Embed Size (px)
Citation preview

Photoelectron spectroscopy of liquid water, some alcohols, and pure nonane in freemicro jetsManfred Faubel, Björn Steiner, and J. Peter Toennies Citation: The Journal of Chemical Physics 106, 9013 (1997); doi: 10.1063/1.474034 View online: http://dx.doi.org/10.1063/1.474034 View Table of Contents: http://scitation.aip.org/content/aip/journal/jcp/106/22?ver=pdfcov Published by the AIP Publishing
This article is copyrighted as indicated in the article. Reuse of AIP content is subject to the terms at: http://scitation.aip.org/termsconditions. Downloaded to IP:
137.99.26.43 On: Thu, 02 Jan 2014 10:12:33

This a
Photoelectron spectroscopy of liquid water, some alcohols, and purenonane in free micro jets
Manfred Faubel,a) Bjorn Steiner,b) and J. Peter ToenniesMax-Planck-Institut fu¨r Stromungsforschung, Bunsenstraße 10, D-37073 Go¨ttingen, Germany
~Received 7 November 1995; accepted 7 March 1997!
The recently developed technique of accessing volatile liquids in a high vacuum environment byusing a very thin liquid jet is implemented to carry out the first measurements of photoelectronspectra of pure liquid water, methanol, ethanol, 1-propanol, 1-butanol, and benzyl alcohol as well asof liquid n-nonane. The apparatus, which consists of a commercial hemispherical~10 cm meanradius! electron analyzer and a hollow cathode discharge HeI light source is described in detail andthe problems of the sampling of the photoelectrons in such an environment are discussed. For waterand most of the alcohols up to six different electronic bands could be resolved. The spectra of1-butanol andn-nonane show two weakly discernable peaks from which the threshold ionizationpotential could be determined. A deconvolution of the photoelectron spectra is used to extractionization potentials of individual molecular bands of molecules near the surface of the liquid andshifts of the order of 1 eV compared to the gas phase are observed. A molecular orientation for watermolecules at the surface of liquid water is inferred from a comparison of the relative band strengthswith the gas phase. Similar effects are also observed for some of the alcohols. The results arediscussed in terms of a simple ‘‘Born-solvation’’ model. ©1997 American Institute of Physics.@S0021-9606~97!02722-0#
s-thd
foic
icouieadbo-
bip
u
sh
cahiby
w
ter-ter-the
theeen
ur-er-alasncholdsm,hen
Antess
ntsthe
nce
ledof
7,
I. INTRODUCTION
The surfaces of liquids with relatively high vapor presures are not easily accessible to investigations withmany experimental methods which have been developerecent years for the study of solid surfaces.1 One prominenttechnique of this kind is the photoelectron spectroscopychemical analysis using X-ray photon sources for whSiegbahn was honored by the Nobel prize in 1981.2 Besidesthe problem of the large vapor pressure of liquids, whmakes it impossible to obtain the required vacuum withthe sample itself being consumed by evaporation, even wless volatile liquids, it is difficult to maintain a clean surfacAt the end of the 19th century already Lord Rayleigh hobserved that a free surface of liquid ‘‘is almost shure todirty,’’ but that a clean surface could be obtained by ‘‘prducing it in the usual manner from a tap.’’3 The most ubiq-uitous liquid, water, was even recently not considered tocompatible with the high vacuum conditions required for mcroscopic surface investigations, because of its high vapressure of 4.6 Torr at the melting point of ice.4
In previous photoemission studies the liquid is pickedby a rotating device, often a simple disc,5,6 and a razor bladescraper is used to provide a continuously clean and freexposed surface in vacuum.7 Stainless steel needles8 andconical shaped trundles,9 as well as moving wetted wires10
have also been used. All such experiments at liquid surfawere limited to equilibrium vapor pressures not greater thabout 0.1 Torr. By restricting these experiments to very tliquid films the charging of the low conductance liquids
a!Electronic mail; [email protected]!Present address: Universita¨t Osnabru¨ck, Fachbereich Physik, Barbarastr.49069 Osnabru¨ck, Germany.
J. Chem. Phys. 106 (22), 8 June 1997 0021-9606/97/106(22)/90rticle is copyrighted as indicated in the article. Reuse of AIP content is sub
137.99.26.43 On: Thu, 0
ein
rh
htth.
e
e-or
p
ly
esnn
the electron emission was minimized by the relatively loresistance to a metallic substrate.6 For species with low de-grees of dissociation this may cause problems for the inpretation, because the influence of a conductor/liquid inface can penetrate a distance of several microns intoliquid by the electrochemical double layer.11
For these reasons only a few experimental studies ofelectronic density of states of liquid water surfaces have bpreviously reported. In 1981 Delahayet al. used a hydrogenlamp with a tunable monochromator to illuminate the sfaces of conductor-supported liquids with photons of engies up to 12 eV.12 After some correction of the experimentdata the photoelectron energy threshold for liquid water wreported to be 10.06 eV.12 The shape of the photoelectroyield as a function of photon energy did not show the Urbaedge,13 indicating that the electron emission at the threshis not simply due to a electron–phonon damping mechaniin contrast to the findings of optical investigations of tUV-absorption coefficient.14 These pioneering studies oseveral liquids are summarized in Delahay’s review.15 Laterin 1986 Lundholmet al. in Siegbahn’s group obtained ESCcore level spectra of liquid water, but in their arrangemethey had to add a large amount of salt in order to supprthe vapor pressure.9
One important conclusion of these early experimewas an empirical necessary condition on the product ofvapor pressureP times the lengthd for transferring photo-electrons from the liquid surface to the spectrometer entraslit.4 For ESCA this limiting value isPd,1 Torr mm whilefor ultraviolet photoelectron spectroscopy~UPS! the morestringent criterium ofPd,0.1 Torr mm was reported.
For neat water these requirements can only be fulfilby a new approach along the lines implied by the work
901313/19/$10.00 © 1997 American Institute of Physicsject to the terms at: http://scitation.aip.org/termsconditions. Downloaded to IP:
2 Jan 2014 10:12:33

in
errmld
27
inn-
orsiz
of-anl-thedi-ata
k
n-
acuamoshapyponulisong
ceec-
hen-liq-owesvefirstillnd-tile
theourII.rel-ctraliq-sedidrumatourta.
istsith
edarateutxi-orblemi-
alr atteralnthe
bernlyo-Fig.wropithbut
am-t at
9014 Faubel, Steiner, and Toennies: Photoelectron spectroscopy of liquids
This a
Rayleigh3 and Knudsen.16 A fast flowing and very thin liquidjet filament is injected into the vacuum system. For a cyldrical jet the effective vapor layer thicknessPd can beevaluated using the following expression17
Pd5ERjet
RspecP~r !dr5P0Rjet~ ln Rspec2 ln Rjet!
<0.1 Torr mm, ~1!
whereRjet is the radius of the jet,Rspecis the radial positionof the spectrometer entrance slit measured from the centthe jet, andP0 is the corresponding local equilibrium vapopressure at the jet surface. Unfortunately, for, a jet of 1 mdiameter and a transfer length of only 0.5 mm this wourequire a limiting surface vapor pressure ofP0<0.3 Torr,which is much less than the vapor pressure of 4.6 Torr atK.
After emerging from the high pressure of 100 bar behthe nozzle the liquid forms a straight, laminar flowing, cylidrical liquid filament with a typical velocity of 140 m s21,which has a smooth surface for several millimeters befbreaking up into a beam of droplets. Because of its smalla high vacuum of 1025 Torr can be maintained with a3000l /s oil diffusion pump. Time of flight measurementsthe evaporated molecules show that H2O molecules evaporating from the jet have a nearly undisturbed Maxwellivelocity distribution, indicating that the evaporated moecules are not appreciably perturbed by collisions alongflight path to the detector.17 These experiments demonstratthat for collision free sampling of liquid surfaces the jet dameterdjet must, in fact, be smaller than the mean free plgas of the gas molecules at the corresponding thermequilibrium16,18
djet,lgas. ~2!
At a water vapor pressure of 4.6 Torr the mean free paththe water molecules in the vapor can be estimated fromnetic gas theory to be of the order of 10mm.19 Equation~2!yields the same restrictions onPd as Eq.~1! and thus pro-vides a physical justification for this semi-empirical relatioship. In the present experimentRjet'3.3mm andRspec51 mm and Eqs.~1! and ~2! are easily fulfilled forP0
<5.3 Torr.Under these unique conditions the entire range of surf
science techniques can now be used for studies of liqsurfaces since the intensities of the probing particle beare not appreciably attenuated by collisions with the vapFor a first demonstration of surface science experimentthe vapor/liquid interface we have chosen UPS since itseveral advantages. For one photoelectron spectroscowell established and widely used for many successful apcations involving gas phase molecular ionizatispectroscopy20 as well as studies of solid surfaces undertrahigh vacuum conditions.21 The necessary equipmentreadily available commercially. Moreover in photoelectrspectroscopy a degradation of the signal due to scatterin
J. Chem. Phys., Vol. 106rticle is copyrighted as indicated in the article. Reuse of AIP content is sub
137.99.26.43 On: Thu, 0
-
of
3
d
ee
e
hl
ofi-
eidsr.atsis
li-
-
in
the vapor is only important for the outcoming electrons sinthe incoming photons have only small scattering cross stions.
Finally we point out that despite the importance of tmolecular level electronic band structure of liquids for a fudamental understanding of the chemistry and physics ofuids and in particular of biochemical processes up to nvery little theoretical work on the electronic density of statin liquid water and other high vapor pressure liquids habeen reported. Thus, the present experiments provide adirect access to this type of information. We hope they wlead to a more complete understanding of the collective biing forces at the surface of water and other highly volaliquid solvents and stimulate theoretical efforts.
The article is organized as follows: The apparatus,liquid target preparation, special handling problems andspecific solutions for them are described in detail in Sec.In Sec. III the data analysis is briefly described and theevant and characteristic features of the photoelectron speare discussed. The results of the investigations on pureuids are presented in Sec. IV where liquid water is discusfirst in Subsection A followed by the experiments on liqualcohols in Subsections B–F. In Subsection G the spectof liquid n-nonane will be considered in order to show ththe low conducting alkanes are also accessible tomethod. Finally, Sec. V provides a summary of the new da
II. APPARATUS
Figure 1 shows an overview of the apparatus. It consof three major vacuum chambers, a cubic main chamber wa corner length of 20 cm in which the liquid jet is producand is probed by photoelectron spectroscopy, and a sepcryo-pumped ‘‘sump’’ chamber which is used to freeze othe highly undercooled droplets onto a cryo-trap at appromately 80 cm from the liquid jet source. The third majcomponent, shown in the upper part of Fig. 1, is the bakeaultrahigh vacuum chamber housing the electrostatic hespherical electron energy analyzer. The HeI gas resonancelamp, which is differentially pumped by two mechanicpumps, irradiates the probe region in the main chamberight-angles to the axis of the jet. The electron spectromeis mounted on top of the main chamber with its axis normto that of the jet and of the laboratory floor. The positiowith respect to the floor is dictated by the construction ofcommercial analyzer used~Leybold EA10/100!.
For the present photoemission experiment a champressure of 1026 Torr could be maintained during operatiowith a 6000l /s oil diffusion pump. In addition, severaliquid-N2 cold traps are placed in the chambers as crpumps. The positions of the cold traps are also shown in1. A third cold trap, not shown in Fig. 1, is mounted belothe beam trap II to catch and freeze ice particles which dfrom it. This is especially necessary for experiments wliquid alcohols, because they do not freeze out as solidsturn into a highly viscous liquid film, which flows slowlydownwards and would otherwise increase the residual chber pressure. Since it was necessary to start the liquid je
, No. 22, 8 June 1997ject to the terms at: http://scitation.aip.org/termsconditions. Downloaded to IP:
2 Jan 2014 10:12:33

a
trae
h
io
ghe
rireonypueof-c-
nt,ntoarsointdi-hes
-dis-
ygmUV
ularngc-a for
be-lly
sto
g
ehlece-po
iva-
Thelsaterarwasec-
es inter
9015Faubel, Steiner, and Toennies: Photoelectron spectroscopy of liquids
This a
atmospheric pressure the vacuum of the spectrometer chber had to be separated by a valve~not shown in Fig. 1! fromthe main chamber. Otherwise, during the start-up phaseliquid water in the nozzle channel would freeze by evapotive cooling and damage the nozzle opening due to thepansion of water at the ice transition.
The nozzle holder can be positioned in thex, y, andzdirections from outside the vacuum chamber. With tpresent setup downstream positionsz along the liquid jet areaccessible between the orifice and the UV excitation regin a range of 0.5 mm,z,12 mm.
The liquid jet itself has been shown to have a straismooth cylindrical surface over a length of several millimters. It’s flow is strictly laminar with a typical velocity of 100m/s.22 The jet is monitored continously by a HeNe lasewhich is directed collinearly to the jet through a sapphwindow in the back side of the nozzle holder. The positiwhere the jet becomes unstable then becomes visible bflection of the laser light and the appearance of a bright sin the jet. Another HeNe laser beam, which crosses the liqjet at right angles, is also used to measure and monitor thdiameter and the surface roughness by observing Fraunhdiffraction patterns.22 Close to the orifice the observed difraction shows no deviations from the ordinary slit diffra
FIG. 1. Perspective view of the photoelectron spectroscopy apparatuvolatile liquids with the major vacuum compartments approximatelyscale: the thin 10- or 20-mm-diam liquid jet enters from the left into themain chamber and is dumped into a separate chamber with liquid nitrocryo-traps 21.218 eV photons from the HeI light source enter through acapillary and a 70-mm-diam collimating aperture into the vacuum probregion. Photoelectrons ejected from the cylindrical liquid jet enter throug20-mm-wide slit into the ultrahigh vacuum entrance lens region of the etrostatic energy spectrometer.~b! shows details of the liquid surface probregion with the UV light capillary, the nozzle and the collimating slit skimmer in front of the electron spectrometer. Dotted parts in the nozzle supare made of electrically insulating material.
J. Chem. Phys., Vol. 106rticle is copyrighted as indicated in the article. Reuse of AIP content is sub
137.99.26.43 On: Thu, 0
m-
he-x-
e
n
t-
,
re-otidjetfer
tion pattern as expected for a smooth cylindrical filamewhile near the point where the continuous jet breaks up idroplets the diffraction pattern changes and disappeabruptly. The chessboardlike pattern near the decay pcould be explained by a cosine-modulation of the outerameter of the jet with a very well defined decay length in tz direction22 compatible with the capillary wave calculationof Weber.23
The intact, cylindrically smooth region of the jet is irradiated by a high intensity windowless homemade gascharge resonance lamp of proven design,24 which is opti-mized for emitting HeI radiation with the photon energhn521.21860.003 eV. An elaborate differential pumpincapillary collimation is used to prevent residual gas froentering the windowless gas discharge which forms thelight source.
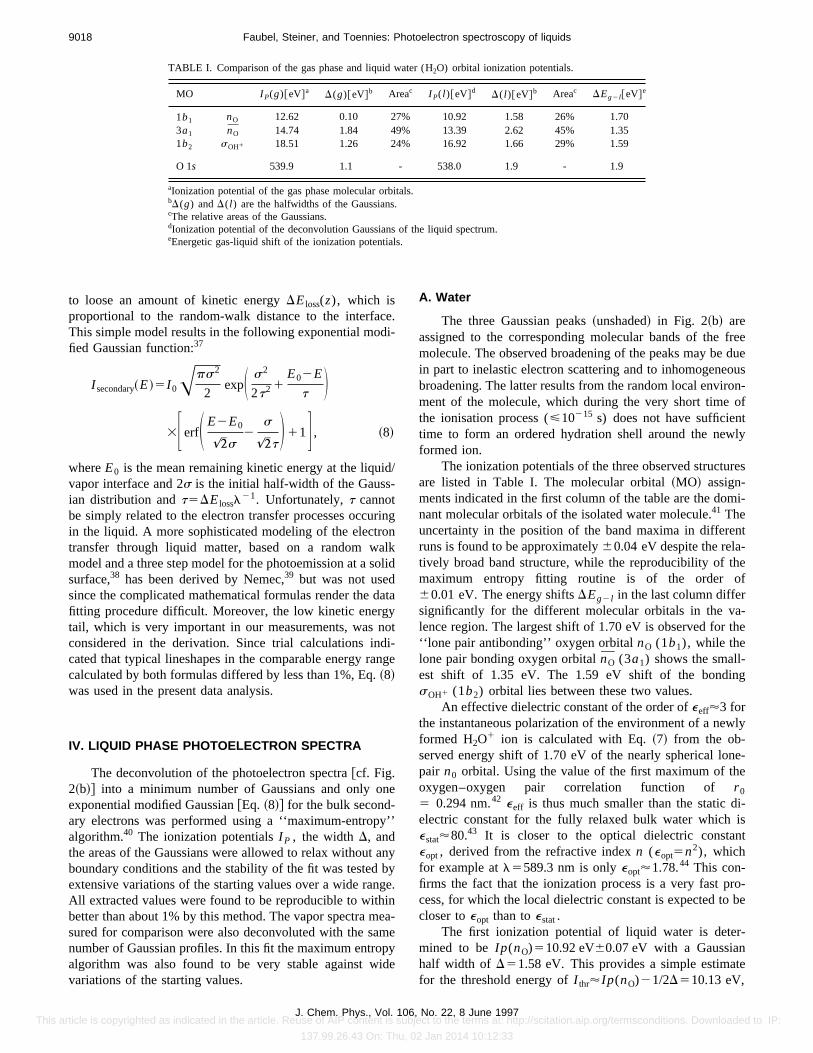
The emitted photoelectrons are sampled, perpendicto the photon beam, by a narrow slit skimmer openi(20mm31 mm) with an opening angle of 28° at the spetrometer entrance. Figure 2 shows representative spectrgaseous~a!, and for liquid water~b! which shows consider-ably broadened and shifted peak structures. The distancetween the jet surface to the skimmer entrance is typica
for
en
a-
rt
FIG. 2. UPS HeI photoelectron spectrum of gaseous~a! and liquid ~b!water. The bottom scale gives the electron kinetic energy, while the equlent upper scale shows the ionisation potentialI P5hn2Ekin . The gas spec-trum was measured for a molecular beam, prepared from a 200mm nozzlebeam with 20 Torr nozzle pressure, 2 mm away from the nozzle orifice.vertical lines in~a! indicate the energetic position of the ionization potentiareported in Ref. 41. The liquid spectrum was measured from a liquid wjet ~20 mm nozzle! at z52.0 mm. The nozzle backing pressure was 50 band the nozzle temperature was stabilized at 3 °C. The measuring timeof the order of 24 h. The liquid spectrum was deconvoluted into one sondary electron distribution~hatched! and three Gaussian functions~open!.The mean energetic positions of the Gaussians indicated by vertical lin~b! are the experimental ionisation potentials of the orbitals of liquid wadetermined from the best fit.
, No. 22, 8 June 1997ject to the terms at: http://scitation.aip.org/termsconditions. Downloaded to IP:
2 Jan 2014 10:12:33

-agimioctome
cia10o
ruemtefathel
thn-er
rata
d
itenthinaabteo
eth
n.
e
idt,h
ssial
cantiveof
ithof-rayronon
min-hepa-e.rent
jet
of
am-o-nspo-Vnlytialsthatby
eri-lcu-edelyergyhef at
onthesee
9016 Faubel, Steiner, and Toennies: Photoelectron spectroscopy of liquids
This a
1 mm to fulfill the vapor transfer length condition of Eqs.~1!and ~2!. This metal slit skimmer is mounted electrically insulated from the vacuum chamber so that an arbitrary voltpotential can be applied. A nonzero voltage at the slit skmer produces an electric field gradient in the vapor regbetween the surface of the liquid and the skimmer entranThis procedure is commonly used in similar experimentssuppress the contribution to the photoelectron signal frvapor phase ionisation and is discussed in detail, forample, in Ref. 25.
For the photoelectron energy analysis a commerhemispherical electron analyzer with a mean radius ofmm ~Leybold EA10/100! was modified to accommodate twdifferential pumping stages~both 240 l /s turbomolecularpumps!, one for the electron optics region and the other~notshown in Fig. 1! for the analyzer hemisphere chamber. Duing the experiment the entire spectrometer ultrahigh vacuchamber was maintained at a constant chamber wall tperature of 150 °C to prevent both the adsorption of waand other residual gases, and also the buildup of surcharges on the surfaces of the electron optics and inhemispherical analyzer. In addition to the mu-metal shithe entire apparatus is located in a 33333 m3 Helmholtzcage to further suppress the deflection of electrons byearth’s magnetic field by an overall factor of 20. Additioally, the scattering chamber is internally clad with an intnally heated magnetic shield of 150-mm-thick Co-NeticAAfoil to reduce stray magnetic fields from the nearby labotory equipment. The photoelectrons were detected by a sdard single-channel CuBe multiplier.
No change in the shape of the spectrum was observea function of the sampling positionz at the jet surface aslong asz.1.5 mm on an intact jet. At smaller distancesz therelative bulk secondary electron contribution increases wrespect to the directly emitted intensity and the overall intsity drops rapidly, presumably due to disturbances bynearby metallic nozzle. With increasing distance in gofrom z'2 mm toz'10 mm the overall intensity drops byfactor of 2. This decrease is presently not understood. It cnot be explained by the decrease in the jet diameterevaporation which amounts to only about 4%. All presenspectra are therefore sampled at a downstream positionz52–3 mm in order to maximize the signal intensity.
A serious problem encountered in photoelectron sptroscopy of nonconducting materials is the charging ofsurface. The photocurrentI is given by
I5djetL• j hne0Pe2, ~3!
wheredjet is the diameter of the jet,L the illuminated lengthof the filament,j hn the photon flux,e0 the unit charge, andPe2(<1) is the probability for the emission of an electroIn our apparatus typical values areL570mm,djet'10mm, and j hn'1011 mm22 s21 resulting in a photo-current of the order ofI<10 pA. Fortunately the jet can btreated as electrically decoupled from the metal surfacethe nozzle aperture. This is due to the relatively low liquconductivity and the high streaming velocity of the jewhich is much faster than the ion mobility in the liquid. Wit
J. Chem. Phys., Vol. 106rticle is copyrighted as indicated in the article. Reuse of AIP content is sub
137.99.26.43 On: Thu, 0
e-ne.o
x-
l0
-m-rceed
e
-
-n-
as
h-eg
n-ydf
c-e
of
no conductivity within or along the jet the emission procewill lead to a charging of the surface of the jet to a radsurface potentialFs , given by
Fs521
2pe0
I
v jetlnS djet2 D , ~4!
where v jet is the velocity of the jet.v jet can be calculatedfrom the conservation of energy12Mv jet
2 5PnV, wherePn isthe nozzle backing pressure withV5Mr21 to be v jet5A2Pnr
21. Fortunately in our caseFs is small sincedjet issmall andv jet is large. For example, withdjet510mm andv jet5100 m s21 (Pn550 bar)Fs,2 meV. The charging ofan insulating liquid surface by the emission processtherefore be completely neglected. This additional, attracfeature of the micro-jet technique makes the entire classinsulating liquids directly accessible to investigations wall, well established charged particle probing techniquessurface science. In addition to the present UPS studies, xphotolectron spectrometry, electron diffraction, and elector ion loss experiments can all be carried out for commliquids using this technique.
One problem with photoelectron spectroscopy fromicro-jets, which had not been anticipated from the begning, is the buildup of an additional surface potential in tstreaming liquid. This potential results from a charge seration which occurs as the liquid leaves the nozzle apertur26
As a result of charge separation a typical streaming curof the order of210 nA is observed for a jet of pure liquidwater. The corresponding radial streaming potential at thesurface is given, in analogy to Eq.~4!, by the followingexpression
Fstr521
2pe0
I strv jet
lnS djet2 D . ~5!
A water jet from a 10mm aperture with a backing pressure80 bar has a diameter of 6.55mm, a streaming velocity of127 m s21 and generates a streaming potentialFstr51.8 Vper 1 nA streaming current. Thus, with the observed streing current of210 nA an additional surface streaming ptential of 218 eV results, which accelerates the electroemitted from the surface. Such strong radial streamingtentials must be accounted for in the calibration of the Uphotoelectron spectra where photons of an energy of o21.218 eV are used. Fortunately, the streaming potenwere found to be very stable over hours of operation, sothe photoelectron spectra are not significantly broadenedpossible fluctuations of the streaming potential. In the expments to be reported here the streaming potential was calated from Eq.~5! and simply subtracted from the measurkinetic energies. This procedure was found to be entirsatisfactory since in all spectra the secondary electron endistributions, which were always observed in addition to tphotoionization structures, exhibited the expected cutofzero kinetic energy.
The matching of the low energy tail of the photoelectrspectra to the internal zero kinetic energy reference ofliquid has been discussed previously by several authors,
, No. 22, 8 June 1997ject to the terms at: http://scitation.aip.org/termsconditions. Downloaded to IP:
2 Jan 2014 10:12:33

ec
enttaththbyecortr
sigthteneee
, n
e.o
utbnth
thwhtininofAed
o
ityoim
e
nted
ardsgy
poreiddstion
e
f a
n-e
om
in-d tof thesn-ies
apether
o-ingulkare
iesonsin-orec-ledere-ec-um.useec-nd-ed
.ed
9017Faubel, Steiner, and Toennies: Photoelectron spectroscopy of liquids
This a
e.g., Ref. 27 in terms of the electromotive force of the eltrochemical half cell~metal u water!. In contrast to theseearlier discussions we eliminate all electrochemical pottials including the Volta potential28 by the streaming currenmeasurement. The measured potentials in our experimentherefore relative to the electronic vacuum level. A smoffset potential discrepancy of the low energy edge ofelectron spectrum compared to zero kinetic energy forlow vapor pressure liquid benzyl alcohol observedMorgner27 is confirmed by our experiment discussed in SIV F and apparently has another physical origin. The thebehind this surface potential, its characterization and conis discussed in detail in the Appendix and in Ref. 26.
In our apparatus the vapor phase contribution to thenal is automatically reduced to a negligible amount bypotential gradient which is generated by the streaming potial and is of the order of 10 kV/m between the surface athe skimmer entrance of the spectrometer. The possiblefect of the electrokinetic charging on the shape of the sptrum was also studied as discussed in the Appendix. Nofect on the shape of the spectrum was observed whenprecautions were taken, neither in the case of pure waterfor any of the other liquid target materials studied~e.g., thesimple alcohols!. The only effect observed was a shift of thlocal reference potential of the photoelectron spectrumnoticeable contribution of the ionization of gas phase mecules above the liquid surface would result in a changethe secondary electron distribution as a function of the sface potential and therefore of the voltage gradient acrossilluminated vapor region for the given conditions. The asence of an effect indicates that the gas phase ionizatiovery efficiently suppressed by the voltage gradient overvapor region above the liquid jet surface.
The attenuation effect of the residual gas pressure inprobe chamber on the measured relative intensitieschecked by admitting argon gas into the chamber. The ptoelectron spectrum of argon was not observed indicathat it was efficiently suppressed by the negative streampotential of214.5 V at the liquid jet surface. The shapethe H2O spectrum was found to be independent of thepressure and the intensity of each of the peaks follownicely the same simple Lambert–Beer law attenuation,creasing from approximately 8 counts/ps~cps! in the maxi-mum of the secondary electron distribution for an argpressure of 4•1026 Torr to 2 cps at 9•1025 Torr.
III. DATA ANALYSIS
The extraction of information on the electronic densof states~DOS! is commonly achieved by a measurementthe kinetic energy distribution of the photoelectrons, whichtaken as a direct measure of the DOS. Koopman’s theore29
attributes the measured mean kinetic energiesEkin of thespectral features to the corresponding vertical ionizationergies I P in a single electron excitation model viaI P5hn2Ekin . Molecular ionization bands in the photoelectrospectra of condensed materials show energetic shifts ofvertical electronic work functions with respect to the relat
J. Chem. Phys., Vol. 106rticle is copyrighted as indicated in the article. Reuse of AIP content is sub
137.99.26.43 On: Thu, 0
-
-
arellee
.yol
-en-df-c-f-allor
Al-ofr-he-ise
easo-gg
rde-
n
fs
n-
he
gas phase spectra. In liquid experiments these shifts towlower ionization potentials reflect the Born solvation enerof the ions in a dielectric.30 This effect was previously in-voked to explain the O 1s core level ionization shifts of wa-ter in mixtures of low vapor pressure liquids9 and for theenergetic shifts of the valence band levels of some low vapressure organic liquids31 as well as in the discussion of thfull ESCA spectra of highly undercooled, glassy liqualcohols32 and for the core level shifts in pure and mixeorganic solvents.33 Thus, the ionization potentials of liquidI P(liq) are related to the corresponding gas phase ionizapotentialsI P(g) by:
I P~ liq!5I P~g!2DEg2l , ~6!
whereDEg2l is called the gas-liquid shift. Note that in thliteratureDEg2l is often called the phase transition shift.34
DEg2l can be simply estimated using a model consisting osphere with ‘‘ion radius’’r 0 and chargez embedded in aninfinitely extended continuum dielectric with dielectric costant e0 . The difference in the electric field energy in thliquid compared to the gas phase is given by30,11
DEg2l52z2e0
2
8pe0r 0•S 112
1
e D , ~7!
where the 1 in the denominator in the brackets arises frevacuum51. Differences inDEg2l for different molecular or-bitals together with careful investigations of the relativetensities of particular molecular bands can thus be useestimate the conformational arrangement at the surface oliquid. The origin of gas-liquid shifts of ionization energieof the spherical molecular orbitals in bulk water and the cotributions of inter- and intramolecular relaxation energhave been discussed by A˚ gren and Carravetta.35 Unfortu-nately we have no reliable absolute value for the finite escdepth of the nascent photoelectrons but from these and oexperiments to be presented in a subsequent paper36 we es-timate the escape depth to be only of the order of one mlecular monolayer. This small escape depth is surprissince it is commonly believed that UPS measures the belectronic density of states. Our experimental findingsattributed to the first layers of the surface of the liquid.
In addition to the photoelectrons with sharp energfrom the surface region a large fraction of the photoelectrare generated deep inside the liquid where they undergoelastic collisions and become completely thermalized befleaving the surface. If their kinetic energy is below the eletronic band gap in the liquid the electron is largely decoupfrom energy loss processes and is quasi-free and can thfore travel long distances in the liquid. The thermalized eltrons can also reach the surface and be emitted into vacuTo describe this complicated process in a simple way wea simple analytical function to fit the broad secondary eltron peak. We assume the initial distribution of the secoary electronsI (E) on creation to be a single Gaussian shapfunction. The electron escape propabilityP is estimated tofollow a Lambert–Beer law,P}exp(2lz), wherel is theinverse escape depth andz is the distance to the surfaceWhile traveling through the liquid, the electrons are assum
, No. 22, 8 June 1997ject to the terms at: http://scitation.aip.org/termsconditions. Downloaded to IP:
2 Jan 2014 10:12:33
9018 Faubel, Steiner, and Toennies: Photoelectron spectroscopy of liquids
This article is copyrighted a
TABLE I. Comparison of the gas phase and liquid water (H2O) orbital ionization potentials.
MO I P(g)@eV#a D(g)@eV#b Areac I P( l )@eV#d D( l )@eV#b Areac DEg2 l@eV#e
1b1 nO 12.62 0.10 27% 10.92 1.58 26% 1.703a1 nO 14.74 1.84 49% 13.39 2.62 45% 1.351b2 sOH1 18.51 1.26 24% 16.92 1.66 29% 1.59
O 1s 539.9 1.1 - 538.0 1.9 - 1.9
aIonization potential of the gas phase molecular orbitals.bD(g) andD( l ) are the halfwidths of the Gaussians.cThe relative areas of the Gaussians.dIonization potential of the deconvolution Gaussians of the liquid spectrum.eEnergetic gas-liquid shift of the ionization potentials.
cedi-
id-
rionalo
daynodin
ne
y’
abginempid
freedueouson-oftly
res
mi-
nt-ef
-the
g
wly
e-e
i-ist
ro-be
r-
te
to loose an amount of kinetic energyDEloss(z), which isproportional to the random-walk distance to the interfaThis simple model results in the following exponential mofied Gaussian function:37
I secondary~E!5I 0Aps2
2expS s2
2t21E02E
t D3FerfS E2E0
&s2
s
&tD 11G , ~8!
whereE0 is the mean remaining kinetic energy at the liquvapor interface and 2s is the initial half-width of the Gaussian distribution andt5DElossl
21. Unfortunately,t cannotbe simply related to the electron transfer processes occuin the liquid. A more sophisticated modeling of the electrtransfer through liquid matter, based on a random wmodel and a three step model for the photoemission at a ssurface,38 has been derived by Nemec,39 but was not usedsince the complicated mathematical formulas render thefitting procedure difficult. Moreover, the low kinetic energtail, which is very important in our measurements, wasconsidered in the derivation. Since trial calculations incated that typical lineshapes in the comparable energy racalculated by both formulas differed by less than 1%, Eq.~8!was used in the present data analysis.
IV. LIQUID PHASE PHOTOELECTRON SPECTRA
The deconvolution of the photoelectron spectra@cf. Fig.2~b!# into a minimum number of Gaussians and only oexponential modified Gaussian@Eq. ~8!# for the bulk second-ary electrons was performed using a ‘‘maximum-entropalgorithm.40 The ionization potentialsI P , the widthD, andthe areas of the Gaussians were allowed to relax withoutboundary conditions and the stability of the fit was testedextensive variations of the starting values over a wide ranAll extracted values were found to be reproducible to withbetter than about 1% by this method. The vapor spectra msured for comparison were also deconvoluted with the sanumber of Gaussian profiles. In this fit the maximum entroalgorithm was also found to be very stable against wvariations of the starting values.
J. Chem. Phys., Vol. 106s indicated in the article. Reuse of AIP content is sub
137.99.26.43 On: Thu, 0
.
/
ng
klid
ta
t-ge
’
nyye.
a-eye
A. Water
The three Gaussian peaks~unshaded! in Fig. 2~b! areassigned to the corresponding molecular bands of themolecule. The observed broadening of the peaks may bein part to inelastic electron scattering and to inhomogenebroadening. The latter results from the random local envirment of the molecule, which during the very short timethe ionisation process (<10215 s) does not have sufficientime to form an ordered hydration shell around the newformed ion.
The ionization potentials of the three observed structuare listed in Table I. The molecular orbital~MO! assign-ments indicated in the first column of the table are the donant molecular orbitals of the isolated water molecule.41 Theuncertainty in the position of the band maxima in differeruns is found to be approximately60.04 eV despite the relatively broad band structure, while the reproducibility of thmaximum entropy fitting routine is of the order o60.01 eV. The energy shiftsDEg2 l in the last column differsignificantly for the different molecular orbitals in the valence region. The largest shift of 1.70 eV is observed for‘‘lone pair antibonding’’ oxygen orbitalnO (1b1), while thelone pair bonding oxygen orbitalnO (3a1) shows the small-est shift of 1.35 eV. The 1.59 eV shift of the bondinsOH1 (1b2) orbital lies between these two values.
An effective dielectric constant of the order ofeeff'3 forthe instantaneous polarization of the environment of a neformed H2O
1 ion is calculated with Eq.~7! from the ob-served energy shift of 1.70 eV of the nearly spherical lonpair n0 orbital. Using the value of the first maximum of thoxygen–oxygen pair correlation function of r 05 0.294 nm.42 eeff is thus much smaller than the static delectric constant for the fully relaxed bulk water whichestat'80.43 It is closer to the optical dielectric constaneopt, derived from the refractive indexn (eopt5n2), whichfor example atl5589.3 nm is onlyeopt'1.78.44 This con-firms the fact that the ionization process is a very fast pcess, for which the local dielectric constant is expected tocloser toeopt than toestat.
The first ionization potential of liquid water is detemined to beIp(nO)510.92 eV60.07 eV with a Gaussianhalf width of D51.58 eV. This provides a simple estimafor the threshold energy ofI thr'Ip(nO)21/2D510.13 eV,
, No. 22, 8 June 1997ject to the terms at: http://scitation.aip.org/termsconditions. Downloaded to IP:
2 Jan 2014 10:12:33

o
th
b
m
tiheilef
idn.eal
tioexthm-thf a
tio
th-iaantceve00r
g-
lm
d
tionl ofau-orklemithion
arere-the
-ltsV,ente
re-
f
up-SCAs as
y
-
u
co
9019Faubel, Steiner, and Toennies: Photoelectron spectroscopy of liquids
This a
which agrees well with the reported value of Delahayhn510.06 eV for the threshold photon energy.12 The secondobserved structure at 13.39 eV is in good agreement withpublished maximum for UV absorption experiments athn513.7 eV.13,45
Additional results for the O 1s core level ionization ofwater, which are listed in the last row of Table I were otained in an X-ray photoemission spectroscopy~XPS! mea-surement at the surface of a liquid jet of water using the saapparatus but with the addition of a salt~1 mol/l KCl! KClwas added since this experiment was made in connecwith a study of the effect of electrokinetic charging and tescape depth of the photoelectrons as described in detathe Appendix. The result of this independent measuremusing Mg Ka (hn51253.6 eV) radiation gives a value oDEg2l51.9 eV ~see Table I! in full agreement with previousresults of the Siegbahn group for the shift of the O 1s ion-ization band of water in saturated solutions of LiCl in liquwater.9 In addition this XPS derived core level shift is ireasonably good agreement with the UPS measurement
From a comparison of the peak areas in the UPS sptrum of liquid water it is found that almost 75% of the totintensity is due to secondary electrons~Table II!. The rela-tive intensities of the remaining three peaks after subtracof the secondary electron contribution are given in the nto last column in Table I, and can be compared withcorresponding intensities in the gas phase in the fifth coluThe relative intensity of thesOH1 band is found to be significantly increased from 24% in the gas phase, to 29% inliquid. This is consistent with the recent observation omolecular alignment of the dipole moment of surface H2Omolecules as derived from optical sum-frequency-generameasurements by the group of Shen.46 It is interesting to seethat this is accompanied by about a 10% reduction ofnear-oxygen localized bondingnO band intensity. This suggests that the molecules in the surface layer are preferentoriented with the H atoms jutted outwards by a conformtional hydrogen bonding to the bulk with the dipole momeleading to a small positive voltage potential at the surfaThis small alignment effect can also explain the obsersmall surface Volta potential of liquid water of around 1meV28 in terms of a molecular orientation effect at the suface.
It is interesting to note that the energy shiftsDEg2l inliquid H2O are quite similar to those in solid cubic ice. Fi
TABLE II. The fitting parameters of Eq.~8! obtained for the secondarelectron contribution to the HeI photoelectron spectrum of liquid water.
I P(E0)@eV#a s@eV#b t@eV#c Aread
20.28 0.74 2.11 75.1%
aThe mean ionization potentialI P5hn2E0 of the assumed Gaussian ionization band.bThe deconvoluted initial half-width of the Gaussian.cThe exponential damping factor, describing the mean energy loss perescape depth.dThe integral over the peak area is a measure of the strength of the seary electron distribution relative to the total electron intensity.
J. Chem. Phys., Vol. 106rticle is copyrighted as indicated in the article. Reuse of AIP content is sub
137.99.26.43 On: Thu, 0
f
e
-
e
on
innt
c-
nten.
e
n
e
lly-s.d
-
ure 3 compares the ESCA spectrum of a solid cubic ice fion an amorphous gold substrate as reported by Ma˚rtenssonet al.47 with our liquid water data. Using monochromatizeAl Ka radiation Martenssonet al. found a well structuredspectrum in the valence band region with peaks at ionisapotentials of 12.1, 8.6, and 6.2 eV above the Fermi levethe substrate visible in their spectrum. Unfortunately, thethors were not able to correct for the change of the wfunction of the substrate induced by the adsorbate, a probwhich is absent in the present experiment. To compare wour results we have tentatively subtracted the work functof a clean gold surface~4.7 eV!, neglecting the work func-tion change, in order to correct the published data whichgiven relative to the Fermi edge of the substrate. Theported electron binding energies in ice were 6.4 eV fornO (1b1) orbital, 6.2 eV for thenO (3a1) orbital, and 6.5 eVfor thesOH1 (1b2) orbital. Ignoring the substrate work function change induced by the ice, we get very similar resufor the energy shifts of solid cubic ice of 1.7, 1.5, and 1.8 erespectively. These values are quite similar to the presmeasurement for liquid water listed in Table I. As for thliquid the shift of the bondingnO (3a1) orbital is lowest andthe shifts of the two other bands are higher.
For a more direct comparison with our results the
FIG. 3. Comparison of the present UPS HeI photoelectron spectrum oliquid water without the bulk secondary electron distribution~a! vs theESCA measurements of cubic ice on an amorphous gold substrate~b! and ofvapor water~c! reported by Ma˚rtenssonet al. ~Ref. 47!. The directly emittedphotoelectron contributions of the three deconvoluted Gaussians in theper panel are compared with the three gas phase bands obtained by Eand the ESCA spectrum of cubic ice. A change in the relative intensitieobserved for UPS~see text! is absent in the ESCA experiment.
nit
nd-
, No. 22, 8 June 1997ject to the terms at: http://scitation.aip.org/termsconditions. Downloaded to IP:
2 Jan 2014 10:12:33

tials of the
9020 Faubel, Steiner, and Toennies: Photoelectron spectroscopy of liquids
This a
TABLE III. Comparison of the gas phase and liquid methanol (CH3OH) orbital ionization potentials.
MOI P(g)@eV#a
D(g)@eV#b Areac
I P(liq)@eV#d
D( l )@eV#b Areac
DEg2l
@eV#e
2a9 nO ~10.94! 10.94 0.32 19.1% 9.99 1.50 24.0% 0.95? - - 11.10 0.56 1.3% -7a8 nO ~12.68! 12.80 1.02 29.4% 12.40 2.08 27.0% 0.406a8 sCO ~15.19!
15.36 1.52 42.9% 14.70 1.28 17.0% 0.661a9 pCH3
~15.70!5a8 sOH ~17.50! 17.69 0.88 8.6% 16.20 1.50 30.7% 1.49
aThe ionization potential of the gas phase molecular orbitals. The values given in parentheses are the experimental individual ionization potenunbunched molecular orbitals.bThe halfwidths of the Gaussians.cThe relative areas of the Gaussians.dThe ionization potential of the Gaussians of the liquid spectrum.eThe energies gas-liquid shift of the ionization potentials.
iameigob
m
econ
atheentrg
aeae
jennteoinverthntre
m
res
letoam-b-tedre-ibil-eren-alem-
riediredofw abeisfit
y ofiza-rbit-them-upsor-onsareeials
uidedionsbeits
ported ESCA spectrum of Ma˚rtensonet al.47 was also de-convoluted with our fitting routine, assuming three Gaussshaped structures. Since the relative strength of the freeecule bands in ESCA are slightly different from the onobtained by UPS their vapor ESCA spectrum shown in F3~c! of Ref. 47 was used for comparison. The valuestained for the relative band weights were 22% (nO), 66%(nO), and 12% (sOH1) for the ESCA vapor phase spectruand 21% (nO), 66% (nO), and 13% (sOH1) for the ESCAcubic ice spectrum. The enrichment of thesOH1 band re-ported here for the liquid is clearly absent in the ESCA sptrum. This is probably related to the larger sampling depthESCA due to the increased escape depth of the more egetic photoelectrons~'25 Å48!, which is a factor of 5 largerthan the values customarily used for the UPS d~'5 Å49!. To get more reliable data on the intensity of tsOH1 band it would be desirable to use higher photon engies, like HeII (hn540.82 eV) or a tunable synchrotrosource. An increase in the photon energy would decreasesecondary electron contribution in the valence band eneregion thereby increasing the visibility of thesOH1 band andits intensity. The change in thesOH1 band strength as afunction of the electron emission depth should then beparent. Experiments with HeII radiation failed because of thinsufficient protection of the windowless discharge from wter impurities, which destabilizes the discharge under thconditions.
These spectra also provide information concerningpossible radial voltage gradient at the surface of the liquidwhich, if present in the region from which the photoelectroare sampled, would broaden the spectrum. This additiobroadening is expected to change with the streaming potial, which could be adjusted experimentally in the range27 to 223 V as described in the Appendix. No changethe Gaussian widths of the spectra was however obserindicating that the electrochemically generated chargessponsible for the streaming potential are not localized insurface layer sampled by the UV photoelectron experimeExperiments on aqueous ionic solutions, which will beported in detail in a separate paper,36 show, however, anintensity increase with respect to the neat water spectrusalts are added to the water.
J. Chem. Phys., Vol. 106rticle is copyrighted as indicated in the article. Reuse of AIP content is sub
137.99.26.43 On: Thu, 0
nol-s.-
-fer-
a
r-
hey
p-
-se
atsaln-f
d,e-es.-
if
B. Methanol
For alcohols a few measurements of HeI photoelectronspectra have been reported previously.29,30,50,51These mea-surements were performed either at very low temperatuwhere the alcohols are close to a glassy state~e.g., at'200 K in Ref. 50! or with the vapor pressure of the sampreduced by adding salts.52 Our new technique can be usedstudy neat liquid alcohols at room temperature. The streing potential shifts were found to be similar to those oserved for liquid water and could be successfully eliminaby using Eq.~5!. Measurements for each substance werepeated at least five times in order to ensure the reproducity of the results. For all studied alcohols the spectra wtaken under essentially identical conditions at the dowstream positionz52 mm. The energetic positions of spectrstructures were found to be independent of the nozzle tperature in the temperature range fromT5245 to 300 K.
Evaluations of the gas phase spectra were also carout using the same number of Gaussian functions as requfor the deconvolution of the primary electron distributionsthe liquids. For this purpose the vapor spectra which shohigher degree of structure than the liquid spectra had toappropriately bunched for given electronic orbitals. Thbunching was performed by the same maximum entropyprocedure as for the liquid spectra and the mean energthe bunched Gaussian is a weighted average over the iontion potentials of the gas phase substructure molecular oals. This procedure was found to be very stable withinmaximum entropy fit procedure and also facilitates a coparison of the relative intensities and the positions of groof substructured molecular orbitals of the vapor with the cresponding liquid spectral features. The energetic positiof the averaged effective Gaussians for the gas spectralisted for each of the alcohols in the Tables III–VII in thcolumn to the right of the respective gas ionization potentwhich are listed in parentheses.
Figure 4 compares the photoelectron spectrum of liqmethanol, CH3OH, with the vapor phase spectrum measurin the same apparatus. The number of Gaussian functneeded to obtain a good fit of the spectra was found toequal for the gas and the liquid spectrum within the lim
, No. 22, 8 June 1997ject to the terms at: http://scitation.aip.org/termsconditions. Downloaded to IP:
2 Jan 2014 10:12:33

s
9021Faubel, Steiner, and Toennies: Photoelectron spectroscopy of liquids
This article is copyrighted a
TABLE IV. Comparison of the gas phase and liquid ethanol (CH3CH2OH) ionization potentials. The symbolhave the same meaning as in Table III.
MOI P(g)@eV#
D(g)@eV# Area
I P~liq!@eV#
D( l )@eV# Area
DEg2l
@eV#
3a9 nO ~10.64! 10.63 0.36 12.0% 9.66 0.94 8.3% 0.9710a8 sCC,nO ~12.18! 12.00 0.44 4.9% 10.95 0.62 1.6% 1.052a9 pCH3
,nO ~13.21!9a8 pCH3
,sCO ~13.86! 13.50 2.24 53.0% 12.94 2.78 65.6% 0.568a8 sCO,sCC ~14.5!1a9 pCH2
,nO ~15.85! 15.92 0.98 12.7% 15.22 1.30 15.6% 0.707a8 sOH ~17.35! 17.55 1.20 17.5% 16.34 0.94 8.8% 1.21
TABLE V. Comparison of the gas phase and liquid 1-propanol (CH3CH2CH2OH) ionization potentials. Thesymbols have the same meaning as in Table III.
MO I P(g)@eV# D(g)@eV# Area I P~liq!@eV# D( l )@eV# Area DEg2l@eV#
nO ~10.49! 10.45 0.34 7.9% 9.72 1.00 1.5% 0.73sCC ~11.70!pCH3
~12.24!pCH2
12.18 1.52 28.9% 11.51 2.56 24.1%sCC ~12.79!pCH3
~13.4!nO
14.55 3.64 63.2% 14.38 4.66 74.3%sCO ~14.52!pCH3
~15.3!pCH2pCH2
~16.03!sOH ~17.23!
TABLE VI. Comparison of the gas phase and liquid 1-butanol (CH3CH2CH2CH2OH) ionization potentials. Thesymbols have the same meaning as in Table II.
I P(g)@eV# D(g)@eV# Area I P~liq!@eV# D( l )@eV# Area DEg2l@eV#
~th! 9.92 9.32 0.60~1! 11.83 2.10 25.7% 11.98 3.08 32.7%~2! 14.53 4.50 74.3% 15.14 4.24 67.3%
TABLE VII. Comparison of the gas phase and liquid benzyl alcohol (C6H5CH2OH) ionization potentials. Thesymbols have the same meaning as in Table II.
MO I P(g)@eV# D(g)@eV# Area I P~liq!@eV# D( l )@eV# Area DEg2l@eV#
p2 ~9.26!9.48 0.56 8.5% 8.51 0.96 8.0% 0.97
p3 ~9.54!nO ~10.78! 10.73 0.34 3.8% 9.58 0.86 3.2% 1.15sB ~11.78!p1 ~12.30! 12.31 1.46 25.3% 11.27 1.56 27.0% 1.04nO ~13.01!nO ,sB ~14.25! 14.28 0.58 9.3% 13.46 1.24 29.5% 0.82sB ~15.16! 15.10 1.46 23.0% 14.56 0.92 8.5% 0.54sB ~16.72!
16.94 1.22 8.4% 15.82 1.72 23.8% 1.12sOH ~17.24!
~19.08! 20.57 5.64 21.7%
J. Chem. Phys., Vol. 106, No. 22, 8 June 1997s indicated in the article. Reuse of AIP content is subject to the terms at: http://scitation.aip.org/termsconditions. Downloaded to IP:
137.99.26.43 On: Thu, 02 Jan 2014 10:12:33

eenacaeth
ls
’sur
t.thga
teto alapon-erld
daetheallo--isesthee to
the
re-siblece.theorundreasn aor-mol-ngion
erthinhis
ben
ical
th--en-beum,. Inthedsanisonger
paomecoec
sta
ntioan
9022 Faubel, Steiner, and Toennies: Photoelectron spectroscopy of liquids
This a
visible in Fig. 4. The upper vertical lines in Fig. 4 for thvapor spectrum indicate the values of the ionization pottials of Ref. 42. The lower vertical bars indicate the meenergetic positions of the bunched Gaussians used to devolute the liquid spectrum. The effective molecular ioniztion potentials for liquid methanol are listed in Table III. Thpositions of the bands is in agreement within 0.1 eV withresults of a study of Ballardet al.,50 who used a cold thinfilm of liquid methanol. Their reported ionization potentiaare~our values in parentheses! 9.95 eV~9.99 eV!, 10.97 eV~11.10 eV!, 12.3 eV~12.40 eV!, 14.8 eV~14.70 eV! and 16.3eV ~16.20 eV!. The present results also confirm Ballardobservation of a small, unexpected additional liquid featat an ionization potential ofI p'11 eV, which when includedin the fit atEkin'10.1 eV lead to a significant improvemenAt present one can only speculate about the origin offeature. In this connection it is interesting to note that aphase HeI photoelectron spectrum and anab initio calcula-tion of the ionization energies of the dimer (CH3OH)2 have
FIG. 4. UPS HeI photoelectron spectrum of gaseous~a! and liquid ~b!methanol. The gas spectrum was measured for a molecular beam, prefrom a 70mm nozzle beam with 20 Torr nozzle pressure, 2 mm away frthe nozzle exit. The vertical lines in~a! indicate the energetic position of thionisation potentials reported in Ref. 41, while the bunched Gaussian devolution is used for comparison with the liquid spectrum. The liquid sptrum was measured from a liquid jet~10 mm nozzle! at z53.0 mm. Thenozzle backing pressure was 70 bar and the nozzle temperature waslized at215 °C and the measuring time was 20 h. The liquid spectrum wdeconvoluted into a secondary electron distribution~hatched! and fiveGaussian functions~open!. The mean energetic positions of the Gaussiaindicated by vertical lines in the lower panel are the experimental ionizapotentials of liquid methanol. The physical origin of the small but significpeak atEkin510.1 eV is presently unknown.
J. Chem. Phys., Vol. 106rticle is copyrighted as indicated in the article. Reuse of AIP content is sub
137.99.26.43 On: Thu, 0
-non--
e
e
iss
been reported by Tomoda and Kimura.53 They suggested thathe level splitting of the molecular orbitals even in thmethanol-dimer broadens the ionization band structurecompletely featureless spectrum with a very strong overof the individual bands. Thus they were not able to decvolute any structured features in their spectrum of the dimand no shifts for individual molecular ionization bands coube extracted.
It is interesting to note that the observation of Tomoand Kimura leads to the following dilemma: Obviously thdimer represents a first stage towards the formation ofliquid and it is generally expected that the properties of smaggregates should evolve smoothly with the size of the mlecular aggregate.54 Tomoda and Kimura’s observation appears to be in contradiction to these expectations and rapuzzling questions concerning the actual evolution ofelectronic band structure of an isolated methanol moleculthe contiguous liquid methanol.
Three peak features, the first two ionization bands ofisolated molecule attributed to thenO andnO orbitals and thefifth feature related to thesOH orbital
41 are found to be en-hanced in the deconvolution of the liquid spectrum withspect to the gas phase spectrum. This suggests a posorientation of the molecules at the liquid methanol surfaOne may argue that, although the relative increase ofsOH band is almost a factor 4, the observation is of minsignificance due to the high secondary electron backgroin this energy region. However the first two structures aalso definitely stronger in the liquid spectrum than in the gspectrum. If the assignment of the liquid bands based osimple matching with the free molecule assignments is crect then our measurements suggest that the methanolecule at the surface is oriented with its OH end stickioutwards towards the vacuum. In terms of the Born-solvatpicture ~see Sec. I! the gas-liquid shift of thesOH bandwould be expected to be slightly smaller than for the othmethanol bands, due to a lesser extent of embedding withe surrounding dielectric. In apparent contradiction to tconclusion the gas-liquid shift of thesOH band is howevergreater than for the other methanol bands. This wouldmore likely to fit the comparison with surface tensiomeasurements,41,44nonlinear optical studies,46 and the resultsfor the other alcohols. We have at present no simple physmodel to explain this contradiction.
C. Ethanol
The more complex photoelectron spectrum of liquid eanol CH3CH2OH, shown in Fig. 5 exhibits remarkably pronounced structures and five significant features can be idtified. The observed structures in the liquid spectrum canrelated readily to the five peaks in the vapor phase spectras shown by the Gaussian deconvolution of the spectraFig. 5 the upper vertical lines in the upper panel indicateliterature values of the individual molecular ionization banof the vapor, while the lower vertical lines indicate the meenergetic positions of the bunched Gaussians for comparwith the liquid spectrum. The bands overlap to a much lar
red
n--
abi-s
snt
, No. 22, 8 June 1997ject to the terms at: http://scitation.aip.org/termsconditions. Downloaded to IP:
2 Jan 2014 10:12:33

h
reuof
hig
vathsfothce
ifi-s ofs ofonhe
e
dxthec-ar
edly ae-
pahefsiauid
st
m azle
asec-
9023Faubel, Steiner, and Toennies: Photoelectron spectroscopy of liquids
This a
extent than in the case of methanol. The number of buncfeatures in the liquid spectrum equals the number of the mjor molecular bands of the isolated molecule. The fittingsult and individual gas-liquid shifts for the bunched moleclar orbital bands are listed in Table IV. As in the casemethanol comparably large variations by up to a factor oare found forDEg2l for different bunched orbitals.
Previous UPS studies of Ballardet al.50 reported threepeaks with vertical ionization potentials at~our values inparentheses! 9.7 eV~9.66 eV!, 13.2 eV~12.94 eV!, and 15.1eV ~15.22 eV! for a very cold (278 °C) thin film of liquidethanol on a tungsten rod. An ESCA spectrum on a tliquid ethanol film on a conical rotator, published by Siebahnet al., showed the same three peaks.32 Unfortunately,here also the spectrum was not calibrated to the vapor lebut to the Fermi level of the substrate, with similar calibrtion problems as already discussed in connection withliquid water measurements. Thus, the absolute positionthese literature ionization potentials are not availablecomparison with the present results. A comparison ofliquid band intensities to the vapor here also shows noti
FIG. 5. UPS HeI photoelectron spectrum of gaseous~a! and liquid ~b!ethanol. The gas spectrum was measured for a molecular beam, prefrom a 80mm nozzle beam with 15 Torr nozzle pressure, 2 mm from tnozzle exit. The upper vertical lines in~a! indicate the energetic position othe ionization potentials reported in Ref. 41, while the bunched Gausdeconvolution is used for comparison with the liquid spectrum. The liqspectrum was measured from a liquid jet~10mm nozzle! atz53.0 mm. Thenozzle backing pressure was 80 bar and the nozzle temperature waslized to210 °C. The measuring time was 23 h.
J. Chem. Phys., Vol. 106rticle is copyrighted as indicated in the article. Reuse of AIP content is sub
137.99.26.43 On: Thu, 0
eda---f2
n-
el-eofre-
able differences of the relative weights. Despite the signcant band overlap, which prevents accurate determinationthe exact shape of the bands, it appears that the intensitiethe lowest ionization energy band and the highest ionizatienergy band are significantly lower than in the vapor. Tformer is attributed to thenO orbital of the ethanol moleculeand the latter is attributed to thesOH orbital. This seems tosuggest that the ethanol molecule is oriented with thesOH
end directed into the liquid, which is compatible with thobserved large gas-liquid shiftDEg2l of thesOH feature.
D. 1-Propanol
A typical spectrum of liquid 1-propanol,CH3~CH2!2OH, obtained after 18 h of operation, is displayein Fig. 6. Virtually identically spectra were obtained in siindependent runs at different nozzle temperatures. As inprevious figures the upper vertical lines in the vapor spetrum indicate the energetic positions of individual moleculionization potentials while the lower row of vertical linesmarks the mean energetic position of the major bunchGaussian spectral features. The liquid spectrum shows onlarge, somewhat distorted peak, so that it is difficult to r
red
n
abi-
FIG. 6. UPS HeI photoelectron spectrum of gaseous~a! and liquid ~b!1-propanol. The gas spectrum was measured for a molecular beam fro100mm nozzle beam with 10 Torr nozzle pressure, 2 mm from the nozexit. The vertical lines in~a! indicate the energetic position of the ionizationpotentials reported in Ref. 41. The liquid spectrum was measured fromliquid jet ~10 mm nozzle! at z52.0 mm. The nozzle backing pressure wa50 bar and the nozzle temperature was stabilized at 0 °C. The liquid sptrum was deconvoluted into a secondary electron distribution~hatched! andthree Gaussian functions~open!. The vertical bars in the lower panel indi-cate the mean energetic positions of the Gaussians.
, No. 22, 8 June 1997ject to the terms at: http://scitation.aip.org/termsconditions. Downloaded to IP:
2 Jan 2014 10:12:33

o-Inacatithinaea
ongzetestis
oi-ider
i-edforas-eare
8.thates
ther-
ro-he
2x-thpe
te
romle
red
uid
9024 Faubel, Steiner, and Toennies: Photoelectron spectroscopy of liquids
This a
solve individual bands. A slight distortion can only be nticed in the high kinetic energy wing of the spectrum.order to improve the fit in this region a third Gaussian wintroduced into the fit procedure. The intensity and the lotion of this peak is very difficult to estimate accurately. Bua comparison of the fitting result for this weak feature wthe results for the other alcohols suggests that it is madue to the first ionization potential of the lone-pair orbitnO of the 1-propanol molecule. The maximum entropy dconvolution gives an intensity reduction for this feature byfactor of 5 with respect to the deconvoluted first ionizatiband of the isolated molecule, but with only a very low sinificance. The remaining spectrum can only be parametriby a two Gaussian fit with less significance. The parameof the fit are given in Table V. The gas-liquid shift of the firionization potential is found to be 0.73 eV which is constent with the other simple alcohols.
E. 1-Butanol
Figure 7 displays a typical spectrum of liquid 1-butanCH3~CH2!3OH which shows only a single large broad maxmum. The ionization threshold of the spectrum of liqu1-butanol was estimated to be 9.32 eV from the point whthe intensity in the high~kinetic! energy wing drops below
FIG. 7. UPS HeI photoelectron spectrum of gaseous~a! and liquid ~b!1-butanol. The gas spectrum was measured for a molecular beam from amm nozzle beam with 10 Torr nozzle pressure, 2 mm from the nozzle eThe upper vertical lines in~a! indicate the energetic position of the ionization potentials reported in Ref. 41, while the lower vertical lines indicateposition of the bunched Gaussians used for comparison with the liquid strum. The liquid spectrum was measured from a liquid jet~20mm nozzle! atz52.0 mm. The nozzle backing pressure was 30 bar and the nozzleperature was stabilized at 20 °C.
J. Chem. Phys., Vol. 106rticle is copyrighted as indicated in the article. Reuse of AIP content is sub
137.99.26.43 On: Thu, 0
s-,
lyl-
-drs
-
l
e
5% of the maximum intensity of the primary electron distrbution. The threshold of the vapor spectrum was determinto be 9.92 eV, taking the same number of Gaussians asthe liquid by an analogous procedure. The estimated gliquid shift of 0.60 eV is in reasonable agreement with thresults for the other simple alcohols. The fit parameterslisted in Table VI.
F. Benzyl alcohol
The spectrum of liquid benzyl alcohol, C6H5CH2OH, ex-hibits at least four well resolved peaks, as shown in Fig.The deconvolution into independent Gaussians suggestsin fact six bands contribute to the spectrum. The fit valuare tabulated in Table VII. All six clearly distinguishablebunched peak features of the free molecule are found inliquid with essentially the same relative intensities. In paticular, the second bunched ionization band~2!, which isrelated to thenO molecular orbital of benzyl alcohol, is re-covered by the deconvolution procedure, which does not pvide a satisfactory fit without this second Gaussian peak. T
00it.
ec-
m-
FIG. 8. UPS HeI photoelectron spectrum of gaseous~a! and liquid ~b!benzyl alcohol. The gas spectrum was measured for a molecular beam fa 200mm nozzle beam with 3 Torr nozzle pressure, 2 mm from the nozzexit. The upper vertical lines in~a! indicate the energetic position of theionisation potentials reported in Ref. 41. The liquid spectrum was measufrom a liquid jet~20mm nozzle! atz52.0 mm. The nozzle backing pressurewas 50 bar and the nozzle temperature was stabilized at 27 °C. The liqspectrum was deconvoluted into a secondary electron distribution~hatched!and six Gaussian functions~open!. The numbers~1...6! in the lower panelindicate the mean energetic positions of the Gaussians.
, No. 22, 8 June 1997ject to the terms at: http://scitation.aip.org/termsconditions. Downloaded to IP:
2 Jan 2014 10:12:33

an-
to-
ousex-hinc-
e
idec-nere-stableting
is
a, ofhatg is
9.hee
ge,andthendhatn-thesibleec-opsu-
9025Faubel, Steiner, and Toennies: Photoelectron spectroscopy of liquids
This a
tabulated ionization potentials are extracted using the loenergy onset of the spectrum as the zero kinetic energy reerence.
In addition to the streaming potential another energshift of 0.8 eV had to be introduced in order to match the lowenergy tail of the experimental spectrum to zero kineticenergy.55 In contrast to the simple alcohols considered in thepreceding measurements, the first ionization band of benzlalcohol does not involve the ionization of thenO molecularorbital but of thep2p3 band. ThenO band ~2! and thebunched ionization band labeled~6! in Fig. 9 show the high-est DEg2l values of 1.15 and 1.12 eV, respectively. Thebunched band~6! has a significant contribution from thesOH ionization band. These two structures represent bandwhich are more localized at the methylene group than thother bands. The bands which are clearly related to the bezyl ring showDEg2l shifts of only 0.97 eV~1! and 0.54 eV~5!. The bands which are mixtures of methyl group and benzyl ring related molecular orbitals show intermediate shiftsDEg2l of 1.04 eV~3! and of 0.82 eV~4!. For these reasonswe suggest that the benzylalcohol molecules are slightly orented in the surface layer with the benzyl ring at the surface
FIG. 9. UPS HeI photoelectron spectrum of gaseous~a! and liquid ~b!n-nonane. The gas spectrum was measured for a molecular beam, prepafrom a 80mm nozzle beam with 12 Torr nozzle pressure, 2 mm from thenozzle exit. A bunched Gaussian band parametrization was used for tvapor for comparison with the liquid spectrum. The liquid spectrum wasmeasured from a liquid jet~20mm nozzle! at z52.0 mm. The nozzle back-ing pressure was 50 bar and the nozzle temperature was stabilized at 29The threshold ionization potential~th! was determined as the point were theintensity drops below 5% of the maximum of the primary electron distribu-tion.
J. Chem. Phys., Vol. 106rticle is copyrighted as indicated in the article. Reuse of AIP content is sub
137.99.26.43 On: Thu, 0
wf-
y
y-
sen-
-
i-.
Unfortunately the band separation is not sufficient to qutify this effect further by, e.g., the band intensities.
G. n -Nonane
Only a few previous attempts to investigate the phoelectron spectra of liquid alkanes have been reported.56 Asfar as we are aware for the pure liquid alkanes no previelectron emission experiment has been successful. Theperiments described in the literature were performed for tliquid films on a conducting material. The emission of eletrons charges the jet surface to a voltage potentialU of
U5 j •d
sL, ~9!
whered is the liquid layer thickness,j the current density ofthe emitted electrons, andsL is the liquid conductivity.Typical experimental parameters wered'300mm and j'1027 A/cm2. Typical conductivities of liquid alkanes arof the order ofsL'10210 V21 cm21 for liquid pentane orsL'10212 V21 cm21 for liquid hexane.43 For hexane a sur-face potentialU of the order of 3000 V follows from Eq.~9!.To overcome this problem Moberget al.57 used a 1.6 Msolution of butyl lithium in heptane to increase the liquconductivity and was able to obtain a photoelectron sptrum. Another successful approach was reported by Morget al.58 who studied mixtures of polar solvents with dodcane, tetradecane, and pentadecane with UPS and metahelium deexcitation. The low conductivity of the liquid is noa problem for our experiment because of the high streamvelocity of the liquid jet~see Section I!. At our typical jetvelocities of 105 cm s21 the effective current densityj in Eq.~9! is reduced by a factor of 105.
The alkane, studied in the present experimentn-nonane (CH3~CH2!7CH3), a nonpolar, extremely weaklydissociated liquid (pK'10249) with a conductivity of theorder ofsL,10212 V21 cm21. n-nonane was chosen astest liquid because of the relatively high vapor pressureapproximately 5 Torr at 25 °C, in order to demonstrate tneither the vapor pressure nor the photoemission chargina problem for the present method. The HeI spectrum of liq-uid n-nonane is compared with that of the vapor in Fig.An electrokinetic charging effect was not observed for tthin liquid jet of n-nonane26 used here but is a formidablproblem at larger nozzle cross sections.59 The overlap of theionization bands for the free molecule is already very larand consequently no strongly pronounced molecular bfeatures are resolved in the liquid. The deconvolution ofliquid spectrum into a secondary electron distribution atwo Gaussian primary bands is shown in Fig. 9. We find tthe two maxima in the liquid spectrum at ionization potetials of 9.60 and 14.01 eV cannot be simply related toobserved two Gaussian gas phase bands and it is not posto extract any gas-liquid shifts for individual bands. Ththreshold ionization potential for the emission of photoeletrons was determined as the point where the intensity drbelow 5% of the maximum of the primary electron distribtion and was determined to beI P
th~liq!58.0 eV, compared to
red
he
°C.
, No. 22, 8 June 1997ject to the terms at: http://scitation.aip.org/termsconditions. Downloaded to IP:
2 Jan 2014 10:12:33

rns
9026 Faubel, Steiner, and Toennies: Photoelectron spectroscopy of liquids
This article is copyrighted a
TABLE VIII. The gas-liquid shiftsDE(eopt) and DE(estat) of simple alcohols are calculated via the Boequation Eq.~7! under the assumption of a constant ion radiusr 053 Å for comparison with the observed galiquid shiftsDEg2l .
eopt5n2 a DE(eopt!@eV# estatb DE(estat!@eV# DEg2l@eV#
CH3OH 1.76 1.04 33.62 2.33 0.95CH3CH2OH 1.85 1.10 24.30 2.30 0.97CH3~CH2!2OH 1.91 1.14 20.10 2.28 0.73CH3~CH2!3OH 1.95 1.17 17.80 2.27 0.60
C6H5CH2OH 2.37 1.39 13.10 2.22 0.97
aCalculated forl5589.3 nm~Ref. 44!.bTaken from Ref. 43.
thhlyrepe
orsidncvfceheodlseapard-nd
ioonoeaonpi-thuith-inideio
leate-hisple
op-ni-
ithtricre-e-f thechre-ortal-eV
theVon
ronofarymo-c-re-ase-con-n-on
ts,
ob-larted
I Pth~gas!58.7 eV. Thus the gas-liquid shift forn-nonane is
DEg2l50.7 eV. These experiments demonstrate that withpresent microjet technique the effect of charging of higinsulating liquids can be negligibly small and that measuments of such pure insulating materials can be easilyformed.
V. CONCLUSIONS
The photoelectron spectrum of water, of several alcohand of the alkanen-nonane have been measured for the fitime with the free jet technique. For water the gas-liquenergy shifts of three molecular orbital bands in the valeband region are determined with respect to the vacuum leThe peak areas show a trend towards an enhancement osOH orbital, compatible with an orientation of the surfamolecules with one H atom outward as proposed by otauthors, e.g., Duet al.46 An analogous deconvolution intGaussian shaped peak structures for the alcohols also mapossible to determine the intensities of the principal orbitaThe intensities and the gas-liquid shifts of the spectral ftures of most alcohols can be interpreted using a simpletially embedded molecule model which is a straightforwaextension of Born’s early solvation theory for partially immersed ions at the liquid surface. Accordingly, ethanol teto be oriented with itssOH orbital directed into the bulk.However, the high gas-liquid shift for thesOH orbital ofmethanol indicates a tendency for this molecule to danglesOH orbital outside the liquid. The spectrum of 1-propanshows a slight distortion in the energy region where the iization band due to thenO band would be expected, but nfurther spectral features were visible. For 1-butanol no clstructural information could be extracted because of a stroverlap of the bands. Photoelectron studies on the low vapressure liquid benzyl alcohol confirm the known six indvidual peaks. In the series of the simple chain alcoholssOH orbitals always have the largest observed gas-liqshifts in these molecular compounds. Further studies ofsimple chain alkanen-nonane failed to reveal a well structured photoelectron spectrum. Here we can only determthe shift of the threshold ionization potential of the liquwith respect to the free nonane molecule. Its magnitudfound to be in reasonable agreement with the expectatfrom the other liquids.
J. Chem. Phys., Vol. 106s indicated in the article. Reuse of AIP content is sub
137.99.26.43 On: Thu, 0
e
-r-
lst
eel.the
r
e it.-r-
s
tsl-
rgor
ede
e
isns
The first ionization potentials measured for the simpalcohols listed in the last column of Table VIII indicate ththe gas-liquid shifts of the threshold ionization energy dcreases roughly with increasing carbon chain length. Ttrend can be compared with the trend predicted by the simBorn picture of the solvation process of Eq.~7!. The ex-pected gas-liquid shifts using both the more appropriatetical dielectric constantseopt taken for an arbitrary chosewavelength ofl5589.3 nm and, alternatively, the static delectric constantsestat are also listed in Table VIII for com-parison. For use in Eq.~7!, a mean spherical radius ofr 053 Å is assumed for all alcohols. No consistent trend wincreasing chain length is predicted for either set of dielecconstants. The failure of the qualitative Born model in pdicting trends for the different alcohols will need further thoretical consideration. As expected the absolute values oBorn theory for the optical dielectric constants agree mubetter in magnitude with the experimental data than thesults for the static dielectric constants. This reflects the sh10215 s time scale of the photoemission process. Benzylcohol shows a comparably large gas-liquid shift of 0.97for the first ionization potential (estat513.10). It is interest-ing to note that the second spectral feature, attributed tono orbital, gives an even higher gas-liquid shift of 1.15 ewhich is qualitatively in better agreement with the predictibased on the optical dielectric constant.
The parameters for the low energy secondary electcontributions in the liquid surface photoelectron spectrathe alcohols are listed in Table IX. In general the secondelectron fraction in the spectra decreases with increasinglecular weight, which is consistent with an increasing eletron stopping power. For ethanol the influence of an unsolved ionization band, corresponding to the gas phionization band at 21.5 eV,60 may have resulted in an increase of the deconvoluted apparent secondary electrontribution. Benzyl alcohol is also an exception from the geeral trend, with a relatively high secondary electrcontribution.
The present evaluation of the spectra and other resul61
to be discussed in a subsequent paper,36 indicate that thetypical escape depth for the electrons contributing to theserved ionization bands is of the order of only one molecumonolayer. This is considerably smaller than the accepvalue of 6 Å commonly used in the literature.49 If the escape
, No. 22, 8 June 1997ject to the terms at: http://scitation.aip.org/termsconditions. Downloaded to IP:
2 Jan 2014 10:12:33

mudenthgizeteix
utiat
sri-
reaincallaleedus
llypeasengl oiedsanca
b
vecaliv-.ionhichthis.-tion
eistici-
ndus-H.is-f A.E.op-sem-c-
ofpplyt iski-ec-in-ct.es aofthelm-hesi-eeenisyliq-uidltzthetal,
then
at
u
ta
9027Faubel, Steiner, and Toennies: Photoelectron spectroscopy of liquids
This a
depth would be of the order of the proposed 6 Å then theobserved differences in the relative areas of the differentlecular orbital ionization bands would be greatly reduced dto the averaging over the escape depth in the liquid. In orto provide a consistent explanation with the preferentialhancement of selected orbitals we, therefore, concludethe electrons generated inside the liquid undergo stroninelastic collisions and therefore appear as the thermalfraction at the expense of the primary electrons. This inpretation is consistent with observations at binary liquid mture surfaces of low vapor pressure liquids.8 It is also con-sistent with the fact that the relative areas and gas-liqshifts of the liquid water UPS spectrum due to a preferenH2O orientation~Sec. IV! compares favorably with recennonlinear optical experiments at liquid water surfaces.46 Thedetailed understanding of the stopping power of electronliquids, will be another important problem for future expements as well as for theoretical calculations~see e.g. Ref.61!.
For lack of a better model the observed spectral featuhave been attributed to the molecular bands of the gas phA more sophisticated model is obviously needed for theterpretation of the spectra. Embedded molecular clusterculations and especially a realistic simulation of the oscitor strength of the individual molecular bands of molecuin liquids would be very useful. Certainly, a more detailinterpretation will require the development of more rigorouniversal theories for the photoemission of liquids.
As shown in this article it is possible to experimentadetermine the photoelectron spectra and, hence, the exmental electronic density of states of volatile liquids inhigh vacuum experiment. The free-micro jet technique uis the only direct method available up to now for obtainithe ionization potentials with respect to the vacuum levevolatile molecular liquids. This new technique can be applto the investigation of many, hitherto inaccessible liquiwhich are of considerable interest in physics, chemistry,biology. Additional experiments on the static and dynamisurface composition of binary mixtures62 and on aqueousionic electrolyte solutions have been performed and will
TABLE IX. The parameters of the secondary electron contribution ofHe I photoelectron spectrum of liquid alcohols as fitted by the ‘‘expontially modified Gaussian’’ function Eq.~8!.
I P(E0)@eV#a s@eV#b t@eV#c Aread
CH3OH 19.05 0.95 0.36 54.7%CH3CH2OH 19.27 0.88 0.16 60.3%CH3~CH2!2OH 19.19 0.99 0.13 35.2%CH3~CH2!3OH 19.74 0.5 1.11 26.8%
C6H5CH2OH 20.10 0.85 1.41 57.9
aThe mean ionization potential of the assumed Gaussian shaped ionizband.bThe deconvoluted initial half width of the Gaussian.cThe exponential damping factor, describing the mean energy loss perescape depth.dThe relative integral over the slow electron peak describes the percenfraction of the secondary electrons in relation to the total intensity.
J. Chem. Phys., Vol. 106rticle is copyrighted as indicated in the article. Reuse of AIP content is sub
137.99.26.43 On: Thu, 0
o-eer-atlydr--
idl
in
sse.-l--s
ri-
d
fd,dl
e
presented in subsequent publications.36 First experimentswith aqueous solutions of biologically relevant liquids hademonstrated the potential of the method for analytipurposes.63 Other experiments illustrate the unique sensitity to small concentrations of solutes in technical solutions64
It will be also interesting to attempt to map out the dispersof the bands by angular resolved photoelectron spectra wwould reflect possible order at the surface. The scope offield is very wide and there is much room for future work
Finally we mention that many other well known ultrahigh vacuum surface techniques such as electron diffrac~LEED! and energy loss spectroscopy~EELS! as well as he-lium atom scattering~HAS! can be used to complement thphotoelectron spectroscopy experiments. We are optimthat such experiments will significantly contribute to our mcroscopic understanding of the liquid state of matter.
ACKNOWLEDGMENTS
The authors thank H. Madden and R. M. Martin amany other visitors and colleagues for stimulating discsions on the experiment. We are also indebted toMorgner, H. Siegbahn, and especially K. Siegbahn for dcussions on the interpretation. We also thank the group oGoldmann in Kassel for technical support and particularlyJanssen for his expert advice with the construction anderation of the HeI light source. Finally we want to expresour great appreciation to Jens Pick and the many other mbers of the technical stuff for their ingenuity in the constrution and maintenance of the apparatus.
APPENDIX: ELECTROKINETIC EFFECTS
In these experiments we found that the understandingthe basic electrochemical processes inside the nozzle suwas crucial for obtaining stable and reproducible data. Ithe goal of the Appendix to report on the relevant electronetic modelling and the resulting effects to the sampled sptra. As reported in Ref. 26, low dissociating liquids containg free ions tend to show an elektrokinetic charging effeIn the interfacial region in the vicinity of a metal, in our casthe inner walls of the PtIr nozzle aperture, the liquid showdifferent charge composition than in the bulk. The layerions closest to the metal surface are tightly bound tosurface leading to the formation of the so-called inner Heholtz layer which results in an electrical potential at tboundary.65 This potential can be generated by either potive or negative ions, depending on the ratio of their frenergies in the metal and the liquid. The potential betwethe inner Helmholtz layer and a point far inside the liquidcalled thez potential.66 A second, more mobile, oppositelcharged ion layer next to the first layer extends into theuid and compensates the electrical charge at the solid–liqinterface. This layer is often called the outer Helmholayer.65 Simple models for the second layer based onspatial decreasing ionic space charge in front of the mewere first proposed by Gou¨y67 and Chapman68 and later im-proved by Stern.69
e-
ion
nit
ge
, No. 22, 8 June 1997ject to the terms at: http://scitation.aip.org/termsconditions. Downloaded to IP:
2 Jan 2014 10:12:33

atn
ty
-oe
b
d
o
ca
sn
nens
ereveni-
-
For0
t.doneout,
bealki-y-or-
adial
y
e.yerf
9028 Faubel, Steiner, and Toennies: Photoelectron spectroscopy of liquids
This a
The thicknessd of the hydrodynamical boundary layerthe nozzle exit can be estimated by the following equatio70
d52r n2r nA6•S 2h
h11D14, ~A1!
where r n denotes the radius of the nozzle channel andh5u/u21 is the relative increase in the local flow velociu along the axis of the channel at a given distancez from theentrance with respect to the velocityu at the channel entrance. In 1922 Schiller reported a simple approximate fmula forh as a function of the nozzle Reynolds number Rand the relative distancez/r n
71
h'A 1
0.114•
z
r n Re. ~A2!
Since the ratio of the total channel lengthl to the aper-ture radiusr n for our nozzles is given byl /r n51 we obtainfor x5 l , d'1mm.
The characteristic electrochemical layer thickness canestimated in the Debye–Hu¨ckel approximation65 by solvingthe corresponding Poisson equation in cylindrical coornates
DF~r !521
ee0•r~r !, ~A3!
whereF is the electrical potential,r is the charge densityandr is the space coordinate. In cylindrical coordinatesz andf the problem reduces to the partial differential equationthe radial potentialF(r ) which can be written as
1
r
]
]r S r ]F~r !
]r D5S 1k D 2•F~r !, ~A4!
wherek is the characteristic length of the electrochemilayer and is given by72
1
k5A2000e0
2NA
ee0kBT•
1
2 (izi2ci , ~A5!
where the characteristic ionic charge numberzi and the con-centrationsci are summed over all ionic speciesi . NA is theAvogadro constant and the other parameters have their umeaning. For example for water with a static dielectric costant of estat580 pH57 ~an ionic concentration ofci51027 mol/l ! and a temperature ofT5300 K we obtaink'1mm. The solution of Eq.~13! inside a cylinder withradiusr n and a constant potentialF at the metallic wall canbe found in mathematical handbooks~Ref. 73, p. 916! to be
F~r !5F0(n50
` S 1k D 2n22n~n! !2
•r 2n. ~A6!
The physical situation at the interface between the inmetallic wall of the nozzle and the liquid containing free iois sketched in Fig. 10. The streaming currentI str, caused bythe electrokinetic charge separation, is given by74
J. Chem. Phys., Vol. 106rticle is copyrighted as indicated in the article. Reuse of AIP content is sub
137.99.26.43 On: Thu, 0
r-,
e
i-
f
l
ual-
r
I str5E0
r nr~r !•u~r !dr, ~A7!
where r(r ) is the net ion charge distribution,u(r ) is thelocal hydrodynamic velocity profile, andr n is the radius ofthe nozzle channel. At the nozzle exit the mobile outHelmholtz ion layer is sheared off and an efficient chargseparation takes place with either negative or positicharges being swept away by the jet flow. This can be motored by the measurement of the streaming currentI str at themetal nozzle aperture.26 The potential generated at the surface of the jetFstr is then given by Eq.~5!.26 Typical stream-ing currents in water are dominated by negative charges.a 10mm liquid water jet with a He backing pressure of 8bar the current is of the order of210 nA. The correspondingadditional surface potential calculated from Eq.~5! is then218 V, corresponding to 1.8 eV per nA streaming currenFortunately this additional charge is uniformly distributeover the surface and the charge separation is constanttypical time scales of the experiment. If this were not thcase the photoelectron spectra would have been smeareddue to the varying local reference potential.
We have observed that this charge separation cancontrolled by modifying the hydrodynamic and the electricboundary layers. First, it is possible to adjust the electronetic charging and thereby change the width of the hydrodnamic boundary layer by varying the nozzle pressure. Unf
FIG. 10. The electrokinetic charge separation process is caused by the rdistribution of streaming velocities@u(r )# at the nozzle exit~a! and theradial distribution of ions in the mobile outer Helmholtz layer in the vicinitof the metallic nozzle channel wall. The electrical potentialF(r ) shown in~b! results from the nonuniform distribution of free ions over the volumThe potential at the boundary between inner and outer Helmholtz ion lais usually called thez potential. Both layers have characteristic lengths othe same order of magnitude for the pure water experiment.
, No. 22, 8 June 1997ject to the terms at: http://scitation.aip.org/termsconditions. Downloaded to IP:
2 Jan 2014 10:12:33

eu
cte
is
tic
on
idte
in-
rehiecth
toit
ng-
m
lderelheu
r-mstlectiathc-okthdtosshi
he-le to
ousects
pec-ron
lso
c-astion
c-
washey Eq.
ent ateenwascy.rging
9029Faubel, Steiner, and Toennies: Photoelectron spectroscopy of liquids
This a
tunately this variation is not very efficient and moreovleads to an undesired change in the length of the intact liqjet.
Slight variations of thepH value have a more dramatieffect on the charge separation effect. Especially for wathe streaming current can be reduced from210 nA atpH 7to a current below the experimental limit of 10 pA atpH7.41 and even reversed in sign to 5 nA atpH 9 by addingsmall amounts of NH3.
26 The species responsible for theffect are the solvated protons H1 and OH2 ions, which dueto their high individual mobilities dominate the electrokinecharging. Thus the measurement of thepH value, instead ofthe whole ionic strength, is an important experimental ctrol parameter.
The third important experimental parameter is the liqutemperature which effects the self dissociation of waChanging the nozzle temperature of a 10mm liquid water jetwith a backing pressure of 80 bar from 280 to 315 Kcreases the electrokinetic streaming current from25 to210 nA with a nearly linear slope of20.14 nA/K, or20.26 V/K for the corresponding surface potential. Thefore the nozzle temperature had to be stabilized to witbetter than 0.1 K to avoid the broadening of the photoeltron spectra by drifts of the reference potential duringsampling intervals.
To study the influence of this surface potential phoelectron spectra were measured for a liquid water jet wdifferent streaming currents in the range of24 to213 nA. This range of currents could be achieved by chaing thepH value of pure water simply by varying the temperature of the liquid~for a detailed description see Ref. 26!.Photoelectron spectra for a 10mm jet of pure water with abacking pressure of 80 bar are shown in Fig. 11 for streaing currents of25.3 nA (29.5 V), 26.5 nA (211.8 V),28.6 nA (215.4 V), and29.5 nA (217.2 V) at a fixeddownstream distance from the nozzle ofz52.5 mm. Thecorresponding surface potentialsFstr, calculated from Eq.~5!, are given in parentheses. The nozzle aperture was hea negative voltage of240 V with respect to the spectrometground in all measurements. In this way a local electric fiis built up in the region surrounding the liquid jet whicassures that the emitted photoelectrons are always accated to avoid problems due to a possible work function coff of the spectrometer.75
In the experiment shown in Fig. 11 the potential diffeence between the local surface potential and the skimentrance of the spectrometer was adjusted to be a con132 V to assure comparable conditions for the photoetron sampling efficiencies. As seen in Fig. 11 the differenshift is in perfect agreement with the calculated values ofstreaming potential from Eq.~5! and the shape of the spetrum under these conditions is unchanged by the electrnetic surface potential. The latter observation implies thatcharges generated at the nozzle are uniformly distributethe layer near the surface from which the UV excited phoelectrons are sampled. Otherwise one would expect tochanges in the shape of the obtained spectrum, leading ecially to a charge dependent broadening of the bands, w
J. Chem. Phys., Vol. 106rticle is copyrighted as indicated in the article. Reuse of AIP content is sub
137.99.26.43 On: Thu, 0
rid
r
-
r.
-n-e
-h
-
-
at
d
ler-t-
erant-le
i-ein-eepe-ch
is definitely not seen. This conclusion is confirmed by tspectrum from liquid water jets with a small addition of ammonia to adjust the charge separation balance at the nozza vanishing electrokinetic charging~for details see Ref. 26!which is identical to the pure water spectrum. Some aquesalt solutions were studied which also show no charge effand will be discussed in a subsequent paper.36 In these ex-periments the simultaneous measurement of the liquid strum and the spectrum of argon gas confirm the electenergy calibration.
As a cross-check the photoelectron distribution was ameasured with an x-ray source (MgKa , hn51253.6 eV) inthe region of the O 1s orbital. In this case reproducible spetra could only be obtained when the streaming potential wsuppressed by the addition of salts. The observed ioniza
FIG. 11. UPS HeI photoelectron spectra of liquid water for different eletrokinetic generated surface potentialsFstr . A 10mm liquid water jet with anozzle backing pressure of 80 bar and a nozzle temperature of 5 °Cmeasured atz52.5 mm. The electrokinetic potential was determined via tmeasurement of the streaming current at the nozzle and calculated b~5!. The nozzle aperture was maintained at a potential of240 V to accel-erate the photoelectrons. The local reference potential in the measuremthe ionization region is interpolated to be 16.7 eV. The difference betwthe local surface potential and the spectrometer entrance slit skimmerheld at 32 V to avoid transmission corrections for the sampling efficienThese spectra illustrate that the shape is not influenced by the chaeffect when proper precautions are made.
, No. 22, 8 June 1997ject to the terms at: http://scitation.aip.org/termsconditions. Downloaded to IP:
2 Jan 2014 10:12:33

fo
dmdtbs
herigh
rdfa
-
k-
m.
n,
on
lec
.
.
-
fonsure
e
ralot
ry
ry
.
ec-
em.
osc.
ec-
les
.
U.
e byt.ec-The
e to
his
elat.
es
9030 Faubel, Steiner, and Toennies: Photoelectron spectroscopy of liquids
This a
potentials for the O 1s band of the liquid 1 M aqueous solu-tions is found to be 538.0 eV, compared to the 539.9 eVthe gas phase, thus yielding a gas-liquid shift of 1.9 eV~seeTable I!. The widths of the Gaussian deconvoluted banwere 1.2 eV for the gas phase and 1.9 eV for liquid. Assuing the broadening in the liquid to be a Gaussian its wiwould be 1.55 eV, which is the same value as obtainedLundholm et al. reported in Ref. 9. The gas-liquid shift ifound to be independent of the alkali halide added andidentical to the value reported by Lundholmet al.9 for ahighly cooled aqueous 3.8 M LiCl solution. We interpret tfailure of the streaming potential correction in this expement to indicate that the electrokinetic generated charlead to a significant broadening of the spectra when the ptoelectrons are sampled from the'25 Å depth, consideredto be the XPS escape depth of electrons with a kinetic enearound 500 eV.48 Conversely it appears that these chargesnot generate a significant voltage gradient across the surregion seen by UPS.49
1A. Zangwill, Physics at Surfaces~Cambridge University Press, Cambridge, 1988!.
2K. Siegbahn.Les Prix Nobel~Stockholm. Roy. Akad. Sci. Press, Stocholm, 1981!.
3Lord Rayleigh. Philos. Mag.33, 363 ~1892!.4H. Siegbahn. J. Phys. Chem.89, 897 ~1985!.5S. A. Lednovich and J. B. Fenn, AlChe J.23, 454 ~1977!.6H. Siegbahn and K. Siegbahn, J. Electron. Spectrosc. Relat. Pheno2,319 ~1973!.
7M. E. King, G. M. Nathanson, M. A. Hanning-Lee, and T. K. MintoPhys. Rev. Lett.70, 1026~1993!.
8H. Morgner, J. Oberbrodhage, K. Richter, and K. Roth, Molec. Phys.73,1295 ~1991!.
9M. Lundholm, H. Siegbahn, S. Holmberg, and M. Arbman, J. ElectrSpectrosc. Relat. Phenom.40, 163 ~1986!.
10H. Fellner-Feldegg, H. Siegbahn, S. Holmberg, and M. Arbman, J. Etron. Spectrosc. Relat. Phenom.40, 163 ~1986!.
11W. J. Moore,Physical Chemistry, 5th ed.~Longman, London, 1972!.12P. Delahay and K. von Burg, Chem. Phys. Lett.83, 250 ~1981!.13M. U. Sander, K. Luther, and J. Troe, Ber. Bunsenges. Phys. Chem97,953 ~1993!.
14F. Williams, S. P. Varma, and S. Hillenius, J. Chem. Phys.64, 1549~1976!.
15P. Delahay, inElectron Spectroscopy, edited by C. R. Brundle and A. DBaker ~Academic, London, 1984!, Vol. 5 p. 124.
16M. Knudsen, Ann. Phys.~Leipzig! 48, 1113~1915!.17S. Schlemmer, M. Faubel, and J. P. Toennies, Z. Phys. D10, 269 ~1988!.18S. Dushman and J. M. Lafferty,Scientific Foundations of Vacuum Techniques~Wiley, New York, 1962!.
19The vapor pressureP at the jet surface and of the generated dropletsthe employed spatial dimensions are identical to equilibrium conditioAn estimate of the vapor pressure increase due to the surface curvatgiven by the Kelvin equation: ln(P/P0)5(2Mg)(RTrr)21, whereM is themolar mass,g the surface tension, andr the liquid density. The vaporpressure for a flat surface isP0 and for a curved surface with curvatur1/r the vapor pressure isP. For water droplets at a temperatureT5293 K (P052333 Pa) the vapor pressure is increased by 0.1% fodroplet with radiusr51mm with respect to the flat surface. Our typicdroplet diameters are of the order of 6mm, so the surface properties do nhave to be corrected for this effect.
20R. E. Ballard,Photoelectron Spectroscopy and Molecular Orbital Theo~A. Hilger, Bristol, 1978!.
21G. Ertl and J. Ku¨ppers,Low Energy Electrons and Surface Chemist~Verlag Chemie, Weinheim, 1974!.
22T. Kisters, diploma thesis, University of Go¨ttingen, Berichte des Max-Planck-Institutes fu¨r Stromungsforschung, 1989.
J. Chem. Phys., Vol. 106rticle is copyrighted as indicated in the article. Reuse of AIP content is sub
137.99.26.43 On: Thu, 0
r
s-hy
is
-eso-
gyoce
.
-
r.is
a
23C. Weber, ZAMM11, 136 ~1931!.24E. Janssen, Ph.D. thesis, University/GH of Kassel, 1990.25H. Siegbahn and M. Lundholm, J. Electron. Spectrosc. Relat. Phenom28,135 ~1982!.
26M. Faubel and B. Steiner, Ber. Bunsenges. Phys. Chem.96, 1167~1992!.27H. Morgner, J. Oberbrodhage, K. Richter, and K. Roth, J. Electron. Sptrosc. Relat. Phenom.57, 61 ~1991!.
28J. R. Farrell and P. McTigue, J. Electroanal. Chem.139, 37 ~1982!.29T. A. Koopman, Physica1, 104 ~1933!.30S. C. Avanzino and W. L. Jolly, J. Am. Chem. Soc.100, 2228~1978!.31R. E. Ballard, J. Jones, D. Read, A. Inchley, and M. Cranmer, ChPhys. Lett.137, 125 ~1987!.
32H. Siegbahn, S. Svensson, and M. Lundholm, J. Electron. SpectrRelat. Phenom.24, 205 ~1981!.
33H. Siegbahn, L. Asplund, P. Kelfve, and K. Siegbahn, J. Electron. Sptrosc. Relat. Phenom.7, 411 ~1975!.
34K. Siegbahn, J. Electron. Spectrosc. Relat. Phenom.5, 3 ~1974!.35H. Agren and V. Carravetta, Molec. Phys.55, 901 ~1985!.36M. Faubel and B. Steiner~unpublished!.37J. A. Jonsson,Chromatographic Theory and Basic Principles~MarcelDekker, New York, 1987!.
38C. N. Berglund and W. E. Spicer, Phys. Rev. A136, 1030~1964!.39L. Nemec, J. Chem. Phys.59, 6092~1973!.40Implemented in: Jandel Scientific Publishing Software,PEAKFIT, distrib-uted by SIGMA Chemical, Mu¨nchen.
41K. Kimura, S. Katsumata, Y. Achiba, T. Yamazaki, and S. Iwata,Hand-book of HeI Photoelectron Spectra of Fundamental Organic Molecu~Japan Scientific Societies, Tokyo, 1981!.
42A. H. Narten, M. D. Danford, and H. A. Levy, Discuss. Faraday Soc.43,97 ~1967!.
43Handbook of Chemistry and Physics, 64th ed., edited by R. C. Weast~TheChemical Rubber Company, Cleveland, OH, 1983!.
44Chemical Engineers Handbook, edited by J. H. Perry~McGraw-Hill, NewYork, 1950!.
45J. M. Heller, R. N. Hamm, R. D. Birkhoff, and L. R. Painter, J. ChemPhys.60, 3483~1974!.
46Q. Du, R. Superfine, E. Freysz, and Y. R. Shen, Phy. Rev. Lett.70, 2313~1993!.
47N. Martensson, P. A˚ . Malmquist, S. Svensson, E. Basilier, J. J. Pireaux,Gelius, and K. Siegbahn, Nouv. J. Chem.1, 191 ~1976!.
48K. Siegbahn,Nishima Memorial Lecture~Nishima Memorial Foundation,Tokyo, 1989!, Vol. 30.
49M. Seah and W. Dench, Surf. Interface Anal.1, 2 ~1979!.50R. Ballard, J. Jones, D. Read, and A. Inchley, Chem. Phys. Lett.127, 149
~1986!.51L. Nemec, H. J. Gaehrs, L. Chia, and P. Delahay, J. Chem. Phys.66, 4450
~1977!.52R. Bohm, H. Morgner, J. Oberbrodhage, and M. Wulf, Surf. Sci.317, 407
~1994!.53S. Tomoda and K. Kimura, Chem. Phys.74, 121 ~1983!.54J. Jortner, Z. Phys. D24, 247 ~1992!.55A similar observation was made for this low vapor pressure substancMorgneret al.Ref. 27 who reported a value of only 0.4 eV for the offseIn Ref. 27 the shift was attributed to the electromotive force of the eltrochemical half cell, an effect which can be neglected in our method.streaming potential correction procedure~see Section I and Appendix!eliminates both the effects of charge separation and all effects dustandard electrochemical boundary potentials, such as thez potential andthe electromotive force of the electrochemical half cell. Therefore tadditional contact potential must have another origin.
56R. E. Ballard, J. Jones, D. Read, and A. Inchley, Chem. Phys. Lett.130,49 ~1986!.
57R. Moberg, Z. C. Yuan, S. Holmberg, F. Bo¨kman, P. Ahlberg, O. Bo-hman, and H. Siegbahn, J. Phys. Org. Chem.2, 417 ~1989!.
58H. Morgner, J. Oberbrodhage, and M. Wulf, J. Electron. Spectrosc. RPhenom.61, 183 ~1993!.
59A. A. Boumans, PhysicaXXIII , 1007~1957!.60J. W. Robinson,Handbook of Spectroscopy~CRC, Boca Raton, FL,1979!.
61M. Faubel and B. Steiner, inLinking the Gaseous and Condensed Phasof Matter: The Behaviour of Slow Electronsedited by L. G. Christo-
, No. 22, 8 June 1997ject to the terms at: http://scitation.aip.org/termsconditions. Downloaded to IP:
2 Jan 2014 10:12:33

9,
ca-
9031Faubel, Steiner, and Toennies: Photoelectron spectroscopy of liquids
This a
phorou, E. Illenberger, W. F. Schmid, NATO ASI Series, B326~Plenum,New York, 1994!, p. 517.
62M. Faubel, B. Steiner, and J. P. Toennies, Mol. Phys.90, 327 ~1996!.63M. Faubel and B. Steiner and J. P. Toennies~unpublished!.64B. Steiner, Ph.D. thesis, University of Go¨ttingen, Berichte des Max-Planck-Institutes fu¨r Stromungsforschung 18/1994; ISSN 0436-1191994.
65C. A. Barlow, Jr., ‘‘The Electrical Double Layer,’’ inPhysical Chemistry,An Advanced Treatise, edited by H. Eyring 1987, Vol. IX A.
66C. H. Hamann and W. Vielstich,Elektrochemie~VCH, Weinheim, 1985!.67G. Gouy, J. Phys.9, 457 ~1910!.68D. L. Chapman, Philos. Mag.25, 475 ~1913!.69O. Stern, Z. Elektrochem.30, 508 ~1924!.
J. Chem. Phys., Vol. 106rticle is copyrighted as indicated in the article. Reuse of AIP content is sub
137.99.26.43 On: Thu, 0
70L. Prandtl,The Mechanics of Viscous Fluids, in Aerodynamics Theory IIIedited by W. F. Durand~Springer, New York, 1935!.
71L. Schiller, ZAMM 2, 96 ~1922!.72MTP Int. Rev. Sci. Ser. 1. V. 6: Electrochemistry, edited by J. O’M.Bockris ~Butterworth, University Park Press, 1973!.
73P. M. Morse and H. Feshbach,Methods of Theoretical Physics~McGrawHill, New York, 1953!.
74J. T. Davies and E. K. Rideal,Interfacial Phenomena~Academic, NewYork, 1963!.
75J. Berkowitz, inElectron Spectroscopy: Theory, Techniques and Applitions, edited by C. R. Brundle and A. D. Baker~Academic, New York,1977!, Vol. 1.
, No. 22, 8 June 1997ject to the terms at: http://scitation.aip.org/termsconditions. Downloaded to IP:
2 Jan 2014 10:12:33


![Synthesis of 3,7-Dinitro-1,3,5,7-tetraazabicyclo- [3,3,1]nonane …downloads.hindawi.com/journals/jchem/2011/573540.pdf · 2019-07-31 · Synthesis of 3,7-Dinitro-1,3,5,7-tetraazabicyclo[3,3,1]nonane](https://img.pdfslide.us/doc/110x75/5e787174041fed2ebc185a21/synthesis-of-37-dinitro-1357-tetraazabicyclo-331nonane-2019-07-31-synthesis.jpg)