Embed Size (px)
Citation preview
Western University Western University
Scholarship@Western Scholarship@Western
Electronic Thesis and Dissertation Repository
1-9-2018 10:00 AM
Photocatalytic Hydrogen Production using a Mesoporous TiO2 Photocatalytic Hydrogen Production using a Mesoporous TiO2
Doped with Pt: Semiconductor Synthesis, Oxidation-Reduction Doped with Pt: Semiconductor Synthesis, Oxidation-Reduction
Network and Quantum Efficiencies. Network and Quantum Efficiencies.
Jesus Fabricio Guayaquil-Sosa, The University of Western Ontario
Supervisor: Hugo de Lasa, The University of Western Ontario
Joint Supervisor: Benito Serrano Rosales, The University of Western Ontario
A thesis submitted in partial fulfillment of the requirements for the Doctor of Philosophy degree
in Chemical and Biochemical Engineering
© Jesus Fabricio Guayaquil-Sosa 2018
Follow this and additional works at: https://ir.lib.uwo.ca/etd
Part of the Catalysis and Reaction Engineering Commons
Recommended Citation Recommended Citation Guayaquil-Sosa, Jesus Fabricio, "Photocatalytic Hydrogen Production using a Mesoporous TiO2 Doped with Pt: Semiconductor Synthesis, Oxidation-Reduction Network and Quantum Efficiencies." (2018). Electronic Thesis and Dissertation Repository. 5191. https://ir.lib.uwo.ca/etd/5191
This Dissertation/Thesis is brought to you for free and open access by Scholarship@Western. It has been accepted for inclusion in Electronic Thesis and Dissertation Repository by an authorized administrator of Scholarship@Western. For more information, please contact [email protected].
i
Abstract
The present PhD dissertation establishes that hydrogen can be produced using mesoporous
TiO2 as a photocatalyst, doped with platinum atoms (Pt), in a slurry medium, under near-UV
irradiation and with ethanol as a sacrificial reagent (scavenger). These mesoporous TiO2
photocatalysts were prepared using a sol-gel method. The mesoporous Pt-TiO2 photocatalyst
displayed a reduced 2.34 eV band gap compared to the bare TiO2 (3.20 eV).
Photocatalytic hydrogen production experiments were performed in a Photo-CREC Water II
Reactor (PCW-II Reactor). This novel unit provides both radial and axial symmetrical
irradiation profiles. Furthermore, macroscopic energy balances developed in this unit, showed
a maximum 96% light absorption efficiency.
Runs in the PCW-II Reactor showed that hydrogen molecules were formed through the
coupling of H• radicals under oxygen-free conditions. The use of 2.00 v/v% ethanol as a
sacrificial reagent enabled the production of significant amounts of hydrogen with the
simultaneous formation of hydrogen peroxide, methane, ethane, acetaldehyde and carbon
dioxide by-products. It was confirmed that the extent of hydrogen generation in the presence
of ethanol is a function of the pH level and Pt loading on the mesoporous TiO2 photocatalyst.
Additionally, it was established that the reaction networks leading to hydrogen production,
using the various photocatalysts, shared common reactivity features. For example, it was
shown that under an inert gas atmosphere, ethanol consumption takes place sub-
stoichiometrically. This points towards the simultaneous formation and consumption of
ethanol. Regarding the consumption of the ethanol scavenger, experimental observations were
supported by an “in series-parallel” reaction network. With respect to energy efficiencies, it
was observed that the maximum 22.6 % Quantum Yields found for hydrogen generation
indicates a very good degree of photon utilization (45.2%).
Thus, this PhD dissertation contributes to the development of novel semiconductors for
hydrogen production via water dissociation. It is demonstrated that when using the synthesized
mesoporous semiconductors with added Pt, in a Photo-CREC-Water II Reactor unit,
encouraging Quantum Yields are achieved.

ii
Keywords
Photo-CREC-Water II Reactor, Heterogeneous Photocatalysis, Platinum, TiO2, Hydrogen
production, Quantum Yield.
iii
Co-Authorship Statement
This PhD thesis encloses materials that are published in peer reviewed journals as listed below.
CHAPTER 4
Title of the paper: Photocatalytic hydrogen production using mesoporous TiO2 doped with
Pt.
Authors: Jesús Fabricio Guayaquil Sosa, Benito Serrano Rosales, Patricio Valadés Pelayo
and Hugo de Lasa.
Status: Published.
Journal: Applied Catalysis B: Environmental.
Author contributions: Fabricio conceived and designed the experiments, wrote a draft of
the paper, contributed by modifying the manuscript and its revisions, performed experiments
as well as data analyses. Dr. Serrano assisted with the manuscript writing process. Dr.
Valadés helped with the methodology for calculating the optical energy band gaps of
synthesized materials. Dr. de Lasa edited and provided the final revision of the manuscript.
Reference: Guayaquil-Sosa, J.F.; Serrano-Rosales, Benito; Valadés-Pelayo, P.J.; de Lasa,
H.; Photocatalytic Hydrogen Production using Mesoporous TiO2 Doped with Pt, Applied
Catalysis B: Environmental, 2017, 7, 337-348, doi.org/10.1016/j.apcatb.2017.04.029.
iv
CHAPTER 5
Title of the Paper: Hydrogen Production via Water Dissociation Using Pt–TiO2
Photocatalysts: An Oxidation–Reduction Network.
Authors: Jesús Fabricio Guayaquil Sosa, Alan Calzada, Benito Serrano Rosales, Salvador
Escobedo and Hugo de Lasa.
Status: Published.
Journal: Catalysts.
Author Contributions: Fabricio conceived and designed the experiments, wrote a draft of
the paper, contributed by modifying the manuscript and its revisions, performed experiments
as well as data analyses. Alan Calzada contributed to the synthesis of the impregnated
materials and Salvador Escobedo facilitated with the storage hydrogen tank. Dr. Serrano and
Dr. de Lasa edited and provided the final revision of the manuscript.
Reference: Guayaquil-Sosa, J.F.; Calzada, A.; Serrano, B.; Escobedo, S.; de Lasa, H.
Hydrogen Production via Water Dissociation Using Pt–TiO2 Photocatalysts: An Oxidation–
Reduction Network. Catalysts 2017, 7, 324. doi:10.3390/catal7110324.

v
Acknowledgments
First, my honest appreciation is to Dr. Hugo de Lasa for putting his trust on me. Also for being
a very supportive supervisor and admirable professor. His superior standards, constant
inspiration, and priceless suggestions made my PhD thesis possible.
I especially thank Professor Benito Serrano for his assistance and friendship during my PhD.
I also wish to extend my sincere respect and thankfulness to my dear friends Dr. Jesus Moreira
and Dr. Aaron Ortiz, for their invaluable support in Canada.
I would like to extend my sincere gratitude to my colleague Dr. Kyriakos Manoli for sharing
his scientific knowledge with me.
Remarkable thanks to all my friends I met in Canada; Hussein Mahmoud, Lin Su, Hai Su,
Yolanda Echeverria, Jimena de la Pena, Rob Lin, Yira Aponte, Angel Lanza, Jose Munoz, Dr.
Sameer Al-Ghamdi, Camila Jeres, Nazanin Afghan, Pablo Vizcarra, Jaime Ontiveros, Danielle
Luskind, Orelie van Geenhoven, Samira Rostom, Imtiaz Ahmed, Ines Griffoux, Juan Lacayo,
Amanda Taylor, Reyna Gomez, Isabella Reinati, Medhavi Gupta, Cindy Torres.
Very sincere thanks to my favourite fellow TA, Daria Popugaeva. I enjoyed our 1050 courses
together. Also, I really appreciate your assistance at all time.
I also thank Ying Zhang and Pastor Solano for their technical support in the laboratory.
Helping me understand the different principles of a variety of analytical techniques.
I am grateful to my best friends in Mexico; Dr. Gamaliel Che, Helena Aranda, Dr. Omar
Castillo, Rocio Villalobos, Dr. Patricio Valadés and Monica Gonzalez. Their invaluable
friendship helped for the successful achievement of my PhD.
I would like to thank The National Council of Science and Technology in Mexico (CONACyT)
for the scholarship that permitted me to pursue my PhD abroad.
Lastly, and most importantly, this PhD thesis is dedicated to my beloved parents, Hector
Guayaquil Arias and Rosa Sosa Gomez, whose love, motivation and work example have been
key in my life. Likewise, this effort is committed to my brothers, Hector and Gustavo, who
have played an important role in my life.
vi
Table of Contents
Abstract ................................................................................................................................ i
Co-Authorship Statement................................................................................................... iii
Title of the paper: Photocatalytic hydrogen production using mesoporous TiO2 doped with
Pt. .................................................................................................................................. iii
Title of the Paper: Hydrogen Production via Water Dissociation Using Pt–TiO2
Photocatalysts: An Oxidation–Reduction Network. ..................................................... iv
Acknowledgments............................................................................................................... v
Table of Contents ............................................................................................................... vi
List of Tables ...................................................................................................................... x
List of Figures .................................................................................................................... xi
Nomenclature ................................................................................................................... xxi
Chapter 1 ............................................................................................................................. 1
1.1 General Objectives .................................................................................................. 4
1.2 References ............................................................................................................... 5
Chapter 2 ............................................................................................................................. 7
2 Literature Review ........................................................................................................... 7
2.1 Hydrogen from the Dissociation of Water .............................................................. 8
2.1.1 Water Electrolysis ....................................................................................... 8
2.1.2 Photobiological Production (bio-photolysis) .............................................. 8
2.1.3 Decomposition of Water at High Temperatures ......................................... 9
2.1.4 Thermo-chemical Process ........................................................................... 9
2.1.5 Photolysis .................................................................................................. 10
2.2 Hydrogen Production via Photocatalysis .............................................................. 10
2.2.1 Photoreactor Configurations ..................................................................... 15
2.2.2 Photo-CREC Water Reactor II.................................................................. 18
2.2.3 Photocatalyst Selection for Hydrogen Production .................................... 20
vii
2.2.4 Mesoporous Titanium Dioxide (TiO2) Semiconductor ............................. 22
2.2.5 Band Gap Energy ...................................................................................... 25
2.2.6 Porosity and Porous Materials .................................................................. 28
2.2.7 Mesoporous Nanostructured TiO2 ............................................................ 30
2.3 Block co-polymers, Pluronic P123 and Pluronic F127 ......................................... 38
2.4 Quantum Efficiency .............................................................................................. 40
2.4.1 Maximum Expected Quantum Yields ....................................................... 43
2.4.2 Quantum Efficiencies and Quantum Yields (QY) .................................... 46
2.5 Previous Works in the Reactor Photo-CREC Water II ......................................... 47
2.6 Scope of thesis ...................................................................................................... 48
2.7 References ............................................................................................................. 49
Chapter 3 ........................................................................................................................... 67
3 Synthesis of Mesoporous Pt Doped TiO2 with Block Co-polymers Pluronic P123 and
Pluronic F127 as Templates for Photocatalytic Hydrogen Generation. ....................... 67
3.1 Introduction ........................................................................................................... 67
3.2 Experimental ......................................................................................................... 69
3.3 Characterization .................................................................................................... 69
3.3.1 N2 Adsorption-Desorption Isotherms ....................................................... 70
3.3.2 XRD Diffractograms ................................................................................. 76
3.3.3 Scanning Electron Microscopy (SEM) ..................................................... 81
3.4 Photocatalytic Hydrogen Production via Water Dissociation using Mesoporous
TiO2 ....................................................................................................................... 85
3.5 Conclusions ........................................................................................................... 92
3.6 References ............................................................................................................. 93
Chapter 4 ........................................................................................................................... 94
4 Photocatalytic Hydrogen Production Using Mesoporous TiO2 Doped with Pt ........... 94
4.1 Introduction ........................................................................................................... 94
viii
4.2 Photocatalyst Engineering .................................................................................... 96
4.3 Experimental Methods .......................................................................................... 96
4.3.1 Preparation of Mesoporous Titania Nanoparticles ................................... 96
4.3.2 Photocatalytic Performance ...................................................................... 97
4.3.3 Apparatus .................................................................................................. 98
4.4 Photocatalyst Characterization .............................................................................. 99
4.4.1 XRD diffractograms.................................................................................. 99
4.4.2 N2 adsorption-desorption isotherms of mesoporous TiO2 ...................... 101
4.4.3 X-ray photoelectron spectroscopy (XPS) ............................................... 104
4.4.4 Band gap ................................................................................................. 105
4.4.5 Scanning electron microscopy (SEM) .................................................... 112
4.5 Hydrogen Production via Water Splitting........................................................... 113
4.6 Quantum Yields (QYs) ....................................................................................... 114
4.7 Conclusions ......................................................................................................... 115
4.8 References ........................................................................................................... 116
Chapter 5 ......................................................................................................................... 122
5 Hydrogen Production via Water Dissociation Using Pt–TiO2 Photocatalysts: An
Oxidation–Reduction Network .................................................................................. 122
5.1 Introduction ......................................................................................................... 122
5.2 Quantum Efficiencies.......................................................................................... 123
5.3 Experimental Methods ........................................................................................ 124
5.3.1 Photocatalyst Preparation of Pt/TiO2 ...................................................... 125
5.4 Photocatalytic Reactor ........................................................................................ 126
5.5 Analytical Methods ............................................................................................. 128
5.6 Photocatalyst Characterization ............................................................................ 128
5.7 Photocatalytic Reaction Mechanism for Hydrogen Production.......................... 136
ix
5.8 Hydrogen Formation with Ethanol Scavenger .................................................... 140
5.9 Quantum Yields for Different Semiconducting Materials .................................. 147
5.10 Conclusions ......................................................................................................... 149
5.11 References ........................................................................................................... 150
Chapter 6 ......................................................................................................................... 152
6 Conclusions and Recommendations .......................................................................... 152
6.1 Conclusions ......................................................................................................... 153
6.2 Future Work ........................................................................................................ 154
Appendices ...................................................................................................................... 155
Appendix A - Supplementary material of Chapter 3 ................................................. 155
Appendix B - Supplementary material of Chapter 4 .................................................. 165
Appendix C - Supplementary material of Chapter 4 .................................................. 166
Appendix D - Supplementary material of Chapter 4 and 5. ...................................... 169
Appendix E - Supplementary material of Chapter 4 and 5 ........................................ 170
Appendix F - Supplementary material of Chapter 4 and 5 ........................................ 172
Appendix G - Supplementary material of Chapter 5 ................................................. 173
Appendix H - Supplementary material of Chapter 5 ................................................. 175
Appendix I - Royal Society of Chemistry License for Chapter 2 .............................. 176
Curriculum Vitae ............................................................................................................ 180
x
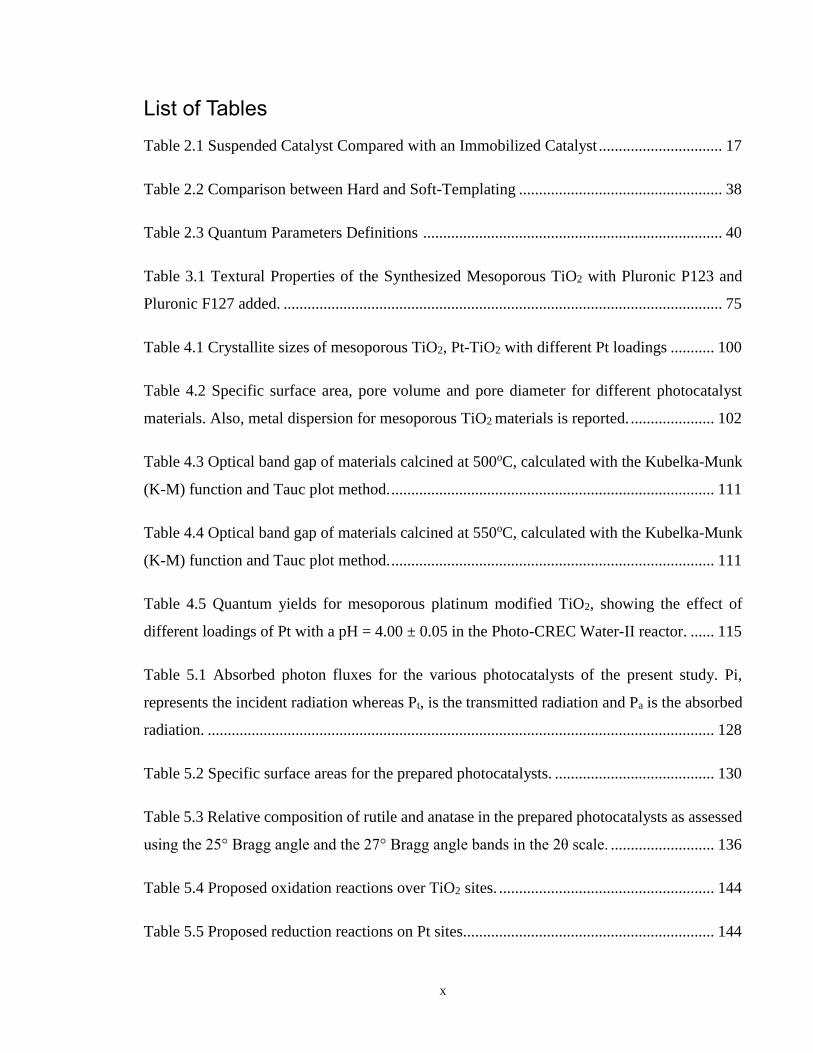
List of Tables
Table 2.1 Suspended Catalyst Compared with an Immobilized Catalyst ............................... 17
Table 2.2 Comparison between Hard and Soft-Templating ................................................... 38
Table 2.3 Quantum Parameters Definitions ........................................................................... 40
Table 3.1 Textural Properties of the Synthesized Mesoporous TiO2 with Pluronic P123 and
Pluronic F127 added. .............................................................................................................. 75
Table 4.1 Crystallite sizes of mesoporous TiO2, Pt-TiO2 with different Pt loadings ........... 100
Table 4.2 Specific surface area, pore volume and pore diameter for different photocatalyst
materials. Also, metal dispersion for mesoporous TiO2 materials is reported. ..................... 102
Table 4.3 Optical band gap of materials calcined at 500oC, calculated with the Kubelka-Munk
(K-M) function and Tauc plot method. ................................................................................. 111
Table 4.4 Optical band gap of materials calcined at 550oC, calculated with the Kubelka-Munk
(K-M) function and Tauc plot method. ................................................................................. 111
Table 4.5 Quantum yields for mesoporous platinum modified TiO2, showing the effect of
different loadings of Pt with a pH = 4.00 ± 0.05 in the Photo-CREC Water-II reactor. ...... 115
Table 5.1 Absorbed photon fluxes for the various photocatalysts of the present study. Pi,
represents the incident radiation whereas Pt, is the transmitted radiation and Pa is the absorbed
radiation. ............................................................................................................................... 128
Table 5.2 Specific surface areas for the prepared photocatalysts. ........................................ 130
Table 5.3 Relative composition of rutile and anatase in the prepared photocatalysts as assessed
using the 25° Bragg angle and the 27° Bragg angle bands in the 2θ scale. .......................... 136
Table 5.4 Proposed oxidation reactions over TiO2 sites. ...................................................... 144
Table 5.5 Proposed reduction reactions on Pt sites............................................................... 144
xi
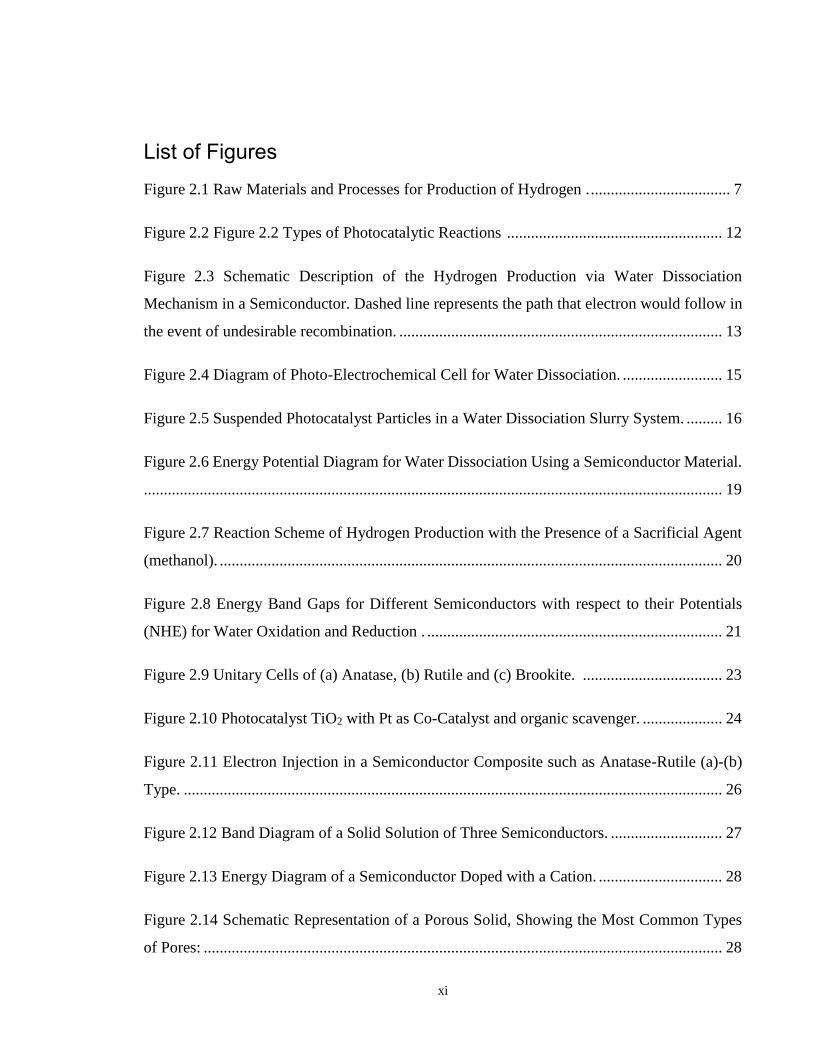
List of Figures
Figure 2.1 Raw Materials and Processes for Production of Hydrogen . ................................... 7
Figure 2.2 Figure 2.2 Types of Photocatalytic Reactions ...................................................... 12
Figure 2.3 Schematic Description of the Hydrogen Production via Water Dissociation
Mechanism in a Semiconductor. Dashed line represents the path that electron would follow in
the event of undesirable recombination. ................................................................................. 13
Figure 2.4 Diagram of Photo-Electrochemical Cell for Water Dissociation. ......................... 15
Figure 2.5 Suspended Photocatalyst Particles in a Water Dissociation Slurry System. ......... 16
Figure 2.6 Energy Potential Diagram for Water Dissociation Using a Semiconductor Material.
................................................................................................................................................. 19
Figure 2.7 Reaction Scheme of Hydrogen Production with the Presence of a Sacrificial Agent
(methanol). .............................................................................................................................. 20
Figure 2.8 Energy Band Gaps for Different Semiconductors with respect to their Potentials
(NHE) for Water Oxidation and Reduction . .......................................................................... 21
Figure 2.9 Unitary Cells of (a) Anatase, (b) Rutile and (c) Brookite. ................................... 23
Figure 2.10 Photocatalyst TiO2 with Pt as Co-Catalyst and organic scavenger. .................... 24
Figure 2.11 Electron Injection in a Semiconductor Composite such as Anatase-Rutile (a)-(b)
Type. ....................................................................................................................................... 26
Figure 2.12 Band Diagram of a Solid Solution of Three Semiconductors. ............................ 27
Figure 2.13 Energy Diagram of a Semiconductor Doped with a Cation. ............................... 28
Figure 2.14 Schematic Representation of a Porous Solid, Showing the Most Common Types
of Pores: .................................................................................................................................. 28
xii
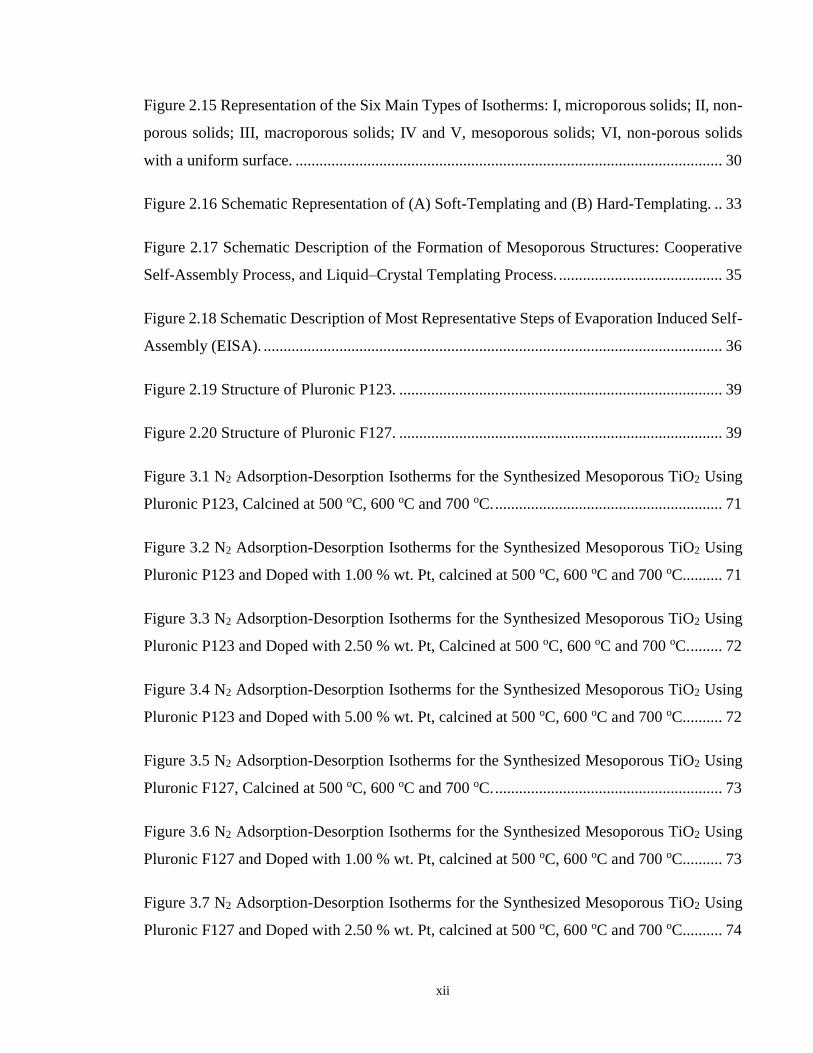
Figure 2.15 Representation of the Six Main Types of Isotherms: I, microporous solids; II, non-
porous solids; III, macroporous solids; IV and V, mesoporous solids; VI, non-porous solids
with a uniform surface. ........................................................................................................... 30
Figure 2.16 Schematic Representation of (A) Soft-Templating and (B) Hard-Templating. .. 33
Figure 2.17 Schematic Description of the Formation of Mesoporous Structures: Cooperative
Self-Assembly Process, and Liquid–Crystal Templating Process. ......................................... 35
Figure 2.18 Schematic Description of Most Representative Steps of Evaporation Induced Self-
Assembly (EISA). ................................................................................................................... 36
Figure 2.19 Structure of Pluronic P123. ................................................................................. 39
Figure 2.20 Structure of Pluronic F127. ................................................................................. 39
Figure 3.1 N2 Adsorption-Desorption Isotherms for the Synthesized Mesoporous TiO2 Using
Pluronic P123, Calcined at 500 oC, 600 oC and 700 oC. ......................................................... 71
Figure 3.2 N2 Adsorption-Desorption Isotherms for the Synthesized Mesoporous TiO2 Using
Pluronic P123 and Doped with 1.00 % wt. Pt, calcined at 500 oC, 600 oC and 700 oC.......... 71
Figure 3.3 N2 Adsorption-Desorption Isotherms for the Synthesized Mesoporous TiO2 Using
Pluronic P123 and Doped with 2.50 % wt. Pt, Calcined at 500 oC, 600 oC and 700 oC. ........ 72
Figure 3.4 N2 Adsorption-Desorption Isotherms for the Synthesized Mesoporous TiO2 Using
Pluronic P123 and Doped with 5.00 % wt. Pt, calcined at 500 oC, 600 oC and 700 oC.......... 72
Figure 3.5 N2 Adsorption-Desorption Isotherms for the Synthesized Mesoporous TiO2 Using
Pluronic F127, Calcined at 500 oC, 600 oC and 700 oC. ......................................................... 73
Figure 3.6 N2 Adsorption-Desorption Isotherms for the Synthesized Mesoporous TiO2 Using
Pluronic F127 and Doped with 1.00 % wt. Pt, calcined at 500 oC, 600 oC and 700 oC.......... 73
Figure 3.7 N2 Adsorption-Desorption Isotherms for the Synthesized Mesoporous TiO2 Using
Pluronic F127 and Doped with 2.50 % wt. Pt, calcined at 500 oC, 600 oC and 700 oC.......... 74
xiii
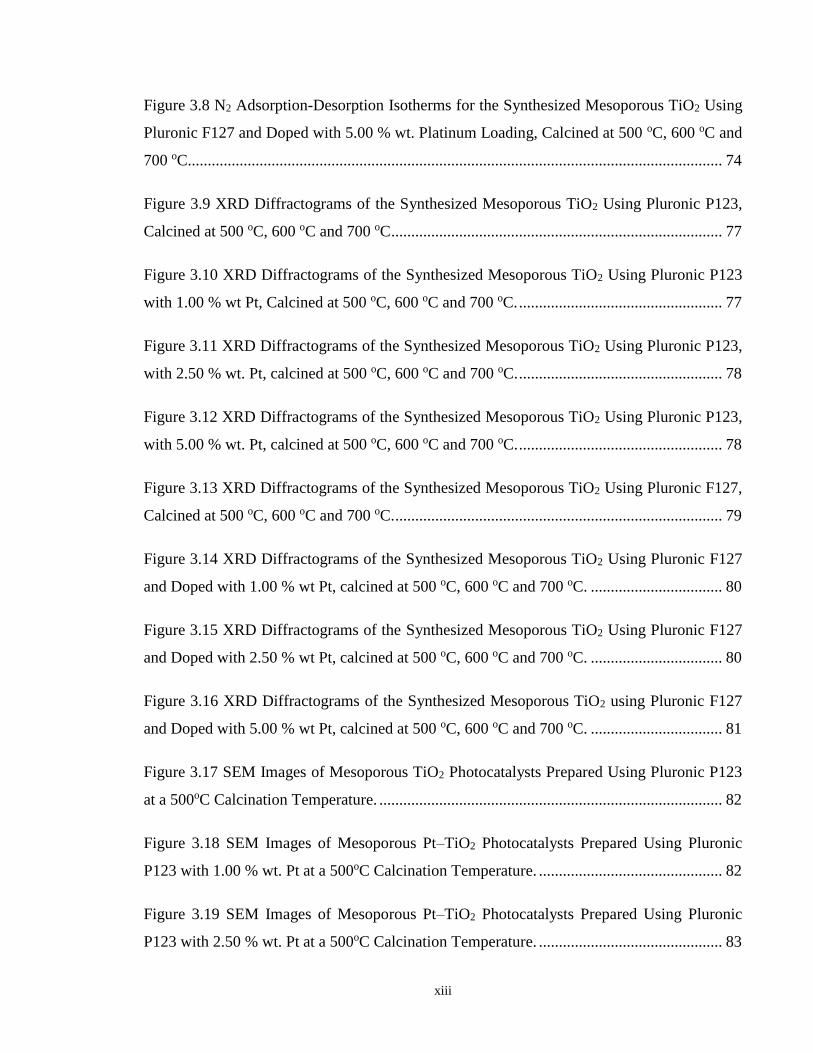
Figure 3.8 N2 Adsorption-Desorption Isotherms for the Synthesized Mesoporous TiO2 Using
Pluronic F127 and Doped with 5.00 % wt. Platinum Loading, Calcined at 500 oC, 600 oC and
700 oC...................................................................................................................................... 74
Figure 3.9 XRD Diffractograms of the Synthesized Mesoporous TiO2 Using Pluronic P123,
Calcined at 500 oC, 600 oC and 700 oC ................................................................................... 77
Figure 3.10 XRD Diffractograms of the Synthesized Mesoporous TiO2 Using Pluronic P123
with 1.00 % wt Pt, Calcined at 500 oC, 600 oC and 700 oC. ................................................... 77
Figure 3.11 XRD Diffractograms of the Synthesized Mesoporous TiO2 Using Pluronic P123,
with 2.50 % wt. Pt, calcined at 500 oC, 600 oC and 700 oC. ................................................... 78
Figure 3.12 XRD Diffractograms of the Synthesized Mesoporous TiO2 Using Pluronic P123,
with 5.00 % wt. Pt, calcined at 500 oC, 600 oC and 700 oC. ................................................... 78
Figure 3.13 XRD Diffractograms of the Synthesized Mesoporous TiO2 Using Pluronic F127,
Calcined at 500 oC, 600 oC and 700 oC. .................................................................................. 79
Figure 3.14 XRD Diffractograms of the Synthesized Mesoporous TiO2 Using Pluronic F127
and Doped with 1.00 % wt Pt, calcined at 500 oC, 600 oC and 700 oC. ................................. 80
Figure 3.15 XRD Diffractograms of the Synthesized Mesoporous TiO2 Using Pluronic F127
and Doped with 2.50 % wt Pt, calcined at 500 oC, 600 oC and 700 oC. ................................. 80
Figure 3.16 XRD Diffractograms of the Synthesized Mesoporous TiO2 using Pluronic F127
and Doped with 5.00 % wt Pt, calcined at 500 oC, 600 oC and 700 oC. ................................. 81
Figure 3.17 SEM Images of Mesoporous TiO2 Photocatalysts Prepared Using Pluronic P123
at a 500oC Calcination Temperature. ...................................................................................... 82
Figure 3.18 SEM Images of Mesoporous Pt–TiO2 Photocatalysts Prepared Using Pluronic
P123 with 1.00 % wt. Pt at a 500oC Calcination Temperature. .............................................. 82
Figure 3.19 SEM Images of Mesoporous Pt–TiO2 Photocatalysts Prepared Using Pluronic
P123 with 2.50 % wt. Pt at a 500oC Calcination Temperature. .............................................. 83
xiv
Figure 3.20 SEM Images of Mesoporous Pt–TiO2 Photocatalysts Prepared Using Pluronic
F127 at a 500oC Calcination Temperature. ............................................................................. 83
Figure 3.21 SEM Images of Mesoporous Pt–TiO2 Photocatalysts Prepared Using Pluronic
F127 with 1.00 % wt. Pt at a 500oC Calcination Temperature. .............................................. 84
Figure 3.22 SEM Images of Mesoporous Pt–TiO2 Photocatalysts Prepared Using Pluronic
F127 with 2.50 % wt. Platinum Loading at a 500oC Calcination Temperature. .................... 84
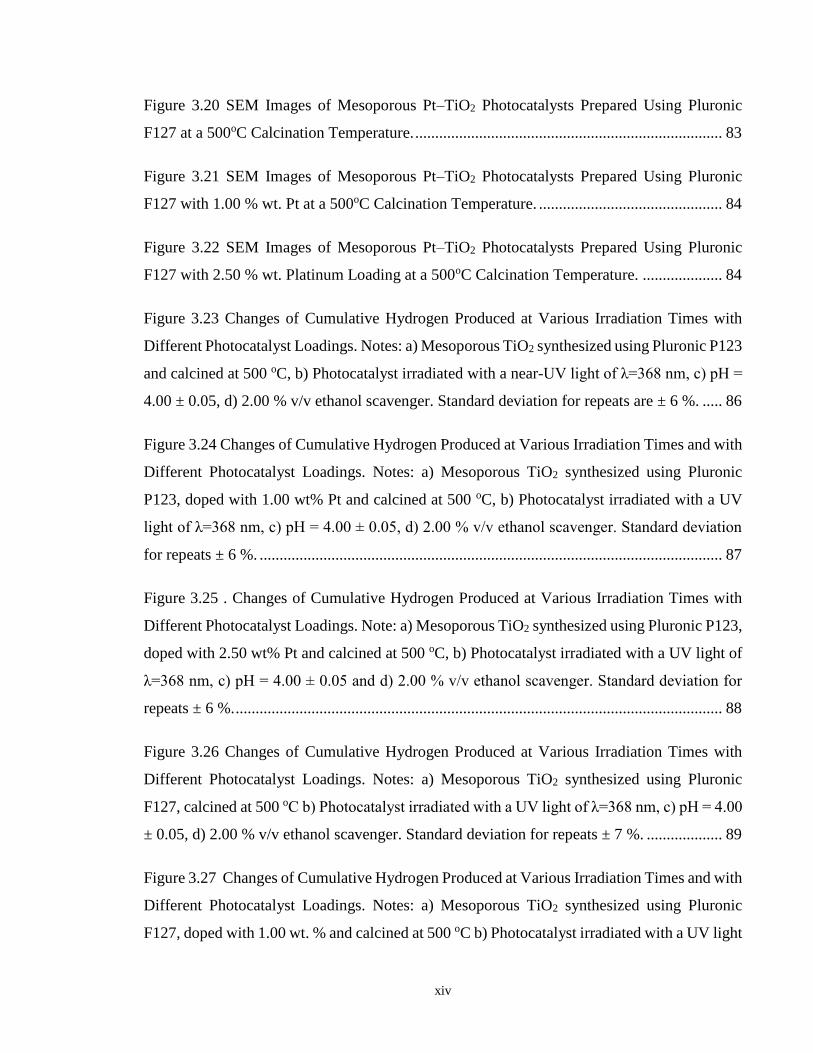
Figure 3.23 Changes of Cumulative Hydrogen Produced at Various Irradiation Times with
Different Photocatalyst Loadings. Notes: a) Mesoporous TiO2 synthesized using Pluronic P123
and calcined at 500 oC, b) Photocatalyst irradiated with a near-UV light of λ=368 nm, c) pH =
4.00 ± 0.05, d) 2.00 % v/v ethanol scavenger. Standard deviation for repeats are ± 6 %. ..... 86
Figure 3.24 Changes of Cumulative Hydrogen Produced at Various Irradiation Times and with
Different Photocatalyst Loadings. Notes: a) Mesoporous TiO2 synthesized using Pluronic
P123, doped with 1.00 wt% Pt and calcined at 500 oC, b) Photocatalyst irradiated with a UV
light of λ=368 nm, c) pH = 4.00 ± 0.05, d) 2.00 % v/v ethanol scavenger. Standard deviation
for repeats ± 6 %. .................................................................................................................... 87
Figure 3.25 . Changes of Cumulative Hydrogen Produced at Various Irradiation Times with
Different Photocatalyst Loadings. Note: a) Mesoporous TiO2 synthesized using Pluronic P123,
doped with 2.50 wt% Pt and calcined at 500 oC, b) Photocatalyst irradiated with a UV light of
λ=368 nm, c) pH = 4.00 ± 0.05 and d) 2.00 % v/v ethanol scavenger. Standard deviation for
repeats ± 6 %. .......................................................................................................................... 88
Figure 3.26 Changes of Cumulative Hydrogen Produced at Various Irradiation Times with
Different Photocatalyst Loadings. Notes: a) Mesoporous TiO2 synthesized using Pluronic
F127, calcined at 500 oC b) Photocatalyst irradiated with a UV light of λ=368 nm, c) pH = 4.00
± 0.05, d) 2.00 % v/v ethanol scavenger. Standard deviation for repeats ± 7 %. ................... 89
Figure 3.27 Changes of Cumulative Hydrogen Produced at Various Irradiation Times and with
Different Photocatalyst Loadings. Notes: a) Mesoporous TiO2 synthesized using Pluronic
F127, doped with 1.00 wt. % and calcined at 500 oC b) Photocatalyst irradiated with a UV light
xv
of λ=368 nm) pH = 4.00 ± 0.05 and d) 2.00 % v/v ethanol scavenger. Standard deviation for
repeats ± 7 %. .......................................................................................................................... 90
Figure 3.28 Changes of Cumulative Hydrogen Produced at Various Irradiation Times and with
Different Photocatalyst Loadings. Notes: a) Mesoporous TiO2 synthesized using Pluronic
F127, doped with 2.50 wt% Pt and calcined at 500oC, b) Photocatalyst irradiated with a UV
light of λ=368 nm, c) pH = 4.00 ± 0.05, d) 2.00 % v/v ethanol scavenger. Standard deviation
for repeats ± 7 %. .................................................................................................................... 91
Figure 4.1 Schematic diagram of the Photo-CREC-Water-II photoreactor with a H2 mixing
tank: (1) BLB lamp, (2) Pyrex glass tube, (3) UV-opaque polyethylene cylinder, (4) fused-
silica windows, (5) centrifugal pump, (6) H2 storing/mixing tank, (7) gas sampling port, (8)
purging gas injector and (9) draining gas valve. ..................................................................... 98
Figure 4.2 XRD diffractograms of the photoactive materials for hydrogen production. XRD
diffractograms were overlapped for comparison. (Δ) represents TiO2 in the anatase phase and
(R) indicates TiO2 in the rutile phase. ..................................................................................... 99
Figure 4.3 N2 adsorption-desorption isotherm of mesoporous TiO2 semiconductor calcined at
550 oC.................................................................................................................................... 101
Figure 4.4 N2 adsorption-desorption isotherm of 1.00 wt. %-Pt / Degussa P25 heated at 450
oC........................................................................................................................................... 102
Figure 4.5 Barrett-Joyner-Halenda (BJH) pore size distribution plot of mesoporous TiO2
calcined at 550 oC. ................................................................................................................ 103
Figure 4.6 Barrett-Joyner-Halenda (BJH) pore size distribution plot of 1.00 wt. %-Pt-TiO2
Degussa P25 semiconductor heated at 450 oC. ..................................................................... 104
Figure 4.7 X-ray photoelectron spectroscopy (XPS) of 1.00 wt. % Pt-mesoTiO2-550 oC. .. 105
Figure 4.8 UV-vis absorption spectra of the different semiconductor materials calcined at
500oC: a) Degussa P25, b) 1.00 wt. % Pt / Degussa P25-450oC, c) Meso-TiO2, d) 0.25 wt. %
Pt- Meso-TiO2, e) 0.75 wt. % Pt- Meso-TiO2, f) 1.00 wt. % Pt- Meso-TiO2 and g) 2.50 wt. %
Pt- Meso-TiO2. ...................................................................................................................... 106
xvi
Figure 4.9 UV-vis absorption spectra of the different semiconductor materials calcined at
550oC: a) Degussa P25, b) 1.00 wt. % Pt / Degussa P25-450oC, c) Meso-TiO2, d) 0.25 wt. %
Pt- Meso-TiO2, e) 0.75 wt. % Pt-Meso-TiO2 f) 1.00 wt. % Pt-Meso-TiO2 and g) 2.50 wt. % Pt-
Meso-TiO2............................................................................................................................. 107
Figure 4.10 Optical band gap calculation for Degussa P25 (DP25) using the Tauc plot method.
This plot was established using the UV-vis absorption spectra. ........................................... 108
Figure 4.11 Optical band gap calculation for Meso-TiO2-550oC using the Tauc plot. This plot
was established using the UV-vis absorption spectra. .......................................................... 109
Figure 4.12 Optical band gap determination for a 2.50 wt. % Pt-Meso-TiO2-550oC using the
Tauc Plot. This plot was established on the basis of the UV-vis absorption spectra. .......... 109
Figure 4.13 Effect of platinum loading on the optical band gap of semiconducting materials
calcined at 500 oC. ................................................................................................................ 110
Figure 4.14 Effect of platinum loading on the optical band gap of semiconducting materials
calcined at 550 oC. ................................................................................................................ 110
Figure 4.15 SEM images of mesoporous Pt–TiO2 photocatalysts prepared with different
platinum loading at 550oC calcination temperature. (a) 1.00 wt. % Pt-TiO2–Mesoporous; (b)
2.50 wt% Pt-TiO2–Mesoporous; (c) 5.00 wt. % Pt-TiO2–Mesoporous. ............................... 112
Figure 4.16 Hydrogen evolution for different semiconductor materials at pH = 4.00 ± 0.05 and
2 % v/v ethanol. Photocatalyst loading 1.00 g/l. Standard deviation for repeats ± 5 %. ...... 113
Figure 5.1 Schematic diagram of a TiO2 photocatalyst with added Pt. Pt sites are shown inside
and outside semiconductor particles. Inner sites are dominant electron reservoirs enhancing
hydrogen production. ............................................................................................................ 124
Figure 5.2 Schematic diagrams of the Photo-CREC Water II Reactor with a H2 mixing/storage
tank:....................................................................................................................................... 127
Figure 5.3 Adsorption–desorption isotherms for Pt-TiO2. Pt was added by wet impregnation.
............................................................................................................................................... 129
xvii
Figure 5.4 Adsorption–desorption of N2 on TiO2 with 1.70 wt. % Pt prepared via the sol-gel A
method................................................................................................................................... 130
Figure 5.5 Pore size distribution of the Pt–TiO2 prepared via incipient wetness impregnation;
(●) mesoporous TiO2 thermally treated at 550 °C (sol-gel B), (■) mesoporous TiO2 calcined at
450 °C (sol-gel A), (Δ) Degussa P25 impregnated with 1.00 wt. % Pt and calcined at 450 °C.
............................................................................................................................................... 131
Figure 5.6 Tauc Plots for sol-gel A based TiO2 photocatalysts calcined at 450 °C: (A) TiO2
sol-gel A; (B) TiO2 sol-gel A with 0.42 wt. % Pt; (C) TiO2 sol-gel A with 0.82 wt. % Pt; (D)
TiO2 sol-gel A with 1.70 wt. % Pt. ....................................................................................... 132
Figure 5.7 Influence of platinum loading on the band gap of the photocatalysts: (●) TiO2—
Mesoporous, thermally treated at 550 °C (sol-gel B) [8], (■) TiO2—Mesoporous, calcined 450
°C (sol-gel A), (Δ) Degussa P25 impregnated and calcined at 450 °C. ................................ 133
Figure 5.8 X-ray diffractogram for: (A) TiO2, Degussa P25; (B) wet impregnated with 1.70 wt.
% Pt on TiO2 Degussa P25; (C) incipiently impregnated with 1.00 wt. % Pt on TiO2 Degussa
P25. ....................................................................................................................................... 135
Figure 5.9 Cumulative hydrogen formation under an argon atmosphere for various
photocatalysts: (♦,◊) Pt–TiO2 prepared via incipient wetness impregnation with 1.70 wt. % and
0.82 wt. % of Pt loadings on TiO2 Degussa P25, (Δ) Degussa P25 and (+) Blank run [no
photocatalyst]. Photoreaction conditions: pH = 4.00 ± 0.05, 2.00% v/v ethanol, photocatalyst
loading: 0.15 g/L. Standard deviation for repeats was ±4.5%. ............................................. 137
Figure 5.10 Cumulative hydrogen formation under an argon atmosphere for various
photocatalysts using: (■) Pt–TiO2 prepared via sol-gel A with 1.70 wt. % of Pt loadings, (□)
TiO2 prepared via sol-gel A and (Δ) Degussa P25, (+) Blank run [no photo catalyst loaded].
Photoreaction conditions: pH = 4.00 ± 0.05, 2.00% v/v ethanol, photocatalyst loading: 0.15
g/L. Standard deviation for repeats was ±5%. ...................................................................... 138
Figure 5.11 Cumulative hydrogen formation under an argon atmosphere for various
photocatalysts using: (●) (●) (○) Pt–TiO2 prepared via sol-gel B with 2.50 wt. % and 1.00 wt.
% Pt, (Δ) Degussa P25, (+) Blank run [no photocatalyst]. Photoreaction conditions: pH = 4.00
xviii
± 0.05, 2.00% v/v ethanol, photocatalyst loading: 0.15 g/L. Standard deviation for repeats was
±5%. ...................................................................................................................................... 139
Figure 5.12 Oxidation–reduction network promoted by TiO2 and Pt sites in the Pt–TiO2
photocatalysts. ....................................................................................................................... 141
Figure 5.13 Methane increase with irradiation time for: (●) 2.50 wt. % Pt–TiO2 (sol-gel B), (■)
1.70 wt. % Pt–TiO2 (sol-gel A), (♦) 1.70 wt. % Pt–TiO2 (wetness impregnation) and (∆)
Degussa P25. Standard deviation for repeats is within ±7.5%. ............................................ 142
Figure 5.14 Ethane increase with irradiation time for: (●) 2.50 wt. % Pt–TiO2 (sol-gel B), (■)
1.70 wt. % Pt–TiO2 (sol-gel A), (♦) 1.70 wt. % Pt–TiO2 (wetness impregnation) and (∆)
Degussa P25. Standard deviation for repeats is within ±7%. ............................................... 143
Figure 5.15 Acetaldehyde increase with irradiation time: (●) 2.50 wt. % Pt–TiO2 (sol-gel B),
(■) 1.70 wt. % Pt–TiO2 (sol-gel A), (♦) 1.70 wt. % Pt–TiO2 (wetness impregnation) and (∆)
Degussa P25. Standard deviation for repeats was within ±6.5%. ......................................... 145
Figure 5.16 CO2 increase with irradiation time for: (●) 2.50 wt. % Pt–TiO2 (sol-gel B), (■)
1.70 wt. % Pt–TiO2 (sol-gel A), (♦) 1.70 wt. % Pt–TiO2 (wetness impregnation) and (∆)
Degussa P25. Standard deviation for repeats is within ±7.5%. ............................................ 146
Figure 5.17 Ethanol concentration changes with irradiation time for: (●) 2.50 wt % Pt–TiO2
(sol-gel B), (■) 1.70 wt. % Pt–TiO2 (sol-gel A), (♦) 1.70 wt. % Pt–TiO2 (wetness impregnation)
and (∆) Degussa P25. Notes: a) Initial ethanol concentration: 2.00% v/v or 0.345 mole/L. 147
Figure 5.18 Quantum yields at various irradiation times for: (●) 2.50 wt. % Pt–TiO2 (sol-gel
B), (■) 1.70 wt. % Pt–TiO2 (sol-gel A), (♦) 1.70 wt. % Pt–TiO2 (wetness impregnation) and
(∆) Degussa P25. Note: TiO2 (Degussa P25) is reported as a reference. .............................. 148
Figure A.0.1 Changes of Cumulative Hydrogen Produced at Various Irradiation Times with
Different Photocatalyst Loadings. Notes: a) Mesoporous TiO2 synthesized using Pluronic P123
and calcined at 600 oC, b) Photocatalyst irradiated with a near-UV light of λ=368 nm, c) pH
= 4.00 ± 0.05, d) 2.00 % v/v ethanol scavenger. Standard deviation for repeats are ± 5.5 %.
............................................................................................................................................... 155
xix
Figure A.0.2 Changes of Cumulative Hydrogen Produced at Various Irradiation Times and
with Different Photocatalyst Loadings. Notes: a) Mesoporous TiO2 synthesized using Pluronic
P123, doped with 1.00 wt% Pt and calcined at 600 oC, b) Photocatalyst irradiated with a UV
light of λ=368 nm, c) pH = 4.00 ± 0.05 , d) 2.00 % v/v ethanol scavenger. Standard deviation
for repeats ± 5.5 %. ............................................................................................................... 156
Figure A.0.3 . Changes of Cumulative Hydrogen Produced at Various Irradiation Times with
Different Photocatalyst Loadings. Note: a) Mesoporous TiO2 synthesized using Pluronic P123,
doped with 2.50 wt% Pt and calcined at 600 oC, b) Photocatalyst irradiated with a UV light of
λ=368 nm, c) pH = 4.00 ± 0.05 and d) 2.00 % v/v ethanol scavenger. Standard deviation for
repeats ± 5.5 %. ..................................................................................................................... 156
Figure A.0.4 Changes of Cumulative Hydrogen Produced at Various Irradiation Times with
Different Photocatalyst Loadings. Notes: a) Mesoporous TiO2 synthesized using Pluronic
F127, calcined at 600 oC b) Photocatalyst irradiated with a UV light of λ=368 nm, c) pH =
4.00 ± 0.05, d) 2.00 % v/v ethanol scavenger . Standard deviation for repeats ± 4.5 %. .... 157
Figure A.0.5 Changes of Cumulative Hydrogen Produced at Various Irradiation Times and
with Different Photocatalyst Loadings. Notes: a) Mesoporous TiO2 synthesized using Pluronic
F127, doped with 1.00 wt% and calcined at 600 oC b) Photocatalyst irradiated with a UV light
of λ=368 nm) pH = 4.00 ± 0.05 and d) 2.00 % v/v ethanol scavenger . Standard deviation for
repeats ± 4.5 %. ..................................................................................................................... 158
Figure A.0.6 Changes of Cumulative Hydrogen Produced at Various Irradiation Times and
with Different Photocatalyst Loadings. Notes: a) Mesoporous TiO2 synthesized using Pluronic
F127, doped with 2.50 wt% Pt and calcined at 500oC, b) Photocatalyst irradiated with a UV
light of λ=368 nm, c) pH = 4.00 ± 0.05, d) 2.00 % v/v ethanol scavenger . Standard deviation
for repeats ± 4.5 %. ............................................................................................................... 159
Figure A.0.7 Changes of Cumulative Hydrogen Produced at Various Irradiation Times with
Different Photocatalyst Loadings. Notes: a) Mesoporous TiO2 synthesized using Pluronic P123
and calcined at 700 oC, b) Photocatalyst irradiated with a near-UV light of λ=368 nm, c) pH
= 4.00 ± 0.05, d) 2.00 % v/v ethanol scavenger . Standard deviation for repeats are ± 7.5 %.
............................................................................................................................................... 160
xx
Figure A.0.8 Changes of Cumulative Hydrogen Produced at Various Irradiation Times and
with Different Photocatalyst Loadings. Notes: a) Mesoporous TiO2 synthesized using Pluronic
P123, doped with 1.00 wt% Pt and calcined at 700 oC, b) Photocatalyst irradiated with a UV
light of λ=368 nm, c) pH = 4.00 ± 0.05 , d) 2.00 % v/v ethanol scavenger. Standard deviation
for repeats ± 7.5 %. ............................................................................................................... 161
Figure A.0.9 . Changes of Cumulative Hydrogen Produced at Various Irradiation Times with
Different Photocatalyst Loadings. Note: a) Mesoporous TiO2 synthesized using Pluronic P123,
doped with 2.50 wt% Pt and calcined at 700 oC, b) Photocatalyst irradiated with a UV light of
λ=368 nm, c) pH = 4.00 ± 0.05 and d) 2.00 % v/v ethanol scavenger. Standard deviation for
repeats ± 7.5 %. ..................................................................................................................... 162
Figure A.0.10 Changes of Cumulative Hydrogen Produced at Various Irradiation Times with
Different Photocatalyst Loadings. Notes: a) Mesoporous TiO2 synthesized using Pluronic F127
, calcined at 700 oC b) Photocatalyst irradiated with a UV light of λ=368 nm, c) pH = 4.00 ±
0.05, d) 2.00 % v/v ethanol scavenger . Standard deviation for repeats ± 6.5 %. ............... 163
Figure A.0.11 Changes of Cumulative Hydrogen Produced at Various Irradiation Times and
with Different Photocatalyst Loadings. Notes: a) Mesoporous TiO2 synthesized using Pluronic
F127, doped with 1.00 wt% and calcined at 700 oC b) Photocatalyst irradiated with a UV light
of λ=368 nm) pH = 4.00 ± 0.05 and d) 2.00 % v/v ethanol scavenger . Standard deviation for
repeats ± 6.5 %. ..................................................................................................................... 163
Figure A.0.12 Changes of Cumulative Hydrogen Produced At Various Irradiation Times and
with Different Photocatalyst Loadings. Notes: a) Mesoporous TiO2 synthesized using Pluronic
F127, doped with 2.50 wt% Pt and calcined at 500oC, b) Photocatalyst irradiated with a UV
light of λ=368 nm, c) pH = 4.00 ± 0.05, d) 2.00 % v/v ethanol scavenger . Standard deviation
for repeats ± 6.5 %. ............................................................................................................... 164
xxi
Nomenclature
c speed of light (3.0 × 10⁸ m/s)
C Celsius
dp porous diameter (cm)
e− electron
h+ hole
h Planck’s constant (6.63 × 10⁻³⁴ J/s)
E energy of a photon at a given wavelength (J)
Eav average energy of a photon at a wavelength range, (J/mol photon).
Ebg energy band gap (eV)
eV electron volts
H2PtCl6 hexachloroplatinic acid
H● hydrogen radical
Pa rate of absorbed photons by semiconductor (photons/s)
Pbs rate of backscattered photons flying off the system (photons/s)
Pi rate of photons reaching the reactor inner surface (photons/s)
Pt rate of transmitted photons (photons/s)
Pt platinum
OH− hydroxide ions
●OH hydroxyl radical
t time (h)
xxii
TiO2 titanium dioxide
Vg volume of the gas phase in the storage tank (cm3)
W weight (g)
wt. % weight percent (% m/m)
Greek symbols
α absorbance (a.u.)
θ diffraction angle (°)
λ wavelength (nm)
ν frequency (1/s)
Acronyms
BJH Barrett–Joyner–Halenda model
BLB black light blue lamp
BET Brunauer–Emmett–Teller surface area method
CB conduction band
DP25 TiO2 Degussa P25
PCWII Photo CREC Water II Reactor
QY quantum yield
UV ultraviolet
VB balance band
xxiii
Subscripts
a absorbed photons by the photocatalyst
bg band gap
bs photons backscattered by the photocatalyst
g gas phase
i incident photons to the photocatalyst
t photons transmitted by the photocatalyst
max maximum
min minimum
1
Chapter 1
1. Introduction
Currently, fossil energy resources are being used extensively to meet most of the world’s
energy requirements. The projections of energy availability and use suggest that in the near
future, there will be major issues and challenges to be faced with energy supply and
demand. Additionally, the combustion of fossil fuels leads to atmospheric emissions of
carbon particles, CO2 as well as noxious gases such as NOx, SOx. Thus, environmentally
friendly fuels, that are both cost-effective and easily storable, are of great importance for
the world's sustainable development [1].
Hydrogen is an ideal candidate as an energy vector [2]. Several technologies can be used
to generate hydrogen. However, only a few of them can be considered as truly
environmentally friendly. Steam hydrocarbon reforming is the current dominant
technology for hydrogen production. It requires high temperatures (700–1100 °C) and
emits large amounts of CO2 [3]. Hence, efforts focused on water splitting are of great
potential significance. Water splitting using solar energy is one of the most attractive
approaches to produce hydrogen. Water splitting is an eco-friendly process that can be
operated at ambient temperature and pressure. This process can take advantage of sunlight;
an abundant and inexpensive renewable energy source [4,5,6]. This technology has the
potential of being of benefit to isolated communities in Canada. Hydrogen could be used
as an energy vector. Moreover, it could be used as chemical energy in Winter from the
solar energy collected during the Summer.
Alternatively, one could envision the use of current excess of electrical energy in Ontario
and Quebec [7-8], in photocatalytic technology for hydrogen production. The hydrogen
produced could be used in individual vehicles power-driven by fuel cells. As well, it could
be co-fed with other hydrocarbon feedstocks (i.e. methane) as a fuel, in power stations,
thus reducing CO2 emissions [9].
2
Since the discovery of photocatalytic reactions in 1972 by Honda and Fujishima [10],
numerous researchers have work aiming to identify the optimal conditions for degradation
of pollutants in water and air, as well as for hydrogen generation. This process takes into
account the water splitting as alternative to the energy concerns experienced currently.
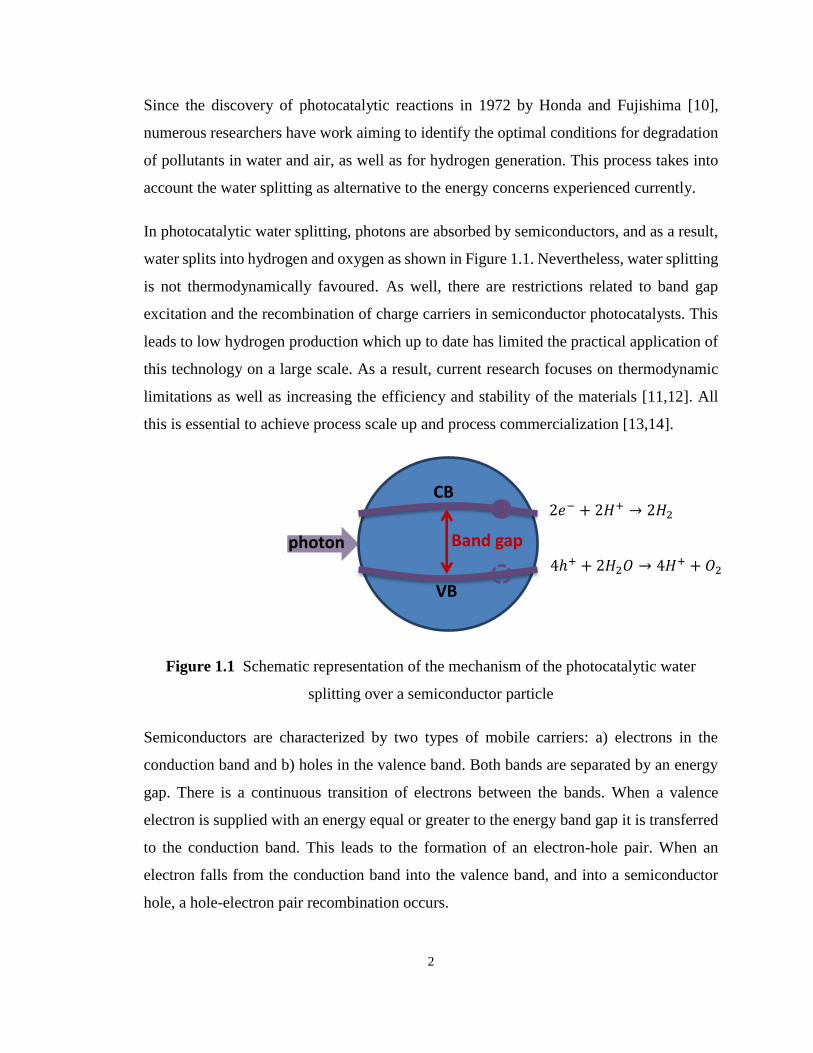
In photocatalytic water splitting, photons are absorbed by semiconductors, and as a result,
water splits into hydrogen and oxygen as shown in Figure 1.1. Nevertheless, water splitting
is not thermodynamically favoured. As well, there are restrictions related to band gap
excitation and the recombination of charge carriers in semiconductor photocatalysts. This
leads to low hydrogen production which up to date has limited the practical application of
this technology on a large scale. As a result, current research focuses on thermodynamic
limitations as well as increasing the efficiency and stability of the materials [11,12]. All
this is essential to achieve process scale up and process commercialization [13,14].
Figure 1.1 Schematic representation of the mechanism of the photocatalytic water
splitting over a semiconductor particle
Semiconductors are characterized by two types of mobile carriers: a) electrons in the
conduction band and b) holes in the valence band. Both bands are separated by an energy
gap. There is a continuous transition of electrons between the bands. When a valence
electron is supplied with an energy equal or greater to the energy band gap it is transferred
to the conduction band. This leads to the formation of an electron-hole pair. When an
electron falls from the conduction band into the valence band, and into a semiconductor
hole, a hole-electron pair recombination occurs.
VB
CB
Band gap Photon photon
2𝑒− + 2𝐻+ → 2𝐻2
4ℎ+ + 2𝐻2𝑂 → 4𝐻+ + 𝑂2
3
Among the various semiconductors, TiO2 has been extensively studied due to its
photosensitivity, low cost, low toxicity, and good chemical and thermal stability. There are
two main issues with TiO2. On one hand, TiO2 can be only be activated with near-
ultraviolet irradiation (near-UV) due to its wide band gap (3.20 eV for anatase and 3.00 eV
for rutile). This limits its application with solar energy, as near-UV light constitutes only
4-5% of sunlight. On the other hand, electron hole recombination reduces the photoelectric
conversion efficiency of TiO2. All these factors, limit the practical application of TiO2
as a viable semiconductor to be activated with solar light.
TiO2 can be modified with CdS, ZnO, PbS, Cu2O, Bi2S3, and CdSe, forming TiO2
composites. Theoretically, combining n-type TiO2 with p-type semiconductors is effective
in improving the photoelectric TiO2 conversion efficiency. Many of these modified
materials have received less attention since, under irradiation and in contact with
water, they can experience photocorrosion (e.g. Zn2+ or Cd2+ dissolution) [15]. A
reliable alternative to improve photoelectric conversion is the addition of noble metals
(e.g. Pt, Au, Ag and Pd) during the semiconductor synthesis. Noble metal addition favours
water splitting, given that: a) the surface plasmon resonance of noble metal particles can
be excited by near-UV and visible light, (b) the energy band gap is reduced, and c) the
noble metal nanoparticles act as electron traps. Regarding possible noble metals as co-
catalysts, Pt is a prime choice given its ability to trap photogenerated electrons. Interaction
of trapped electrons and H+, yields H• radicals, and molecular hydrogen.
In recent years, it has been shown quite extensively that the successful development of
semiconductors must be accompanied by a rigorous evaluation of photon utilization
efficiencies. This approach has been demonstrated extensively in several research studies
by CREC-UWO researchers with methodologies summarized in de Lasa et al [16,17]. It
is in this context, that it is considered of major importance to extend these methodologies
to the photocatalytic production of hydrogen with an evaluation of Quantum Yields.
4
1.1 General Objectives
The present study aims at advancing photocatalytic hydrogen generation via water
dissociation by developing novel semiconductor mesoporous materials using a new
synthesis method. It is envisioned that prepared semiconductors will be characterized in
terms of structural and physicochemical properties as well as photocatalytic activity. It is
anticipated that the high expected mesoporous TiO2 photocatalytic activity will be further
enhanced with highly dispersed noble metals, such as Pt. It is expected that the projected
high photoactivity of the prepared photocatalysts will be ranked by evaluating the QYs in
a CREC-Water II Reactor.
In this respect, the general objectives of this PhD dissertation can be divided into three
main sub-objectives:
a) The development and establishment of new preparation methods for photocatalytic
materials based on mesoporous TiO2 and using Pt as a co-catalyst. These new
semiconductors shall be based on a modified architecture where particle size,
particle size distribution, specific surface area, crystalline phases, composition and
light absorption are closely controlled.
b) The demonstration of the high performance of the developed semiconductors for
water dissociation to hydrogen under near-UV irradiation and using an
environmentally friendly scavenger. This demonstration shall involve a
photocatalytic reactor unit where Quantum Yields can be rigorously evaluated.
c) The elucidation of the oxidation-reduction reaction network for hydrogen
production involving ethanol as a scavenger, with the aim of establishing adequate
kinetic models suitable for photocatalytic reactor scale-up.
5
1.2 References
[1] Mao, S.; Shen, S. & Guo, L. Nanomaterials for renewable hydrogen production, storage
and utilization. Progress in Natural Science: Materials International. 2012, 22, 522-534.
[2] Jing, D.; Guo, L.; Zhao, L.; Zhang, X.; Liu, H.; Li, M.; Shen, S.; Liu, G. & Hu, X.
Efficient solar hydrogen production by photocatalytic water splitting: From
fundamental study to pilot demonstration. International Journal of Hydrogen Energy.
2010, 35, 7087-7087.
[3] Häussinger, P.; Lohmüller, R. & Watson, A. Hydrogen, 1. Properties and Occurence.
Ullmann's Encyclopedia of Industrial Chemistry. 2011.
[4] Navarro, Y.; Rufino M.; Álvarez-Galván, M.C.; Del Valle, F.; Villoria De La Mano,
J.A. & Fierro, J.L.G. Water Splitting on Semiconductor Catalysts under Visible-Light
Irradiation. ChemSusChem. 2009, 2, 471–85.
[5] Navarro, R.M.; Del Valle, F.; Villoria De La Mano, J.A.; Álvarez-Galván, M.C. &
Fierro, J.L.G. Photocatalytic Water Splitting Under Visible Light: Concept and
Catalysts Development. Photocatalytic Technologies. Advances in Chemical
Engineering. 2009, 36, 111–43
[6] Maeda, K.; Teramura, K.; Lu D.; Takata, T.; Inoue, S.; & Domen, K. Photocatalyst
releasing hydrogen from water. Nature. 2006, 440, 295–295.
[7] Taljan G., Canizares C., Fowler M., Verbic G. The Feasibility of Hydrogen Storage for
Mixed Wind-Nuclear Power Plants, Power Systems IEEE Transactions. 2018, 23,
1507-1518.
[8] Forsberg C. Future hydrogen markets for large-scale hydrogen production systems.
International Journal of Hydrogen Energy, 2007, 32 (4), 431-439.
6
[9] Prakash D., Meisen P. Hydrogen for Large-scale Electricity Generation in USA. Global
Energy Network Institute. 2011.
[10] Honda, K & Fujishima, A. Electrochemical Photolysis of Water at a Semiconductor
Electrode. Nature. 1972, 238, 37–38.
[11] Nakata, K. & Fujishima, A. TiO2 photocatalysis: Design and applications. Journal of
Photochemistry and Photobiology C: Photochemistry Reviews, 2012, 13, 169 –189.
[12] Nowotny J.; Sorrell, C.C.; Sheppard, L.R. & Bak, T. Solar-hydrogen: Environmentally
safe fuel for the future. International Journal of Hydrogen Energy, 2005, 30 ,521 –
544.
[13] Honda, K & Fujishima, A. Electrochemical Evidence for the Mechanism of the
Primary Stage of Photosynthesis. Bulletin of the Chemical Society of Japan. 1971, 44,
1148–1150.
[14] U.S. Department of Energy. Hydrogen production. Fuel cells and infrastructure
technologies program, 2009, 3,1-20.
[15] Wang Y., Wang Q., Zhan X., Wang F., Safdar M. and He J. Visible light driven type
II heterostructures and their enhanced photocatalysis properties: a review. Nanoscale,
2013, 5, 8326
[16] Ibrahim, H.; de Lasa, H. Photo-catalytic degradation of air borne pollutants. Apparent
quantum efficiencies in a novel photo-CREC-air reactor. Chem. Eng. Sci. 2003, 58,
943-949.
[17] de Lasa, H.; Serrano, B.; Salaices, M. Photocatalytic Reaction Engineering, First Ed.,
Springer: New York, 2005.
7
Chapter 2
2 Literature Review
Hydrogen can be produced through a wide variety of raw materials. These raw materials
include fossil sources, such as gas and coal, as well as renewable sources, such as biomass
and water, using renewable energy sources (sunlight, wind, hydraulic). A diversity of
technologies can be used, including chemical, biological, electrolytic, photolytic and
thermochemical processes.
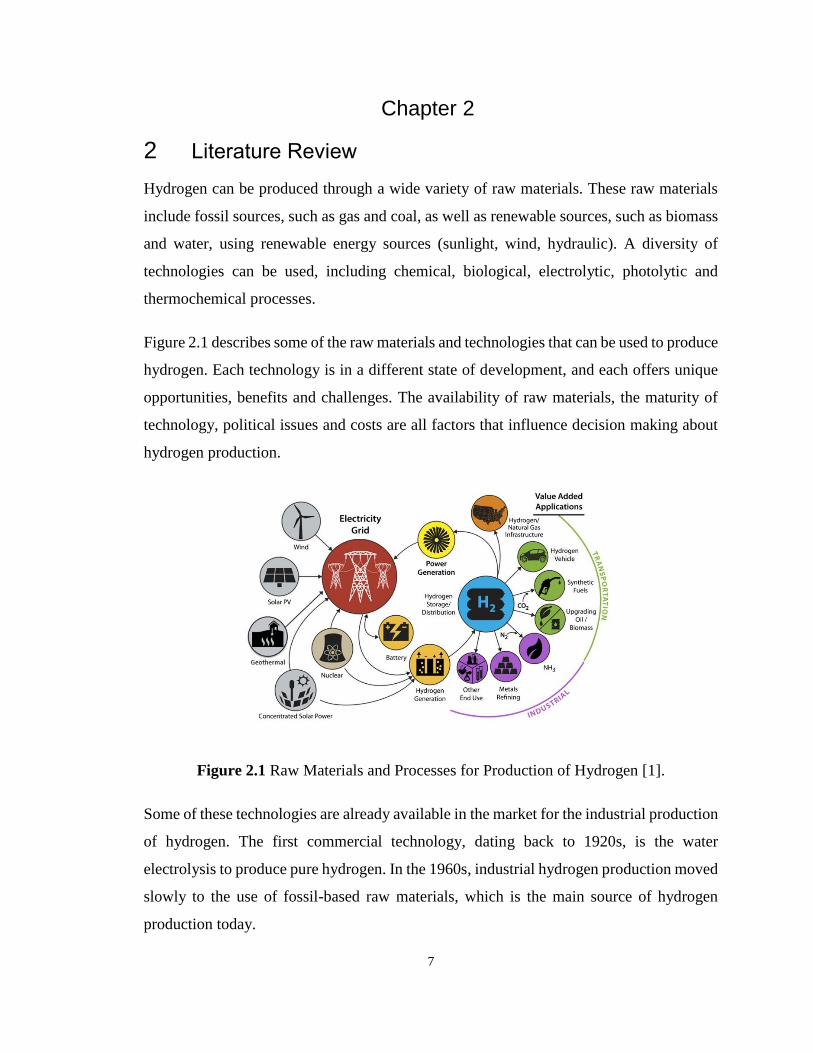
Figure 2.1 describes some of the raw materials and technologies that can be used to produce
hydrogen. Each technology is in a different state of development, and each offers unique
opportunities, benefits and challenges. The availability of raw materials, the maturity of
technology, political issues and costs are all factors that influence decision making about
hydrogen production.
Figure 2.1 Raw Materials and Processes for Production of Hydrogen [1].
Some of these technologies are already available in the market for the industrial production
of hydrogen. The first commercial technology, dating back to 1920s, is the water
electrolysis to produce pure hydrogen. In the 1960s, industrial hydrogen production moved
slowly to the use of fossil-based raw materials, which is the main source of hydrogen
production today.
8
Main technologies to produce hydrogen from water dissociation are discussed in the next
sections.
2.1 Hydrogen from the Dissociation of Water
Hydrogen can be generated from the dissociation of water through several processes. Some
of these methods are electrolysis, photo electrolysis, photobiological production and the
decomposition of water at high temperatures.
2.1.1 Water Electrolysis
Electrolysis is a process by which water is dissociated into hydrogen and oxygen through
the application of electrical energy, as shown in Equation 2.1. The total energy that is
needed for the electrolysis of water depends on the temperature. For example, at higher
temperatures the electrical energy decreases. Therefore, a process of electrolysis at high
temperatures is preferable when high temperatures are available as residual heat from
another process [2,3].
𝐻2𝑂 + 𝑒− ⟶ 𝐻2 +1
2𝑂2 (2.1)
Most of the electricity produced worldwide, is based on fossil energy sources. Currently,
researchers are actively searching for some type of renewable source that could supply
electricity to the electrolysers, and be environmentally friendly.
2.1.2 Photobiological Production (bio-photolysis)
The photobiological production of hydrogen is based on two steps: photosynthesis and
hydrogen production catalyzed by hydrogenase. For example, green algae and bacteria [2]
could be used. The overall process involves the following two reactions:
Photosynthesis:
2𝐻2𝑂 ⟶ 4𝐻+ + 4𝑒− + 𝑂2 (2.2)
Hydrogen production:
4𝐻+ + 4𝑒− ⟶ 2𝐻2 (2.3)
9
2.1.3 Decomposition of Water at High Temperatures
The dissociation of water at high temperatures is carried out at 300°C. At this temperature,
10% of the water is decomposed only, and the remaining 90% has to be recycled.
To reduce the process thermal load, other processes have been suggested for the
dissociation of water at high temperatures (up to 850° C), such as: a) thermochemical
cycles, b) hybrid systems coupling thermal decomposition and electrolytic decomposition,
c) thermo-physical cycles as well as d) water decomposition by chemical plasma. In these
kind of processes, efficiencies above 50% can be obtained, reducing the cost of hydrogen
production.
The main technical challenge for these types of high temperature processes is the
availability of materials that can resist corrosion at high temperatures, plus the development
of membranes, heat exchangers, and heat storage media. Design and safety aspects are also
very important [3].
2.1.4 Thermo-chemical Process
The dissociation of water by thermochemical processes leads to the conversion of water
into hydrogen and oxygen. This approach involves a series of thermochemical reactions.
An example of this type of process is the iodine/sulfur cycle, presented in equations (2.4-
2.7):
(@ 850𝑜𝐶): 𝐻2𝑆𝑂4 ⟶ 𝑆𝑂2 + 𝐻2𝑂 + 1
2𝑂2 (2.4)
(@120𝑜𝐶): 𝐼2 + 𝑆𝑂2 + 2𝐻2𝑂 ⟶ 𝐻2𝑆𝑂4 + 2𝐻𝐼 (2.5)
(@450𝑜𝐶): 2𝐻𝐼 ⟶ 𝐼2 + 𝐻2 (2.6)
𝑂𝑣𝑒𝑟𝑎𝑙𝑙 ∶ 𝐻2𝑂 ⟶ 𝐻2 +1
2𝑂2 (2.7)
For the implementation of thermochemical processes, research and development is still
required to establish the approaches avoiding secondary reactions and eliminating the use
10
of harmful substances. Corrosion problems associated with the handling of such chemicals
still require great attention [3,4].
2.1.5 Photolysis
Artificial photosynthesis is an alternative that involves capturing the energy available in
the environment from sunlight, and converting it into a valuable and strategic fuel such as
hydrogen. Artificial photocatalysis provides a way to mimic photosynthesis by using a
semiconductor material to absorb and utilize solar energy by converting it into chemical
species. As well, the dissociation of water using this type of process to produce hydrogen
is promising, clean, low cost and environmentally friendly. In the following sections,
important concepts for this work are presented [5-10].
2.2 Hydrogen Production via Photocatalysis
The interest in photocatalysis began in 1970, when this process was considered for the
water dissociation to produce hydrogen using solar and UV energy. Then in 1980, a new
potential application using water dissociation for environmental remediation was proposed
[11]. Since then, interest applications of this technology that have been proposed for water
purification, air purification, self-cleaning surfaces and the production of high energy
content molecules, such as hydrogen, among others [12].
Photocatalysis belongs to the general field of catalysis. By using photocatalysis, many
oxidation-reduction reactions with interesting applications can be obtained. These types of
oxidation-reduction reactions may be used for water purification and air treatments.
Photocatalysis can also be considered an advanced oxidation process, a technology which
has been studied thoroughly in recent decades.
Photocatalysis is defined as "the acceleration of a photoreaction in the presence of a catalyst
or its initiation under the action of light radiation (ultraviolet, visible or infrared) in the
presence of a semiconductor substance that absorbs light continuously with interactions
and regeneration of electrons / holes during the photochemical activation." (IUPAC).
Photocatalytic reactions can be either homogeneous or heterogeneous. Heterogeneous
11
photocatalysis is by far the most studied in recent years, given its potential application for
environmental and energy applications.
In homogeneous photocatalysis, reagents and photocatalysts are in the same phases.
Photochemical degradations found using hydrogen peroxide (H2O2/UV), ozone (O3/UV),
transition metal oxides and photo-Fenton reagents (Fe+ and Fe+/H2O2) [13] belong to this
group.
On the other hand, in heterogeneous photocatalysis, the photocatalyst is in a particulate
solid phase while the various pollutants to be converted are in either the gas phase or liquid
phase.
From classical heterogeneous catalysis, the overall process can be broken down into six
independent steps:
(a) Transfer of reagents from the fluid bulk to the catalyst surface.
(b) The adsorption of at least one of the reagents.
(c) The generation of electron / hole charge pair by absorbed photons.
(d) The reaction in the adsorbed phase.
(e) The desorption of the formed products.
(f) The removal of products from the catalyst-fluid interface region.
Photocatalytic reactions occur in the adsorbed phase (step (c)). The only difference with
conventional catalysis is the mode of activation of the catalyst in which thermal activation
is replaced by photonic activation [14].
In heterogeneous photocatalysis, the reaction also involves interfaces between the solid
photocatalyst (metal or semiconductor) and a fluid containing reactants and products.
Processes involving irradiation of these adsorbate-metal interfaces are generally included
in the branch of photochemistry. Therefore, the term "heterogeneous photocatalysis" is
mainly used in cases where a semiconductor catalyst absorbs light, and is in contact with
one gas phase or liquid phase.
12
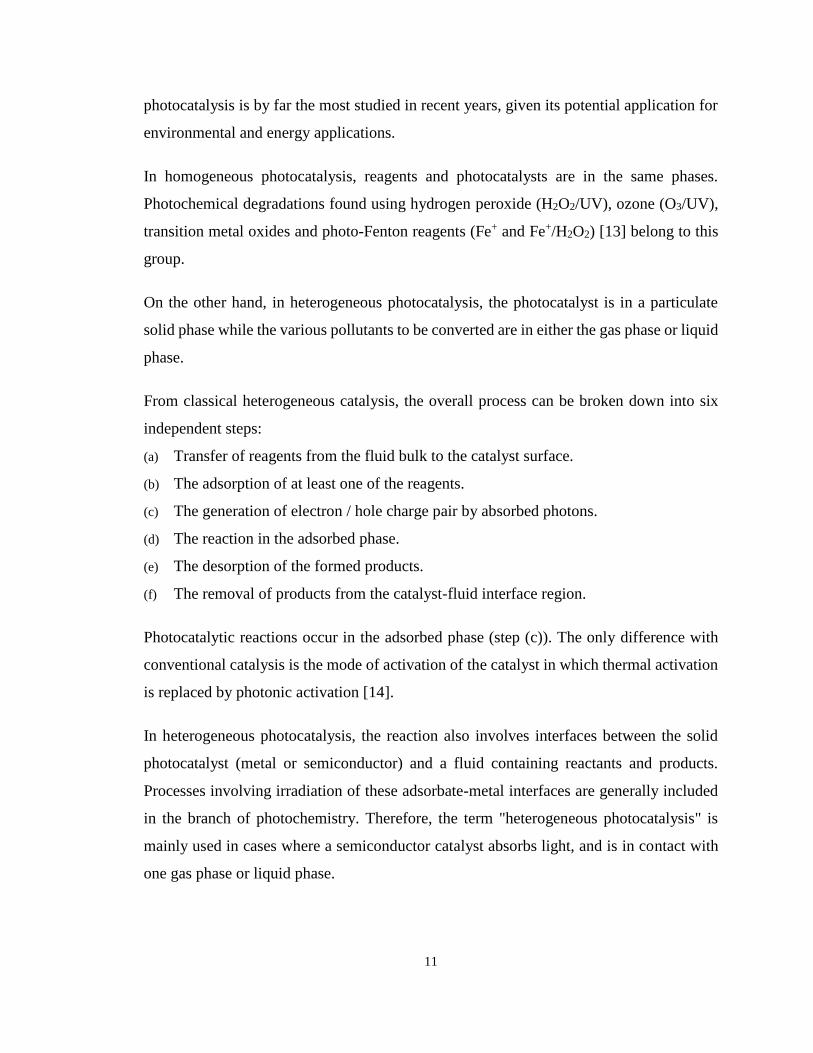
Photocatalytic reactions can be classified into two categories: a) "uphill (Δ𝐺𝑜 > 0) and b)
downhill (Δ𝐺𝑜 < 0) reactions", as shown in Figure 2.2.
Figure 2.2 Figure 2.2 Types of Photocatalytic Reactions [15].
One should notice that the degradation of organic pollutants such as photooxidation of
organic compounds using oxygen is generally a "downhill” ∆G reaction. Thus, the reaction
may proceed irreversibly. This type of induced photo-reactions has been extensively
studied using titanium dioxide.
On the other hand, water dissociation into H2 and O2 is accompanied by a large positive
change in the Gibbs Free Energy (Δ𝐺𝑜 = 273 kJ /mole). This is a reaction with an "uphill"
∆G. In this case, photon energy is converted into chemical energy, as it occurs in the
photosynthesis by green plants. It is for this reason, that water dissociation, is frequently
refereed to as artificial photosynthesis [16].
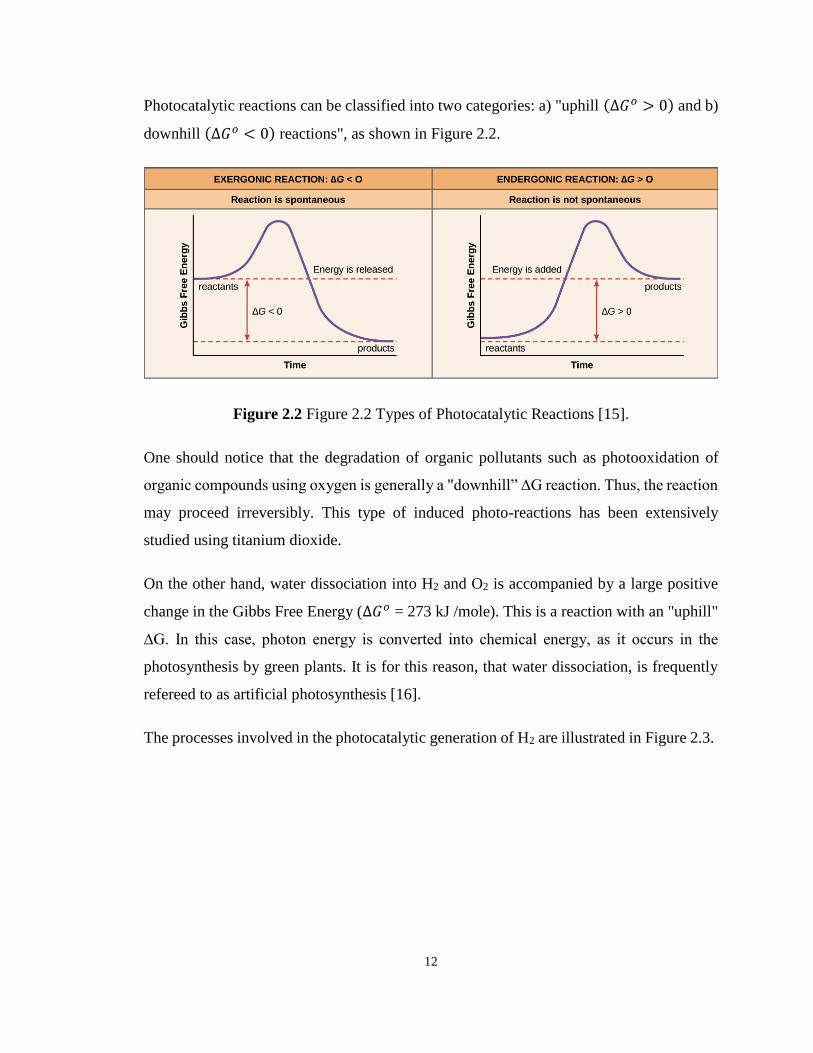
The processes involved in the photocatalytic generation of H2 are illustrated in Figure 2.3.
13
Figure 2.3 Schematic Description of the Hydrogen Production via Water Dissociation
Mechanism in a Semiconductor. Dashed line represents the path that electron would follow
in the event of undesirable recombination.
The semiconductor absorbs photons, with energy higher than its energy band gap (Ebg).
This generates a pair of electron charge carriers and vacancies, in the conduction band and
in the valence band respectively, as shown in Figure 2.3. After this initial step, the pair of
charges separate and migrate towards the surface. On the photocatalyst surface, the charge
carriers may reduce and oxidize adsorbed water molecules, producing hydrogen molecules
[17]. Competing with this, there is the undesirable and potential charge carrier
recombination, with energy being released as heat or photons [18].
Overall, the energy of the photons can be converted into chemical energy (hydrogen) via a
combined oxidation and reduction process as follows:
Oxidation:
4𝑂𝐻− + 4ℎ+ ⟶ 2𝐻2𝑂 + 𝑂2 (2.8)
Reduction
4𝐻+ + 4𝑒− ⟶ 2𝐻2 (2.9)
Overall reaction
2𝐻2𝑂 ⟶ 2𝐻2 + 𝑂2 (2.10)
14
Hence, the redox potential for both reduction and oxidation processes determine the
successful candidate semiconductor for water dissociation, with this being determined by
the difference between valence and conduction bands energy levels.
Regarding the electronic structure of a potential photocatalyst for H2 production, there are
two important requirements: (i) The band gap should be 1.24 eV < Eg < 3.26 eV, due to
the targeted wavelengths 1000 nm < λ < 380 nm. (ii) The band positions should be located
such as the bottom of the conduction band is more negative than the redox potential of
H+/H2 (0 V versus NHE at pH=0) and the valence band more positive than the redox
potential of the O2/H2O (1.23 V).
Thus, from a thermodynamic point of view, the water splitting reaction should be easily
achieved using a photoinduced catalytic process involving materials which satisfy the
above conditions. However, the overall photocatalytic water splitting reaction is an
endothermic reaction. This means that, to overcome such an energy barrier, photons of
higher energy are needed.
Within the great number of photoactive semiconductors proposed for water splitting and
photo-reforming reactions, TiO2 has until now been, the most promising. However, the
reported photonic efficiencies from solar to hydrogen by TiO2 photocatalytic water
splitting are still low. This is mainly due to the following reasons:
(a) The recombination of photo-generated electron/hole pairs: conduction band electrons
can recombine with valence band holes very quickly and release energy in the form of
unproductive heat or photons;
(b) A competitive fast backward reaction: As mentioned before, water cleavage into
hydrogen and oxygen is an energy unfavoured process. Thus, a backward reaction could
easily proceed and strongly compete with water splitting;
(c) The failure to absorb visible light photons: The band gap of TiO2 is about 3.2 eV and
only UV or near UV irradiation can be utilized for hydrogen production. Since the UV light
only accounts for about 4% of the solar radiation energy, the efficiency of the process
becomes necessarily low.
15
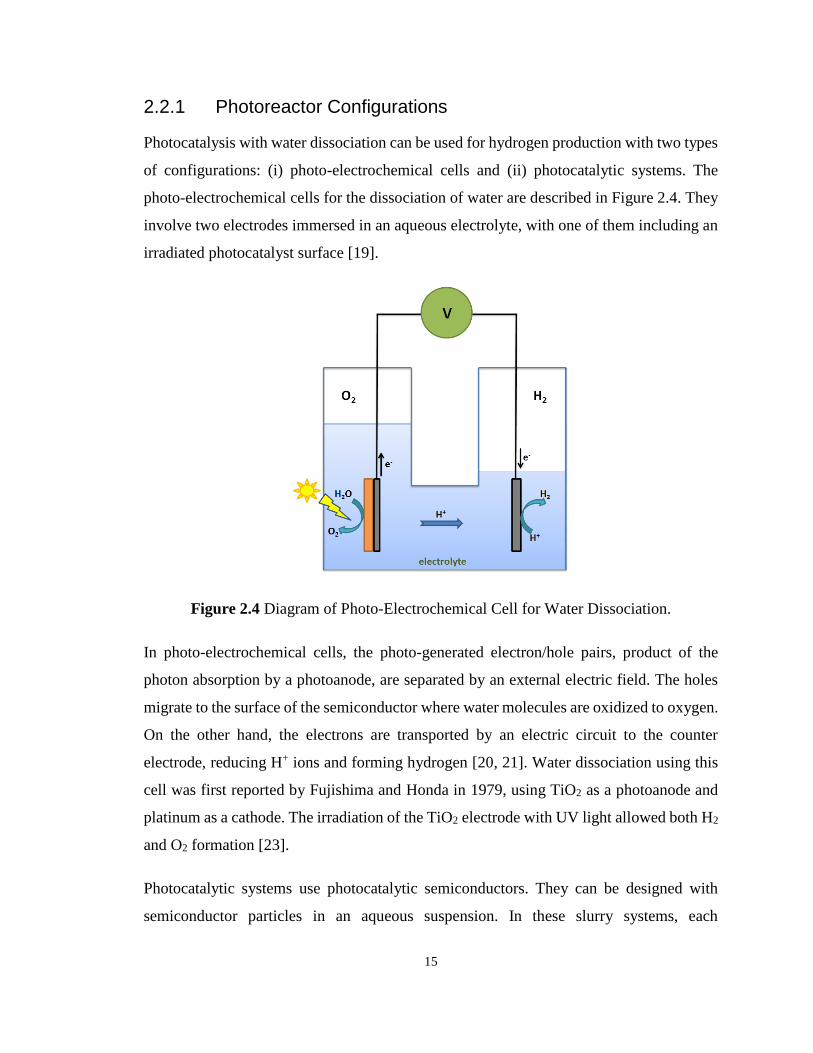
2.2.1 Photoreactor Configurations
Photocatalysis with water dissociation can be used for hydrogen production with two types
of configurations: (i) photo-electrochemical cells and (ii) photocatalytic systems. The
photo-electrochemical cells for the dissociation of water are described in Figure 2.4. They
involve two electrodes immersed in an aqueous electrolyte, with one of them including an
irradiated photocatalyst surface [19].
Figure 2.4 Diagram of Photo-Electrochemical Cell for Water Dissociation.
In photo-electrochemical cells, the photo-generated electron/hole pairs, product of the
photon absorption by a photoanode, are separated by an external electric field. The holes
migrate to the surface of the semiconductor where water molecules are oxidized to oxygen.
On the other hand, the electrons are transported by an electric circuit to the counter
electrode, reducing H+ ions and forming hydrogen [20, 21]. Water dissociation using this
cell was first reported by Fujishima and Honda in 1979, using TiO2 as a photoanode and
platinum as a cathode. The irradiation of the TiO2 electrode with UV light allowed both H2
and O2 formation [23].
Photocatalytic systems use photocatalytic semiconductors. They can be designed with
semiconductor particles in an aqueous suspension. In these slurry systems, each
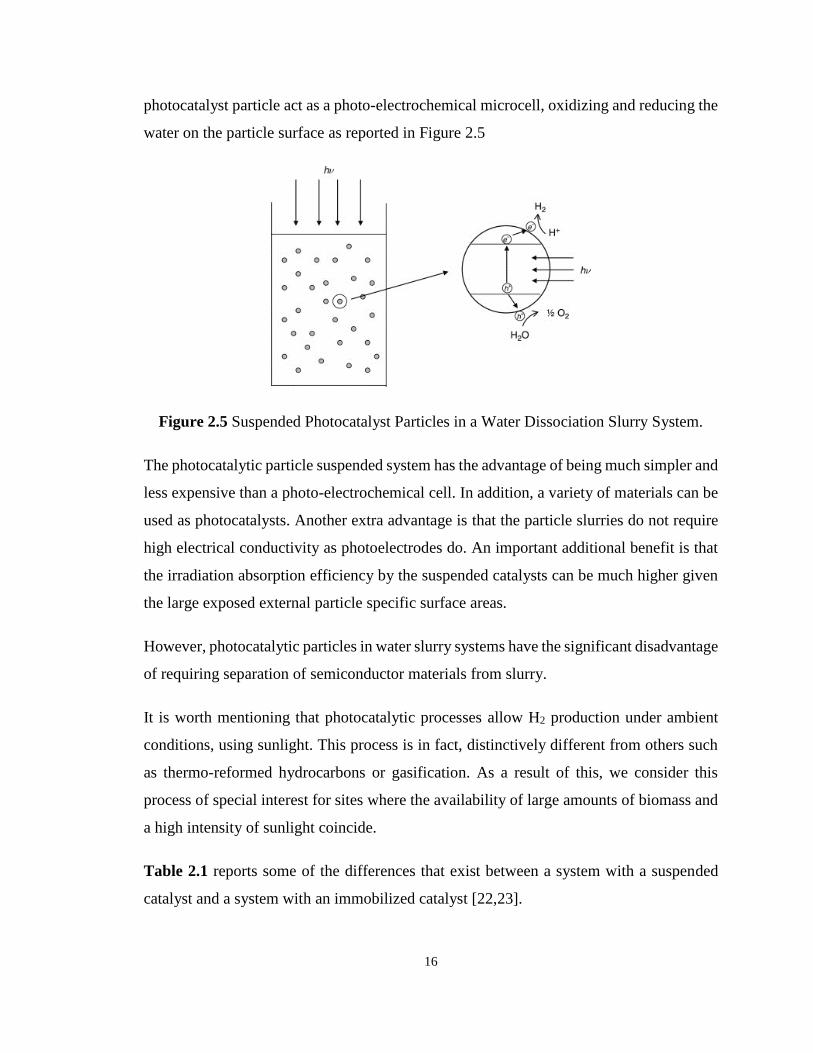
16
photocatalyst particle act as a photo-electrochemical microcell, oxidizing and reducing the
water on the particle surface as reported in Figure 2.5
Figure 2.5 Suspended Photocatalyst Particles in a Water Dissociation Slurry System.
The photocatalytic particle suspended system has the advantage of being much simpler and
less expensive than a photo-electrochemical cell. In addition, a variety of materials can be
used as photocatalysts. Another extra advantage is that the particle slurries do not require
high electrical conductivity as photoelectrodes do. An important additional benefit is that
the irradiation absorption efficiency by the suspended catalysts can be much higher given
the large exposed external particle specific surface areas.
However, photocatalytic particles in water slurry systems have the significant disadvantage
of requiring separation of semiconductor materials from slurry.
It is worth mentioning that photocatalytic processes allow H2 production under ambient
conditions, using sunlight. This process is in fact, distinctively different from others such
as thermo-reformed hydrocarbons or gasification. As a result of this, we consider this
process of special interest for sites where the availability of large amounts of biomass and
a high intensity of sunlight coincide.
Table 2.1 reports some of the differences that exist between a system with a suspended
catalyst and a system with an immobilized catalyst [22,23].
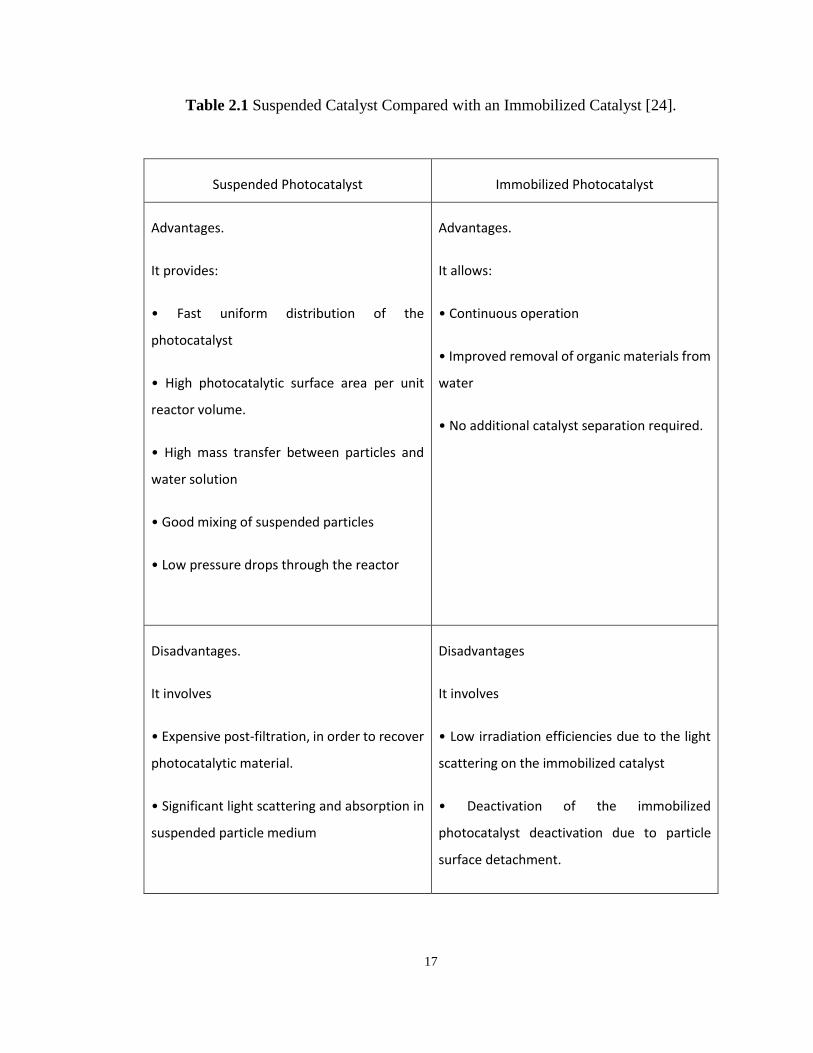
17
Table 2.1 Suspended Catalyst Compared with an Immobilized Catalyst [24].
Suspended Photocatalyst Immobilized Photocatalyst
Advantages.
It provides:
• Fast uniform distribution of the
photocatalyst
• High photocatalytic surface area per unit
reactor volume.
• High mass transfer between particles and
water solution
• Good mixing of suspended particles
• Low pressure drops through the reactor
Advantages.
It allows:
• Continuous operation
• Improved removal of organic materials from
water
• No additional catalyst separation required.
Disadvantages.
It involves
• Expensive post-filtration, in order to recover
photocatalytic material.
• Significant light scattering and absorption in
suspended particle medium
Disadvantages
It involves
• Low irradiation efficiencies due to the light
scattering on the immobilized catalyst
• Deactivation of the immobilized
photocatalyst deactivation due to particle
surface detachment.
18
2.2.2 Photo-CREC Water Reactor II
The development and design of a hydrogen production systems based on heterogeneous
photocatalysis is a research area of great importance. The configuration used to produce
hydrogen in this study is based on the suspension system of the catalyst in water, using the
Photo-CREC Water II Reactor.
Photo-CREC reactors were designed in early applications for the degradation of pollutants
in water/air using UV radiation, having suspended or immobilized photocatalysts [25,26].
Currently, this type of reactors is being considered to produce hydrogen [27, 28].
Regarding the Photo-CREC Water II Reactor, it consists of two concentric tubes. A UV
lamp is placed inside a second tube which is transparent. In this second tube, the
photocatalytic suspension flows freely. This type of reactor works in a batch mode with
high recirculation of water suspended particles. This unit is equipped with an airtight
storage and feeding tank, which is always kept in agitation. This allows the photocatalyst
to be well suspended and prevents the photocatalyst from settling. The hermetic tank of the
unit is equipped with sampling ports for both liquid and gas phase sampling.
2.2.3 Required Energy
The production of H2 through the dissociation of water is limited thermodynamically by
the Gibbs free energy needed (237 kJ / mol, 1.23 eV). It is therefore necessary, as shown
in Figure 2.6, that the semiconductor flat band potential exceeds the proton reduction
potential (0.0 eV against the normal hydrogen electrode, NHE). In addition, and to facilitate
the oxidation of water, the edge of the valence band must exceed the oxidation potential of
the water (+1.23 eV against the NHE).
In agreement with this and in order to carry out water dissociation, the theoretical required
energy gap necessary for a semiconductor is 1.23 eV [28].
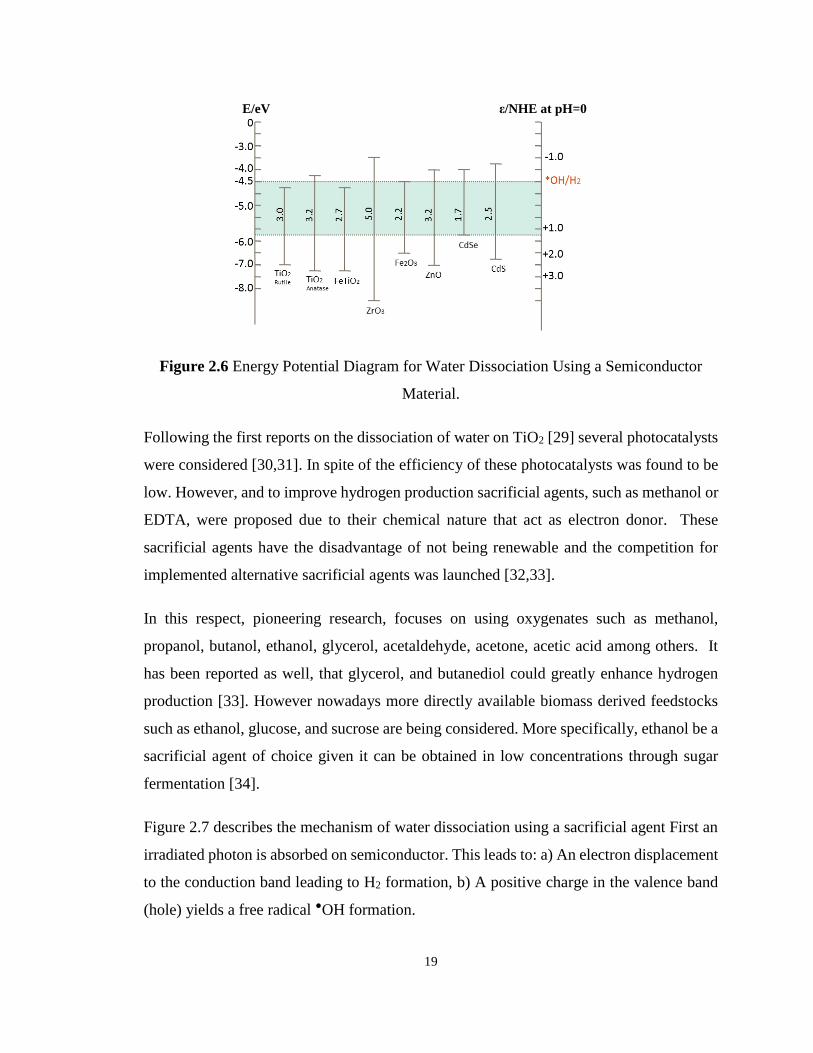
19
Figure 2.6 Energy Potential Diagram for Water Dissociation Using a Semiconductor
Material.
Following the first reports on the dissociation of water on TiO2 [29] several photocatalysts
were considered [30,31]. In spite of the efficiency of these photocatalysts was found to be
low. However, and to improve hydrogen production sacrificial agents, such as methanol or
EDTA, were proposed due to their chemical nature that act as electron donor. These
sacrificial agents have the disadvantage of not being renewable and the competition for
implemented alternative sacrificial agents was launched [32,33].
In this respect, pioneering research, focuses on using oxygenates such as methanol,
propanol, butanol, ethanol, glycerol, acetaldehyde, acetone, acetic acid among others. It
has been reported as well, that glycerol, and butanediol could greatly enhance hydrogen
production [33]. However nowadays more directly available biomass derived feedstocks
such as ethanol, glucose, and sucrose are being considered. More specifically, ethanol be a
sacrificial agent of choice given it can be obtained in low concentrations through sugar
fermentation [34].
Figure 2.7 describes the mechanism of water dissociation using a sacrificial agent First an
irradiated photon is absorbed on semiconductor. This leads to: a) An electron displacement
to the conduction band leading to H2 formation, b) A positive charge in the valence band
(hole) yields a free radical ●OH formation.
E/eV ε/NHE at pH=0
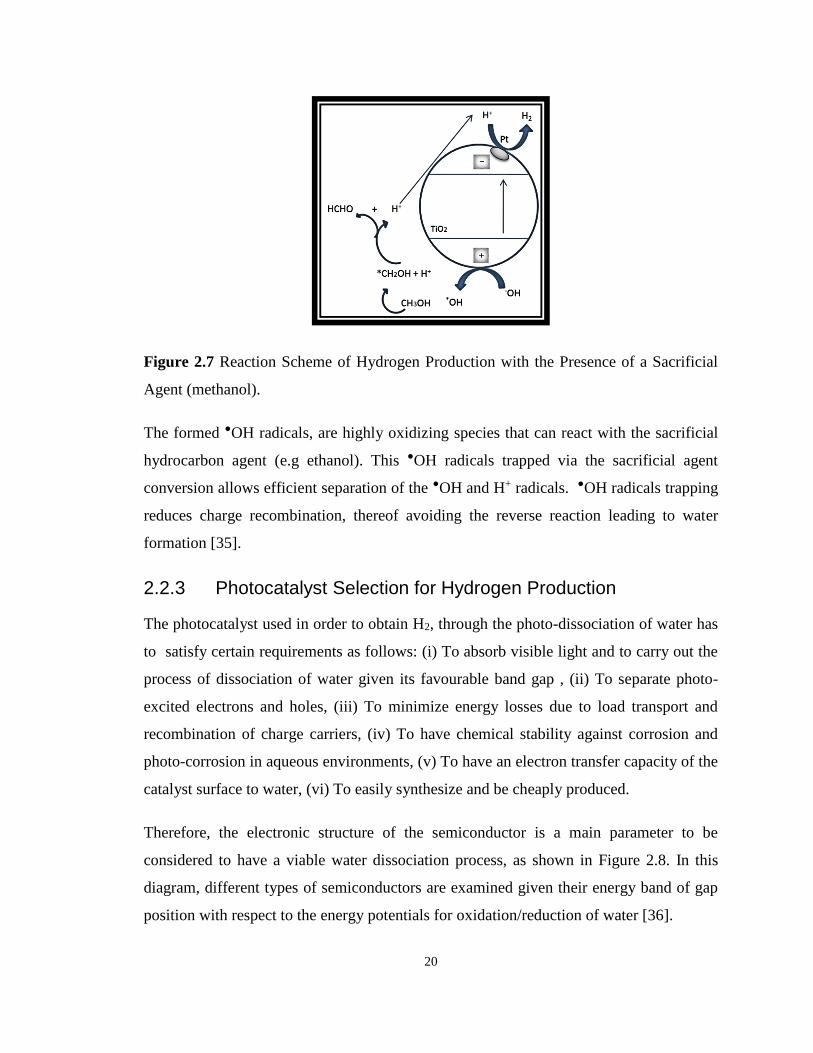
20
Figure 2.7 Reaction Scheme of Hydrogen Production with the Presence of a Sacrificial
Agent (methanol).
The formed ●OH radicals, are highly oxidizing species that can react with the sacrificial
hydrocarbon agent (e.g ethanol). This ●OH radicals trapped via the sacrificial agent
conversion allows efficient separation of the ●OH and H+ radicals. ●OH radicals trapping
reduces charge recombination, thereof avoiding the reverse reaction leading to water
formation [35].
2.2.3 Photocatalyst Selection for Hydrogen Production
The photocatalyst used in order to obtain H2, through the photo-dissociation of water has
to satisfy certain requirements as follows: (i) To absorb visible light and to carry out the
process of dissociation of water given its favourable band gap , (ii) To separate photo-
excited electrons and holes, (iii) To minimize energy losses due to load transport and
recombination of charge carriers, (iv) To have chemical stability against corrosion and
photo-corrosion in aqueous environments, (v) To have an electron transfer capacity of the
catalyst surface to water, (vi) To easily synthesize and be cheaply produced.
Therefore, the electronic structure of the semiconductor is a main parameter to be
considered to have a viable water dissociation process, as shown in Figure 2.8. In this
diagram, different types of semiconductors are examined given their energy band of gap
position with respect to the energy potentials for oxidation/reduction of water [36].
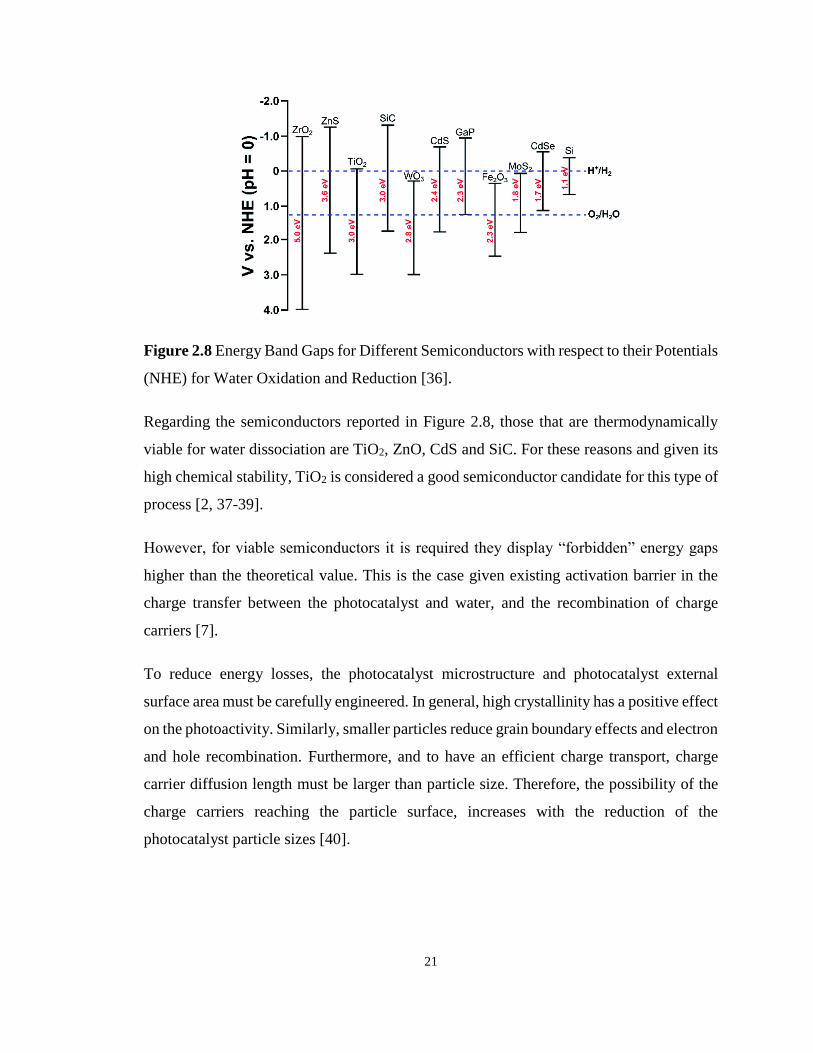
21
Figure 2.8 Energy Band Gaps for Different Semiconductors with respect to their Potentials
(NHE) for Water Oxidation and Reduction [36].
Regarding the semiconductors reported in Figure 2.8, those that are thermodynamically
viable for water dissociation are TiO2, ZnO, CdS and SiC. For these reasons and given its
high chemical stability, TiO2 is considered a good semiconductor candidate for this type of
process [2, 37-39].
However, for viable semiconductors it is required they display “forbidden” energy gaps
higher than the theoretical value. This is the case given existing activation barrier in the
charge transfer between the photocatalyst and water, and the recombination of charge
carriers [7].
To reduce energy losses, the photocatalyst microstructure and photocatalyst external
surface area must be carefully engineered. In general, high crystallinity has a positive effect
on the photoactivity. Similarly, smaller particles reduce grain boundary effects and electron
and hole recombination. Furthermore, and to have an efficient charge transport, charge
carrier diffusion length must be larger than particle size. Therefore, the possibility of the
charge carriers reaching the particle surface, increases with the reduction of the
photocatalyst particle sizes [40].
22
2.2.4 Mesoporous Titanium Dioxide (TiO2) Semiconductor
TiO2 is a promising material for technological applications given its versatility [41-44],
abundance, low toxicity, good chemical stability, photosensitivity as well as photo-stability
[45-48]. In nature, it is found principally in the mineral ilmenite [49], that can be processed
industrially by two different routes [50]; First stage, encompasses the reaction of the
concentrate of ilmenite with hot sulphuric acid, resulting in the formation of sulphates of
titanium, Fe(II) and Fe(III). The resultant solution is then purified and hydrolyzed to
produce pure TiO2 [51].
Another common method of manufacturing TiO2 involves in combining the mineral with
coke and gaseous chlorine under heating. This yields CO2 and a spongy material rich in
TiCl4. The reaction product is subjected to successive fractional distillation, with the
formation of TiCl2 and TiCl3. This is allowed given titanium species stability at various
oxidation states. Finally, these precursors of titanium are hydrolyzed, forming titanium
dioxide [52].
In 1972, Honda [5,23], achieved, for the first time, the successful decomposition of water
under irradiation with light and without the application of electricity. These authors
reported that when n-type TiO2 was used as an anode and platinum as cathode, the TiO2
electrode irradiated under short-circuit conditions, formed hydrogen at the platinum
electrode, while oxygen evolved from the anode. Since then, numerous studies aimed at
establishing TiO2 applications were recorded in the open literature [6-14].
TiO2 can be used in ultraviolet radiation absorbing filters [15, 53], in chemical sensors for
gases [16-18], as a bactericide [19], in biomaterials for bone implants [20], in
environmental photocatalysis [16, 21, 22, 54], in the photocatalytic hydrogen evolution [9,
55-60], and in dye-sensitized solar cells [13, 61-68].
The photocatalytic efficiency of TiO2 depends on its structural and morphological
characteristics, which are related to the method of synthesis used in the preparation of
nanoparticles [10, 13, 21, 36]. To be photoactive and to favour the photocatalysis process,
the TiO2 must possess a high specific surface area, good porosity, with big sized pores [59,
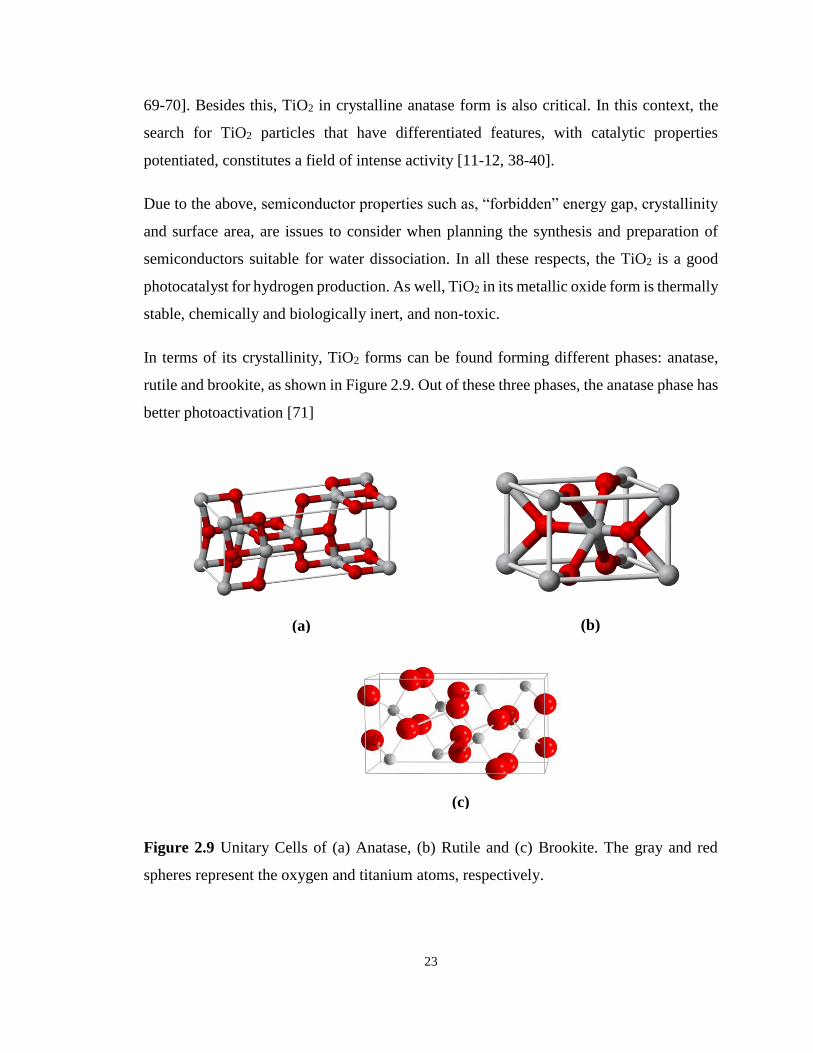
23
69-70]. Besides this, TiO2 in crystalline anatase form is also critical. In this context, the
search for TiO2 particles that have differentiated features, with catalytic properties
potentiated, constitutes a field of intense activity [11-12, 38-40].
Due to the above, semiconductor properties such as, “forbidden” energy gap, crystallinity
and surface area, are issues to consider when planning the synthesis and preparation of
semiconductors suitable for water dissociation. In all these respects, the TiO2 is a good
photocatalyst for hydrogen production. As well, TiO2 in its metallic oxide form is thermally
stable, chemically and biologically inert, and non-toxic.
In terms of its crystallinity, TiO2 forms can be found forming different phases: anatase,
rutile and brookite, as shown in Figure 2.9. Out of these three phases, the anatase phase has
better photoactivation [71]
Figure 2.9 Unitary Cells of (a) Anatase, (b) Rutile and (c) Brookite. The gray and red
spheres represent the oxygen and titanium atoms, respectively.
(b) (a)
(c)
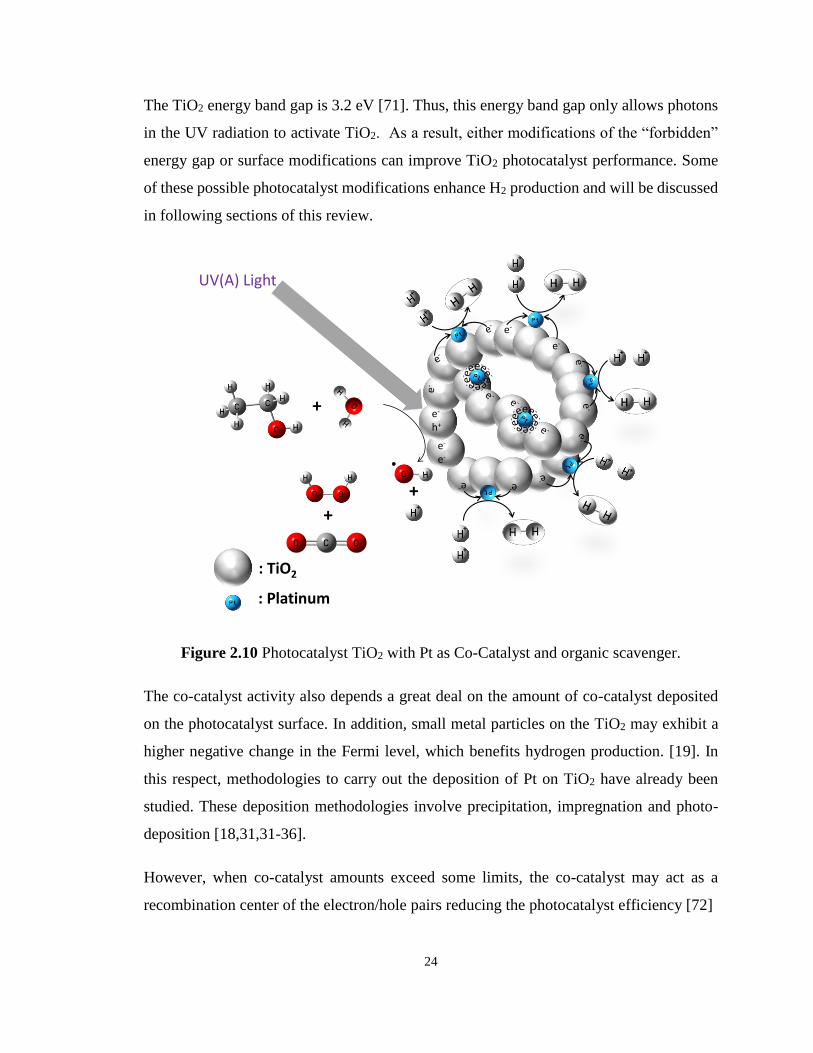
24
The TiO2 energy band gap is 3.2 eV [71]. Thus, this energy band gap only allows photons
in the UV radiation to activate TiO2. As a result, either modifications of the “forbidden”
energy gap or surface modifications can improve TiO2 photocatalyst performance. Some
of these possible photocatalyst modifications enhance H2 production and will be discussed
in following sections of this review.
Figure 2.10 Photocatalyst TiO2 with Pt as Co-Catalyst and organic scavenger.
The co-catalyst activity also depends a great deal on the amount of co-catalyst deposited
on the photocatalyst surface. In addition, small metal particles on the TiO2 may exhibit a
higher negative change in the Fermi level, which benefits hydrogen production. [19]. In
this respect, methodologies to carry out the deposition of Pt on TiO2 have already been
studied. These deposition methodologies involve precipitation, impregnation and photo-
deposition [18,31,31-36].
However, when co-catalyst amounts exceed some limits, the co-catalyst may act as a
recombination center of the electron/hole pairs reducing the photocatalyst efficiency [72]
+
+
+
⦁
+
e-
e-
e-
h+
e-
e-
e-
+
+ +
e-
+
1
UV(A) Light
+
: TiO2
: Platinum
+
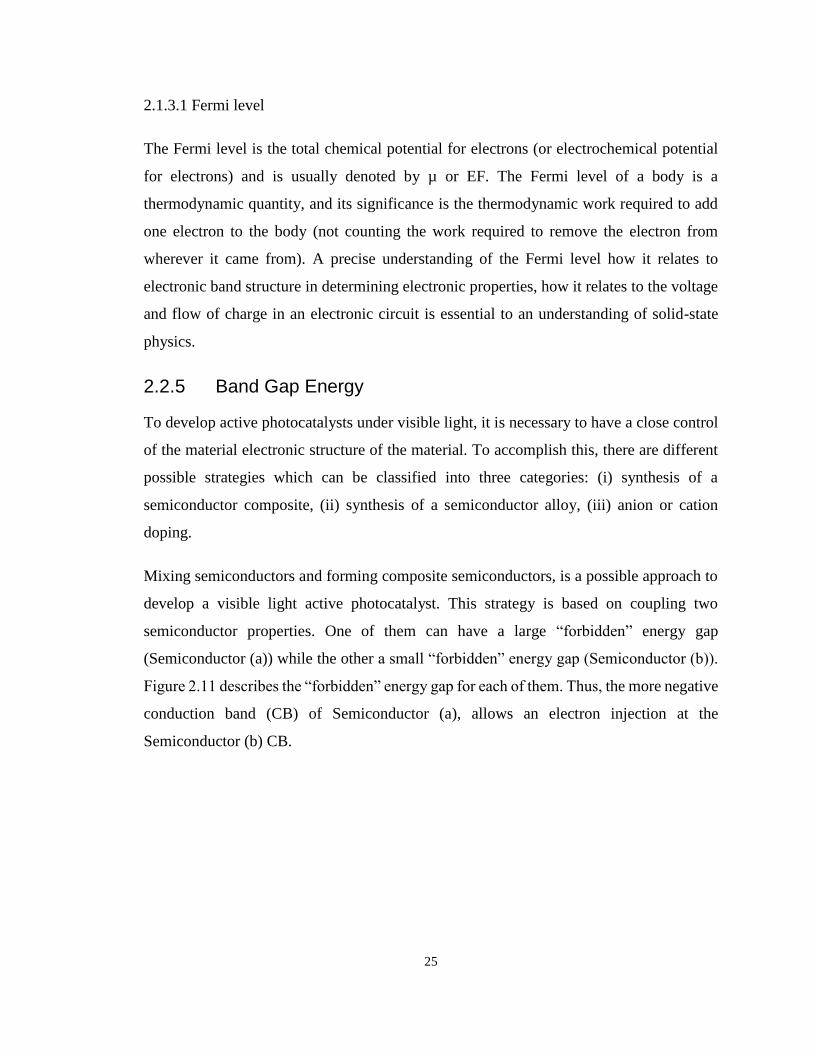
25
2.1.3.1 Fermi level
The Fermi level is the total chemical potential for electrons (or electrochemical potential
for electrons) and is usually denoted by µ or EF. The Fermi level of a body is a
thermodynamic quantity, and its significance is the thermodynamic work required to add
one electron to the body (not counting the work required to remove the electron from
wherever it came from). A precise understanding of the Fermi level how it relates to
electronic band structure in determining electronic properties, how it relates to the voltage
and flow of charge in an electronic circuit is essential to an understanding of solid-state
physics.
2.2.5 Band Gap Energy
To develop active photocatalysts under visible light, it is necessary to have a close control
of the material electronic structure of the material. To accomplish this, there are different
possible strategies which can be classified into three categories: (i) synthesis of a
semiconductor composite, (ii) synthesis of a semiconductor alloy, (iii) anion or cation
doping.
Mixing semiconductors and forming composite semiconductors, is a possible approach to
develop a visible light active photocatalyst. This strategy is based on coupling two
semiconductor properties. One of them can have a large “forbidden” energy gap
(Semiconductor (a)) while the other a small “forbidden” energy gap (Semiconductor (b)).
Figure 2.11 describes the “forbidden” energy gap for each of them. Thus, the more negative
conduction band (CB) of Semiconductor (a), allows an electron injection at the
Semiconductor (b) CB.
26
Figure 2.11 Electron Injection in a Semiconductor Composite such as Anatase-Rutile (a)-
(b) Type.
Semiconductor composites can couple CdS (Eg = 2.4 eV) and SnO2 (Eg = 3.5 eV). These
composites can produce hydrogen under irradiation of visible light, using the EDTA
sacrificial agent [73]. On the other hand, the coupling of TiO2 with a semiconductor with
a “forbidden” energy gap was also investigated. These TiO2 composites were proved to be
more efficient under UV irradiations [74].
It is anticipated that for semiconductor composites to succeed for hydrogen production the
following has to be met: (i) Both semiconductors should not be influenced by photo-
corrosion, (ii) electron injection should be possible, (iii) Semiconductor (b) should be
excited with visible light, (iv) the Semiconductor (b) CB energy level should be more
negative than the Semiconductor (a) CB energy level, (v) the CB of the semiconductor (b)
should have a larger negative energy level than the water reduction level.
A second strategy to extend the response of a semiconductor under visible light involves a
solid solution between semiconductors with both a wide and narrow “forbidden” energy
gap with both materials having a closely similar crystal lattice. Figure 2.12 provides a
schematic of such solid solution
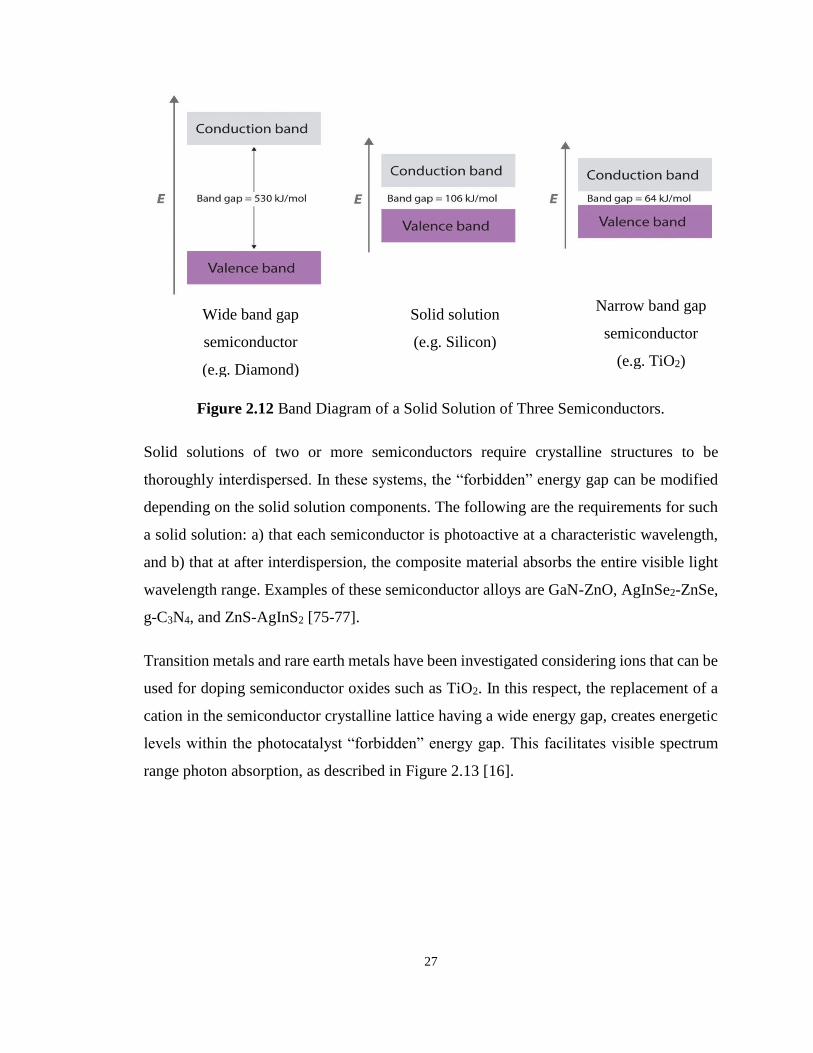
27
Figure 2.12 Band Diagram of a Solid Solution of Three Semiconductors.
Solid solutions of two or more semiconductors require crystalline structures to be
thoroughly interdispersed. In these systems, the “forbidden” energy gap can be modified
depending on the solid solution components. The following are the requirements for such
a solid solution: a) that each semiconductor is photoactive at a characteristic wavelength,
and b) that at after interdispersion, the composite material absorbs the entire visible light
wavelength range. Examples of these semiconductor alloys are GaN-ZnO, AgInSe2-ZnSe,
g-C3N4, and ZnS-AgInS2 [75-77].
Transition metals and rare earth metals have been investigated considering ions that can be
used for doping semiconductor oxides such as TiO2. In this respect, the replacement of a
cation in the semiconductor crystalline lattice having a wide energy gap, creates energetic
levels within the photocatalyst “forbidden” energy gap. This facilitates visible spectrum
range photon absorption, as described in Figure 2.13 [16].
Wide band gap
semiconductor
(e.g. Diamond)
Solid solution
(e.g. Silicon)
Narrow band gap
semiconductor
(e.g. TiO2)
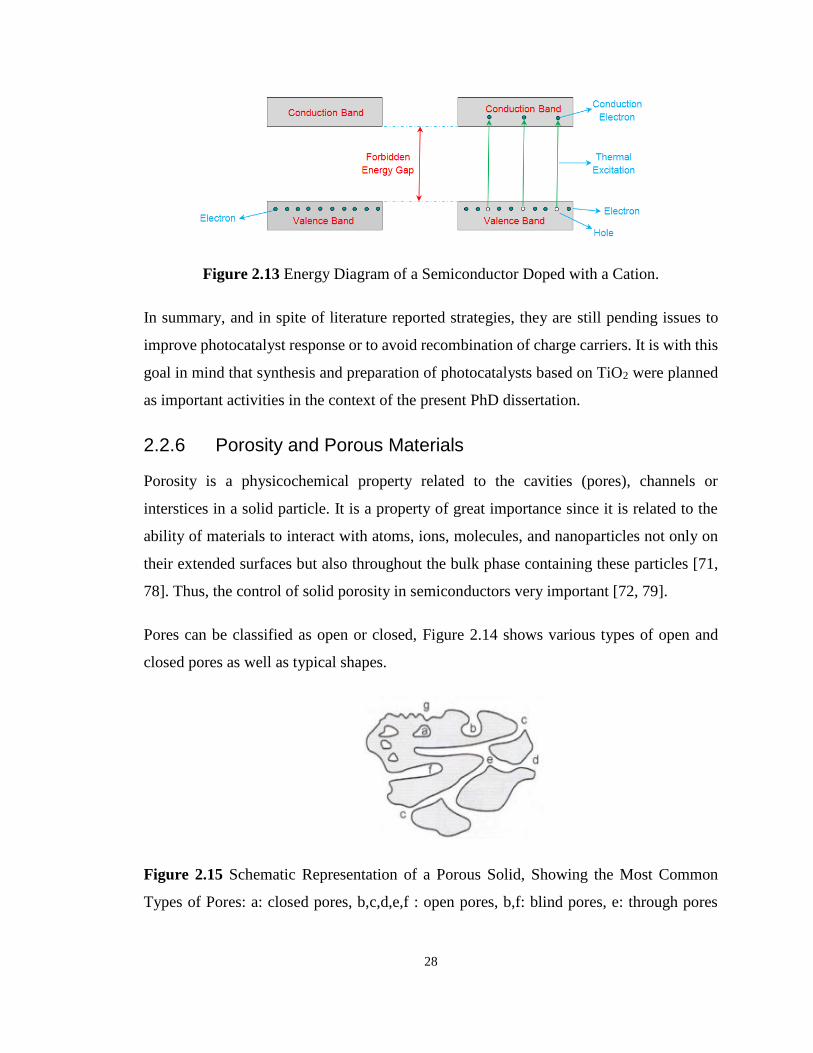
28
Figure 2.13 Energy Diagram of a Semiconductor Doped with a Cation.
In summary, and in spite of literature reported strategies, they are still pending issues to
improve photocatalyst response or to avoid recombination of charge carriers. It is with this
goal in mind that synthesis and preparation of photocatalysts based on TiO2 were planned
as important activities in the context of the present PhD dissertation.
2.2.6 Porosity and Porous Materials
Porosity is a physicochemical property related to the cavities (pores), channels or
interstices in a solid particle. It is a property of great importance since it is related to the
ability of materials to interact with atoms, ions, molecules, and nanoparticles not only on
their extended surfaces but also throughout the bulk phase containing these particles [71,
78]. Thus, the control of solid porosity in semiconductors very important [72, 79].
Pores can be classified as open or closed, Figure 2.14 shows various types of open and
closed pores as well as typical shapes.
Figure 2.15 Schematic Representation of a Porous Solid, Showing the Most Common
Types of Pores: a: closed pores, b,c,d,e,f : open pores, b,f: blind pores, e: through pores
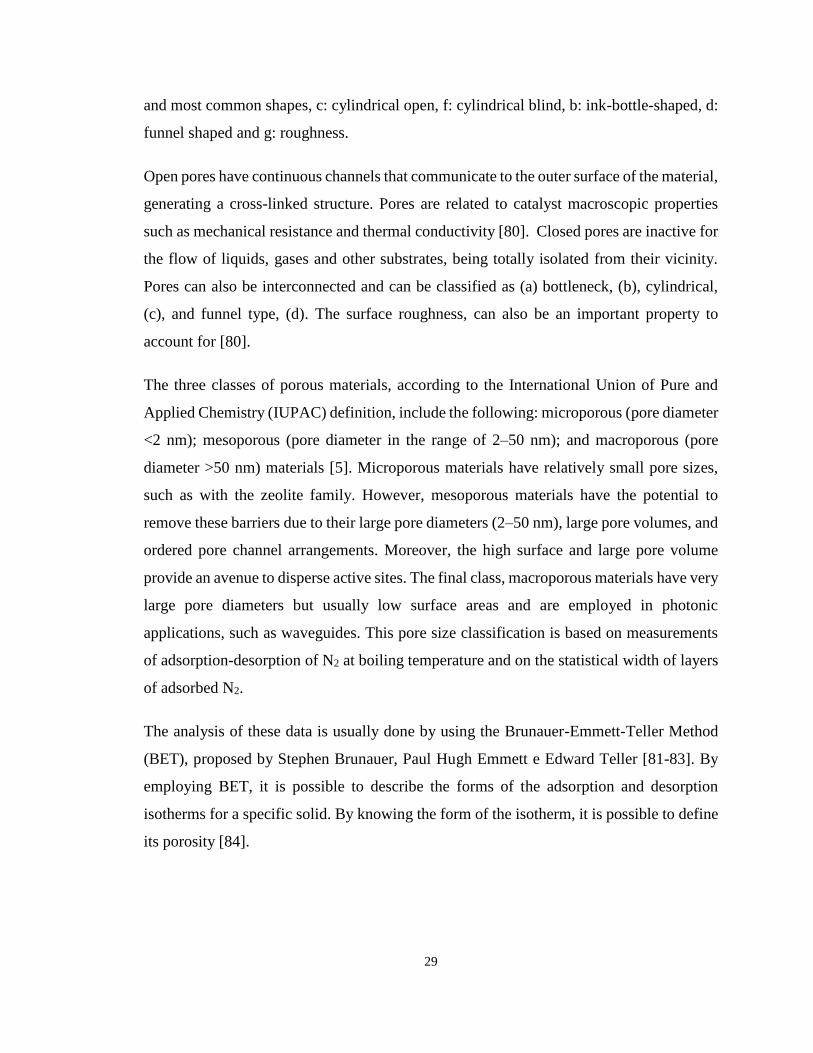
29
and most common shapes, c: cylindrical open, f: cylindrical blind, b: ink-bottle-shaped, d:
funnel shaped and g: roughness.
Open pores have continuous channels that communicate to the outer surface of the material,
generating a cross-linked structure. Pores are related to catalyst macroscopic properties
such as mechanical resistance and thermal conductivity [80]. Closed pores are inactive for
the flow of liquids, gases and other substrates, being totally isolated from their vicinity.
Pores can also be interconnected and can be classified as (a) bottleneck, (b), cylindrical,
(c), and funnel type, (d). The surface roughness, can also be an important property to
account for [80].
The three classes of porous materials, according to the International Union of Pure and
Applied Chemistry (IUPAC) definition, include the following: microporous (pore diameter
<2 nm); mesoporous (pore diameter in the range of 2–50 nm); and macroporous (pore
diameter >50 nm) materials [5]. Microporous materials have relatively small pore sizes,
such as with the zeolite family. However, mesoporous materials have the potential to
remove these barriers due to their large pore diameters (2–50 nm), large pore volumes, and
ordered pore channel arrangements. Moreover, the high surface and large pore volume
provide an avenue to disperse active sites. The final class, macroporous materials have very
large pore diameters but usually low surface areas and are employed in photonic
applications, such as waveguides. This pore size classification is based on measurements
of adsorption-desorption of N2 at boiling temperature and on the statistical width of layers
of adsorbed N2.
The analysis of these data is usually done by using the Brunauer-Emmett-Teller Method
(BET), proposed by Stephen Brunauer, Paul Hugh Emmett e Edward Teller [81-83]. By
employing BET, it is possible to describe the forms of the adsorption and desorption
isotherms for a specific solid. By knowing the form of the isotherm, it is possible to define
its porosity [84].
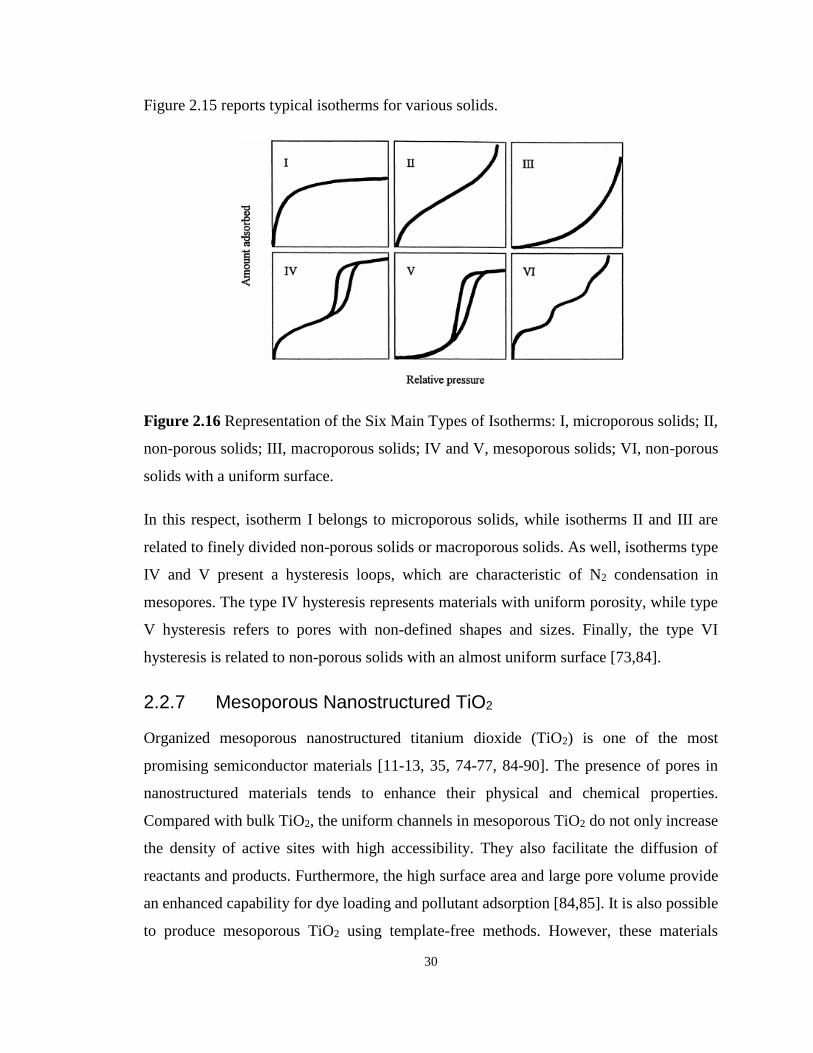
30
Figure 2.15 reports typical isotherms for various solids.
Figure 2.16 Representation of the Six Main Types of Isotherms: I, microporous solids; II,
non-porous solids; III, macroporous solids; IV and V, mesoporous solids; VI, non-porous
solids with a uniform surface.
In this respect, isotherm I belongs to microporous solids, while isotherms II and III are
related to finely divided non-porous solids or macroporous solids. As well, isotherms type
IV and V present a hysteresis loops, which are characteristic of N2 condensation in
mesopores. The type IV hysteresis represents materials with uniform porosity, while type
V hysteresis refers to pores with non-defined shapes and sizes. Finally, the type VI
hysteresis is related to non-porous solids with an almost uniform surface [73,84].
2.2.7 Mesoporous Nanostructured TiO2
Organized mesoporous nanostructured titanium dioxide (TiO2) is one of the most
promising semiconductor materials [11-13, 35, 74-77, 84-90]. The presence of pores in
nanostructured materials tends to enhance their physical and chemical properties.
Compared with bulk TiO2, the uniform channels in mesoporous TiO2 do not only increase
the density of active sites with high accessibility. They also facilitate the diffusion of
reactants and products. Furthermore, the high surface area and large pore volume provide
an enhanced capability for dye loading and pollutant adsorption [84,85]. It is also possible
to produce mesoporous TiO2 using template-free methods. However, these materials
31
usually present disordered mesostructures, and this because of the irregular packing of their
building blocks [84].
2.2.7.1 Surfactants as Drive Agents in Obtaining Mesoporous Ordered Materials
Certain surfactants can act as structural templates, during the semiconductor synthesis.
Structural templates promote specific semiconductor architectures. This process occurs due
to the spontaneous oxide nuclei forming around a surfactant molecule. This condition
controls the initially microstructure formation and the later growth. This mesoporous
semiconductor synthesis yields an ordered material. The architecture and its
physicochemical properties can be controlled with the concentration of the surfactant
employed [13, 91].
For a successful mesoporous semiconductor synthesis, the surfactant (X) and the inorganic
species (I) need to interact as [91]:
1) X+I-: cationic surfactants are needed as structural drivers for negatively charged
inorganic species;
2) X-I+: anionic surfactants are required as structural drivers for positively charged
inorganic species;
3) X+X-I+: Both the surfactant and inorganic species must be positively charged and this
in the presence of opposite charged species. These species act as counter ions;
4) X-X+I-: Both the surfactant and inorganic species must be negatively charged and this
in the presence of a species of opposite charge. These species act as counter ions;
5) Xº Iº: Both the surfactant and the medium must favour neutrality for the inorganic
species. In this case, the interaction between the species occurs through hydrogen
bonds or dipoles.
Thus, the concentration of the surfactant in the reaction medium must be higher than the
critical micelle concentration (CMC), and favour the auto-assembling of micelles. This
phenomenon promotes bi and three-dimensional arrays responsible for the empty spaces
that lead to nanopores material synthesis [91].
32
2.2.7.2 Sol-Gel method
The sol-gel method has become the most widely used for the synthesis of semiconductor
photocatalysts. It is a powerful method for tailoring metal oxides to fit particular
applications due to a great number of parameters can be controlled; i.e., the nature of the
precursors, reagent concentrations, aging temperature and time, temperature as well as time
of reaction, pH, catalyst nature and concentration, the amount of added water, addition of
organic additives. One of the main advantages of the sol-gel method is the homogeneous
mixing at the molecular level of metal ion which promotes the formation of polycrystalline
particles with characteristic properties. Another important advantage of the sol-gel method
is that through some stage of the process it is possible to incorporate different types of
dopants. The incorporation of an active dopant in the sol during the gelation stage allows
doping elements to have a direct interaction with support in such a way that the
photocatalytic properties of the material can be enhanced.
2.2.7.3 Synthesis of mesoporous TiO2 using Sol-Gel method
Among the methodologies of TiO2 mesoporous synthesis, the methods of sol-gel and
homogeneous precipitation best favour the control of morphology [82, 92, 93]. The term
sol-gel involves several synthesis methodologies based on hydrolytic processes [11, 12,
83, 94]. Hydrolysis and condensation reactions involving the precursor, allow the
formation of colloidal particles (sol) and the subsequent formation of three-dimensional
networks (gel). This process ensures a good homogeneity for the reaction product, leading,
in general, to metastable phases, amorphous or not [95]. In the case of amorphous
materials, a step for the crystallization of the oxides formed, is required.
The use of solvothermal conditions is an alternative to the conversion of the amorphous
material to crystalline material without the use of high temperatures [84, 93]. The
solvothermal method consists in the dissolution of a metallic precursor in anhydrous benzyl
alcohol while being heated at temperatures above 423 K. Under these conditions, the
alcoholic hydroxyl group connects partially to the metal ion, starting a polycondensation
reaction. Due to the greater volume of the organic group, steric hindrance, tends to control
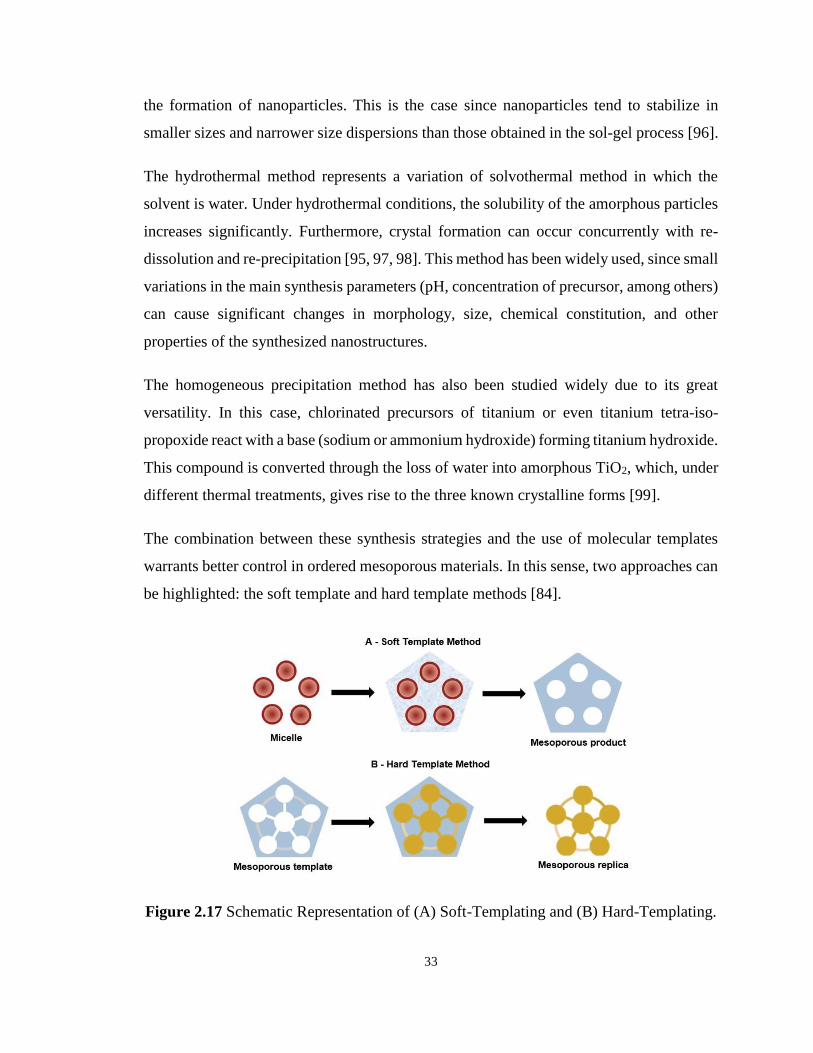
33
the formation of nanoparticles. This is the case since nanoparticles tend to stabilize in
smaller sizes and narrower size dispersions than those obtained in the sol-gel process [96].
The hydrothermal method represents a variation of solvothermal method in which the
solvent is water. Under hydrothermal conditions, the solubility of the amorphous particles
increases significantly. Furthermore, crystal formation can occur concurrently with re-
dissolution and re-precipitation [95, 97, 98]. This method has been widely used, since small
variations in the main synthesis parameters (pH, concentration of precursor, among others)
can cause significant changes in morphology, size, chemical constitution, and other
properties of the synthesized nanostructures.
The homogeneous precipitation method has also been studied widely due to its great
versatility. In this case, chlorinated precursors of titanium or even titanium tetra-iso-
propoxide react with a base (sodium or ammonium hydroxide) forming titanium hydroxide.
This compound is converted through the loss of water into amorphous TiO2, which, under
different thermal treatments, gives rise to the three known crystalline forms [99].
The combination between these synthesis strategies and the use of molecular templates
warrants better control in ordered mesoporous materials. In this sense, two approaches can
be highlighted: the soft template and hard template methods [84].
Figure 2.17 Schematic Representation of (A) Soft-Templating and (B) Hard-Templating.
34
The soft-templating method consists in the use of a template in the liquid phase. It is widely
used in the sol-gel processes based on titanium precursors. Due to its high chemical
reactivity, these precursors tend to suffer hydrolysis, giving rise to dense precipitates very
quickly. The self-structuration of surfactants can lead to mesostructured sol particles. This
occurs through the spontaneous organization of molecules around automounted micelle
structures, usually in an aqueous medium, and gives rise to colloidal nanocrystals.
Studies have suggested that two mechanisms are related to the formation of mesoporous
materials via the soft-templating method [91, 100-102]. The first is known as the
Cooperative Self-Assembly (CSA), and the second, is identified as the Liquid Crystal
Template (LCT). In the CSA, there is a simultaneous aggregation between the inorganic
precursor and the surfactant. This includes the formation of a liquid crystal-like phase with
cubic, hexagonal or lamellar arrangements, containing both micelles and the inorganic
precursor. On the other hand, in the LCT mechanism the concentration of surfactant is so
high that a liquid-crystalline phase is formed without the presence of inorganic precursors.
In both mechanisms, after the formation of the material, it is necessary to remove the
template to obtain the porosity. For this, the procedure most commonly used is calcination
[91].
In 1992, scientists from Mobil Oil Corporation [103], reported mesoporous silicate
molecular sieves synthesis, denoted by M41s. These were synthesized using a macro-
molecule-templating process, that gave rise to a new and fascinating field of research.
Subsequently, efforts have been concentrated in studies related to the synthesis and
application of mesoporous materials [2, 92, 104-111].
In 1995, the preparation of mesoporous TiO2 using a sol-gel method associated with a
surfactant as a structural template was at first reported [112]. Since then, efforts have been
made to propose methods of synthesis of ordered mesoporous TiO2. These aim at
contributing to the improvement of the photocatalytic activity of this material, by using
diverse applications [113-116].
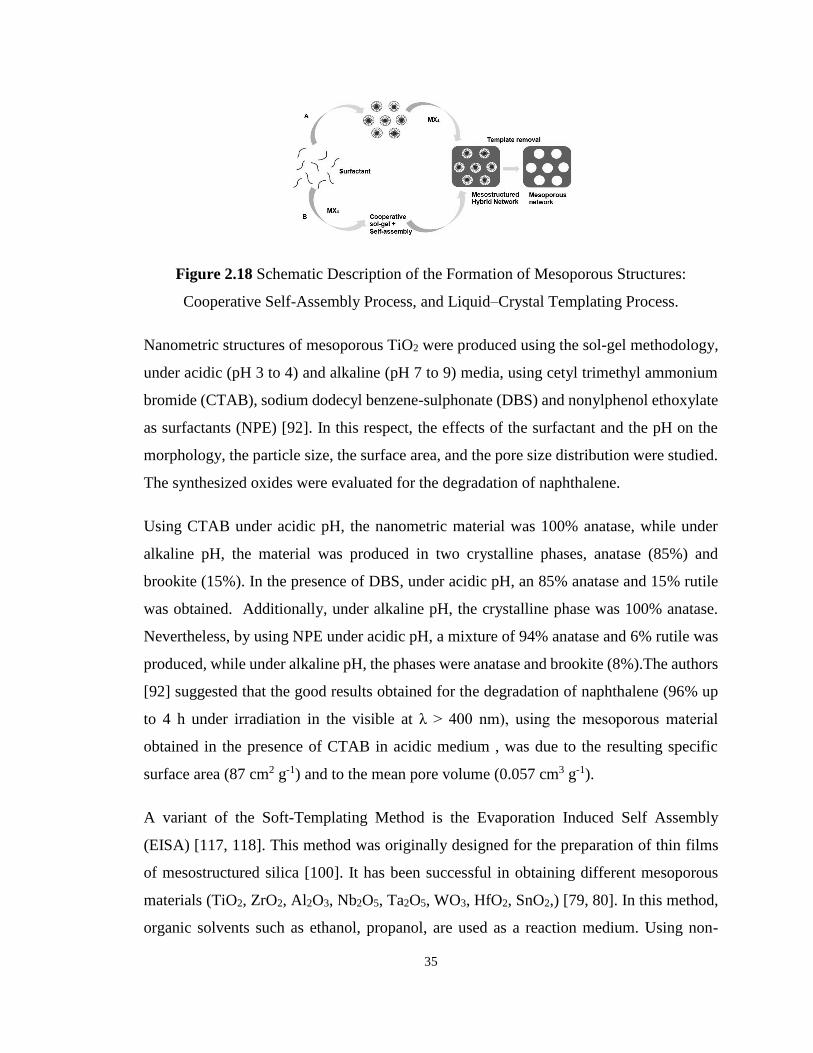
35
Figure 2.18 Schematic Description of the Formation of Mesoporous Structures:
Cooperative Self-Assembly Process, and Liquid–Crystal Templating Process.
Nanometric structures of mesoporous TiO2 were produced using the sol-gel methodology,
under acidic (pH 3 to 4) and alkaline (pH 7 to 9) media, using cetyl trimethyl ammonium
bromide (CTAB), sodium dodecyl benzene-sulphonate (DBS) and nonylphenol ethoxylate
as surfactants (NPE) [92]. In this respect, the effects of the surfactant and the pH on the
morphology, the particle size, the surface area, and the pore size distribution were studied.
The synthesized oxides were evaluated for the degradation of naphthalene.
Using CTAB under acidic pH, the nanometric material was 100% anatase, while under
alkaline pH, the material was produced in two crystalline phases, anatase (85%) and
brookite (15%). In the presence of DBS, under acidic pH, an 85% anatase and 15% rutile
was obtained. Additionally, under alkaline pH, the crystalline phase was 100% anatase.
Nevertheless, by using NPE under acidic pH, a mixture of 94% anatase and 6% rutile was
produced, while under alkaline pH, the phases were anatase and brookite (8%).The authors
[92] suggested that the good results obtained for the degradation of naphthalene (96% up
to 4 h under irradiation in the visible at λ > 400 nm), using the mesoporous material
obtained in the presence of CTAB in acidic medium , was due to the resulting specific
surface area (87 cm2 g-1) and to the mean pore volume (0.057 cm3 g-1).
A variant of the Soft-Templating Method is the Evaporation Induced Self Assembly
(EISA) [117, 118]. This method was originally designed for the preparation of thin films
of mesostructured silica [100]. It has been successful in obtaining different mesoporous
materials (TiO2, ZrO2, Al2O3, Nb2O5, Ta2O5, WO3, HfO2, SnO2,) [79, 80]. In this method,
organic solvents such as ethanol, propanol, are used as a reaction medium. Using non-
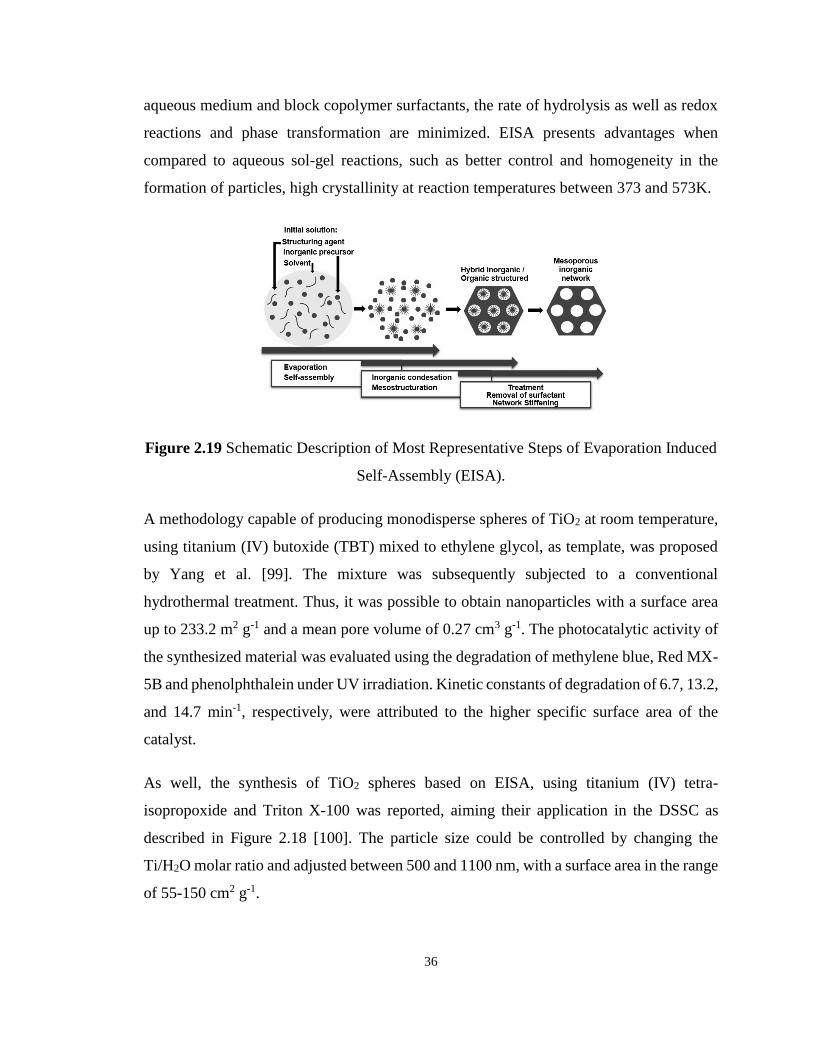
36
aqueous medium and block copolymer surfactants, the rate of hydrolysis as well as redox
reactions and phase transformation are minimized. EISA presents advantages when
compared to aqueous sol-gel reactions, such as better control and homogeneity in the
formation of particles, high crystallinity at reaction temperatures between 373 and 573K.
Figure 2.19 Schematic Description of Most Representative Steps of Evaporation Induced
Self-Assembly (EISA).
A methodology capable of producing monodisperse spheres of TiO2 at room temperature,
using titanium (IV) butoxide (TBT) mixed to ethylene glycol, as template, was proposed
by Yang et al. [99]. The mixture was subsequently subjected to a conventional
hydrothermal treatment. Thus, it was possible to obtain nanoparticles with a surface area
up to 233.2 m2 g-1 and a mean pore volume of 0.27 cm3 g-1. The photocatalytic activity of
the synthesized material was evaluated using the degradation of methylene blue, Red MX-
5B and phenolphthalein under UV irradiation. Kinetic constants of degradation of 6.7, 13.2,
and 14.7 min-1, respectively, were attributed to the higher specific surface area of the
catalyst.
As well, the synthesis of TiO2 spheres based on EISA, using titanium (IV) tetra-
isopropoxide and Triton X-100 was reported, aiming their application in the DSSC as
described in Figure 2.18 [100]. The particle size could be controlled by changing the
Ti/H2O molar ratio and adjusted between 500 and 1100 nm, with a surface area in the range
of 55-150 cm2 g-1.
37
By using the EISA strategy, excellent photocatalysts based on CeO2, capable of oxidizing
harmful gases, such as CO, NOx and hydrocarbons, in non-toxic gases, were synthesized
[102]. The triblock copolymer P123 and polyvinyl pyrrolidone (PVP) were used as
templates. In this sense, photocatalysts with different pore sizes (about 40 μm, 2 μm and <
0.3 μm) and the specific surface area of 32.5 m2 g-1 were produced.
Collapse to the mesoporous structure may occur due to the presence of residual template.
Possible damage may involve the blocking of pores or even the poisoning of photocatalytic
sites on the surface of the mesoporous material. In this sense, calcination has been
identified as a method to eliminate some surfactants [119]. Non-ionic surfactants, as Triton
X-100, can be simply removed by washing the oxide formed [120].
Concerning the hard-templating method the solid is formed around a template, usually
composed of zeolites and meso- and macroporous silica, via interactions between the
template and the precursor [84]. This methodology is more complex when compared to the
soft-templating method. Nevertheless, hard templating is highly effective in obtaining
mesoporous structures [121]. Through this methodology, nanostructures are formed on
surface of templates [122].
The synthesis of uniform TiO2 sized nano-spheres, based on hard-templating and using
silica as template and (NH4)2TiF6 as precursor, was proposed by Tang et.al. [123]. This
synthesized material displayed a 54.2 m2 g-1 surface area and 0.15 cm3 g-1 pore volume.
The photocatalytic activity was evaluated by using the degradation of the dyes of
methylene blue, rhodamine B and methyl-orange. The levels of degradation were 95%,
95% and 90%, respectively. These excellent results were attributed to the high specific
surface area and charge separation in the monodispersed resulting materials.
Chen et.al. [124] proposed synthesizing mesoporous TiO2 by using a combination of hard-
and soft-templating methods. By using mesoporous silica in the first step (hard-
templating), and Pluronic P123 as structure directing agent at the soft-templating stage,
this allows particle morphology control. This yielded three-dimensionally ordered
mesopores with a 145 m2 g-1 specific surface area and 0.246 cm3 g-1 specific pore volume.
Due to the porous nature of the material obtained and due to the three-dimensional
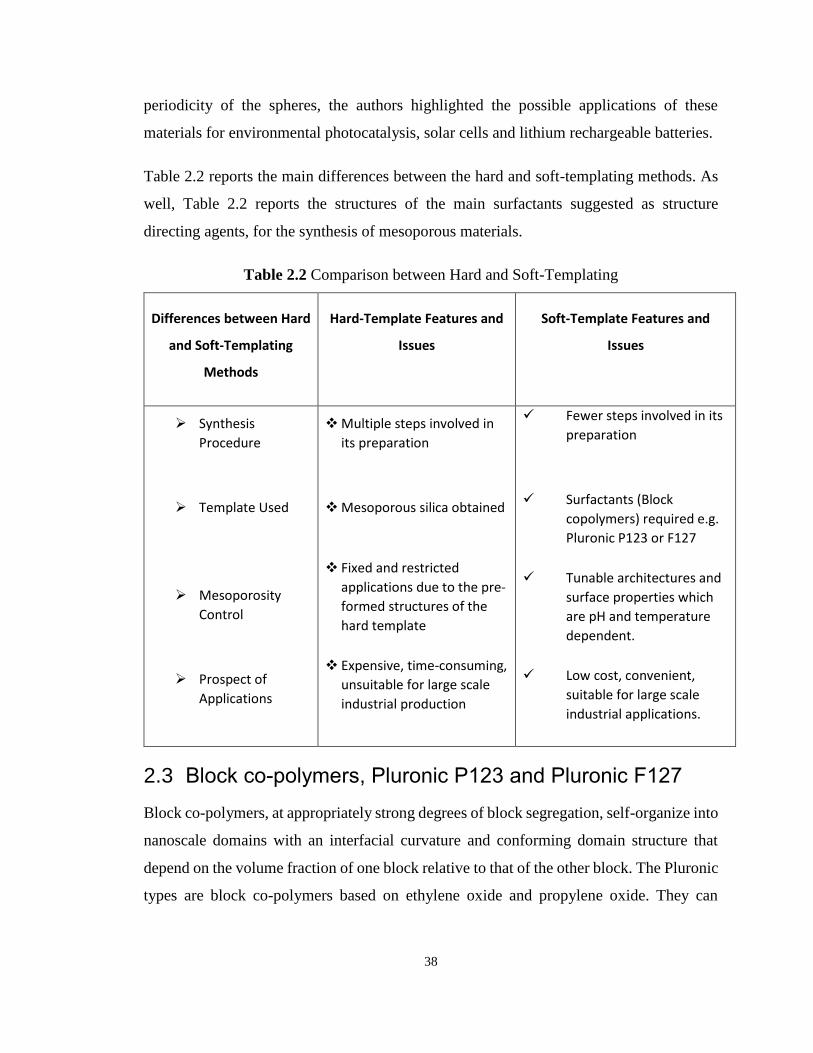
38
periodicity of the spheres, the authors highlighted the possible applications of these
materials for environmental photocatalysis, solar cells and lithium rechargeable batteries.
Table 2.2 reports the main differences between the hard and soft-templating methods. As
well, Table 2.2 reports the structures of the main surfactants suggested as structure
directing agents, for the synthesis of mesoporous materials.
Table 2.2 Comparison between Hard and Soft-Templating
Differences between Hard
and Soft-Templating
Methods
Hard-Template Features and
Issues
Soft-Template Features and
Issues
➢ Synthesis
Procedure
➢ Template Used
➢ Mesoporosity
Control
➢ Prospect of
Applications
❖ Multiple steps involved in
its preparation
❖ Mesoporous silica obtained
❖ Fixed and restricted
applications due to the pre-
formed structures of the
hard template
❖ Expensive, time-consuming,
unsuitable for large scale
industrial production
✓ Fewer steps involved in its
preparation
✓ Surfactants (Block
copolymers) required e.g.
Pluronic P123 or F127
✓ Tunable architectures and
surface properties which
are pH and temperature
dependent.
✓ Low cost, convenient,
suitable for large scale
industrial applications.
2.3 Block co-polymers, Pluronic P123 and Pluronic F127
Block co-polymers, at appropriately strong degrees of block segregation, self-organize into
nanoscale domains with an interfacial curvature and conforming domain structure that
depend on the volume fraction of one block relative to that of the other block. The Pluronic
types are block co-polymers based on ethylene oxide and propylene oxide. They can
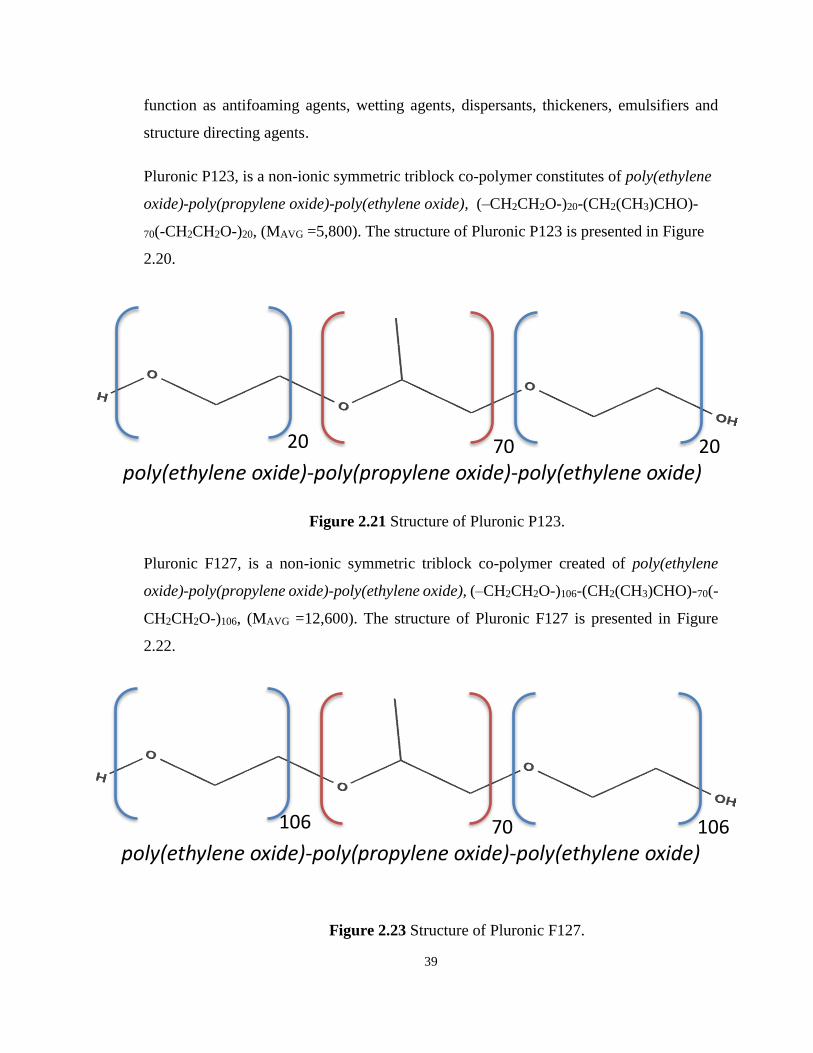
39
20 20 70
poly(ethylene oxide)-poly(propylene oxide)-poly(ethylene oxide)
106 106 70
poly(ethylene oxide)-poly(propylene oxide)-poly(ethylene oxide)
Figure 2.21 Structure of Pluronic P123.
Figure 2.23 Structure of Pluronic F127.
function as antifoaming agents, wetting agents, dispersants, thickeners, emulsifiers and
structure directing agents.
Pluronic P123, is a non-ionic symmetric triblock co-polymer constitutes of poly(ethylene
oxide)-poly(propylene oxide)-poly(ethylene oxide), (–CH2CH2O-)20-(CH2(CH3)CHO)-
70(-CH2CH2O-)20, (MAVG =5,800). The structure of Pluronic P123 is presented in Figure
2.20.
Pluronic F127, is a non-ionic symmetric triblock co-polymer created of poly(ethylene
oxide)-poly(propylene oxide)-poly(ethylene oxide), (–CH2CH2O-)106-(CH2(CH3)CHO)-70(-
CH2CH2O-)106, (MAVG =12,600). The structure of Pluronic F127 is presented in Figure
2.22.
40
2.4 Quantum Efficiency
The specialized literature is densely populated by photocatalysis studies which require
important additional specifics about photocatalytic efficiency. In this respect,
photocatalytic conversion alone does not allow adequate assessment of conductor materials
and photocatalytic reactor designs. Not having this important data hinders scientific and
technological progress.
A key parameter in this analysis is the quantum efficiency. This is a parameter that can also
help in reaction pathway discrimination. Different definitions for quantum efficiency have
been proposed, leading to different approaches in assessing their photoreactor energy
efficiency [25-26]. Ibrahim [125] and de Lasa et al. [126] have provided detailed
summaries of possible quantum yield definitions. Other definitions using the incident
photon flux [127-135] can be found in the literature, but most of them are of uncertain
utility.
Quantum parameters are key and useful efficiency estimators in photocatalysis. These
parameters are based on “number ratio”, either of photoconverted molecules over absorbed
photons, or photoconverted molecules over photons entering the reactor, as illustrated in
the following table.
I. Primary Quantum Yield,
II. Overall quantum yield and,
III. Apparent quantum yield or global quantum yield.
Table 2.3 Quantum Parameters Definitions (Ibrahim, 2001)
Parameter Definition and Literature Reference
Primary Quantum Yield (Primary QY)
𝑛𝑢𝑚𝑏𝑒𝑟 𝑜𝑓 𝑝𝑜𝑙𝑙𝑢𝑡𝑎𝑛𝑡 𝑚𝑜𝑙𝑒𝑐𝑢𝑙𝑒𝑠 𝑑𝑒𝑔𝑟𝑎𝑑𝑒𝑑 𝑓𝑟𝑜𝑚 𝑎 𝑝𝑟𝑖𝑚𝑎𝑟𝑦 𝑝𝑟𝑜𝑐𝑒𝑠𝑠
𝑛𝑢𝑚𝑏𝑒𝑟 𝑜𝑓 𝑎 𝑝ℎ𝑜𝑡𝑜𝑛𝑠 𝑎𝑏𝑠𝑜𝑟𝑏𝑒𝑑
Cassano et al., (1995), Davydov et al., (1999)
Overall Quantum Yield (Overall QY)
𝑛𝑢𝑚𝑏𝑒𝑟 𝑜𝑓 𝑝𝑜𝑙𝑙𝑢𝑡𝑎𝑛𝑡 𝑚𝑜𝑙𝑒𝑐𝑢𝑙𝑒𝑠 𝑑𝑒𝑔𝑟𝑎𝑑𝑒𝑑 𝑓𝑟𝑜𝑚 𝑎 𝑝𝑟𝑖𝑚𝑎𝑟𝑦 𝑎𝑛𝑑 𝑠𝑒𝑐𝑜𝑛𝑑 𝑝𝑟𝑜𝑐𝑒𝑠𝑠
𝑛𝑢𝑚𝑏𝑒𝑟 𝑜𝑓 𝑎 𝑝ℎ𝑜𝑡𝑜𝑛𝑠 𝑎𝑏𝑠𝑜𝑟𝑏𝑒𝑑
Cassano et al., (1995)
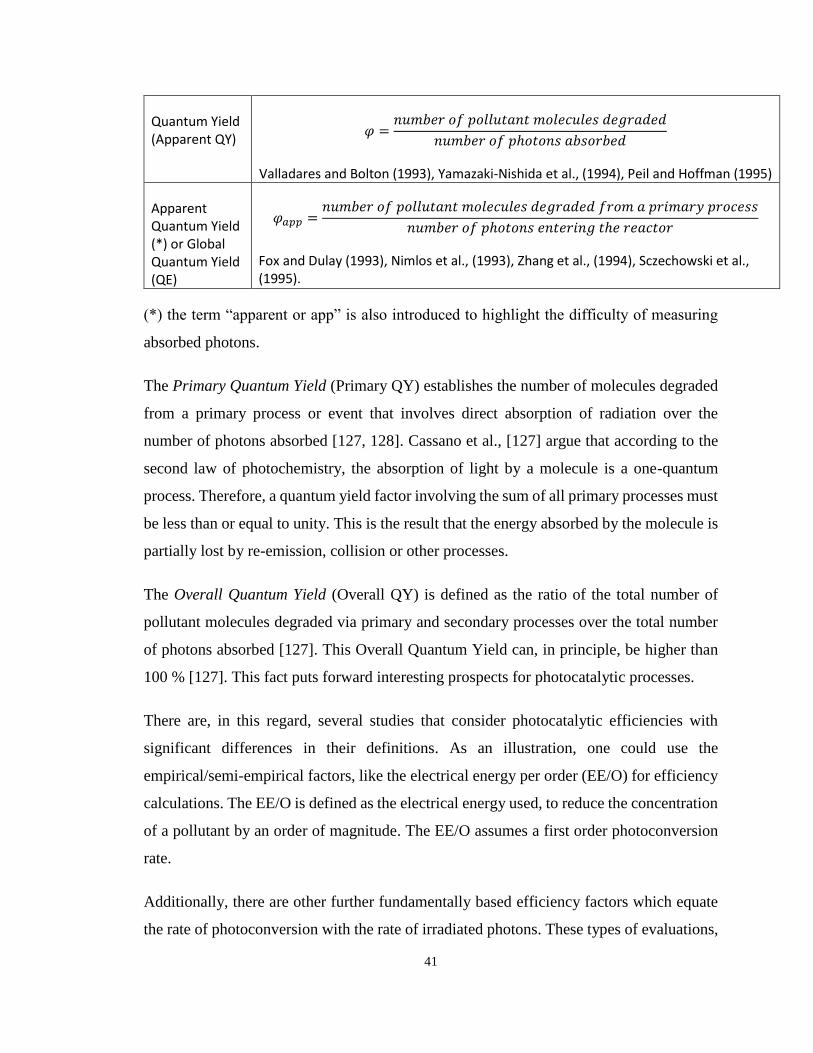
41
Quantum Yield (Apparent QY)
𝜑 =𝑛𝑢𝑚𝑏𝑒𝑟 𝑜𝑓 𝑝𝑜𝑙𝑙𝑢𝑡𝑎𝑛𝑡 𝑚𝑜𝑙𝑒𝑐𝑢𝑙𝑒𝑠 𝑑𝑒𝑔𝑟𝑎𝑑𝑒𝑑
𝑛𝑢𝑚𝑏𝑒𝑟 𝑜𝑓 𝑝ℎ𝑜𝑡𝑜𝑛𝑠 𝑎𝑏𝑠𝑜𝑟𝑏𝑒𝑑
Valladares and Bolton (1993), Yamazaki-Nishida et al., (1994), Peil and Hoffman (1995)
Apparent Quantum Yield (*) or Global Quantum Yield (QE)
𝜑𝑎𝑝𝑝 =𝑛𝑢𝑚𝑏𝑒𝑟 𝑜𝑓 𝑝𝑜𝑙𝑙𝑢𝑡𝑎𝑛𝑡 𝑚𝑜𝑙𝑒𝑐𝑢𝑙𝑒𝑠 𝑑𝑒𝑔𝑟𝑎𝑑𝑒𝑑 𝑓𝑟𝑜𝑚 𝑎 𝑝𝑟𝑖𝑚𝑎𝑟𝑦 𝑝𝑟𝑜𝑐𝑒𝑠𝑠
𝑛𝑢𝑚𝑏𝑒𝑟 𝑜𝑓 𝑝ℎ𝑜𝑡𝑜𝑛𝑠 𝑒𝑛𝑡𝑒𝑟𝑖𝑛𝑔 𝑡ℎ𝑒 𝑟𝑒𝑎𝑐𝑡𝑜𝑟
Fox and Dulay (1993), Nimlos et al., (1993), Zhang et al., (1994), Sczechowski et al., (1995).
(*) the term “apparent or app” is also introduced to highlight the difficulty of measuring
absorbed photons.
The Primary Quantum Yield (Primary QY) establishes the number of molecules degraded
from a primary process or event that involves direct absorption of radiation over the
number of photons absorbed [127, 128]. Cassano et al., [127] argue that according to the
second law of photochemistry, the absorption of light by a molecule is a one-quantum
process. Therefore, a quantum yield factor involving the sum of all primary processes must
be less than or equal to unity. This is the result that the energy absorbed by the molecule is
partially lost by re-emission, collision or other processes.
The Overall Quantum Yield (Overall QY) is defined as the ratio of the total number of
pollutant molecules degraded via primary and secondary processes over the total number
of photons absorbed [127]. This Overall Quantum Yield can, in principle, be higher than
100 % [127]. This fact puts forward interesting prospects for photocatalytic processes.
There are, in this regard, several studies that consider photocatalytic efficiencies with
significant differences in their definitions. As an illustration, one could use the
empirical/semi-empirical factors, like the electrical energy per order (EE/O) for efficiency
calculations. The EE/O is defined as the electrical energy used, to reduce the concentration
of a pollutant by an order of magnitude. The EE/O assumes a first order photoconversion
rate.
Additionally, there are other further fundamentally based efficiency factors which equate
the rate of photoconversion with the rate of irradiated photons. These types of evaluations,
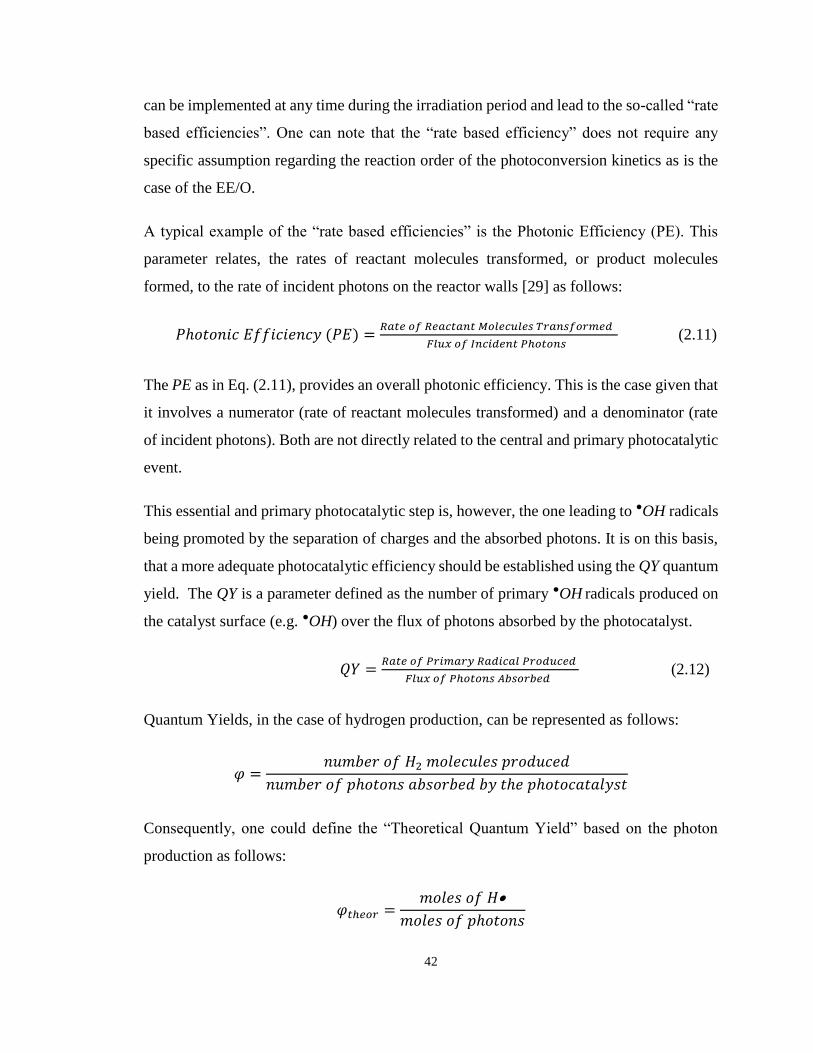
42
can be implemented at any time during the irradiation period and lead to the so-called “rate
based efficiencies”. One can note that the “rate based efficiency” does not require any
specific assumption regarding the reaction order of the photoconversion kinetics as is the
case of the EE/O.
A typical example of the “rate based efficiencies” is the Photonic Efficiency (PE). This
parameter relates, the rates of reactant molecules transformed, or product molecules
formed, to the rate of incident photons on the reactor walls [29] as follows:
𝑃ℎ𝑜𝑡𝑜𝑛𝑖𝑐 𝐸𝑓𝑓𝑖𝑐𝑖𝑒𝑛𝑐𝑦 (𝑃𝐸) =𝑅𝑎𝑡𝑒 𝑜𝑓 𝑅𝑒𝑎𝑐𝑡𝑎𝑛𝑡 𝑀𝑜𝑙𝑒𝑐𝑢𝑙𝑒𝑠 𝑇𝑟𝑎𝑛𝑠𝑓𝑜𝑟𝑚𝑒𝑑
𝐹𝑙𝑢𝑥 𝑜𝑓 𝐼𝑛𝑐𝑖𝑑𝑒𝑛𝑡 𝑃ℎ𝑜𝑡𝑜𝑛𝑠 (2.11)
The PE as in Eq. (2.11), provides an overall photonic efficiency. This is the case given that
it involves a numerator (rate of reactant molecules transformed) and a denominator (rate
of incident photons). Both are not directly related to the central and primary photocatalytic
event.
This essential and primary photocatalytic step is, however, the one leading to ●OH radicals
being promoted by the separation of charges and the absorbed photons. It is on this basis,
that a more adequate photocatalytic efficiency should be established using the QY quantum
yield. The QY is a parameter defined as the number of primary ●OH radicals produced on
the catalyst surface (e.g. ●OH) over the flux of photons absorbed by the photocatalyst.
𝑄𝑌 =𝑅𝑎𝑡𝑒 𝑜𝑓 𝑃𝑟𝑖𝑚𝑎𝑟𝑦 𝑅𝑎𝑑𝑖𝑐𝑎𝑙 𝑃𝑟𝑜𝑑𝑢𝑐𝑒𝑑
𝐹𝑙𝑢𝑥 𝑜𝑓 𝑃ℎ𝑜𝑡𝑜𝑛𝑠 𝐴𝑏𝑠𝑜𝑟𝑏𝑒𝑑 (2.12)
Quantum Yields, in the case of hydrogen production, can be represented as follows:
𝜑 =𝑛𝑢𝑚𝑏𝑒𝑟 𝑜𝑓 𝐻2 𝑚𝑜𝑙𝑒𝑐𝑢𝑙𝑒𝑠 𝑝𝑟𝑜𝑑𝑢𝑐𝑒𝑑
𝑛𝑢𝑚𝑏𝑒𝑟 𝑜𝑓 𝑝ℎ𝑜𝑡𝑜𝑛𝑠 𝑎𝑏𝑠𝑜𝑟𝑏𝑒𝑑 𝑏𝑦 𝑡ℎ𝑒 𝑝ℎ𝑜𝑡𝑜𝑐𝑎𝑡𝑎𝑙𝑦𝑠𝑡
Consequently, one could define the “Theoretical Quantum Yield” based on the photon
production as follows:
𝜑𝑡ℎ𝑒𝑜𝑟 =𝑚𝑜𝑙𝑒𝑠 𝑜𝑓 𝐻•
𝑚𝑜𝑙𝑒𝑠 𝑜𝑓 𝑝ℎ𝑜𝑡𝑜𝑛𝑠
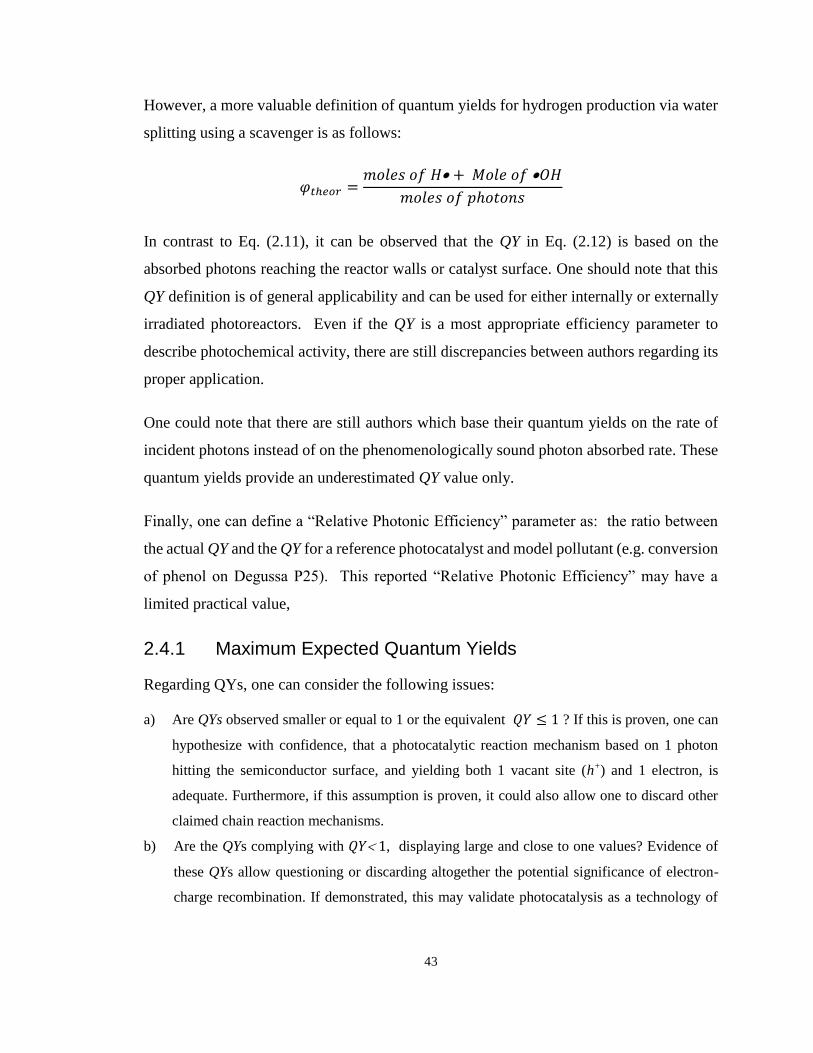
43
However, a more valuable definition of quantum yields for hydrogen production via water
splitting using a scavenger is as follows:
𝜑𝑡ℎ𝑒𝑜𝑟 =𝑚𝑜𝑙𝑒𝑠 𝑜𝑓 𝐻• + 𝑀𝑜𝑙𝑒 𝑜𝑓 •𝑂𝐻
𝑚𝑜𝑙𝑒𝑠 𝑜𝑓 𝑝ℎ𝑜𝑡𝑜𝑛𝑠
In contrast to Eq. (2.11), it can be observed that the QY in Eq. (2.12) is based on the
absorbed photons reaching the reactor walls or catalyst surface. One should note that this
QY definition is of general applicability and can be used for either internally or externally
irradiated photoreactors. Even if the QY is a most appropriate efficiency parameter to
describe photochemical activity, there are still discrepancies between authors regarding its
proper application.
One could note that there are still authors which base their quantum yields on the rate of
incident photons instead of on the phenomenologically sound photon absorbed rate. These
quantum yields provide an underestimated QY value only.
Finally, one can define a “Relative Photonic Efficiency” parameter as: the ratio between
the actual QY and the QY for a reference photocatalyst and model pollutant (e.g. conversion
of phenol on Degussa P25). This reported “Relative Photonic Efficiency” may have a
limited practical value,
2.4.1 Maximum Expected Quantum Yields
Regarding QYs, one can consider the following issues:
a) Are QYs observed smaller or equal to 1 or the equivalent 𝑄𝑌 ≤ 1 ? If this is proven, one can
hypothesize with confidence, that a photocatalytic reaction mechanism based on 1 photon
hitting the semiconductor surface, and yielding both 1 vacant site (h+) and 1 electron, is
adequate. Furthermore, if this assumption is proven, it could also allow one to discard other
claimed chain reaction mechanisms.
b) Are the QYs complying with 𝑄𝑌 1, displaying large and close to one values? Evidence of
these QYs allow questioning or discarding altogether the potential significance of electron-
charge recombination. If demonstrated, this may validate photocatalysis as a technology of
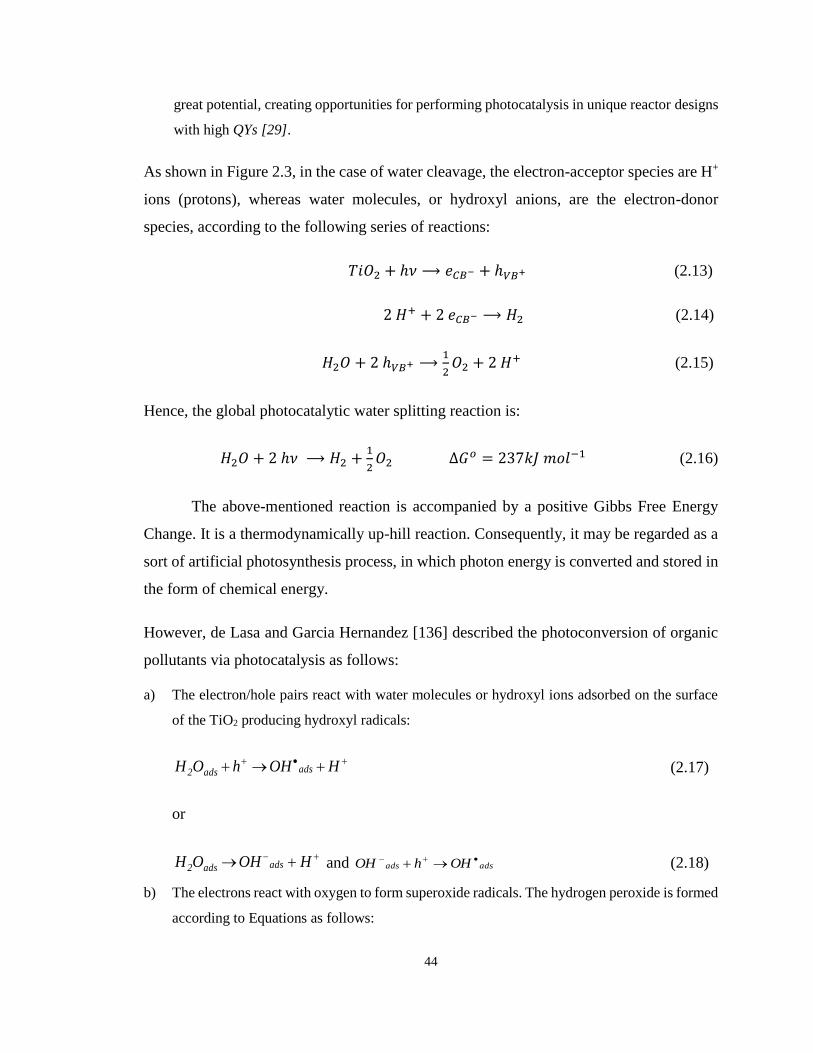
44
great potential, creating opportunities for performing photocatalysis in unique reactor designs
with high QYs [29].
As shown in Figure 2.3, in the case of water cleavage, the electron-acceptor species are H+
ions (protons), whereas water molecules, or hydroxyl anions, are the electron-donor
species, according to the following series of reactions:
𝑇𝑖𝑂2 + ℎ𝜈 ⟶ 𝑒𝐶𝐵− + ℎ𝑉𝐵+ (2.13)
2 𝐻+ + 2 𝑒𝐶𝐵− ⟶ 𝐻2 (2.14)
𝐻2𝑂 + 2 ℎ𝑉𝐵+ ⟶1
2𝑂2 + 2 𝐻+ (2.15)
Hence, the global photocatalytic water splitting reaction is:
𝐻2𝑂 + 2 ℎ𝜈 ⟶ 𝐻2 +1
2𝑂2 Δ𝐺𝑜 = 237𝑘𝐽 𝑚𝑜𝑙−1 (2.16)
The above-mentioned reaction is accompanied by a positive Gibbs Free Energy
Change. It is a thermodynamically up-hill reaction. Consequently, it may be regarded as a
sort of artificial photosynthesis process, in which photon energy is converted and stored in
the form of chemical energy.
However, de Lasa and Garcia Hernandez [136] described the photoconversion of organic
pollutants via photocatalysis as follows:
a) The electron/hole pairs react with water molecules or hydroxyl ions adsorbed on the surface
of the TiO2 producing hydroxyl radicals:
• HOHhOH adsads2 (2.17)
or
HOHOH adsads2 and adsads OHhOH • (2.18)
b) The electrons react with oxygen to form superoxide radicals. The hydrogen peroxide is formed
according to Equations as follows:
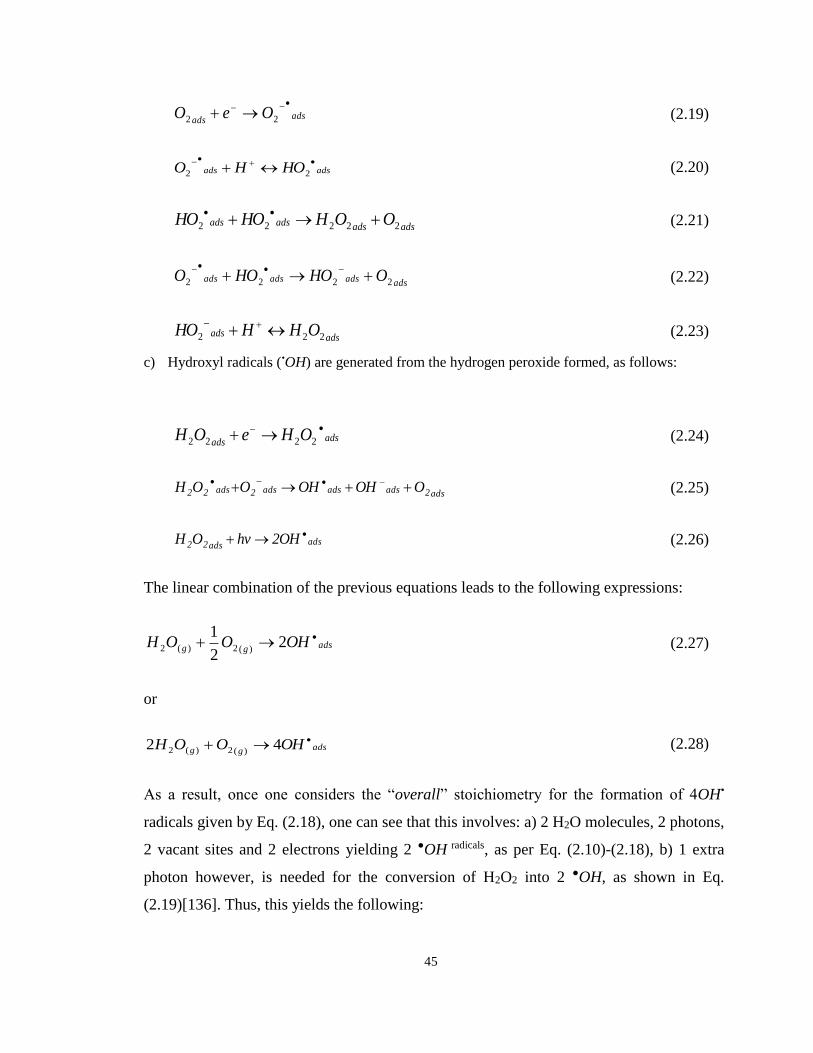
45
adsadsOeO
• 22 (2.19)
adsads HOHO•
• 22
(2.20)
adsadsadsads OOHHOHO 22222 ••
(2.21)
adsadsadsads OHOHOO 2222 ••
(2.22)
adsads OHHHO 222 (2.23)
c) Hydroxyl radicals (•OH) are generated from the hydrogen peroxide formed, as follows:
adsadsOHeOH
• 2222 (2.24)
ads2adsadsads2ads22 OOHOHOOH •• (2.25)
adsads22 OH2hvOH • (2.26)
The linear combination of the previous equations leads to the following expressions:
adsgg OHOOH • 22
1)(2)(2 (2.27)
or
adsgg OHOOH • 42)(2)(2
(2.28)
As a result, once one considers the “overall” stoichiometry for the formation of 4OH•
radicals given by Eq. (2.18), one can see that this involves: a) 2 H2O molecules, 2 photons,
2 vacant sites and 2 electrons yielding 2 ●OH radicals, as per Eq. (2.10)-(2.18), b) 1 extra
photon however, is needed for the conversion of H2O2 into 2 ●OH, as shown in Eq.
(2.19)[136]. Thus, this yields the following:
46
3 photons 4 OH• (2.29)
or a maximum quantum yield as follows:
𝑄𝑌𝑚𝑎𝑥 = 1.33 or 133% (2.30)
Thus, one can notice that the highest Quantum Yield or QYmax percentage that one can be
obtained, neglecting all possible electron-vacant site recombination is 1.33 or 133%.
In this respect, if one would like to analyze mechanisms in photocatalysis using QYs, one
should check that the QYs, do not surpass the QYmax = 1.33 upper limit, with this being in
compliance with the overall 1 vacant site -1 one electron mechanism.
It is interesting to notice that the 1.33 stoichiometric limit for QY or QYmax is an observed
constraint for the photocatalysis of organic pollutants both in air and water, as shown by
Garcia Hernandez et. al. 136].
2.4.2 Quantum Efficiencies and Quantum Yields (QY)
One of the important parameters in photocatalytic systems is the Quantum Efficiency
which allows comparing different types of photocatalysts for the same process. The
quantum efficiency of a photocatalyst is defined by the number of photo-produced or
photo-converted molecules over the number of photons absorbed by the catalyst. The
quantum efficiency for the production of hydrogen is presented below:
𝑄𝑌𝑡ℎ𝑒𝑜𝑟 =𝑚𝑜𝑙𝑒𝑠 𝑜𝑓 𝐻•
𝑚𝑜𝑙𝑒𝑠 𝑜𝑓 𝑖𝑟𝑟𝑎𝑑𝑖𝑎𝑡𝑒𝑑 𝑝ℎ𝑜𝑡𝑜𝑛𝑠
However, in hydrogen production systems, where a sacrificial agent is present, the above
definition changes, to take into account the number of ●OH radicals that are produced
simultaneously and react with the sacrificial agent.
Furthermore, a more relevant Quantum Yield for hydrogen production via water
splitting using a scavenger can be defined as follows:
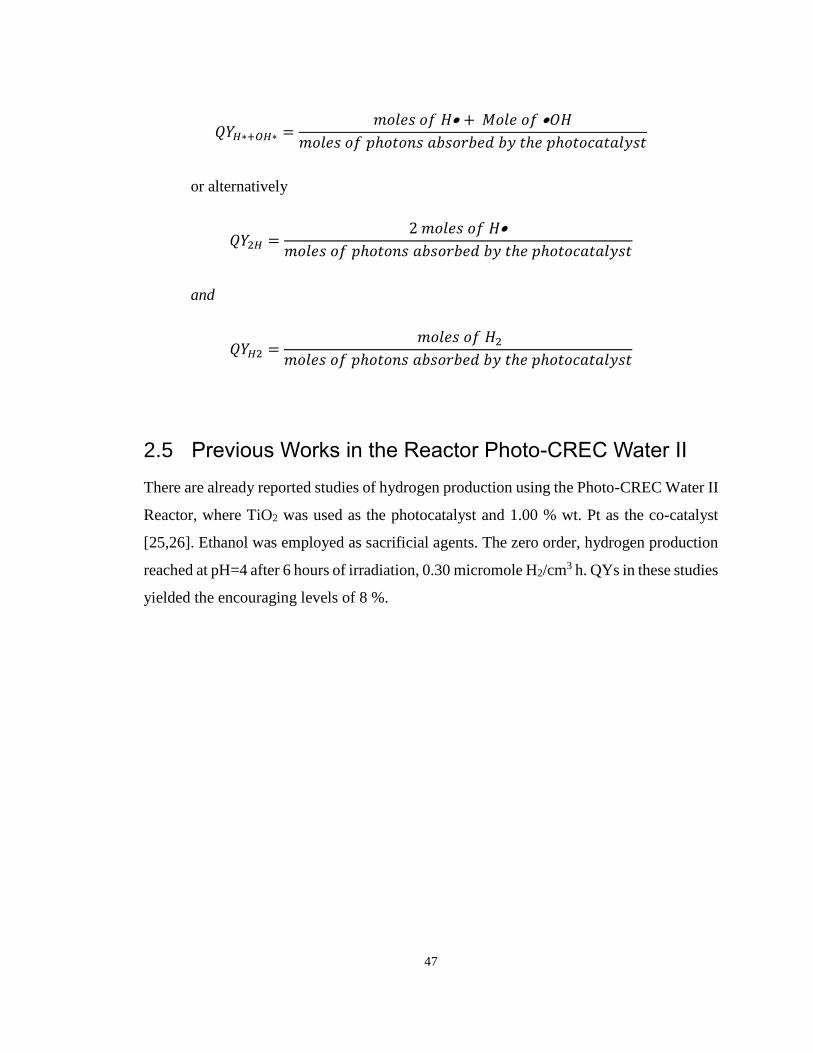
47
𝑄𝑌𝐻∗+𝑂𝐻∗ =𝑚𝑜𝑙𝑒𝑠 𝑜𝑓 𝐻• + 𝑀𝑜𝑙𝑒 𝑜𝑓 •𝑂𝐻
𝑚𝑜𝑙𝑒𝑠 𝑜𝑓 𝑝ℎ𝑜𝑡𝑜𝑛𝑠 𝑎𝑏𝑠𝑜𝑟𝑏𝑒𝑑 𝑏𝑦 𝑡ℎ𝑒 𝑝ℎ𝑜𝑡𝑜𝑐𝑎𝑡𝑎𝑙𝑦𝑠𝑡
or alternatively
𝑄𝑌2𝐻 =2 𝑚𝑜𝑙𝑒𝑠 𝑜𝑓 𝐻•
𝑚𝑜𝑙𝑒𝑠 𝑜𝑓 𝑝ℎ𝑜𝑡𝑜𝑛𝑠 𝑎𝑏𝑠𝑜𝑟𝑏𝑒𝑑 𝑏𝑦 𝑡ℎ𝑒 𝑝ℎ𝑜𝑡𝑜𝑐𝑎𝑡𝑎𝑙𝑦𝑠𝑡
and
𝑄𝑌𝐻2 = 𝑚𝑜𝑙𝑒𝑠 𝑜𝑓 𝐻2
𝑚𝑜𝑙𝑒𝑠 𝑜𝑓 𝑝ℎ𝑜𝑡𝑜𝑛𝑠 𝑎𝑏𝑠𝑜𝑟𝑏𝑒𝑑 𝑏𝑦 𝑡ℎ𝑒 𝑝ℎ𝑜𝑡𝑜𝑐𝑎𝑡𝑎𝑙𝑦𝑠𝑡
2.5 Previous Works in the Reactor Photo-CREC Water II
There are already reported studies of hydrogen production using the Photo-CREC Water II
Reactor, where TiO2 was used as the photocatalyst and 1.00 % wt. Pt as the co-catalyst
[25,26]. Ethanol was employed as sacrificial agents. The zero order, hydrogen production
reached at pH=4 after 6 hours of irradiation, 0.30 micromole H2/cm3 h. QYs in these studies
yielded the encouraging levels of 8 %.
48
2.6 Scope of thesis
Given the above reviewed research progress and the state-of-the-art in photocatalysis, it is
found that there is a need for research and development in photocatalysis, specifically in
the area of hydrogen production via water dissociation as follows:
a) New mesoporous semiconductors should be implemented via synthesis methods allowing
modification of semiconductor 's morphology, particle size and particle size distribution,
crystalline phase, composition and light absorption efficiency.
b) These TiO2 mesoporous supports should be engineered based on a soft-templating
synthesis strategy, with a significant increase of anatase content and highly dispersed Pt
co-catalyst.
c) These mesoporous semiconductors should be demonstrated for hydrogen production via
water dissociation under near-UV irradiation and using environmentally friendly scavenger
such as ethanol at low concentrations (i.e. 1.00-2.00 wt. %)
d) These mesoporous semiconductors should be tested using most advanced photocatalytic
reactors, the case of Photo-CREC-Water II Reactor, where high anticipated QYs are
rigorously established and demonstrated.
49
2.7 References
[1] Satyapal, S. (2017, October 4). The Unique Potential of Hydrogen in Energy Infrastructure,
Storage and Resiliency. Office of Energy Efficiency and Renewable Energy, Department
of Energy U.S.A. http://newscenter.lbl.gov/2017/10/06/reimagining-hydrogen-small-
molecule-large-scale-ideas/
[2] Wu MM, Shen Y, Gu F, Xie YA, Zhang JC, Wang LJ. Preparation and photoelectric
properties of mesoporous ZnO films. Journal of Sol-Gel Science and Technology
2010;53(2) 470-474.
[3] Xiong XH, Wang ZX, Wu FX, Li XH, Guo HJ. Preparation of TiO2 from ilmenite using
sulfuric acid decomposition of the titania residue combined with separation of Fe3+ with
EDTA during hydrolysis. Advanced Powder Technology 2013;24(1) 60-67.
[4] El-Hazek N, Lasheen TA, El-Sheikh R, Zaki SA. Hydrometallurgical criteria for TiO2
leaching from Rosetta ilmenite by hydrochloric acid. Hydrometallurgy 2007;87(1-2) 45-
50.
[5] Fujishima A, Honda K. Eletrochemical photolysis of water at semiconductor electrode.
Nature 1972(238) 37-38.
[6] He LF, Wang CD, Yao XL, Ma RG, Wang HK, Chen PR, et al. Synthesis of carbon
nanotube/mesoporous TiO2 coaxial nanocables with enhanced lithium ion battery
performance. Carbon 2014;75 345-352.
[7] Hu LY, Wang JY, Zhang JX, Zhang QY, Liu ZH. An N-doped anatase/rutile TiO2 hybrid
from low-temperature direct nitridization: enhanced photoactivity under UV-/visible-light.
Rsc Advances 2014;4(1) 420-427.
50
[8] Lan X, Wang LZ, Zhang BY, Tian BZ, Zhang JL. Preparation of lanthanum and boron co-
doped TiO2 by modified sol-gel method and study their photocatalytic activity. Catalysis
Today 2014;224 163-170.
[9] Liu GQ, Liu LC, Song JR, Liang JD, Luo QZ, Wang DS. Visible light photocatalytic
activity of TiO2 nanoparticles hybridized by conjugated derivative of polybutadiene.
Superlattices and Microstructures 2014;69 164-174.
[10] Neubert S, Ramakrishnan A, Strunk J, Shi HY, Mei B, Wang LD, et al. Surface-Modified
TiO2 Photocatalysts Prepared by a Photosynthetic Route: Mechanism, Enhancement, and
Limits. Chempluschem 2014;79(1) 163-170.
[11] A. E. H. Machado, A. O. T. Patrocinio, M. D. França, L. M. Santos, K. A. Borges, L. F.
Paula. Metal oxides for photoinduced hydrogen production and dye-sensitized solar cell
applications. In: Méndez-Vilas A. (ed.) Materials and processes for energy:
communicating current research and technological developments. Badajoz: Formatex;
2013. 867-879.
[12] A. E. H. Machado, L. M. Santos, K. A. Borges, P. S. Batista, V. A. B. Paiva, P. S. Müller
Jr., et al. Potential Applications for Solar Photocatalysis: From Environmental
Remediation to Energy Conversion. In: Babatunde E. B. (ed.) Solar Radiation. Rijeka: In‐
Tech; 2012. 339-378.
[13] F. Sordello, V. Maurino, C. Minero. Improved photochemistry of TiO2 inverse opals and
some examples. In: Saha S (ed.) Molecular Photochemistry-Various Aspects. Rijeka:
InTech; 2012. 63-87.
[14] M. Valenzuela. Photocatalytic deposition of metal oxides on semiconductor particles: a
review. In: Saha S (ed.) Molecular Photochemistry-Various Aspects. Rijeka: InTech; 2012.
25-41.
51
[15] Jaroenworaluck A, Pijarn N, Kosachan N, Stevens R. Nanocomposite TiO2-SiO2 gel for
UV absorption. Chemical Engineering Journal 2012;181 45-55.
[16] Affam AC, Chaudhuri M. Degradation of pesticides chlorpyrifos, cypermethrin and
chlorothalonil in aqueous solution by TiO2 photocatalysis Journal of Environmental
Management 2013;130 160-165.
[17] Hirakawa T, Sato K, Komano A, Kishi S, Nishimoto CK, Mera N. Specific properties on
TiO2 photocatalysis to decompose isopropyl methylphosphonofluoridate and dimethyl
methylphosphonate in Gas Phase. Journal of Photochemistry and Photobiology a-
Chemistry 2013;264 12-17.
[18] Chen JW, Shi JW, Wang X, Ai HY, Cui HJ, Fu ML. Hybrid metal oxides quantum
dots/TiO2 block composites: Facile synthesis and photocatalysis application. Powder
Technology 2013;246 108 116.
[19] A. Eremenko, N. Smirnova, I. Gnatiuk, O. Linnik, N. Vityuk, Y. Mukha. Silver and gold
nanoparticles on sol-gel TiO2, ZrO2, SiO2 surfaces: optical spectra, photocatalytic activity,
bactericide properties. In: Cuppoletti J (ed.) Nanocomposites and Polymers with Analytical
Methods. Rijeka: InTech; 2011. 51-83.
[20] V. S. Viteri, E. Fuentes. Titanium and Titanium Alloys as Biomaterials. In: Gegner J (ed.)
Tribology-Fundamentals and Advancements. Rijeka: InTech; 2013. 155-181.
[21] Grcic I, Vujevic D, Zizek K, Koprivanac N. Treatment of organic pollutants in water using
TiO2 powders: photocatalysis versus sonocatalysis. Reaction Kinetics Mechanisms and
Catalysis 2013;109(2) 335-354.
[22] Machado AEH, França MD, Velani V, Magnino GA, Velani HMM, Freitas FS.
Characterization and evaluation of the efficiency of TiO2/zinc phthalocyanine nano‐ Solar
52
Radiation Applications composites as photocatalysts for wastewater treatment using solar
irradiation. International Journal of Photoenergy 2008; 2008.
[23] Fujishima A, Honda K. Electrochemical Photolysis of Water at a Semiconductor
Electrode. Nature 1972;238(5358) 37
[24] Gao P, Sun DD. Hierarchical sulfonated graphene oxide-TiO2 composites for highly
efficient hydrogen production with a wide pH range. Applied Catalysis B-Environmental
2014;147 888-896.
[25] Escobedo-Salas, S.; Serrano-Rosales B., de Lasa, H. Quantum Yield with Platinum
Modified TiO2 Photocatalyst for Hydrogen Production. Applied Catalysis-B;
Environmental. 2013; 140 523-536.
[26] Escobedo, S.; Serrano, B.; Calzada, A.; Moreira, J.; de Lasa, H. Hydrogen production
using a platinum modified TiO2 photocatalyst and an organic scavenger. Kinetic modeling.
Fuel; 2016; 181 438-449.
[27] Guayaquil-Sosa, J.F.; Serrano-Rosales, B.; Valadés-Pelayo, P.J.; de Lasa, H.
Photocatalytic hydrogen production using mesoporous TiO2 doped with Pt. Applied
Catalysis-B; Environmental. 2017; 211 337-348.
[28] Guayaquil-Sosa, J.F.; Calzada, A.; Serrano, B.; Escobedo, S.; de Lasa, H. Hydrogen
Production via Water Dissociation Using Pt–TiO2 Photocatalysts: An Oxidation–
Reduction Network. Catalysts; 2017; 7 324.
[29] Hagfeldt A., Gratzel M. Light-Induced Redox Reactions in Nanocrystalline Systems.
Chemical Reviews 1995;9549-68.
[30] Hagfeldt A, Gratzel M. Molecular photovoltaics. Accounts Chemistry Reserarch 2000(33)
269-277.
53
[31] Peter LM. Dye-sensitized nanocristalline solar cells. Physical Chemistry Chemical
Physics 2007;9 2630-2642.
[32] Fujishima A, Honda K. Electrochemical Photolysis of Water at a Semiconductor Elec‐
trode. Nature 1972;238(5358) 37-+. DOI: 10.1038/238037a0.
[33] Melian E.P, Suarez MN, Jardiel T, Rodriguez JMD, Caballero AC, Arana J, et al. Influ‐
ence of nickel in the hydrogen production activity of TiO2. Applied Catalysis B-
Environmental 2014;152 192-201. DOI: 10.1016/j.apcatb.2014.01.039.
[34] Mendez J.A.O., Lopez C.R., Melian E.P., Diaz OG, Rodriguez J.M.D, Hevia D.F., et al.
Pro‐ duction of hydrogen by water photo-splitting over commercial and synthesised
Au/TiO2 catalysts. Applied Catalysis B-Environmental 2014;147 439-452. DOI:
10.1016/j.apcatb.2013.09.029.
[35] Paula LF, Amaral RC, Iha NYM, Paniago RM, Machado AEH, Patrocinio AOT. New
layer-by-layer Nb2O5-TiO2 film as an effective underlayer in dye-sensitised solar cells.
RSC Advances 2014;4(20) 10310-10316.
[36] Kudo A. and Miseki Y. Heterogeneous photocatalyst materials for water splitting. Chem. Soc.
Rev., 2009;(8), 253–278
[37] Kumar N, Maitra U, Hegde VI, Waghmare UV, Sundaresan A, Rao CNR. Synthesis,
Characterization, Photocatalysis, and Varied Properties of TiO2 Co-substituted with
Nitrogen and Fluorine. Inorganic Chemistry 2013;52(18) 10512-10519.
[38] Gupta SK, Singh J, Anbalagan K, Kothari P, Bhatia RR, Mishra PK. Synthesis, phase to
phase deposition and characterization of rutile nanocrystalline titanium dioxide (TiO2)
thin films. Applied Surface Science 2013;264 737-742.
54
[39] Ji YF, Zhou L, Ferronato C, Salvador A, Yang X, Chovelon JM. Degradation of sunscreen
agent 2-phenylbenzimidazole-5-sulfonic acid by TiO2 photocatalysis: Kinetics,
photoproducts and comparison to structurally related compounds. Applied Catalysis B-
Environmental 2013;140 457-467.
[40] Kim DS, Kwak SY. The hydrothermal synthesis of mesoporous TiO2 with high
crystallinity, thermal stability, large surface area, and enhanced photocatalytic activity.
Applied Catalysis a General 2007;323 110-118.
[41] Hidalgo D, Messina R, Sacco A, Manfredi D, Vankova S, Garrone E. Thick mesoporous
TiO2 films through a sol–gel method involving a non-ionic surfactant: Characterization
and enhanced performance for water photo-electrolysis. International Journal of
Hydrogen Energy 2014.
[42] Sanchez-Quiles D, Tovar-Sanchez A. Sunscreens as a source of hydrogen peroxide
production in coastal waters. Environmental Science & Technology 2014;48(16) 9037-
9042.
[43] Xi BJ, Chu XN, Hu JY, Bhatia CS, Danner AJ, Yang H. Preparation of Ag/TiO2/SiO2
films via photo-assisted deposition and adsorptive self-assembly for catalytic bactericidal
application. Applied Surface Science 2014;311 582-592.
[44] Yeh SW, Ko HH, Chiang HM, Chen YL, Lee JH, Wen CM. Characteristics and properties
of a novel in situ method of synthesizing mesoporous TiO2 nanopowders by a simple
coprecipitation process without adding surfactant. Journal of Alloys and Compounds
2014;613 107-116.
[45] Wang ZY, Yao N, Hu X. Single material TiO2 double layers antireflection coating with
photocatalytic property prepared by magnetron sputtering technique. Vacuum 2014;108
20-26.
55
[46] Zhaoyong Wang, Ning Yao, Xing Hu, Xinwei Shi, Structural and photocatalytic study of
titanium dioxide films deposited by DC sputtering, In Materials Science in
Semiconductor Processing. 2014;21 91-97.
[47] Chen KC, Wang YH. The effects of Fe-Mn oxide and TiO2/alpha-Al2O3 on the formation
of disinfection by-products in catalytic ozonation. Chemical Engineering Journal
2014;253 84-92.
[48] A. Oliveira, E. M. Saggioro, T. Pavesi, J. C. Moreira, L. F. V. Ferreira. Solar
photochemistry for environmental remediation-advanced oxidation processes for
industrial wastewater treatment. In: Saha S (ed.) Molecular Photochemistry-Various
Aspects. Rijeka: InTech; 2012. 195-223.
[49] Wu MM, Shen Y, Gu F, Xie YA, Zhang JC, Wang LJ. Preparation and photoelectric
properties of mesoporous ZnO films. Journal of Sol-Gel Science and Technology
2010;53(2) 470-474.
[50] Xiong XH, Wang ZX, Wu FX, Li XH, Guo HJ. Preparation of TiO2 from ilmenite using
sulfuric acid decomposition of the titania residue combined with separation of Fe3+ with
EDTA during hydrolysis. Advanced Powder Technology 2013;24(1) 60-67.
[51] Sasikumar C, Rao DS, Srikanth S, Ravikumar B, Mukhopadhyay NK, Mehrotra SP. Effect
of mechanical activation on the kinetics of sulfuric acid leaching of beach sand ilmenite
from Orissa, India. Hydrometallurgy 2004;75(1-4) 189-204.
[52] El-Hazek N, Lasheen TA, El-Sheikh R, Zaki SA. Hydrometallurgical criteria for TiO2
leaching from Rosetta ilmenite by hydrochloric acid. Hydrometallurgy 2007;87(1-2) 45-
50.
[53] Sanchez-Quiles D, Tovar-Sanchez A. Sunscreens as a source of hydrogen peroxide
production in coastal waters. Environmental Science & Technology 2014;48(16) 9037-
9042.
56
[54] Hu LY, Wang JY, Zhang JX, Zhang QY, Liu ZH. An N-doped anatase/rutile TiO2 hybrid
from low-temperature direct nitridization: enhanced photoactivity under UV-/visible-
light. RSC Advances 2014;4(1) 420-427.
[55] Machado AEH, França MD, Velani V, Magnino GA, Velani HMM, Freitas FS.
Characterization and evaluation of the efficiency of TiO2/zinc phthalocyanine nano‐Solar
Radiation Applications.
[56] Gao P, Sun DD. Hierarchical sulfonated graphene oxide-TiO2 composites for highly
efficient hydrogen production with a wide pH range. Applied Catalysis B-Environmental
2014;147 888-896.
[57] Melian EP, Suarez MN, Jardiel T, Rodriguez JMD, Caballero AC, Arana J. Influence of
nickel in the hydrogen production activity of TiO2. Applied Catalysis B-Environmental
2014;152 192-201. DOI: 10.1016/j.apcatb.2014.01.039.
[58] Mendez JAO, Lopez CR, Melian EP, Diaz OG, Rodriguez JMD, Hevia DF. Production
of hydrogen by water photo-splitting over commercial and synthesised Au/TiO2
catalysts. Applied Catalysis B-Environmental 2014;147 439-452.
[59] Taboada E, Angurell I, Llorca J. Dynamic photocatalytic hydrogen production from
ethanol-water mixtures in an optical fiber honeycomb reactor loaded with Au/TiO2.
Journal of Catalysis 2014;309 460-467.
[60] Wu ZF, Zhang WH, Xiong F, Yuan Q, Jin YK, Yang JL. Active hydrogen species on TiO2
for photocatalytic H2 production. Physical Chemistry Chemical Physics 2014;16(15)
7051-7057.
57
[61] Idigoras J, Berger T, Anta JA. Modification of Mesoporous TiO2 Films by
Electrochemical Doping: Impact on Photoelectrocatalytic and Photovoltaic Performance.
Journal of Physical Chemistry C 2013;117(4) 1561-1570.
[62] Higashijima S, Miura H, Fujita T, Kubota Y, Funabiki K, Yoshida T. Highly efficient new
indoline dye having strong electron-withdrawing group for zinc oxide dye-sensitized
solar cell. Tetrahedron 2011;67(43) 8421-8421.
[63] Jayaweera PVV, Perera AGU, Tennakone K. Why Gratzel`s cells works so well.
Inorganica Chimica Acta 2008(361) 707-711.
[64] Park SH, Roy A, Beaupré S, Cho S, Coates N, Moon JS. Bulk heterojunction solar cells
with internal quantum efficiency approaching 100%. Nature Photonics 2009;3 297-302.
[65] Gratzel M. Solar energy conversion by dye-sensitized photovoltaic cells. Inorganic
Chemistry 2005;44(20) 6841-6851.
[66] O'Regan B, Grätzel M. A Low-Cost, High-Efficiency Solar-Cell Based on Dye-Sensitized
Colloidal TiO2 Films. Nature 1991;353(6346) 737-740.
[67] Gratzel M. Photoelectrochemical cells. Nature 2001;414(6861) 338-344.
[68] Chiba Y, Islam A, Watanabe Y, Komiya R, Koide N, Han LY. Dye-sensitized solar cells
with conversion efficiency of 11.1%. Japanese Journal of Applied Physics, Part 2: Letters
& Express Letters 2006;45(24-28).
[69] Kroon JM, Bakker NJ, Smit HJP, Liska P, Thampi KR, Wang P. Nanocrystalline dye-
sensitized solar cells having maximum performance. Progress in Photovoltaics
2007;15(1) 1-18.
58
[70] Kalyanasundaram K, Gratzel M. Applications of functionalized transition metal
complexes in photonic and optoelectronic devices. Coordination Chemistry Reviews
1998;177 347-414.
[71] Davis ME. Ordered porous materials for emerging applications. Nature 2002;417(6891)
813-821.
[72] Zheng XL, Kuang Q, Yan KY, Qiu YC, Qiu JH, Yang SH. Mesoporous TiO2 Single
Crystals: Facile Shape-, Size-, and Phase-Controlled Growth and Efficient Photocatalytic
Performance. Applied Materials & Interfaces 2013;5(21) 11249-11257.
[73] Kim DS, Han SJ, Kwak SY. Synthesis and photocatalytic activity of mesoporous TiO2
with the surface area, crystallite size, and pore size. Journal of Colloid and Interface
Science 2007;316(1) 85-91.
[74] Blin JL, Stebe MJ, Roques-Carmes T. Use of ordered mesoporous titania with
semicrystalline framework as photocatalyst. Colloids and Surfaces a-Physicochemical
and Engineering Aspects 2012;407 177-185.
[75] Li W, Wu ZX, Wang JX, Elzatahry AA, Zhao DY. A Perspective on Mesoporous TiO2
Materials. Chemistry of Materials 2014;26(1) 287-298.
[76] Crossland EJW, Noel N, Sivaram V, Leijtens T, Alexander-Webber JA, Snaith HJ.
Mesoporous TiO2 single crystals delivering enhanced mobility and optoelectronic device
performance. Nature 2013;495(7440) 215-219. DOI: 10.1038/Nature11936.
[77] Herrero C, Quaranta A, Leibl W, Rutherford AW, Aukauloo A. Artificial photosynthetic
systems. Using light and water to provide electrons and protons for the synthesis of a
fuel. Energy & Environmental Science 2011;4(7) 2353-2365.
59
[78] Lee ES, Lee KM, Yoon SI, Ko YG, Shin DH. Influence of CNT incorporation on the
photovoltaic behavior of TiO2 films formed by high-voltage electrophoretic deposition.
Current Applied Physics 2013;13 526-529.
[79] Kondo JN, Domen K. Crystallization of mesoporous metal oxides. Chemistry of Materials
2008;20(3) 835-847.
[80] Ferreira OP, Alves OL, Macedo JD, Gimenez ID, Barreto LS. Ecomaterials: Development
and application of functional porous materials for environmental protection. Química
Nova 2007;30(2) 464-467.
[81] Guo SY, Han S, Chi B, Pu J, Li J. Synthesis of shape-controlled mesoporous titanium
phosphate nanocrystals: The hexagonal titanium phosphate with enhanced hydrogen
generation from water splitting. International Journal of Hydrogen Energy 2014;39(6)
2446-2453.
[82] Kao LH, Hsu TC, Cheng KK. Novel synthesis of high-surface-area ordered mesoporous
TiO2 with anatase framework for photocatalytic applications. Journal of Colloid and
Interface Science 2010;341(2) 359-365.
[83] Yang H, Coombs N, Sokolov I, Ozin GA. Free-standing and oriented mesoporous silica
films grown at the air-water interface. Nature 1996;381(6583) 589-592. DOI:
10.1038/381589a0.
[84] Li W, Wu ZX, Wang JX, Elzatahry AA, Zhao DY. A Perspective on Mesoporous TiO2
Materials. Chemistry of Materials 2014;26(1) 287-298.
[85] Kandiel TA, Ivanova I, Bahnemann DW. Long-term investigation of the photocatalytic
hydrogen production on platinized TiO2: an isotopic study. Energy & Environmental
Science 2014;7(4) 1420-1425.
60
[86] Rungjaroentawon N, Onsuratoom S, Chavadej S. Hydrogen production from water
splitting under visible light irradiation using sensitized mesoporous-assembled TiO2-
Applications of Mesoporous Ordered Semiconductor Materials — Case Study of TiO2
SiO2 mixed oxide photocatalysts. International Journal of Hydrogen Energy 2012;37(15)
11061-11071.
[87] Taffa DH, Kathiresan M, Arnold T, Walder L, Erbacher M, Bauer D. Dye sensitized
membranes within mesoporous TiO2 Photocurrents in aqueous solution. Journal of
Photochemistry and Photobiology a-Chemistry 2010;216(1) 35-43.
[88] Tan HQ, Zhao Z, Niu M, Mao CY, Cao DP, Cheng DJ. A facile and versatile method for
preparation of colored TiO2 with enhanced solar-driven photocatalytic activity.
Nanoscale 2014;6(17) 10216-10223.
[89] Zhang RY, Elzatahry AA, Al-Deyab SS, Zhao DY. Mesoporous titania: From synthesis
to application. Nano Today 2012;7(4) 344-366.
[90] Zhou XF, Lu J, Jiang JJ, Li XB, Lu MN, Yuan GT. Simple fabrication of N-doped
mesoporous TiO2 nanorods with the enhanced visible light photocatalytic activity.
Nanoscale Research Letters 2014;9 DOI: 10.1186/1556-276x-9-34.
[91] Pal N, Bhaumik A. Soft templating strategies for the synthesis of mesoporous materials:
Inorganic, organic-inorganic hybrid and purely organic solids. Advances in Colloid and
Interface Science 2013;189 21-41.
[92] Abdel-Azim SM, Aboul-Gheit AK, Ahmed SM, El-Desouki DS, Abdel-Mottaleb MSA.
Preparation and Application of Mesoporous Nanotitania Photocatalysts Using Different
Templates and pH Media. International Journal of Photoenergy 2014;2014.
61
[93] Song HJ, Chen T, Sun YL, Zhang XQ, Jia XH. Controlled synthesis of porous flowerlike
TiO2 nanostructure with enhanced photocatalytic activity. Ceramics International
2014;40(7) 11015-11022.
[94] Patrocinio A. O. T., El-Bachá A. S., Paniago E. B., Paniago R. M., and Murakami Iha N.
Y., Influence of the Sol-Gel pH Process and Compact Film on the Efficiency of -Based
Dye-Sensitized Solar Cells. International Journal of Photoenergy, 2012;2012 (7)
doi:10.1155/2012/638571
[95] Kim DS, Kwak SY. The hydrothermal synthesis of mesoporous TiO2 with high
crystallinity, thermal stability, large surface area, and enhanced photocatalytic activity.
Applied Catalysis A-General 2007;323 110-118.
[96] Niederberger M, Garnweitner G, Buha J, Polleux J, Ba JH, Pinna N. Non-aqueous
synthesis of metal oxide nanoparticles: Review and indium oxide as case study for the
dependence of particle morphology on precursors and solvents. Journal of Sol-Gel
Science and Technology 2006;40(2-3) 259-266.
[97] Ribeiro C, Malagutti, A. R., Mendonça, V. R. E Mourão, A. J. L. Nanostructures in
Photocatalysis: A review on strategies of photocatalysts’ synthesis for nanometric scale.
Química Nova 2009;32(8).
[98] Muniz EC, Goes MS, Silva JJ, Varela JA, Joanni E, Parra R. Synthesis and
characterization of mesoporous TiO2 nanostructured films prepared by a modified sol-
gel method for application in dye solar cells. Ceramics International 2011;37(3) 1017-
1024.
[99] Yang XH, Fu HT, Yu AB, Jiang XC. Large-surface mesoporous TiO2 nanoparticles:
Synthesis, growth and photocatalytic performance. Journal of Colloid and Interface
Science 2012;38 774-783.
62
[100] Mahoney L, Koodali RT. Versatility of evaporation-induced self-assembly (EISA)
method for preparation of mesoporous TiO2 for energy and environmental applications.
Materials 2014;7(4) 2697-2746.
[101] Arconada N, Castro Y, Duran A, Hequet V. Photocatalytic oxidation of methyl ethyl
ketones over sol-gel mesoporous and meso-structured TiO2 films obtained by EISA
method. Applied Catalysis B-Environmental 2011;107(1-2) 52-58.
[102] Ouyang J, Li XY, Jin J, Yang HM, Tang AD. Surface status and reduction behavior of
porous ceria (CeO2) via amended EISA method. Journal of Alloys and Compounds
2014;606 236-241.
[103] Beck, J.S.; Calabro, D.C.; McCullen, S.B.; Pelrine, B.P.; Schmitt, K.D.; Vartuli, J.C.
Method for Functionalizing Synthetic Mesoporous Crystalline Material. U.S. Patent
2,069,722, 27 May 1992.
[104] Badawy MI, Ghaly MY, Ali MEM. Photocatalytic hydrogen production over
nanostructured mesoporous titania from olive mill wastewater. Desalination
2011;267(2-3) 250-255.
[105] Bian YR, Wang XH, Hu ZY. Synthesis of mesoporous titania thin films by a simple
route at low-temperature via plasma treatment. Journal of Materials Science
2013;48(11) 4088-4096.
[106] Zhou W, Li W, Wang JQ, Qu Y, Yang Y, Xie Y. Ordered Mesoporous Black TiO2 as
Highly Efficient Hydrogen Evolution Photocatalyst. Journal of the American Chemical
Society 2014;136(26) 9280-9283.
[107] Xiang P, Li X, Wang H, Liu GH, Shu T, Zhou ZM. Mesoporous nitrogen-doped TiO2
sphere applied for quasi-solid-state dye-sensitized solar cell. Nanoscale Research
Letters 2011;6.
63
[108] Wu ZY, Tao YF, Lin Z, Liu L, Fan XX, Wang Y. Hydrothermal Synthesis and
Morphological Evolution of Mesoporous Titania-Silica. Journal of Physical Chemistry
C 2009;113(47) 20335-20348.
[109] Wen ZH, Wu W, Liu Z, Zhang H, Li JH, Chen JH. Ultrahigh-efficiency photocatalysts
based on mesoporous Pt-WO3 nanohybrids. Physical Chemistry Chemical Physics
2013;15(18) 6773-6778.
[110] Wang YZ, Zhu SP, Chen XR, Tang YG, Jiang YF, Peng ZG. One-step template free
fabrication of mesoporous ZnO/TiO2 hollow microspheres with enhanced
photocatalytic activity. Applied Surface Science 2014;307 263-271.
[111] Shamaila S, Khan A, Sajjad L, Chen F, Zhang JL. Mesoporous titania with high
crystallinity during synthesis by dual template system as an efficient photocatalyst.
Catalysis Today 2011;175(1) 568-575.
[112] Antonelli DM, Ying JY. Synthesis of Hexagonally Packed Mesoporous TiO2 by a
Modified Sol-Gel Method. Angewandte Chemie-International Edition in English
1995;34(18) 2014-2017.
[113] Joo JB, Lee I, Dahl M, Moon GD, Zaera F, Yin YD. Controllable Synthesis of
Mesoporous TiO2 Hollow Shells: Toward an Efficient Photocatalyst. Advanced
Functional Materials 2013;23(34) 4246-4254.
[114] Lopez A, Acosta D, Martinez AI, Santiago J. Nanostructured low crystallized titanium
dioxide thin films with good photocatalytic activity. Powder Technology 2010;202(1-
3) 111-117.
[115] Ramasamy E, Jo C, Anthonysamy A, Jeong I, Kim JK, Lee J. Soft-template simple
synthesis of ordered mesoporous titanium nitride-carbon nanocomposite for high
64
performance dye-sensitized solar cell counter electrodes. Chemistry of Materials
2012;24(9) 1575-1582.
[116] Tran TH, Nosaka AY, Nosaka Y. Adsorption and decomposition of a dipeptide in TiO2
photocatalytic systems. Journal of Photochemistry and Photobiology a-Chemistry
2007;192(2-3) 105-113.
[117] Lu YF, Fan HY, Stump A, Ward TL, Rieker T, Brinker CJ. Aerosol-assisted self-
assembly of mesostructured spherical nanoparticles. Nature 1999;398(6724) 223-226.
[118] Yang H, Coombs N, Sokolov I, Ozin GA. Free-standing and oriented mesoporous silica
films grown at the air-water interface. Nature 1996;381(6583) 589-592.
[119] Gao J, Li HR, Rong H, Dai YH. Large pore nanocrystalline TiO2 films for quasi-solid
state dye-sensitized solar cells. Nanotechnology and Precision Engineering, Pts 1 and 2
2013;662 177-181.
[120] Wang Y, Jiang ZH, Yang FJ. Preparation and photocatalytic activity of mesoporous TiO2
derived from hydrolysis condensation with TX-100 as template. Materials Science and
Engineering B-Solid State Materials for Advanced Technology 2006;128(1-3) 229-233.
[121] Rodriguez-Abreu C, Vilanova N, Solans C, Ujihara M, Imae T, Lopez-Quintela A. A
combination of hard and soft templating for the fabrication of silica hollow microcoils
with nanostructured walls. Nanoscale Research Letters 2011;6.
[122] Hu CY, Xu YJ, Duo SW, Li WK, Xiang JH, Li MS. Preparation of Inorganic Hollow
Spheres Based on Different Methods. Journal of the Chinese Chemical Society
2010;57(5A) 1091-1098.
65
[123] Tang H, Zhang D, Tang GG, Ji XR, Li CS, Yan XH. Low temperature synthesis and
photocatalytic properties of mesoporous TiO2 Nano spheres. Journal of Alloys and
Compounds 2014;591 52-57.
[124] Chen JF, Hua ZJ, Yan YS, Zakhidov AA, Baughman RH, Xu LB. Template synthesis of
ordered arrays of mesoporous titania spheres. Chemical Communications 2010;46(11)
1872-1874.
[125] Ibrahim, H.; de Lasa, H. Photo-catalytic degradation of air borne pollutants. Apparent
quantum efficiencies in a novel photo-CREC-air reactor. Chem. Eng. Sci. 58 (2003)
943-949.
[126] de Lasa, H.; Serrano, B.; Salaices, M. Photocatalytic Reaction Engineering, First Ed.,
Springer: New York, 2005.
[127] Cassano, A., Martin, C., Brandi, R., and Alfano, Photoreactor analysis and design:
Fundamentals and applications, Ind. and Eng. Chem. Res., 34 (1995) 2155-2201.
[128] Davydov, L., Srairniotis, G., and Pratsinis, E., Novel differential reactor for the
measurement of overall quantum yields, Ind. and Eng. Chem. Res., 38 (1999) 1375-
1383.
[129] Peil, N., and Hoffmann, M., Development and optimization of a TiO2 coated fiber optic
cable reactor: Photocatalytic degradation of 4-chlorophenol, Environ. Sci. and Tech.
29 (1995) 2974-2981.
[130] Valladares, J., and Bolton, J., A method for the determination of quantum yields in
heterogeneous systems: The titanium dioxide photocatalyzed bleaching of methylene
blue. Trace Metals in the Environment, 3 (1993) 111-120.
[131] Yamazaki-Nishida, S., Read, H., Nagano, J., Jarosch, T., Eddy, C., Cervera-March, S.,
66
and Anderson, M., Gas phase photocatalytic degradation on TiO2 pellets of volatile
chlorinated compounds from a soil vapor extraction well. J. Soil Contam., 3 (1994)
363–378.
[132] Fox, M. and Dulay, M., Heterogeneous photocatalysis, Chem. Rev., 93 (1933) 341–
357.
[133] Nimlos, M., Jacoby, W., Blake, D., and Milne T., Direct mass spectrometric studies of
the destruction of hazardous wastes. 2. Gas phase photocatalytic oxidation of
trichloroethylene over TiO2: Products and mechanisms, Environ. Sci. and Tech., 27
(1993) 732–740.
[134] Sczechowski, J., Koval, C., and Noble, R., A Taylor vortex reactor for heterogeneous
photocatalysis, Chem. Eng. Sci., 50 (1995) 3163–3173.
[135] Zhang, Y., Crittenden, J., and Hand, D., 1994a, The solar photocatalytic
decontamination of water, Chem. and Ind., 18 (1994) 714–717.
[136] Garcia Hernandez J.M., Serrano Rosales B. and de Lasa Hugo, The photochemical
thermodynamic efficiency factor (PTEF) in photocatalytic reactors for air treatment,
In Chemical Engineering Journal, 165 (2010) 891-901.
67
Chapter 3
3 Synthesis of Mesoporous Pt Doped TiO2 with Block Co-polymers Pluronic P123 and Pluronic F127 as Templates for Photocatalytic Hydrogen Generation.
3.1 Introduction
Titanium dioxide (TiO2) has outstanding optical, semiconductor and chemical properties.
Due to this, in the near future, TiO2 is expected to play an increasingly significant role in
photocatalysis, chemical sensors, electrochromic devices, solar cells and in other fields.
TiO2 can be directly used as a photocatalyst under ultraviolet irradiation. In this case, the
photons from the light source interact with the TiO2 making possible the elimination of
organic pollutants in air and in water and contributing to hydrogen generation.
Among current synthesis methods, the sol-gel method is very suitable to produce
nanomaterials. This method can be implemented under ambient conditions and does not
require complex configurations and synthesis procedures. The sol-gel synthesis is based on
the hydrolysis/condensation of a titanium precursor to produce a sol and then a gel. After
solvent evaporation, a xerogel is obtained, which is milled and heat treated to produce a
highly crystalline TiO2 mesoporous material. It is important to state that titanium dioxide
with a mesoporous structure has gained great interest in recent years, due to its large surface
area, as well as its higher adsorption capacity and higher catalytic activity than the more
conventional non-porous TiO2 [1-7].
It is well known that by increasing the available specific surface area of a TiO2
photocatalyst, one can promote the adsorption and diffusion of reactants which leads to an
enhanced photocatalytic performance. To increase the active surface area, pore formers are
usually added to the sol-gel synthesis. As discussed in Chapter 2, hard- and soft-templating
syntheses have been widely reported in the literature to produce porous arrays. In fact,
hard-templates are attractive because a high degree of self-organization can be obtained.
This can be done, for instance, with inverse opals by using templating nanoparticles (i.e.,
silica or polystyrene particles) [8-10].
68
Nevertheless, the hard-template technique requires the synthesis of nanoparticles which is
not cost effective. Instead, the soft-template synthesis using polymers is relatively simple
and does not require the complex synthesis used in the hard-template procedure. In the
soft-template synthesis, a polymeric precursor is added to the sol. The porosity is created
by removing the polymeric chains using high temperature annealing to form mesoporous
anatase or rutile particles. Hence, as reported in the literature, polymeric precursors have
been employed to increase the photocatalytic activity of TiO2 nanoparticles. These are:
P123 and F127. P123 or similar non-ionic surfactants, display low periodicity (ordering)
of the pores. In this regard, improvements in pore ordering have been achieved using these
non-ionic surfactants.
The templates in the syntheses of mesoporous TiO2 can be anionic surfactants, cationic
surfactants or non-ionic surfactants. These templates have strong electrostatic interactions
between ionic surfactants and inorganic species. Calcinations at high temperatures are
needed to remove the templates. However, this process can result in a collapse of the pore
structure. Both the block copolymers P123 and F127 have been used as templates for the
syntheses of mesoporous silica and titania. Due to the small binding force between the
inorganic species and the general non-ionic surfactants, it is still challenging to produce
ordered mesoporous TiO2.
In the synthesis of mesoporous TiO2, when using P123 and F127, a low acidity tends to
form anatase, whereas a high acidity forms rutile phases. Citric acid functionalizes the
surface of the hydrophilic titania nanoparticles and enhances the binding of these particles
to the ethylene oxide units of F127. P123 and F127 molecules bind to the surface of titania
nanoparticles and prevent collapse of pores. They also prevent the transformation of
anatase to rutile, despite the use of calcination temperatures as high as 700 °C.
In this chapter, the ordered and pure TiO2 mesoporous materials were synthesized by sol-
gel method using P123 and F127 as templates. The influence of the various factors on the
syntheses of the ordered mesoporous catalysts are discussed in detail.
69
3.2 Experimental
The triblock co-polymer surfactants, poly(ethylene oxide)-poly(propylene oxide)-poly
(ethylene oxide), (–CH2CH2O-)106-(CH2(CH3)CHO)-70(-CH2CH2O-)106, (Pluronic F127,
MAVG =12600, Sigma Aldrich) and (–CH2CH2O-)20-(CH2(CH3)CHO)-70(-CH2CH2O-)20
(Pluronic P123, MAVG =5800, Sigma Aldrich) were used as soft-templates. These soft-
templates help in the sol-gel synthesis method, directing the structure reagents in the
mesoporous TiO2 synthesis. Hydrochloric acid of 37% purity, citric acid and titanium (IV)
isopropoxide (Ti(OC3H7)4, Sigma Aldrich), were employed as co-reactants.
For the synthesis of mesoporous TiO2, 400 mL of ethanol (CH3CH2OH) from Commercial
Alcohols company were acidified using 33.00 g of hydrochloric acid (37 wt. % purity,
Sigma Aldrich). After combining these reagents, 20.00 g of Pluronic F127 or Pluronic P123
were added, and the suspension was mixed until dissolution (0.5 h). Then, 6.30 g of citric
acid were incorporated under intense stirring. Following this procedure, the solution pH
was adjusted to 0.75. Mixing continued at ambient temperature for 1 h. Once this step was
completed, 28.50 g of titanium (IV) isopropoxide were added into the mixture dropwise.
The resultant liquid phase, displaying a sol-gel appearance, was mixed for 24 h. The
resulting sol-gel phases were evaporated and calcined by gradually increasing the
temperature, from room temperature up to the target temperature (i.e., 773 K (500°C), 873
K (600°C) and 973 K (700°C)). As soon as the desired thermal level was achieved, this
temperature was kept under ambient air for 6 h to calcine the sample and combust the
organic template.
Mesoporous TiO2 was doped with Pt as a co-catalyst for water dissociation. A titanium
(IV) isopropoxide template method was modified with hexachloroplatinic acid hydrate
(Sigma Aldrich H2PtCl6*xH2O, 99.9% purity). Titanium (IV) isopropoxide was added to
the sol-gel, concurrently with the Pt containing species.
3.3 Characterization
Three photocatalyst characterization techniques were employed in this study: (a) Specific
Surface Area determined using a Micromeritics, ASAP 2010 unit, through nitrogen
70
adsorption; (b) X-Ray Diffraction (XRD) developed by using a diffractometer RIGAKU
Ultima IV and a multi-purpose diffractometer; and (c) Scanning Electron Microscopy
(SEM) analyses which were carried out using a Hitachi S-4500 Field Emission SEM
Instrument with a Quartz PCI X One SSD X-Ray Analyzer. The mesoporous TiO2 were
dispersed using sonication in methanol, with platinum oxide glass used as the conductive
substrate during SEM analyses.
3.3.1 N2 Adsorption-Desorption Isotherms
Specific surface areas were calculated using the Brunauer–Emmett–Teller (BET) method
while the pore volume distributions were measured with the Barrett–Joyner–Halenda
(BJH) model. Nitrogen adsorption was carried out at 77.8 K using a 3 Flex 3.02 Analyzer
Model from Micromeritics. The materials were degassed at 300 °C for 6 h. Nitrogen
adsorption covered the 10-8 to 1 relative partial pressure range. Pore size distributions were
calculated using the BJH method [10]. The pore diameter distribution was established using
the N2 isotherm data for each material as reported in Table 3.1.
Figure 3.1 to 3.8 report both adsorption and desorption isotherms of type V for the
synthesized mesoporous TiO2 using Pluronic P123 and Pluronic F127, and calcined at 500
oC, 600 oC and 700 oC.
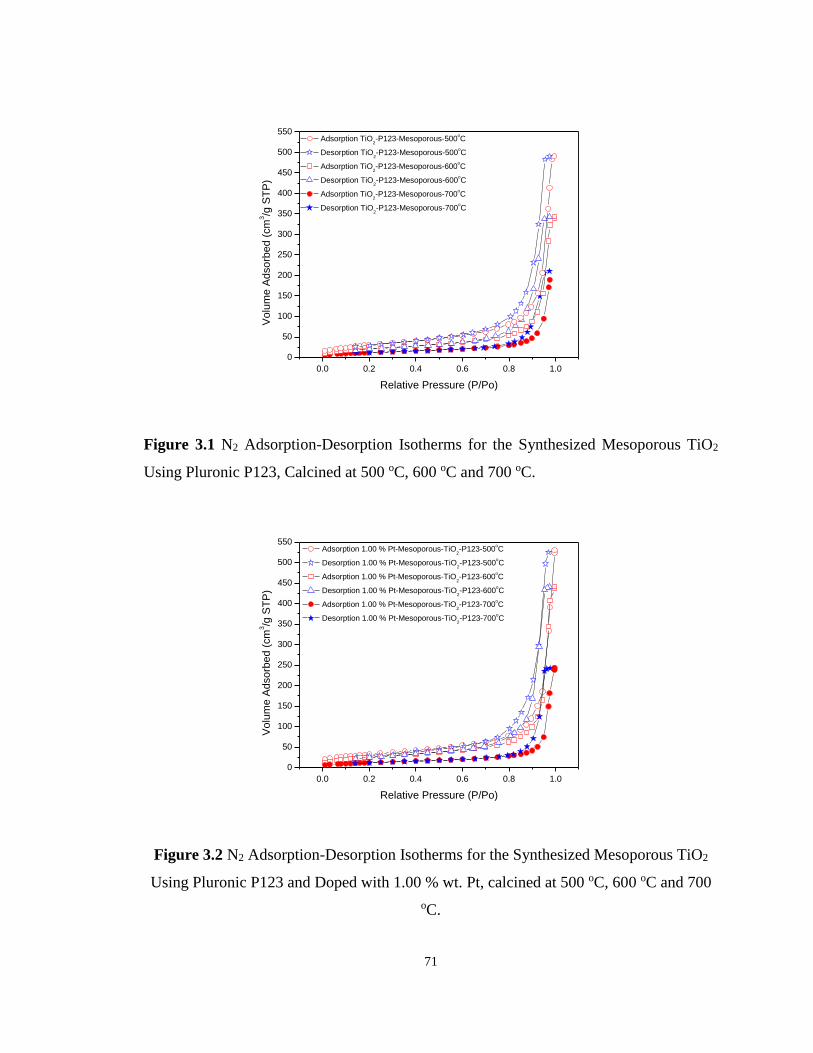
71
0.0 0.2 0.4 0.6 0.8 1.0
0
50
100
150
200
250
300
350
400
450
500
550
Vo
lum
e A
dso
rbe
d (
cm
3/g
ST
P)
Relative Pressure (P/Po)
Adsorption TiO2-P123-Mesoporous-500
oC
Desorption TiO2-P123-Mesoporous-500
oC
Adsorption TiO2-P123-Mesoporous-600
oC
Desorption TiO2-P123-Mesoporous-600
oC
Adsorption TiO2-P123-Mesoporous-700
oC
Desorption TiO2-P123-Mesoporous-700
oC
Figure 3.1 N2 Adsorption-Desorption Isotherms for the Synthesized Mesoporous TiO2
Using Pluronic P123, Calcined at 500 oC, 600 oC and 700 oC.
0.0 0.2 0.4 0.6 0.8 1.0
0
50
100
150
200
250
300
350
400
450
500
550
Vo
lum
e A
dso
rbe
d (
cm
3/g
ST
P)
Relative Pressure (P/Po)
Adsorption 1.00 % Pt-Mesoporous-TiO2-P123-500
oC
Desorption 1.00 % Pt-Mesoporous-TiO2-P123-500
oC
Adsorption 1.00 % Pt-Mesoporous-TiO2-P123-600
oC
Desorption 1.00 % Pt-Mesoporous-TiO2-P123-600
oC
Adsorption 1.00 % Pt-Mesoporous-TiO2-P123-700
oC
Desorption 1.00 % Pt-Mesoporous-TiO2-P123-700
oC
Figure 3.2 N2 Adsorption-Desorption Isotherms for the Synthesized Mesoporous TiO2
Using Pluronic P123 and Doped with 1.00 % wt. Pt, calcined at 500 oC, 600 oC and 700
oC.
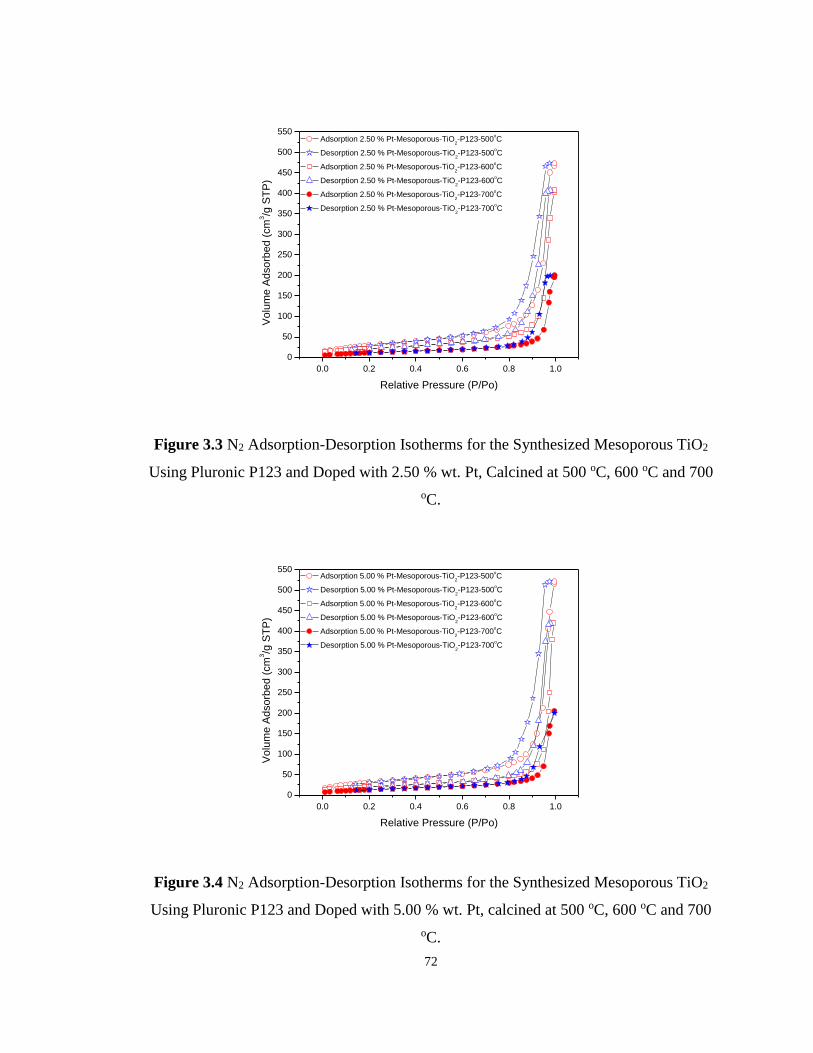
72
0.0 0.2 0.4 0.6 0.8 1.0
0
50
100
150
200
250
300
350
400
450
500
550
Vo
lum
e A
dso
rbe
d (
cm
3/g
ST
P)
Relative Pressure (P/Po)
Adsorption 2.50 % Pt-Mesoporous-TiO2-P123-500
oC
Desorption 2.50 % Pt-Mesoporous-TiO2-P123-500
oC
Adsorption 2.50 % Pt-Mesoporous-TiO2-P123-600
oC
Desorption 2.50 % Pt-Mesoporous-TiO2-P123-600
oC
Adsorption 2.50 % Pt-Mesoporous-TiO2-P123-700
oC
Desorption 2.50 % Pt-Mesoporous-TiO2-P123-700
oC
Figure 3.3 N2 Adsorption-Desorption Isotherms for the Synthesized Mesoporous TiO2
Using Pluronic P123 and Doped with 2.50 % wt. Pt, Calcined at 500 oC, 600 oC and 700
oC.
0.0 0.2 0.4 0.6 0.8 1.0
0
50
100
150
200
250
300
350
400
450
500
550
Vo
lum
e A
dso
rbe
d (
cm
3/g
ST
P)
Relative Pressure (P/Po)
Adsorption 5.00 % Pt-Mesoporous-TiO2-P123-500
oC
Desorption 5.00 % Pt-Mesoporous-TiO2-P123-500
oC
Adsorption 5.00 % Pt-Mesoporous-TiO2-P123-600
oC
Desorption 5.00 % Pt-Mesoporous-TiO2-P123-600
oC
Adsorption 5.00 % Pt-Mesoporous-TiO2-P123-700
oC
Desorption 5.00 % Pt-Mesoporous-TiO2-P123-700
oC
Figure 3.4 N2 Adsorption-Desorption Isotherms for the Synthesized Mesoporous TiO2
Using Pluronic P123 and Doped with 5.00 % wt. Pt, calcined at 500 oC, 600 oC and 700
oC.
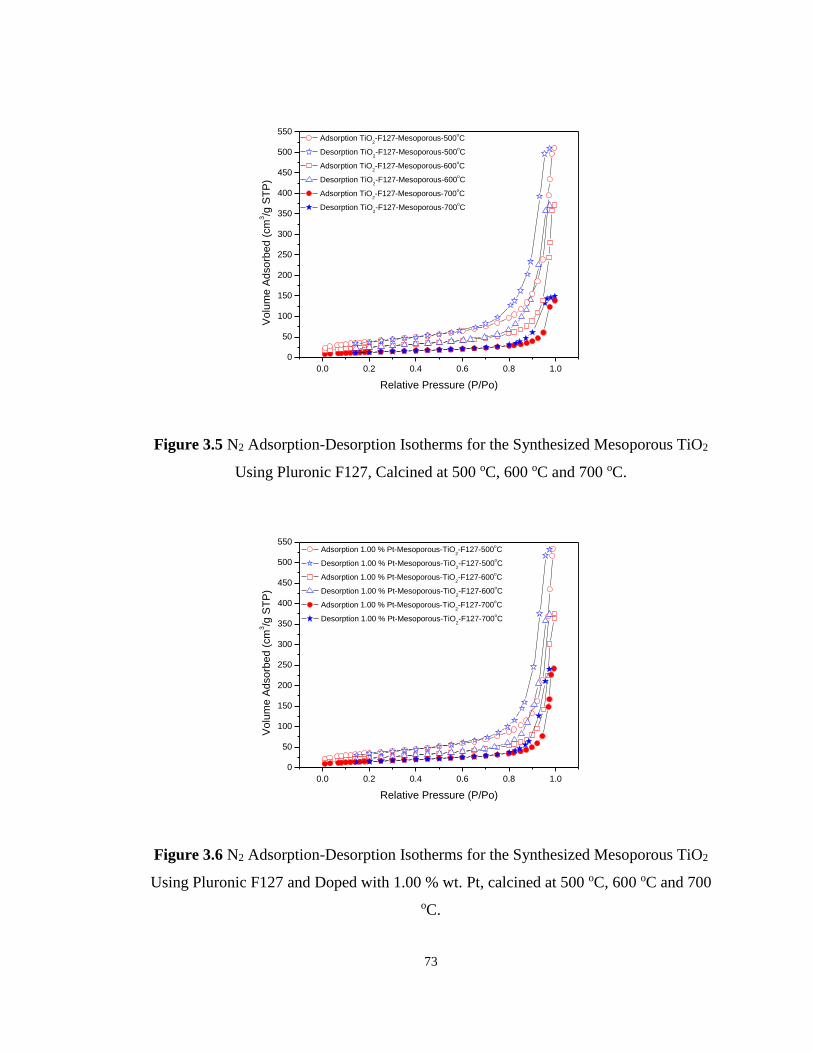
73
0.0 0.2 0.4 0.6 0.8 1.0
0
50
100
150
200
250
300
350
400
450
500
550
Vo
lum
e A
dso
rbe
d (
cm
3/g
ST
P)
Relative Pressure (P/Po)
Adsorption TiO2-F127-Mesoporous-500
oC
Desorption TiO2-F127-Mesoporous-500
oC
Adsorption TiO2-F127-Mesoporous-600
oC
Desorption TiO2-F127-Mesoporous-600
oC
Adsorption TiO2-F127-Mesoporous-700
oC
Desorption TiO2-F127-Mesoporous-700
oC
Figure 3.5 N2 Adsorption-Desorption Isotherms for the Synthesized Mesoporous TiO2
Using Pluronic F127, Calcined at 500 oC, 600 oC and 700 oC.
0.0 0.2 0.4 0.6 0.8 1.0
0
50
100
150
200
250
300
350
400
450
500
550
Vo
lum
e A
dso
rbe
d (
cm
3/g
ST
P)
Relative Pressure (P/Po)
Adsorption 1.00 % Pt-Mesoporous-TiO2-F127-500
oC
Desorption 1.00 % Pt-Mesoporous-TiO2-F127-500
oC
Adsorption 1.00 % Pt-Mesoporous-TiO2-F127-600
oC
Desorption 1.00 % Pt-Mesoporous-TiO2-F127-600
oC
Adsorption 1.00 % Pt-Mesoporous-TiO2-F127-700
oC
Desorption 1.00 % Pt-Mesoporous-TiO2-F127-700
oC
Figure 3.6 N2 Adsorption-Desorption Isotherms for the Synthesized Mesoporous TiO2
Using Pluronic F127 and Doped with 1.00 % wt. Pt, calcined at 500 oC, 600 oC and 700
oC.
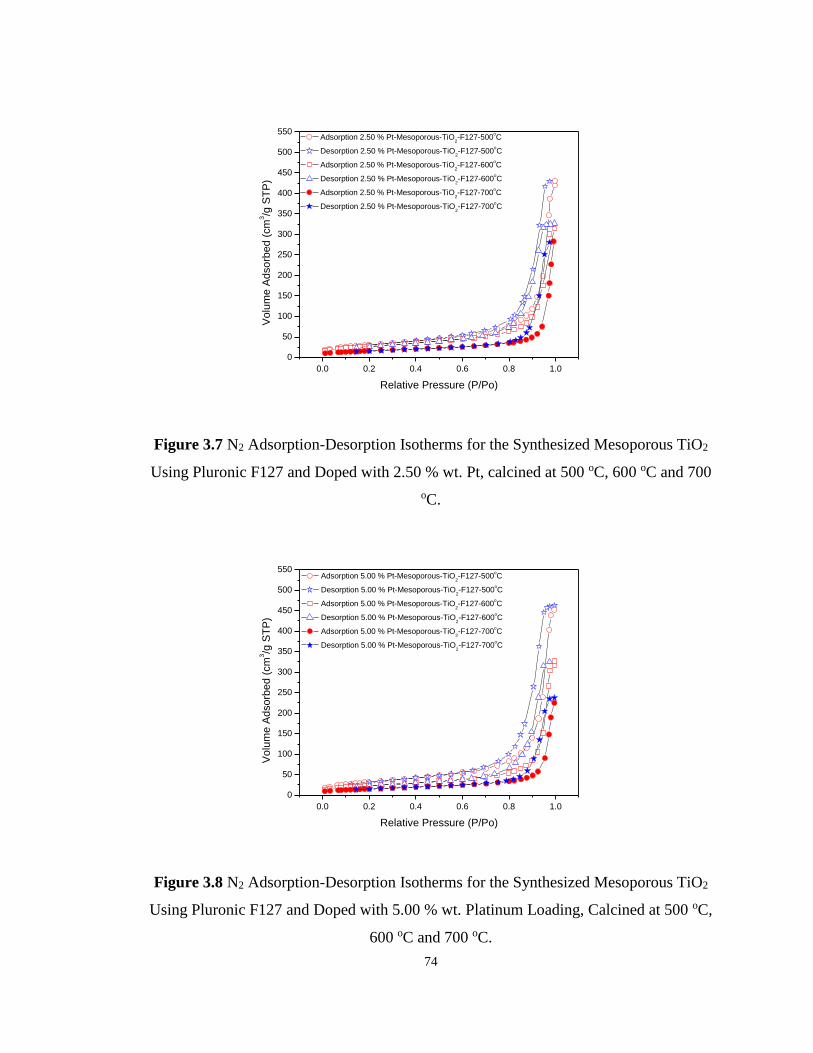
74
0.0 0.2 0.4 0.6 0.8 1.0
0
50
100
150
200
250
300
350
400
450
500
550
Vo
lum
e A
dso
rbe
d (
cm
3/g
ST
P)
Relative Pressure (P/Po)
Adsorption 2.50 % Pt-Mesoporous-TiO2-F127-500
oC
Desorption 2.50 % Pt-Mesoporous-TiO2-F127-500
oC
Adsorption 2.50 % Pt-Mesoporous-TiO2-F127-600
oC
Desorption 2.50 % Pt-Mesoporous-TiO2-F127-600
oC
Adsorption 2.50 % Pt-Mesoporous-TiO2-F127-700
oC
Desorption 2.50 % Pt-Mesoporous-TiO2-F127-700
oC
Figure 3.7 N2 Adsorption-Desorption Isotherms for the Synthesized Mesoporous TiO2
Using Pluronic F127 and Doped with 2.50 % wt. Pt, calcined at 500 oC, 600 oC and 700
oC.
0.0 0.2 0.4 0.6 0.8 1.0
0
50
100
150
200
250
300
350
400
450
500
550
Vo
lum
e A
dso
rbe
d (
cm
3/g
ST
P)
Relative Pressure (P/Po)
Adsorption 5.00 % Pt-Mesoporous-TiO2-F127-500
oC
Desorption 5.00 % Pt-Mesoporous-TiO2-F127-500
oC
Adsorption 5.00 % Pt-Mesoporous-TiO2-F127-600
oC
Desorption 5.00 % Pt-Mesoporous-TiO2-F127-600
oC
Adsorption 5.00 % Pt-Mesoporous-TiO2-F127-700
oC
Desorption 5.00 % Pt-Mesoporous-TiO2-F127-700
oC
Figure 3.8 N2 Adsorption-Desorption Isotherms for the Synthesized Mesoporous TiO2
Using Pluronic F127 and Doped with 5.00 % wt. Platinum Loading, Calcined at 500 oC,
600 oC and 700 oC.
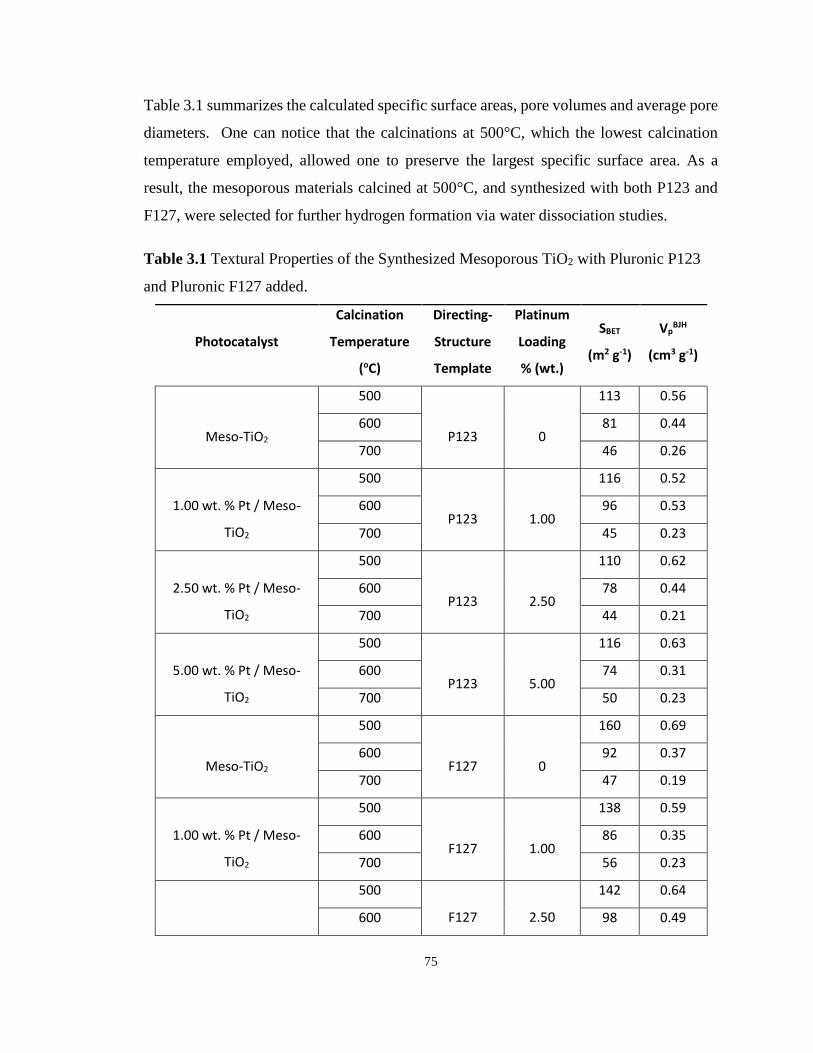
75
Table 3.1 summarizes the calculated specific surface areas, pore volumes and average pore
diameters. One can notice that the calcinations at 500°C, which the lowest calcination
temperature employed, allowed one to preserve the largest specific surface area. As a
result, the mesoporous materials calcined at 500°C, and synthesized with both P123 and
F127, were selected for further hydrogen formation via water dissociation studies.
Table 3.1 Textural Properties of the Synthesized Mesoporous TiO2 with Pluronic P123
and Pluronic F127 added.
Photocatalyst
Calcination
Temperature
(oC)
Directing-
Structure
Template
Platinum
Loading
% (wt.)
SBET
(m2 g-1)
VpBJH
(cm3 g-1)
Meso-TiO2
500
P123
0
113 0.56
600 81 0.44
700 46 0.26
1.00 wt. % Pt / Meso-
TiO2
500
P123
1.00
116 0.52
600 96 0.53
700 45 0.23
2.50 wt. % Pt / Meso-
TiO2
500
P123
2.50
110 0.62
600 78 0.44
700 44 0.21
5.00 wt. % Pt / Meso-
TiO2
500
P123
5.00
116 0.63
600 74 0.31
700 50 0.23
Meso-TiO2
500
F127
0
160 0.69
600 92 0.37
700 47 0.19
1.00 wt. % Pt / Meso-
TiO2
500
F127
1.00
138 0.59
600 86 0.35
700 56 0.23
500
F127
2.50
142 0.64
600 98 0.49
76
2.50 wt. % Pt / Meso-
TiO2 700 59 0.24
5.00 wt. % Pt / Meso-
TiO2
500
F127
5.00
127 0.61
600 85 0.41
700 56 0.23
3.3.2 XRD Diffractograms
XRD analyses were developed by using Cu as an anode material, and by utilizing Ni
filtered CuKα radiation (λ= 0.15406 nm) in an Ultima IV X-Ray Diffractometer from
Rigaku. The XRD analyses were recorded in the 20° to 80° range of the 2 degrees scale.
Figure 3.9 to Figure 3.12 report the XRD diffractograms for the synthesized mesoporous
TiO2 materials prepared by sol-gel method using PluronicP123, as a directing structure
reagent. When reviewing the XRD diffractograms, one can recognize the characteristic
peaks of the crystalline anatase phase of titanium dioxide, with platinum included as a
dopant material.
In this respect, one can notice that all photocatalysts show the anatase (101) crystal plane
given the characteristic 27° Bragg angle band in the 2 degrees scale. On the other hand,
and as an interesting observation, the various sol-gel Pt–TiO2 photocatalysts showed
recordable 27° Bragg angles. Hence, this demonstrates that the various synthesized sol-gel
Pt–TiO2 catalysts using Pluronic P123 are free of a rutile as revealed by the absence of the
rutile (110) facet plane.
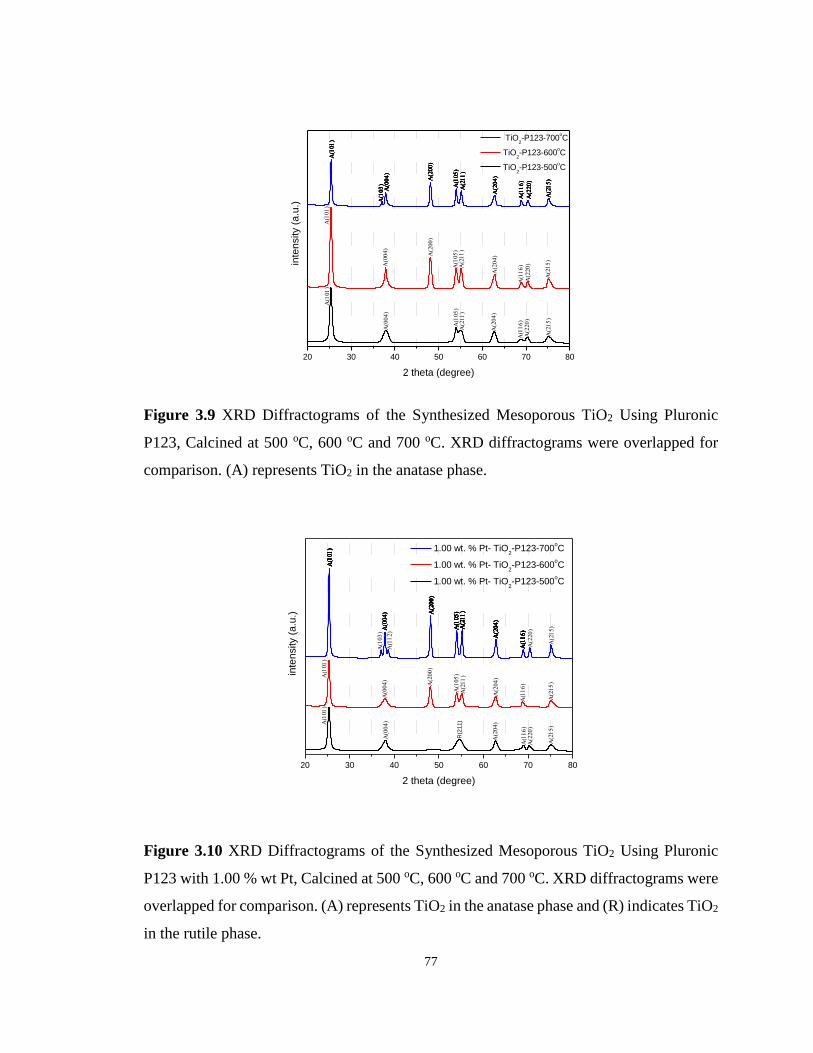
77
20 30 40 50 60 70 80
in
ten
sity (
a.u
.)
2 theta (degree)
TiO2-P123-700
oC
TiO2-P123-600
oC
TiO2-P123-500
oC
Figure 3.9 XRD Diffractograms of the Synthesized Mesoporous TiO2 Using Pluronic
P123, Calcined at 500 oC, 600 oC and 700 oC. XRD diffractograms were overlapped for
comparison. (A) represents TiO2 in the anatase phase.
20 30 40 50 60 70 80
R(2
11
)
inte
nsity (
a.u
.)
2 theta (degree)
1.00 wt. % Pt- TiO2-P123-700
oC
1.00 wt. % Pt- TiO2-P123-600
oC
1.00 wt. % Pt- TiO2-P123-500
oC
Figure 3.10 XRD Diffractograms of the Synthesized Mesoporous TiO2 Using Pluronic
P123 with 1.00 % wt Pt, Calcined at 500 oC, 600 oC and 700 oC. XRD diffractograms were
overlapped for comparison. (A) represents TiO2 in the anatase phase and (R) indicates TiO2
in the rutile phase.
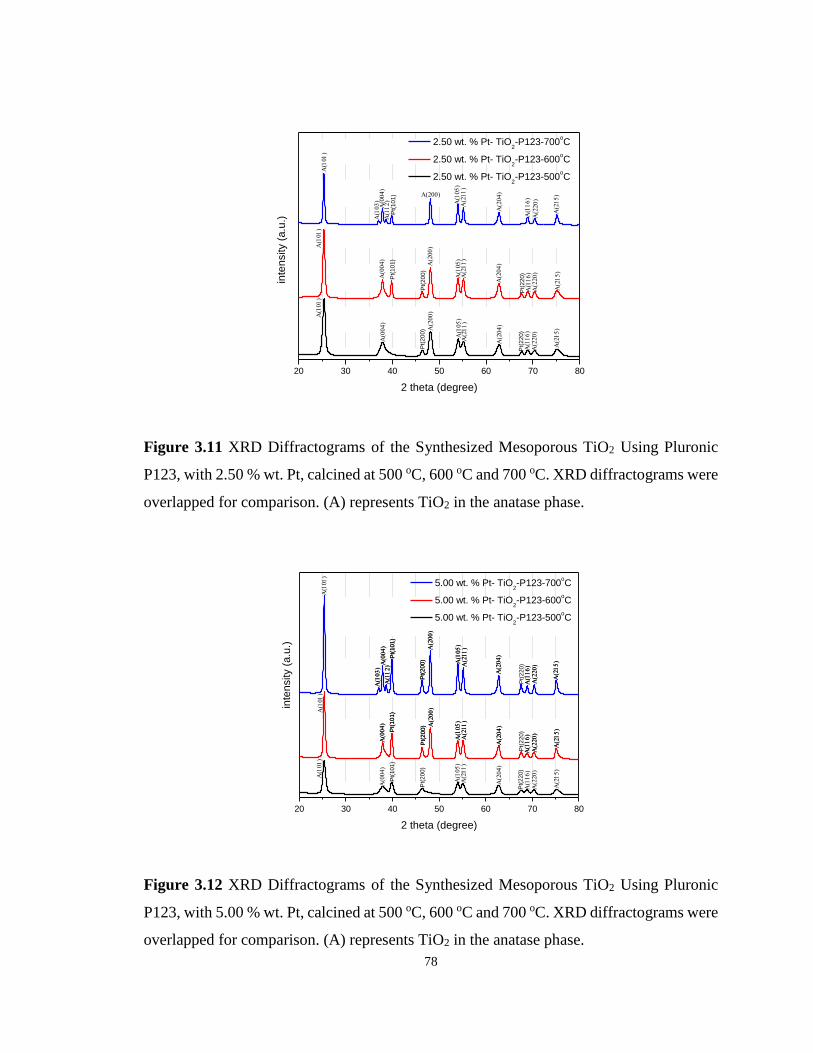
78
20 30 40 50 60 70 80
Pt(
20
0)
Pt(
22
0)
Pt(
22
0)
Pt(
20
0)
Pt(
10
1)
Pt(
10
1)
inte
nsity (
a.u
.)
2 theta (degree)
2.50 wt. % Pt- TiO2-P123-700
oC
2.50 wt. % Pt- TiO2-P123-600
oC
2.50 wt. % Pt- TiO2-P123-500
oC
Figure 3.11 XRD Diffractograms of the Synthesized Mesoporous TiO2 Using Pluronic
P123, with 2.50 % wt. Pt, calcined at 500 oC, 600 oC and 700 oC. XRD diffractograms were
overlapped for comparison. (A) represents TiO2 in the anatase phase.
20 30 40 50 60 70 80
Pt(
22
0)
Pt(
20
0)
inte
nsity (
a.u
.)
2 theta (degree)
5.00 wt. % Pt- TiO2-P123-700
oC
5.00 wt. % Pt- TiO2-P123-600
oC
5.00 wt. % Pt- TiO2-P123-500
oC
Pt(
10
1)
Pt(
20
0)
Pt(
10
1)
Pt(
22
0)
Pt(
20
0)
Pt(
10
1)
Pt(
20
0)
Pt(
10
1)
Pt(
22
0)
Pt(
20
0)
Pt(
10
1)
Figure 3.12 XRD Diffractograms of the Synthesized Mesoporous TiO2 Using Pluronic
P123, with 5.00 % wt. Pt, calcined at 500 oC, 600 oC and 700 oC. XRD diffractograms were
overlapped for comparison. (A) represents TiO2 in the anatase phase.
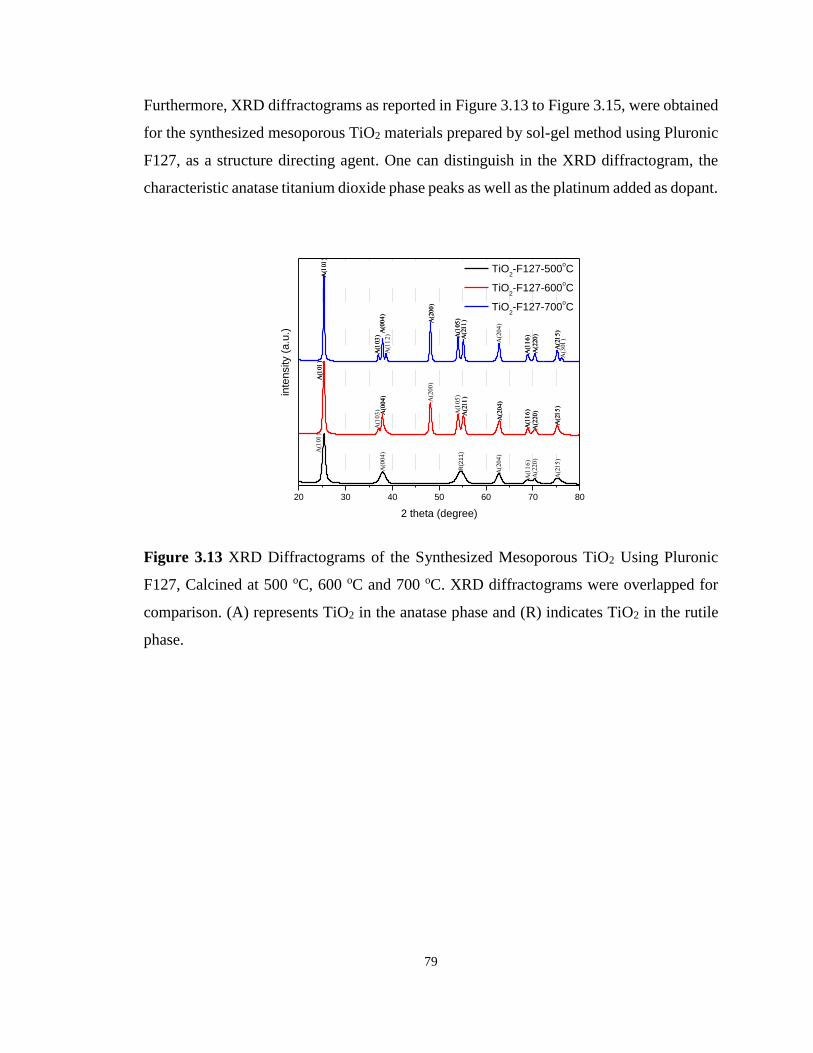
79
Furthermore, XRD diffractograms as reported in Figure 3.13 to Figure 3.15, were obtained
for the synthesized mesoporous TiO2 materials prepared by sol-gel method using Pluronic
F127, as a structure directing agent. One can distinguish in the XRD diffractogram, the
characteristic anatase titanium dioxide phase peaks as well as the platinum added as dopant.
20 30 40 50 60 70 80
R(2
11
)
inte
nsity (
a.u
.)
2 theta (degree)
TiO2-F127-500
oC
TiO2-F127-600
oC
TiO2-F127-700
oC
Figure 3.13 XRD Diffractograms of the Synthesized Mesoporous TiO2 Using Pluronic
F127, Calcined at 500 oC, 600 oC and 700 oC. XRD diffractograms were overlapped for
comparison. (A) represents TiO2 in the anatase phase and (R) indicates TiO2 in the rutile
phase.
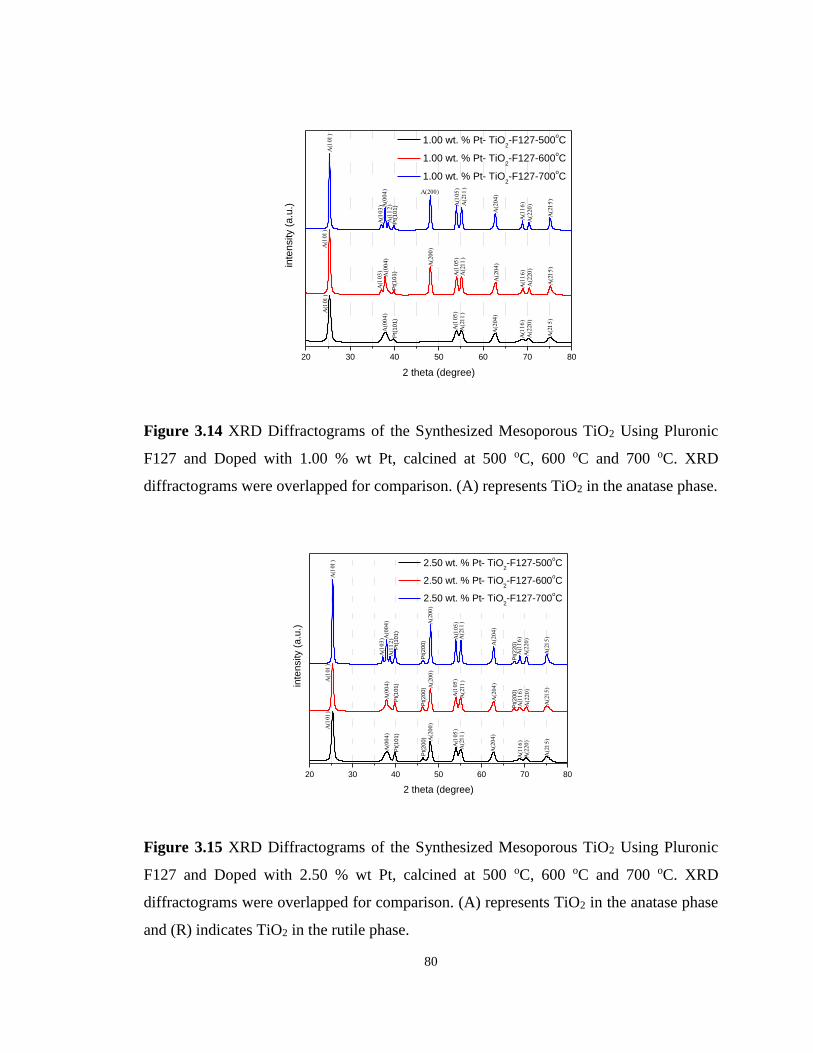
80
20 30 40 50 60 70 80
Pt(
10
1)
Pt(
10
1)
Pt(
10
1)
inte
nsity (
a.u
.)
2 theta (degree)
1.00 wt. % Pt- TiO2-F127-500
oC
1.00 wt. % Pt- TiO2-F127-600
oC
1.00 wt. % Pt- TiO2-F127-700
oC
Figure 3.14 XRD Diffractograms of the Synthesized Mesoporous TiO2 Using Pluronic
F127 and Doped with 1.00 % wt Pt, calcined at 500 oC, 600 oC and 700 oC. XRD
diffractograms were overlapped for comparison. (A) represents TiO2 in the anatase phase.
20 30 40 50 60 70 80
Pt(
20
0)
Pt(
22
0)
Pt(
20
0)
Pt(
20
0)
Pt(
20
0)
Pt(
10
1)
Pt(
10
1)
Pt(
10
1)
inte
nsity (
a.u
.)
2 theta (degree)
2.50 wt. % Pt- TiO2-F127-500
oC
2.50 wt. % Pt- TiO2-F127-600
oC
2.50 wt. % Pt- TiO2-F127-700
oC
Figure 3.15 XRD Diffractograms of the Synthesized Mesoporous TiO2 Using Pluronic
F127 and Doped with 2.50 % wt Pt, calcined at 500 oC, 600 oC and 700 oC. XRD
diffractograms were overlapped for comparison. (A) represents TiO2 in the anatase phase
and (R) indicates TiO2 in the rutile phase.
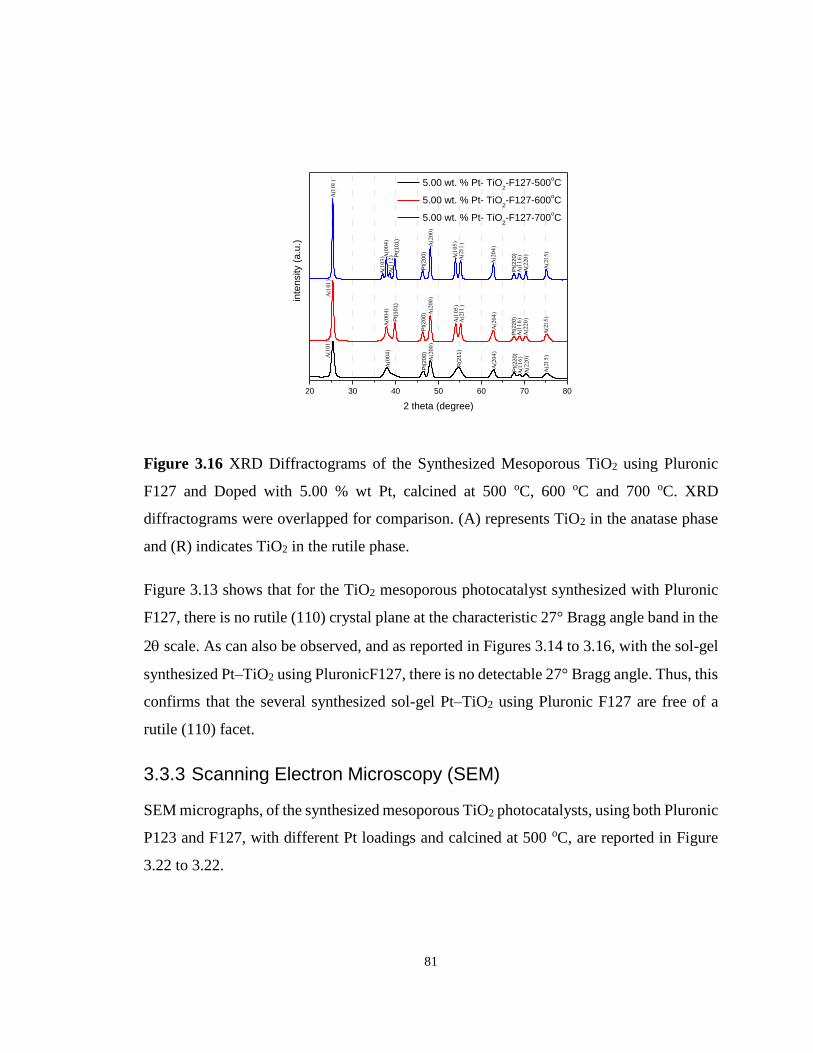
81
20 30 40 50 60 70 80
Pt(
20
0)
R(2
11
)
inte
nsity (
a.u
.)
2 theta (degree)
5.00 wt. % Pt- TiO2-F127-500
oC
5.00 wt. % Pt- TiO2-F127-600
oC
5.00 wt. % Pt- TiO2-F127-700
oC
Pt(
22
0)
Pt(
20
0)
Pt(
10
1)
Pt(
22
0)
Pt(
20
0)
Pt(
10
1)
Pt(
22
0)
Figure 3.16 XRD Diffractograms of the Synthesized Mesoporous TiO2 using Pluronic
F127 and Doped with 5.00 % wt Pt, calcined at 500 oC, 600 oC and 700 oC. XRD
diffractograms were overlapped for comparison. (A) represents TiO2 in the anatase phase
and (R) indicates TiO2 in the rutile phase.
Figure 3.13 shows that for the TiO2 mesoporous photocatalyst synthesized with Pluronic
F127, there is no rutile (110) crystal plane at the characteristic 27° Bragg angle band in the
2 scale. As can also be observed, and as reported in Figures 3.14 to 3.16, with the sol-gel
synthesized Pt–TiO2 using PluronicF127, there is no detectable 27° Bragg angle. Thus, this
confirms that the several synthesized sol-gel Pt–TiO2 using Pluronic F127 are free of a
rutile (110) facet.
3.3.3 Scanning Electron Microscopy (SEM)
SEM micrographs, of the synthesized mesoporous TiO2 photocatalysts, using both Pluronic
P123 and F127, with different Pt loadings and calcined at 500 oC, are reported in Figure
3.22 to 3.22.
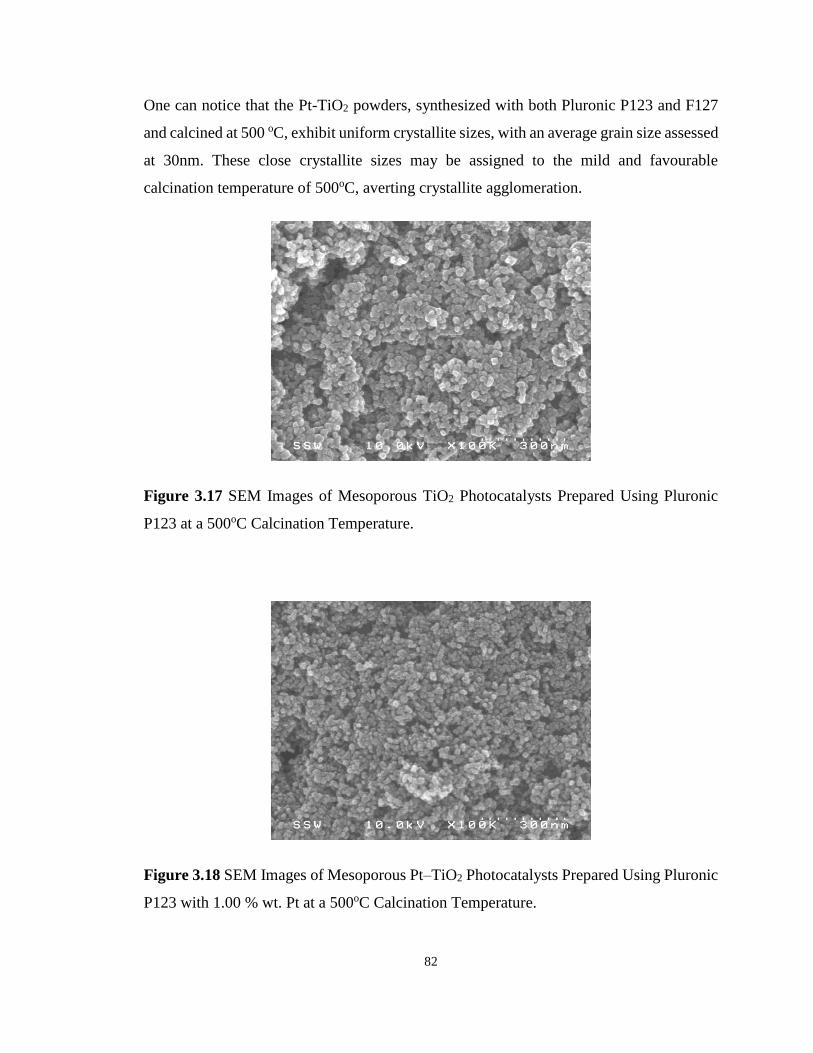
82
One can notice that the Pt-TiO2 powders, synthesized with both Pluronic P123 and F127
and calcined at 500 oC, exhibit uniform crystallite sizes, with an average grain size assessed
at 30nm. These close crystallite sizes may be assigned to the mild and favourable
calcination temperature of 500oC, averting crystallite agglomeration.
Figure 3.17 SEM Images of Mesoporous TiO2 Photocatalysts Prepared Using Pluronic
P123 at a 500oC Calcination Temperature.
Figure 3.18 SEM Images of Mesoporous Pt–TiO2 Photocatalysts Prepared Using Pluronic
P123 with 1.00 % wt. Pt at a 500oC Calcination Temperature.
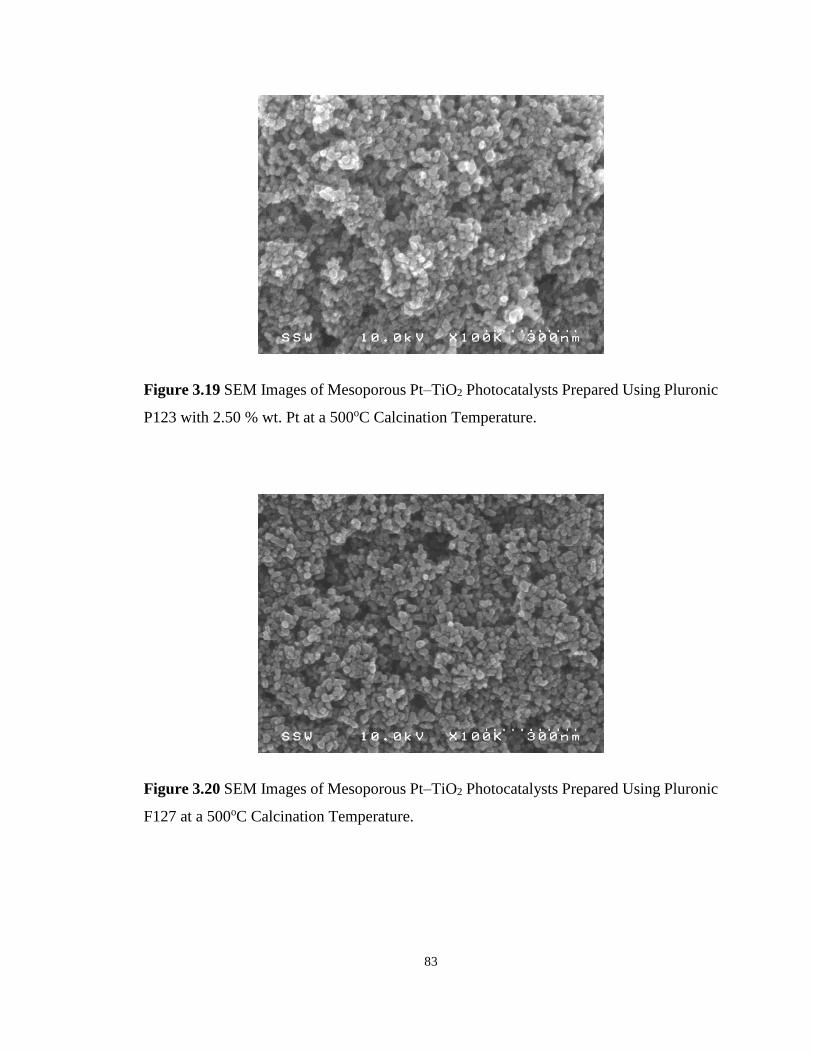
83
Figure 3.19 SEM Images of Mesoporous Pt–TiO2 Photocatalysts Prepared Using Pluronic
P123 with 2.50 % wt. Pt at a 500oC Calcination Temperature.
Figure 3.20 SEM Images of Mesoporous Pt–TiO2 Photocatalysts Prepared Using Pluronic
F127 at a 500oC Calcination Temperature.

84
Figure 3.21 SEM Images of Mesoporous Pt–TiO2 Photocatalysts Prepared Using Pluronic
F127 with 1.00 % wt. Pt at a 500oC Calcination Temperature.
Figure 3.22 SEM Images of Mesoporous Pt–TiO2 Photocatalysts Prepared Using Pluronic
F127 with 2.50 % wt. Platinum Loading at a 500oC Calcination Temperature.
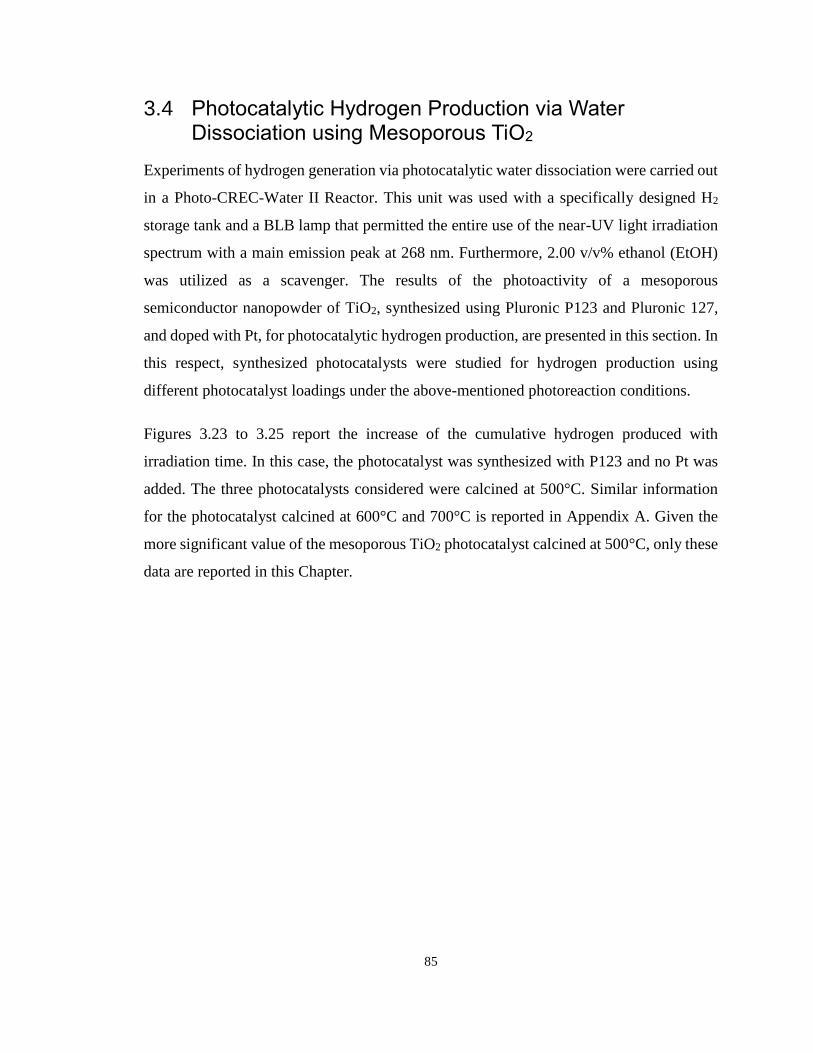
85
3.4 Photocatalytic Hydrogen Production via Water Dissociation using Mesoporous TiO2
Experiments of hydrogen generation via photocatalytic water dissociation were carried out
in a Photo-CREC-Water II Reactor. This unit was used with a specifically designed H2
storage tank and a BLB lamp that permitted the entire use of the near-UV light irradiation
spectrum with a main emission peak at 268 nm. Furthermore, 2.00 v/v% ethanol (EtOH)
was utilized as a scavenger. The results of the photoactivity of a mesoporous
semiconductor nanopowder of TiO2, synthesized using Pluronic P123 and Pluronic 127,
and doped with Pt, for photocatalytic hydrogen production, are presented in this section. In
this respect, synthesized photocatalysts were studied for hydrogen production using
different photocatalyst loadings under the above-mentioned photoreaction conditions.
Figures 3.23 to 3.25 report the increase of the cumulative hydrogen produced with
irradiation time. In this case, the photocatalyst was synthesized with P123 and no Pt was
added. The three photocatalysts considered were calcined at 500°C. Similar information
for the photocatalyst calcined at 600°C and 700°C is reported in Appendix A. Given the
more significant value of the mesoporous TiO2 photocatalyst calcined at 500°C, only these
data are reported in this Chapter.
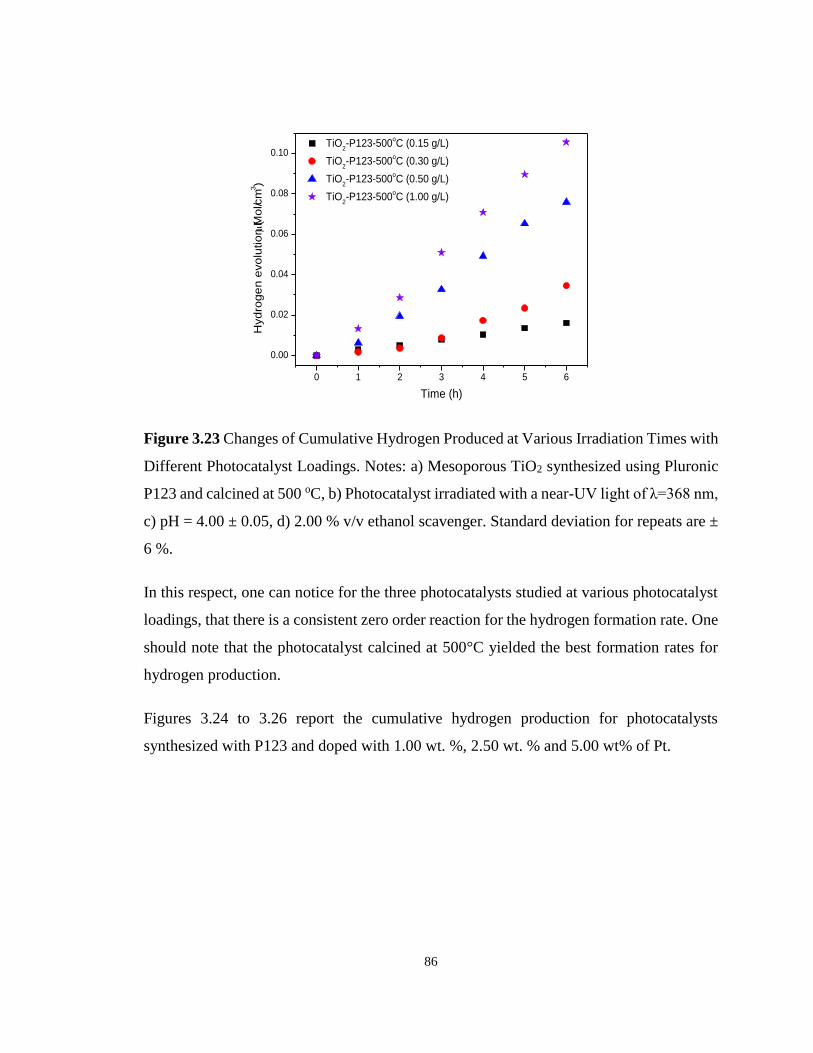
86
0 1 2 3 4 5 6
0.00
0.02
0.04
0.06
0.08
0.10
TiO2-P123-500
oC (0.15 g/L)
TiO2-P123-500
oC (0.30 g/L)
TiO2-P123-500
oC (0.50 g/L)
TiO2-P123-500
oC (1.00 g/L)
Hyd
rog
en
evo
lutio
n (M
ol/c
m3)
Time (h)
Figure 3.23 Changes of Cumulative Hydrogen Produced at Various Irradiation Times with
Different Photocatalyst Loadings. Notes: a) Mesoporous TiO2 synthesized using Pluronic
P123 and calcined at 500 oC, b) Photocatalyst irradiated with a near-UV light of λ=368 nm,
c) pH = 4.00 ± 0.05, d) 2.00 % v/v ethanol scavenger. Standard deviation for repeats are ±
6 %.
In this respect, one can notice for the three photocatalysts studied at various photocatalyst
loadings, that there is a consistent zero order reaction for the hydrogen formation rate. One
should note that the photocatalyst calcined at 500°C yielded the best formation rates for
hydrogen production.
Figures 3.24 to 3.26 report the cumulative hydrogen production for photocatalysts
synthesized with P123 and doped with 1.00 wt. %, 2.50 wt. % and 5.00 wt% of Pt.
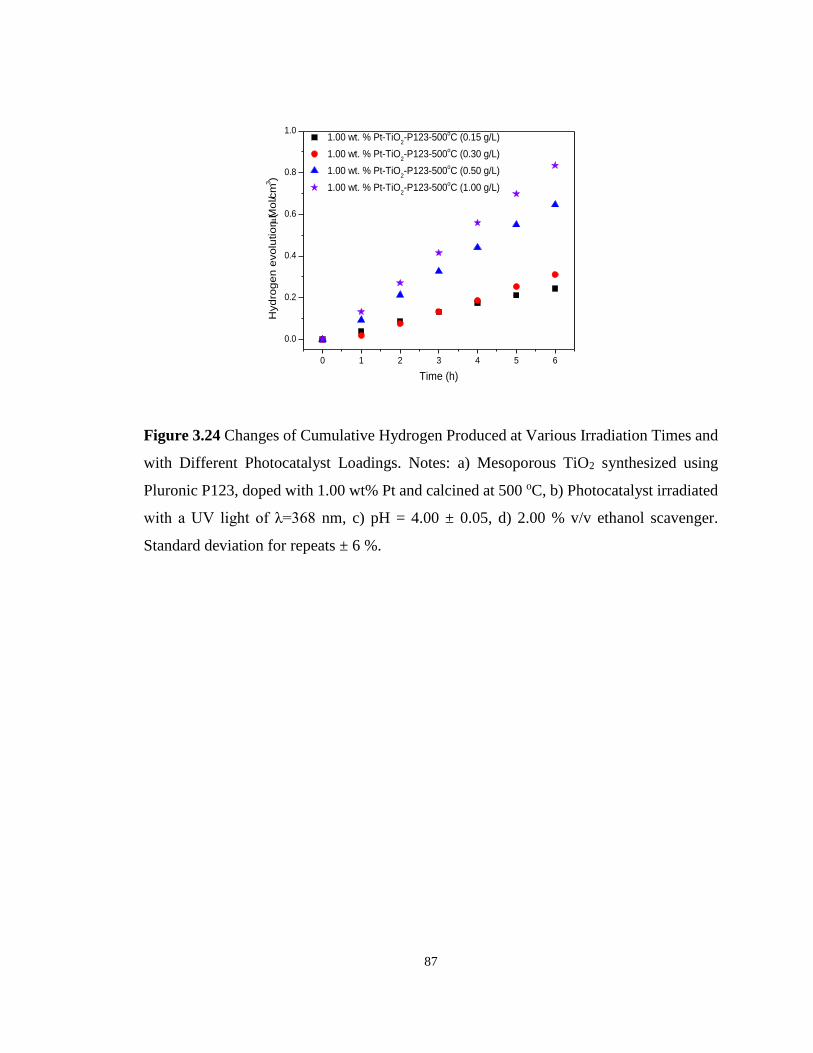
87
0 1 2 3 4 5 6
0.0
0.2
0.4
0.6
0.8
1.0
1.00 wt. % Pt-TiO2-P123-500
oC (0.15 g/L)
1.00 wt. % Pt-TiO2-P123-500
oC (0.30 g/L)
1.00 wt. % Pt-TiO2-P123-500
oC (0.50 g/L)
1.00 wt. % Pt-TiO2-P123-500
oC (1.00 g/L)
Hyd
rog
en
evo
lutio
n (M
ol/c
m3)
Time (h)
Figure 3.24 Changes of Cumulative Hydrogen Produced at Various Irradiation Times and
with Different Photocatalyst Loadings. Notes: a) Mesoporous TiO2 synthesized using
Pluronic P123, doped with 1.00 wt% Pt and calcined at 500 oC, b) Photocatalyst irradiated
with a UV light of λ=368 nm, c) pH = 4.00 ± 0.05, d) 2.00 % v/v ethanol scavenger.
Standard deviation for repeats ± 6 %.
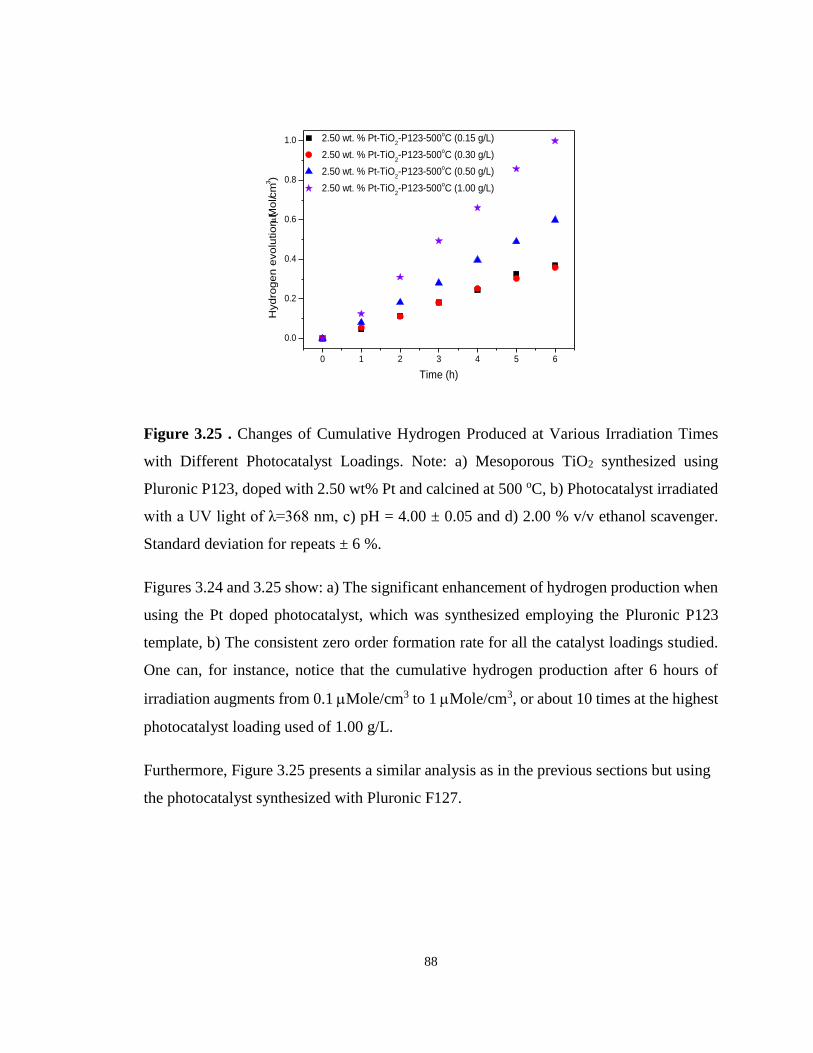
88
0 1 2 3 4 5 6
0.0
0.2
0.4
0.6
0.8
1.0
2.50 wt. % Pt-TiO2-P123-500
oC (0.15 g/L)
2.50 wt. % Pt-TiO2-P123-500
oC (0.30 g/L)
2.50 wt. % Pt-TiO2-P123-500
oC (0.50 g/L)
2.50 wt. % Pt-TiO2-P123-500
oC (1.00 g/L)
Hyd
rog
en
evo
lutio
n (M
ol/c
m3)
Time (h)
Figure 3.25 . Changes of Cumulative Hydrogen Produced at Various Irradiation Times
with Different Photocatalyst Loadings. Note: a) Mesoporous TiO2 synthesized using
Pluronic P123, doped with 2.50 wt% Pt and calcined at 500 oC, b) Photocatalyst irradiated
with a UV light of λ=368 nm, c) pH = 4.00 ± 0.05 and d) 2.00 % v/v ethanol scavenger.
Standard deviation for repeats ± 6 %.
Figures 3.24 and 3.25 show: a) The significant enhancement of hydrogen production when
using the Pt doped photocatalyst, which was synthesized employing the Pluronic P123
template, b) The consistent zero order formation rate for all the catalyst loadings studied.
One can, for instance, notice that the cumulative hydrogen production after 6 hours of
irradiation augments from 0.1 Mole/cm3 to 1 Mole/cm3, or about 10 times at the highest
photocatalyst loading used of 1.00 g/L.
Furthermore, Figure 3.25 presents a similar analysis as in the previous sections but using
the photocatalyst synthesized with Pluronic F127.
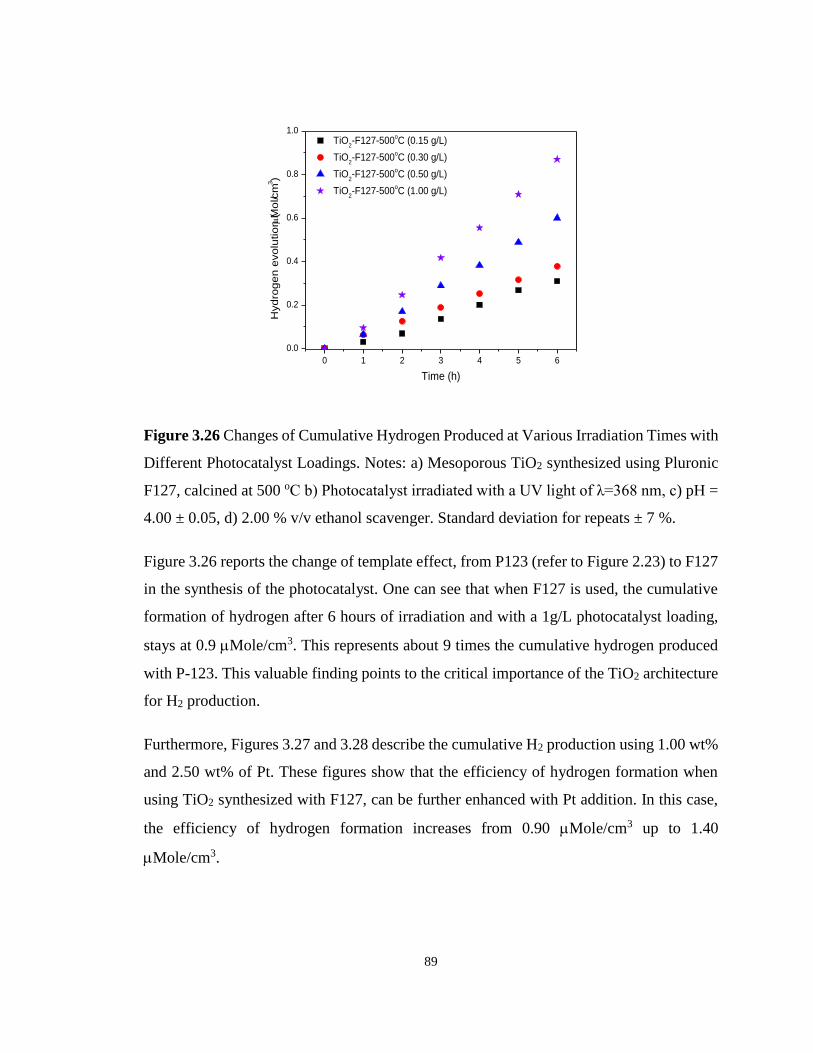
89
0 1 2 3 4 5 6
0.0
0.2
0.4
0.6
0.8
1.0
TiO2-F127-500
oC (0.15 g/L)
TiO2-F127-500
oC (0.30 g/L)
TiO2-F127-500
oC (0.50 g/L)
TiO2-F127-500
oC (1.00 g/L)
Hyd
rog
en
evo
lutio
n (M
ol/c
m3)
Time (h)
Figure 3.26 Changes of Cumulative Hydrogen Produced at Various Irradiation Times with
Different Photocatalyst Loadings. Notes: a) Mesoporous TiO2 synthesized using Pluronic
F127, calcined at 500 oC b) Photocatalyst irradiated with a UV light of λ=368 nm, c) pH =
4.00 ± 0.05, d) 2.00 % v/v ethanol scavenger. Standard deviation for repeats ± 7 %.
Figure 3.26 reports the change of template effect, from P123 (refer to Figure 2.23) to F127
in the synthesis of the photocatalyst. One can see that when F127 is used, the cumulative
formation of hydrogen after 6 hours of irradiation and with a 1g/L photocatalyst loading,
stays at 0.9 Mole/cm3. This represents about 9 times the cumulative hydrogen produced
with P-123. This valuable finding points to the critical importance of the TiO2 architecture
for H2 production.
Furthermore, Figures 3.27 and 3.28 describe the cumulative H2 production using 1.00 wt%
and 2.50 wt% of Pt. These figures show that the efficiency of hydrogen formation when
using TiO2 synthesized with F127, can be further enhanced with Pt addition. In this case,
the efficiency of hydrogen formation increases from 0.90 Mole/cm3 up to 1.40
Mole/cm3.
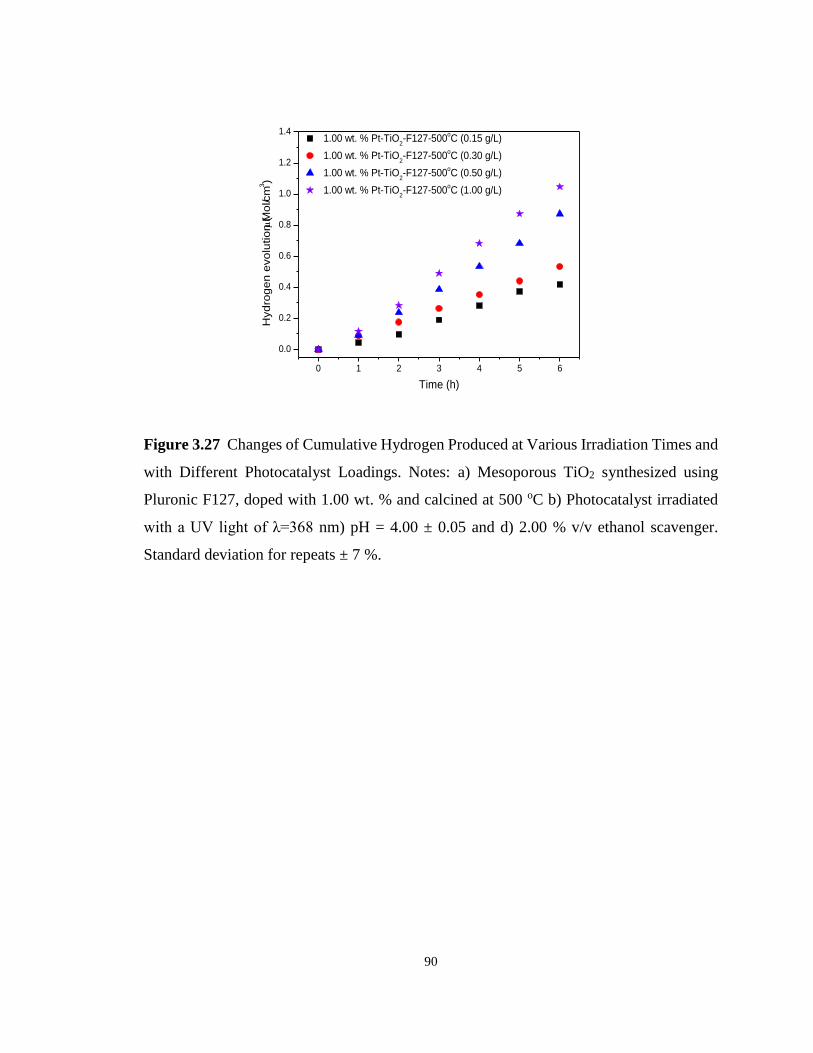
90
0 1 2 3 4 5 6
0.0
0.2
0.4
0.6
0.8
1.0
1.2
1.4
1.00 wt. % Pt-TiO2-F127-500
oC (0.15 g/L)
1.00 wt. % Pt-TiO2-F127-500
oC (0.30 g/L)
1.00 wt. % Pt-TiO2-F127-500
oC (0.50 g/L)
1.00 wt. % Pt-TiO2-F127-500
oC (1.00 g/L)
Hyd
rog
en
evo
lutio
n (M
ol/c
m3)
Time (h)
Figure 3.27 Changes of Cumulative Hydrogen Produced at Various Irradiation Times and
with Different Photocatalyst Loadings. Notes: a) Mesoporous TiO2 synthesized using
Pluronic F127, doped with 1.00 wt. % and calcined at 500 oC b) Photocatalyst irradiated
with a UV light of λ=368 nm) pH = 4.00 ± 0.05 and d) 2.00 % v/v ethanol scavenger.
Standard deviation for repeats ± 7 %.
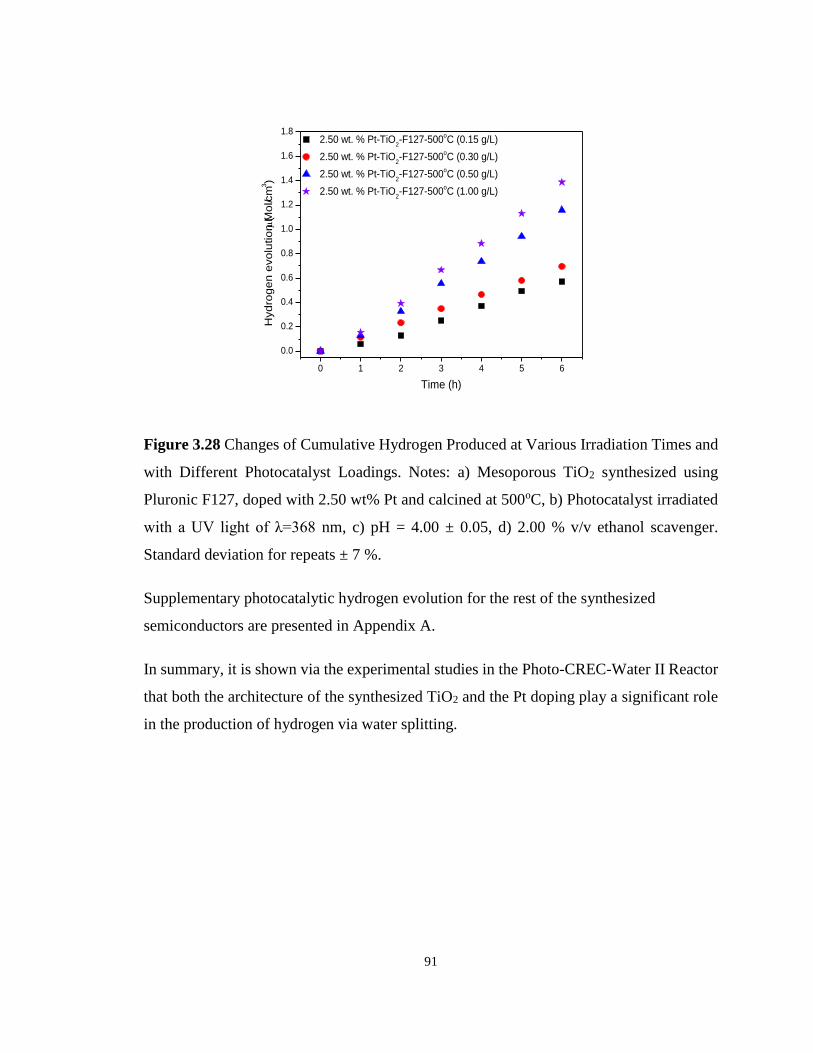
91
0 1 2 3 4 5 6
0.0
0.2
0.4
0.6
0.8
1.0
1.2
1.4
1.6
1.8
2.50 wt. % Pt-TiO2-F127-500
oC (0.15 g/L)
2.50 wt. % Pt-TiO2-F127-500
oC (0.30 g/L)
2.50 wt. % Pt-TiO2-F127-500
oC (0.50 g/L)
2.50 wt. % Pt-TiO2-F127-500
oC (1.00 g/L)
Hyd
rog
en
evo
lutio
n (M
ol/c
m3)
Time (h)
Figure 3.28 Changes of Cumulative Hydrogen Produced at Various Irradiation Times and
with Different Photocatalyst Loadings. Notes: a) Mesoporous TiO2 synthesized using
Pluronic F127, doped with 2.50 wt% Pt and calcined at 500oC, b) Photocatalyst irradiated
with a UV light of λ=368 nm, c) pH = 4.00 ± 0.05, d) 2.00 % v/v ethanol scavenger.
Standard deviation for repeats ± 7 %.
Supplementary photocatalytic hydrogen evolution for the rest of the synthesized
semiconductors are presented in Appendix A.
In summary, it is shown via the experimental studies in the Photo-CREC-Water II Reactor
that both the architecture of the synthesized TiO2 and the Pt doping play a significant role
in the production of hydrogen via water splitting.
92
3.5 Conclusions
The following are the significant conclusions of the present chapter:
(a) Mesoporous TiO2 photocatalysts were successfully synthesized using a Pluronic P123
template and a Pluronic F127 template.
(b) The synthesized mesoporous TiO2 were characterized using nitrogen adsorption, XRD
diffraction and Scanning Electron Microscopy (SEM). The obtained nitrogen
adsorption isotherms allowed one to calculate the specific surface area at the 150 cm2/g-
1 level, pore size of up to 40 nm.
(c) XRD was particularly useful to identify the anatase and rutile crystalline phases in both
the mesoporous TiO2 and Pt-TiO2 photocatalysts. Anatase was the dominant phase
found in the synthesized mesoporous semiconductors.
(d) Reactivity studies for hydrogen production demonstrate the major importance of both
the mesoporous TiO2 structure and the Pt loading. It is on this basis, and given the
value of the mesoporous TiO2 photocatalysts synthesized with Pluronic F127 up 10
times higher in photoactivity compared to the observed using Pluronic P-123, that
further studies documented in Chapters 4 and 5 were developed.
93
3.6 References
[1] Soler-Illia, G.J.A.A.; Sanchez, C.; Lebeau, B.; Patarin, J. Chemical strategies to design
textured materials: From microporous and mesoporous oxides to nanonetworks and
hierarchical structures. Chem. Rev. 2002, 102, 4093–4138.
[2] Wan, Y.; Zhao, D. On the controllable soft-templating approach to mesoporous silicates.
Chem. Rev. 2007, 107, 2821–2860.
[3] Corma, A. From microporous to mesoporous molecular sieve materials and their use in
catalysis. Chem. Rev. 1997, 97, 2373–2420.
[4] Corma, A. Preparation and catalytic properties of new mesoporous materials. Top. Catal.
1997, 4, 249–260.
[5] Sing, K.S.W.; Everett, D.H.; Haul, R.A.W.; Moscou, L.; Pierotti, R.A.; Rouquerol, J.;
Siemieniewska, T. Reporting physisorption data for gas/solid systems with special
reference to the determination of surface area and porosity. Pure Appl. Chem. 1985, 57,
603–619.
[6] Brinker, C.J. Evaporation-induced self-assembly: Functional nanostructures made easy.
MRS Bull. 2004, 29, 631–640.
[7] Meynen, V.; Cool, P.; Vansant, E.F. Verified syntheses of mesoporous materials.
Microporous Mesoporous Mater. 2009, 125, 170–223.
[8] Lee J, Han S, Hyeon T. Synthesis of new nanoporous carbon materials using
nanostructured silica materials as templates. 2004, 478–486.
[9] Zhang J, Zhou P, Liu J, Yu J. New understanding of the difference of photocatalytic
activity among anatase, rutile and brookite TiO2. Phys Chem 2014,16,20382–20386.
[10] Zhao XS, Su F, Yan Q. Templating methods for preparation of porous structures. J
Mater Chem. 2006, 16, 637.
94
Chapter 4
4 Photocatalytic Hydrogen Production Using Mesoporous TiO2 Doped with Pt
The information presented in this chapter is based on the article entitled "Photocatalytic
hydrogen production using mesoporous TiO2 doped with Pt", published in Applied
Catalysis B: Environmental Vol. 211 p. 337-348, in August 2017. The sections reported in
this chapter contribute towards the fulfilment of the general objectives a) and b) of the PhD
Dissertation as described in section 1.1.
4.1 Introduction
Currently, fossil energy resources are used extensively to satisfy most of the world’s energy
requirements. Projection of energy use and availability suggests that in the near future,
there will be major issues and challenges to be faced with energy supply and demand.
Additionally, combustion of fossil fuels leads to atmospheric emissions of carbon particles,
CO2 and noxious gases such as NOx, SOx. Thus, environmentally friendly fuels, that are
both cost-effective and easily storable, are of great importance for the world's sustainable
development [1].
Hydrogen is, in this respect, an ideal candidate as an energy vector [2]. Numerous
technologies can be used to generate hydrogen. However, only a few of them can be
considered as truly environmentally friendly. Steam hydrocarbon reforming is the current
dominant technology for hydrogen production. It requires high temperatures (700–
1100 °C) and emits large amounts of CO2 [3]. Hence, efforts focused on water splitting are
of great potential significance. Water splitting using solar energy is one of the most
attractive approaches to produce hydrogen. Water splitting is an eco-friendly process that
can be operated at ambient temperature and pressure. This process can take advantage from
sunlight; an abundant and inexpensive renewable energy source [4,5,6].
The most important issue still to be addressed is the low quantum efficiency of
photocatalytic materials in photocatalytic hydrogen production. This is related with
restrictions in band gap excitation as well as recombination of charge carriers in
95
semiconductor photocatalysts. Thus, promoting too low hydrogen evolution rates, which
up to date have limited the practical application of this technology on a large scale.
In photocatalytic water splitting, photons are absorbed by semiconductors, and as a result,
water splits into hydrogen and oxygen. Nevertheless, water splitting is not
thermodynamically favored. Current research focuses on increasing both the efficiency and
stability of the materials [7,8]. This is essential to achieve the commercialization of this
process [9,10].
Semiconductors are characterized by two types of mobile carriers: a) electrons in the
conduction band and b) holes in the valence band. Both bands are separated by an energy
gap. There is a continuous transition of electrons between bands. When a valence electron
is given an energy equal or greater than the energy band gap, it is transferred to the
conduction band, leading to a pair electron-hole formation. When an electron falls from the
conduction band into the valence band, and into a hole, a recombination occurs.
Among the various semiconductors, TiO2 has been extensively studied due to its
photosensitivity, low cost, low toxicity, and good chemical and thermal stability. There are
two main issues with TiO2. On one hand, TiO2 can be activated mainly by near ultraviolet
irradiation (near-UV) due to its wide band gap (3.20 eV for anatase and 3.00 eV for rutile),
which limits its practical efficiency while using solar energy. In addition, near-UV
radiation makes up only 4-5% of the solar spectrum, further reducing its potential
applications. On the other hand, a high electron hole recombination reduces the
photoelectric conversion efficiency of TiO2. This being one of the main limitations to
the practical application of photocatalysis as a viable technology for solar light
harvesting.
TiO2 can be modified with CdS, ZnO, PbS, Cu2O, Bi2S3, and CdSe forming TiO2
composites. Theoretically combining n-type TiO2 with p-type semiconductors is effective
in improving the photoelectric TiO2 conversion efficiency. Many of these modified
materials have received less attention due to, under illumination in contact with water,
they can experience photocorrosion (e.g. Zn2+ or Cd2+ dissolution). A reliable
alternative to improving photoelectric conversion is the addition of noble metals (e.g. Pt,
96
Au, Ag and Pd) during the semiconductor synthesis. Noble metals addition favors water
splitting given the separation of photoproduced electron-hole pairs because: a) the surface
plasmon resonance of noble metal particles can be excited by visible light, (b) the energy
band gap is reduced, and c) the noble metal nanoparticles act as electron traps [45-47].
CREC-UWO research group developed a platinum modified TiO2 photocatalyst [33-36].
Pt modified photocatalysts were evaluated in a Photo-CREC Water-II (PCWII) Reactor
using 2% v/v ethanol water acidic solutions (pH = 4.00 ± 0.05) under near-UV light
irradiation [36]. Low grade ethanol is a renewable carbon containing scavenger.
Dissociated water and photon activated semiconductors yield H• and •OH. Pairs of H•
radicals combine forming H2, while the ethanol •OH scavenger forms CO2, CH4 and C2H6.
Under oxygen-free conditions, Quantum Yields (QY) as high as 8 % were obtained.
Hydrogen was produced in a stable process with no detectable photocatalyst deactivation.
4.2 Photocatalyst Engineering
A phenomenological approach for photocatalyst design for hydrogen production involves
the followings: a) Semiconductor purity: the highest possible anatase content close to
100%. This appears to enhance under concurrent conversion of an ethanol scavengers,
hydrogen production, b) Surface area of the mesoporous TiO2: the highest possible. This
can be accomplished with a mesoporous TiO2 with a regular and nanometric pore sizes, c)
Crystallite size: the smallest possible with Pt crystallites, consistent with the pore sizes and
pore volume of the synthesized mesoporous TiO2. This can lead to a nanometric Pt
crystallites and high Pt metal dispersion.
4.3 Experimental Methods
4.3.1 Preparation of Mesoporous Titania Nanoparticles
The copolymer surfactant –CH2CH2O-106-CH2(CH3)CHO-70–CH2CH2O-106 (Pluronic
F127, MAVG =12600) was used as a structure-directing template. Hydrochloric acid of 37%
purity, as well as citric acid and titanium (IV) isopropoxide (Sigma Aldrich Ti(OC3H7)4),
were employed as co-reactants.
97
In a typical synthesis, 400 mL of ethanol (CH3CH2OH) from Commercial Alcohols (A
Trade Name of Greenfield Specialty Alcohols) were acidified with 33.00 g of hydrochloric
acid (37 wt. % purity). After combining these reagents, 20.00 g of Pluronic F127 were
added, and the suspension was mixed until dissolution (0.5 h). Then, 6.30 g of citric acid
were incorporated under intense stirring. Following this procedure, the solution pH was
adjusted to 0.75. Mixing continued at ambient temperature for 1 h. Once this step was
completed, 28.50 g of titanium (IV) isopropoxide were added dropwise. The resultant
liquid phase, displaying a sol-gel appearance, was mixed for 24 h. At the end of this period,
it was split in two equal solutions, labelled A and B. The resulting sol-gel phases were
evaporated and calcined by gradually increasing the temperature, from room temperature
to 773 K (500°C) for flask A and to 823 K (550°C) for flask B at a 1° C/min heating rate.
Once the desired thermal level was reached (i.e. 773 K for A and 823 K for B), this
temperature was kept during 6 h under ambient air to calcine the sample and combust the
organic template.
Synthesis conditions selected secured template-free self-assembled mesoporous titania
nanoparticles. Samples obtained following this process were labeled as TiO2- Meso-500oC
and TiO2- Meso-550oC, respectively.
Given the importance of doping TiO2 with Pt for water splitting [36], the synthesized
mesoporous titania of the present study, was also doped with platinum incorporated into
the TiO2 lattice. Titanium (IV) isopropoxide template method was modified with the use
of hexachloroplatinic acid hydrate (Sigma Aldrich H2PtCl6*xH2O). Titanium (IV)
isopropoxide was added in the sol-gel concurrently with the Pt containing species.
Samples prepared using the above described steps were designated as: a) 1.00 wt. % Pt-
TiO2-Meso-500oC and 2.50 wt. % Pt-Meso-TiO2-500oC and b) 1.00 wt. % Pt- TiO2- Meso-
550oC, and 2.50 wt. % Pt-TiO2- Meso-550oC.
4.3.2 Photocatalytic Performance
The photocatalytic activity of the synthesized semiconductors was determined using a
Photo-CREC Water-II bench scale photoreactor (PCWII) [36] containing a hydrogen
98
storage tank with jet driving mixing. PCWII is comprised of a 2.65 L internally irradiated
slurry annular section and a total 6.00 L slurry volume. A 15 W EIKO T8 Black-Light-
Blue (BLB) lamp is the light source. This lamp displays a wavelength peak at 370 nm and
emits in the range of 320 nm to 410 nm. The photocatalyst loading was evaluated in the
range 0.05-1.00 g/l in an acid medium (pH = 4.00 ± 0.05). A 1.00 g of TiO2/Liter loading
was used with Pt embedded in the mesoporous TiO2. This was done to ensure that a 90 %
of the incident energy was absorbed in all experiments. Absolute ethanol was used as a
renewable organic scavenger. Ethanol was kept at 2 % v/v as reported in our previous
studies [36].
4.3.3 Apparatus
Figure 4.1 reports a description of the Photo-CREC Water-II reactor with the following
components: (1) 15-W black light lamp or (BLB), (2) Pyrex glass inner tube with a 3.58
cm diameter, (4) silica windows, (5) black polyethylene outer tube, (6) stirred tank, (7)
centrifugal pump, (8) purging gas injector, and (9) sampling port. 15-W lamp, 1.33 cm
radius, 41.3 cm length, black-light UV lamp is positioned at the center of the inner Pyrex
tube, which was selected given its high irradiation transmittance.
Figure 4.1 Schematic diagram of the Photo-CREC-Water-II photoreactor with a H2 mixing
tank: (1) BLB lamp, (2) Pyrex glass tube, (3) UV-opaque polyethylene cylinder, (4) fused-
silica windows, (5) centrifugal pump, (6) H2 storing/mixing tank, (7) gas sampling port,
(8) purging gas injector and (9) draining gas valve.
99
4.4 Photocatalyst Characterization
4.4.1 XRD diffractograms
Powder XRD spectra were taken on using a Rigaku Rotating Anode X-Ray Diffractometer
employing CuKa radiation. The instrument was operated at 45 kV and 160 mA. X-rays
were collimated using 1° divergent and scatter slits, and a 0.15-mm receiving slit.
Continuous scans were collected over the 2θ range 20-80 º with a step size of 0.02 º for a
dwell time of 2 seconds per step.
Figure 4.2 XRD diffractograms of the photoactive materials for hydrogen production.
XRD diffractograms were overlapped for comparison. (Δ) represents TiO2 in the anatase
phase and (R) indicates TiO2 in the rutile phase.
One can observe in Figure 4.2 that the characteristic crystalline phases for TiO2 are also
present in the mesoporous TiO2 calcined at 500 oC and 550 oC, respectively. Figure 4.2
also provides XRD for other TiO2-based photocatalysts doped with platinum, curves (g)-
(l). For those cases, the characteristic anatase peaks at the 2θ diffraction angles of 25, 38,
48, 54, 63, 69, 70.5 and 75o corresponding to the planes (101), (004), (200), (105), (204),
(116), (220) and (215) were consistently observed. Figure 4.2 (d) shows small extra peaks
(a) Anatase
(b) Rutile
(c) Degussa P25
(d) 1.00 wt. % Pt-Degussa P25
(e) TiO2-Meso-500oC
(f) TiO2-Meso-550oC
(g) 1.00 wt. % Pt-TiO2-Meso-500oC
(h) 1.00 wt. % Pt-TiO2-Meso-550oC
(i) 2.50 wt. % Pt-TiO2-Meso-500oC
(j) 2.50 wt. % Pt-TiO2-Meso-550oC
(k) 5.00 wt. % Pt-TiO2-Meso-500oC
(l) 5.00 wt. % Pt-TiO2-Meso-550oC
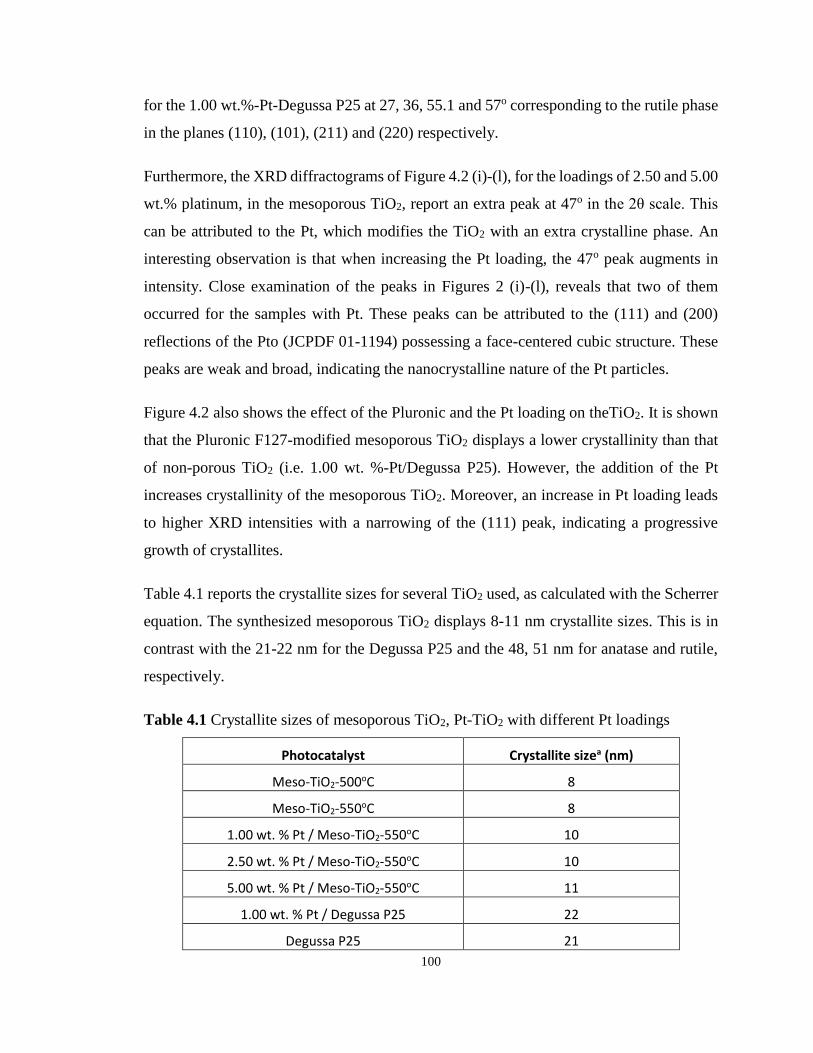
100
for the 1.00 wt.%-Pt-Degussa P25 at 27, 36, 55.1 and 57o corresponding to the rutile phase
in the planes (110), (101), (211) and (220) respectively.
Furthermore, the XRD diffractograms of Figure 4.2 (i)-(l), for the loadings of 2.50 and 5.00
wt.% platinum, in the mesoporous TiO2, report an extra peak at 47o in the 2θ scale. This
can be attributed to the Pt, which modifies the TiO2 with an extra crystalline phase. An
interesting observation is that when increasing the Pt loading, the 47o peak augments in
intensity. Close examination of the peaks in Figures 2 (i)-(l), reveals that two of them
occurred for the samples with Pt. These peaks can be attributed to the (111) and (200)
reflections of the Pto (JCPDF 01-1194) possessing a face-centered cubic structure. These
peaks are weak and broad, indicating the nanocrystalline nature of the Pt particles.
Figure 4.2 also shows the effect of the Pluronic and the Pt loading on theTiO2. It is shown
that the Pluronic F127-modified mesoporous TiO2 displays a lower crystallinity than that
of non-porous TiO2 (i.e. 1.00 wt. %-Pt/Degussa P25). However, the addition of the Pt
increases crystallinity of the mesoporous TiO2. Moreover, an increase in Pt loading leads
to higher XRD intensities with a narrowing of the (111) peak, indicating a progressive
growth of crystallites.
Table 4.1 reports the crystallite sizes for several TiO2 used, as calculated with the Scherrer
equation. The synthesized mesoporous TiO2 displays 8-11 nm crystallite sizes. This is in
contrast with the 21-22 nm for the Degussa P25 and the 48, 51 nm for anatase and rutile,
respectively.
Table 4.1 Crystallite sizes of mesoporous TiO2, Pt-TiO2 with different Pt loadings
Photocatalyst Crystallite sizea (nm)
Meso-TiO2-500oC 8
Meso-TiO2-550oC 8
1.00 wt. % Pt / Meso-TiO2-550oC 10
2.50 wt. % Pt / Meso-TiO2-550oC 10
5.00 wt. % Pt / Meso-TiO2-550oC 11
1.00 wt. % Pt / Degussa P25 22
Degussa P25 21
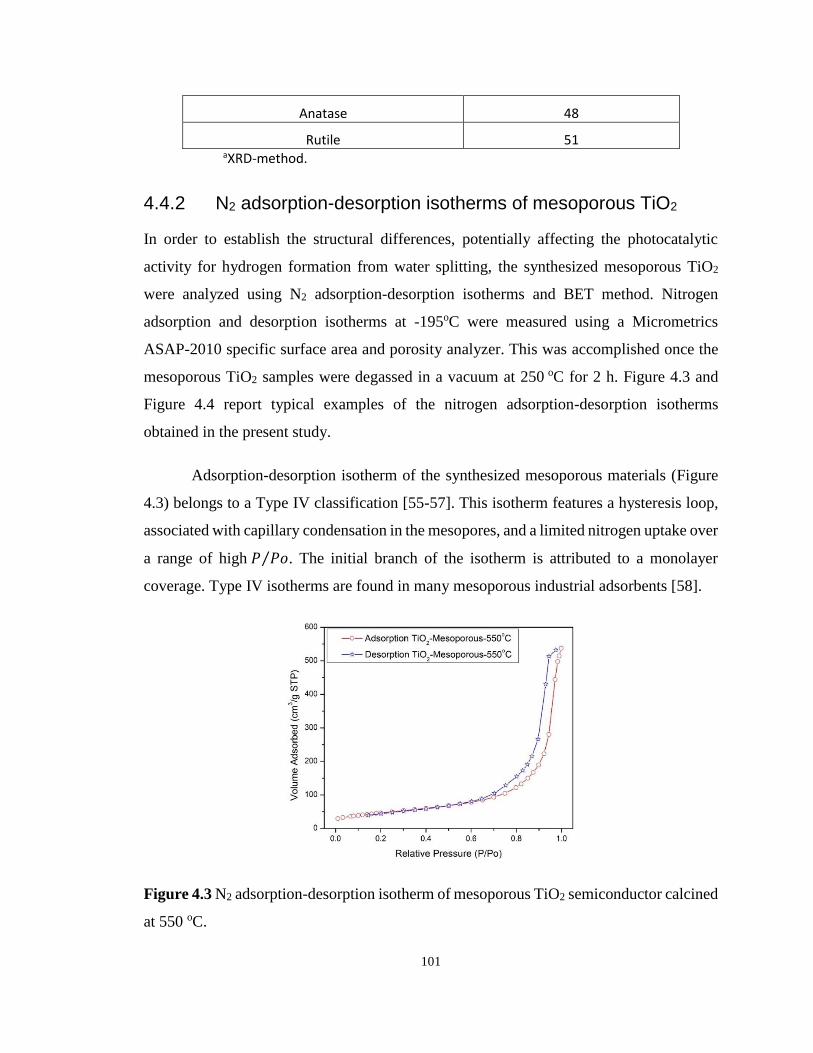
101
Anatase 48
Rutile 51 aXRD-method.
4.4.2 N2 adsorption-desorption isotherms of mesoporous TiO2
In order to establish the structural differences, potentially affecting the photocatalytic
activity for hydrogen formation from water splitting, the synthesized mesoporous TiO2
were analyzed using N2 adsorption-desorption isotherms and BET method. Nitrogen
adsorption and desorption isotherms at -195oC were measured using a Micrometrics
ASAP-2010 specific surface area and porosity analyzer. This was accomplished once the
mesoporous TiO2 samples were degassed in a vacuum at 250 oC for 2 h. Figure 4.3 and
Figure 4.4 report typical examples of the nitrogen adsorption-desorption isotherms
obtained in the present study.
Adsorption-desorption isotherm of the synthesized mesoporous materials (Figure
4.3) belongs to a Type IV classification [55-57]. This isotherm features a hysteresis loop,
associated with capillary condensation in the mesopores, and a limited nitrogen uptake over
a range of high 𝑃 𝑃𝑜⁄ . The initial branch of the isotherm is attributed to a monolayer
coverage. Type IV isotherms are found in many mesoporous industrial adsorbents [58].
Figure 4.3 N2 adsorption-desorption isotherm of mesoporous TiO2 semiconductor calcined
at 550 oC.
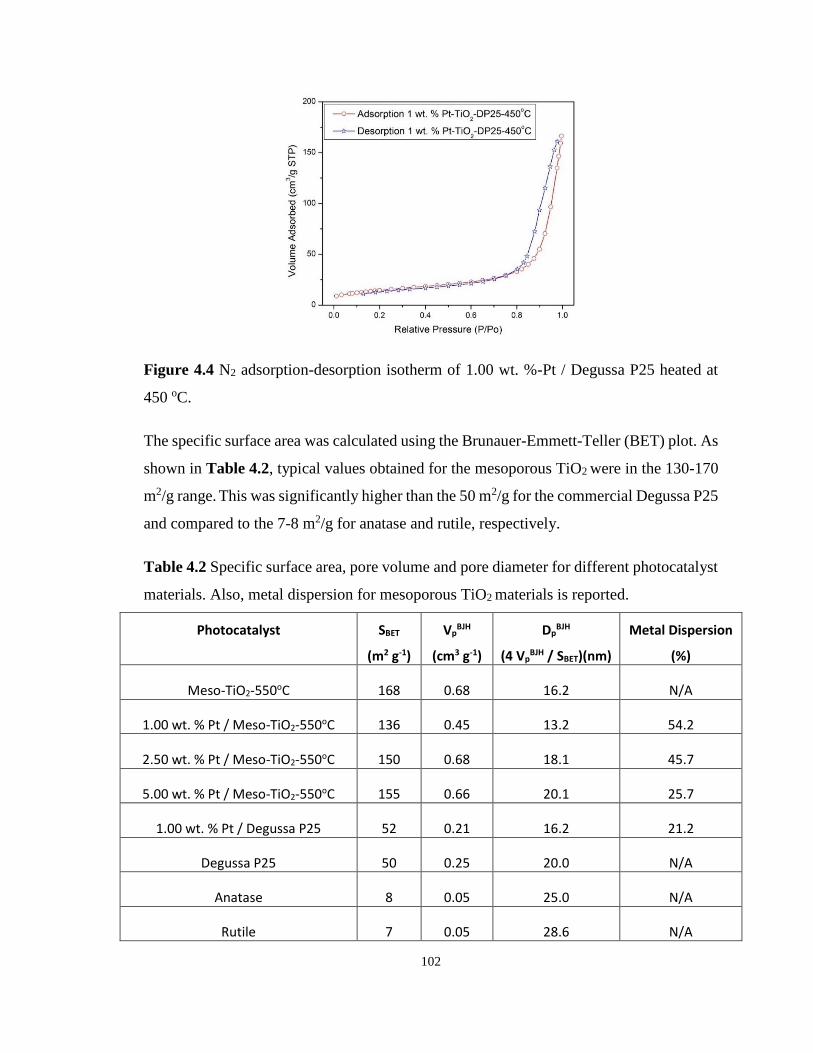
102
Figure 4.4 N2 adsorption-desorption isotherm of 1.00 wt. %-Pt / Degussa P25 heated at
450 oC.
The specific surface area was calculated using the Brunauer-Emmett-Teller (BET) plot. As
shown in Table 4.2, typical values obtained for the mesoporous TiO2 were in the 130-170
m2/g range. This was significantly higher than the 50 m2/g for the commercial Degussa P25
and compared to the 7-8 m2/g for anatase and rutile, respectively.
Table 4.2 Specific surface area, pore volume and pore diameter for different photocatalyst
materials. Also, metal dispersion for mesoporous TiO2 materials is reported.
Photocatalyst SBET
(m2 g-1)
VpBJH
(cm3 g-1)
DpBJH
(4 VpBJH / SBET)(nm)
Metal Dispersion
(%)
Meso-TiO2-550oC 168 0.68 16.2 N/A
1.00 wt. % Pt / Meso-TiO2-550oC 136 0.45 13.2 54.2
2.50 wt. % Pt / Meso-TiO2-550oC 150 0.68 18.1 45.7
5.00 wt. % Pt / Meso-TiO2-550oC 155 0.66 20.1 25.7
1.00 wt. % Pt / Degussa P25 52 0.21 16.2 21.2
Degussa P25 50 0.25 20.0 N/A
Anatase 8 0.05 25.0 N/A
Rutile 7 0.05 28.6 N/A
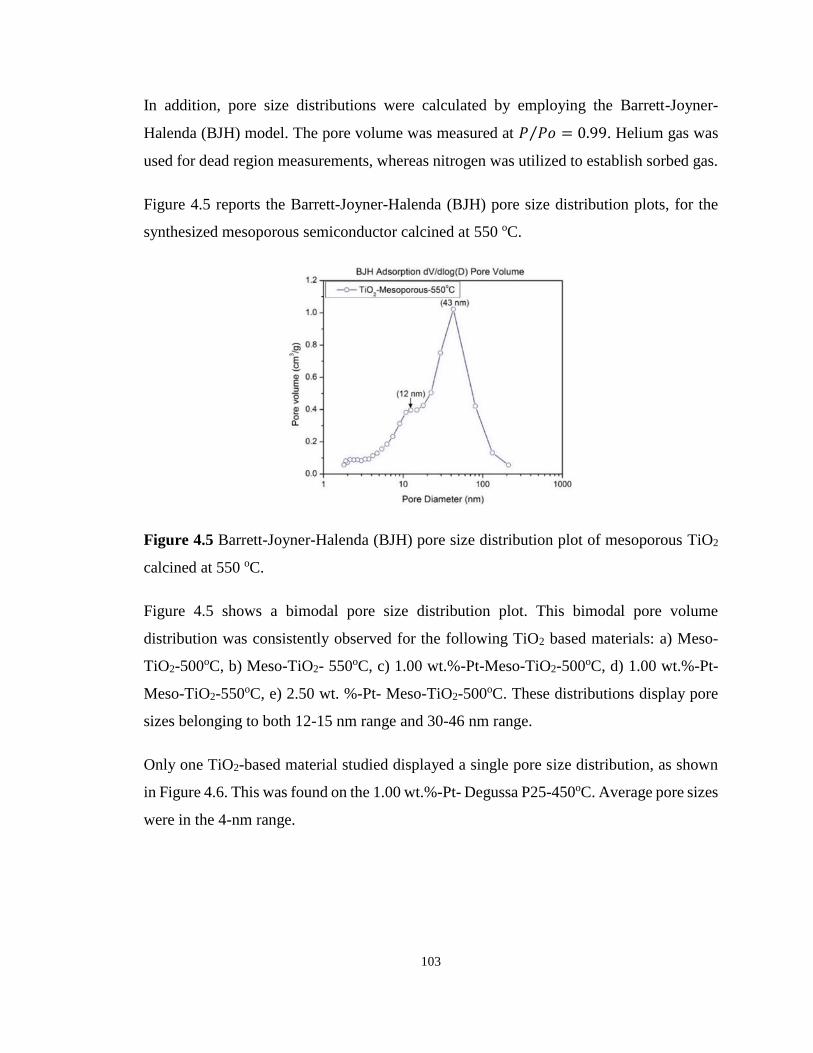
103
In addition, pore size distributions were calculated by employing the Barrett-Joyner-
Halenda (BJH) model. The pore volume was measured at 𝑃 𝑃𝑜 = 0.99⁄ . Helium gas was
used for dead region measurements, whereas nitrogen was utilized to establish sorbed gas.
Figure 4.5 reports the Barrett-Joyner-Halenda (BJH) pore size distribution plots, for the
synthesized mesoporous semiconductor calcined at 550 oC.
Figure 4.5 Barrett-Joyner-Halenda (BJH) pore size distribution plot of mesoporous TiO2
calcined at 550 oC.
Figure 4.5 shows a bimodal pore size distribution plot. This bimodal pore volume
distribution was consistently observed for the following TiO2 based materials: a) Meso-
TiO2-500oC, b) Meso-TiO2- 550oC, c) 1.00 wt.%-Pt-Meso-TiO2-500oC, d) 1.00 wt.%-Pt-
Meso-TiO2-550oC, e) 2.50 wt. %-Pt- Meso-TiO2-500oC. These distributions display pore
sizes belonging to both 12-15 nm range and 30-46 nm range.
Only one TiO2-based material studied displayed a single pore size distribution, as shown
in Figure 4.6. This was found on the 1.00 wt.%-Pt- Degussa P25-450oC. Average pore sizes
were in the 4-nm range.
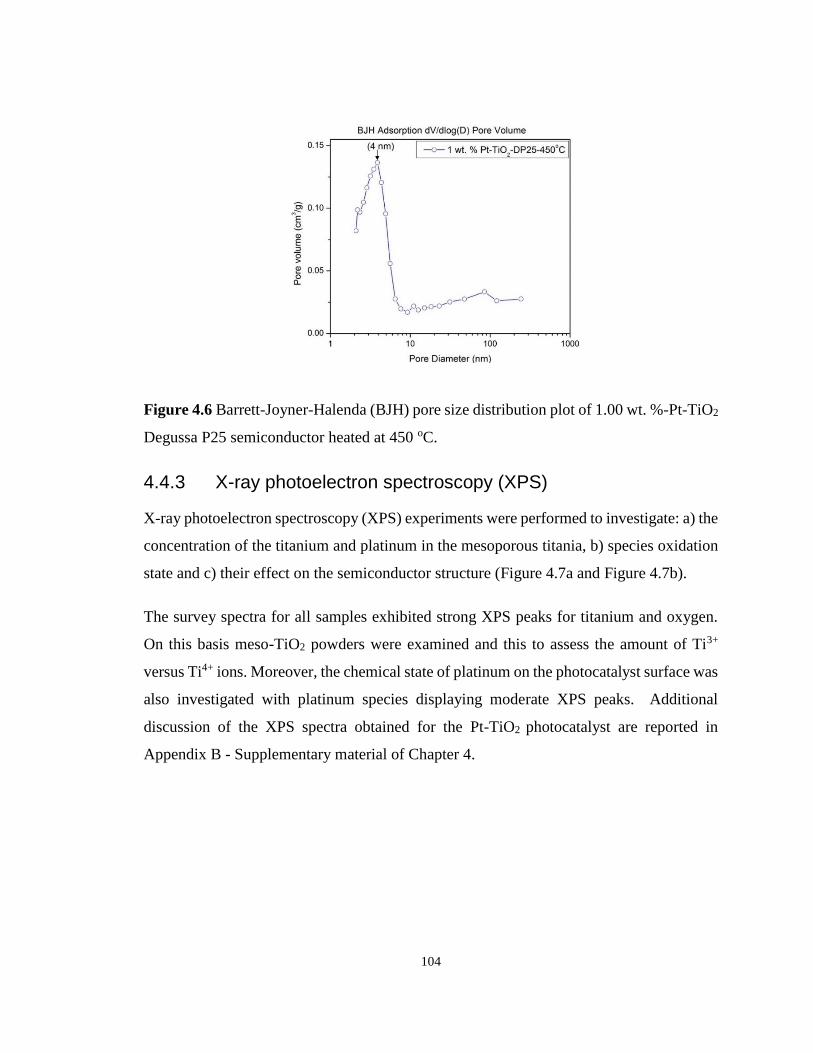
104
Figure 4.6 Barrett-Joyner-Halenda (BJH) pore size distribution plot of 1.00 wt. %-Pt-TiO2
Degussa P25 semiconductor heated at 450 oC.
4.4.3 X-ray photoelectron spectroscopy (XPS)
X-ray photoelectron spectroscopy (XPS) experiments were performed to investigate: a) the
concentration of the titanium and platinum in the mesoporous titania, b) species oxidation
state and c) their effect on the semiconductor structure (Figure 4.7a and Figure 4.7b).
The survey spectra for all samples exhibited strong XPS peaks for titanium and oxygen.
On this basis meso-TiO2 powders were examined and this to assess the amount of Ti3+
versus Ti4+ ions. Moreover, the chemical state of platinum on the photocatalyst surface was
also investigated with platinum species displaying moderate XPS peaks. Additional
discussion of the XPS spectra obtained for the Pt-TiO2 photocatalyst are reported in
Appendix B - Supplementary material of Chapter 4.
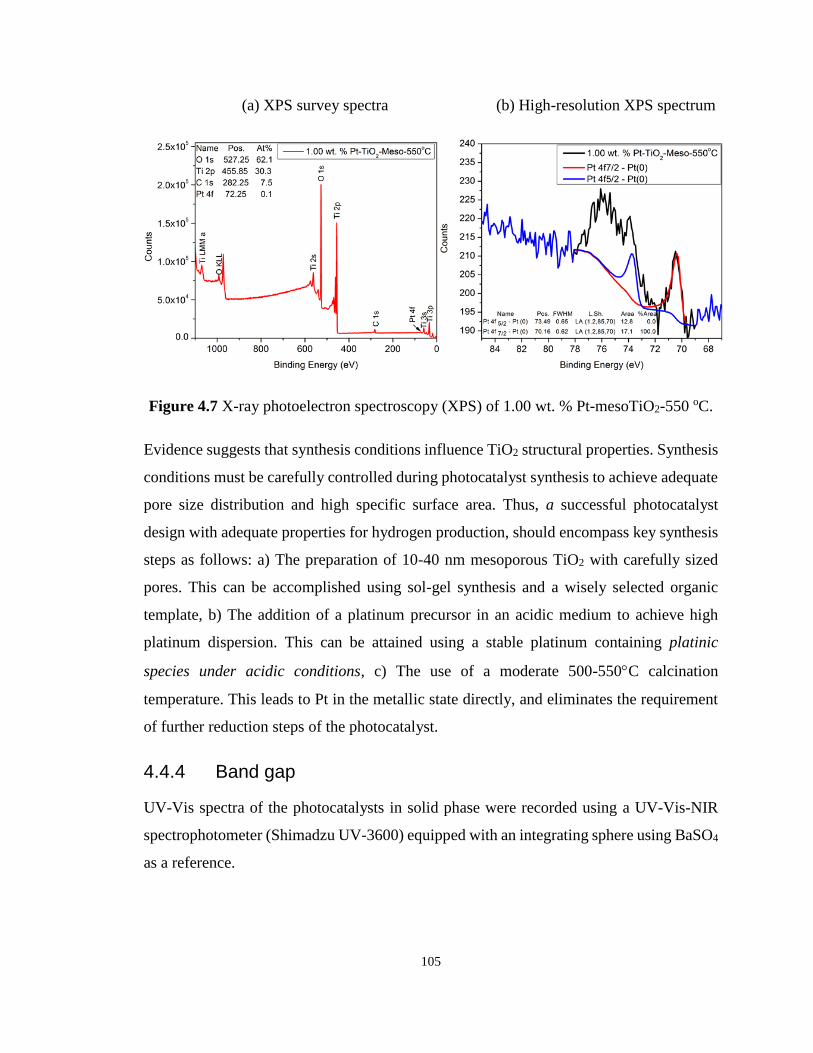
105
(a) XPS survey spectra (b) High-resolution XPS spectrum
Figure 4.7 X-ray photoelectron spectroscopy (XPS) of 1.00 wt. % Pt-mesoTiO2-550 oC.
Evidence suggests that synthesis conditions influence TiO2 structural properties. Synthesis
conditions must be carefully controlled during photocatalyst synthesis to achieve adequate
pore size distribution and high specific surface area. Thus, a successful photocatalyst
design with adequate properties for hydrogen production, should encompass key synthesis
steps as follows: a) The preparation of 10-40 nm mesoporous TiO2 with carefully sized
pores. This can be accomplished using sol-gel synthesis and a wisely selected organic
template, b) The addition of a platinum precursor in an acidic medium to achieve high
platinum dispersion. This can be attained using a stable platinum containing platinic
species under acidic conditions, c) The use of a moderate 500-550C calcination
temperature. This leads to Pt in the metallic state directly, and eliminates the requirement
of further reduction steps of the photocatalyst.
4.4.4 Band gap
UV-Vis spectra of the photocatalysts in solid phase were recorded using a UV-Vis-NIR
spectrophotometer (Shimadzu UV-3600) equipped with an integrating sphere using BaSO4
as a reference.
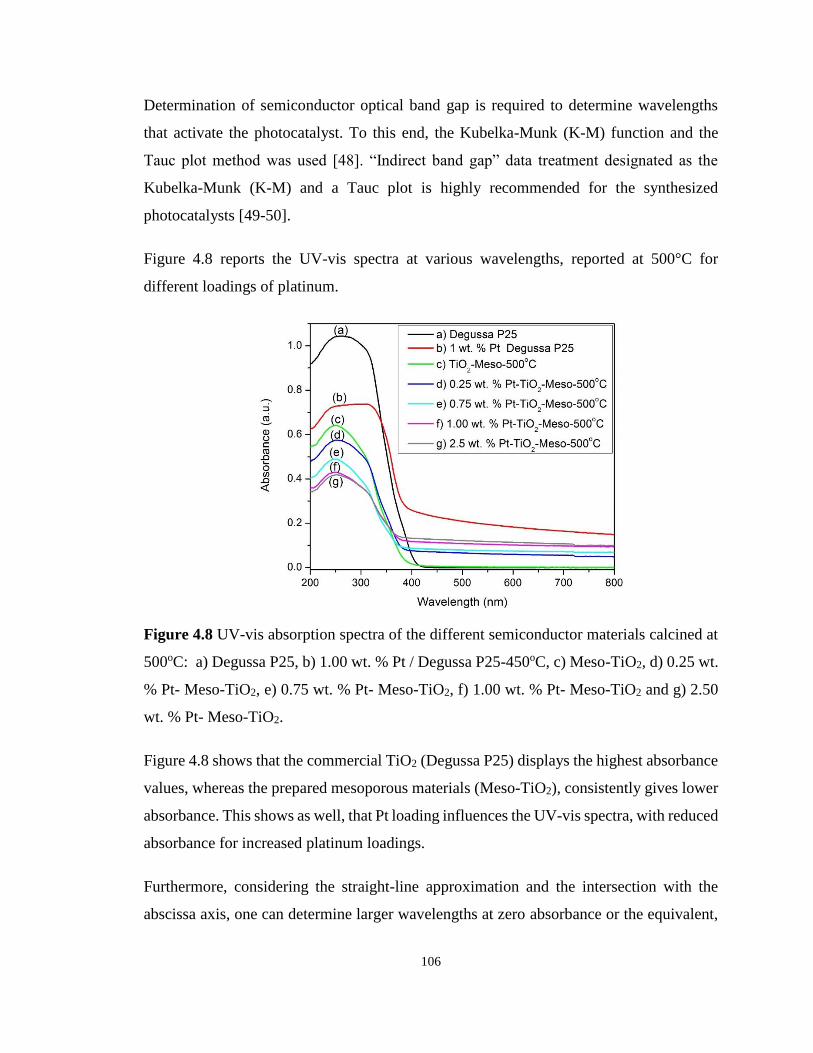
106
Determination of semiconductor optical band gap is required to determine wavelengths
that activate the photocatalyst. To this end, the Kubelka-Munk (K-M) function and the
Tauc plot method was used [48]. “Indirect band gap” data treatment designated as the
Kubelka-Munk (K-M) and a Tauc plot is highly recommended for the synthesized
photocatalysts [49-50].
Figure 4.8 reports the UV-vis spectra at various wavelengths, reported at 500°C for
different loadings of platinum.
Figure 4.8 UV-vis absorption spectra of the different semiconductor materials calcined at
500oC: a) Degussa P25, b) 1.00 wt. % Pt / Degussa P25-450oC, c) Meso-TiO2, d) 0.25 wt.
% Pt- Meso-TiO2, e) 0.75 wt. % Pt- Meso-TiO2, f) 1.00 wt. % Pt- Meso-TiO2 and g) 2.50
wt. % Pt- Meso-TiO2.
Figure 4.8 shows that the commercial TiO2 (Degussa P25) displays the highest absorbance
values, whereas the prepared mesoporous materials (Meso-TiO2), consistently gives lower
absorbance. This shows as well, that Pt loading influences the UV-vis spectra, with reduced
absorbance for increased platinum loadings.
Furthermore, considering the straight-line approximation and the intersection with the
abscissa axis, one can determine larger wavelengths at zero absorbance or the equivalent,
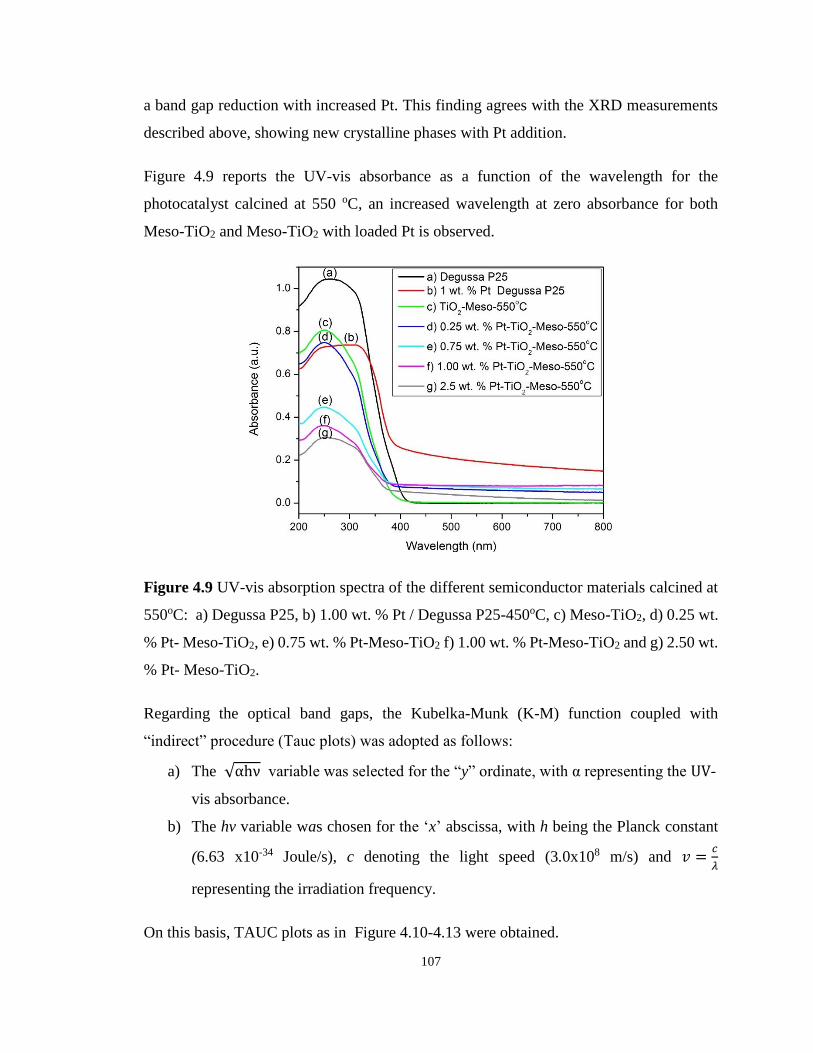
107
a band gap reduction with increased Pt. This finding agrees with the XRD measurements
described above, showing new crystalline phases with Pt addition.
Figure 4.9 reports the UV-vis absorbance as a function of the wavelength for the
photocatalyst calcined at 550 oC, an increased wavelength at zero absorbance for both
Meso-TiO2 and Meso-TiO2 with loaded Pt is observed.
Figure 4.9 UV-vis absorption spectra of the different semiconductor materials calcined at
550oC: a) Degussa P25, b) 1.00 wt. % Pt / Degussa P25-450oC, c) Meso-TiO2, d) 0.25 wt.
% Pt- Meso-TiO2, e) 0.75 wt. % Pt-Meso-TiO2 f) 1.00 wt. % Pt-Meso-TiO2 and g) 2.50 wt.
% Pt- Meso-TiO2.
Regarding the optical band gaps, the Kubelka-Munk (K-M) function coupled with
“indirect” procedure (Tauc plots) was adopted as follows:
a) The √αhν variable was selected for the “y” ordinate, with α representing the UV-
vis absorbance.
b) The hv variable was chosen for the ‘x’ abscissa, with h being the Planck constant
(6.63 x10⁻³⁴ Joule/s), c denoting the light speed (3.0x10⁸ m/s) and 𝑣 =𝑐
𝜆
representing the irradiation frequency.
On this basis, TAUC plots as in Figure 4.10-4.13 were obtained.
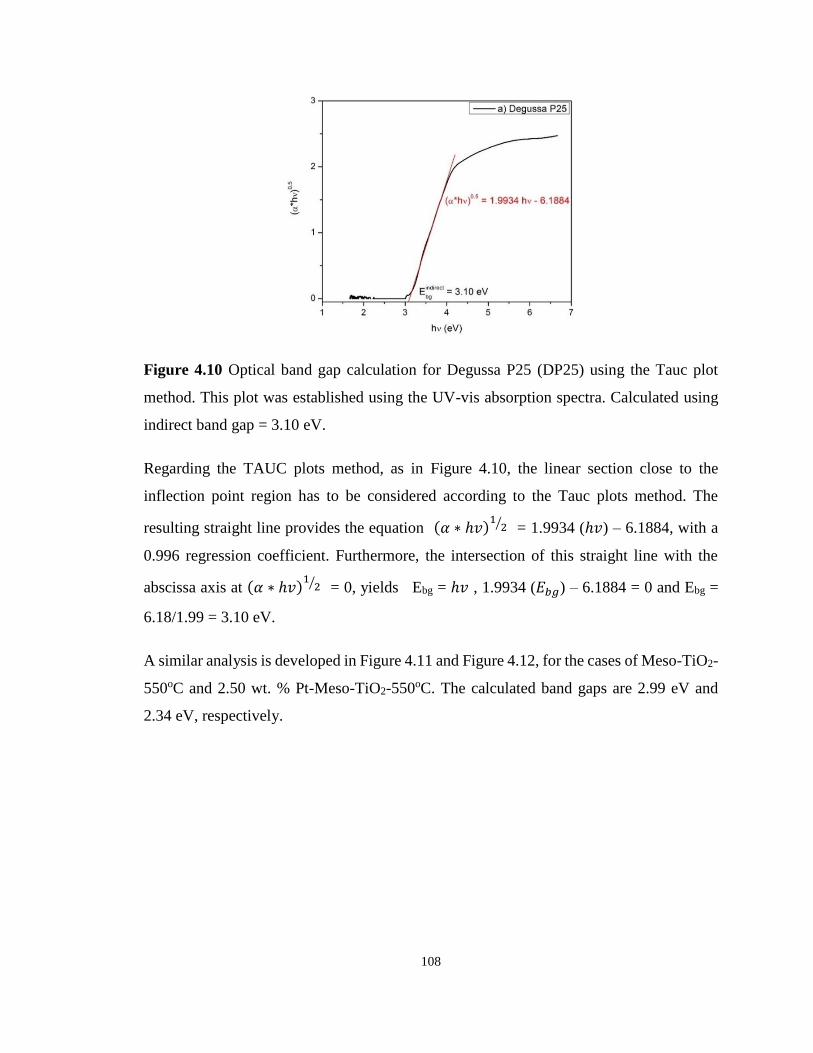
108
Figure 4.10 Optical band gap calculation for Degussa P25 (DP25) using the Tauc plot
method. This plot was established using the UV-vis absorption spectra. Calculated using
indirect band gap = 3.10 eV.
Regarding the TAUC plots method, as in Figure 4.10, the linear section close to the
inflection point region has to be considered according to the Tauc plots method. The
resulting straight line provides the equation (𝛼 ∗ ℎ𝑣)1
2⁄ = 1.9934 (ℎ𝑣) – 6.1884, with a
0.996 regression coefficient. Furthermore, the intersection of this straight line with the
abscissa axis at (𝛼 ∗ ℎ𝑣)1
2⁄ = 0, yields Ebg = ℎ𝑣 , 1.9934 (𝐸𝑏𝑔) – 6.1884 = 0 and Ebg =
6.18/1.99 = 3.10 eV.
A similar analysis is developed in Figure 4.11 and Figure 4.12, for the cases of Meso-TiO2-
550oC and 2.50 wt. % Pt-Meso-TiO2-550oC. The calculated band gaps are 2.99 eV and
2.34 eV, respectively.
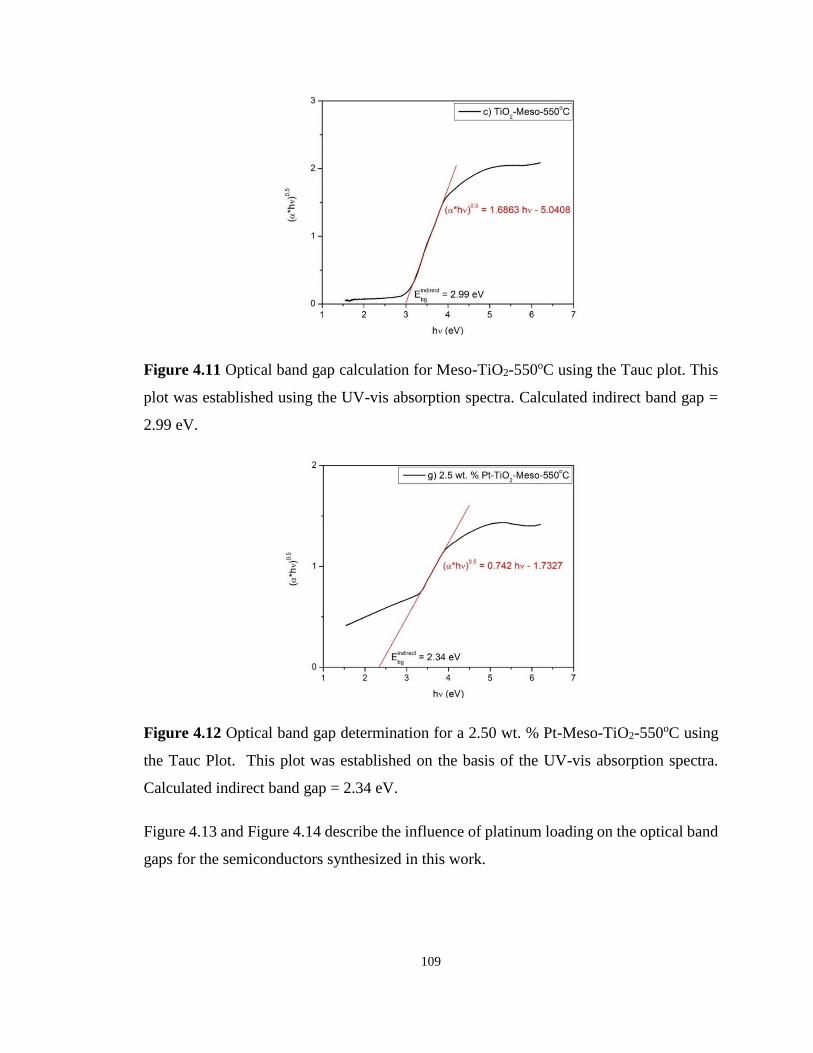
109
Figure 4.11 Optical band gap calculation for Meso-TiO2-550oC using the Tauc plot. This
plot was established using the UV-vis absorption spectra. Calculated indirect band gap =
2.99 eV.
Figure 4.12 Optical band gap determination for a 2.50 wt. % Pt-Meso-TiO2-550oC using
the Tauc Plot. This plot was established on the basis of the UV-vis absorption spectra.
Calculated indirect band gap = 2.34 eV.
Figure 4.13 and Figure 4.14 describe the influence of platinum loading on the optical band
gaps for the semiconductors synthesized in this work.
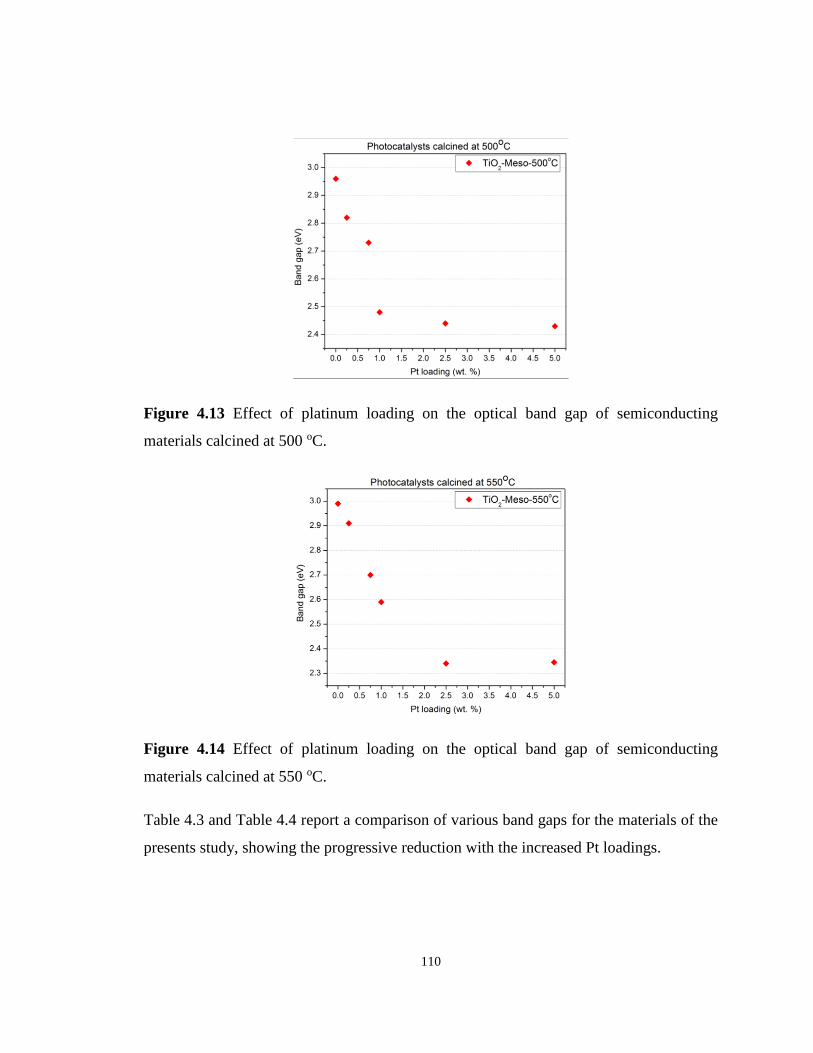
110
Figure 4.13 Effect of platinum loading on the optical band gap of semiconducting
materials calcined at 500 oC.
Figure 4.14 Effect of platinum loading on the optical band gap of semiconducting
materials calcined at 550 oC.
Table 4.3 and Table 4.4 report a comparison of various band gaps for the materials of the
presents study, showing the progressive reduction with the increased Pt loadings.
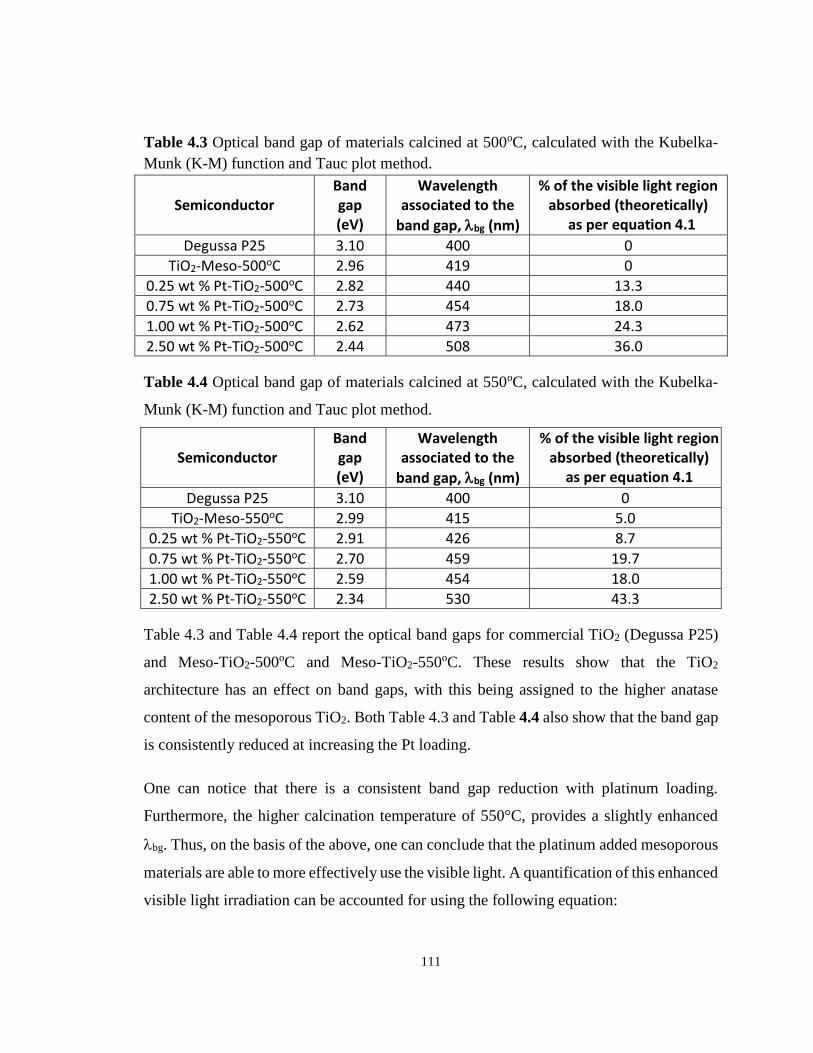
111
Table 4.3 Optical band gap of materials calcined at 500oC, calculated with the Kubelka-
Munk (K-M) function and Tauc plot method.
Semiconductor
Band gap (eV)
Wavelength associated to the
band gap, bg (nm)
% of the visible light region absorbed (theoretically)
as per equation 4.1
Degussa P25 3.10 400 0
TiO2-Meso-500oC 2.96 419 0
0.25 wt % Pt-TiO2-500oC 2.82 440 13.3
0.75 wt % Pt-TiO2-500oC 2.73 454 18.0
1.00 wt % Pt-TiO2-500oC 2.62 473 24.3
2.50 wt % Pt-TiO2-500oC 2.44 508 36.0
Table 4.4 Optical band gap of materials calcined at 550oC, calculated with the Kubelka-
Munk (K-M) function and Tauc plot method.
Semiconductor
Band gap (eV)
Wavelength associated to the
band gap, bg (nm)
% of the visible light region absorbed (theoretically)
as per equation 4.1
Degussa P25 3.10 400 0
TiO2-Meso-550oC 2.99 415 5.0
0.25 wt % Pt-TiO2-550oC 2.91 426 8.7
0.75 wt % Pt-TiO2-550oC 2.70 459 19.7
1.00 wt % Pt-TiO2-550oC 2.59 454 18.0
2.50 wt % Pt-TiO2-550oC 2.34 530 43.3
Table 4.3 and Table 4.4 report the optical band gaps for commercial TiO2 (Degussa P25)
and Meso-TiO2-500oC and Meso-TiO2-550oC. These results show that the TiO2
architecture has an effect on band gaps, with this being assigned to the higher anatase
content of the mesoporous TiO2. Both Table 4.3 and Table 4.4 also show that the band gap
is consistently reduced at increasing the Pt loading.
One can notice that there is a consistent band gap reduction with platinum loading.
Furthermore, the higher calcination temperature of 550°C, provides a slightly enhanced
bg. Thus, on the basis of the above, one can conclude that the platinum added mesoporous
materials are able to more effectively use the visible light. A quantification of this enhanced
visible light irradiation can be accounted for using the following equation:
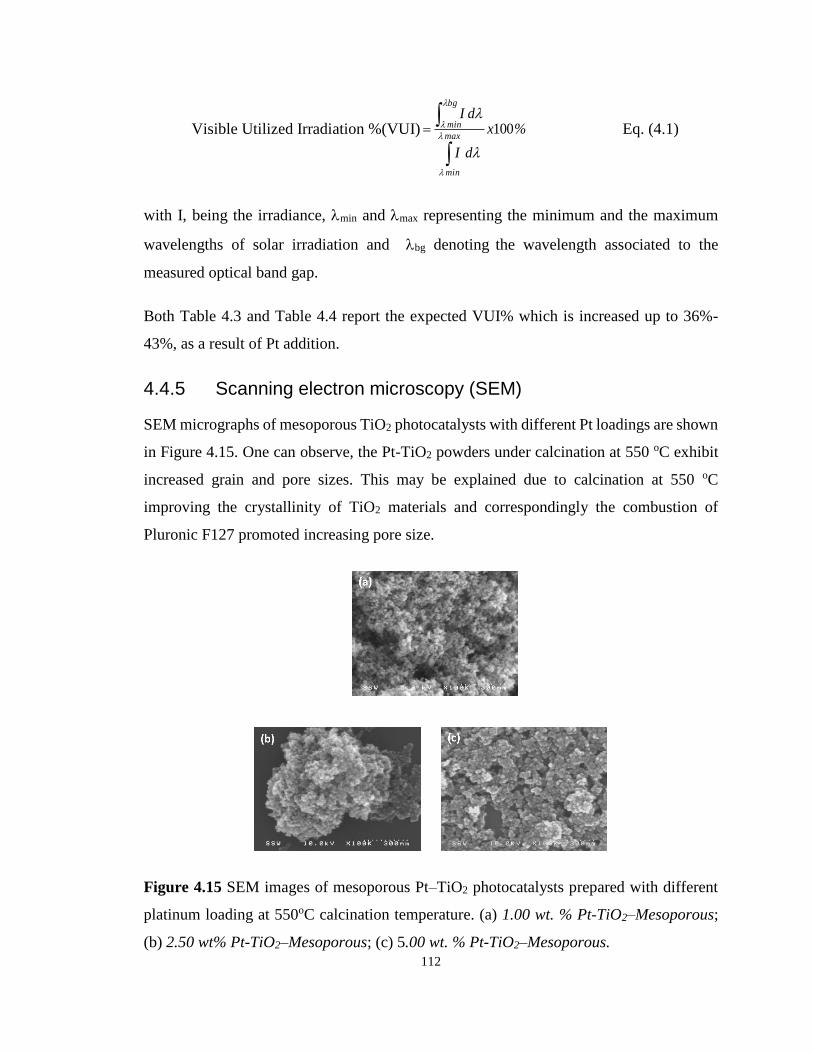
112
Visible Utilized Irradiation %(VUI) %x
dI
dI
max
min
bg
min 100
Eq. (4.1)
with I, being the irradiance, min and max representing the minimum and the maximum
wavelengths of solar irradiation and bg denoting the wavelength associated to the
measured optical band gap.
Both Table 4.3 and Table 4.4 report the expected VUI% which is increased up to 36%-
43%, as a result of Pt addition.
4.4.5 Scanning electron microscopy (SEM)
SEM micrographs of mesoporous TiO2 photocatalysts with different Pt loadings are shown
in Figure 4.15. One can observe, the Pt-TiO2 powders under calcination at 550 oC exhibit
increased grain and pore sizes. This may be explained due to calcination at 550 oC
improving the crystallinity of TiO2 materials and correspondingly the combustion of
Pluronic F127 promoted increasing pore size.
Figure 4.15 SEM images of mesoporous Pt–TiO2 photocatalysts prepared with different
platinum loading at 550oC calcination temperature. (a) 1.00 wt. % Pt-TiO2–Mesoporous;
(b) 2.50 wt% Pt-TiO2–Mesoporous; (c) 5.00 wt. % Pt-TiO2–Mesoporous.
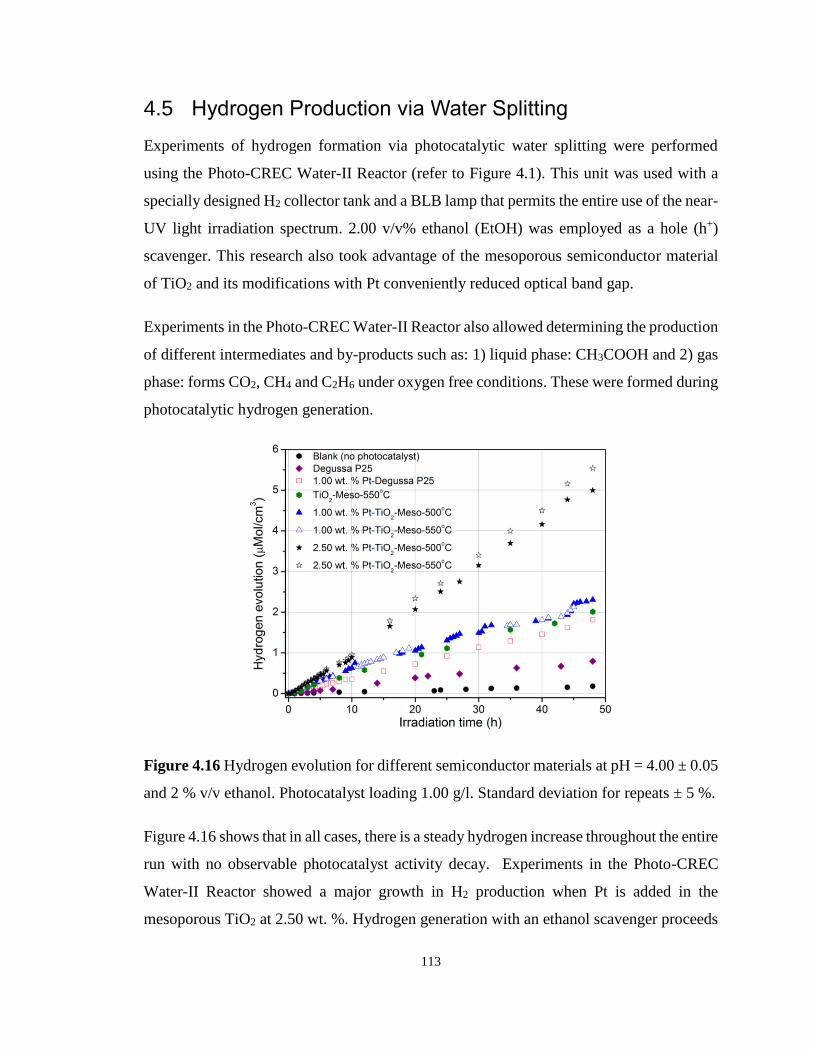
113
4.5 Hydrogen Production via Water Splitting
Experiments of hydrogen formation via photocatalytic water splitting were performed
using the Photo-CREC Water-II Reactor (refer to Figure 4.1). This unit was used with a
specially designed H2 collector tank and a BLB lamp that permits the entire use of the near-
UV light irradiation spectrum. 2.00 v/v% ethanol (EtOH) was employed as a hole (h+)
scavenger. This research also took advantage of the mesoporous semiconductor material
of TiO2 and its modifications with Pt conveniently reduced optical band gap.
Experiments in the Photo-CREC Water-II Reactor also allowed determining the production
of different intermediates and by-products such as: 1) liquid phase: CH3COOH and 2) gas
phase: forms CO2, CH4 and C2H6 under oxygen free conditions. These were formed during
photocatalytic hydrogen generation.
Figure 4.16 Hydrogen evolution for different semiconductor materials at pH = 4.00 ± 0.05
and 2 % v/v ethanol. Photocatalyst loading 1.00 g/l. Standard deviation for repeats ± 5 %.
Figure 4.16 shows that in all cases, there is a steady hydrogen increase throughout the entire
run with no observable photocatalyst activity decay. Experiments in the Photo-CREC
Water-II Reactor showed a major growth in H2 production when Pt is added in the
mesoporous TiO2 at 2.50 wt. %. Hydrogen generation with an ethanol scavenger proceeds
114
consistently via a similar redox network path yielding CH3COOH, H2O2, CH4, C2H6, and
CO2.
4.6 Quantum Yields (QYs)
The comparison of the performance of TiO2 semiconductors for hydrogen production needs
a rigorous assessment of QY [51-54]. The adequate definition of QYs requires macroscopic
energy balances allowing Qabs to be measured. The so-called quantum yield is defined as
the ratio of the moles of photons effectively converted into products to the moles of
absorbed photons. Thus, QY can be calculated as follows:
𝑄𝑌 =2 𝑀𝑜𝑙𝑒𝑠 𝑜𝑓 𝐻2 𝑃𝑟𝑜𝑑𝑢𝑐𝑒𝑑/𝑠
𝑀𝑜𝑙𝑒𝑠 𝑜𝑓 𝑃ℎ𝑜𝑡𝑜𝑛𝑠 𝐴𝑏𝑠𝑜𝑟𝑏𝑒𝑑/𝑠 Eq. (4.2)
In this calculation, the photons absorbed (Pa) were calculated using macroscopic balances
taking into account incident, transmitted and reflected photons [36]. The number of
Einstein effectively converted in hydrogen production can be easily calculated as twice the
moles of hydrogen formed, due to two electrons being needed to produce one hydrogen
molecule.
A significant increase, from the 7.9 % of the previous QY values reported [36], to the 9.6
% and to the 22.6 % QY values for 1 wt. %-Pt-TiO2-Meso-550 oC and 2.50 wt. %-Pt-TiO2-
Meso-550oC photocatalysts is observed, respectively. These QY enhancements are
assigned to the favourable influence of mesoporous architectures of the synthesized
semiconductors in the present study.
Table 4.5 reports the QY (%) of the semiconductors prepared in this study. The 2.50 wt.%-
Pt- TiO2-Meso-550oC displays a 22.6 % QY, about 6 times greater than that for bare DP25
displaying only a 3.5 % QY. Appendix C reports additional clarifications concerning the
QYs calculations.
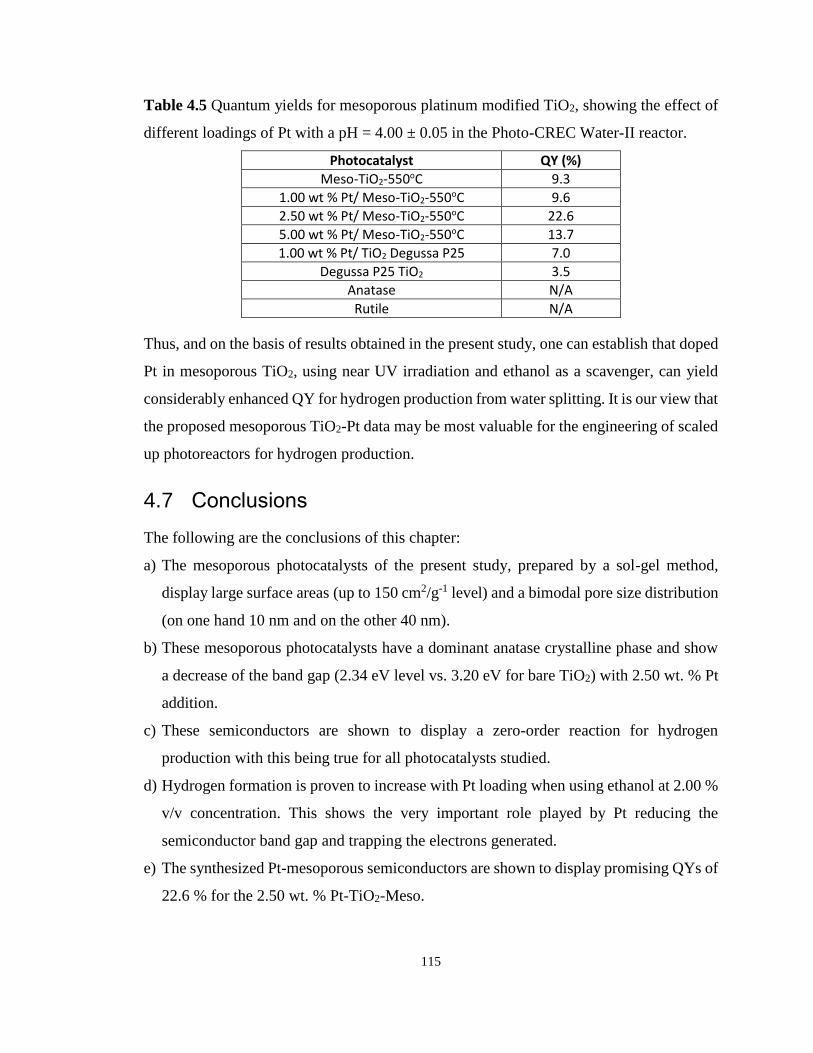
115
Table 4.5 Quantum yields for mesoporous platinum modified TiO2, showing the effect of
different loadings of Pt with a pH = 4.00 ± 0.05 in the Photo-CREC Water-II reactor.
Photocatalyst QY (%)
Meso-TiO2-550oC 9.3
1.00 wt % Pt/ Meso-TiO2-550oC 9.6
2.50 wt % Pt/ Meso-TiO2-550oC 22.6
5.00 wt % Pt/ Meso-TiO2-550oC 13.7
1.00 wt % Pt/ TiO2 Degussa P25 7.0
Degussa P25 TiO2 3.5
Anatase N/A
Rutile N/A
Thus, and on the basis of results obtained in the present study, one can establish that doped
Pt in mesoporous TiO2, using near UV irradiation and ethanol as a scavenger, can yield
considerably enhanced QY for hydrogen production from water splitting. It is our view that
the proposed mesoporous TiO2-Pt data may be most valuable for the engineering of scaled
up photoreactors for hydrogen production.
4.7 Conclusions
The following are the conclusions of this chapter:
a) The mesoporous photocatalysts of the present study, prepared by a sol-gel method,
display large surface areas (up to 150 cm2/g-1 level) and a bimodal pore size distribution
(on one hand 10 nm and on the other 40 nm).
b) These mesoporous photocatalysts have a dominant anatase crystalline phase and show
a decrease of the band gap (2.34 eV level vs. 3.20 eV for bare TiO2) with 2.50 wt. % Pt
addition.
c) These semiconductors are shown to display a zero-order reaction for hydrogen
production with this being true for all photocatalysts studied.
d) Hydrogen formation is proven to increase with Pt loading when using ethanol at 2.00 %
v/v concentration. This shows the very important role played by Pt reducing the
semiconductor band gap and trapping the electrons generated.
e) The synthesized Pt-mesoporous semiconductors are shown to display promising QYs of
22.6 % for the 2.50 wt. % Pt-TiO2-Meso.
116
4.8 References
[1] Mao, S.; Shen, S. & Guo, L. Nanomaterials for renewable hydrogen production, storage
and utilization. Progress in Natural Science: Materials International. 22 (2012) 522-
534.
[2] Jing, D.; Guo, L.; Zhao, L.; Zhang, X.; Liu, H.; Li, M.; Shen, S.; Liu, G. & Hu, X.
Efficient solar hydrogen production by photocatalytic water splitting: From
fundamental study to pilot demonstration. International Journal of Hydrogen Energy.
35 (2010) 7087-7087.
[3] Häussinger, P.; Lohmüller, R. & Watson, A. Hydrogen, 1. Properties and Occurence.
Ullmann's Encyclopedia of Industrial Chemistry, 2011, pp. 1-15.
[4] Navarro, Y.; Rufino M.; Álvarez-Galván, M.C.; Del Valle, F.; Villoria De La Mano,
J.A. & Fierro, J.L.G. Water Splitting on Semiconductor Catalysts under Visible-Light
Irradiation. ChemSusChem. 2 (2009) 471-85.
[5] Navarro, R.M.; Del Valle, F.; Villoria De La Mano, J.A.; Álvarez-Galván, M.C. &
Fierro, J.L.G. Photocatalytic Water Splitting Under Visible Light: Concept and
Catalysts Development. Photocatalytic Technologies. Advances in Chemical
Engineering. 36 (2009)111-43.
[6] Maeda, K.; Teramura, K.; Lu D.; Takata, T.; Inoue, S.; & Domen, K. Photocatalyst
releasing hydrogen from water. Nature. 440 (2006) 295-295.
[7] Nakata, K. & Fujishima, A. TiO2 photocatalysis: Design and applications. Journal of
Photochemistry and Photobiology C: Photochemistry Reviews, 13 (2012) 169-189.
[8] Nowotny J.; Sorrell, C.C.; Sheppard, L.R. & Bak, T. Solar-hydrogen: Environmentally
safe fuel for the future. International Journal of Hydrogen Energy, 30 (2005) 521-544.
[9] U.S. Department of Energy. Hydrogen production. Fuel cells and infrastructure
technologies program, 3 (2009)1-20.
[10] Honda, K and Fujishima, A. Electrochemical Evidence for the Mechanism of the
Primary Stage of Photosynthesis. Bulletin of the Chemical Society of Japan. 44 (1971)
1148-1150.
[11] Honda, K and Fujishima, A. Electrochemical Photolysis of Water at a Semiconductor
Electrode. Nature. 238 (1972) 37–38.
117
[12] Du, P.; Schneider, J.; Li, F.; Zhao, W.; Patel, U.; Castellano, F.N. & Eisenberg, R. Bi-
and terpyridyl platinum(II) chloro complexes: Molecular catalysts or the
photogeneration of hydrogen from water or simply precursors for colloidal platinum?
Journal of the American Chemical Society. 130 (2008) 5056-5058.
[13] Lei, P.; Hedlund, M.; Lomoth, R.; Rensmo, H.; Johansson, O. & Hammarstrom, L.
The role of colloid formation in the photoinduced H2 production with a Ru(II)-Pd(II)
supramolecular complex a study by GC, XPS, and TEM. J. of the American Chemical
Society.130 (2008) 26-27.
[14] Domen, K.; Naito, S.; Soma, M.; Onishi, T.; Tamaru, K. J. Chem. Soc., Chem.
Commun. 12 (1980) 543-544.
[15] Sato, S.; White, J. M. Chem. Phys. Lett. 72 (1980) 83-86.
[16] Lehn, J. M.; Sauvage, J. P.; Ziessel, R. NouV. J. Chim. 1980, 4623-4627.
[17] Domen, K.; Naito, S.; Onishi, T.; Tamaru, K. Chem. Phys. Lett. 92 (1982) 433-434.
[18] Sayama, K.; Arakawa, H. J. Phys. Chem. 97 (1993) 531-533
[19] Inoue, Y.; Kubokawa, T & Sato, K. Photocatalytic activity of sodium hexatitanate,
Na2Ti6O13, with a tunnel structure for decomposition of water. Journal of the Chemical
Society, Chemical Communications. 19 (1990)1298–1299
[20] Inoue, Y.; Niiyama, T.; Asai, T. & Sato, K. Stable photocatalytic activity of BaTi4O9
combined with ruthenium oxide for decomposition of water. Journal of the Chemical
Society, Chemical Communications. (1992) 579–580
[21] Ikeda, S.; Itani, T.; Nango, K.; Matsumura, M. Catal. Lett. 98 (2004) 229-233
[22] Takata, T.; Furumi, Y.; Shinohara, K.; Tanaka, A.; Hara, M.; Kondo, J. N.; Domen,
K. Chem. Mater. 9 (1997) 1063-1064.
118
[23] Ikeda, S.; Hara, M.; Kondo, J. N.; Domen, K.; Takahashi, H.; Okubo, T.; Kakihana,
M. J. Mater. Res. 13 (1998) 852-855.
[24] Kudo, A.; Kato, H. Chem. Lett. 26 (1997) 867-877.
[25] Kim, H. G.; Hwang, D. W.; Kim, J.; Kim, Y. G.; Lee, J. S. Chem. Commun. 1999,
1077-1078.
[26] Cerdá, J; Marchetti, J. L.; Cassano, A. E. Radiation efficiencies in elliptical
photoreactors. Lat. Am. J. Heat Mass Transfer. 1 (1977) 33-63.
[27] Ibrahim, H.; de Lasa, H. Photo-catalytic degradation of air borne pollutants. Apparent
quantum efficiencies in a novel photo-CREC-air reactor. Chem. Eng. Sci. 58 (2003)
943-949.
[28] Ibrahim, H. Photo-catalytic reactor for the degradation of airborne pollutants: photo-
conversion efficiency and kinetics modeling. Ph.D. dissertation. The University of
Western Ontario, London, Canada. 2001
[29] de Lasa, H.; Serrano, B.; Salaices, M. Photocatalytic Reaction Engineering, First Ed.,
Springer: New York, 2005.
[30] Hoffmann, M. R.; Martin, S.T.; Choi, W. Environmental Applications of
Semiconductor Photocatalysis, Chem. Rev. 95 (1995) 69-77.
[31] Tahiri, H.; Serpone, N.; Le Van Mao, R. Application of concept of relative photonic
efficiencies and surface characterization of a new titania photocatalyst designed for
environmental remediation. J. Photochem. Photobiol., A: Chem. 93 (1996) 199-203.
[32] Kisch, H. On the Problem of comparing Rates or Apparent Quantum Yields in
Heterogeneous Photocatalysis. Angew. Chem. Int. Ed. 49 (2010) 9588-9589.
[33] Escobedo-Salas, S., Serrano-Rosales B., de Lasa, H. Quantum Yield in a Photo-CREC
reactor for hydrogen production. AIChE Annual Meeting 2012.
[34] Moreira, J.; Serrano, B.; Ortiz, A. & de Lasa, H. TiO2 absorption and scattering
coefficients using Monte Carlo method and macroscopic balances in a photo-CREC
119
unit. Chemical Engineering Science. 66 (2011) 5813 – 582.
[35] Serrano, B.; Ortiz, A.; Moreira, J. & de Lasa, H. Energy efficiency in photocatalytic
reactors for the full span of reaction times. Industrial and Engineering Chemistry
Research. 48 (2009) 9864–9876.
[36] Escobedo-Salas, S.; Serrano-Rosales B., de Lasa, H. Quantum Yield with Platinum
Modified TiO2 Photocatalyst for Hydrogen Production. Applied Catalysis-B;
Environmental. 140 (2013) 523-536.
[37] Valadés-Pelayo, P. J.; Moreira, J.; Solano-Flores, P.; Serrano, Benito; De Lasa, Hugo.
Establishing photon absorption fields in a Photo-CREC Water II Reactor using a
CREC-Spectroradiometric probe. Chemical Engineering Science. 116 (2014) 406-417.
[38] Swapan K. Das.; Manas K. Bhunia and Asim Bhaumik. Self-assembled TiO2
nanoparticles: mesoporosity, optical and catalytic properties. The Royal Society of
Chemistry. Dalton Trans., 39 (2010) 4382–4390.
[39] C.C. Nguyen, N.-N. Vu, Trong-On Do, Recent Advances in the Development of
Sunlight-Driven Hollow Structure Photocatalysts and their Applications, Journal of
Materials Chemistry A, 2015, Review Article, 7, 8187-8208.
[40] M. Reza Gholipour, C.-T. Dinh, F. Beland, Trong-On Do, Nanocomposite
heterojunctions as sunlight-driven photocatalysts for hydrogen production from water
splitting, Nanoscale, Review Article. 7 (2015) 8187-8208.
[41] C.-T. Dinh, Y. Hoang, f. Kleitz, Trong-On Do, Three-Dimensional Ordered Assembly
of Thin-Shell Au/TiO2 Hollow Nanospheres for Enhanced Visible-Light Driven
Photocatalysis. Angew. Chem. Int. Ed. Engl., 2014.
[42] C.-T. Dinh, M.-H. Pham, Y. Seo, F. Kleitz, Trong-On Do, Design of multicomponent
photocatalysts for hydrogen production under visible light using water-soluble titanate
nanodisks, Nanoscale, 2014.
[43] Wang, X., Yu, J. C., Yip, H. Y., Wu, L., Wong, P. K. and Lai, S. Y., A Mesoporous
Pt/TiO2 Nanoarchitecture with Catalytic and Photocatalytic Functions. Chem. Eur. J.,
11: 2997–3004, 2005.
[44] Chih-Chieh Chan, Chung-Chieh Chang, Wen-Chia Hsu, Shih-Kai Wang, Jerry Lin,
Photocatalytic activities of Pd-loaded mesoporous TiO2 thin films, Chemical
Engineering Journal, Volume 152, Issues 2–3, Pages 492-497, 15 October 2009.
120
[45] Yan-Feng Zhu, Lu Xu, Juan Hu, Juan Zhang, Rong-Gui Du, Chang-Jian Lin,
Fabrication of heterostructured SrTiO3/TiO2 nanotube array films and their use in
photocathodic protection of stainless steel, Electrochimica Acta, Volume 121, 1 March
2014, 361-368.
[46] Weijiong Dai, Junqing Yan, Ke Dai, Landong Li, Naijia Guan, Ultrafine metal
nanoparticles loaded on TiO2 nanorods: Synthesis strategy and photocatalytic activity,
Chinese Journal of Catalysis, Volume 36, Issue 11, Pages 1968-1975, November 2015.
[47] Chapter 6: Diodes. Fundamentals of Electrical Engineering. 2nd ed. New York, New
York: Oxford UP, 1996. 352-54.
[48] R. Borja-Urby, L.A. Diaz-Torres, I. Garcia-Martinez, D. Bahena-Uribe, Gilberto
Casillas, A. Ponce, M. Jose-Yacaman, Crystalline and narrow band gap semiconductor
BaZrO3: Bi–Si synthesized by microwave–hydrothermal synthesis, Catalysis Today,
Volume 250, 15 July 2015, Pages 95-101.
[49] Shamsa Munir, Syed Mujtaba Shah, Hazrat Hussain, Rafaqat Ali khan, Effect of carrier
concentration on the optical band gap of TiO2 nanoparticles, Materials & Design,
Volume 92, 15 February 2016, Pages 64-72, ISSN 0264-1275.
[50] E. Barajas-Ledesma, M.L. García-Benjume, I. Espitia-Cabrera, M. Ortiz-Gutiérrez,
F.J. Espinoza-Beltrán, J. Mostaghimi, M.E. Contreras-García, Determination of the
band gap of TiO2–Al2O3 films as a function of processing parameters, Materials
Science and Engineering: B, Volume 174, Issues 1–3, 25 October 2010, Pages 71-73.
[51] Aaron Ortiz-Gomez, Benito Serrano-Rosales, Jesus Moreira-del-Rio, Hugo de-Lasa,
Mineralization of Phenol in an Improved Photocatalytic Process Assisted with Ferric
Ions: Reaction Network and Kinetic Modeling, Advances in Chemical Engineering,
Academic Press, 2009, Volume 36, Pages 69-110.
[52] P.J. Valadés-Pelayo, Jesus Moreira del Rio, Pastor Solano-Flores, B. Serrano, H. de
Lasa. Establishing photon absorption fields in a Photo-CREC Water II Reactor using a
CREC-Spectro radiometric probe, Chemical Engineering Science, Volume 116, 6
September 2014, Pages 406-417.
[53] P.J. Valadés-Pelayo, J. Moreira, B. Serrano, H. de Lasa, Boundary conditions and phase
functions in a Photo-CREC Water-II reactor radiation field, Chemical Engineering
Science, Volume 107, 7 April 2014, Pages 123-136.
121
[54] P.J. Valadés-Pelayo, F. Guayaquil Sosa, B. Serrano, H. de Lasa, Eight-lamp externally
irradiated bench-scale photocatalytic reactor: Scale-up and performance prediction,
Chemical Engineering Journal, Volume 282, 15 December 2015, Pages 142-151.
[55] Sing, K.S.W.; Everett, D.H.; Haul, R.A.W.; Moscou, L.; Pierotti, R.A.; Rouquerol, J.;
Siemieniewska, T. Reporting physisorption data for gas/solid systems with special
reference to the determination of surface area and porosity. Pure Appl. Chem. 1985,
57, Pages 603–619.
[56] Broekhoff, J.C.P. Mesopore determination from nitrogen sorption isotherms:
Fundamentals, scope, limitations. Stud. Surf. Sci. Catal. 1979, 3, Pages 663–684.
[57] Shields, J.E.; Lowell, S.; Thomas, M.A.; Thommes, M. Characterization of Porous
Solids and Powders: Surface Area, Pore Size and Density; Kluwer Academic Publisher:
Boston, MA, USA, 2004, Pages 43–45.
[58] Alothman, Z.A. A Review: Fundamental Aspects of Silicate Mesoporous
Materials. Materials 2012, 5, Pages 2874-2902.
122
Chapter 5
5 Hydrogen Production via Water Dissociation Using Pt–TiO2 Photocatalysts: An Oxidation–Reduction Network
The information presented Chapter 5 is based on the article entitled " Hydrogen Production
via Water Dissociation Using Pt–TiO2 Photocatalysts: An Oxidation–Reduction Network",
published in Catalysts Vol. 7 Issue 11 p. 324-345, in October 2017. The sections of this
chapter contribute towards the fulfilment of the general objectives a), b) and c) of the PhD
dissertation as described in section 1.1 of Chapter 1.
5.1 Introduction
Heterogeneous photocatalysis is a technique based on the excitation of a semiconductor.
Photons having enough energy can promote the transition of an electron from the valence
band to the conduction band. In this way, a couple of electrical charges are generated: the
electron (e−) and the hole (h+). It is in this promoted outer semiconductor particle surface
site, that the various redox reactions are initiated [1,2,3,4]. Hydroxide ions (OH−) from
dissociated water may react with electron holes (h+) yielding •OH radicals. These •OH
radicals may be consumed by ethanol at 1.00–2.00% v/v concentrations. The efficiency of
the photocatalytic process can be enhanced by the addition of so-called sacrificial reagents
(i.e., ethanol, methanol) [5–7]. Ethanol is an attractive organic renewable scavenger that
can be produced from sugars or agricultural waste fermentation processes at a low cost.
Electrons may eventually react with protons (H+) to form H● radicals. H● radicals may
dimerize, forming molecular hydrogen (H2).
Nowadays, TiO2 is the most widely used photocatalyst due to its photocatalytic activity,
chemical stability in aqueous solutions and favourable band gap energy (3.20 eV in
anatase) [5]. However, new materials such as modified TiO2 combined with noble metals
are gaining importance in hydrogen production because of the reported reduced band gaps
[1,2,6,7]. In 2005, Galinska et al. [4] performed photocatalytic water splitting over Pt–TiO2
(Degussa P25) using various sacrificial reagents under UV irradiation. Nevertheless, these
authors did not report values for the quantum yield. Despite this progress, the value of
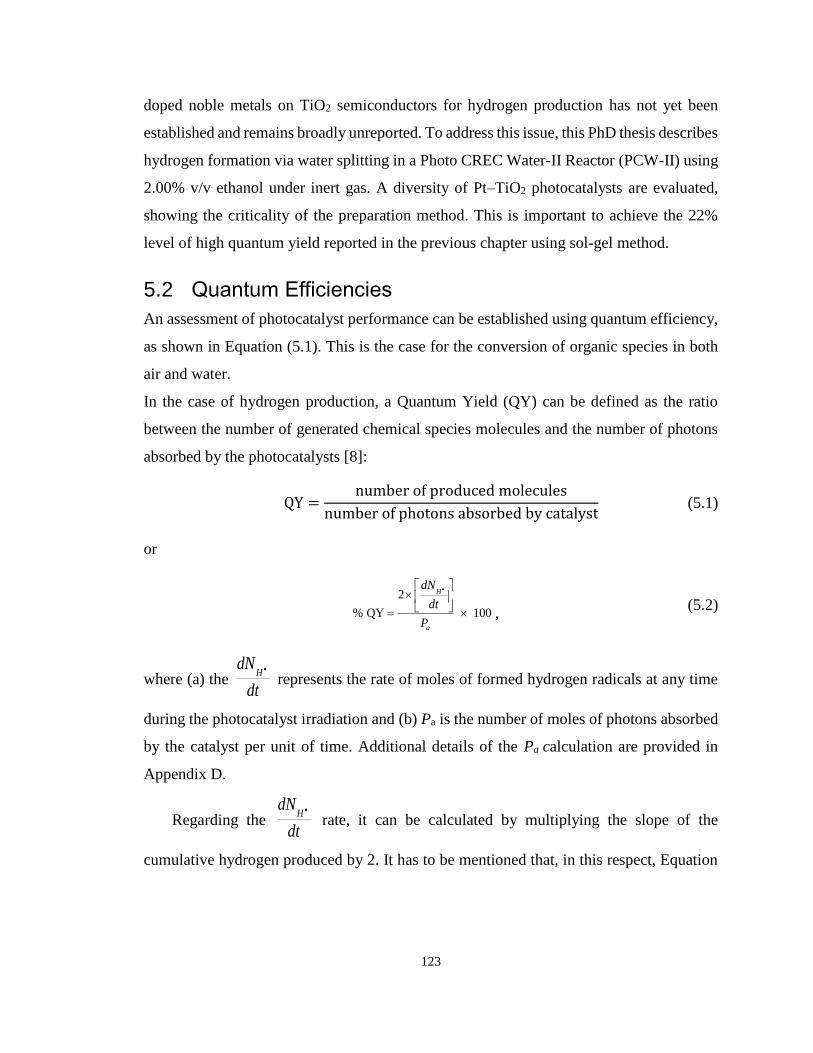
123
doped noble metals on TiO2 semiconductors for hydrogen production has not yet been
established and remains broadly unreported. To address this issue, this PhD thesis describes
hydrogen formation via water splitting in a Photo CREC Water-II Reactor (PCW-II) using
2.00% v/v ethanol under inert gas. A diversity of Pt–TiO2 photocatalysts are evaluated,
showing the criticality of the preparation method. This is important to achieve the 22%
level of high quantum yield reported in the previous chapter using sol-gel method.
5.2 Quantum Efficiencies
An assessment of photocatalyst performance can be established using quantum efficiency,
as shown in Equation (5.1). This is the case for the conversion of organic species in both
air and water.
In the case of hydrogen production, a Quantum Yield (QY) can be defined as the ratio
between the number of generated chemical species molecules and the number of photons
absorbed by the photocatalysts [8]:
QY =number of produced molecules
number of photons absorbed by catalyst (5.1)
or
2
% QY 100
H
a
dN
dt
P
• ,
(5.2)
where (a) the dt
dNH •
represents the rate of moles of formed hydrogen radicals at any time
during the photocatalyst irradiation and (b) Pa is the number of moles of photons absorbed
by the catalyst per unit of time. Additional details of the Pa calculation are provided in
Appendix D.
Regarding the dt
dNH •
rate, it can be calculated by multiplying the slope of the
cumulative hydrogen produced by 2. It has to be mentioned that, in this respect, Equation
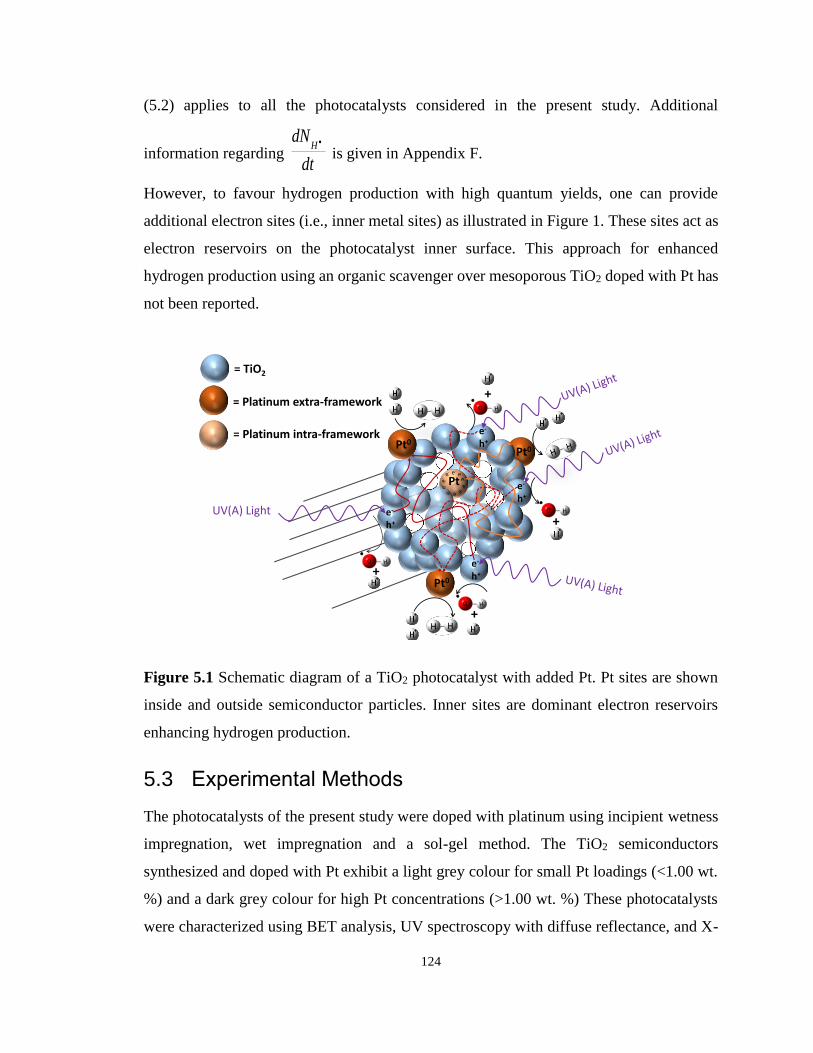
124
(5.2) applies to all the photocatalysts considered in the present study. Additional
information regarding dt
dNH •
is given in Appendix F.
However, to favour hydrogen production with high quantum yields, one can provide
additional electron sites (i.e., inner metal sites) as illustrated in Figure 1. These sites act as
electron reservoirs on the photocatalyst inner surface. This approach for enhanced
hydrogen production using an organic scavenger over mesoporous TiO2 doped with Pt has
not been reported.
Figure 5.1 Schematic diagram of a TiO2 photocatalyst with added Pt. Pt sites are shown
inside and outside semiconductor particles. Inner sites are dominant electron reservoirs
enhancing hydrogen production.
5.3 Experimental Methods
The photocatalysts of the present study were doped with platinum using incipient wetness
impregnation, wet impregnation and a sol-gel method. The TiO2 semiconductors
synthesized and doped with Pt exhibit a light grey colour for small Pt loadings (<1.00 wt.
%) and a dark grey colour for high Pt concentrations (>1.00 wt. %) These photocatalysts
were characterized using BET analysis, UV spectroscopy with diffuse reflectance, and X-
Pt
+
+
⦁
+
+
1
UV(A) Light
e-
h+
+
⦁
+
+
⦁
+
+
⦁+
e-
h+
e-
h+
e-
h+
= TiO2
= Platinum extra-framework
= Platinum intra-framework
+
+
Pt0
Pt0
Pt0
++
125
ray diffraction (XRD). Furthermore, a near UV lamp was employed during the runs in the
Photo-CREC-Water II Reactor. Various methodologies used for photocatalyst preparation
as well as for hydrogen production experiments are described in the upcoming sections of
this thesis.
5.3.1 Photocatalyst Preparation of Pt/TiO2
5.3.1.1 Incipient Wetness Impregnation Method
An incipient wetness impregnation technique can be used to prepare a modified Pt–TiO2
photocatalyst. The material utilized as a support was a Degussa P25 semiconductor of
titanium dioxide (TiO2) from Evonik Degussa Co. Platinum was added on the outer surface
of the TiO2 particles by employing a 99.90 wt. % H2PtCl6 xH2O reagent from Sigma-
Aldrich Co. This prepared material was used as a reference, for assessing the performance
of two other synthesized photocatalysts of the present study.
5.3.1.2 Wet Impregnation Method
The wet impregnation method was developed by incorporating 2.00 grams of Degussa P25
(TiO2) in a solution of 10.00 mL deionized water, under continuous stirring. The doping
solution was prepared with a dihydrogen-dinitro-sulphate platinate solution (H2Pt NO2
SO4) at different concentrations. This was done to obtain platinum loadings on TiO2 in the
0.42–1.70 wt. % range. This solution was added to the TiO2, and mixed for one hour. A
reducing agent of 0.03 M of sodium borohydride (NaBH4) was then employed. The
resulting solution was mixed for another 10 h. Then, the obtained solids were filtered, dried
at 110 °C for 18 h, and finally calcined at 450 °C for 3 h.
5.3.1.3 Sol-Gel Method
Regarding this method, two different routes, labelled sol-gel A and sol-gel B, were
developed.
Sol-Gel A
The synthesis of the sol-gel A was achieved using titanium (IV) isopropoxide (C12H28O4Ti,
Sigma-Aldrich 97.00%), isopropanol (C3H7OH, J.T. Baker 99.90%), and dihydrogen
126
dinitro-sulphate platinate(II). 70.00 mL of isopropanol reagent (organic solvent) was
poured into a flask, under nitrogen bubbling flow. Then, the titanium (IV) isopropoxide
was added dropwise. Once this step was completed, the resulting blend was mixed for 20
min to remove all the dissolved oxygen. Then, 7.50 mL of the dihydrogen dinitro-sulphate
palatinate(II) solution were added dropwise. The resulting solution was allowed to stand
for 20 min. H2Pt(NO2)2SO4 concentrations were carefully selected to obtain Pt loadings of
0, 0.42, 0.82 and 1.70 wt. %. Finally, and to reduce platinum into its metal state, a 0.03 M
of sodium borohydride (NaBH4) reducing solution was used. The prepared solution was
placed in a 1200 W microwave unit for 30 min, at 215 °C and allowed to rest for 1 h. The
resulting slurry was filtered and washed with distillate water. The obtained wet-paste was
dried out at 110 °C for 18 h and later calcined at 450 °C for 3 h.
Sol-Gel B
The sol-gel B method first involves the dissolution of 2.00 g of Pluronic F127 in 40 mL of
ethanol (CH3CH2OH) and 3.30 g of hydrochloric acid (37 wt. % purity) as reported in the
previous chapter. Once this is achieved, 0.63 g of citric acid were added and mixed
continuously at room temperature for 2 h. When this step was completed, 2.85 g of titanium
(IV) isopropoxide were added to the resulting blend. This method was used to prepare the
mesoporous titanium dioxide. This sol-gel synthesis process gives a Pt loaded TiO2 with
the following valuable properties: 150 m2/g of specific surface area, 10–40 nm pore sizes,
0.68 cm3/g pore volume, 100% anatase content, 10 nm Pt crystallite sizes.
5.4 Photocatalytic Reactor
Figure 5.2 reports a schematic diagram of the Photo-CREC Water II Reactor and its
accessories for hydrogen production used in the present study. This modified Photo-CREC
Water II Reactor is a “well mixed” batch unit that produces hydrogen. Figure 5.2 also
shows the overall unit configuration: a sealed stirred tank chamber connected in series with
a tubular photocatalytic reactor. The Photo-CREC Water II Reactor includes the additional
following components: (i) a BLB Lamp; (ii) a Pyrex glass tube; (iii) a UV-opaque
polyethylene cylinder; (iv) fused-silica windows; (v) a centrifugal pump; (vi) a H2
storing/mixing tank; (vii) a gas sampling port; (viii) a slurry sampling port; (ix) a purging
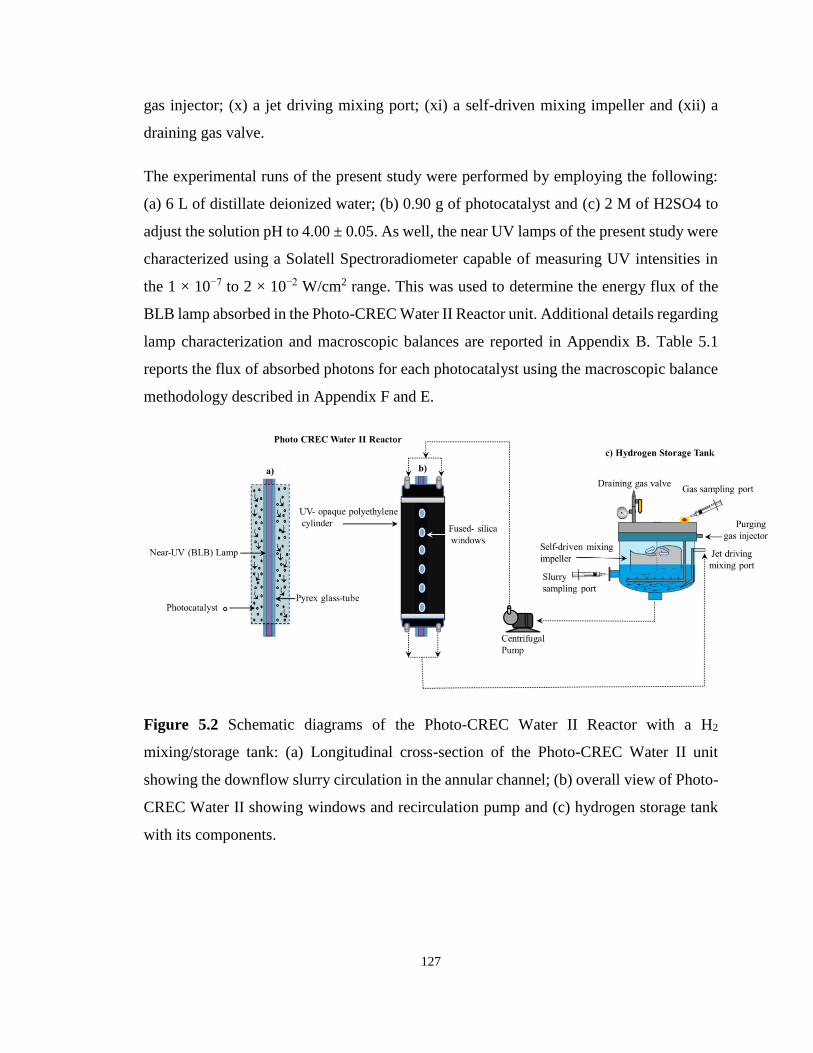
127
gas injector; (x) a jet driving mixing port; (xi) a self-driven mixing impeller and (xii) a
draining gas valve.
The experimental runs of the present study were performed by employing the following:
(a) 6 L of distillate deionized water; (b) 0.90 g of photocatalyst and (c) 2 M of H2SO4 to
adjust the solution pH to 4.00 ± 0.05. As well, the near UV lamps of the present study were
characterized using a Solatell Spectroradiometer capable of measuring UV intensities in
the 1 × 10⁻⁷ to 2 × 10⁻² W/cm2 range. This was used to determine the energy flux of the
BLB lamp absorbed in the Photo-CREC Water II Reactor unit. Additional details regarding
lamp characterization and macroscopic balances are reported in Appendix B. Table 5.1
reports the flux of absorbed photons for each photocatalyst using the macroscopic balance
methodology described in Appendix F and E.
Figure 5.2 Schematic diagrams of the Photo-CREC Water II Reactor with a H2
mixing/storage tank: (a) Longitudinal cross-section of the Photo-CREC Water II unit
showing the downflow slurry circulation in the annular channel; (b) overall view of Photo-
CREC Water II showing windows and recirculation pump and (c) hydrogen storage tank
with its components.
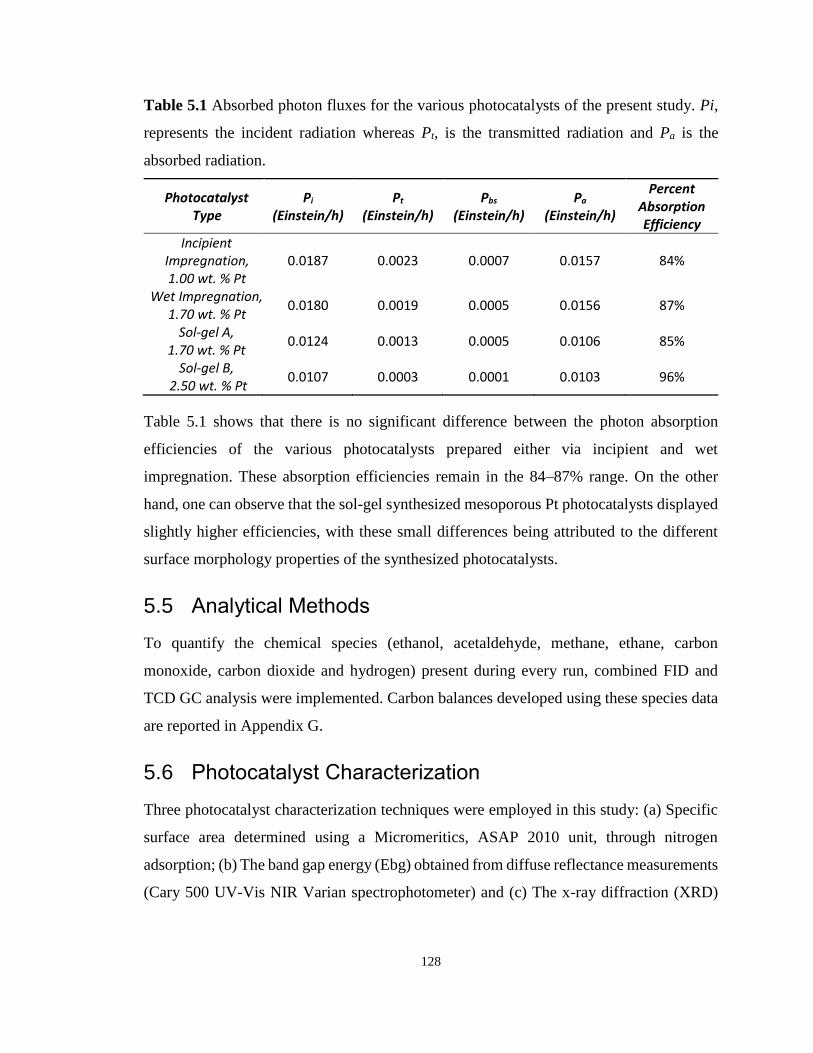
128
Table 5.1 Absorbed photon fluxes for the various photocatalysts of the present study. Pi,
represents the incident radiation whereas Pt, is the transmitted radiation and Pa is the
absorbed radiation.
Photocatalyst Type
Pi (Einstein/h)
Pt (Einstein/h)
Pbs (Einstein/h)
Pa (Einstein/h)
Percent Absorption Efficiency
Incipient Impregnation, 1.00 wt. % Pt
0.0187 0.0023 0.0007 0.0157 84%
Wet Impregnation, 1.70 wt. % Pt
0.0180 0.0019 0.0005 0.0156 87%
Sol-gel A, 1.70 wt. % Pt
0.0124 0.0013 0.0005 0.0106 85%
Sol-gel B, 2.50 wt. % Pt
0.0107 0.0003 0.0001 0.0103 96%
Table 5.1 shows that there is no significant difference between the photon absorption
efficiencies of the various photocatalysts prepared either via incipient and wet
impregnation. These absorption efficiencies remain in the 84–87% range. On the other
hand, one can observe that the sol-gel synthesized mesoporous Pt photocatalysts displayed
slightly higher efficiencies, with these small differences being attributed to the different
surface morphology properties of the synthesized photocatalysts.
5.5 Analytical Methods
To quantify the chemical species (ethanol, acetaldehyde, methane, ethane, carbon
monoxide, carbon dioxide and hydrogen) present during every run, combined FID and
TCD GC analysis were implemented. Carbon balances developed using these species data
are reported in Appendix G.
5.6 Photocatalyst Characterization
Three photocatalyst characterization techniques were employed in this study: (a) Specific
surface area determined using a Micromeritics, ASAP 2010 unit, through nitrogen
adsorption; (b) The band gap energy (Ebg) obtained from diffuse reflectance measurements
(Cary 500 UV-Vis NIR Varian spectrophotometer) and (c) The x-ray diffraction (XRD)
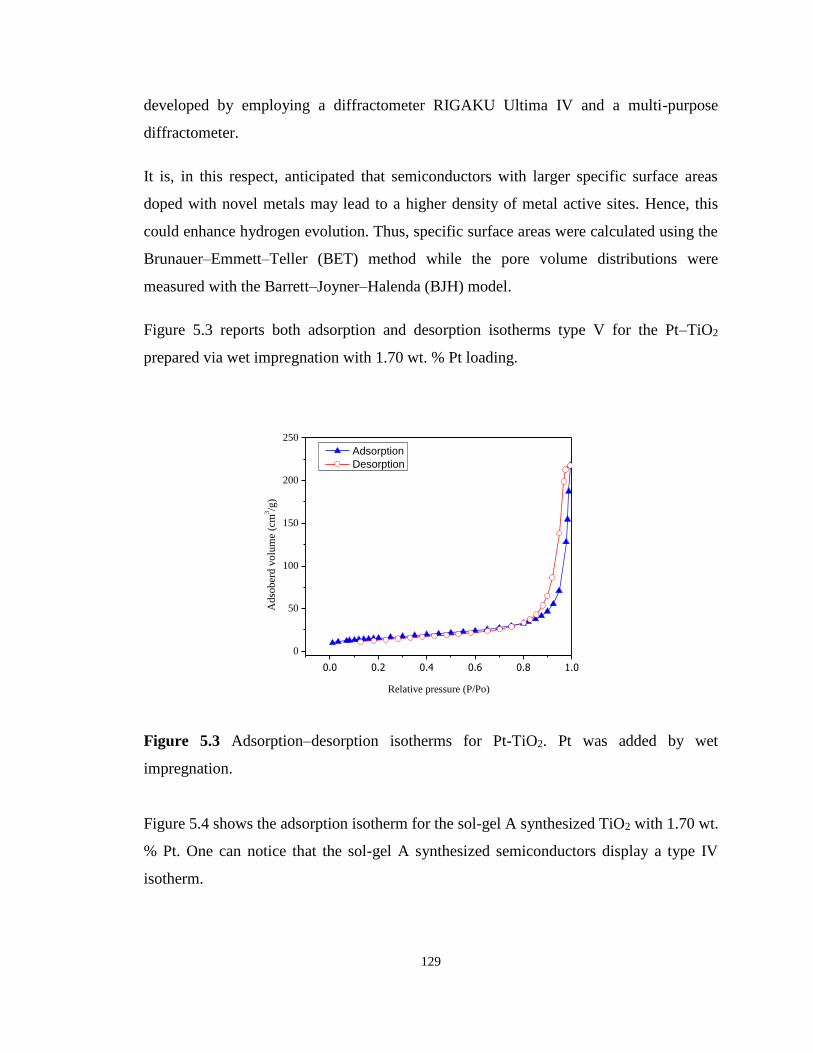
129
developed by employing a diffractometer RIGAKU Ultima IV and a multi-purpose
diffractometer.
It is, in this respect, anticipated that semiconductors with larger specific surface areas
doped with novel metals may lead to a higher density of metal active sites. Hence, this
could enhance hydrogen evolution. Thus, specific surface areas were calculated using the
Brunauer–Emmett–Teller (BET) method while the pore volume distributions were
measured with the Barrett–Joyner–Halenda (BJH) model.
Figure 5.3 reports both adsorption and desorption isotherms type V for the Pt–TiO2
prepared via wet impregnation with 1.70 wt. % Pt loading.
0.0 0.2 0.4 0.6 0.8 1.0
0
50
100
150
200
250
Adso
ber
d v
olu
me
(cm
3/g
)
Relative pressure (P/Po)
Adsorption
Desorption
Figure 5.3 Adsorption–desorption isotherms for Pt-TiO2. Pt was added by wet
impregnation.
Figure 5.4 shows the adsorption isotherm for the sol-gel A synthesized TiO2 with 1.70 wt.
% Pt. One can notice that the sol-gel A synthesized semiconductors display a type IV
isotherm.
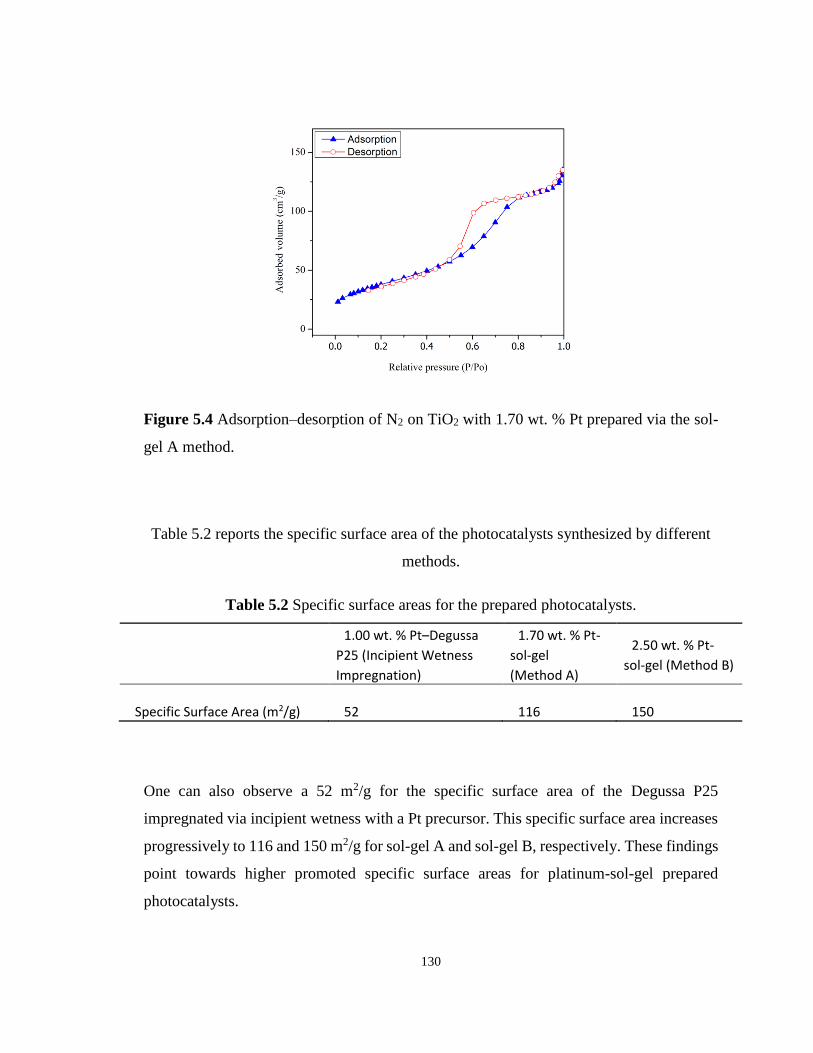
130
Figure 5.4 Adsorption–desorption of N2 on TiO2 with 1.70 wt. % Pt prepared via the sol-
gel A method.
Table 5.2 reports the specific surface area of the photocatalysts synthesized by different
methods.
Table 5.2 Specific surface areas for the prepared photocatalysts.
1.00 wt. % Pt–Degussa
P25 (Incipient Wetness
Impregnation)
1.70 wt. % Pt-
sol-gel
(Method A)
2.50 wt. % Pt-
sol-gel (Method B)
Specific Surface Area (m2/g) 52 116 150
One can also observe a 52 m2/g for the specific surface area of the Degussa P25
impregnated via incipient wetness with a Pt precursor. This specific surface area increases
progressively to 116 and 150 m2/g for sol-gel A and sol-gel B, respectively. These findings
point towards higher promoted specific surface areas for platinum-sol-gel prepared
photocatalysts.
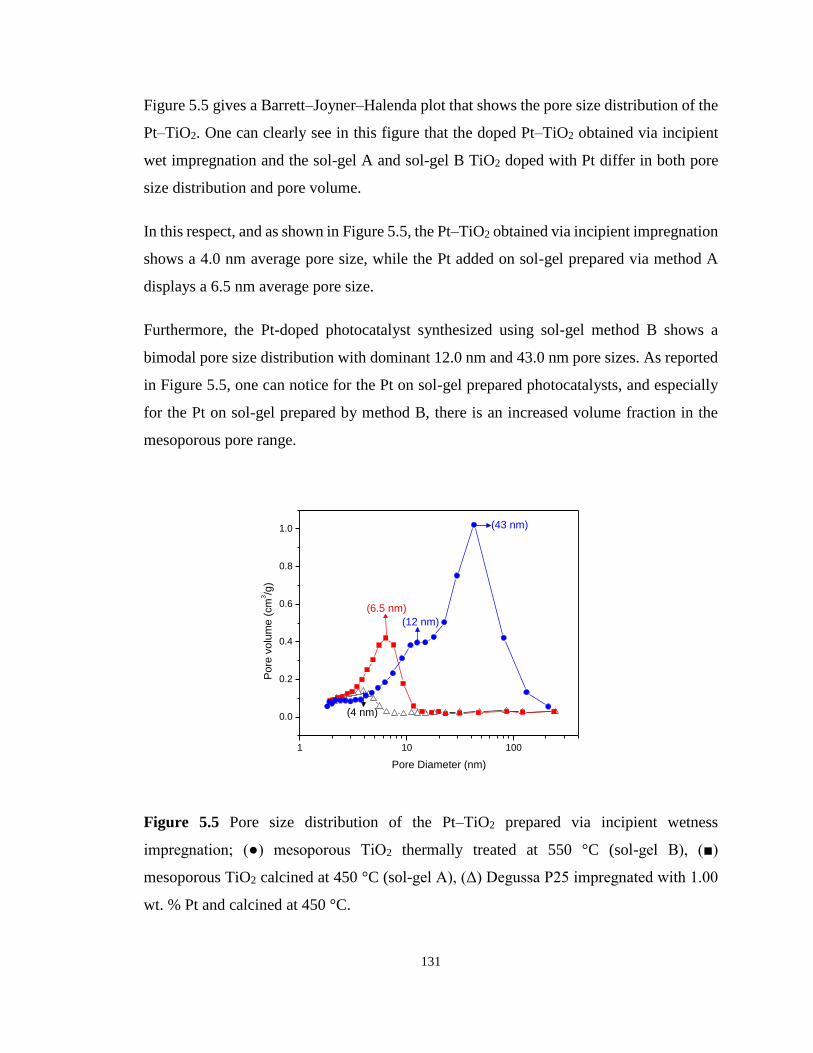
131
Figure 5.5 gives a Barrett–Joyner–Halenda plot that shows the pore size distribution of the
Pt–TiO2. One can clearly see in this figure that the doped Pt–TiO2 obtained via incipient
wet impregnation and the sol-gel A and sol-gel B TiO2 doped with Pt differ in both pore
size distribution and pore volume.
In this respect, and as shown in Figure 5.5, the Pt–TiO2 obtained via incipient impregnation
shows a 4.0 nm average pore size, while the Pt added on sol-gel prepared via method A
displays a 6.5 nm average pore size.
Furthermore, the Pt-doped photocatalyst synthesized using sol-gel method B shows a
bimodal pore size distribution with dominant 12.0 nm and 43.0 nm pore sizes. As reported
in Figure 5.5, one can notice for the Pt on sol-gel prepared photocatalysts, and especially
for the Pt on sol-gel prepared by method B, there is an increased volume fraction in the
mesoporous pore range.
1 10 100
0.0
0.2
0.4
0.6
0.8
1.0 (43 nm)
(12 nm)
(6.5 nm)
Po
re v
olu
me
(cm
3/g
)
Pore Diameter (nm)
(4 nm)
Figure 5.5 Pore size distribution of the Pt–TiO2 prepared via incipient wetness
impregnation; (●) mesoporous TiO2 thermally treated at 550 °C (sol-gel B), (■)
mesoporous TiO2 calcined at 450 °C (sol-gel A), (Δ) Degussa P25 impregnated with 1.00
wt. % Pt and calcined at 450 °C.
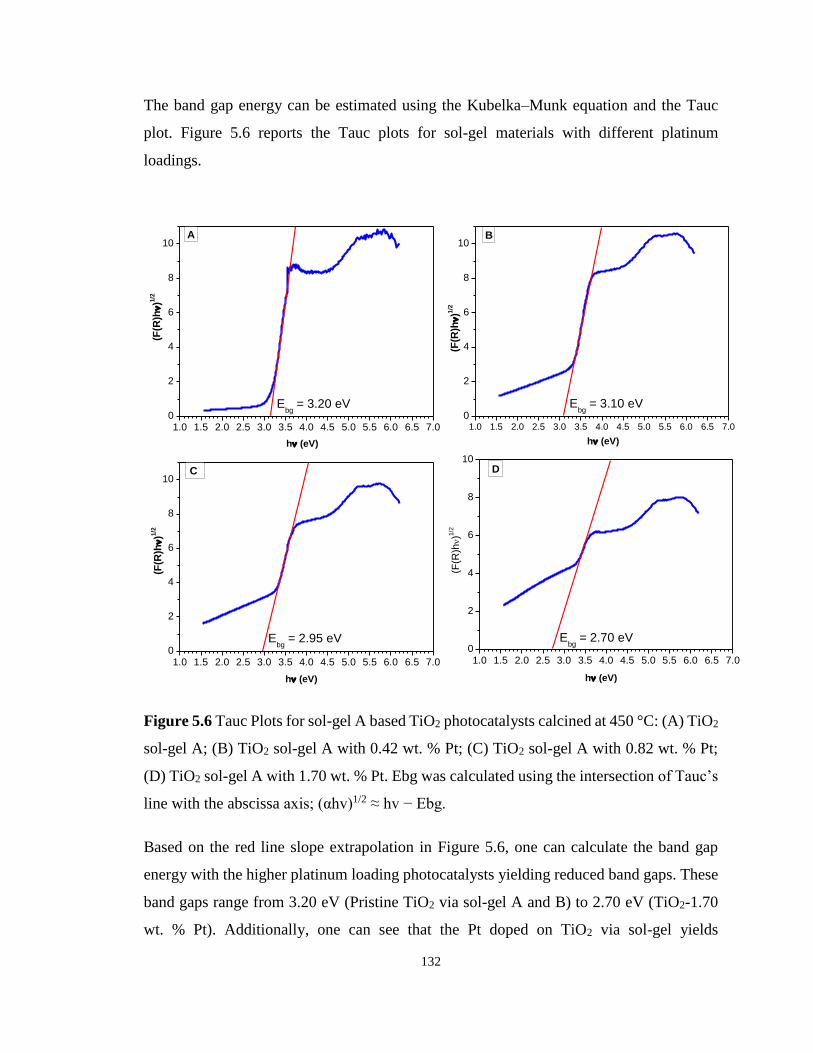
132
The band gap energy can be estimated using the Kubelka–Munk equation and the Tauc
plot. Figure 5.6 reports the Tauc plots for sol-gel materials with different platinum
loadings.
1.0 1.5 2.0 2.5 3.0 3.5 4.0 4.5 5.0 5.5 6.0 6.5 7.0
0
2
4
6
8
10
Ebg
= 3.10 eV
h (eV)
h (eV)
h (eV)
h (eV)
(F(R
)h)1
/2
(F(R
)h)1
/2(F
(R)h)1
/2
(F(R
)h)1
/2
B
1.0 1.5 2.0 2.5 3.0 3.5 4.0 4.5 5.0 5.5 6.0 6.5 7.00
2
4
6
8
10
Ebg
= 3.20 eV
A
1.0 1.5 2.0 2.5 3.0 3.5 4.0 4.5 5.0 5.5 6.0 6.5 7.00
2
4
6
8
10
D
1.0 1.5 2.0 2.5 3.0 3.5 4.0 4.5 5.0 5.5 6.0 6.5 7.00
2
4
6
8
10
Ebg
= 2.70 eVEbg
= 2.95 eV
C
Figure 5.6 Tauc Plots for sol-gel A based TiO2 photocatalysts calcined at 450 °C: (A) TiO2
sol-gel A; (B) TiO2 sol-gel A with 0.42 wt. % Pt; (C) TiO2 sol-gel A with 0.82 wt. % Pt;
(D) TiO2 sol-gel A with 1.70 wt. % Pt. Ebg was calculated using the intersection of Tauc’s
line with the abscissa axis; (αhv)1/2 ≈ hv − Ebg.
Based on the red line slope extrapolation in Figure 5.6, one can calculate the band gap
energy with the higher platinum loading photocatalysts yielding reduced band gaps. These
band gaps range from 3.20 eV (Pristine TiO2 via sol-gel A and B) to 2.70 eV (TiO2-1.70
wt. % Pt). Additionally, one can see that the Pt doped on TiO2 via sol-gel yields
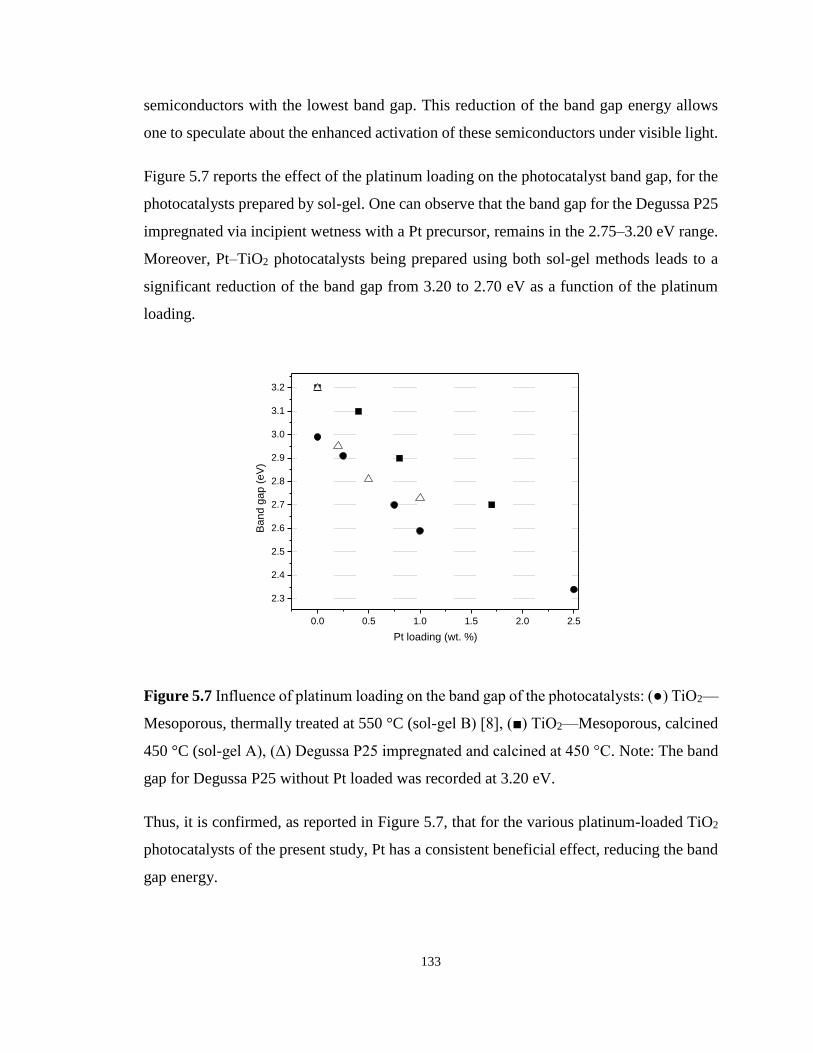
133
semiconductors with the lowest band gap. This reduction of the band gap energy allows
one to speculate about the enhanced activation of these semiconductors under visible light.
Figure 5.7 reports the effect of the platinum loading on the photocatalyst band gap, for the
photocatalysts prepared by sol-gel. One can observe that the band gap for the Degussa P25
impregnated via incipient wetness with a Pt precursor, remains in the 2.75–3.20 eV range.
Moreover, Pt–TiO2 photocatalysts being prepared using both sol-gel methods leads to a
significant reduction of the band gap from 3.20 to 2.70 eV as a function of the platinum
loading.
0.0 0.5 1.0 1.5 2.0 2.5
2.3
2.4
2.5
2.6
2.7
2.8
2.9
3.0
3.1
3.2
Ba
nd
ga
p (
eV
)
Pt loading (wt. %)
Figure 5.7 Influence of platinum loading on the band gap of the photocatalysts: (●) TiO2—
Mesoporous, thermally treated at 550 °C (sol-gel B) [8], (■) TiO2—Mesoporous, calcined
450 °C (sol-gel A), (Δ) Degussa P25 impregnated and calcined at 450 °C. Note: The band
gap for Degussa P25 without Pt loaded was recorded at 3.20 eV.
Thus, it is confirmed, as reported in Figure 5.7, that for the various platinum-loaded TiO2
photocatalysts of the present study, Pt has a consistent beneficial effect, reducing the band
gap energy.
134
Figure 5.8 reports a typical XRD diffractogram for TiO2-based materials prepared by either
wet or incipient impregnation. In addition, one can recognize the characteristic peaks of
the two crystalline phases of titanium dioxide (anatase and rutile), with platinum also being
included.
Figure 5.8 reports a change of the different XRD peaks for the wet and incipient platinum
impregnated TiO2–Degussa P25. One can notice that both photocatalysts display rutile
(110) crystal plane and that this giving the characteristic 27° Bragg angle band. One can
also observe, as reported in Table 5.3, that for the various sol-gel Pt–TiO2, there is no
recordable 27° Bragg angle. As a result, this shows that the various synthesized sol-gel Pt–
TiO2 are free of rutile (110) facet.
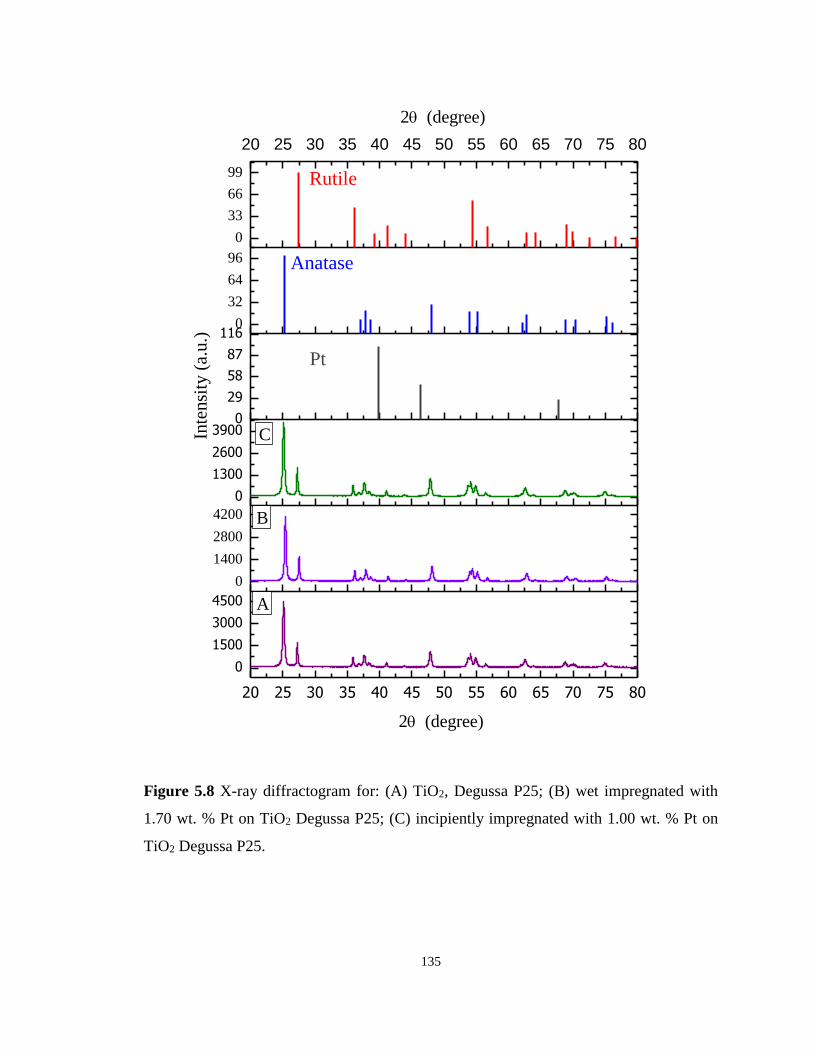
135
20 25 30 35 40 45 50 55 60 65 70 75 80
0
1500
3000
4500
0
1400
2800
4200
0
1300
2600
39000
29
58
87
1160
32
64
96
0
33
66
99
20 25 30 35 40 45 50 55 60 65 70 75 80
2 (degree)
2 (degree)
Inte
nsi
ty (
a.u.)
A
B
C
Pt
Anatase
Rutile
Figure 5.8 X-ray diffractogram for: (A) TiO2, Degussa P25; (B) wet impregnated with
1.70 wt. % Pt on TiO2 Degussa P25; (C) incipiently impregnated with 1.00 wt. % Pt on
TiO2 Degussa P25.
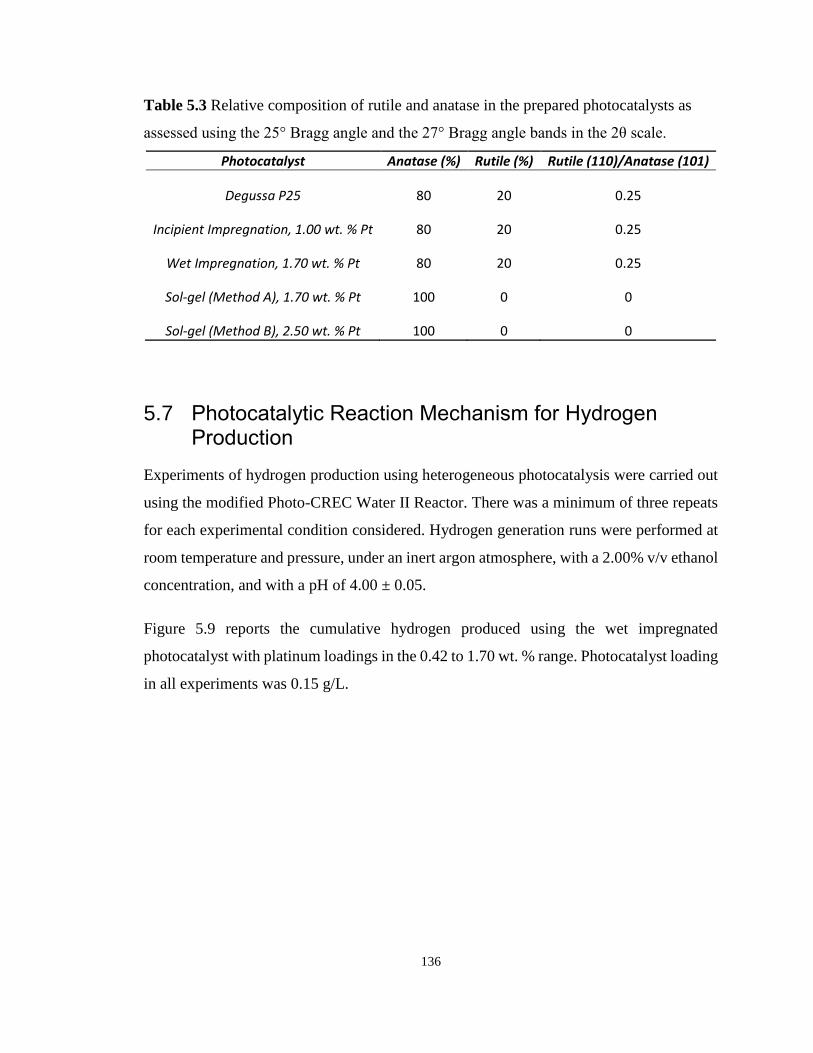
136
Table 5.3 Relative composition of rutile and anatase in the prepared photocatalysts as
assessed using the 25° Bragg angle and the 27° Bragg angle bands in the 2θ scale.
Photocatalyst Anatase (%) Rutile (%) Rutile (110)/Anatase (101)
Degussa P25 80 20 0.25
Incipient Impregnation, 1.00 wt. % Pt 80 20 0.25
Wet Impregnation, 1.70 wt. % Pt 80 20 0.25
Sol-gel (Method A), 1.70 wt. % Pt 100 0 0
Sol-gel (Method B), 2.50 wt. % Pt 100 0 0
5.7 Photocatalytic Reaction Mechanism for Hydrogen Production
Experiments of hydrogen production using heterogeneous photocatalysis were carried out
using the modified Photo-CREC Water II Reactor. There was a minimum of three repeats
for each experimental condition considered. Hydrogen generation runs were performed at
room temperature and pressure, under an inert argon atmosphere, with a 2.00% v/v ethanol
concentration, and with a pH of 4.00 ± 0.05.
Figure 5.9 reports the cumulative hydrogen produced using the wet impregnated
photocatalyst with platinum loadings in the 0.42 to 1.70 wt. % range. Photocatalyst loading
in all experiments was 0.15 g/L.
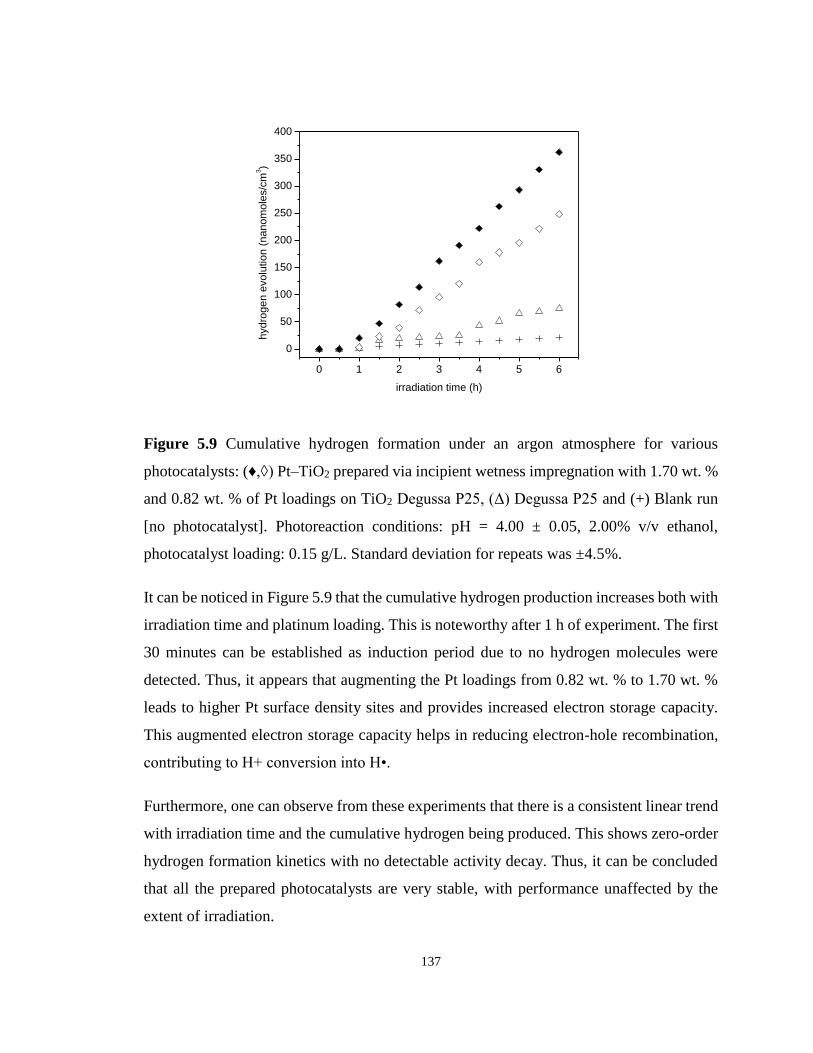
137
0 1 2 3 4 5 6
0
50
100
150
200
250
300
350
400
hyd
rog
en
evo
lutio
n (
na
no
mo
les/c
m3)
irradiation time (h)
Figure 5.9 Cumulative hydrogen formation under an argon atmosphere for various
photocatalysts: (♦,◊) Pt–TiO2 prepared via incipient wetness impregnation with 1.70 wt. %
and 0.82 wt. % of Pt loadings on TiO2 Degussa P25, (Δ) Degussa P25 and (+) Blank run
[no photocatalyst]. Photoreaction conditions: pH = 4.00 ± 0.05, 2.00% v/v ethanol,
photocatalyst loading: 0.15 g/L. Standard deviation for repeats was ±4.5%.
It can be noticed in Figure 5.9 that the cumulative hydrogen production increases both with
irradiation time and platinum loading. This is noteworthy after 1 h of experiment. The first
30 minutes can be established as induction period due to no hydrogen molecules were
detected. Thus, it appears that augmenting the Pt loadings from 0.82 wt. % to 1.70 wt. %
leads to higher Pt surface density sites and provides increased electron storage capacity.
This augmented electron storage capacity helps in reducing electron-hole recombination,
contributing to H+ conversion into H•.
Furthermore, one can observe from these experiments that there is a consistent linear trend
with irradiation time and the cumulative hydrogen being produced. This shows zero-order
hydrogen formation kinetics with no detectable activity decay. Thus, it can be concluded
that all the prepared photocatalysts are very stable, with performance unaffected by the
extent of irradiation.
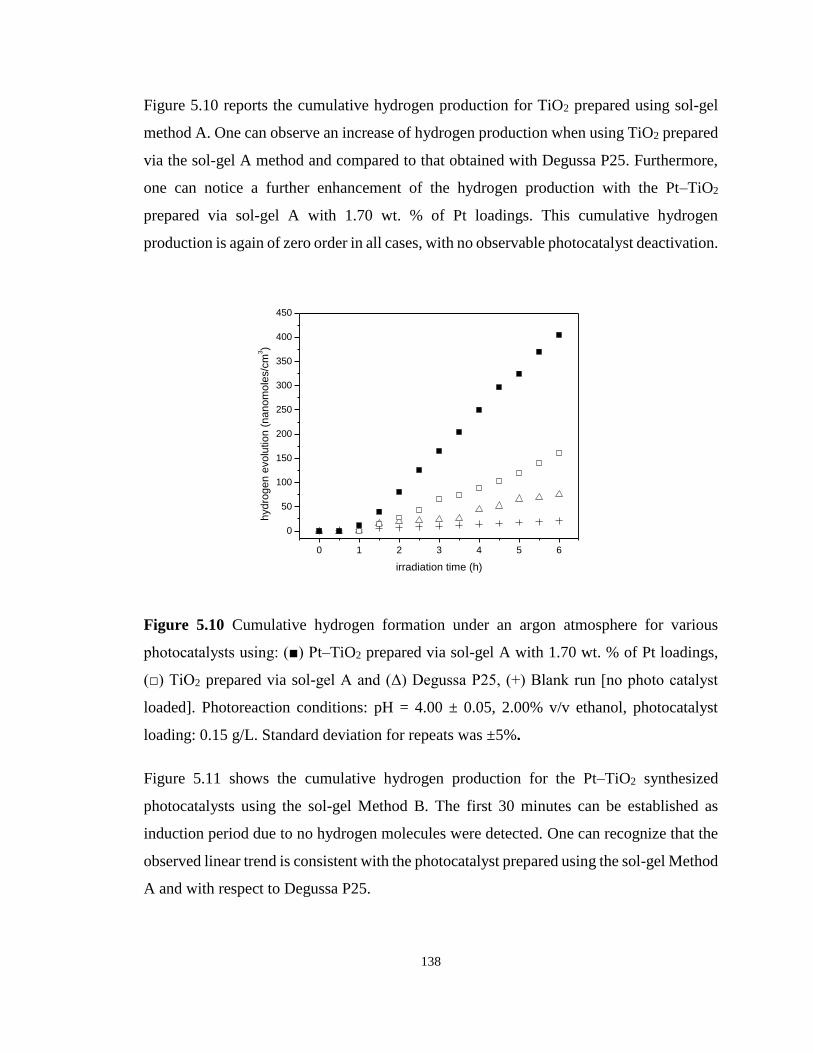
138
Figure 5.10 reports the cumulative hydrogen production for TiO2 prepared using sol-gel
method A. One can observe an increase of hydrogen production when using TiO2 prepared
via the sol-gel A method and compared to that obtained with Degussa P25. Furthermore,
one can notice a further enhancement of the hydrogen production with the Pt–TiO2
prepared via sol-gel A with 1.70 wt. % of Pt loadings. This cumulative hydrogen
production is again of zero order in all cases, with no observable photocatalyst deactivation.
0 1 2 3 4 5 6
0
50
100
150
200
250
300
350
400
450
hyd
rog
en
evo
lutio
n (
na
no
mo
les/c
m3)
irradiation time (h)
Figure 5.10 Cumulative hydrogen formation under an argon atmosphere for various
photocatalysts using: (■) Pt–TiO2 prepared via sol-gel A with 1.70 wt. % of Pt loadings,
(□) TiO2 prepared via sol-gel A and (Δ) Degussa P25, (+) Blank run [no photo catalyst
loaded]. Photoreaction conditions: pH = 4.00 ± 0.05, 2.00% v/v ethanol, photocatalyst
loading: 0.15 g/L. Standard deviation for repeats was ±5%.
Figure 5.11 shows the cumulative hydrogen production for the Pt–TiO2 synthesized
photocatalysts using the sol-gel Method B. The first 30 minutes can be established as
induction period due to no hydrogen molecules were detected. One can recognize that the
observed linear trend is consistent with the photocatalyst prepared using the sol-gel Method
A and with respect to Degussa P25.
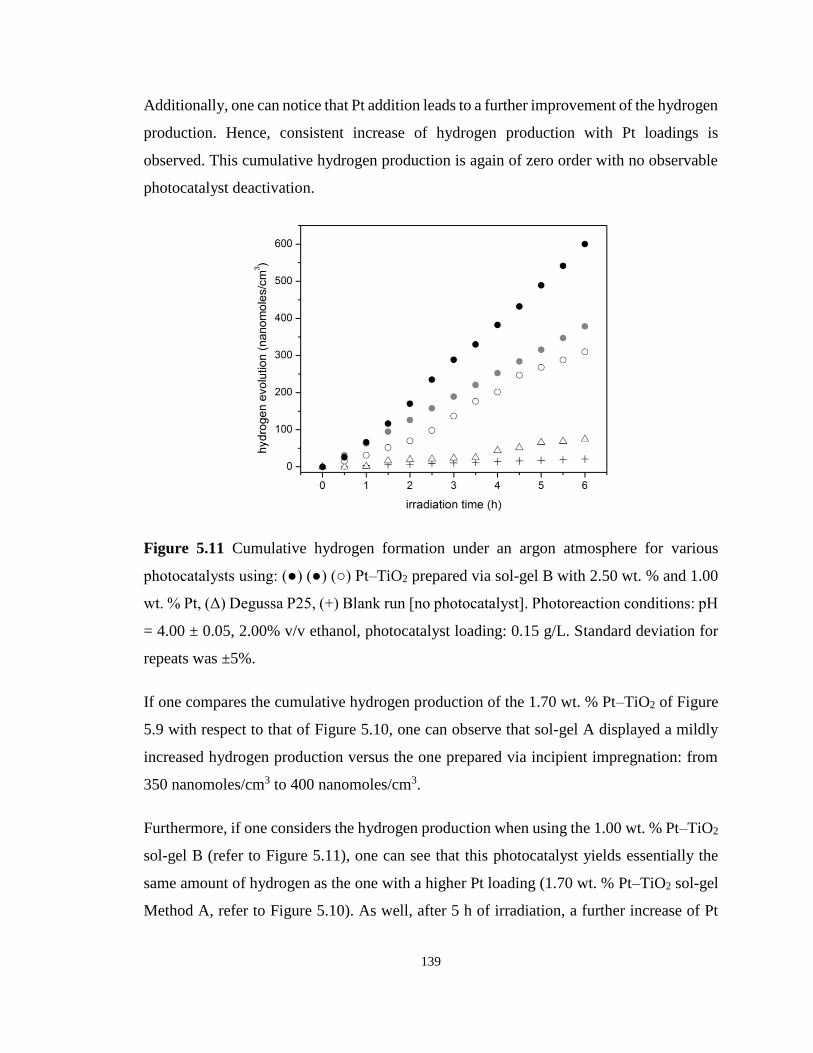
139
Additionally, one can notice that Pt addition leads to a further improvement of the hydrogen
production. Hence, consistent increase of hydrogen production with Pt loadings is
observed. This cumulative hydrogen production is again of zero order with no observable
photocatalyst deactivation.
Figure 5.11 Cumulative hydrogen formation under an argon atmosphere for various
photocatalysts using: (●) (●) (○) Pt–TiO2 prepared via sol-gel B with 2.50 wt. % and 1.00
wt. % Pt, (Δ) Degussa P25, (+) Blank run [no photocatalyst]. Photoreaction conditions: pH
= 4.00 ± 0.05, 2.00% v/v ethanol, photocatalyst loading: 0.15 g/L. Standard deviation for
repeats was ±5%.
If one compares the cumulative hydrogen production of the 1.70 wt. % Pt–TiO2 of Figure
5.9 with respect to that of Figure 5.10, one can observe that sol-gel A displayed a mildly
increased hydrogen production versus the one prepared via incipient impregnation: from
350 nanomoles/cm3 to 400 nanomoles/cm3.
Furthermore, if one considers the hydrogen production when using the 1.00 wt. % Pt–TiO2
sol-gel B (refer to Figure 5.11), one can see that this photocatalyst yields essentially the
same amount of hydrogen as the one with a higher Pt loading (1.70 wt. % Pt–TiO2 sol-gel
Method A, refer to Figure 5.10). As well, after 5 h of irradiation, a further increase of Pt
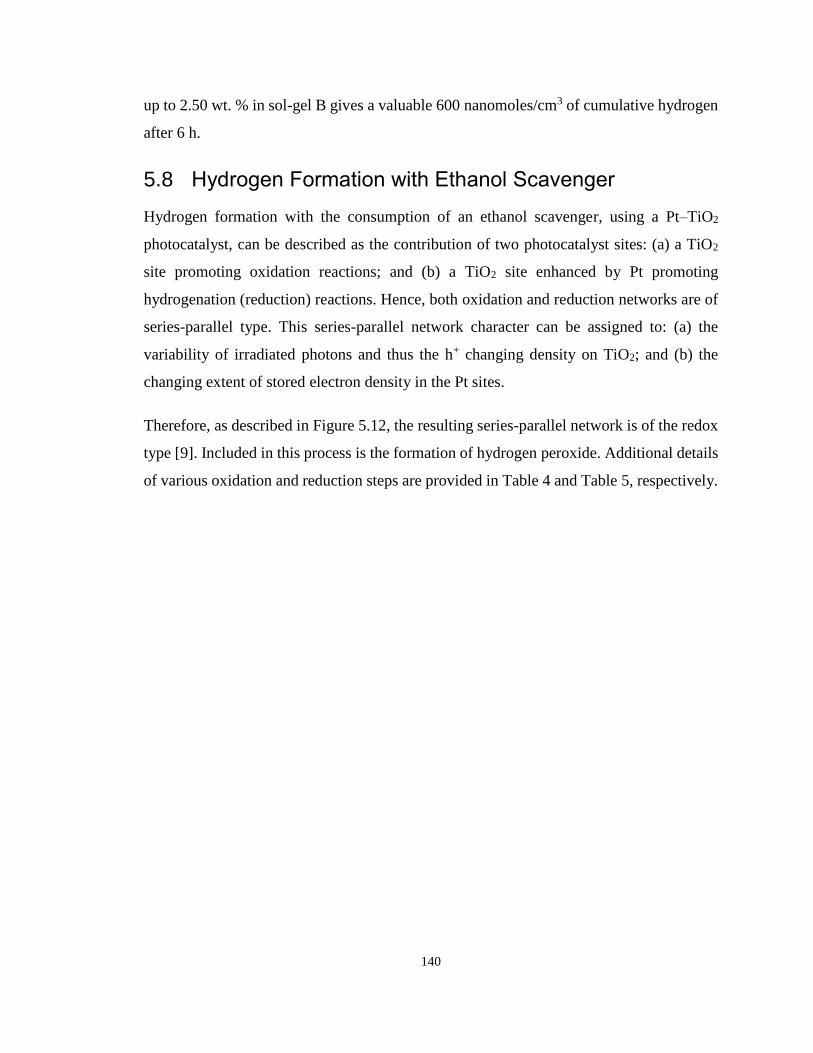
140
up to 2.50 wt. % in sol-gel B gives a valuable 600 nanomoles/cm3 of cumulative hydrogen
after 6 h.
5.8 Hydrogen Formation with Ethanol Scavenger
Hydrogen formation with the consumption of an ethanol scavenger, using a Pt–TiO2
photocatalyst, can be described as the contribution of two photocatalyst sites: (a) a TiO2
site promoting oxidation reactions; and (b) a TiO2 site enhanced by Pt promoting
hydrogenation (reduction) reactions. Hence, both oxidation and reduction networks are of
series-parallel type. This series-parallel network character can be assigned to: (a) the
variability of irradiated photons and thus the h+ changing density on TiO2; and (b) the
changing extent of stored electron density in the Pt sites.
Therefore, as described in Figure 5.12, the resulting series-parallel network is of the redox
type [9]. Included in this process is the formation of hydrogen peroxide. Additional details
of various oxidation and reduction steps are provided in Table 4 and Table 5, respectively.
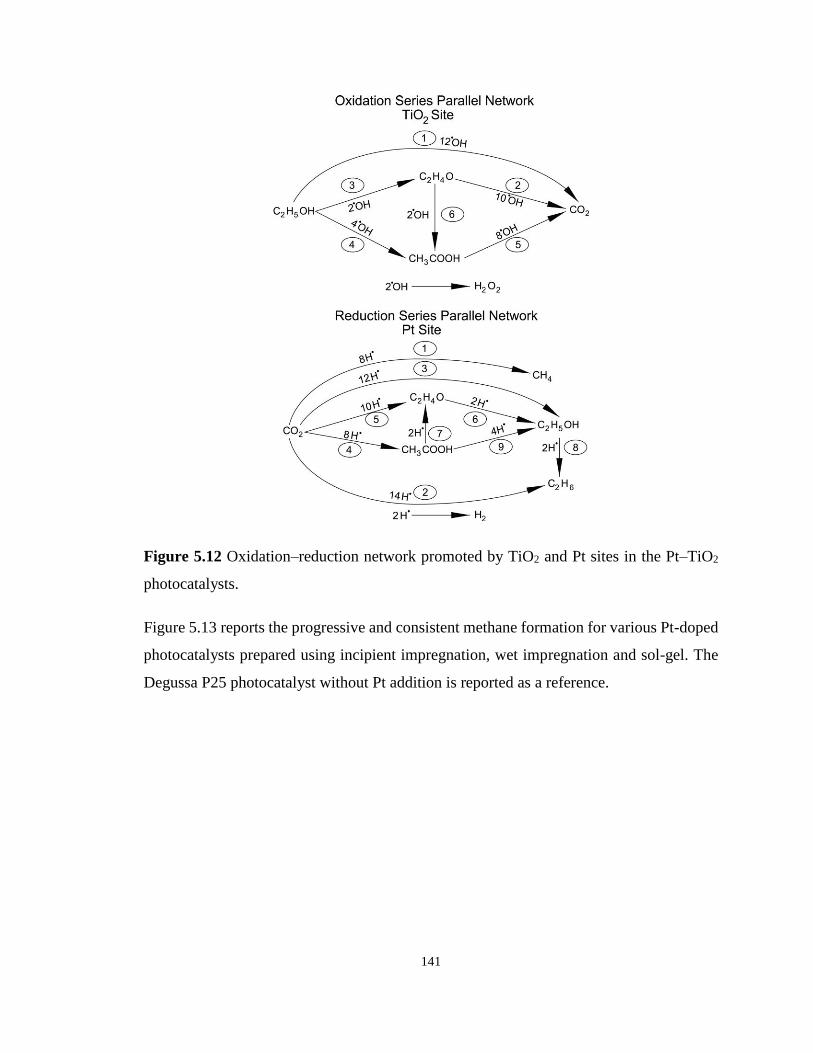
141
Figure 5.12 Oxidation–reduction network promoted by TiO2 and Pt sites in the Pt–TiO2
photocatalysts.
Figure 5.13 reports the progressive and consistent methane formation for various Pt-doped
photocatalysts prepared using incipient impregnation, wet impregnation and sol-gel. The
Degussa P25 photocatalyst without Pt addition is reported as a reference.
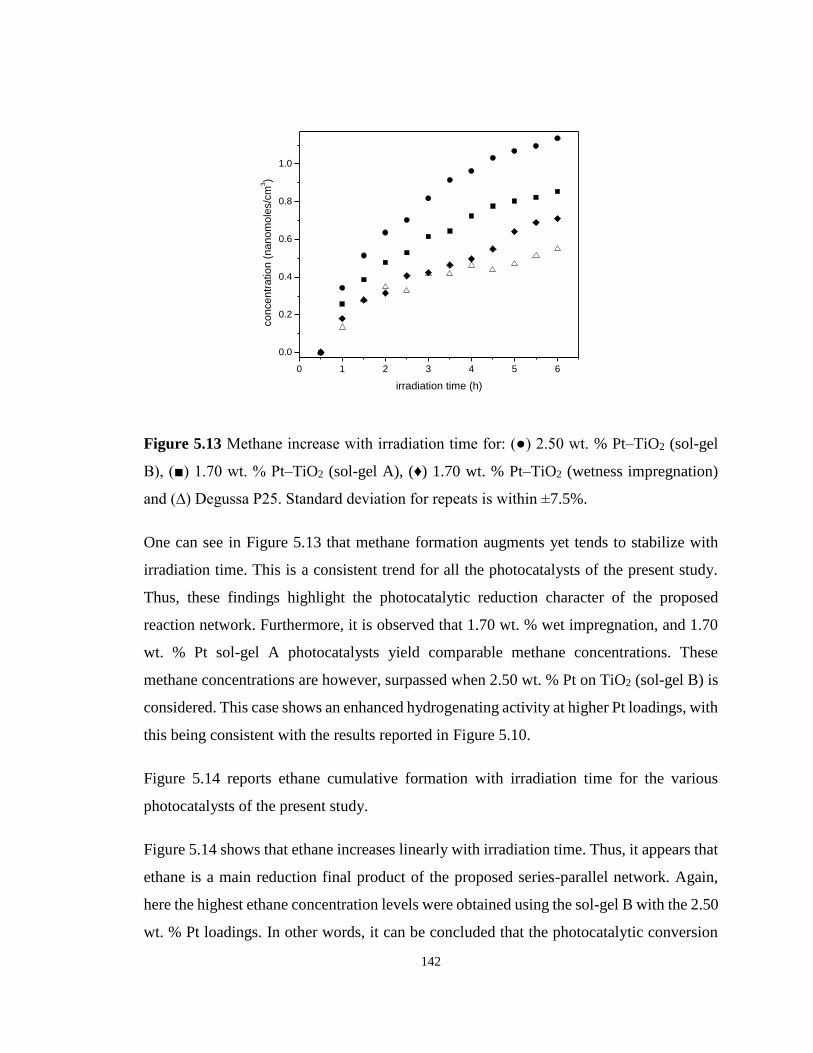
142
0 1 2 3 4 5 6
0.0
0.2
0.4
0.6
0.8
1.0
co
nce
ntr
atio
n (
na
no
mo
les/c
m3)
irradiation time (h)
Figure 5.13 Methane increase with irradiation time for: (●) 2.50 wt. % Pt–TiO2 (sol-gel
B), (■) 1.70 wt. % Pt–TiO2 (sol-gel A), (♦) 1.70 wt. % Pt–TiO2 (wetness impregnation)
and (∆) Degussa P25. Standard deviation for repeats is within ±7.5%.
One can see in Figure 5.13 that methane formation augments yet tends to stabilize with
irradiation time. This is a consistent trend for all the photocatalysts of the present study.
Thus, these findings highlight the photocatalytic reduction character of the proposed
reaction network. Furthermore, it is observed that 1.70 wt. % wet impregnation, and 1.70
wt. % Pt sol-gel A photocatalysts yield comparable methane concentrations. These
methane concentrations are however, surpassed when 2.50 wt. % Pt on TiO2 (sol-gel B) is
considered. This case shows an enhanced hydrogenating activity at higher Pt loadings, with
this being consistent with the results reported in Figure 5.10.
Figure 5.14 reports ethane cumulative formation with irradiation time for the various
photocatalysts of the present study.
Figure 5.14 shows that ethane increases linearly with irradiation time. Thus, it appears that
ethane is a main reduction final product of the proposed series-parallel network. Again,
here the highest ethane concentration levels were obtained using the sol-gel B with the 2.50
wt. % Pt loadings. In other words, it can be concluded that the photocatalytic conversion
143
of the ethanol scavenger is significantly affected by several reduction steps leading to the
formation of both methane and ethane.
On the other hand, Figure 5.15 reports the acetaldehyde obtained, with acetaldehyde
formation increasing progressively with irradiation time. This described trend was
observed consistently for all the studied photocatalysts with added Pt.
Thus, as shown in Figure 5.15, photocatalysis with loaded Pt leads to the oxidation of the
ethanol scavenger. One should notice in this respect, that acetaldehyde is a characteristic
representative species of primary oxidation products of the network oxidation branch, as
described in Table 5.4. One can notice in Figure 5.15 that the 1.70 wt. % Pt-sol-gel A yields
the highest acetaldehyde concentrations, consistent with higher overall photocatalytic
activity.
0 1 2 3 4 5 6
0
2
4
6
8
10
12
14
co
nce
ntr
atio
n (
na
no
mo
les/c
m3)
irradiation time (h)
Figure 5.14 Ethane increase with irradiation time for: (●) 2.50 wt. % Pt–TiO2 (sol-gel B),
(■) 1.70 wt. % Pt–TiO2 (sol-gel A), (♦) 1.70 wt. % Pt–TiO2 (wetness impregnation) and
(∆) Degussa P25. Standard deviation for repeats is within ±7%.
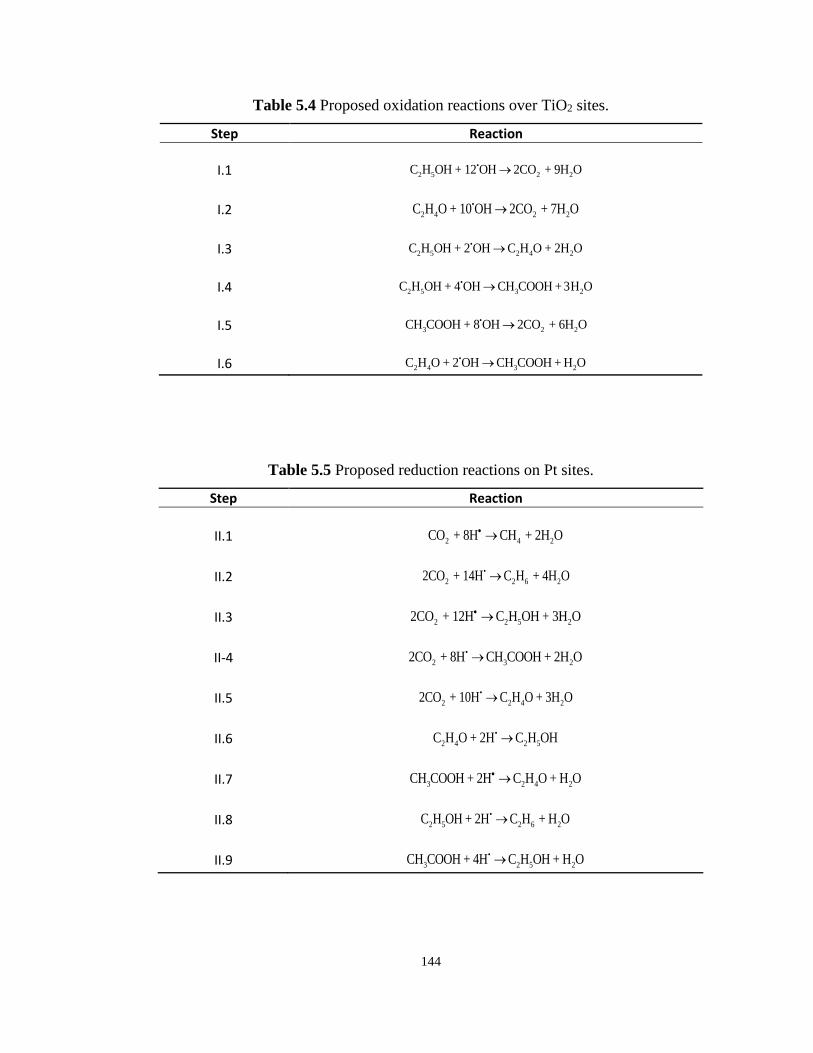
144
Table 5.4 Proposed oxidation reactions over TiO2 sites.
Step Reaction
I.1 •
2 5 2 2C H OH + 12 OH 2CO + 9H O
I.2 •
2 4 2 2C H O + 10 OH 2CO + 7H O
I.3 •
2 5 2 4 2C H OH + 2 OH C H O + 2H O
I.4 •
2 5 3 2C H OH + 4 OH CH COOH + 3H O
I.5 •
3 2 2CH COOH + 8 OH 2CO + 6H O
I.6 •
2 4 3 2C H O + 2 OH CH COOH + H O
Table 5.5 Proposed reduction reactions on Pt sites.
Step Reaction
II.1 2 4 2CO + 8H CH + 2H O•
II.2 •
2 2 6 22CO + 14H C H + 4H O
II.3 2 2 5 22CO + 12H C H OH + 3H O•
II-4 •
2 3 22CO + 8H CH COOH + 2H O
II.5 •
2 2 4 22CO + 10H C H O + 3H O
II.6 •
2 4 2 5C H O + 2H C H OH
II.7 3 2 4 2CH COOH + 2H C H O + H O•
II.8 •
2 5 2 6 2C H OH + 2H C H + H O
II.9 •
3 2 5 2CH COOH + 4H C H OH + H O
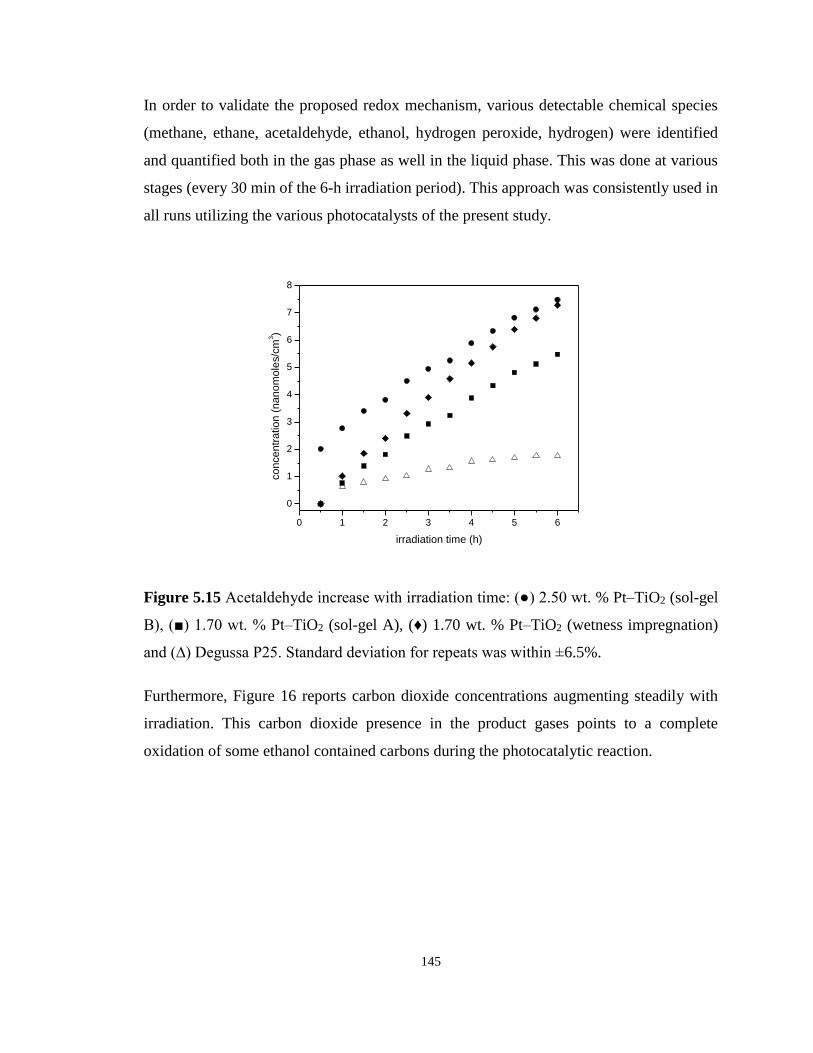
145
In order to validate the proposed redox mechanism, various detectable chemical species
(methane, ethane, acetaldehyde, ethanol, hydrogen peroxide, hydrogen) were identified
and quantified both in the gas phase as well in the liquid phase. This was done at various
stages (every 30 min of the 6-h irradiation period). This approach was consistently used in
all runs utilizing the various photocatalysts of the present study.
0 1 2 3 4 5 6
0
1
2
3
4
5
6
7
8
co
nce
ntr
atio
n (
na
no
mo
les/c
m3)
irradiation time (h)
Figure 5.15 Acetaldehyde increase with irradiation time: (●) 2.50 wt. % Pt–TiO2 (sol-gel
B), (■) 1.70 wt. % Pt–TiO2 (sol-gel A), (♦) 1.70 wt. % Pt–TiO2 (wetness impregnation)
and (∆) Degussa P25. Standard deviation for repeats was within ±6.5%.
Furthermore, Figure 16 reports carbon dioxide concentrations augmenting steadily with
irradiation. This carbon dioxide presence in the product gases points to a complete
oxidation of some ethanol contained carbons during the photocatalytic reaction.
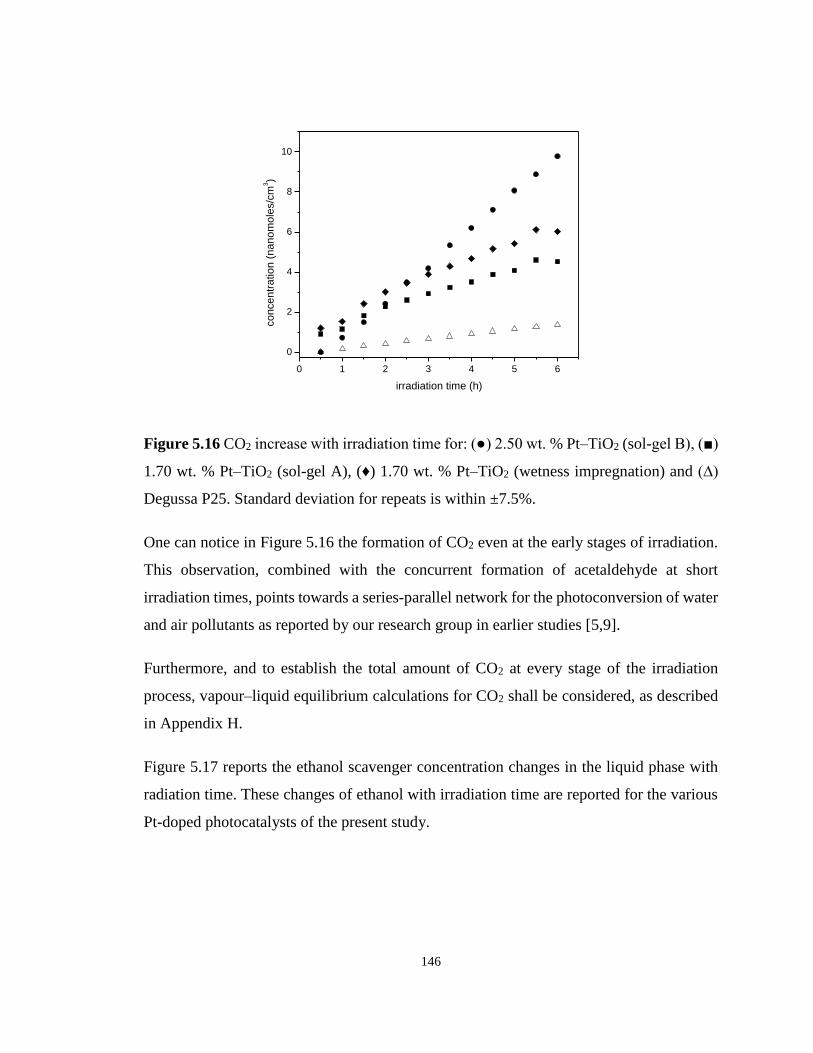
146
0 1 2 3 4 5 6
0
2
4
6
8
10
co
nce
ntr
atio
n (
na
no
mo
les/c
m3)
irradiation time (h)
Figure 5.16 CO2 increase with irradiation time for: (●) 2.50 wt. % Pt–TiO2 (sol-gel B), (■)
1.70 wt. % Pt–TiO2 (sol-gel A), (♦) 1.70 wt. % Pt–TiO2 (wetness impregnation) and (∆)
Degussa P25. Standard deviation for repeats is within ±7.5%.
One can notice in Figure 5.16 the formation of CO2 even at the early stages of irradiation.
This observation, combined with the concurrent formation of acetaldehyde at short
irradiation times, points towards a series-parallel network for the photoconversion of water
and air pollutants as reported by our research group in earlier studies [5,9].
Furthermore, and to establish the total amount of CO2 at every stage of the irradiation
process, vapour–liquid equilibrium calculations for CO2 shall be considered, as described
in Appendix H.
Figure 5.17 reports the ethanol scavenger concentration changes in the liquid phase with
radiation time. These changes of ethanol with irradiation time are reported for the various
Pt-doped photocatalysts of the present study.
147
0 1 2 3 4 5 6
0.00
0.05
0.10
0.15
0.20
0.25
0.30
0.35
0.40
Eth
an
ol (m
ol/L
)
Irradiation time (h)
Figure 5.17 Ethanol concentration changes with irradiation time for: (●) 2.50 wt % Pt–
TiO2 (sol-gel B), (■) 1.70 wt. % Pt–TiO2 (sol-gel A), (♦) 1.70 wt. % Pt–TiO2 (wetness
impregnation) and (∆) Degussa P25. Notes: a) Initial ethanol concentration: 2.00% v/v or
0.345 mole/L.
One can observe in Figure 5.17 a progressive and mild decline of the ethanol scavenger
concentration with irradiation time. This tendency for net ethanol to decrease is in line with
an oxidation–reduction network where ethanol may be consumed and formed
simultaneously.
5.9 Quantum Yields for Different Semiconducting Materials
In order to evaluate photocatalytic efficiency, a quantum yield can be defined as described
with Equation (2) based on the moles of H● produced.
Figure 5.18 reports the quantum yield efficiencies for the various photocatalysts of the
present study using sol-gel as well as wet impregnation methods. These photocatalysts
contain various Pt loadings.
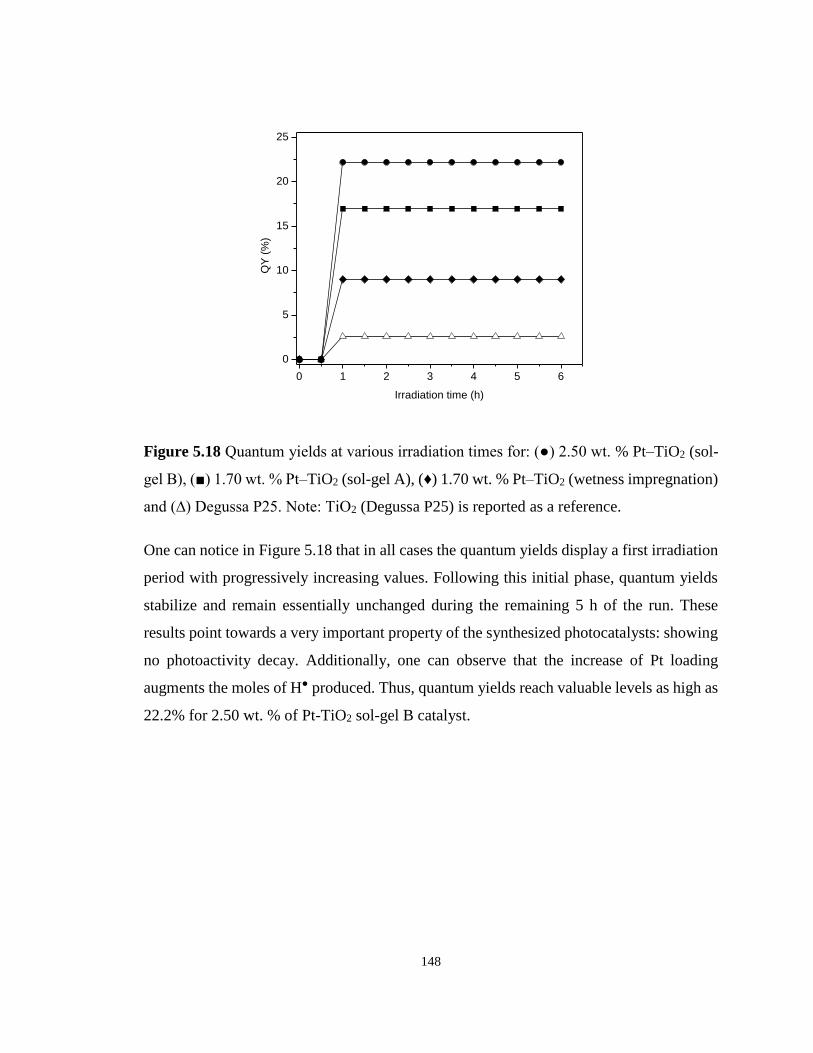
148
0 1 2 3 4 5 6
0
5
10
15
20
25
QY
(%
)
Irradiation time (h)
Figure 5.18 Quantum yields at various irradiation times for: (●) 2.50 wt. % Pt–TiO2 (sol-
gel B), (■) 1.70 wt. % Pt–TiO2 (sol-gel A), (♦) 1.70 wt. % Pt–TiO2 (wetness impregnation)
and (∆) Degussa P25. Note: TiO2 (Degussa P25) is reported as a reference.
One can notice in Figure 5.18 that in all cases the quantum yields display a first irradiation
period with progressively increasing values. Following this initial phase, quantum yields
stabilize and remain essentially unchanged during the remaining 5 h of the run. These
results point towards a very important property of the synthesized photocatalysts: showing
no photoactivity decay. Additionally, one can observe that the increase of Pt loading
augments the moles of H● produced. Thus, quantum yields reach valuable levels as high as
22.2% for 2.50 wt. % of Pt-TiO2 sol-gel B catalyst.
149
5.10 Conclusions
The following are the major conclusions of the present chapter:
(a) Pt-loaded photocatalysts can be prepared using both wet impregnation and sol-gel
synthesis. These photocatalysts are used very effectively to produce hydrogen via water
dissociation with 2.00% v/v ethanol as an organic scavenger.
(b) The Pt–TiO2 sol-gel photocatalysts showed a reduced 2.34 eV band gap. This reduced
band gap can be attributed to the role of Pt in the modified semiconductor. In addition, the
XRD for the Pt–TiO2 sol-gel photocatalysts showed a dominant anatase content,
contributing to enhanced photocatalytic activity for hydrogen production.
(c) A common series-parallel reaction network with reduction–oxidation steps included
was observed for all photocatalysts studied for hydrogen production, using ethanol as an
organic scavenger. Both reduced species (methane, ethane) and oxidized species
(acetaldehyde, carbon dioxide) were consistently detected in all experiments.
(d) The proposed reaction network was found to be consistent with the overall carbon
balance, accounting for various carbon-containing species involved in both oxidation and
reduction steps.
150
5.11 References
[1] Bahruji, H.; Bowker, M.; Davies, P.R.; Pedrono, F. New insights into the mechanism
of photocatalytic reforming on Pd/TiO2. Appl. Catal. B Environ. 2011, 107, 205–209,
doi:10.1016/j.apcatb.2011.07.015.
[2] Bahruji, H.; Bowker, M.; Davies, P.R.; Al-Mazroai, L.S.; Dickinson, A.; Greaves, J.;
James, D.; Millard, L.; Pedrono, F. Sustainable H2 gas production by photocatalysis. J.
Photochem. Photobiol. Chem. 2010, 216, 115–118,
doi:10.1016/j.jphotochem.2010.06.022.
[3] Kudo, A. Recent progress in the development of visible light-driven powdered
photocatalysts for water splitting. Int. J. Hydrog. Energy 2007, 32, 2673–2678,
doi:10.1016/j.ijhydene.2006.09.010.
[4] Galińska, A.; Walendziewski, J. Photocatalytic Water Splitting over Pt-TiO2 in the
Presence of Sacrificial Reagents. Energy Fuels 2005, 19, 1143–1147,
doi:10.1021/ef0400619.
[5] Escobedo Salas, S.; Serrano Rosales, B.; de Lasa, H. Quantum yield with platinum
modified TiO2 photocatalyst for hydrogen production. Appl. Catal. B Environ. 2013,
140–141, 523–536.
[6] Bahruji, H.; Bowker, M.; Brookes, C.; Davies, P.R.; Wawata, I. The adsorption and
reaction of alcohols on TiO2 and Pd/TiO2 catalysts. Appl. Catal. Gen. 2013, 454, 66–
73, doi:10.1016/j.apcata.2013.01.005.
[7] Yoong, L.S.; Chong, F.K.; Dutta, B.K. Development of copper-doped TiO2
photocatalyst for hydrogen production under visible light. Energy 2009, 34, 1652–
1661, doi:10.1016/j.energy.2009.07.024.
151
[8] Guayaquil-Sosa, J.F.; Serrano-Rosales, B.; Valadés-Pelayo, P.J.; de Lasa, H.
Photocatalytic hydrogen production using mesoporous TiO2 doped with Pt. Appl.
Catal. B Environ. 2017, 211, 337–348, doi:10.1016/j.apcatb.2017.04.029.
[9] Escobedo, S.; Serrano, B.; Calzada, A.; Moreira, J.; de Lasa, H. Hydrogen production
using a platinum modified TiO2 photocatalyst and an organic scavenger. Kinetic
modeling. Fuel 2016, 181, 438–449.
[10] Cerdá, J.; Marchetti, J.L.; Cassano, A.E. Radiation efficiencies in elliptical
photoreactors. Lat. Am. J. Heat Mass Transfer. 1977, 1, 33–63.
152
Chapter 6
6 Conclusions and Recommendations
As discussed in the literature review section of this PhD thesis, there is a need to design
and synthesize novel materials that enhance the photocatalytic hydrogen production via
water dissociation. If successful, one can foresee the development of larger externally
irradiated demonstration scale photoreactors. This technology has the potential of being of
benefit to isolated communities in Canada. Hydrogen could be used as an energy vector
and as a mean of storing solar energy in the summer for usage in the winter. Alternatively,
one could envision the usage of the photocatalytic technology for hydrogen production for
the utilization of current excesses of electrical energy in Ontario and Quebec. The
hydrogen produced could be used in individual vehicles powered-driven by fuel cells. As
well it could be co-fed with other hydrocarbon feedstocks (e.g. methane), as a fuel, in
power stations thus reducing CO2 emissions.
To accomplish this, there is the need of progress in the area of photocatalytic reactors, to
surpass the current relatively low Quantum Yields (1-10 %) achieving higher Quantum
Yields (in the 45% range). This is particularly true in the case of photocatalytic hydrogen
production, which requires two simultaneous or quasi-simultaneous photons to interact
with two adjacent semiconductor sites. Thus, and in this respect, the present PhD
dissertation, strive to open new ground for hydrogen production under near-UV irradiation
using mesoporous TiO2, doped with platinum.
This PhD also contributes to a better understanding the oxidation-reduction network for
photocatalytic hydrogen production using ethanol as organic scavenger. This PhD research
reports an original study on the synthesis, characterization and photoactivity of
mesoporous titanium dioxide, doped with platinum for hydrogen generation, using ethanol
as an organic scavenger. Moreover, the morphology of the prepared mesoporous TiO2 are
rigorously characterized using surface science techniques. The photocatalytic activity of
this semiconductor is established in a Photo-CREC-Water II Reactor, using ethanol as
organic scavenger (electron donor), at 2 % v/v and with a pH of 4.00. The obtained
Quantum Yields (QYs) in this PhD study were a notable 0.226 (22.6%).
153
6.1 Conclusions
The following conclusions can be considered as the most important contributions of this
PhD research:
(a) It was shown that the mesoporous TiO2 photocatalyst can be successfully synthesized
using Pluronic P123 and Pluronic F127 templates by using a sol-gel method.
(b) It was proven that the synthesized TiO2 photocatalysts display the expected
mesoporous properties which are specific surface area, pore volume and average pore
diameter. This was confirmed using nitrogen adsorption, X-ray diffraction (XRD) and
Scanning Electron Microscopy (SEM). The obtained nitrogen adsorption isotherms
allowed showing that the mesoporous TiO2 prepared by a sol-gel method, displays large
surface areas as well as bimodal pore size distribution.
(c) It was established that the synthesized mesoporous Pt–TiO2 photocatalysts displayed a
reduced 2.34 eV band gap. This reduced band gap was attributed to the effect of Pt on the
modified semiconductors. In addition, the XRD of the Pt–TiO2 sol-gel photocatalysts
showed a dominant anatase composition which appeared to contribute to the enhancement
of the photocatalytic activity for hydrogen production via water dissociation.
(d) It was shown that the Pt-loaded photocatalysts prepared using both wet impregnation
and sol-gel synthesis are very effective compared to the commercial Degussa P25 in the
production of hydrogen via water dissociation with 2.00% v/v ethanol as an organic
scavenger. Additionally, it was demonstrated that Pt plays a very important role in reducing
the semiconductor band gap and trapping generated electrons.
(e) Through reactivity studies, the major importance of both the mesoporous TiO2
architecture and the Pt loading for hydrogen production were proven. It is on this basis,
and given the valuable hydrogen production rates, that further studies with mesoporous
TiO2 synthesized with Pluronic F127 were developed as documented in Chapters 4 and 5.
(f) It was demonstrated that all the synthesized semiconductors displayed a zero-order
reaction for hydrogen production, with no indication of photocatalyst activity decay.
154
Furthermore, it was established that all the photocatalysts studied shared a series-parallel
reaction network involving both reduction and oxidation. In this respect and while using
ethanol as an organic scavenger, both reduced species (methane, ethane) and oxidized
species (aldehyde, carbon dioxide) were consistently detected. It was also shown that this
proposed reaction network was consistent with the overall carbon balance, accounting for
various carbon-containing species involved in both oxidation and reduction steps.
(g) It was confirmed that the synthesized mesoporous Pt-TiO2 semiconductors exhibited
promising energy efficiencies as quantified with the QYs of 22.6 % observed for the
mesoporous 2.50 wt. % Pt-TiO2-550oC.
6.2 Future Work
There are several key issues that have emerged, based on the results examined and the
observations made during this PhD thesis dissertation. Furthermore, there are areas of
opportunity and possible valuable approaches for future work. Such developments are
needed if one aims to extensively apply photocatalytic reactors for hydrogen production
via water dissociation at the commercial scale.
In this respect, the following recommendations outline areas for possible future work:
a) Determining the semiconductor optical properties for a range of pHs, mixing conditions
and photocatalyst concentrations. This would provide insights into the influence of
radiation absorption efficiency using these parameters.
b) Characterizing particle agglomerates formed while using different scavenger
concentrations, pH and photocatalyst concentration. On this basis, the photocatalyst that
provides the best external specific surface area (BET), could be selected. Furthermore, by
taking into account this parameter, photocatalytic hydrogen production and the effect of
particle agglomeration could be accounted for.
c) Comprehensively evaluating the synthesized photocatalyst performance of this PhD
thesis under visible light irradiation using mesoporous TiO2 decorated with other noble
metals (i.e. Pd).
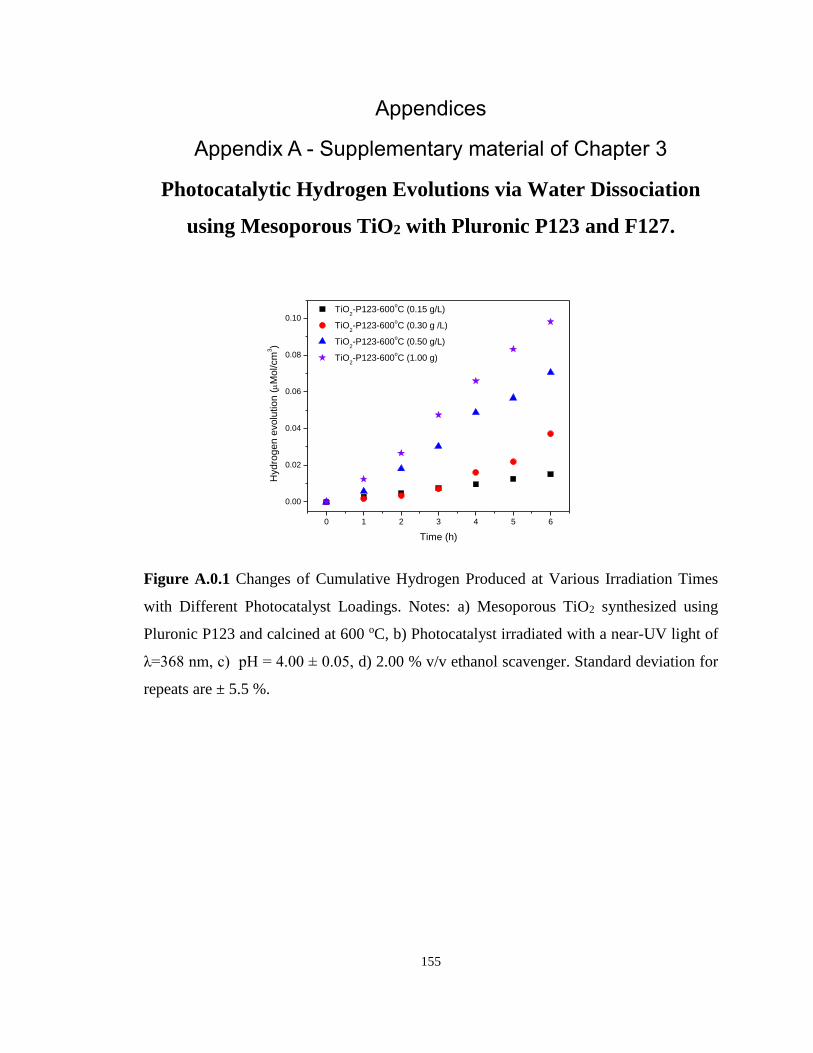
155
Appendices
Appendix A - Supplementary material of Chapter 3
Photocatalytic Hydrogen Evolutions via Water Dissociation
using Mesoporous TiO2 with Pluronic P123 and F127.
0 1 2 3 4 5 6
0.00
0.02
0.04
0.06
0.08
0.10
TiO2-P123-600
oC (0.15 g/L)
TiO2-P123-600
oC (0.30 g /L)
TiO2-P123-600
oC (0.50 g/L)
TiO2-P123-600
oC (1.00 g)
Hyd
rog
en
evo
lutio
n (M
ol/cm
3)
Time (h)
Figure A.0.1 Changes of Cumulative Hydrogen Produced at Various Irradiation Times
with Different Photocatalyst Loadings. Notes: a) Mesoporous TiO2 synthesized using
Pluronic P123 and calcined at 600 oC, b) Photocatalyst irradiated with a near-UV light of
λ=368 nm, c) pH = 4.00 ± 0.05, d) 2.00 % v/v ethanol scavenger. Standard deviation for
repeats are ± 5.5 %.
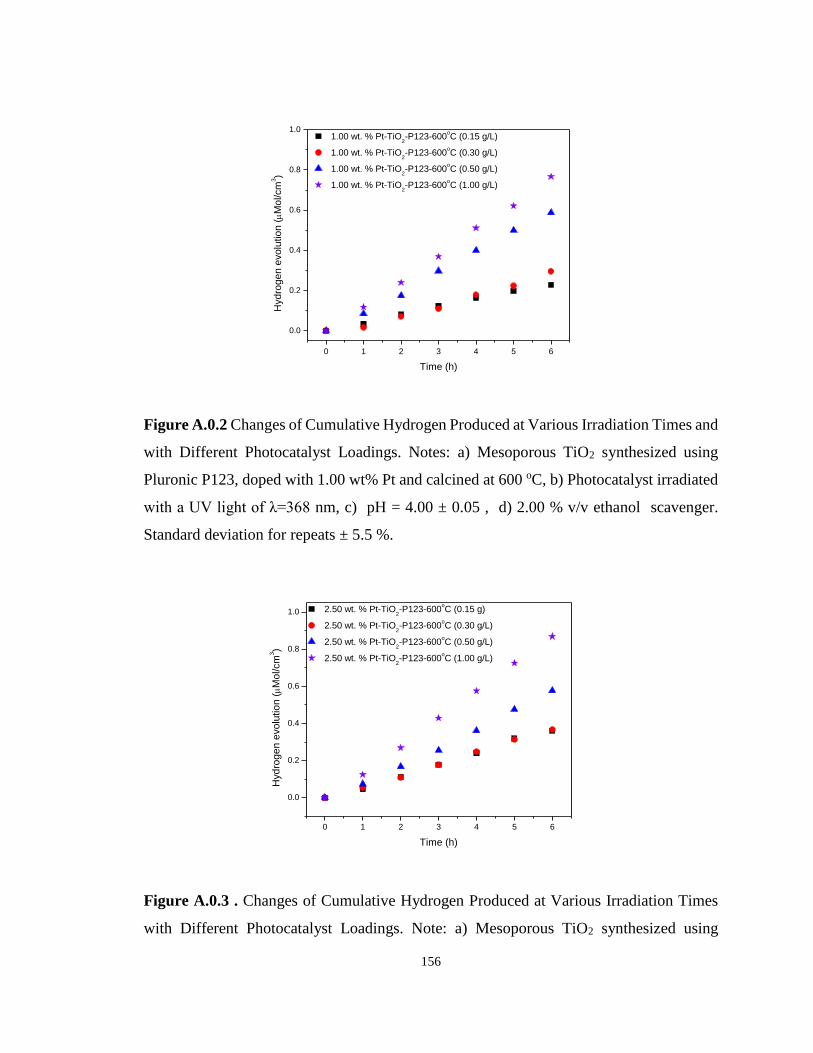
156
0 1 2 3 4 5 6
0.0
0.2
0.4
0.6
0.8
1.0
1.00 wt. % Pt-TiO2-P123-600
oC (0.15 g/L)
1.00 wt. % Pt-TiO2-P123-600
oC (0.30 g/L)
1.00 wt. % Pt-TiO2-P123-600
oC (0.50 g/L)
1.00 wt. % Pt-TiO2-P123-600
oC (1.00 g/L)
Hyd
rog
en
evo
lutio
n (M
ol/cm
3)
Time (h)
Figure A.0.2 Changes of Cumulative Hydrogen Produced at Various Irradiation Times and
with Different Photocatalyst Loadings. Notes: a) Mesoporous TiO2 synthesized using
Pluronic P123, doped with 1.00 wt% Pt and calcined at 600 oC, b) Photocatalyst irradiated
with a UV light of λ=368 nm, c) pH = 4.00 ± 0.05 , d) 2.00 % v/v ethanol scavenger.
Standard deviation for repeats ± 5.5 %.
0 1 2 3 4 5 6
0.0
0.2
0.4
0.6
0.8
1.0
2.50 wt. % Pt-TiO2-P123-600
oC (0.15 g)
2.50 wt. % Pt-TiO2-P123-600
oC (0.30 g/L)
2.50 wt. % Pt-TiO2-P123-600
oC (0.50 g/L)
2.50 wt. % Pt-TiO2-P123-600
oC (1.00 g/L)
Hyd
rog
en
evo
lutio
n (M
ol/cm
3)
Time (h)
Figure A.0.3 . Changes of Cumulative Hydrogen Produced at Various Irradiation Times
with Different Photocatalyst Loadings. Note: a) Mesoporous TiO2 synthesized using
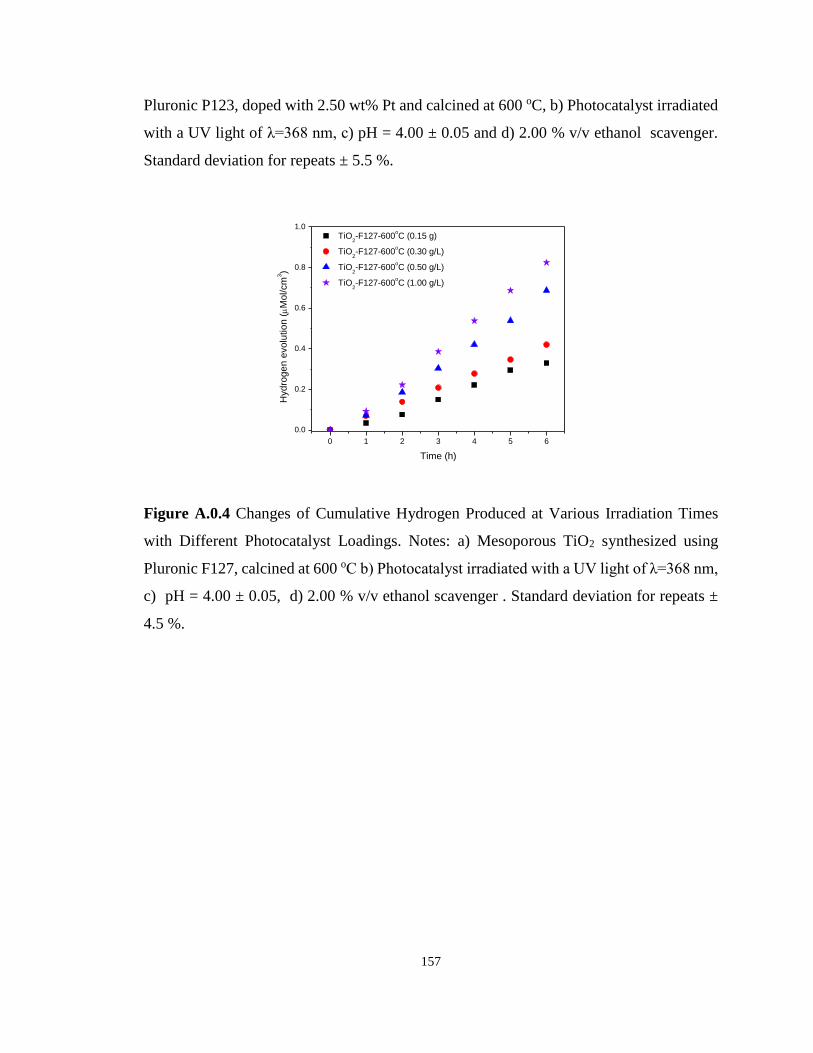
157
Pluronic P123, doped with 2.50 wt% Pt and calcined at 600 oC, b) Photocatalyst irradiated
with a UV light of λ=368 nm, c) pH = 4.00 ± 0.05 and d) 2.00 % v/v ethanol scavenger.
Standard deviation for repeats ± 5.5 %.
0 1 2 3 4 5 6
0.0
0.2
0.4
0.6
0.8
1.0
TiO2-F127-600
oC (0.15 g)
TiO2-F127-600
oC (0.30 g/L)
TiO2-F127-600
oC (0.50 g/L)
TiO2-F127-600
oC (1.00 g/L)
Hyd
rog
en
evo
lutio
n (M
ol/cm
3)
Time (h)
Figure A.0.4 Changes of Cumulative Hydrogen Produced at Various Irradiation Times
with Different Photocatalyst Loadings. Notes: a) Mesoporous TiO2 synthesized using
Pluronic F127, calcined at 600 oC b) Photocatalyst irradiated with a UV light of λ=368 nm,
c) pH = 4.00 ± 0.05, d) 2.00 % v/v ethanol scavenger . Standard deviation for repeats ±
4.5 %.
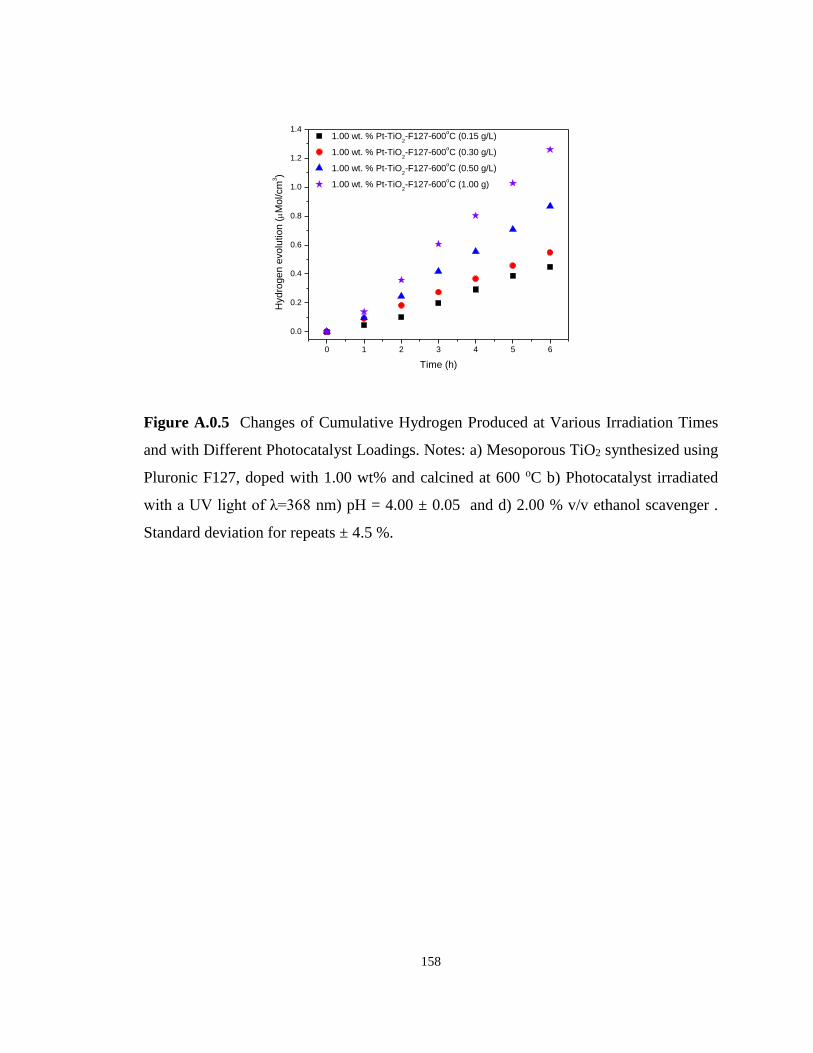
158
0 1 2 3 4 5 6
0.0
0.2
0.4
0.6
0.8
1.0
1.2
1.4
1.00 wt. % Pt-TiO2-F127-600
oC (0.15 g/L)
1.00 wt. % Pt-TiO2-F127-600
oC (0.30 g/L)
1.00 wt. % Pt-TiO2-F127-600
oC (0.50 g/L)
1.00 wt. % Pt-TiO2-F127-600
oC (1.00 g)
Hyd
rog
en
evo
lutio
n (M
ol/cm
3)
Time (h)
Figure A.0.5 Changes of Cumulative Hydrogen Produced at Various Irradiation Times
and with Different Photocatalyst Loadings. Notes: a) Mesoporous TiO2 synthesized using
Pluronic F127, doped with 1.00 wt% and calcined at 600 oC b) Photocatalyst irradiated
with a UV light of λ=368 nm) pH = 4.00 ± 0.05 and d) 2.00 % v/v ethanol scavenger .
Standard deviation for repeats ± 4.5 %.
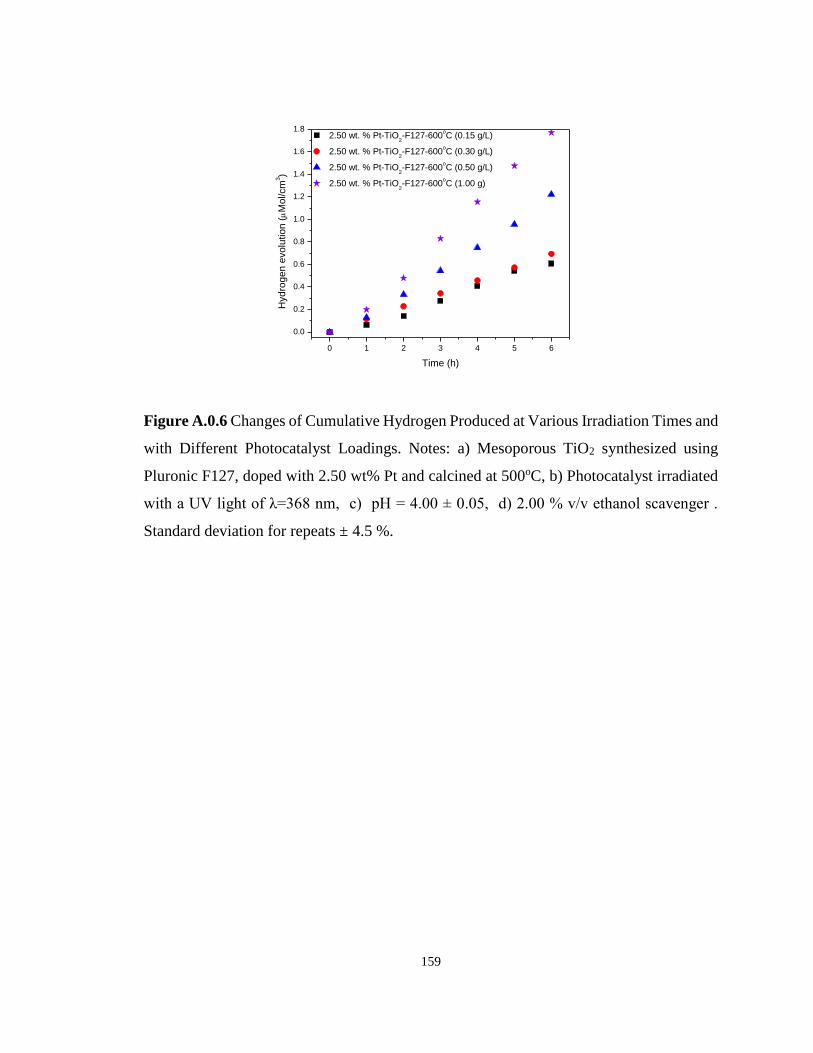
159
0 1 2 3 4 5 6
0.0
0.2
0.4
0.6
0.8
1.0
1.2
1.4
1.6
1.8
2.50 wt. % Pt-TiO2-F127-600
oC (0.15 g/L)
2.50 wt. % Pt-TiO2-F127-600
oC (0.30 g/L)
2.50 wt. % Pt-TiO2-F127-600
oC (0.50 g/L)
2.50 wt. % Pt-TiO2-F127-600
oC (1.00 g)
Hyd
rog
en
evo
lutio
n (M
ol/cm
3)
Time (h)
Figure A.0.6 Changes of Cumulative Hydrogen Produced at Various Irradiation Times and
with Different Photocatalyst Loadings. Notes: a) Mesoporous TiO2 synthesized using
Pluronic F127, doped with 2.50 wt% Pt and calcined at 500oC, b) Photocatalyst irradiated
with a UV light of λ=368 nm, c) pH = 4.00 ± 0.05, d) 2.00 % v/v ethanol scavenger .
Standard deviation for repeats ± 4.5 %.
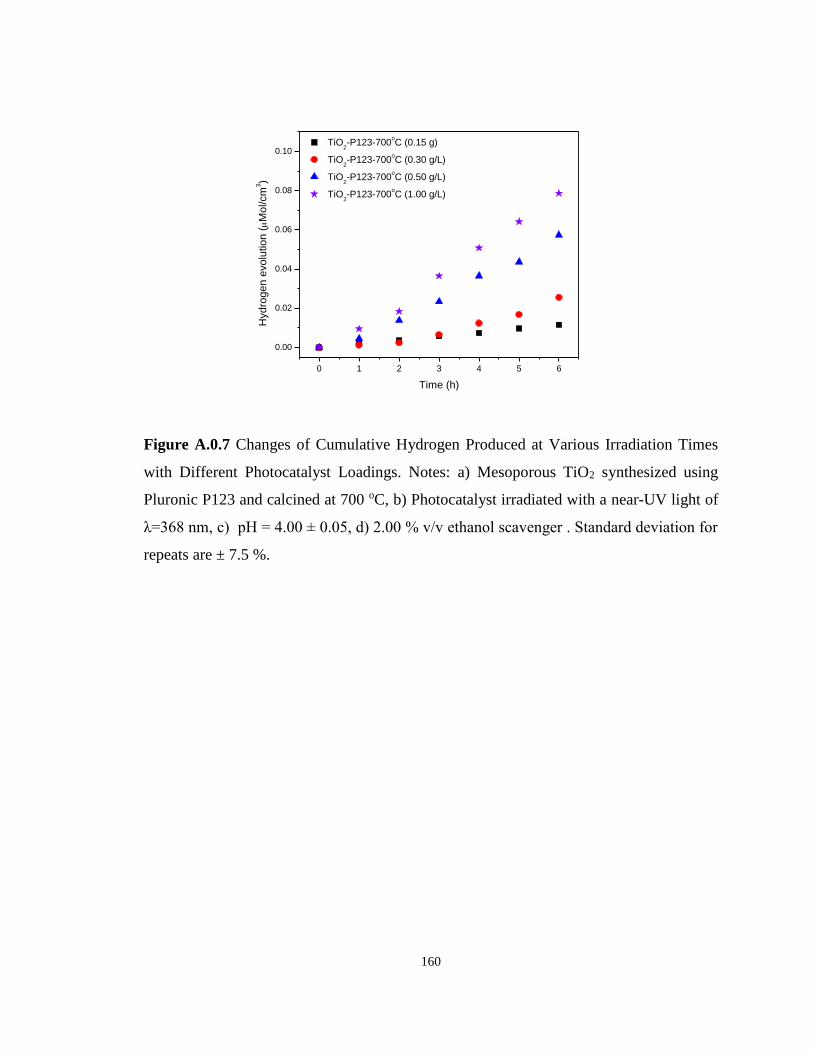
160
0 1 2 3 4 5 6
0.00
0.02
0.04
0.06
0.08
0.10
TiO2-P123-700
oC (0.15 g)
TiO2-P123-700
oC (0.30 g/L)
TiO2-P123-700
oC (0.50 g/L)
TiO2-P123-700
oC (1.00 g/L)
Hyd
rog
en
evo
lutio
n (M
ol/cm
3)
Time (h)
Figure A.0.7 Changes of Cumulative Hydrogen Produced at Various Irradiation Times
with Different Photocatalyst Loadings. Notes: a) Mesoporous TiO2 synthesized using
Pluronic P123 and calcined at 700 oC, b) Photocatalyst irradiated with a near-UV light of
λ=368 nm, c) pH = 4.00 ± 0.05, d) 2.00 % v/v ethanol scavenger . Standard deviation for
repeats are ± 7.5 %.
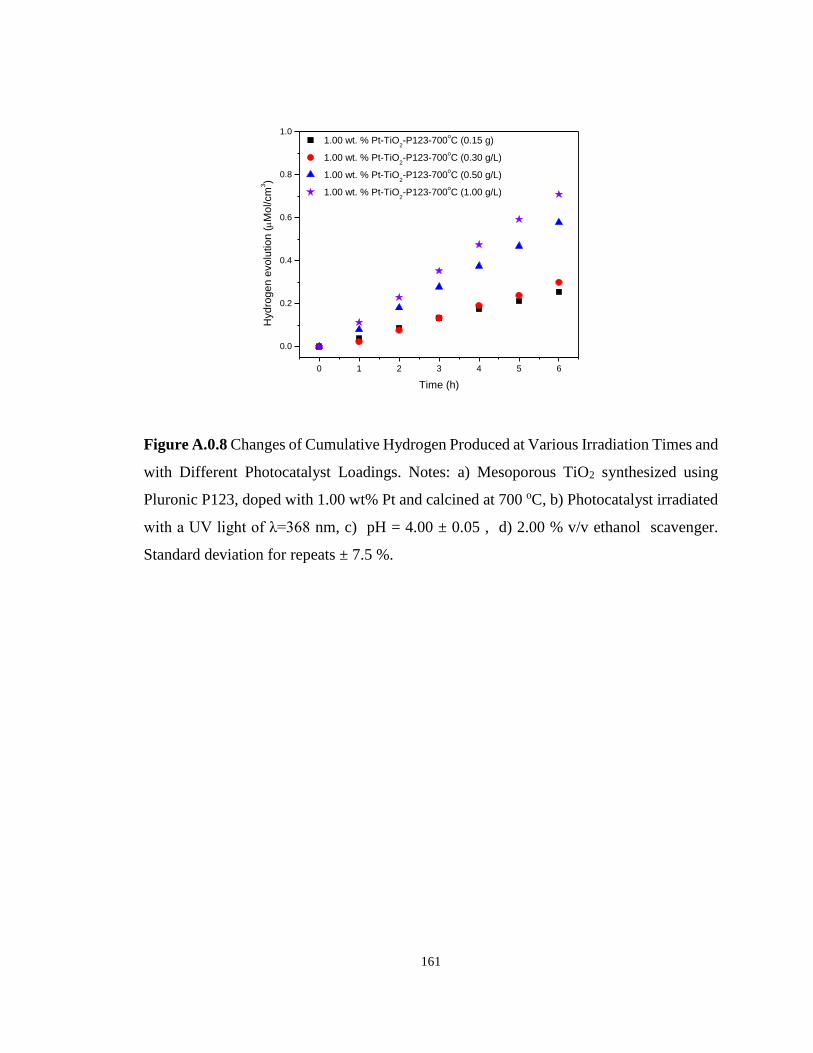
161
0 1 2 3 4 5 6
0.0
0.2
0.4
0.6
0.8
1.0
1.00 wt. % Pt-TiO2-P123-700
oC (0.15 g)
1.00 wt. % Pt-TiO2-P123-700
oC (0.30 g/L)
1.00 wt. % Pt-TiO2-P123-700
oC (0.50 g/L)
1.00 wt. % Pt-TiO2-P123-700
oC (1.00 g/L)
Hyd
rog
en
evo
lutio
n (M
ol/cm
3)
Time (h)
Figure A.0.8 Changes of Cumulative Hydrogen Produced at Various Irradiation Times and
with Different Photocatalyst Loadings. Notes: a) Mesoporous TiO2 synthesized using
Pluronic P123, doped with 1.00 wt% Pt and calcined at 700 oC, b) Photocatalyst irradiated
with a UV light of λ=368 nm, c) pH = 4.00 ± 0.05 , d) 2.00 % v/v ethanol scavenger.
Standard deviation for repeats ± 7.5 %.
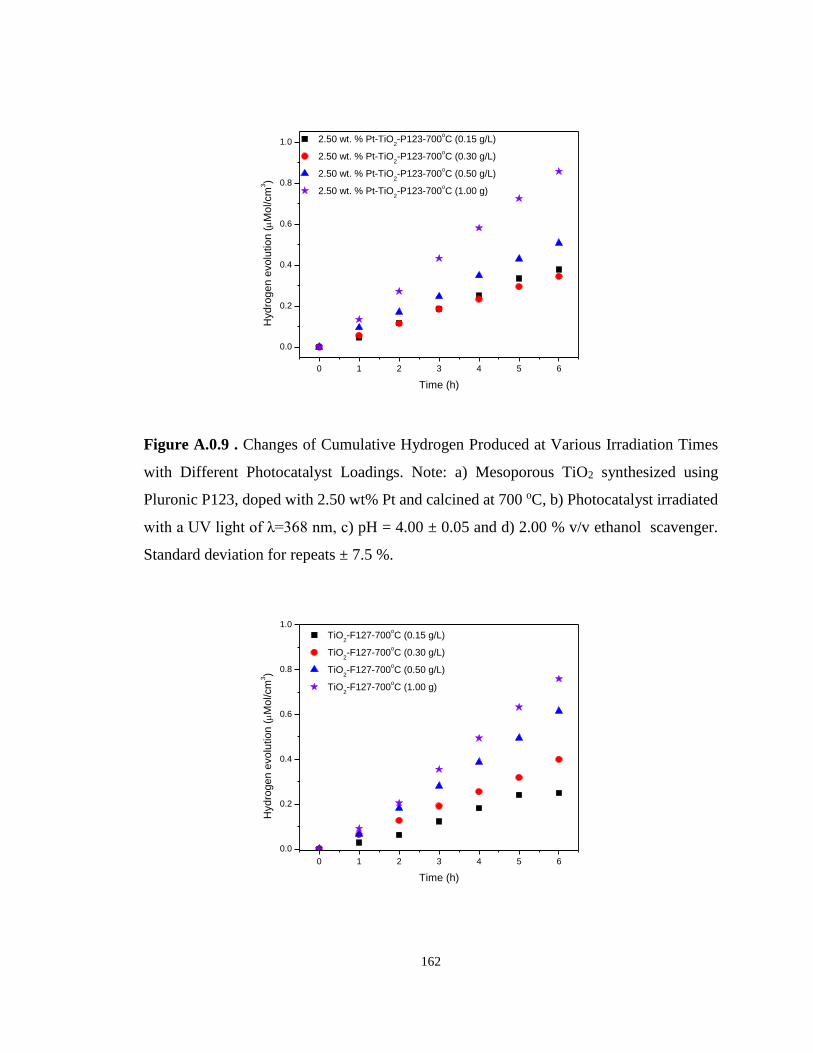
162
0 1 2 3 4 5 6
0.0
0.2
0.4
0.6
0.8
1.0
2.50 wt. % Pt-TiO2-P123-700
oC (0.15 g/L)
2.50 wt. % Pt-TiO2-P123-700
oC (0.30 g/L)
2.50 wt. % Pt-TiO2-P123-700
oC (0.50 g/L)
2.50 wt. % Pt-TiO2-P123-700
oC (1.00 g)
Hyd
rog
en
evo
lutio
n (M
ol/cm
3)
Time (h)
Figure A.0.9 . Changes of Cumulative Hydrogen Produced at Various Irradiation Times
with Different Photocatalyst Loadings. Note: a) Mesoporous TiO2 synthesized using
Pluronic P123, doped with 2.50 wt% Pt and calcined at 700 oC, b) Photocatalyst irradiated
with a UV light of λ=368 nm, c) pH = 4.00 ± 0.05 and d) 2.00 % v/v ethanol scavenger.
Standard deviation for repeats ± 7.5 %.
0 1 2 3 4 5 6
0.0
0.2
0.4
0.6
0.8
1.0
TiO2-F127-700
oC (0.15 g/L)
TiO2-F127-700
oC (0.30 g/L)
TiO2-F127-700
oC (0.50 g/L)
TiO2-F127-700
oC (1.00 g)
Hyd
rog
en
evo
lutio
n (M
ol/cm
3)
Time (h)
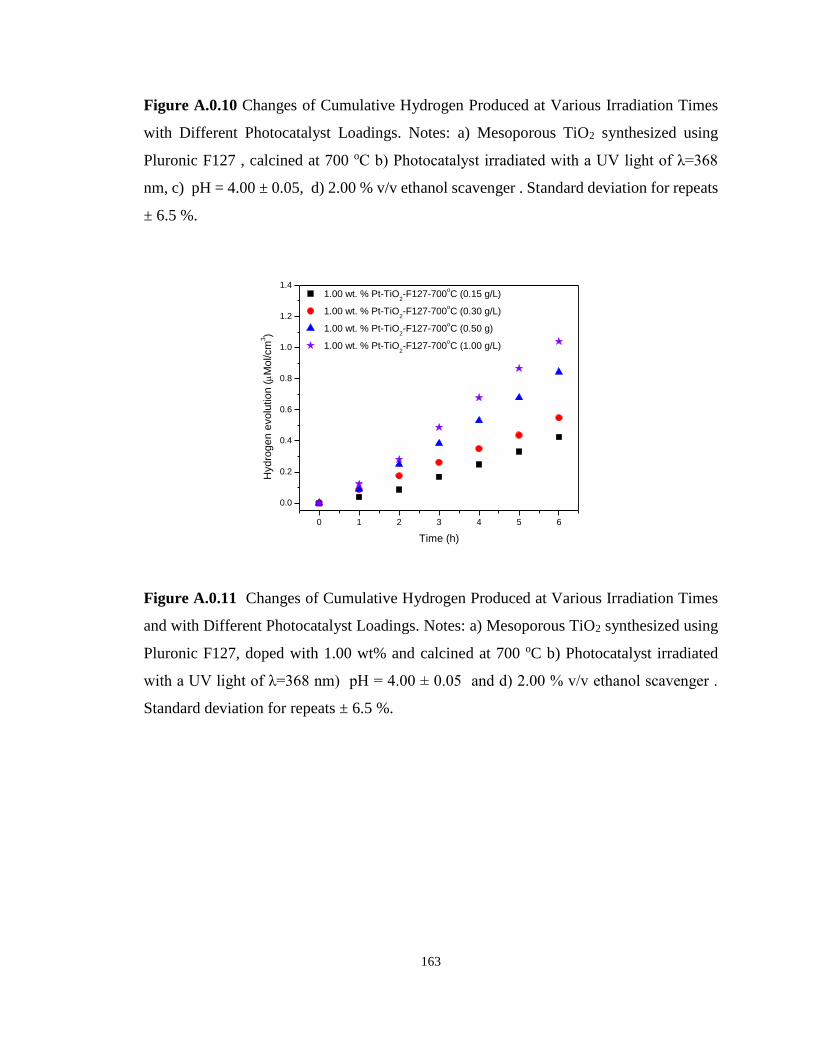
163
Figure A.0.10 Changes of Cumulative Hydrogen Produced at Various Irradiation Times
with Different Photocatalyst Loadings. Notes: a) Mesoporous TiO2 synthesized using
Pluronic F127 , calcined at 700 oC b) Photocatalyst irradiated with a UV light of λ=368
nm, c) pH = 4.00 ± 0.05, d) 2.00 % v/v ethanol scavenger . Standard deviation for repeats
± 6.5 %.
0 1 2 3 4 5 6
0.0
0.2
0.4
0.6
0.8
1.0
1.2
1.4
1.00 wt. % Pt-TiO2-F127-700
oC (0.15 g/L)
1.00 wt. % Pt-TiO2-F127-700
oC (0.30 g/L)
1.00 wt. % Pt-TiO2-F127-700
oC (0.50 g)
1.00 wt. % Pt-TiO2-F127-700
oC (1.00 g/L)
Hyd
rog
en
evo
lutio
n (M
ol/cm
3)
Time (h)
Figure A.0.11 Changes of Cumulative Hydrogen Produced at Various Irradiation Times
and with Different Photocatalyst Loadings. Notes: a) Mesoporous TiO2 synthesized using
Pluronic F127, doped with 1.00 wt% and calcined at 700 oC b) Photocatalyst irradiated
with a UV light of λ=368 nm) pH = 4.00 ± 0.05 and d) 2.00 % v/v ethanol scavenger .
Standard deviation for repeats ± 6.5 %.
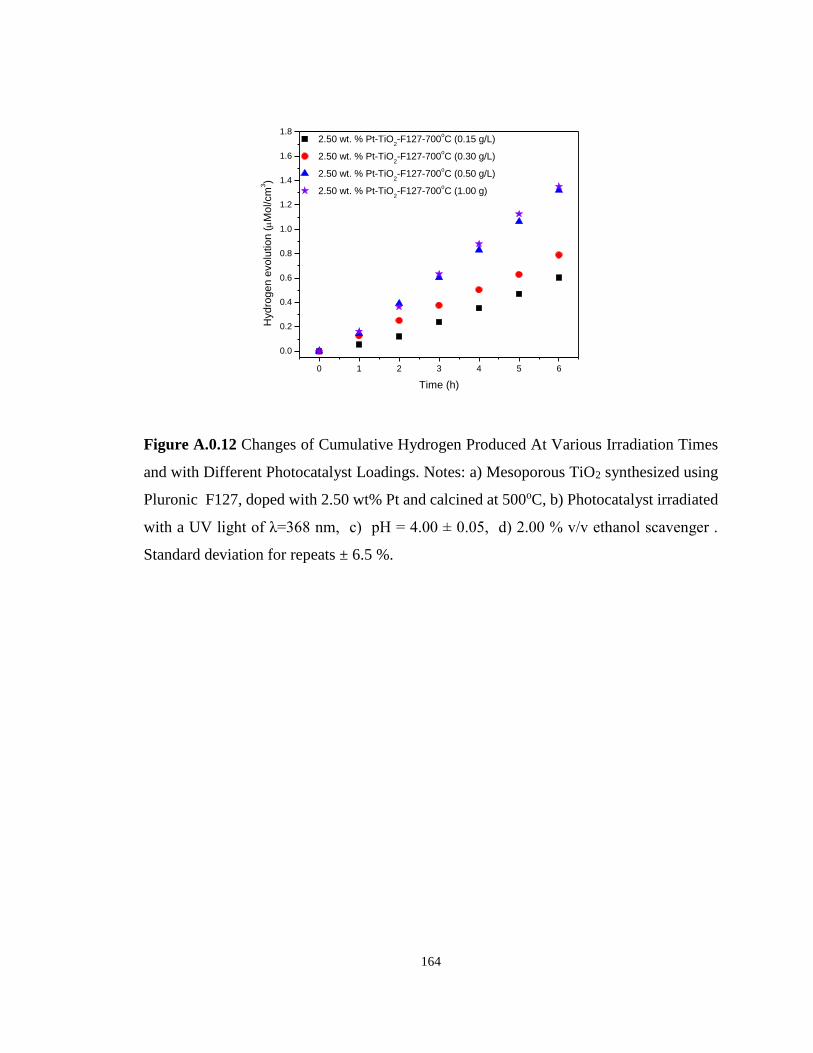
164
0 1 2 3 4 5 6
0.0
0.2
0.4
0.6
0.8
1.0
1.2
1.4
1.6
1.8
2.50 wt. % Pt-TiO2-F127-700
oC (0.15 g/L)
2.50 wt. % Pt-TiO2-F127-700
oC (0.30 g/L)
2.50 wt. % Pt-TiO2-F127-700
oC (0.50 g/L)
2.50 wt. % Pt-TiO2-F127-700
oC (1.00 g)
Hyd
rog
en
evo
lutio
n (M
ol/cm
3)
Time (h)
Figure A.0.12 Changes of Cumulative Hydrogen Produced At Various Irradiation Times
and with Different Photocatalyst Loadings. Notes: a) Mesoporous TiO2 synthesized using
Pluronic F127, doped with 2.50 wt% Pt and calcined at 500oC, b) Photocatalyst irradiated
with a UV light of λ=368 nm, c) pH = 4.00 ± 0.05, d) 2.00 % v/v ethanol scavenger .
Standard deviation for repeats ± 6.5 %.
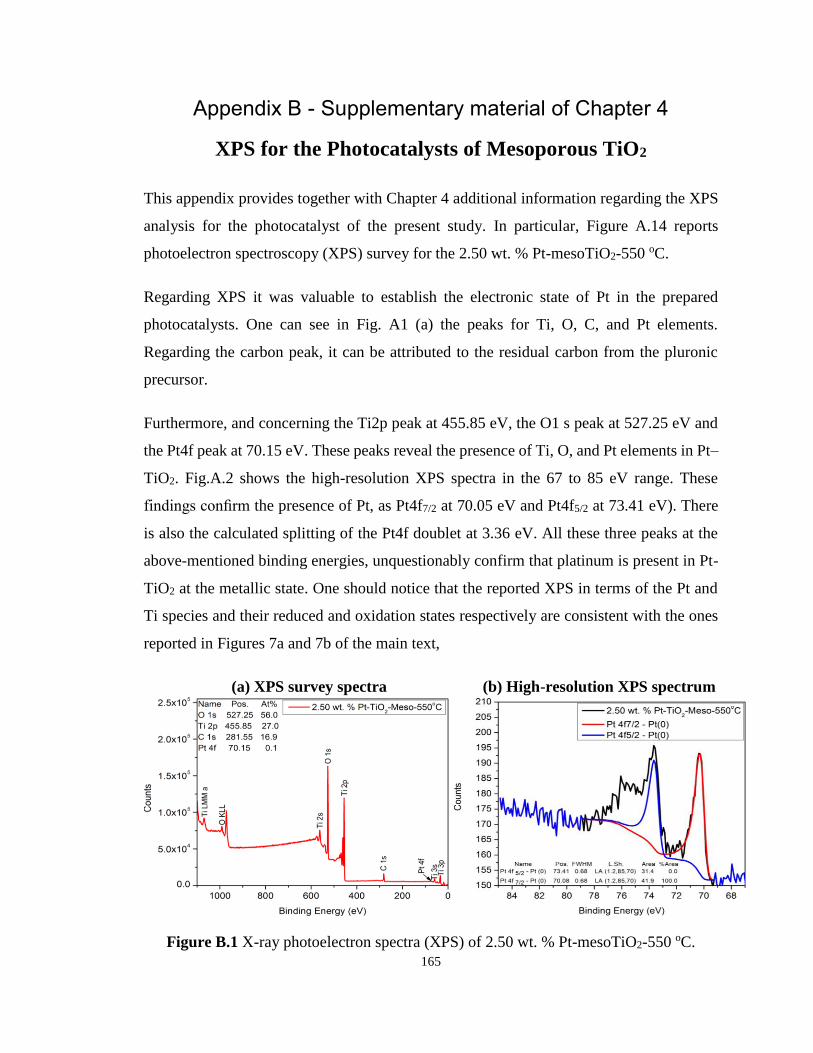
165
Appendix B - Supplementary material of Chapter 4
XPS for the Photocatalysts of Mesoporous TiO2
This appendix provides together with Chapter 4 additional information regarding the XPS
analysis for the photocatalyst of the present study. In particular, Figure A.14 reports
photoelectron spectroscopy (XPS) survey for the 2.50 wt. % Pt-mesoTiO2-550 oC.
Regarding XPS it was valuable to establish the electronic state of Pt in the prepared
photocatalysts. One can see in Fig. A1 (a) the peaks for Ti, O, C, and Pt elements.
Regarding the carbon peak, it can be attributed to the residual carbon from the pluronic
precursor.
Furthermore, and concerning the Ti2p peak at 455.85 eV, the O1 s peak at 527.25 eV and
the Pt4f peak at 70.15 eV. These peaks reveal the presence of Ti, O, and Pt elements in Pt–
TiO2. Fig.A.2 shows the high-resolution XPS spectra in the 67 to 85 eV range. These
findings confirm the presence of Pt, as Pt4f7/2 at 70.05 eV and Pt4f5/2 at 73.41 eV). There
is also the calculated splitting of the Pt4f doublet at 3.36 eV. All these three peaks at the
above-mentioned binding energies, unquestionably confirm that platinum is present in Pt-
TiO2 at the metallic state. One should notice that the reported XPS in terms of the Pt and
Ti species and their reduced and oxidation states respectively are consistent with the ones
reported in Figures 7a and 7b of the main text,
(a) XPS survey spectra (b) High-resolution XPS spectrum
Figure B.1 X-ray photoelectron spectra (XPS) of 2.50 wt. % Pt-mesoTiO2-550 oC.
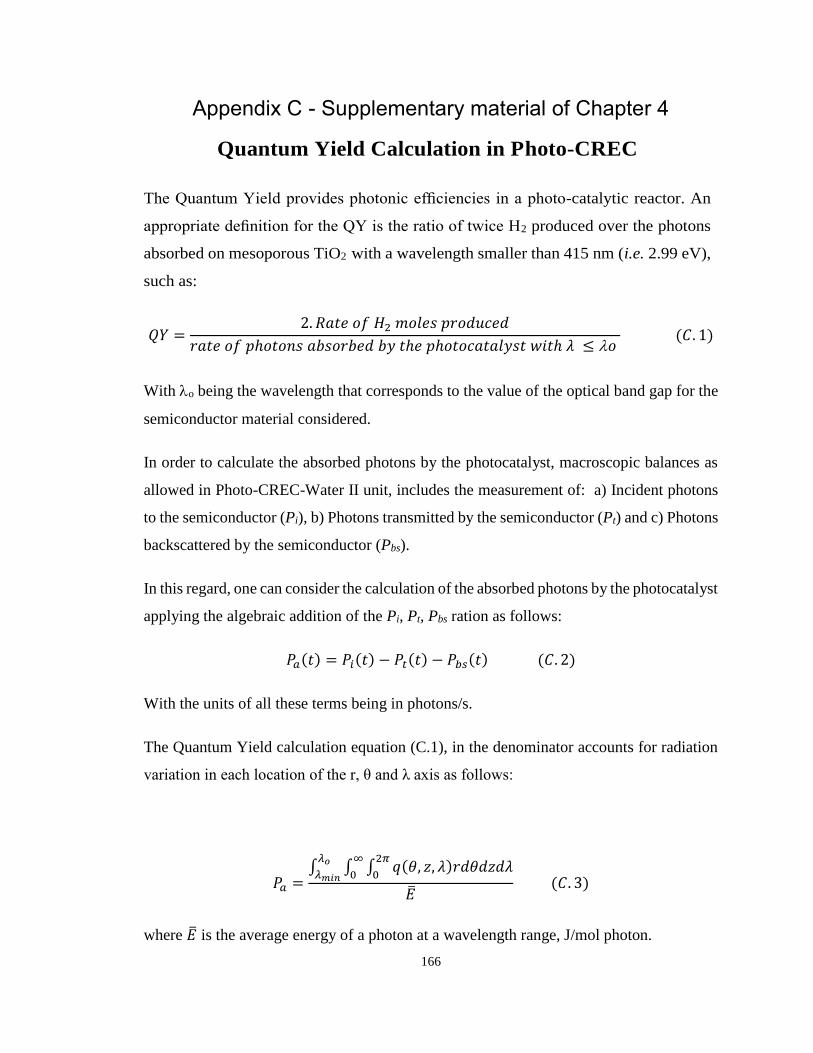
166
Appendix C - Supplementary material of Chapter 4
Quantum Yield Calculation in Photo-CREC
The Quantum Yield provides photonic efficiencies in a photo-catalytic reactor. An
appropriate definition for the QY is the ratio of twice H2 produced over the photons
absorbed on mesoporous TiO2 with a wavelength smaller than 415 nm (i.e. 2.99 eV),
such as:
𝑄𝑌 =2. 𝑅𝑎𝑡𝑒 𝑜𝑓 𝐻2 𝑚𝑜𝑙𝑒𝑠 𝑝𝑟𝑜𝑑𝑢𝑐𝑒𝑑
𝑟𝑎𝑡𝑒 𝑜𝑓 𝑝ℎ𝑜𝑡𝑜𝑛𝑠 𝑎𝑏𝑠𝑜𝑟𝑏𝑒𝑑 𝑏𝑦 𝑡ℎ𝑒 𝑝ℎ𝑜𝑡𝑜𝑐𝑎𝑡𝑎𝑙𝑦𝑠𝑡 𝑤𝑖𝑡ℎ 𝜆 ≤ 𝑜 (𝐶. 1)
With o being the wavelength that corresponds to the value of the optical band gap for the
semiconductor material considered.
In order to calculate the absorbed photons by the photocatalyst, macroscopic balances as
allowed in Photo-CREC-Water II unit, includes the measurement of: a) Incident photons
to the semiconductor (Pi), b) Photons transmitted by the semiconductor (Pt) and c) Photons
backscattered by the semiconductor (Pbs).
In this regard, one can consider the calculation of the absorbed photons by the photocatalyst
applying the algebraic addition of the Pi, Pt, Pbs ration as follows:
𝑃𝑎(𝑡) = 𝑃𝑖(𝑡) − 𝑃𝑡(𝑡) − 𝑃𝑏𝑠(𝑡) (𝐶. 2)
With the units of all these terms being in photons/s.
The Quantum Yield calculation equation (C.1), in the denominator accounts for radiation
variation in each location of the r, θ and λ axis as follows:
𝑃𝑎 =∫ ∫ ∫ 𝑞(𝜃, 𝑧, 𝜆)𝑟𝑑𝜃𝑑𝑧𝑑𝜆
2𝜋
0
∞
0
𝜆𝑜
𝜆𝑚𝑖𝑛
�� (𝐶. 3)
where �� is the average energy of a photon at a wavelength range, J/mol photon.
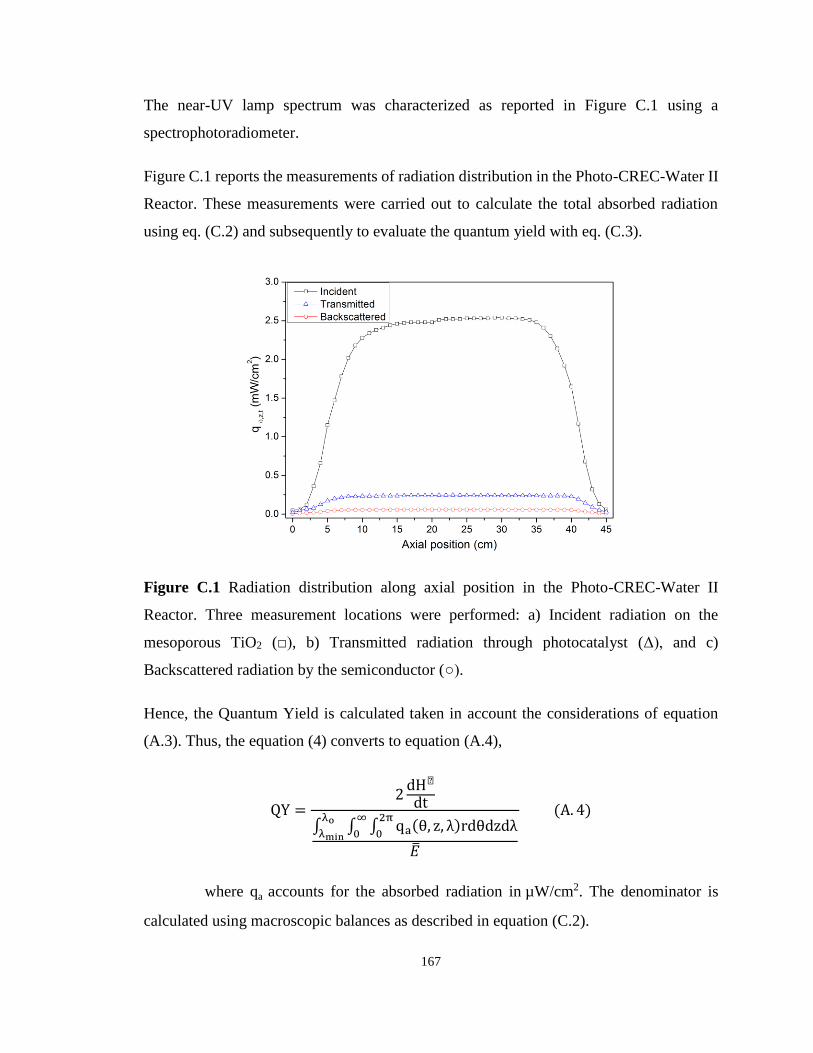
167
The near-UV lamp spectrum was characterized as reported in Figure C.1 using a
spectrophotoradiometer.
Figure C.1 reports the measurements of radiation distribution in the Photo-CREC-Water II
Reactor. These measurements were carried out to calculate the total absorbed radiation
using eq. (C.2) and subsequently to evaluate the quantum yield with eq. (C.3).
Figure C.1 Radiation distribution along axial position in the Photo-CREC-Water II
Reactor. Three measurement locations were performed: a) Incident radiation on the
mesoporous TiO2 (□), b) Transmitted radiation through photocatalyst (Δ), and c)
Backscattered radiation by the semiconductor (○).
Hence, the Quantum Yield is calculated taken in account the considerations of equation
(A.3). Thus, the equation (4) converts to equation (A.4),
QY =2
dH●
dt
∫ ∫ ∫ qa(θ, z, λ)rdθdzdλ2π
0
∞
0
λo
λmin
��
(A. 4)
where qa accounts for the absorbed radiation in µW/cm2. The denominator is
calculated using macroscopic balances as described in equation (C.2).
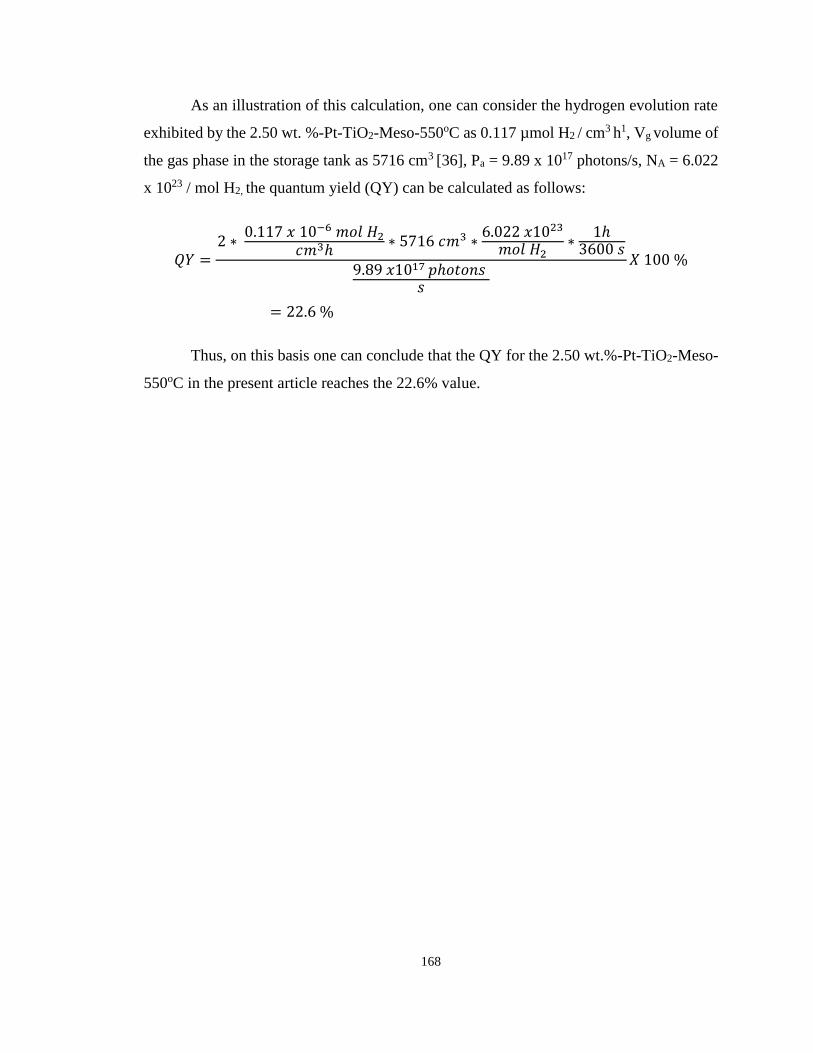
168
As an illustration of this calculation, one can consider the hydrogen evolution rate
exhibited by the 2.50 wt. %-Pt-TiO2-Meso-550oC as 0.117 µmol H2 / cm3 h1, Vg volume of
the gas phase in the storage tank as 5716 cm3 [36], Pa = 9.89 x 10¹⁷ photons/s, NA = 6.022
x 1023 / mol H2, the quantum yield (QY) can be calculated as follows:
𝑄𝑌 =2 ∗
0.117 𝑥 10−6 𝑚𝑜𝑙 𝐻2
𝑐𝑚3ℎ∗ 5716 𝑐𝑚3 ∗
6.022 𝑥1023
𝑚𝑜𝑙 𝐻2∗
1ℎ3600 𝑠
9.89 𝑥1017 𝑝ℎ𝑜𝑡𝑜𝑛𝑠 𝑠
𝑋 100 %
= 22.6 %
Thus, on this basis one can conclude that the QY for the 2.50 wt.%-Pt-TiO2-Meso-
550oC in the present article reaches the 22.6% value.
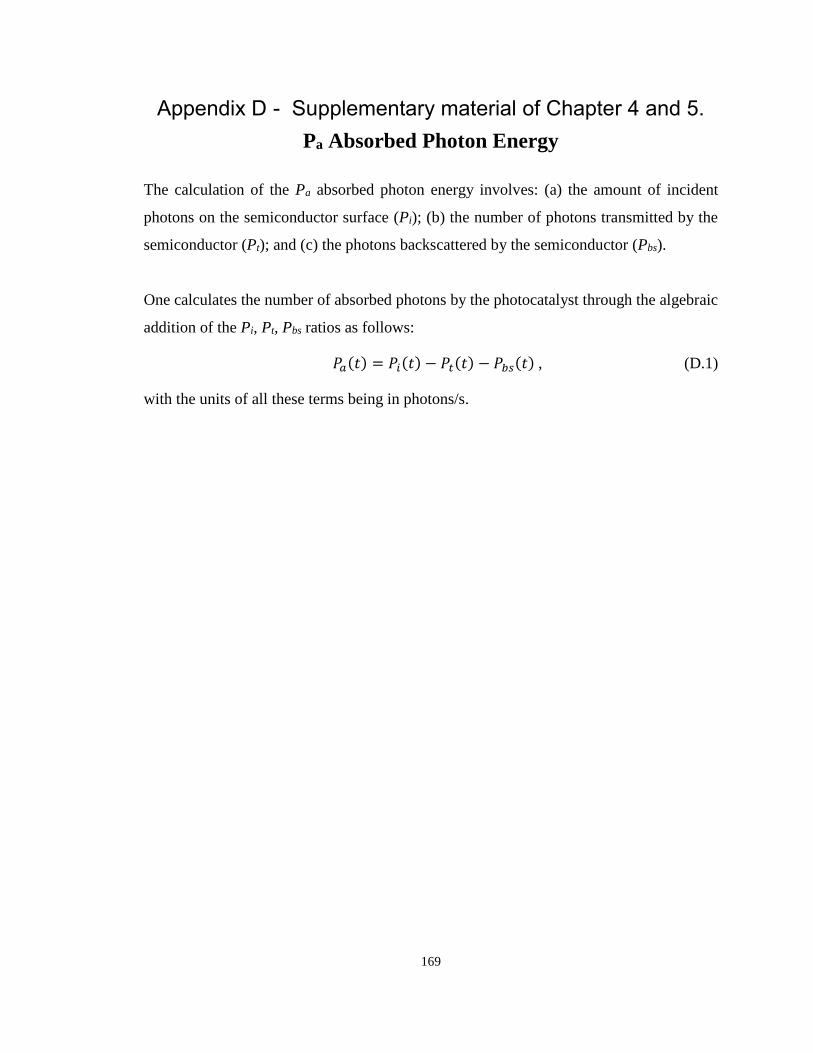
169
Appendix D - Supplementary material of Chapter 4 and 5.
Pa Absorbed Photon Energy
The calculation of the Pa absorbed photon energy involves: (a) the amount of incident
photons on the semiconductor surface (Pi); (b) the number of photons transmitted by the
semiconductor (Pt); and (c) the photons backscattered by the semiconductor (Pbs).
One calculates the number of absorbed photons by the photocatalyst through the algebraic
addition of the Pi, Pt, Pbs ratios as follows:
𝑃𝑎(𝑡) = 𝑃𝑖(𝑡) − 𝑃𝑡(𝑡) − 𝑃𝑏𝑠(𝑡) , (D.1)
with the units of all these terms being in photons/s.
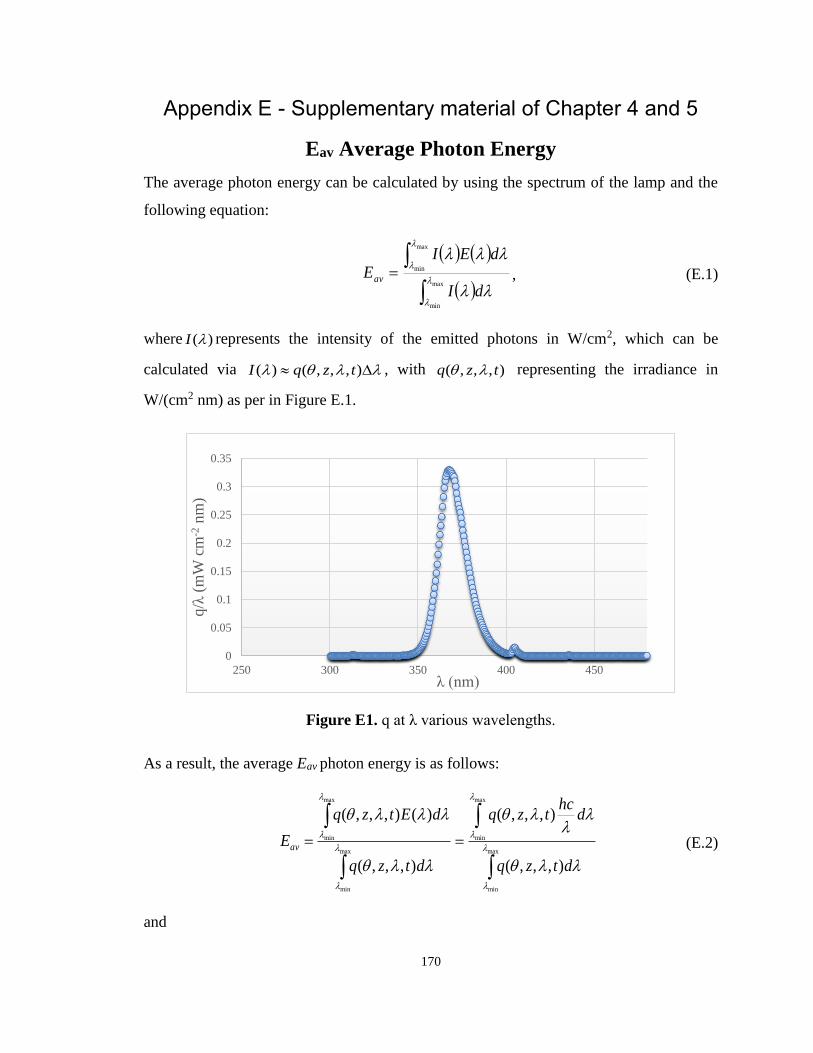
170
Appendix E - Supplementary material of Chapter 4 and 5
Eav Average Photon Energy
The average photon energy can be calculated by using the spectrum of the lamp and the
following equation:
max
min
max
min
dI
dEIEav , (E.1)
where )(I represents the intensity of the emitted photons in W/cm2, which can be
calculated via ),,,()( tzqI , with ),,,( tzq representing the irradiance in
W/(cm2 nm) as per in Figure E.1.
Figure E1. q at λ various wavelengths.
As a result, the average Eav photon energy is as follows:
max
min
max
min
max
min
max
min
),,,(
),,,(
),,,(
)(),,,(
dtzq
dhc
tzq
dtzq
dEtzq
Eav (E.2)
and
0
0.05
0.1
0.15
0.2
0.25
0.3
0.35
250 300 350 400 450
q/λ
(mW
cm
-2nm
)
λ (nm)

171
max
min
max
min
16
2
19
2
( , , , ) nm6.48 1.8 10
cm nm photon5.35 10
photon2407( , , , )
cm
av
q z t W Jhc d
JE
Wq z t d
.
(E.3)
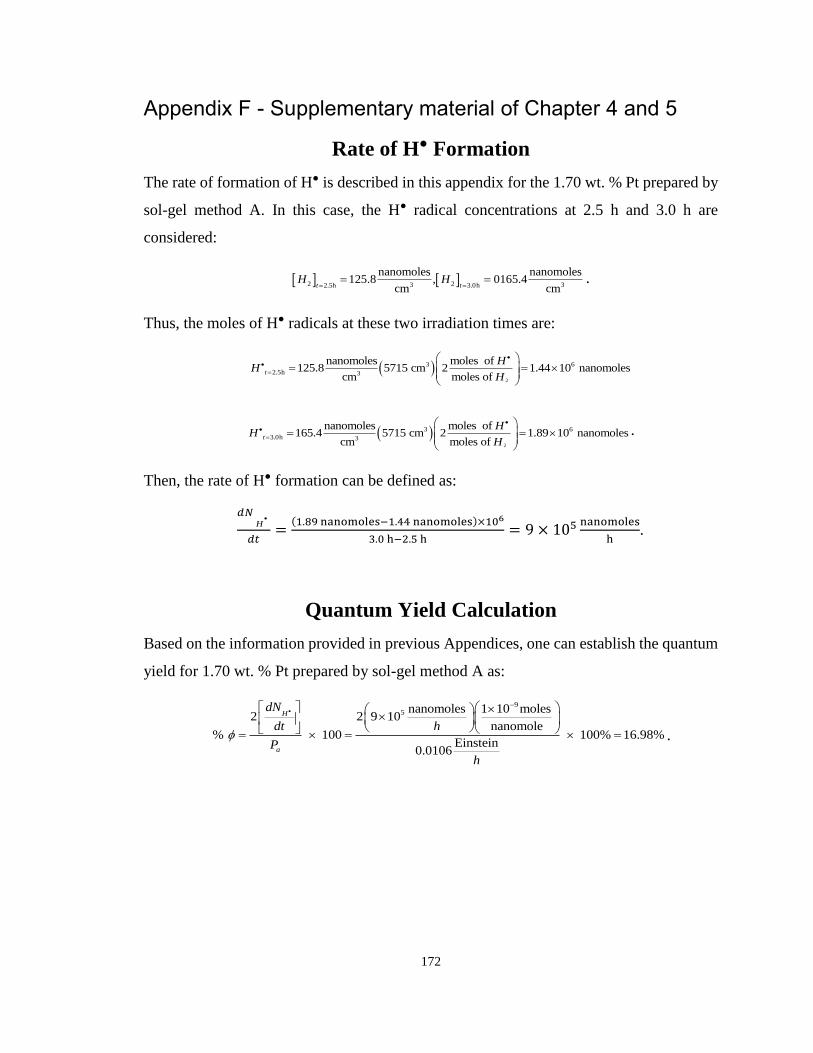
172
Appendix F - Supplementary material of Chapter 4 and 5
Rate of H● Formation
The rate of formation of H● is described in this appendix for the 1.70 wt. % Pt prepared by
sol-gel method A. In this case, the H● radical concentrations at 2.5 h and 3.0 h are
considered:
2 23 32.5h 3.0h
nanomoles nanomoles125.8 , 0165.4
cm cmt tH H
.
Thus, the moles of H● radicals at these two irradiation times are:
2
3 6
2.5h 3
nanomoles moles of 125.8 5715 cm 2 1.44 10 nanomoles
cm moles of t
HH
H
••
2
3 6
3.0h 3
nanomoles moles of 165.4 5715 cm 2 1.89 10 nanomoles
cm moles of t
HH
H
••
.
Then, the rate of H● formation can be defined as:
𝑑𝑁•
H
𝑑𝑡=
(1.89 nanomoles−1.44 nanomoles)×106
3.0 h−2.5 h= 9 × 10⁵ nanomoles
h.
Quantum Yield Calculation
Based on the information provided in previous Appendices, one can establish the quantum
yield for 1.70 wt. % Pt prepared by sol-gel method A as:
95 nanomoles 1 10 moles
2 2 9 10nanomole
% 100 100% 16.98%Einstein
0.0106
H
a
dN
dt h
P
h
•
.
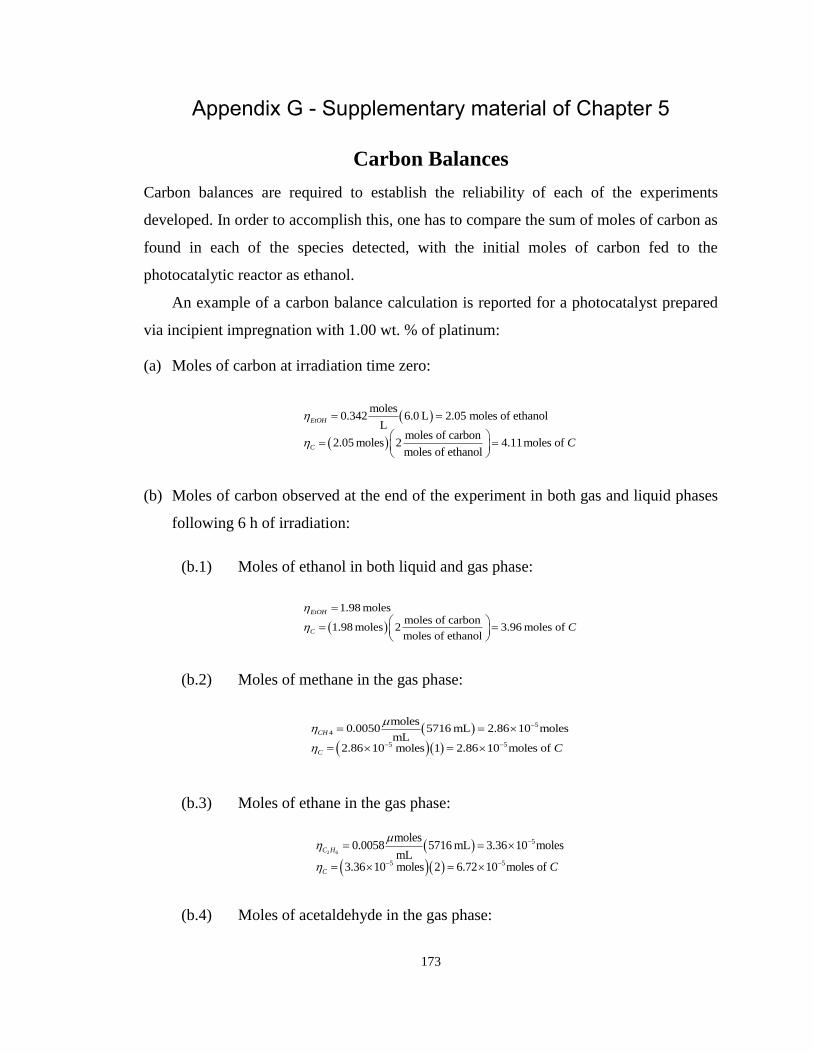
173
Appendix G - Supplementary material of Chapter 5
Carbon Balances
Carbon balances are required to establish the reliability of each of the experiments
developed. In order to accomplish this, one has to compare the sum of moles of carbon as
found in each of the species detected, with the initial moles of carbon fed to the
photocatalytic reactor as ethanol.
An example of a carbon balance calculation is reported for a photocatalyst prepared
via incipient impregnation with 1.00 wt. % of platinum:
(a) Moles of carbon at irradiation time zero:
moles0.342 6.0 L 2.05 moles of ethanol
Lmoles of carbon
2.05 moles 2 4.11moles of moles of ethanol
EtOH
C C
(b) Moles of carbon observed at the end of the experiment in both gas and liquid phases
following 6 h of irradiation:
(b.1) Moles of ethanol in both liquid and gas phase:
1.98 molesmoles of carbon
1.98 moles 2 3.96 moles of moles of ethanol
EtOH
C C
(b.2) Moles of methane in the gas phase:
5
4
5 5
moles0.0050 5716 mL 2.86 10 moles
mL2.86 10 moles 1 2.86 10 moles of
CH
C C
(b.3) Moles of ethane in the gas phase:
2 6
5
5 5
moles0.0058 5716 mL 3.36 10 moles
mL3.36 10 moles 2 6.72 10 moles of
C H
C C
(b.4) Moles of acetaldehyde in the gas phase:
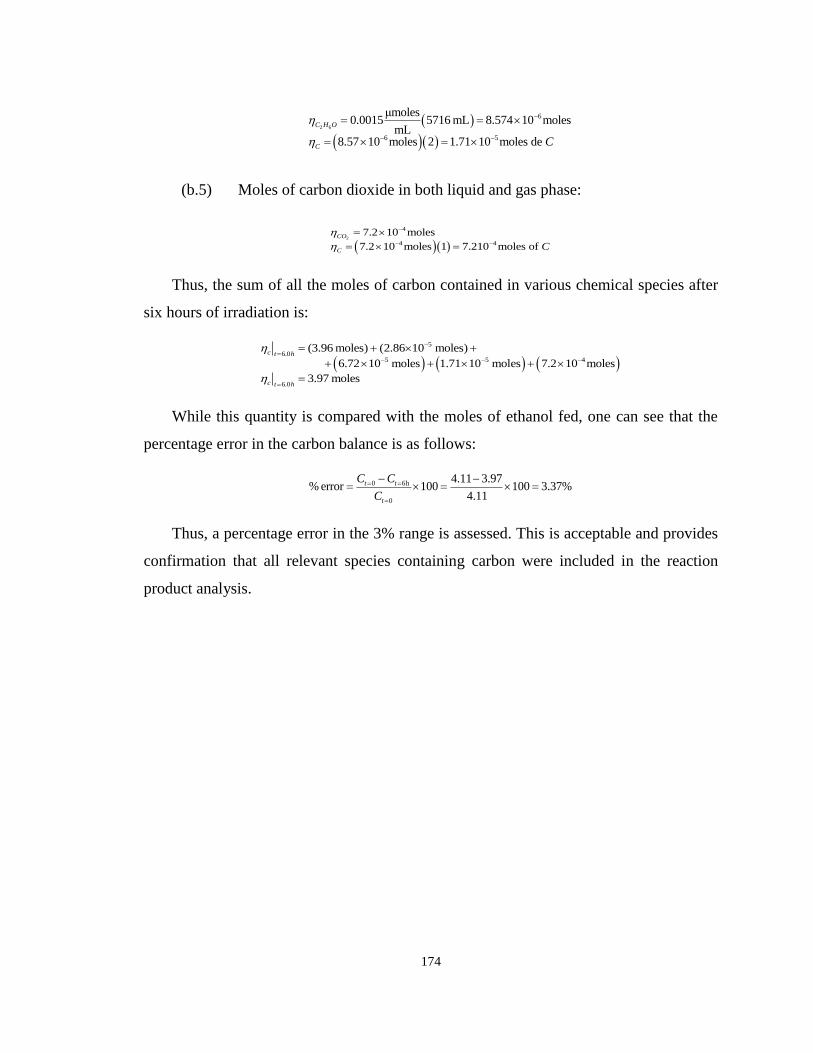
174
2 6
6
6 5
μmoles0.0015 5716 mL 8.574 10 moles
mL8.57 10 moles 2 1.71 10 moles de
C H O
C C
(b.5) Moles of carbon dioxide in both liquid and gas phase:
2
4
4 4
7.2 10 moles
7.2 10 moles 1 7.210 moles of CO
C C
Thus, the sum of all the moles of carbon contained in various chemical species after
six hours of irradiation is:
5
6.05 5 4
6.0
(3.96 moles) (2.86 10 moles)
6.72 10 moles 1.71 10 moles 7.2 10 moles
3.97 moles
c t h
c t h
While this quantity is compared with the moles of ethanol fed, one can see that the
percentage error in the carbon balance is as follows:
0 6h
0
4.11 3.97% error 100 100 3.37%
4.11
t t
t
C C
C
Thus, a percentage error in the 3% range is assessed. This is acceptable and provides
confirmation that all relevant species containing carbon were included in the reaction
product analysis.
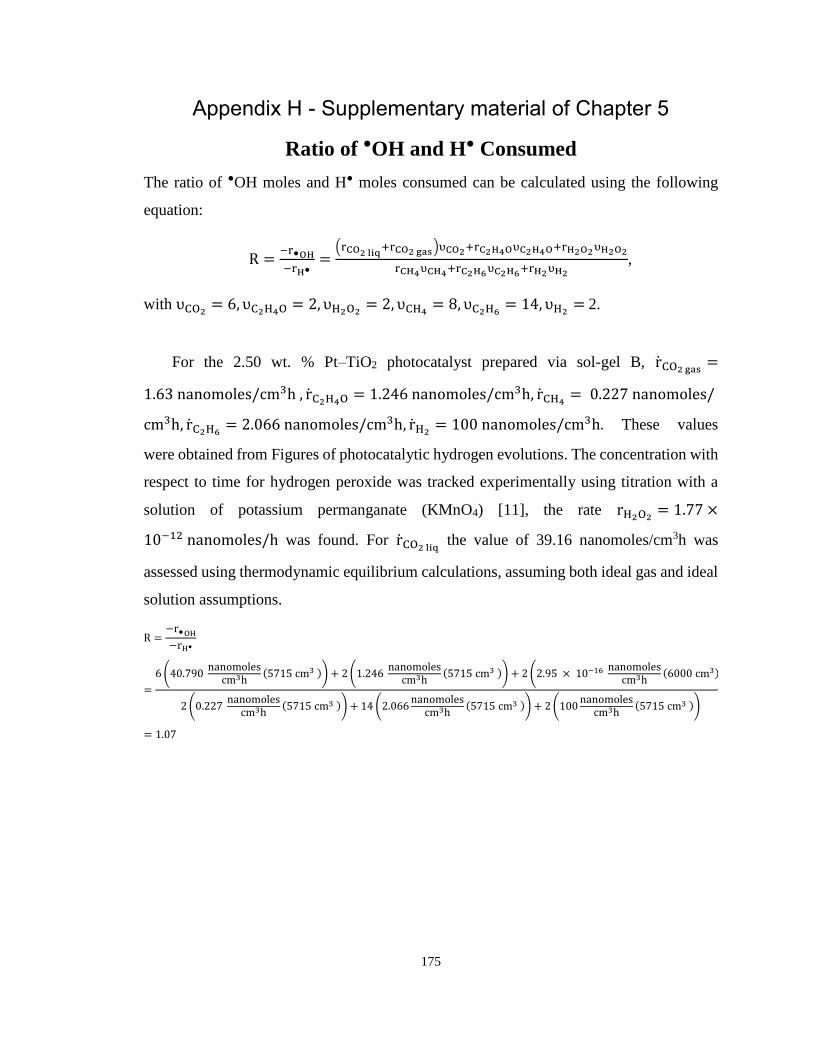
175
Appendix H - Supplementary material of Chapter 5
Ratio of ●OH and H● Consumed
The ratio of ●OH moles and H● moles consumed can be calculated using the following
equation:
R =−r●OH
−rH●=
(rCO2 liq+rCO2 gas)υCO2+rC2H4OυC2H4O+rH2O2υH2O2
rCH4υCH4+rC2H6υC2H6+rH2υH2
,
with υCO2= 6, υC2H4O = 2, υH2O2
= 2, υCH4= 8, υC2H6
= 14, υH2= 2.
For the 2.50 wt. % Pt–TiO2 photocatalyst prepared via sol-gel B, rCO2 gas=
1.63 nanomoles/cm3h , rC2H4O = 1.246 nanomoles/cm3h, rCH4= 0.227 nanomoles/
cm3h, rC2H6= 2.066 nanomoles/cm3h, rH2
= 100 nanomoles/cm3h. These values
were obtained from Figures of photocatalytic hydrogen evolutions. The concentration with
respect to time for hydrogen peroxide was tracked experimentally using titration with a
solution of potassium permanganate (KMnO4) [11], the rate rH2O2= 1.77 ×
10−12 nanomoles/h was found. For rCO2 liq the value of 39.16 nanomoles/cm3h was
assessed using thermodynamic equilibrium calculations, assuming both ideal gas and ideal
solution assumptions.
R =−r●OH
−rH●
=
6 (40.790 nanomoles
cm3h(5715 cm3 )) + 2 (1.246
nanomolescm3h
(5715 cm3 )) + 2 (2.95 × 10⁻¹⁶ nanomoles
cm3h(6000 cm3))
2 (0.227 nanomoles
cm3h(5715 cm3 )) + 14 (2.066
nanomolescm3h
(5715 cm3 )) + 2 (100nanomoles
cm3h(5715 cm3 ))
= 1.07

176
Appendix I -Royal Society of Chemistry License for Chapter 2
177
178

179

180
Curriculum Vitae
Jesús Fabricio Guayaquil Sosa
Post-secondary Doctor of Philosophy in Chemical and Biochemical Engineering
Education and The University of Western Ontario
Degrees: London, Ontario, Canada
2013-2018 Ph.D.
Master of Science in Chemical Engineering
Autonomous Metropolitan University – Campus I
Mexico city, Mexico
2010-2012 M.Sc.
Bachelor of Chemical Engineering
Autonomous Metropolitan University – Campus I
Mexico city, Mexico
2004-2009 B.Eng.
Honours and Full Scholarship for International PhD studies.
Awards: Sponsored by the Federal Government of Mexico through the
National Council of Science and Technology (CONACYT).
2013-2018
Supplement Bursary for International PhD studies.
Sponsored by the Federal Government of Mexico through the
Secretariat of Public Education (SEP).
2013-2018
Dean's Honours List with a GPA of 98/100.
Autonomous Metropolitan University – Campus I, Mexico city,
Mexico. 2012
Dean's Honours List with a GPA of 97/100.
Autonomous Metropolitan University – Campus I, Mexico city,
Mexico. 2009.
Related Work Research Assistant
Experience The University of Western Ontario
2013-2017
Teaching Assistant
The University of Western Ontario
2014-2017
181
Publications:
International peer-reviewed publications
1. J.F. Guayaquil-Sosa, B. Serrano-Rosales, P. J. Valadés-Pelayo, H. de Lasa.
(2017). Photocatalytic Hydrogen Production using Mesoporous TiO2 Doped
with Pt. Applied Catalysis B: Environmental, 211, 337-348. Impact Factor:
9.446.
2. J.F. Guayaquil-Sosa.; Calzada, A.; Serrano, B.; Escobedo, S.; de Lasa, H.
(2017). Hydrogen Production via Water Dissociation Using Pt–TiO2
Photocatalysts: An Oxidation–Reduction Network. Catalysts, 7, 324. Impact
Factor: 3.082.
3. B. Serrano Rosales, Jesús Moreira del Rio, Jesús Fabricio Guayaquil Sosa, H.
de Lasa. (2016) Photodegradation Efficiencies in a Photo-CREC Water-II
Reactor Using Several TiO2 Based Catalysts. International Journal of Chemical
Reactor Engineering, 14, (3), 685-701. Impact Factor: 0.623.
4. P.J. Valadés-Pelayo, F. Guayaquil Sosa, B. Serrano, H. de Lasa. (2015). Eight
Lamp Externally Irradiated Bench-Scale Photocatalytic Reactor: Scale-up and
Performance Prediction. Chemical Engineering Journal, 282, 142-151. Impact
Factor: 6.216.
5. P. J. Valadés-Pelayo, F. Guayaquil Sosa, B. Serrano, H. de Lasa. (2015).
Photocatalytic Reactor Under Different External Irradiance Conditions:
Validation of a Fully Predictive Radiation Absorption Model. Chemical
Engineering Science, 126, 42-54. Impact Factor: 2.895.