Embed Size (px)
Citation preview

Termtanun, Mutsee (2013) Photocatalytic degradation of pesticides using TiO2 nanoparticles. PhD thesis, University of Nottingham.
Access from the University of Nottingham repository: http://eprints.nottingham.ac.uk/13827/2/Thesis_MUTSEE2.pdf
Copyright and reuse:
The Nottingham ePrints service makes this work by researchers of the University of Nottingham available open access under the following conditions.
This article is made available under the University of Nottingham End User licence and may be reused according to the conditions of the licence. For more details see: http://eprints.nottingham.ac.uk/end_user_agreement.pdf
For more information, please contact [email protected]

PHOTOCATALYTIC DEGRADATION OF
PESTICIDES USING TIO2 NANOPARTICLES
BY
MUTSEE TERMTANUN, BEng, MSc
THESIS SUBMITTED TO UNIVERSITY
OF NOTTINGHAM OF DOCTOR OF
PHILOSOPHY
NOVEMBER 2013

i
ABSTRACT
The problem of water pollution has been an environmental concern for many
years. Numerous researchers are looking for an effective method to solve this
issue.
Heterogeneous photocatalysis, using a semiconductor as a catalyst, is a
promising method for the destruction of water polluting pesticides. This
method has been called the Advanced Oxidation Process (AOP) which is one
of the techniques for water treatment. Titanium dioxide (TiO2) is the most
widely accepted photocatalyst because it is non-toxic, stable to
photocorrosion, low cost and can potentially work using sunlight rather than
artificial sources of light. When titanium dioxide is illuminated by UV
radiation, the absorption of photons of energy is then equal to or greater than
its band gap width. This artefact leads to the formation of conduction-band
electrons and valence-band holes on the surface of TiO2, which yield hydroxyl
radicals, the primary oxidising species needed for the photocatalytic
degradation of pollutants.
Supercritical water hydrothermal synthesis (ScWHS) is one of novel
approaches for nanoparticle manufacture which involves the mixing of an
aqueous metal salt stream with a supercritical water stream to produce nano-
sized metal oxide particles. The engineering design for the mixing of these

ii
two fluids is critical and a novel nozzle reactor has been developed at the
University of Nottingham that can produce high quality particles with an
excellent control over particle size and particle size distribution. By
application of this technique, titanium dioxide (TiO2), in nanoparticle form,
was produced and used for the photocatalytic treatment of wastewater.
In this thesis, the photocatalytic degradation of the three pesticides -
isoproturon, simazine and propazine - was measured using 3 different types of
reactors: thin film fixed bed reactor (TFFBR), a stirred reactor, and a fluidised
bed photoreactor. Various conditions were used: for example without UVC
and UVA illumination, with commercial TiO2, with the synthesised TiO2,
without any photocatalyst, low concentration, high concentration, and at
different TiO2 concentrations. The optimum TiO2 concentration for the
treatment of the three chosen pesticides was equal to 5 g litre-1
. The efficiency
in decreasing the pesticides concentration of the synthesised TiO2 (from
ScWHS technique) with all three types of reactors was lower than that of the
commercial titanium dioxide (P-25 TiO2). The fluidised bed reactor appeared
to give the highest performance amongst three reactors.

iii
ACKNOWLEDGEMENT
I would like to express my profound gratitude to everyone who has been
involved in my research. Firstly, I much appreciated the most valuable
support, advice and comments from my supervisors, Prof. Edward Lester and
Prof. Trevor Drage. Also, I feel really thankful to Prof. George Z. Chen, for
his special encouragement that helped me to overcome many obstacles.
Secondly, many thanks are due to my colleagues: Miquel Gimeno Fabra,
Thomas Huddle, Christopher Straykey, Haiping Shen, Sherif Elbasuney and
Selina Tang, who always gave me their kindness and help throughout the
period of my research. Also, I would like to take this opportunity to say thank
you to the many co-workers, staff, technicians in the School of Chemistry and
School of Chemical and Environmental Engineering for their assistance and
friendship.
Finally, my wholeheartly thanks is given to the love from my family and my
friends in university and outside university, who were always there when I
needed their warmness and a shoulder to lean on.

iv
CONTENTS
ABSTRACT i
ACKNOWLEDGEMENTS iii
CONTENTS iv
LIST OF FIGURES xvi
LIST OF TABLES xxxvii
Chapter 1 INTRODUCTION 1
1.1 Introduction 1
1.1.1 Examples of common water pollutants 1
1.1.2 Definition of pesticides (in general view) 2
1.1.3 Group of pesticides (categorised by Ministry of 3
Environment, Ontario, Canada)
1.1.4 Water pollution from pesticides: the pesticides usually 8
found in wastewater
1.1.5 Selected pesticides used in this thesis 10
1.1.6 Legislation of pesticides in respect to human consumption 14
1.2 Research objectives 15
1.3 Thesis structure 16
Chapter 2 BACKGROUND AND REVIEW OF LITERATURE 19
2.1 Introduction to background and review of literature 19

v
2.2 The photolysis or photodissociation process 19
2.3 The principle of photocatalysis 20
2.3.1 Homogeneous photocatalytic reactions 20
2.3.2 Heterogeneous photocatalytic reactions 20
2.4 The photo-Fenton reaction 22
2.5 Advanced Oxidation Processing (AOP) 23
2.6 Photocatalytic materials 24
2.7 Mechanism/reactions of TiO2 photocatalyst 24
2.8 Photocatalytic degradation pathways and intermediates 27
2.9 Degradation pathways of isoproturon, simazine and propazine 30
2.10 The toxicity assessment of isoproturon, simazine and propazine 36
using % inhibition of bacteria
2.11 Factors affecting the photocatalytic kinetics 37
2.11.1 Crystal phase of photocatalyst 38
2.11.2 Organic pollutant concentration 42
2.11.3 TiO2 concentration 46
2.11.4 O2 initial concentration 50
2.11.5 pH 53
2.11.6 Reaction temperature 56
2.11.7 Irradiation wavelength 57
2.11.8 Light intensity 59

vi
2.11.9 Additional oxidants 60
2.11.10 Mode of the catalyst application: the suspended 62
or immobilized system
2.12 Photocatalytic reactor 63
2.12.1. Reactors using suspended solid photocatalysts 63
2.12.1.1 Annular reactors with horizontal flow 63
2.12.1.2 Thin-film slurry photocatalytic reactor (TFS) 64
2.12.2 Fixed catalyst systems 65
2.12.2.1 Thin Film Fixed Bed Reactor (TFFBR) 65
2.12.2.2 Packed Bed Reactor (PBR), fixed bed reactor 66
and fluidised bed reactor
2.12.2.3 Fibre Photoreactor (FP) and Optical Fibre 67
Photoreactor (OFP)
2.12.2.4 Rotating Disc Reactor (RDR) 69
2.12.2.5 Photocatalytic Membrane Reactors (PMRs) 69
2.13 Key elements of reactor design for photocatalytic reaction 71
2.13.1 Mass transfer and contact between chemical compounds 72
and photocatalyst
2.13.2 Photocatalyst activation 72
2.13.3 Oxygen content in two phases? systems 72
2.14 Supercritical water hydrothermal synthesis (ScWHS) 73

vii
2.15 The ScWHS process 74
2.16 Conclusions from review of literature 75
Chapter 3 EXPERIMENTAL 78
3.1 Introduction to experimental 78
3.2 Chemicals and materials 78
3.3 Procedure for supercritical water synthesis of TiO2 79
3.4 Thin Film Fixed Bed Reactor System (TFFBR) 82
3.4.1 Surface coating method 84
3.4.2 Experimental procedures for the TFFBR 86
3.4.3 Operating conditions 87
3.5 Stirred photoreactor 87
3.5.1 Operating conditions 88
3.6 Fluidised bed photoreactor system 89
3.6.1 Experimental procedure for fluidised bed photoreactor 91
3.7 Analytical Techniques 92
3.7.1 High Performance Liquid Chromatography (HPLC) 92
3.7.2 Ultraviolet-visible Spectroscopy (UV-Vis) 94
3.7.3 Scanning Electron Microscopy (SEM) 95
and Energy Dispersive X-ray Spectroscopy (EDAX)
3.7.4 Transmission Electron Microscope (TEM) 96
3.7.5 X-Ray Diffraction (XRD) 97

viii
3.8 Calibration curves for pesticides quantification 99
3.9 Conclusions of the Experimental Chapter 106
Chapter 4 PHOTOCATALYTIC DEGRADATION OF 107
PESTICIDES USING THIN FILM FIXED
BED REACTOR
4.1 Introduction to TFFBR results 107
4.2 Aims and objectives for TFFBR experiments 108
4.3 Characterisation of the TiO2 photocatalysts: Scanning Electron 109
Microscope (SEM) image and Energy Dispersive X-ray
Spectroscopy (EDAX) data
4.4 Control experiments to determine the difference between photolysis 111
and photocatalytic reaction
4.4.1 Determination of the pesticides degradation rate in the absence 112
of UV excitation but the presence of TiO2
4.4.2 Determination of the rate of loss of pesticides in the presence 113
of UV irradiation without a TiO2 catalyst.
4.5 Photocatalytic degradation, effect of TiO2 and the feed flow rate 120
4.6 Influence of initial pesticides concentration 129
4.7 Influence of photocatalyst type (the commercial VS the synthesised) 132
4.8 Conclusions of TFFBR experiments 140

ix
Chapter 5 PHOTOCATALYTIC DEGRADATION OF 142
PESTICIDES USING STIRRED PHOTOREACTOR
5.1 Introduction to a stirred photoreactor results 142
5.2 Aims and objectives 143
5.3 Control experiments to determination the rate of pesticide loss 144
in the absence of UV but the presence of TiO2
5.4 Determination of the effect of P-25 TiO2 concentration on 147
photocatalytic degradation
5.5 Influence of catalyst type on the photocatalytic degradation 155
(P-25 TiO2 VS synthesised TiO2)
5.6 X-ray Diffraction (XRD) results at different sintering temperature 163
5.7 Conclusions of stirred photoreactor experiments 168
Chapter 6 PHOTOCATALYTIC DEGRADATION OF 169
PESTICIDES USING FLUIDISED BED
PHOTOREACTOR
6.1 Introduction to fluidised bed photoreactor results 169
6.2 Aims and objectives 170
6.3 Control experiments, determination of the rate of loss of pesticides 172
degradation rate in the absence of UV but in the presence of TiO2

x
6.4 UVA and UVC photolysis 173
6.5 Photocatalytic degradation of pesticides 175
6.6 Effect of P-25 TiO2 concentration on the photocatalytic degradation 184
6.7 Influence of catalyst type (P-25 TiO2 VS synthesised TiO2) 192
6.8 Transmission Electron Microscopy (TEM) results 197
6.9 X-Ray Diffraction (XRD) results 200
6.10 Conclusion of fluidised bed photoreactor experiments 202
Chapter 7 CONCLUSION AND RECOMMENDATIONS 205
7.1 Overview of results and experimental work 205
7.2 Conclusions 206
7.3 Recommendations for future work 208
APPENDICES 210
APPENDIX I: Student T-test for TFFBR results 211
I.1 UVA/UVC photolysis of isoproturon 211
I.2 UVA/UVC photolysis of simazine 211
I. 3 UVA/UVC photolysis of propazine 211
I.4 UVC photolysis of isoproturon VS simazine 212
I.5 UVC photolysis of simazine VS propazine 212
I.6 UVC photolysis of isoproturon VS propazine 212

xi
I.7 UVA photolysis of isoproturon VS simazine 212
I.8 UVA photolysis of simazine VS propazine 213
I.9 UVA photolysis of isoproturon VS propazine 213
I.10 UVA photocatalytic of isoproturon at high flow rate (100 ml min-1
) 213
VS low flow rate (20 ml min-1
)
I.11 UVA photocatalytic of simazine at high flow rate (100 ml min-1
) 213
VS low flow rate (20 ml min-1
)
I.12 UVA photocatalytic of propazine at high flow rate (100 ml min-1
) 214
VS low flow rate (20 ml min-1
)
I.13 UVC photocatalytic of isoproturon at high flow rate (100 ml min-1
) 214
VS low flow rate (20 ml min-1
)
I.14 UVC photocatalytic of simazine at high flow rate (100 ml min-1
) 214
VS low flow rate (20 ml min-1
)
I.15 UVC photocatalytic of propazine at high flow rate (100 ml min-1
) 214
VS low flow rate (20 ml min-1
)
I.16 UVC photocatalytic of isoproturon at low initial concentration 215
(2.5 ppm) VS high initial concentration (20 ppm)
I.17 UVC photocatalytic of propazine at low initial concentration 215
(2.5 ppm) VS high initial concentration (20 ppm)

xii
APPENDIX II: Student T-test for stirred photoreactor results 216
II.1 Adsorption concentration of isoproturon VS simazine in the 216
absence of UV
II.2 Adsorption concentration of simazine VS propazine in the 216
absence of UV
II.3 Adsorption concentration of isoproturon VS propazine in the 217
absence of UV
APPENDIX III: Student T-test for fluidised bed photoreactor results 218
III.1 Adsorption concentration of isoproturon VS simazine in the 218
absence of UV
III.2 Adsorption concentration of simazine VS propazine in the 218
absence of UV
III.3 Adsorption concentration of isoproturon VS propazine in the 219
absence of UV
III.4 UVA photolysis of isoproturon VS simazine 219
III.5 UVA photolysis of simazine VS propazine 219
III.6 UVA photolysis of isoproturon VS propazine 219
III.7 UVC photolysis of isoproturon VS simazine 220
III.8 UVC photolysis of simazine VS propazine 220

xiii
III.9 UVC photolysis of isoproturon VS propazine 220
III.10 UVA photolysis of isoproturon using fluidised bed VS stirred 220
photoreactor
III.11 UVA photolysis of isoproturon using fluidised bed VS TFFBR 221
III.12 UVA photolysis of simazine using fluidised bed VS stirred 221
photoreactor
III.13 UVA photolysis of simazine using fluidised bed VS TFFBR 221
III.14 UVA photolysis of propazine using fluidised bed VS stirred 221
photoreactor
III.15 UVA photolysis of propazine using fluidised bed VS TFFBR 222
III.16 UVC photolysis of isoproturon using fluidised bed VS stirred 222
photoreactor
III.17 UVC photolysis of isoproturon using fluidised bed VS TFFBR 222
III.18 UVC photolysis of simazine using fluidised bed VS stirred 222
photoreactor
III.19 UVC photolysis of simazine using fluidised bed VS TFFBR 223
III.20 UVC photolysis of propazine using fluidised bed VS stirred 223
photoreactor
III.21 UVC photolysis of propazine using fluidised bed VS TFFBR 223

xiv
III.22 UVA photocatalytic of isoproturon using fluidised bed VS stirred 223
photoreactor
III.23 UVA photocatalytic of simazine using fluidised bed VS stirred 224
photoreactor
III. 24 UVA photocatalytic of propazine using fluidised bed VS stirred 224
photoreactor
BIBIOLOGRAPHY 225

xv
LIST OF FIGURES
Figure 1.1 Triazine isomers: (1) 1,2,3 triazine, (2) 1,2,4 triazine, 4
(3) 1,3,5 triazine
Figure 1.2 Chemical structure of carbamic acid group 4
Figure 1.3 Structure of DDT, an example of pesticides in OCs group 4
Figure 1.4 Chemical structure of phenoxy acid 5
Figure 1.5 Paraquat structure 6
Figure 1.6 Phenylurea structure 6
Figure 1.7 Two isomeric forms of thiocarbamate 6
Figure 1.8 Statistical data of used pesticides in 2006 in UK 9
Figure 1.9 Use of isoproturon (kg/hr) with crops in UK 11
Figure 1.10 Rate of use (kg/ha) for simazine with crops in UK 13
Figure 1.11 Structure of three pesticides 14
Figure 2.1 Mechanism of photocatalytic reaction in TiO2 26
Figure 2.2 Degradation pathway of isoproturon in the water 30
Figure 2.3 Degradation pathway of simazine, cyanazine, atrazine and 31
propazine in water

xvi
Figure 2.4 Scheme of proposed pathway for simazine photocatalytic 33
degradation
Figure 2.5 Proposed degradation pathway of simazine in UV/TiO2 34
system
Figure 2.6 Tentative photodegradation pathway of propazine 35
Figure 2.7 Results of toxicity in the triazine samples at condition 36
simazine pH = 5.5, TiO2 concentration = 0.25g/l,
atrazine pH = 6, TiO2 concentration = 1.8 g/l,
immersion well photoreactor
Figure 2.8 Crystalline structures of titanium dioxide 38
(a) anatase, (b) rutile
Figure 2.9 Photocatalytic oxidation of acetaldehyde with 41
Degussa P-25 TiO2, nanostructured anatase and rutile
Figure 2.10 Possible mechanisms for enhancement of 42
photocatalytic activity caused by contact between
(a) anatase TiO2 (b) rutile TiO2 and (C)
coexistence of anatase and rutile TiO2
Figure 2.11 Initial rate of reaction calculated by L-H kinetics 45
as a function of the initial concentration of isoproturon,

xvii
simazine, and propazine
Figure 2.12 Influence of catalyst concentration on the photocatalytic 47
degradation rate of isoproturon at UV=238 nm,
0.5 mM isoproturon, 250 ml, and P-25
(0.5, 1, 2 and 3 g litre-1
)
Figure 2.13 Effect of catalyst loading at pH = 7, radiation 48
intensity = 185.2 W m-2
, CTiO2 = TiO2 concentration (kg m-3
),
τ = optical thickness, dimensionless, NRe = Reynolds number,
Q = volumetric flowrate (m3s
-1)
Figure 2.14 Effect of TiO2 concentration on the photodegradation 49
efficiency of glyphosate, t = 1.0 hr
Figure 2.15 Effect of the amount of TiO2 on the photodegradation 49
efficiency of methamidophos, annular photoreactor,
375 W medium pressure mercury lamp,
reaction temperature =30 ºC, illumination time = 30min
Figure 2.16 Effect of added molecular oxygen on the degradation 52
rate of vanillin in the presence of Degussa P-25, UV-100
and ZnO. Experimental conditions: substrate concentration
(0.5 mM), V = 250 mL, pH = 2 for TiO2 samples and

xviii
pH = 6 for ZnO, Degussa P-25, UV-100 and
ZnO = 1g litre-1
, immersion well photoreactor,
125 W medium pressure Hg lamp, irradiation time = 45 min
Figure 2.17 Effect of initial pH value on the photodegradation 55
efficiency of trichlorfon using TiO2, annular photoreactor,
375 W medium pressure mercury lamp, illumination
time = 30 min
Figure 2.18 Influence of pH on the degradation rate of vanillin 55
using Degussa P-25, UV-100 and ZnO = 1glitre-1
experimental conditions: substrate concentration (0.5 mM),
V = 250 mL, immersion well photo-reactor, 125 W medium
pressure Hg lamp, pH range (2, 4, 6, 8, 10 and 12), continuous
O2 purging and stirring, irradiation time = 45 min
Figure 2.19 Effect of anions on the photocatalytic degradation rate 56
constants of Butachlor
Figure 2.20 Comparison of the photocatalytic degradation of 57
chlorfenapyr at 300 nm of UV at different temperature.
The initial concentrations of chlorfenapyr and
TiO2 = 800 mg litre-1
, pH = 6

xix
Figure 2.21 Geometry of annular photoreactor 63
Figure 2.22 Geometry of TFS (Thin-film slurry photoreactor) 64
Figure 2.23 Geometry of water fountain photoreactor 65
Figure 2.24 Flowchart of TFFBR (Thin Flim Fixed Bed Reactor) 66
Figure 2.25 Illustration of FP (Fibre Photoreactor) 68
Figure 2.26 Layout for OFP (Optical Fibre Photoreactor) 68
Figure 2.27 Horizontal RDR (Rotating Disc Reactor) 69
Figure 2.28 Schematic of submerged membrane photocatalytic reactor 70
Figure 2.29 Influence of the different physical parameters which 76
govern the reaction rate r (r is generally comprised
between 1 and 0.1 mmol hr-1
): (A) mass of catalyst;
(B) wavelength; (C) initial concentration of reactant;
(D) temperature; (E) radiant flux
Figure 3.1 Supercritical hydrothermal synthesis rig 80
Figure 3.2 Schematic of TFFBR photocatalytic reactor 82
Figure 3.3 Photograph of the TFFBR photocatalytic reactor 83
Figure 3.4 Photograph of the reactive area and the water source 84
Figure 3.5 (a) Photograph of a P-25 TiO2 coated surface on the 84
stainless steel plate (b) SEM image of P-25 TiO2

xx
coated surface at a magnification 200 μm
Figure 3.6 SEM image of synthesised TiO2 coated surface 85
Figure 3.7 The set-up of stirring batch reactor 88
Figure 3.8 Schematic diagram of the fluidised bed photoreactor 90
Figure 3.9 Photograph of the fluidised bed photoreactor 90
Figure 3.10 Schematic diagram of HPLC 93
Figure 3.11 Double beam UV-Vis spectophotometer 95
Figure 3.12 Geometry of SEM 96
Figure 3.13 Geometry of TEM 97
Figure 3.14 Schematic diagram of XRD 99
Figure 3.15 Overall chromatograph peak at concentration 5 ppm 101
of isoproturon, simazine, and propazine
Figure 3.16 Structure of triazines 102
Figure 3.17 HPLC chromatogram of a mixture of isoproturon, 103
simazine and propazine (1 mg litre-1
each)
Figure 3.18 Isoproturon calibration curve 105
Figure 3.19 Simazine calibration curve 105
Figure 3.20 Propazine calibration curve 106
Figure 4.1 EDAX data of surface structure of 40 % wt of P-25 TiO2 110
on TFFBR
Figure 4.2 EDAX data of surface structure of 14 % wt of synthesised 110

xxi
TiO2 on TFFBR
Figure 4.3 Remaining concentration (as a function of initial 113
concentration), versus time plot for isoproturon, simazine
and propazine over P-25 TiO2 plate in the absence of UV
irradiation (initial pesticide concentration = 20 ppm,
flow rate = 20 ml min-1
)
Figure 4.4 Remaining percentage after loss of isoproturon versus time: 115
effect of light wavelength on the photolysis reaction
(without catalyst), Initial concentration 20 ppm,
flow rate = 20 ml min -1
Figure 4.5 Remaining percentage after loss of simazine versus time: 116
effect of light wavelength the photolysis reaction of
simazine (without catalyst). Initial concentration 20 ppm,
flow rate = 20 ml min -1
Figure 4.6 Remaining percentage after loss of propazine versus time: 116
effect of light wavelength on the photolysis reaction
of propazine (without catalyst). Initial concentration 20 ppm,
flow rate = 20 ml min-1
Figure 4.7 UVC photolysis on isoproturon, simazine, and propazine 118

xxii
without any photocatalyst, initial concentration = 20 ppm,
flow rate = 20 ml min-1
Figure 4.8 Simazine degradation by direct photolysis and photocatalysis. 118
8 UV lamps, initial simazine concentration was 2.5 x 10⁻⁵
M,
TiO2 dosage = 0.1 g litre-1, and initial pH = 5.6.
Figure 4.9 General degradation pathways of simazine (A) 119
where (B) is deisopropyl atrazine and (C) is diamino
chlorotriazine produced by photolytic loss of alkyl groups
Figure 4.10 Remaining percentage after loss of isoproturon versus 121
time (initial concentration =20 ppm) using P-25 TiO2
under UVA with high and low flow rate
Figure 4.11 Remaining percentage after loss of simazine versus time 122
(initial concentration = 20 ppm) using P-25 TiO2 under
UVA with high and low flow rate
Figure 4.12 Remaining percentage after loss of propazine versus time 122
(initial concentration = 20 ppm) using P-25 TiO2 under
UVA with high and low flow rate
Figure 4.13 Remaining percentage after loss of isoproturon versus time 123
(initial concentration = 20 ppm) using P-25 TiO2 under

xxiii
UVC with high and low flow rate (100 ml min-1
and
20 ml min-1
, respectively)
Figure 4.14 Remaining percentage after loss of simazine versus time 124
(initial concentration = 20 ppm) using P-25 TiO2 under
UVC with high and low flow rate (100 ml min-1
and
20 ml min-1
, respectively)
Figure 4.15 Remaining percentage after loss of propazine versus time 124
(initial concentration = 20 ppm) using P-25 TiO2 under
UVC with high and low flow rate (100 ml min-1
and
20 ml min-1
, respectively)
Figure 4.16 Different flow structure (a) FFLF is falling film 127
laminar flow, (b)PF is plug flow, and (c) SF is slit flow
Figure 4.17 The difference between laminar flow and turbulent flow 127
Figure 4.18 Comparison of photocatalytic degradation of three 128
pesticides at high flow rate (initial concentration = 20 ppm)
using P-25 TiO2 under UVC
Figure 4.19 Comparison of photocatalytic degradation of three 129
pesticides at low flowrate (initial concentration = 20 ppm)
using P-25 TiO2 under UVC

xxiv
Figure 4.20 Remaining percentage after loss of isoproturon versus time 131
(initial concentration =2.5 ppm) using P-25 TiO2 under UVC
with low flow rate
Figure 4.21 Remaining percentage after loss of propazine versus time 131
(initial nconcentration = 2.5 ppm) using P-25 TiO2 under
UVC with low flow rate
Figure 4.22 Remaining percentage (per gram of photocatalyst) after 133
loss of isoproturon versus time (initial concentration =
20 ppm) under UVA using P-25 TiO2 comparing to
synthesised TiO2
Figure 4.23 Remaining percentage (per gram of photocatalyst) after 134
loss of isoproturon versus time (initial concentration =
2.5 ppm) under UVA using P-25 TiO2 comparing to
synthesised TiO2
Figure 4.24 Remaining percentage (per gram of photocatalyst) after 134
loss of isoproturon versus time (initial concentration =
20 ppm) under UVC using P-25 TiO2 comparing to
synthesised TiO2
Figure 4.25 Remaining percentage (per gram of photocatalyst) after 135

xxv
loss of isoproturon versus time (initial concentration =
2.5 ppm) under UVC using P-25 TiO2 comparing to
synthesised TiO2
Figure 4.26 Remaining percentage (per gram of photocatalyst) after 136
loss of simazine versus time (initial concentration =
20 ppm) under UVC using P-25 TiO2 comparing to
synthesised TiO2
Figure 4.27 Remaining percentage (per gram of photocatalyst) after 136
loss of simazine versus time (initial concentration =
2.5 ppm) under UVC using P-25 TiO2 comparing to
synthesised TiO2
Figure 4.28 Remaining percentage (per gram of photocatalyst) after 138
loss of propazine versus time (initial concentration =
20 ppm) under UVA using P-25 TiO2 comparing to
synthesised TiO2
Figure 4.29 Remaining percentage (per gram of photocatalyst) after 138
loss of propazine versus time (initial concentration =
2.5 ppm) under UVA using P-25 TiO2 comparing to
synthesised TiO2

xxvi
Figure 4.30 Remaining percentage (per gram of photocatlyst) after 139
loss of propazine versus time (initial concentration =
20 ppm) under UVC using P-25 TiO2 comparing to
synthesised TiO2
Figure 4.31 Remaining percentage (per gram of photocatalyst) after 139
loss of propazine versus time (initial concentration =
2.5 ppm) under UVC using P-25 TiO2 comparing to
synthesised TiO2
Figure 4.32 Structure of dodecenyl succinic anhydride (DDSA) 140
Figure 5.1 Degradation rate of pesticides in the absence of UV but 146
the presence of P-25 TiO2 = 5 g litre-1
Figure 5.2 Adsorbed concentration of isoproturon in the absence of UV 147
onto TiO2 at different isoproturon concentration. TiO2
concentration = 0.4 g litre-1
and isoproturon concentration
= 1-8 ppm
Figure 5.3 Effect of P-25 TiO2 loadings on the degradation of 148
isoproturon versus time under UVA irradiation
Figure 5.4 Effect of P-25 TiO2 loadings on the degradation of 149
simazine versus time under UVA irradiation

xxvii
Figure 5.5 Effect of P-25 TiO2 loadings on the degradation of 149
propazine versus time under UVA irradiation
Figure 5.6 ln [CR]/[C0] (Remaining concentration divided by initial 151
concentration of isoproturon when using 10 g litre-1
of P-25 TiO2) versus time
Figure 5.7 Optimum P-25 TiO2 loading of the stirred reactor 152
under UVA, k value was calculated from Figure 5.1,
Figure 5.2, and Figure 5.3
Figure 5.8 The six principal directions of photons scattering 154
in the six-flux model (SFM) and the scattering probabilities
Figure 5.9 Degradation of propazine (initial concentration = 2.5ppm) 156
using P-25 TiO2 and synthesised TiO2 under UVA
Figure 5.10 Photograph of synthesised TiO2 after sintering at 900 °C 158
for an hour
Figure 5.11 Degradation of isoproturon (initial concentration = 2.5ppm) 159
using the synthesised TiO2 under UVA,
[TiO2] = 5 g litre-1
after drying at 80 °C
and sintering at 900 °C
Figure 5.12 Degradation of simazine (initial concentration = 2.5ppm) 159

xxviii
using the synthesised TiO2 under UVA,
[TiO2] = 5 g litre-1
after drying at 80 °C
and sintering at 900 °C
Figure 5.13 Degradation of propazine (initial concentration = 2.5ppm) 160
using the synthesised TiO2 under UVA,
[TiO2] = 5 g litre-1
after drying at 80 °C
and sintering at 900 °C
Figure 5.14 Degradation of isoproturon (initial concentration = 2.5ppm) 161
using the synthesised TiO2 under UVC, [TiO2] = 5 g litre-1
after drying at 80 °C and sintering at 900 °C
Figure 5.15 Degradation of simazine (initial concentration = 2.5ppm) 161
using the synthesised TiO2 under UVC, [TiO2] = 5 g litre-1
after drying at 80 °C and sintering at 900 °C
Figure 5.16 Degradation of propazine (initial concentration = 2.5ppm) 162
using the synthesised TiO2 under UVC, [TiO2] = 5 g litre-1
after drying at 80 °C and sintering at 900 °C
Figure 5.17 Degradation of propazine using the synthesised TiO2 163
under UVA [TiO2] = 5 g litre-1
after drying at 80 °C
and sintering at 900 °C compared with the non-sintering

xxix
synthesised TiO2
Figure 5.18 Results of XRD analysis of synthesised TiO2 at different 165
temperatures
Figure 5.19 XRD of pure titanium when oxidation in the temperature 167
range 400 – 800 °C
Figure 6.1 Decrease in the concentration of pesticides in the absence of 173
UV irradiation but in the presence of P-25 TiO2 (5 g litre-1
)
Figure 6.2 UVA photolysis of isoproturon, simazine, and propazine 174
without any catalyst
Figure 6.3 UVC photolysis of isoproturon, simazine, and propazine 175
without any catalyst
Figure 6.4 Effect of light wavelength on the photocatalytic 179
oxidation rate of isoproturon, [TiO2] = 5 g litre-1
,
initial concentration of isoproturon = 2.5 ppm,
P-25 TiO2 sintered at 900 °C for an hour
Figure 6.5 Effect of light wavelength on the photocatalytic 179
oxidation rate of simazine, [TiO2] = 5 g litre-1
,
initial concentration of simazine = 2.5 ppm,

xxx
P-25 TiO2 sintered at 900 °C for an hour
Figure 6.6 Effect of light wavelength on the photocatalytic 180
oxidation rate of propazine, UVA [TiO2] = 5 g litre-1
,
UVC [TiO2]= 5 g litre-1
, initial concentration of simazine
= 2.5 ppm, P-25 TiO2 sintered at 900 °C for an hour
Figure 6.7 Effect of air flow rate on liquid phase phenol 183
degradation fraction
Figure 6.8 Photocatalytic degradation of isoproturon using 185
fluidised bed reactor under UVA with P-25
TiO2 concentration 2.5, 5 and 7.5 g litre-1
Figure 6.9 Photocatalytic degradation of simazine using 185
fluidised bed reactor under UVA with P-25 TiO2
concentration 5 and 7.5 g litre-1
Figure 6.10 Photocatalytic degradation of isoproturon, simazine 188
and propazine using fluidised bed reactor under UVA
with P-25 TiO2 concentration 5 g litre-1
Figure 6.11 Photocatalytic degradation of isoproturon using 189
fluidiszed bed reactor under UVC with P-25 TiO2
concentration 2.5, 5 and 7.5 g litre-1

xxxi
Figure 6.12 Photocatalytic degradation of isoproturon, 190
simazine and propazine using fluidised bed reactor
under UVC with P-25 TiO2 concentration 5 g litre-1
Figure 6.13 The linear relationship between ln [CR]/[C0] 191
(remaining concentration divided by the initial
concentration of isoproturon using P-25 7.5 g litre-1
under UVA) and time
Figure 6.14 Optimum P-25 TiO2 loading of the fluidised bed 192
photoreactor under UVA (a), and UVC (b) irradiation
for photocatalytic degradation of isoproturon, k value
was calculated from Figure 6.8, and Figure 6.12 of
isoproturon degradation
Figure 6.15 Photocatalytic degradation of isoproturon under UVA 193
using synthesised TiO2 5 g litre-1
compared with
using P-25 TiO2 5 g litre-1
Figure 6.16 Photocatalytic degradation of isoproturon under UVC 194
using synthesised TiO2 5g litre-1
compared with
using P-25 TiO2 5 g litre-1
Figure 6.17 Photocatalytic degradation of simazine under UVA 195

xxxii
using synthesised TiO2 5 g litre-1
compared with
using P-25 TiO2 5 g litre-1
Figure 6.18 Photocatalytic degradation of simazine under UVC 195
using synthesised TiO2 5 g litre-1
compared with
using P-25 TiO2 5 g litre-1
Figure 6.19 Photocatalytic degradation of propazine under UVA 196
using synthesised TiO2 5 g litre-1
compared with
using P-25 TiO2 5 g litre-1
Figure 6.20 Photocatalytic degradation of propazine under UVC 197
using synthesised TiO2 5 g litre-1
compared with
using P-25 TiO2 5 g litre-1
Figure 6.21 TEM photograph of P-25 TiO2 in aqueous suspension 198
Figure 6.22 TEM photograph of synthesised TiO2 in aqueous 199
suspension (a) fine particles with the size of 10-15 nm
(b) start to agglomerate due to high surface area
Figure 6.23 UV-Vis spectroscopy of the P-25 TiO2 comparing 202
with the synthesised TiO2

xxxiii
LIST OF TABLES
Table 1.1 Three examples of pesticides in OPs group 5
with molecular formula and chemical structures:
Parathion methyl, fenitrothion, parathion
Table 1.2 Common pesticides in each group categorized 7
by chemical structure
Table 1.3 The 12 pesticides most often found in UK drinking water 9
Table 1.4 The total usage of pesticides in the UK 10
Table 1.5 Structure refinement and crystal data of isoproturon 12
Table 1.6 Maximum acceptable values (MAVs) for the pesticide 15
residues in the drinking water in New Zealand
Table 2.1 List of herbicides degradation by the TiO2 29
photocatalysis, the main reaction pathways,
the transformation products (TPs)
Table 2.2 Main intermediates produced in the photocatalytic 32
reaction of simazine
Table 2.3 Photocatalytic degradation of bromacil in an aqueous 40
suspensions under the different types of TiO2

xxxiv
Table 2.4 Degradation rate of indole-3-acetic acid (IAA) in 46
Degussa P-25 TiO2 suspension at different
indole-3-acetic acid (IAA) concentrations
Table 2.5 Photocatalytic degradation of tebuthiuron at different 50
Degussa P-25 TiO2 concentration
Table 2.6 Influence of pH on the photocatalytic degradation 54
of various pollutants
Table 2.7 Comparing % removal of pesticides by photocatalytic 61
treatments before adding H2O2 and after adding H2O2
Table 2.8 Comparing the advantages and drawbacks of 71
suspended and immobilized photocatalytic system
Table 3.1 Comparing molecular weight of three chosen pesticides 102
Table 6.1 Photocatalytic reaction rate of isoproturon, simazine, 186
and propazine using P-25 TiO2 under UVA and UVC
(reaction rate constant at the first 10 minutes)

1
Chapter 1
INTRODUCTION
1.1 Introduction
The increase in the worldwide contamination of freshwater systems with
industrial and natural chemicals is a major environmental problem. Since
drinking water is becoming increasingly scarce, investigation into the
decontamination of the impure water has risen substantially because of an
increased presence of pollutants, such as surfactants, pesticides, dyes,
persistent organic chemicals and heavy metals. Although the pesticides are
usually present in low concentrations, many of them raise considerable
toxicological concerns, particularly when present as complex mixtures. The
three pesticides investigated in this thesis - isoproturon, simazine and
propazine - are three of the most frequently detected pesticides in
groundwater.
1.1.1 Examples of common water pollutants
1. Industrial chemicals (solvents, intermediates, petrochemicals) :
tetrachloromethane, methyl-t-butylether, BTEX (benzene, toluene,
xylene)
2. Industrial products (additives, lubricants, flame retardants):
phthalates, PCBs (Polychlorinated biphenyls), polybrominated
diphenylethers

2
3. Consumer products (detergents, pharmaceuticals, hormones,
personal-care products): nonylphenol ethoxylates, antibiotics,
ethinyl estradiol, ultraviolet filters
4. Biocides (pesticides, nonagriculural biocides): DDT, atrazine,
tributyltin, triclosan
5. Geogenic/natural chemicals (heavy metals, inorganic, taste and
odor, cyanotoxines, human hormones): lead, cadmium, mercury,
arsenic, selenium, fluoride, uranium, geosmin, methylisobornoel,
microcystins, estradiol
6. Disinfection/oxidation (disinfection by-products): trihalomethanes,
haloacetic acids, bromate
7. Transformation products (metabolites from above chemicals):
metabolites of perfluorinated compounds, chloroacetanilide
herbicide metabolites
1.1.2 Definition of pesticides (in general view)
'Pesticide' is a broad term, covering a range of products that are used to control
pests. Slug pellets, ant powder, weed killers, and rat and mouse baits are
examples of pesticides which are encountered in daily life.
1. Insect killers (insecticides)
2. Mould and fungi killers (fungicides)
3. Weedkillers (herbicides)

3
4. Slug pellets (molluscicides)
5. Plant growth regulators
6. Bird and animal repellents
7. Rats and mouse killers (rodenticides)
Pesticides are widely used for the control of plant disease and weeds. Many
pesticides, including herbicides and fungicides are highly toxic to terraneous
and aquatic life; this is a particular problem in agricultural areas. They can
enter into the environment by several routes such as spraying, soil and storage,
as well as wastewater discharge. Moreover, these compounds can contaminate
surface and groundwater, posing a risk to wildlife and human health, due to
the potential toxicity of these compounds. Environmental contamination
occurs when these pesticides drift from application site via air and rain water,
into groundwater by leaching through soil, running off the treated land via
storm or irrigation water, or migrating from application sites (Zhou et al.,
2007).
1.1.3 Groups of pesticides
Pesticides can be categorised into 9 major groups, based on their by chemical
structures (Ministry of Environment, Ontario, Canada, 2010).
1. Triazine (N-Containing pesticides): a group of compounds whose
molecules contain an unsaturated ring of three carbon and three
nitrogen atoms.

4
2.
Figure 1.1 Triazine isomers: (1) 1,2,3 triazine ,(2) 1,2,4 triazine ,(3) 1,3,5
triazine
2. Carbamates (Cbs): a salt or ester containing the anion NH2COO−,
derived from compound carbamic acid.
Figure 1.2 Chemical structure of carbamic acid group
3. Organochloride (OCs): pesticides containing chloride.
4.
Figure 1.3 Structure of DDT, an example of pesticides in OCs group
4. Organophosphorous (OPs): pesticides containing phosphorus.

5
Table 1.1 Three examples of pesticides in OPs group with molecular
formula and chemical structures: Parathion methyl, fenitrothion,
parathion
5. Chlorophenols (CPs): for example;trichlorophenol, pentachlorophenol,
dichlorophenol, 2-chlorophenol
6. Phenoxy acids (PAs): a family of chemicals related to the growth
hormone indoleacetic acid (IAA).
Figure 1.4 Chemical structure of Phenoxy acid
7. Quaternary ammonium compounds (Q) are positively charged
polyatomic ions of the structure NR4+ with R being alkyl or aryl
groups. Examples of the pesticides in this group are Diquat and
Paraquat.

6
8. Phenylurea (PhUrs): a chemical compound on which relatively
nontoxic herbicides are based.
Figure 1.5 Paraquat structure
9. Thiocarbamate (ThCbs): a family of organosulfur compounds.
Figure 1.7 Two isomeric forms of Thiocarbamate
Table 1.2 presents 9 different groups of pesticides, as described above.
The pesticides in each group are given.

7

8
1.1.4 Water pollution from pesticides
Atrazine, simazine, isoproturon, chlortoluron and mecoprop represent the most
widespread contaminants in drinking water, as shown in Table 1.3 (Ward et
al., 1993). Simazine and atrazine are so widely used that they are found in
nearly all the water sources in Europe (Croll, 1991). They are slowly broken
down in the soil where it has a low mobility, although they are still commonly
detected in low concentrations in both the ground and surface water. Simazine
is shown to display chronic toxicity in laboratory animals (Turner, 2003). The
World Health Organization (WHO) set the guideline value for simazine in the
drinking water at 0.002 mg/l (Mohapatra and Michell, 2003). Atrazine is
relatively persistent and more mobile in soil than simazine. It is slowly
degraded by photolysis and microbial action in soil, although it can remain in
water for many years and cause long-term adverse effects in the aquatic
environment (simazine MSDS, propazine MSDS from Sigma-Aldrich). The
health effects of atrazine are evidence of a highly toxic, carcinogenic
substance. WHO has now set guideline values for atrazine in drinking water at
0.002 mg/l (Hamilton et al., 2003).

9
Frequently occurring Commonly occurring
Atrazine (C8H14ClN5) 2.4-D (C8H6Cl2O3)
Chlortoluron (C10H13ClN2O) Dicamba (C8H6Cl2O3)
Isoproturon (C12H18N2O) Dichlorprop (C9H8Cl2O3)
MCPA (C9H9ClO3) Dimethoate (C5H12NO3PS2)
Mecocrop (C10H11ClO3) Linuron (C9H10Cl2N2O2)
Simazine (C7H12ClN5) 2,4,5-T (C8H5Cl3O3)
Table 1.3 The 12 pesticides most often found in UK drinking water. All are
herbicides except for dimethoate, which is an insecticide (Ward et al., 1993).
Figure 1.8 Statistical data of used pesticides in 2006 in UK (from Food and
Environmental Research Agency, 2006)
Pesticides
Area
Treated (ha)
Percentage
(%)
Triazine and sulfonylurea 4050000 47
Amide 600000 7
Organnophosporous
5%
Amide 7%

10
Carbamate and
thiocarbamate 1350000 15.7
Phenylurea 2200000 25.6
Phenoxy 20000 0.2
Organnophosphorus 400000 4.5
Organnochloride 0 0
Total 8620000 100
Table 1.4 The total usage of pesticides in the UK (from Food and
Environmental Research Agency, 2006)
From Figure 1.8 and Table 1.4, most agricultural areas in 2006 are treated with
triazine, which is equal to 47% of all the agricultural areas in the United
Kingdom.
1.1.5 Selected pesticides used in this thesis
1. Isoproturon (3-(4-isopropylphenyl)-1,1-dimethylurea) is a phenylurea
herbicide, which consists of an aromatic ring with an alkylic chain and
a ureic group (diamide), acting to inhibit the photosynthesis (Gora et
al., 2006). It has been used for pre- and post- emergence of annual
grass, wild oats, annual meadow grass and many broad leaf weeds in
winter wheat, spring and winter barley and winter rye.
Figure 1.9 shows the use of isoproturon in UK agriculture during 1990-
2009. Isoproturon seems to have been used in lower amounts after
1996 and constantly applied until 2009.

11
Figure 1.9 Use of isoproturon (kg/hr) with crops in UK (from The Food and
Environmental Research Agency, 2006)

12
Table 1.5 Structure refinement and crystal data of isoproturon (Vrielynck et
al., 2006)
Table 1.5 shows the properties of isoproturon; for example the calculated
density, crystal size, structure refinement, unit cell dimensions, etc.
2. Simazine (6-chloro-N,N'-diethyl-1,3,5-triazine-2,4-diamine) is a s-
triazine herbicide. Figure 1.11 indicates that simazine consists of an
alkylic chain bound to the N-exocyclic. It is used in various herbicide

13
formulations, in agriculture, for controlling plant production, and in
orchards, with Christmas trees and in recreational areas.
Figure 1.10 shows the use of simazine in UK agriculture during 1990-
2009. There was a decrease in the use of simazine from 1996 to 2005.
However, since 2006, the use of simazine has significantly increased.
Figure 1.10 Rate of use (kg/ha) for simazine with crops in UK (from The
Food and Environmental Research Agency, 2006)
3. Propazine (6-Chloro-N, N’-bis(1-methylethyl)-1-3, 5-triazine-2, 4-
diamine) is a selective s-triazine herbicide used for the control of most
annual broadleaf weeds and annual grasses. Its structure consists of the
alkylic chain bound to the exocyclic N-amino group, as shown in
Figure 1.12. Its principal mode of action is to selectively inhibit plant
photosynthesis.

14
Figure 1.11 Structure of three pesticides
1.1.6 Legislation of pesticides in respect to human consumption
In the European Union, there is a maximum admissible concentration (MAC)
which, in turn, defines that the minimum specified requirements of potable
water. Each pesticide is limited to 0.1 μg/l up to a maximum of 0.5 μg/l for the
total pesticides (Ward et al., 1993). Table 1.6, the ‘maximum acceptable
value’ (MAV) of pesticides in drinking water, was defined by the New
Zealand Ministry of Health. Pesticide regulations relating to the drinking
water of New Zealand are presented to show MAVs of three chosen pesticides
(isoproturon, simazine and propazine). The MAV for isoproturon is 10 μg/l,
for simazine 2 μg/l and for propazine 70 μg/l. From the definition, MAV
values are designed to take into account consumption of a lifetime. However,
the quality of drinking water should not be degraded by the MAV level. The
removal of excess pesticides in the water may therefore be necessary and there
are different approaches to reducing their total concentration, including air
stripping, granular activated carbon adsorption (GAC) and advanced oxidation
processing (AOP).

15
Table 1.6 Maximum acceptable values (MAVs) for the pesticide residues in the
drinking water in New Zealand (Hamilton et al., 2003, Ministry of Health, NZ.
Drinking-water standards for New Zealand, 2000)
1.2 Research objectives
The main objectives of this study are:
(i) To use TiO2 nanoparticles synthesised by the supercritical water in the
waste water treatment
(ii) To characterise TiO2 produced via hydrothermal synthesis using
Scanning Electron Microscopy (SEM), Transmission Electron
Microscopy (TEM), Ultraviolet-Visible absorption spectroscopy
(UV-Vis) and X-Ray Diffraction (XRD)
(iii) To design, construct and develop three different types of reactors (thin
film fixed bed reactor, stirred reactor and fluidised bed

16
photoreactor) for the treatment of the water polluted by the three
named pesticides
(iv) To evaluate the effectiveness of commercial P-25 TiO2 compared with
ScWHS synthesised TiO2 when applied to the photocatalytic
degradation of the aqueous solutions of selected pesticides
(isoproturon, simazine and propazine)
(v) To study the effect of the operating parameters such as catalyst
concentration, pesticide concentration, and the wavelength of light
on the photocatalytic degradation of the pesticides
1.3 Thesis structure
This thesis is composed of 7 chapters. Each chapter addresses different
research issues.
Chapter 1: An outline of the global water pollution problem, particularly
water polluted by pesticides, and the use of pesticides in agriculture. Pesticides
are categorised into different categories, and the impacts of each category are
identified. The structures of the three pesticides related to this research are
provided. The objectives of this research and outlines of the thesis structure
are also included.
Chapter 2: The basic concepts of photolysis, the homogeneous photocatalysis,
the heterogeneous photocatalysis, and also ‘Photo-Fenton reaction’ are
reviewed. This chapter mainly discusses the fundamental knowledge of
photocatalysis, the choice of photocatalysts, the mechanism, and the effecting
17
factors in the reaction. An up-to-date review of the literature of all the above
topics is also addressed. The TiO2 nanoparticles synthesis is also reviewed.
Chapter 3: This chapter explains the experimental part of the photocatalysis,
which comprises of the reagents and materials, the photocatalysis reactor
including, the thin film fixed bed reactor (TFFBR), the stirred reactor, and the
fluidised bed photoreactor. Standard operating procedures are also included in
this chapter. The experimental set-up of the reactor used to synthesise the
nanoparticles is also presented. The schematic diagram and the photograph of
the system are offered. All the technical and analytical methods used in this
research are addressed.
Chapter 4: The results from the TFFBR are presented. The efficiency of this
reactor with a synthesised TiO2 surface is compared with a commercial TiO2.
The results of the photocatalytic degradation under the different conditions are
presented.
Chapter 5: The results from the stirred reactor are presented. The impact of the
photocatalyst loadings is presented in this chapter. The optimum TiO2
concentrations for the photocatalytic degradation of isoproturon, simazine and
propazine are evaluated. The photocatalytic performance of the synthesised
TiO2 is compared with the commercial one. The promising explanations are
addressed. X-ray diffraction (XRD) results are proposed to support the
explanation.
Chapter 6: The results from the fluidised bed photoreactor are presented. The
influence of UV wavelength and photocatalyst concentration is discussed.

18
The efficiency of ScWHS synthesised TiO2 is compared to the commercial
TiO2 in term of the photocatalytic activity.
Chapter 7: Overall conclusions of the research. Recommendations are made
for improving the efficiency of a UV based photo-oxidation system. Potential
future work is also addressed in this chapter.

19
Chapter 2
BACKGROUND AND
REVIEW OF LITERATURE
2.1 Introduction
The purpose of this chapter is to give an overview of the fundamental
principles of heterogeneous photocatalysis. The mechanisms, the kinetics and
the effect of the different parameters on the photocatalytic rate are outlined. A
variety of reactor designs are presented and an introduction to the synthesis of
the nanocatalysts, using supercritical water, is also given. This synthesis
method was used to prepare nanoparticles titanium dioxide which was used in
experiments to compare the photocatalytic efficiency with the commercial P-
25 TiO2.
2.2 Photolysis or Photodissociation process
Photolysis is a chemical process by which molecules are broken down through
the absorption of light. Photons, with their energy being inversely proportional
to their wavelength, can affect the chemical bonds of a chemical compound by
the cleavage of one or more covalent bonds in a molecular entity (Muller,
1994). The general photolysis reaction can be given as
H2O + hv H+ + OH
- (2.1)

20
2.3 The principle of photocatalysis
2.3.1 Homogeneous photocatalytic reactions
In homogeneous photocatalysis, the reactants and the photocatalysts are in the
same phase. The most commonly used homogeneous photocatalysts are the
ozone, the transition metal oxide and the photo-Fenton systems. The
mechanism of the hydroxyl radical production by the ozone is as follows,
O3 + hν → O2 + O (1D) (2.2)
O (1D) + H2O → •OH + •OH (2.3)
O (1D) + H2O → H2O2 (2.4)
H2O2 + hν → •OH + •OH (2.5)
2.3.2 Heterogeneous photocatalytic reactions
Heterogeneous photocatalysis is defined as the acceleration of the
photoreaction in the presence of a catalyst in the difference phase (Radwan,
2005). In the context of pesticide and contaminant removal, it has also been
referred to as advanced oxidation processing (AOP) or photocatalytic
oxidation (PCO). The initial interest in heterogeneous photocatalysis began in
1972, when the photochemical splitting of the water into hydrogen and
oxygen, using TiO2, was shown to be possible (Fujishima and Honda, 1972).
From that date, extensive work has been carried out to produce hydrogen from
the water by this novel oxidation reduction reaction using a variety of
semiconductors (Mill and Hunte, 1997; Mill et al., 1993; Hoffmann et al.,
1995).

21
Ten years ago, a number of researchers focused on using semiconductor
materials as photocatalysts for the removal of organic and inorganic species
from the aqueous or gas phase. This method has been put forward as a means
of environmental protection, due to its ability to oxidise the organic and
inorganic substrates (Fox and Dulay, 1993).
Heterogeneous photocatalysis is a complex sequence of the reactions. Its
mechanism composes of five steps (Hermann, 1999, Pirkanniemi and
Sillanpaa, 2002), which are:
(i) Mass transfer of the organic contaminant in the liquid phase to the TiO2
surface
(ii) Adsorption of the organic contaminant onto the photon activated TiO2
surface
(iii) Photocatalysis reaction for the adsorbed phase on the TiO2 surface
(iv) Desorption of the intermediate from the TiO2 surface
(v) Mass transfer of the intermediate from the interface region to the bulk fluid

22
2.4 The Photo-Fenton reaction
The Fenton reaction is a homogeneous photocatalytic process which does not
involve light illumination. Conversely, in the Photo-Fenton system, an iron
catalyst is used in the presence of hydrogen peroxide under an irradiation
source of the visible wavelength (approximately 450-600 nanometre). It was
originally recognised in the 1960s and still remains one of the most applied
AOPs for its ability to degrade high loadings of organic compounds in highly
saline conditions (Chong et al., 2010). The advantages of this method are an
environmentally-friendly reagent; using the sunlight; the relatively cost-
effective process, and the replenishing of the hydroxyl radical which is the key
for oxidation. These Fenton and photo-Fenton reactions might occur
simultaneously with TiO2 photocatalysis during the UV irradiation period,
post-TiO2 photocatalysis period or as a stand-alone photo-Fenton process. The
photo-Fenton mechanism is shown below (Pirkanniemi and Sillanpaa, 2002),
Fe2+
+ H2O2 → HO• + Fe3+
+ OH− (2.6)
Fe3+
+ H2O2 → Fe2+
+ HO•2 + H+ (2.7)
Fe2+
+ HO• → Fe3+
+ OH− (2.8)
The additional sources of OH radicals should be considered: through the
photolysis of H2O2, and through the reduction of Fe3+
ions under the UV light:
H2O2 + hν → HO• + HO• (2.9)
Fe3+
+ H2O + hν → Fe2+
+ HO• + H+
(2.10)

23
The efficiency of Fenton type processes, which will influence its feasibility for
the larger scale application, is largely dependent on several parameters, such
as the concentration of hydrogen peroxide, pH and the intensity of the UV
(Bigda, 1995). These reactions have been proven more efficient than the
heterogeneous photocatalysis but the disadvantage is that the process requires
the optimum pH of 4 (since iron precipitates at the higher pH and additional
processing is necessary to remove the iron).
2.5 Advanced Oxidation Processing (AOP)
AOP covers a suite of chemical treatment procedures designed to remove the
organic and inorganic materials in the waste water by oxidation. It is attractive
as a means for removing pesticides from water because it can destroy the
hazardous contaminants, rather than simply transfer them to another phase, as
with other techniques, such as the air stripping and granular activated carbon
adsorption (GAC). Overall the TiO2/UV photocatalysis process is known to
have many important advantages. For the heterogeneous photocatalysis, the
liquid phase organic compounds are degraded to their corresponding
intermediates and further mineralised to carbon dioxide, water and mineral
salts, if the irradiation time is extended. (Garcia et al., 2006; Vora et al., 2009;
Ahmed et al., 2011).

24
2.6 Photocatalytic materials
Various noble metals (Ru, Pt, Rh, Ir, and Pd) and some metal oxides (Cu, Mn,
Co, Cr, V, Ti, Bi, and Zn) have traditionally been used as heterogeneous
catalysts (Pirkanniemi and Sillanpaa, 2002). Ideal photocatalysts should have
the following properties (Bhatkhande et al., 2001; Radwan et al., 2005):
(i) photoactivity
(ii) biological and chemical inertness
(iii) stability towards photocorrosion
(iv) suitability towards visible or near UV light
(v) low cost
(vi) lack of toxicity
TiO2 is known as an excellent photocatalyst due to its properties. It has been
used in a variety of applications, for example, electroceramics, glass and
degradation of chemicals in the water and in the air. It has been used in the
form of a suspension, or an immobilised water treatment.
2.7 Mechanism/reactions of TiO2 photocatalyst
When titanium dioxide is illuminated by UV radiation, it usually corresponds
to wavelength < 380 nm (Pirkanniemi and Sillanpaa, 2002). Photons that have
an energy equal to or greater than the band gap width, usually 3.2 eV for
anatase or 3.0 eV for rutile (Chong et al., 2010), leads to the formation of
conduction-band electrons and valence-band holes, which subsequently
diffuse to the particle surface in competition with the bulk recombination

25
(Linsebigler et al., 1995). At the surface, these carriers are trapped by
defective sites, surface states or oxidising or reducing agents. They are then
able to initiate the redox reactions with other substrates. The trapped electron
reduces the pre-adsorbed acceptor A to A-, and the trapped hole oxidises the
pre-adsorbed electron donor D to D+
(Serpone and Emeline, 2004, Pirkanniemi
and Sillanpaa, 2002).
TiO2 + hv TiO2 + hVb+ + ecb
- (2.11)
OH- + hvb
+
●OH (2.12)
H2O + hvb+
●OH + H
+ (2.13)
To prevent electron-hole recombination, it is necessary for illumination to take
place in the presence of an electron acceptor. For this purpose, illumination is
generally carried out in an oxygen rich environment:
O2 + ecb- O2
- (2.14)
{Ti4+
-O2-
-Ti4+
} - ●OH + RH CO2 + H2O (2.15)

26
Figure 2.1 Mechanism of photocatalytic reaction in TiO2 (Linsebigler et al.,
1995)
The reaction of photogenerated holes with water molecules and hydroxyl ions
adsorbed on the surface of the TiO2 in Equation (2.12 and 2.13) results in the
formation of hydroxyl radicals in Equation (2.15) (Abramovic et al., 2004),
whereas the electron in the conduction band reduces the oxygen adsorbed on
the photocatalyst. It has been suggested that these hydroxyl radicals and
superoxide radical anions are the primary oxidising species in the
photocatalytic oxidation processes. The hydroxyl radicals attack organic
compounds, which results in various reaction intermediates and produces the
final products, which are CO2 and H2O. The efficiency of degradation will
depend upon the oxygen concentration, which determines the efficiency with

27
which the conduction band electrons are scavenged and (e-/h
+) recombination
is prevented (Haque and Muneer, 2007).
2.8 Photocatalytic degradation pathways and intermediates
The intermediate compounds during photocatalytic degradation and probable
pathways for each pesticide have been identified by various researchers
(Topalov et al., 2000; Hequet et al., 2001; Rafqah et al., 2005; Sojic et al.,
2009; Aungpradit et al., 2007; Han et al., 2009; Muneer and Boxall, 2008; Lu
et al., 2009; Kaneco et al.; 2009, Wu et al., 2010; Moctezuma et al., 2007;
Florencio et al., 2004; Calza et al., 2008; Aramendia et al., 2005). Some
intermediates belong to s-triazine pesticides, for example hexaconazole – the
parent compound (Calza et al., 2008). Intermediates from fenithion, diazinon,
imidacloprid and dipyrone were found to be carboxylic acid (Mahmoohdi et
al., 2008; Mahmoodi et al., 2007; Perez-Estrada et al., 2007). Hydrochloric
acid is one of the intermediate products discovered in dichloroacetic acid
degradation (Zalazar et al., 2008). Acetic acid is the product from glyphosate
degradation in basic condition (Muneer and Boxall, 2008). Moreover, there
are several stable intermediates, such as acetamide and formamide, which still
remain at the end of removal of cymoxnil, methomyl, oxamyl, dimethoate,
telone and pyrimethanil (Oller et al., 2006). This means that investigation of
the intermediate products is necessary for the treatment to obtain higher
cleanliness of water. While comparing between the solar and the artificial
irradiation source, imazquin degrades faster under solar light than under the
artificial source (Garcia and Takashima, 2003); on the other hand, isoproturon

28
degrades better under the artificial source than under sunlight (Haque and
Muneer, 2003). The Table below shows herbicides, divided by the chemical
structures, the reaction pathways and the intermediate substances
(Konstantinou and Albanis, 2003).

29
Table 2.1 List of herbicides degradation by the TiO2 photocatalysis, the main
reaction pathways, the transformation products (TPs) (Konstantinou and
Albanis, 2003)
2.9 Degradation pathways of isoproturon, simazine and propazine
For isoproturon, there are a lot of intermediates in the oxidation process. As
illustrated in the pathway in Figure 2.2, it shows that the first are di and
trihydroxylated intermediates. The next groups that will occur are aldehydes,
ketones and organic acids. The final products from photocatalytic degradation
of isoproturon are carbon dioxide, water, and nitric acid (Benitez et al., 2006).

30
Figure 2.2 Degradation pathway of isoproturon in water (Benitez et al., 2006)
In the case of simazine and propazine, there are two triazine metabolites, DEA
and DIA, which were found to occur in water derived from parent triazine
herbicides. DEA is derived from propazine and atrazine whereas DIA
originated from atrazine and cyanazine. Trace amounts of DIA are contributed
by simazine (Scribner et al., 2000).

31
Figure 2.3 Degradation pathway of simazine, cyanazine, atrazine and
propazine in water (Scribner et al., 2000)

32
Chemical name Acronym
6-Amino-2-chloro-4-ethylamino-1,3,5-triazine ACET
2-Chloro-4,6-diamino-1,3,5-triazine CAAT
4,6-Diethylamino-2-hydroxy-1,3,5-triazine EEOT
6-Amino-4-ethylamino-2-hydroxy-1,3,5-triazine AEOT
2-Hydroxy-4,6-diamino-1,3,5-triazine (ammeline) OAAT
2,4-Dihydroxy-6-amino-1,3,5-triazine (ammelide) OOAT
2,4,6-Trihydroxy-1,3,5-triazine (cyanuric acid) OOOT
Table 2.2 main intermediates produced in the photocatalytic reaction of
simazine (Lopez-Munoz et al., 2011)

33
Fig
ure
2.4
Sch
eme
of
pro
pose
d p
ath
way
for
sim
azi
ne
photo
cata
lyti
c deg
rad
ati
on (
Lopez
-Munoz
et a
l., 2011)

34
Figure 2.5 Proposed degradation pathway of simazine in UV/TiO2 system. The
dashed arrow indicates a possible pathway (Chu et al., 2009)

35
However, in 2009, Chu and co-workers proposed another photocatalytic
degradation pathway which is different from that suggested by Lopez-Munoz
and colleagues. However, the same final products, cyanuric acid (OOOT) and
ammeline, were achieved which had a lower toxicity (Chu et al., 2009).
The photodegradation pathway of propazine is shown in Figure 2.6 by Barcelo
and co-workers (1993) The main photodegradation pathways correspond to
dealkylation, hydroxylation and dehalogenation with the formation of
deisopropylpropazine (deethylatrazine) (compound2 in Figure 2.6), and
hydroxypropazine (compound4 in Figure 2.6). The final product is a hydroxyl-
s-triazine, compound 1.
Figure 2.6 Tentative photodegradation pathway of propazine (compound 5,
molecular weight = 229) in water containing 4% of methanol (Barcelo et al.,
1993)

36
2.10 The toxicity assessment of isoproturon, simazine and propazine
In 2011, Lopez-Munoz and co-workers analysed the toxicity of simazine and
atrazine by withdrawing the samples along TiO2 photocatalytic reactions and
monitoring the changes in the natural emission of the luminescence bacteria
Vibrio fischeri. The results are shown in Figure 2.7 which displays the
percentage of the inhibition of the bacteria as a function of the irradiation time
for atrazine and simazine degradation. After 15 min, the toxicity of atrazine
was 82% and reached 31% at the end of inhibition; whereas, simazine was
73% and finally reduced to 46%. In case of ammeline, which is one of the
intermediates of simazine degradation, the toxicity was reduced from 42% to
27%. However, the toxicity of ammelide, which lastly changed to cyanuric
acid, significantly decreased from 33% to 1%.
Figure 2.7 Results of toxicity in the triazine samples at condition simazine pH
= 5.5, TiO2 concentration = 0.25g/l, atrazine pH = 6, TiO2 concentration =
1.8 g/l, immersion well photoreactor (Lopez-Munoz et al., 2011).
37
For isoproturon, the detoxification by the bacteria Vibrio fischeri was carried
out by Hincapie and colleagues. They found that percentage inhibition of
isoproturon decreased from 95 % to 60 % in first 50 min and reached 5 % at
the end of TiO2 photocatalytic degradation (300 min) (Hincapie et al., 2005).
In the case of propazine, the E. coli bacterial biosensor was used to determine
toxicity during the photocatalytic degradation, due to a higher sensitivity to the
target pesticide than Vibrio fischeri (Strachan et al., 2001). Strachan and co-
workers recorded that the toxicity of propazine decreased to about half of the
initial value at the end of the degradation. Their results showed the similar
trend to that seen by Miquel et al., 2012 which also occurred in the case of the
TiO2 photocatalytic degradation of other pesticides, including melamine and
parathion (Kim et al., 2006; Bozzi et al., 2004).
2.11 Factors affecting the photocatalytic kinetics
Many researchers have studied the degradation kinetics under different
conditions such as catalyst concentration, pH, substrate concentration,
different types of TiO2, light wavelength, light intensity, temperature, presence
of electron acceptor such as H2O2, KBrO3, (NH4)2S2O8 and operation mode of
the photoreactor (Haque and Muneer, 2003; Rahman et al., 2005; Shifu and
Yunzhang, 2007; Qamar et al., 2006; Qamar and Muneer, 2005; Muneer et al.,
2005; Singh et al., 2007; Qamar and Muneer, 2009; Kaneco, 2009; Sojic et al.,
2009; Han et al., 2009).

38
2.11.11 Crystal phase
Titanium dioxide has three different crystalline forms, depending on the
synthesis method. The most common forms are the anatase and the rutile. In
both forms, titanium (Ti4+
) atoms form TiO6 octahedra by co-ordinating
with six oxygen (O2−
) atoms. Figure 2.7 (a) shows the structure of the
anatase forming (001) planes in a tetragonal structure by the corner (vertice)
sharing octahedral. However, in the rutile phase, the octahedra shares edges at
(001) planes to give a tetragonal structure, as seen in Figure 2.8 (b) (Pelaez et
al., 2012). Anatase is the most stable form by 8-12 KJ mol-1
and can be
converted to the rutile by heating to 700 ºC. The density of the rutile phase is
greater at 4.26 g/ml, while anatase titania has a density of 3.9 g/ml (Radwan,
2005). Anatase has been reported to be more active as a photocatalyst than
rutile (Hurum et al., 2003; Qourzal et al., 2008; Radwan, 2005; Pelaez et al.,
2012; Ahmed et al., 2011).
Figure 2.8 Crystalline structures of titanium dioxide (a) anatase, (b) rutile
(Pelaez et al., 2012)

39
There are 3 main types of commercial TiO2 used in the literature: Degussa P-
25 TiO2, Millenium PC-500, and Hombikat UV-100 TiO2. Hombikat UV-100
TiO2 consists of the pure anatase modification. The majority of investigations
have been performed using Degussa P-25 TiO2. The efficiency of
photocatalysts is shown to follow the order: P-25 > UV-100 > PC-500 for the
degradation of pesticides derivatives, as shown in Table 2.3 (Bhatkhande et
al., 2001; Singh et al., 2003; Singh et al., 2007; Singh and Muneer 2004;
Rahman and Muneer, 2005; Qamar and Muneer, 2005; Qourzal et al., 2008;
Qamar and Muneer., 2009; Singh et al., 2007; Muneer et al., 2005; Rafqah et
al., 2005). One of the examples related to the influence of TiO2 types is shown
in Table 2.3 which was the photocatalytic degradation of bromacil (Singh et
al., 2003). The commercial Degussa P-25 is composed of 75% anatase and
25% rutile (Singh and Muneer 2004; Singh et al., 2007; Ahmed et al., 2011).
It has a BET surface area of 50 m2
g-1
and the diameters of its particles are
between 20-30 nm. Hombikat UV-100 consists of 100% pure and smaller
anatase with a BET surface area 186 m2g
-1 and particle size of 5 nm. In case of
PC-500, it has a BET surface area 287 m2g
-1 with 100% anatase and particle
size of 5-10 nm (Ahmed et al., 2011). However, the difference in the
photocatalytic activity also depends on a BET surface, the lattice mismatches,
or the density of the hydroxyl groups on the catalysts surface. There are three
reasons why the photoactivity of Degussa P-25 has been reported to be the
superior: (1) The smaller band gap of the rutile extends the useful range of the
photoactivity into the visible region. Then the electron transfer from the rutile

40
(conduction band) to the electron traps, in the anatase phase, takes place. (2)
The recombination is inhibited by the stabilisation of the charge separation by
the electron transfer from the rutile to the anatase. (3) The small size of the
rutile crystallites facilitates this transfer, making the catalytic hot spots at the
rutile/anatase interface. (Qourzal et al., 2008; Hurum et al., 2003).
Catalyst (1 g litre-1
) Rate/10-6
M min-1
P-25 1.116
UV-100 1.094
PC-500 0.755
Table 2.3 Photocatalytic degradation of bromacil in an aqueous suspensions
under the different types of TiO2 (Singh et al., 2003)
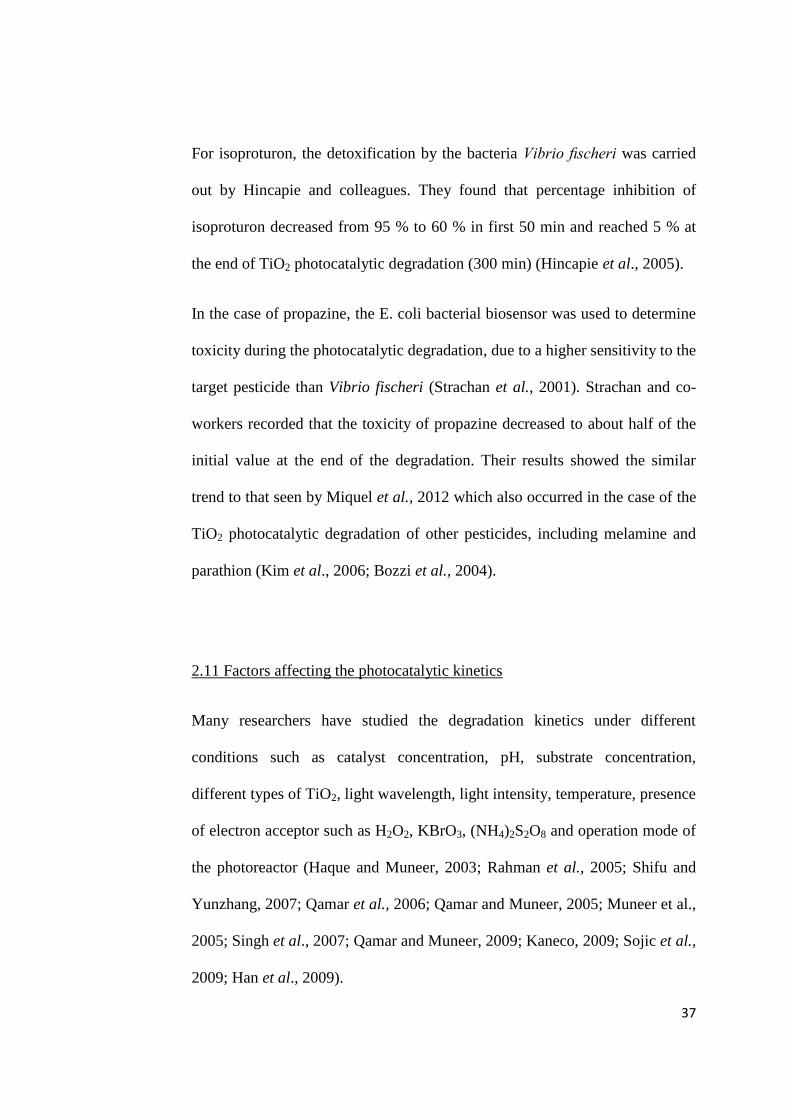
In 2008, Yeredla and Xu investigated the nanostructured rutile and anatase
plates with a view to improve the photo splitting of the water. They discovered
the different photocatalytic performance of acetaldehyde decomposition due to
the different phases: among mixed-phase P-25, anatase and rutile alone
(Yeredla and Xu, 2008). As shown in Figure 2.9, Degussa P-25 TiO2 and pure
anatase show a very high activity for the photo-oxidation of acetaldehyde. In
contrast, the rutile phase shows a moderate activity which is much less when
compared to the anatase phase.
41
Figure 2.9 Photocatalytic oxidation of acetaldehyde with Degussa P-25 TiO2,
nanostructured anatase and rutile (Yeredla and Xu, 2008)
There was a theory that each TiO2 phase has different rates of oxidation of
H2O molecules as an electron donor (electron transfer rate from H2O to the
holes on TiO2 surface) and the reduction of molecular oxygen as an electron
acceptor (electron transfer rate from TiO2 surface to the molecular O2) (Sato
and Taya, 2006). The quantum yield for the generation of hydroxyl radicals in
the anatase phase is limited by the oxidation reaction, whereas the rutile is
limited by the reduction reaction to keep the electro-neutrality, as shown in
Fig. 2.10 (a) and (b). However, in the case of the coexistence of both types of
TiO2, the close contact of the anatase and the rutile enables an exchange of the
photo-excited electrons and the holes between the particles, leading to the
balance in the acceleration of the oxidation and the reduction rates (Fig. 2.10
(c)).

42
Figure 2.10 Possible mechanisms for enhancement of photocatalytic activity
caused by contact between (a) anatase TiO2 (b) rutile TiO2 and (C) coexistence
of anatase and rutile TiO2 (Sato and Taya, 2006)
2.11.12 Organic pollutant concentration
The initial rate of the disappearance of the pollutant fits Langmuir-
Hinshelwood (L-H) kinetics, which is the most commonly used kinetic
expression to explain the kinetics of the heterogeneous catalytic processes.
The Langmuir–Hinshelwood expression was given by Hoffmann et al., 1995:

43
ri = - d[C]i/dt = k K[C]I (2.16)
1+ K[C]i
The term ri is represented in terms of the initial reaction rate of the
disappearance of the pollutant. [C]i is the initial concentration of the pollutant
C, K represent the Langmuir adsorption constant of the species C on the
surface of TiO2 and k is the proportional constant which provides a measure of
the intrinsic reactivity of the photoactivated surface with the pollutant C.
The competition of a variety of pollutants was modelled as follows:
-rj = kjKjCj with j = 1,2,……….,n (2.17)
1 + Σn
j=1 Kj C0j
Where kj (mol L-1
s-1
)and Kj (L/mol) are the reaction kinetic constant and the
binding constant of pollutant j respectively, Cj (L mol-1
) is the concentration of
the pollutant in solution C0j (L mol-1
) where the concentration of the pollutants
at the initial time or in the reactor feed and n is the number of the pollutants in
the solution (Li Puma et al., 2007).
Note that the denominator in Equation (2.17) takes into account the effect of
the Intermediate reaction products, since it assumes a stepwise reaction
scheme with identical binding constants of the intermediates and the pollutant
such that:
KjCj + (Σ KiCi) = Kj C0j (2.18)

44
where Ki (L mol-1
) is the binding constant of the intermediate product
adsorbed onto the surface of TiO2 and Ci is the concentration of the
intermediate in the solution (Li Puma et al., 2007).
Many researchers have shown that, with an increase in the initial pollutant
concentrations, the photocatalytic removal conversion of the pesticides
decreases correspondingly. This is shown in Figure 2.11 (Gora et al., 2006)
and in Table 2.4 (Qamar and Muneer, 2005). The presumed reason is that
when the pollutant concentration increases, the amount of the pesticide
molecules adsorbed on the surface of TiO2 also increases. The large amount of
the adsorbed pesticide is thought to have an inhibiting effect on the reaction
with the photogenerated holes or the hydroxyl radicals, due to the lack of the
direct contact between them. Once the concentration of the pesticide reaches a
critical level, the pesticide molecules adsorb all the light and the photons never
reach the photocatalyst surface.
Moreover, increasing the initial concentration of pollutants results in higher
concentrations of the intermediates, which adsorb on the surface of the
catalyst. This, in turn, leads to a deactivation of the active sites of the
photocatalyst. (Carp et al., 2004; Pourata et al., 2009; Garcia et al., 2003;
Rahmann and Muneer, 2005; Haque and Muneer, 2003; Qamar et al., 2006;
Singh et al., 2007; Muneer et al., 2005; Sojic et al., 2009; Sharma et al., 2008;
Qamar and Muneer, 2009; Kaneco et al., 2009; Han et al., 2009).

45
Figure 2.11 Initial rate of reaction calculated by L-H kinetics as a function of
the initial concentration of isoproturon, simazine, and propazine Symbols are
experimental data at different initial herbicide concentrations. Solid lines are
Langmuir–Hinshelwood model fitting (Gora et al., 2006)

46
IAA concentration (mM) Degradation rate (10-3
mol/l min-1
)
0.20 0.01260
0.30 0.01773
0.40 0.01361
0.60 0.00562
Table 2.4 Degradation rate of indole-3-acetic acid (IAA) in Degussa P-25
TiO2 suspension at different indole-3-acetic acid (IAA) concentrations (Qamar
and Muneer, 2005)
2.11.3 TiO2 concentration
In any reactor system, the photocatalytic removal rate is found to be directly
proportional to the photocatalyst concentration. However, when it reaches an
optimum value, the efficiency decreases (Carp et al., 2004; Konstantinou and
Albanis, 2004; Cao et al., 2005; Akpan and Hameed, 2009; Chong et al.,
2010). In slurry photoreactors, the optimal catalyst dosage reported lies in a
wide range (from 0.15 to 8 g litre-1
) for different photoreactors (Carp et al.,
2004). The optimum concentration values for each reactor depends on the
geometry of the reactor and working conditions where the surface reaction is
initiated upon light photon absorption. This is because the light photon
absorption coefficient decreases radially and light scattering increases (Chong
et al., 2010). At the high TiO2 concentration, the excess TiO2 particles start to
agglomerate, so reducing surface area for the light absorption which leads to a
drop in photocatalysis efficiency. Many studies revealed the non-uniformity of
light intensity as a result of increased catalyst loadings beyond the optimum
amount. (Wu et al., 2010; Wu et al., 2009; Pourata et al., 2009; Chen and Liu,

47
2007; Qamar et al., 2006; Sojic et al., 2009; Sharma et al., 2008; Qamar and
Muneer, 2009; Kaneco et al., 2009; Han et al., 2009; Lu et al., 2009).
In the research of Haque and colleagues (Haque, 2003), the optimum
concentration of TiO2 for isoproturon photocatalytic degradation using
immersion well photoreactor was found to be 2 g litre-1
as shown in Figure
2.12. The degradation rates scarcely increased beyond 2 g litre-1
.
Figure 2.12 Influence of catalyst concentration on the photocatalytic
degradation rate of isoproturon at UV=238 nm, 0.5 mM isoproturon, 250 ml,
and P-25 (0.5, 1, 2 and 3 g litre-1
) (Haque et al., 2003)
In 2004, Li Puma et al., (2004) used the model simulation to validate the
effect of TiO2 concentration on the photocatalytic degradation of isoproturon
in an annular photoreactor, as shown in Figure 2.13. They concluded that the
optimum concentration of Degussa P-25 TiO2 in an annular photoreactor was
0.4 kg m-3
. Increasing the concentration beyond this value led to a decrease in
the degradation rate.

48
Figure 2.13 Effect of catalyst loading at pH = 7, radiation intensity = 185.2
W/m2, CTiO2 = TiO2 concentration (kg m
-3), τ = optical thickness,
dimensionless, NRe = Reynolds number, Q = volumetric flowrate (m3s
-1) (Li
Puma et al., 2004)
From Figure 2.14, the study of the photocatalytic degradation of glyphosate by
TiO2 was carried out in an annular photoreactor by Chen and Liu in 2007
(Chen and Liu, 2007). Their results showed that a further increase of the most
favourable catalyst concentration equalled 6.0 g litre-1
since it led to a slight
decrease in the degradation efficiency when the TiO2 concentration exceeded
that value. Results from 2009 showed a similar trend (Figure 2.15). As the
concentration of TiO2 increased from 2.0 to 12.0 g litre-1
, the photodegradation
efficiency of methamidophos increased rapidly from 16.6 % to 75.1 %. Then,
the efficiency slightly decreased when the amount of TiO2 was above 12.0 g
litre-1
.

49
Figure 2.14 Effect of TiO2 concentration on the photodegradation efficiency
of glyphosate, t = 1.0 hr (Chen and Liu, 2007)
Figure 2.15 Effect of the amount of TiO2 on the photodegradation efficiency of
methamidophos, annular photoreactor, 375 W medium pressure mercury
lamp, reaction temperature =30 ºC, illumination time = 30 min (Wei et al.,
2009)
Table 2.5 shows the results from Muneer and co-workers who studied the
photocatalysed reaction of tebuthiuron in an aqueous suspension of Degussa

50
P-25 TiO2 in an immersion well photoreactor. The optimum TiO2
concentration for tebuthiuron degradation was 5 g litre-1
, as shown in the table
below (Muneer et al., 2005).
TiO2 concentration (g litre-1
) Degradation rate (M min-1
x 10-3
)
0.5 0.0085
1 0.0120
2 0.0140
5 0.0185
7.5 0.0180
Table 2.5 Photocatalytic degradation of tebuthiuron at different Degussa P-25
TiO2 concentration (Muneer et. al, 2005)
2.11.4 O2 initial concentration
The presence of oxygen assures the presence of sufficient electron
scavengers, acts as an electron sink by trapping the excited conduction-band
electron from the recombination, and enhances the decomposition of the
organic compounds (Devipriya and Yesodharan, 2005; Chong et al., 2009;
Malato et al., 2009; Chong et al., 2010). The main role of the oxygen present
during the reaction stage is to support the formation of the hydroxyl radicals
and stabilise the intermediates. In 2001, Axelsson and Dunne studied the
effect of the dissolved molecular oxygen on the mechanism of the
photocatalytic oxidation of 3,4-dichlorophenol. They concluded that when it is
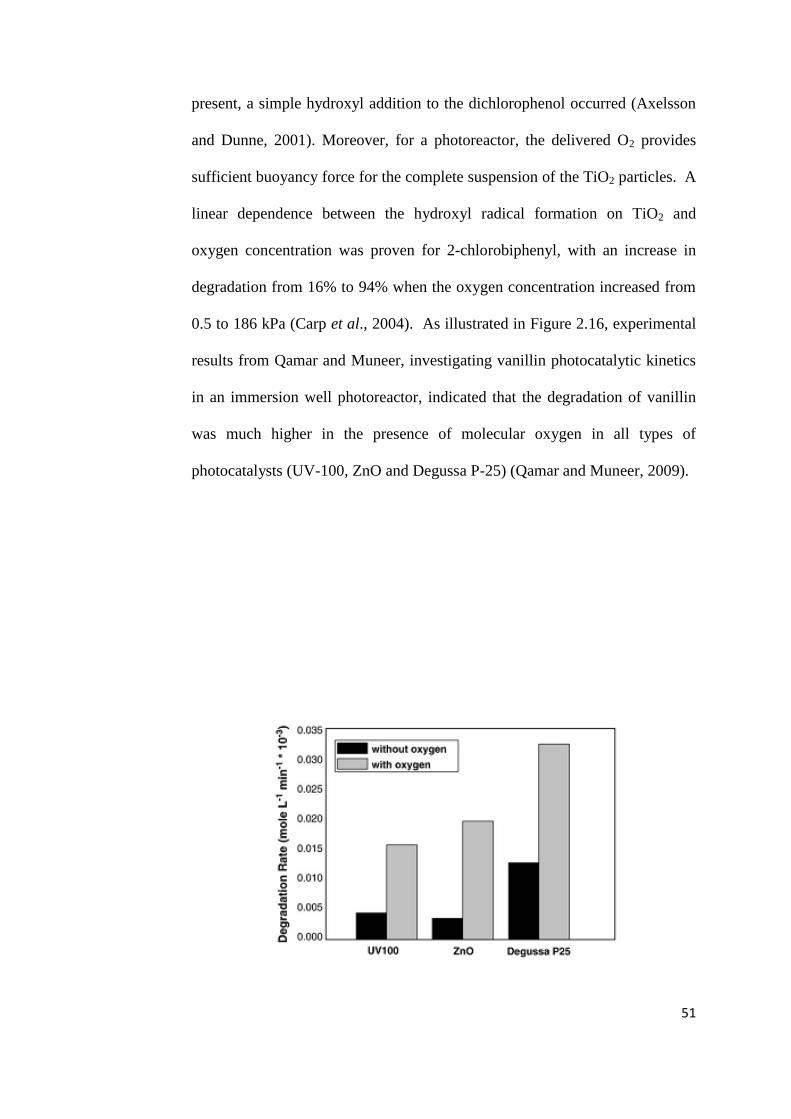
51
present, a simple hydroxyl addition to the dichlorophenol occurred (Axelsson
and Dunne, 2001). Moreover, for a photoreactor, the delivered O2 provides
sufficient buoyancy force for the complete suspension of the TiO2 particles. A
linear dependence between the hydroxyl radical formation on TiO2 and
oxygen concentration was proven for 2-chlorobiphenyl, with an increase in
degradation from 16% to 94% when the oxygen concentration increased from
0.5 to 186 kPa (Carp et al., 2004). As illustrated in Figure 2.16, experimental
results from Qamar and Muneer, investigating vanillin photocatalytic kinetics
in an immersion well photoreactor, indicated that the degradation of vanillin
was much higher in the presence of molecular oxygen in all types of
photocatalysts (UV-100, ZnO and Degussa P-25) (Qamar and Muneer, 2009).

52
Figure 2.16 Effect of added molecular oxygen on the degradation rate of
vanillin in the presence of Degussa P-25, UV-100 and ZnO. Experimental
conditions: substrate concentration (0.5 mM), V = 250 mL, pH = 2 for TiO2
samples and pH = 6 for ZnO, Degussa P-25, UV-100 and ZnO = 1g litre-1
,
immersion well photoreactor, 125 W medium pressure Hg lamp, irradiation
time = 45 min (Qamar and Muneer, 2009)
For the liquid phase reactions, the study of pressure and the influence of
oxygen on degradation rates is difficult because the reaction is polyphasic.
Therefore, it is generally assumed that the oxygen adsorbs TiO2 from the
liquid phase, following Henry’s law. When the oxygen is continuously
supplied, it can be assumed that the apparent integrated rate of its coverage at
the surface of TiO2 is as follows (Herrmann, 1999):
A+ O2 P (2.19)
rA = -d[A] = k ӨAӨO2 = kappӨA (2.20)
dt
Actually, the apparent rate constant is a function of the power flux (expressed
in mW cm-2
) and oxygen coverage.
2.11.5 pH
The effect of pH on the photocatalytic reaction is generally attributed to the
surface charge of the photocatalyst and its relation to the ionic form of the
organic compound (anionic or cationic). The point of zero charge (PZC) of
TiO2 is 6.25 (Saber et al., 2011). At a pH value lower than 6.25 the catalyst

53
surface is positively charged and the positive holes are considered as major
oxidation steps; whereas at higher pH values the catalyst surface is negatively
charged and hydroxyl radicals are considered as the predominant species.
Electrostatic attraction or repulsion between the catalyst’s surface and the
organic molecules are taking place, depending on the ionic form of the organic
compound (anionic or cationic) and enhancing or inhibiting the
photodegradation efficiency, respectively (Wu et al., 2010; Wu et al., 2009;
Garcia et al., 2003; Rahmann and Muneer, 2005; Haque and Muneer, 2003;
Chen and Liu, 2007; Qamar and Muneer, 2005; Muneer et al., 2005; Singh et
al., 2007; Sojic et al., 2009; Sharma et al., 2008; Qamar and Muneer, 2009;
Kaneco et al., 2009; Mahmoodi et al., 2008). In the case of vanillin (Figure
2.18) (Qamar and Muneer, 2009), the degradation rate decreased with
increasing pH. However, the photocatalytic degradation of trichlorfon
preferred an alkaline condition, as shown in Figure 2.17 (Wei et al., 2009). In
the case of isoproturon and carbofuran, the optimum pH was 7, which is
slightly higher than neutral pH, as shown in Table 2.6 (Sharma et al., 2009;
Saber et al., 2011).
The ionisation state of the surface of the photocatalyst can be protonated and
deprotonated under acidic and alkaline conditions respectively, as shown in
the following equations (Malato et al., 2009; Lu et al., 2009):
TiOH + H+ TiOH2
+ (2.21)
TiOH + OH- TiO
- + H2O (2.22)

54
Pollutant Photocatalyst optimum pH
Atrazine TiO2 4-5
Diazinon TiO2 5.2
Phorate TiO2 8
Propachlor TiO2 3
Dimethoate TiO2 11.05
Isoproturon TiO2 7
Turbophos TiO2 8
Thiram TiO2 8
Carbofuran TiO2 7
Carbendazim TiO2 9
Table 2.6 Influence of pH on the photocatalytic degradation of various
pollutants (Saber et al., 2011; Sharma et al., 2009; Wu et al., 2009)

55
Figure 2.17 Effect of initial pH value on the photodegradation efficiency of
trichlorfon using TiO2, annular photoreactor, 375 W medium pressure
mercury lamp, illumination time = 30 min (Wei et al., 2009)
Figure 2.18 Influence of pH on the degradation rate of vanillin using
Degussa P-25, UV-100 and ZnO = 1g/l. experimental conditions: substrate
concentration (0.5 mM), V = 250 mL, immersion well photo-reactor, 125 W
medium pressure Hg lamp, pH range (2, 4, 6, 8, 10 and 12), continuous O2
purging and stirring, irradiation time = 45 min (Qamar and Muneer, 2009)
Adding anions or cations to increase or decrease pH has an effect on
photocatalytic degradation rates. With industrial effluents, anions such as
chloride, carbonate, and bicarbonate are commonly found. These ions have a
significant effect on the adsorption of the degradation species; they decrease
the rate by reaction with the hydroxyl radicals and absorption of UV light,
especially chlorides. In Figure 2.19, Mahmoodi and coworkers studied the
effect of the chloride, sulphates and nitrate ions on the photocatalytic
degradation of Butachlor. Sulphate and nitrate also decrease the reaction rate

56
but have a smaller effect on the photo-oxidation (Mahmoodi et al., 2007).
However, in case of cations, conflicting results have been reported by many
researchers (Bhatkhande et al., 2001).
Figure 2.19 Effect of anions on the photocatalytic degradation rate constants
of Butachlor (Mahmoodi et al., 2007)
2.11.6 Reaction temperature
It is well known that the photocatalytic oxidation rate is not dependent on
temperature. However, some researchers found that an increase of the
photocatalytic reaction temperature (> 80 ºC) promotes the recombination of
the charge carriers and desorption of the organic compounds on the TiO2
surface (Chong et al., 2010). On the contrary, at temperatures below 80 ºC, the
adsorption mechanism is actually favorable. Consequently, the optimum
reaction temperature for photocatalysis is reported to be in the range of 20-80
ºC. In 2005, Cao and co-workers found that temperature had a slight effect on
the degradation of chlorfenapyr, as shown in Figure 2.20.

57
Figure 2.20 Comparison of the photocatalytic degradation of chlorfenapyr at
300 nm of UV at different temperature. The initial concentrations of
chlorfenapyr and TiO2 = 800 mg litre-1
, pH = 6 (Cao et al., 2005)
2.11.7 Irradiation wavelength
The different wavelength of an irradiation source has a profound effect on the
photocatalytic reaction rate (Legrinl et al., 1993). This discovery depends on
the crystalline phase of photocatalyst, for example, anatase or rutile phase,
elemental composition and photocatalyst doping. In the case of Degussa P-25
TiO2, which has a crystalline ratio of the anatase 75: 25, a light at wavelength
lower than 380 nm is sufficient for photoactivation. The rutile TiO2 has a
smaller bandgap energy compared to the anatase TiO2. This dictates that rutile
TiO2 can be activated with a light wavelength up to 400 nm. For UV
irradiation, it can be classified as UV-A, UV-B and UV-C, according to its
emitting wavelength. The UVA wavelength ranges from 315 to 400 nm (3.10-
3.94 eV), while UVB has a wavelength range from 280 to 315 nm (3.94-4.43

58
eV) and germicidal UVC ranges from 100 to 280 nm (4.43- 12.4 eV). There
have been many studies that state that shorter wavelength radiations (254 nm)
are considerably more effective for photocatalytic degradation, where the
optimum rate can occur with a less catalyst than would be required at a higher
wavelength (Bhatkhande et al., 2001). The energy of a photon is related to its
wavelength. The wavelength is inversely proportional to the energy; the higher
the energy, the shorter the wavelength. The lower the energy the longer the
wavelength, as explained in Planck’s equation by the relationship between the
wavelength and the energy of a photon (Equation (2.23)).
The energy of photon = E = h c /λ (2.23)
Where λ is the wavelength of the light,
h is Planck's constant = 6.626 × 10 -34
joule·s
c is the speed of light = 2.998 × 10⁸ m/s
2.11.8 Light intensity
The rate of the photocatalytic reaction is strongly dependent on the intensity of
the irradiation source. In order to achieve a high photocatalytic reaction rate,
particularly in water treatment, a relatively high light intensity is required
(Ahmed et al., 2011; Cassano and Alfano, 2000). In the case of imazaquin,
when the mercury lamp powers were changed from 125 to 250 W, the
degradation rate increased by about 16% (Garcia and Takashima, 2003). The

59
overall energy input to a photocatalytic process is dependent on the light
intensity. This corresponded to the concept of the quantum yield, which was
used to describe the efficiency of the reaction under different intensities of
light. The relationship between the quantum yield (Ф) and the quantity of
photon in the system (Na) was presented as follows:
Ф = Δn / Na (2.24)
The quantity of photons from the lamp is related to the power of the lamp, P
and energy per photon, E, as derived from Planck’s equation (Equation (2.23))
as follows,
Na = P E = P h c = I A h c (2.25)
λ λ
where I is the intensity of the visible light or the energy per unit area per unit
time in units of W/m2 and A is surface area.
Therefore, the rate of the photocatalytic removal increases at the higher
irradiation intensities on the TiO2 surface and hence more hydroxyl radicals
are produced (Pourata et al., 2009; Liu et al., 2009; Faramazpour et al., 2009;
Kaneco et al., 2009) However, at high light intensities, the reaction rate
becomes independent of light intensity, because of the rate of flux and the
increase in electron-hole recombination rates (Wong and Chu, 2003).
Previous investigations have proved the relationship between the degradation
rate and the light intensity, which is directly proportional to the square root of
the light intensity (Herrmann, 1999; Garcia and Takashima, 2003).

60
2.11.9 Additional oxidants
(i) H2O2 (hydrogen peroxide)
Photo-assisted catalyst mediated degradation, in the combination with H2O2
has been found to be highly effective for the degradation of the water polluting
pesticides such as simazine, propazine, terbutryn, alachlor, molinate, trifuralin,
parathion, phorate, malathion, methamidophos, diazinon, isodrin, aldrin, and
DDTs, as shown in Table 2.7 (Devipriya and Yesodharan, 2005; Wei et al.,
2009; Liu et al., 2009; Miquel et al., 2012). The reaction to generate the
reactive species is written as follows (Radwan, 2005);
H2O2 + e-CB OH
● + OH
- (2.26)
H2O2 + OH● H2O + HO2
● (2.27)
HO2● + OH
● H2O + O2 (2.28)

61
Table 2.7 Comparing % removal of pesticides by photocatalytic treatments
before adding H2O2 and after adding H2O2 (Miquel et al., 2012)
(ii) K2S2O8 (potassium persulphate)

62
S2O82-
+ e-CB SO4
2- + SO4
●- (2.29)
SO4●-
+ H2O SO42-
+ OH● + H
+ (2.30)
(iii)KBrO3 (potassium bromate)
BrO3- + 2 H
+ + e
-CB BrO2
● + H2O (2.31)
BrO3-+ 6H
+ + 6e
-CB [BrO2
-, HOBr] Br
- + 3H2O (2.32)
2.11.10 Mode of the catalyst application: the suspended or immobilised
system
Photoreactors can be categorised into 2 main classes which rely on the mode
of the catalyst application: the suspended and the immobilised system. These
types will be explained more in Section 2.12. The suspended TiO2 catalyst has
superior photocatalytic efficiency compared to the same catalysts immobilised
on substrate (Parra et al., 2004; Pizarro et al., 2005; Madani et al., 2006;
Lhomme et al., 2008; Senthilnathan and Philip, 2009; Ahmed et al., 2011).
This can be explained by enhanced mass transfer in the suspended form.
However, the need of the catalyst extraction seems to be the drawback of this
system. The immobilised catalyst is slightly easier to handle, but the fouling
and the deactivation of catalyst cause significant expenses because the activity
of the catalyst drops after the reaction proceeds. The density of the hydroxyl
groups on the catalyst surface decreases and strongly adsorbed intermediates
occupy the active sites on the catalyst surface (Dutta and Ray, 2004).

63
2.12 Photocatalytic reactor
A literature review of reactor designs for photocatalytic oxidation was carried
out in order to understand which designs are more optimal for continuous
operation. Reactors can be classified into two types: reactors that use a catalyst
in suspension and reactors that use an immobilised catalyst fixed on a film or
other suspended material (Radwan, 2005).
2.12.1. Reactors using suspended solid photocatalysts
2.12.1.1 Annular reactor with horizontal flow
An annular reactor is composed of the vertical UV lamps centre inside a
quartz tube surrounded by the polluted water, in which all the light is emitted
reasonably uniformly along the tube’s length (Figure 2.21) (Li Puma, 2005).
The system includes a mechanically stirred tank with the air bubbling to
supply the oxygen to the reaction (Bickley et al., 2005).
Figure 2.21 Geometry of annular photoreactor (Li Puma, 2005)

64
2.12.1.2 Thin-film slurry photocatalytic reactor (TFS)
TFS reactors can achieve a high light absorptivity for a TiO2 slurry suspension
and can operate at the high catalyst concentration. As a result of the high mass
transfer rate of the reducing agent oxygen, this falling film reactor has a higher
conversion rate than the annular type reactor. The illustration of a TFS is
shown in Figure 2.22. One example of a thin-film, slurry, photocatalytic
reactor is the Fountain photoreactor. The liquid film emerges from the nozzle
in the shape of smooth, approximately horizontal and radially expanding water
fountain, as shown in Figure 2.23. The radiation source is situated above the
water fountain and can be either from solar radiation or artificial light sources.
The photon collection efficiency of this new photoreactor can be higher than
that of a flat-plate falling-film photoreactor (Li Puma and Yue, 2001).
However, this reactor has the disadvantage that it requires catalyst separation
post treatment.
Figure 2.22 Geometry of TFS (Thin-film slurry photoreactor) (Li Puma, 2005)

65
Figure 2.23 Geometry of water fountain photoreactor (Li Puma, 2005)
2.12.2 Fixed catalyst systems
2.12.2.1 Thin Film Fixed Bed Reactor (TFFBR)
Thin film fixed bed photocatalytic reactors (TFFBR) are one of the first solar
reactors that do not require a light concentrating system and thus are able to
utilise diffuse as well as direct portions of solar UVA irradiation during the
photocatalytic process. The most important part of a TFFBR is the sloping
plate coated with the photocatalyst which is brought into contact with the
polluted water which is present as a thin film over the plate surface (~100 μm).
The flow rate is controlled by a cassette peristaltic pump and varies from 1 to
6.5 l/h. From Figure 2.24, this configuration benefits from a very large
illuminated catalyst surface area per unit volume of the reactor and the
minimal mass transfer limitation (Bahnemann, 2004). The catalyst particles
are bonded to an immobilized surface to avoid the problem of catalyst

66
recovery (Zayani et al., 2009; Feitz et al., 2000). Pollutants have to be
transported to the surface by convective motion and molecular diffusion. High
intensities of irradiation are needed to enhance the rate of the degradation
(Bickely et al., 2005).
Figure 2.24 Flowchart of TFFBR (taken from Bahnemann, 2004)
2.12.2.2 Packed bed reactor (PBR), fixed-bed reactor and fluidised bed reactor
Photocatalyst particles are supported on larger particles for example, glass
beads, sand, or other packing materials. This is advantageous because the
catalyst is both fully suspended and supported, which gives very high
photocatalyst surface areas and mass-transfer rates. At the same time, there is
no need for a post-treatment separation process. Therefore, fluidised and fixed
bed photoreactors have received significant attention, especially for gas-phase
photoreactions, due to the high degree of interaction between the photocatalyst

67
particles and the reactant phase (Rowan and Andrew, 2009). It has been
reported that titanium dioxide in a fluidised-bed reactor system has a higher
activity compared to that of a fixed-bed (Alexander et al., 2000).
2.12.2.3 Fibre Photoreactor (FP) and Optical Fibre Photoreactor (OFP)
In a fibre photoreactor, a photocatalyst is coated onto the fibres and immersed
in the reactant fluid as shown in Figure 2.25. In the case of an optical fibre
photoreactor (OFP), the parabolic dish is located in the centre, as shown in
Figure 2.26, to act as the convex secondary reflector in order to concentrate
the sunlight into a bundle of optical fibres. It has one advantage over other
photoreactor designs in that it separates the light gathering and the
photocatalytic components of the reactor. The light can be collected remotely
and transmitted a great distance through the optical fibres to the vessel
containing the reactant fluid and the photocatalyst. This allows this
photoreactor design to be used within buildings, as long as the light gathering
device and the connecting fibre optics are suitably placed (Rowan and
Andrew, 2009).

68
Figure 2.25 Illustration of Fibre Photoreactor (FP) (Dijkstra et al., 2003)
TiO2 is a thin film on the fibres (less than 1.3 μm). The fibre has thickness = 1
mm. The length of the fibre is 0.7 m, which is equal to the illuminated length.
The light is carried into the liquid by a large number of fibres. The reactant
fluid is immerse at the inlet and flows pass on the fibre to the outlet.
Figure 2.26 Layout for Optical Fibre Photoreactor (OFP) (Rowan and
Andrew, 2009) An 24 inch parabolic dish with 3.5 inch convex secondary
reflector to concentrate sunlight into bundle of 537 quartz optical fibres
coated with a photocatalyst and immerse into the reactant fluid.

69
2.12.2.4 Rotating Disc Reactor (RDR)
A vertically orientated, radially rotating disk is half submerged in the reactant
fluid with the photocatalyst supported on the disk, as illustrated in Figure 2.27.
As a section of the surface of the disk emerges from the reactant fluid, it
carries a thin film of the liquid. The exposed surface of the disk is illuminated
using UV-lamps, with the thin film on the disk’s surface allowing an efficient
mass transfer between the reactant fluid and both the photocatalyst and the
atmosphere (Dionysiou et al., 2000; Rowan and Andrew, 2009). The
limitation of this process could be the short residence times available for the
oxidation process.
Figure 2.27 Horizontal RDR (Rowan and Andrew, 2009)
2.12.2.5 Photocatalytic Membrane Reactors (PMRs)
The photocatalytic membrane reactors (PMRs) constitute a hybrid
photocatalytic membrane reactor system which uses the membrane filtration
effluent
reactant feed
irradiation source

70
unit to configure into the different positioning with the photocatalytic reactor,
as shown in Figure 2.28. It can be either a slurry-type or deposit onto
membrane that suspends in the water. In the system of an immobilised PM, the
membrane module functions as the support for the photocatalyst particles and
as the barrier against the different organic molecules in the reaction water. The
membrane also helps in the resistance of the photocatalyst particles and
organic molecules or the intermediate compounds not to be degraded in the
slurry PMRs. The photocatalytic reaction takes place on the surface of the
membrane or within its pores. It has been reported that the photo-oxidation
efficiency of an immobilised PM was higher than in the case of the suspended
catalyst. However, there will be severe membrane damage owing to the
immobilising particles (Chong et al., 2010).
Figure 2.28 Schematic of submerged membrane photocatalytic reactor
(Chong et al., 2010)
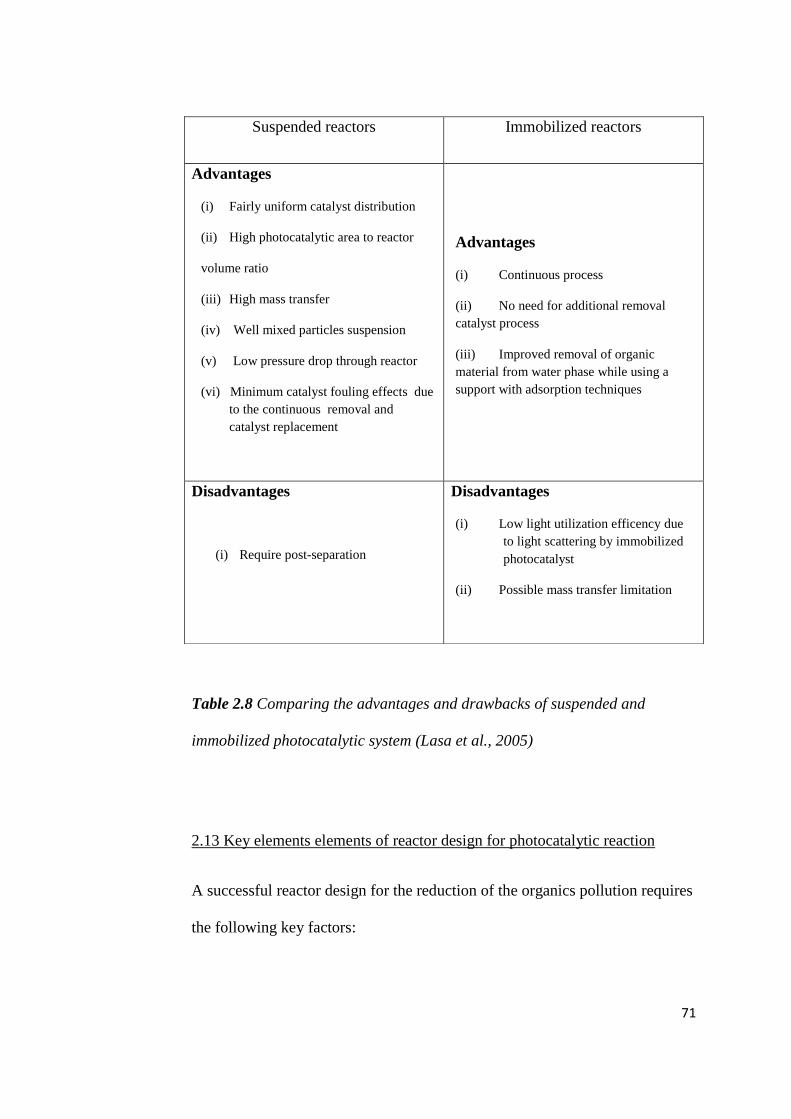
71
Table 2.8 Comparing the advantages and drawbacks of suspended and
immobilized photocatalytic system (Lasa et al., 2005)
2.13 Key elements elements of reactor design for photocatalytic reaction
A successful reactor design for the reduction of the organics pollution requires
the following key factors:
Suspended reactors Immobilized reactors
Advantages
(i) Fairly uniform catalyst distribution
(ii) High photocatalytic area to reactor
volume ratio
(iii) High mass transfer
(iv) Well mixed particles suspension
(v) Low pressure drop through reactor
(vi) Minimum catalyst fouling effects due
to the continuous removal and
catalyst replacement
Advantages
(i) Continuous process
(ii) No need for additional removal
catalyst process
(iii) Improved removal of organic
material from water phase while using a
support with adsorption techniques
Disadvantages
(i) Require post-separation
Disadvantages
(i) Low light utilization efficency due
to light scattering by immobilized
photocatalyst
(ii) Possible mass transfer limitation

72
2.13.1 High Mass Transfer
In a slurry system (non-fixed catalyst), mass transfer is increased by mixing of
the pollutants through the turbulence and baffles. In the fixed-bed (or fixed
catalyst) and fluidised-bed, mass transfer is controlled by the variation of the
liquid and the gas flow rate.
2.13.2 Photocatalyst activation
Based on analysis of the literature, catalyst illumination is probably the most
important factor. The UV-light penetration depth is limited due to the
absorption by both catalyst particles and pollutants. Photocatalytic reactions
occur on the catalyst surface and the catalyst can either be dispersed in the
liquid or can be immobilised on the surfaces, but the contact between the
catalyst and the contaminant is essential.
2.13.3 Oxygen content
The oxygen content in the water is defined by the solubility at saturation
conditions and regarded to be relatively constant. However, oxygen or air is
required to replace that used in the oxidation process. Without replenishment,
the overall reaction rate could be limited by the reduction of dissolved oxygen.
Low oxygen solubility in the water leads to a low rate of oxygen reduced by
the controlled-band electrons; an accumulation of the electrons in a
semiconductor would result. This accumulation enhances the rate of
recombination of the photogenerated electrons and the holes (Sobczynski and
Dobosz, 2001).

73
2.14 Supercritical water hydrothermal synthesis (ScWHS)
Continuous supercritical water synthesis is a relatively novel technique to
produce the ultra fine particles of metal oxides (Poliakoff, 2001; Cabanas et
al., 2001; Cabanas et al., 2007; Chudoba et al., 2008; Matsui et al., 2008;
Atashfaraz et al., 2007; Lester et al., 2006; Edwards et al., 2006; Sue et al.,
2004; Kawasaki et al., 2009; Hobbs et al., 2009; Lu et al., 2012).
Supercritical water has been used as a solvent or antisolvent for particle
formation because it offers the following advantages (Li, 2008; Aimable et al.,
2009)
(i) Solvent properties that can be tuned by changing pressure or
temperature
(ii) Reduced viscosities and increased mass transfer
(iii) Dramatic modification of the solvent strength by the dissolution of a
dense gas
(iv) Control of the super-saturation via the pressure, the temperature and
the anti-solvent
(v) Relatively low synthesis temperatures
This method includes the chemical reactions to form the particles and adjust
the direction of the crystal growth, the morphology, the particle size and the
size distribution, because of the controllability of the thermodynamics and the
transport properties by pressure and temperature.
The supercritical hydrothermal technique has an advantage in that it produces
fine powders with high purity, controlled stoichiometry, high quality, narrow

74
particle size distribution, controlled morphology, uniformity, less defects,
dense particles, high crystallinity, excellent reproducibility, controlled
microstructure and high reactivity without sintering issues (Byrappa and
Adschiri, 2007).
2.15 ScWHS Mechanisms
ScWHS involves the mixing of an aqueous metal salt stream with a
supercritical water stream within a continuous reactor to produce the nano-
sized metal oxide particles. When the water is heated to its critical point (Tc =
374 ºC, Pc = 22.1 MPa), it changes from a polar liquid to a fluid with a low
dielectric constant and low pH. The concentration of H+ and OH
- increases.
Under these conditions, a hydrolysis of the metal salts is immediately followed
by a dehydration step
Hydrolysis: MLx + xOH- M(OH)x + xL
- (2.33)
Dehydration: M (OH)x MOx/2 + x/2 H2O (2.34)
In Equation (2.33), a metal salt is first hydrolyzed to metal hydroxide, which is
then dehydrated, according to Equation (2.34), forms metal oxide crystals with
micro- or nano-size by precipitating from the solution. Therefore, supercritical
water promotes a hydrolysis reaction (Equation (2.34)) and enhances a
production of oxide particles.

75
2.16 Conclusion of background and review of literature
This chapter has reviewed the definition, kinetics, mechanisms, materials,
parameters and reactor design of photocatalysis, and also briefly the technique
for synthesising the nanoparticles by supercritical water. Photocatalytic
treatment has been known for many years as a potential option for solving
water pollution, especially that caused by pesticides. The most commonly used
photocatalyst is Degussa P-25 TiO2 due to the superior properties compared to
other photocatalysts. The parameters which affect the photocatalytic reaction
are the crystal phase of TiO2, the pollutant concentration, the TiO2
concentration, O2 concentration, pH, the light wavelength, the light intensity,
the additional oxidants and the operation mode of the reactor. The conclusion
of the influence of each parameter on the degradation rate is shown in Figure
2.29 (Herrmenn, 1999).

76
Figure 2.29 Influence of the different physical parameters which govern the
reaction rate r (r is generally comprised between 1 and 0.1 mmol/h): (A) mass
of catalyst; (B) wavelength; (C) initial concentration of reactant; (D)
temperature; (E) radiant flux (Herrmann, 1999)
Photocatalytic reactor design can be categorised into 2 major types: the
suspended and immobilised catalyst. The reactors which use an immobilised
catalyst have the advantage in that there is no need to employ a separation

77
process after treatment. However, the efficiency of reactors using a suspension
catalyst is still higher than an immobilised catalyst.

78
Chapter 3
EXPERIMENTAL
3.1 Introduction
This chapter describes the experimental procedures used in this thesis for
carrying out photocatalytic oxidation treatment of three specific pesticides that
pollute ground water. Stock solutions of each were made using de-ionised
water. A laboratory scale stirred reactor, thin film fixed bed reactor, and
fluidised bed photoreactor were constructed for these studies. Photographs and
illustrations of these reactors are presented. Experimental reagents, procedures
and all analytical techniques related to this study are also described.
Calibration curves were established using high performance liquid
chromatography (HPLC) in order to accurately quantify results from the peaks
in the chromatography curve relating to the pesticides concentration.
3.2 Chemicals and materials
The materials were obtained from the following sources and were used as
received: P-25 TiO2 (Sigma-Aldrich, UK); Isoproturon, Simazine, and
Propazine (Sigma-Aldrich, UK); Tibald (Titanium (IV) bis (ammonium
lactato) dihydroxide solution 50 wt% in H2O; Sigma-Aldrich, UK);
Acetonitrile > 99% (Sigma-Aldrich, UK); DDSA (Dodecenyl Succinic

79
Anhydride; Fluka, UK); Toluene (Fisher Scientific, UK) Hydrogen peroxide >
30% (Fisher Chemical, UK); 0.45 μm nylon filters (Sartorios, UK).
3.3 Procedure for supercritical water synthesis of TiO2
Precursor and reagent
0.2M of Tibald (Titanium (IV) bis (ammonium lactato) dihydroxide solution
50 wt% in H2O; Sigma-Aldrich, UK) was used as a precursor in this synthesis.
0.005M of DDSA (Dodecenyl Succinic Anhydride; Fluka, UK) in Toluene
(Fisher Scientific, UK) was used as a capping agent, which was introduced at
the capping point as shown in Figure 3.1. Deionised water with 5% H2O2
(Hydrogen Peroxide; Fisher Scientific, UK) was used as a water stream feed.
Peroxide; Fisher Scientific, UK) was used as water stream feed.
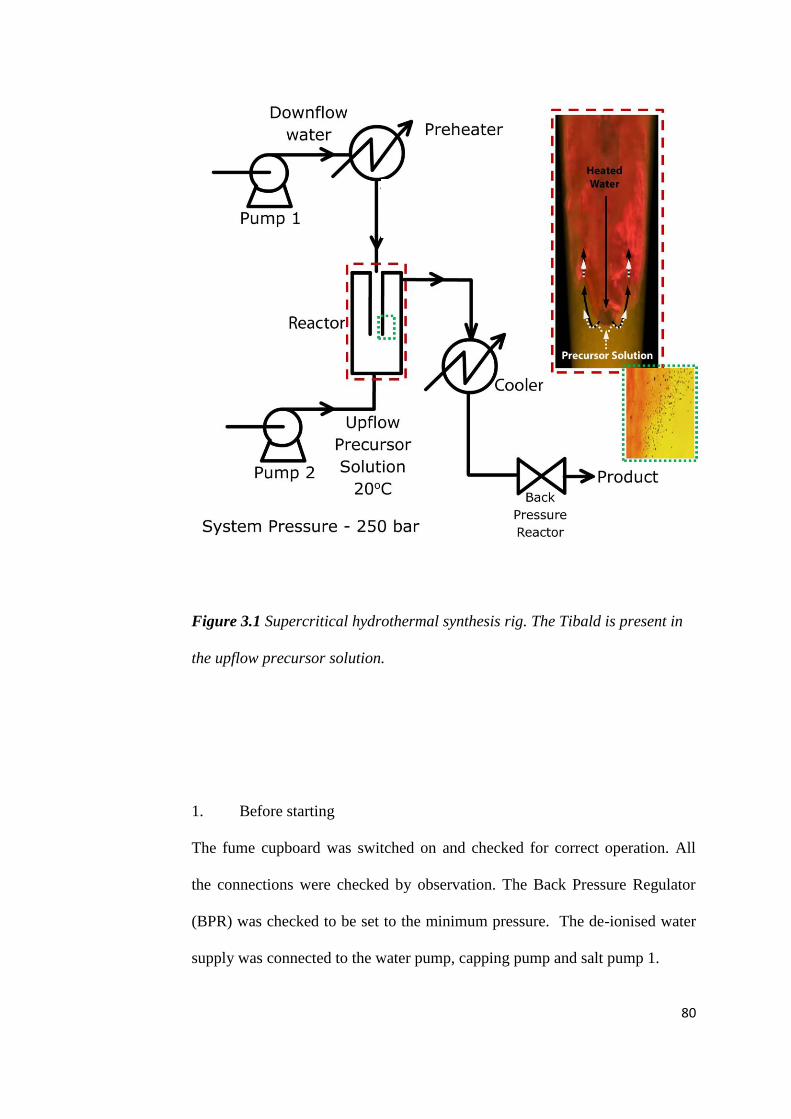
80
Figure 3.1 Supercritical hydrothermal synthesis rig. The Tibald is present in
the upflow precursor solution.
1. Before starting
The fume cupboard was switched on and checked for correct operation. All
the connections were checked by observation. The Back Pressure Regulator
(BPR) was checked to be set to the minimum pressure. The de-ionised water
supply was connected to the water pump, capping pump and salt pump 1.

81
2. Start-up
The main power and the computer were switched on in order to initialise the
Picolog programme used for monitoring the temperature at each point of the
system. The water pump, capping pump and salt pump 1 were switched on at
the flow rate of 20 ml/min. The system pressure was increased using a spanner
on the BPR. At this time, the pressure measured at the pressure transducer and
the pressure gauge was monitored. The BPR was no longer adjusted once the
pressure had reached 240 bars. The cooling water valves were opened to
maximum flow. The water heater was switched on and set to 480 ºC. The
monitoring of the temperature and the pressure on a Picolog programme was
started. When all parameters were stable, the water pump feed was changed to
a 5% H2O2 solution. The salt pump 1 was then changed to feed Tibald and the
capping pump was changed to feed DDSA in the toluene. The flow rate of the
5% H2O2 solution was 20 ml/min. The flow rate of the Tibald solution was 10
ml/min and the flow rate of DDSA in Toluene was 5 ml/min. The sample was
taken when complete mixing of reagents and nanoparticles was observed after
3-5 minutes.

82
3. Shutdown procedure
The heater temperature was set to 0 ºC. All the pumps were switched to a feed
of de-ionised water. The pressure of the system was decreased slowly by
loosening the BPR. During the depressuring process, the BPR inlet
temperature was monitored until it had decreased to below 100 ºC. The
pumps were set to cool down the system. The cooling water valves were
switched off when the temperature had dropped below 150 ºC. The pumps,
computer and the main power were then switched off.
3.4 Thin Film Fixed Bed Reactor System (TFFBR)
Figure 3.2 Schematic of TFFBR photocatalytic reactor

83
The reactor in Figure 3.2 was designed and constructed for this thesis. This
reactor is based on the Thin Film Fixed Bed Reactor (TFFBR) concept which
has the potential advantage of avoiding the need to separate the nanoparticles
from the effluent. A stainless steel plate of 30.5 cm-long, 9 cm-width and 0.05
cm thickness was supported with two vertical parallel plates of 22.8 cm by
30.5 cm. Two 8 watt lamps of UVC (wavelength = 250 nm) and UVA
(wavelength = 350 nm), 30 cm in length, were supported in the parallel
direction, 10 cm above the surface. The TiO2 was fixed on the surface of the
plate to avoid the contamination of the effluent as described in the
experimental procedures. Figures 3.3 and 3.4 show the reactor arrangement.
Figure 3.3 Photograph of the TFFBR photocatalytic reactor
Round-shape distributor
Feed Pump Drain
UV lamp

84
Figure 3.4 Photograph of the reactive area and the water source
Figure 3.5 (a) Photograph of a P-25 TiO2 coated surface on the stainless steel
plate (b) SEM image of P-25 TiO2 coated surface at a magnification 200 μ m
3.4.1 Surface coating method
In this research, there were 2 stainless steel sheets. One was coated with 40%
P-25 TiO2 and the other was coated with 14% synthesised TiO2.
Stainless steel plate
Round-shape distributor

85
Plate 1: 25 g of epoxy resin was mixed with 18 g of Degussa P-25 TiO2 at 80 º
C using a spatula in a fume cupboard. 3 g of hardener was then mixed and
applied to the plate as a thin layer across the surface. A further 10 g of TiO2
was spread on the polymer to increase the concentration of TiO2 particles on
the surface. Figure 3.5 shows the photograph and SEM image of P-25 surface
on the metal sheet. The SEM image at high magnification shows a non
homogeneous layer.
Plate 2: 2.6 g of synthesised TiO2 from ScWHS was mixed with 18.6 g of
epoxy using a spatula in a fume cupboard. As shown in the SEM image at high
resolution in Figure 3.6, the synthesised TiO2 is well distributed.
Figure 3.6 SEM image of synthesised TiO2 coated surface with a scale bar of
20μm

86
3.4.2 Experimental procedures for the TFFBR
1. Before starting
All the connections were checked before conducting the experiments; the
fittings of the tubing must be correctly connected before beginning the
experiment. The position of the round-shaped distributor was checked to make
sure that the water will distribute evenly on the stainless steel plate. The angle
of the UV-lamp was checked by keeping the UV lamp parallel with the slope
of the plate.
2. Start up
The amount of pesticide solution in the reservoir for each experiment was
approximately 400 ml. The UV lamp was switched on 10 minutes prior to the
experiment to allow the lamp to warm up. The feed pump was switched on to
draw the water from the reservoir at either a high flow rate (100 ml/min), or a
low flow rate (20 ml/min), as explained in the operating conditions. The first
sample was taken from the sample port 1 at the time t = 0, shown in Figure
3.2. Then 50 ml of the 1st cycle sample was collect from the sample port 2
after the feed solution had been depleted and the concentration of pesticide in
product was analysed. The by-product solution from the drain container was
poured into the feed solution reservoir; the sample for the 2nd
cycle was
collected at sample port 2. Samples were collected in a similar way until the
5th
cycle.
3. Shut down

87
After finishing the experiments, the surface of the reactor was cleaned by
pumping 1000 ml water through. The UV lamps and pump were switched off.
3.4.3 Operating conditions
1. Polluted water feed at the high flow rate = 100 ml min-1
, at the low
flow rate = 20 ml min-1
2. Photolysis: without any photocatalyst, only under UV irradiation
3. Dark condition: with TiO2 but without UV irradiation
4. At the high concentration of the pesticide solutions: isoproturon,
simazine and propazine concentration = 20 ppm
5. At the low concentration of the pesticide solutions: isoproturon,
simazine and propazine concentration = 2.5 ppm
6. The first cycle requires 25 minutes, then 15, 10, and 5,
respectively for the remaining cycles
7. 2 UVA lamps (each equipped with a Phillips TL 8W BLB, length
= 30 cm , wavelength = 350 nm, 8 watts)
8. 2 UVC lamps (each equipped with a Ultraviolet UV-C HG GBT5,
length = 30 cm , wavelength = 250 nm, 8 watts)
9. The feed pump details : Watson Marlow 604 U/R, maximum
speed: 165 rpm
3.5 Stirred Photoreactor
The photocatalytic degradation of isoproturon, simazine and propazine was
studied through the small scale reactor. The initial TiO2 concentration was 0.5

88
g litre-1
. The initial concentration of each pesticide is 2500 μg litre-1
(2.5ppm).
200 ml of TiO2 suspension with pesticides was put into the small container
which was set on the stirrer at 900 rpm in the black box under 8 watt UVA
lamp. 5 ml of samples were collected every 10 minutes and then filtered
through nylon filters to remove the TiO2 particles, to be promptly analysed by
the Hewlett Packard 1050 series high performance liquid chromatography
system fitted with a diode array detector and autosampler. The HPLC
detection limits are 0.16 μg litre-1
for isoproturon, 3.2 μg litre-1
for simazine
and 7.2 μg litre-1
for propazine. The set-up of the system is shown in Figure
3.7.
Figure 3.7 The set-up of stirred reactor
3.5.1 Operating conditions
1. ‘Dark’ conditions: 0.5 g litre-1
P-25 TiO2 added without any
irradiation source
2. Photolysis: no photocatalyst, only under the UV light
3. At various concentrations of P-25 TiO2: 0.25, 0.5, 1, 2.5, 5, 10 g
litre-1

89
4. UVA lamp (equipped with a Phillips TL 8W BLB, length = 30
cm., wavelength = 350 nm, 8 watts)
5. The magnetic stirrer details : KRET control-visc (Ika werke),
maximum speed 1100 rpm
3.6 Fluidised bed photoreactor system
The fluidised bed photoreactor was designed for use with large scale
experiments. It contains two 120 cm length of 1 inch-diameter quartz cylinder
tubes circled with 2 UVA and 2 UVC lamps operated at 36 watts, as shown in
Figure 3.8. The sintered TiO2 was prepared by heating up 1.6 kg of the P-25
TiO2 to 900 ºC for 2 hours. Then, the sintered TiO2 was carefully transferred
into the photoreactor.
Reservoir

90
.
Quartz tubing
Peristaltic pump
UVA
UVC
Drain port 1 Drain port 2
Air Valve1 Air valve 2
Figure 3.8 Schematic diagram of the fluidised bed photoreactor
Figure 3.9 Photograph of the fluidised bed photoreactor
Compressed air
Flow meter
regulator

91
In this reactor system, 2.5 ppm of one pesticide (isoproturon, simazine,
propazine) was well-mixed with the de-ionized water in a fume cupboard. The
reservoir tank was filled with the feed solution next to the peristaltic pump.
3.6.1 Experimental procedure for fluidised bed photoreactor
1. Before starting
All the connections were checked for leaks before doing the experiments and
the air inlet valves 1 and 2 were in the closed position. The quartz tubing
reactor was fixed in the rig and guaranteed that the discharge of the reactor
was checked for any blockage as was the external ventilation.
2. Start-up
The pesticide solutions (isoproturon, simazine, propazine) were fed into the
quartz tubing reactor by opening the stream water valve and switching on the
peristaltic pump. The water level reached a steady state after waiting for
approximately an hour. The compressed air cylinder was opened to let air pass
upright from the bottom of the quartz tubing. Then, the sintered TiO2 was
applied. The outlet pressure from the gas cylinder was adjusted at the pressure
regulator to introduce a small bubble into the tube. The tubing air inlet valve 1
and 2 were opened (Figure 3.8) and then the air flow meter was adjusted to
ensure the air bubble was spread evenly (0.8 litre min-1
) and the sintered TiO2
was suspended evenly in the tubing. The UV isolation shielding sheet was
completely closed before switching on the UVA and UVC lamps. The samples

92
were taken from both drain ports 1 and 2 every 10 minutes for a period of 1.5
hours.
3. Shutdown Procedure
Both the UVA and UVC lamps were switched off. The air gas cylinder outlet
valve was closed. The tubing air inlet valve 1 and 2 were then closed. The
peristaltic pump was switched off and drain valves were opened to remove
water from the reactor. The reactor was washed, and stored at the ambient
temperature.
3.7 Analytical Techniques
3.7.1 High Performance Liquid Chromatography (HPLC)
HPLC is a chromatography method which is widely used for solution analysis.
HPLC is a dynamic absorption process; it is a separation technique involving
mass transfer between the stationary and mobile phase. The stationary phase is
defined as the immobile packing material in the chromatography column,
which can be a liquid or a solid phase. Firstly, the sample is dissolved in the
mobile phase and then injected into a chromatography column under high
pressure, as shown in Figure 3.10. The interaction between the solute and the
mobile phase results in separation of the components which are detected by
the UV absorption at the specific wavelength. The analytical software shows
different absorption-peak heights and absorption-peak areas at the variable
retention times. The concentration of each component can then be quantified
by using a calibration curve from the set of the peak area data.

93
In this thesis, the samples were filtered through a 0.45 um nylon filter, then
injected and mixed with the mobile phase; the sample was then forced to flow
through the chromatographic column under high pressure. The samples were
promptly analysed using a Hewlett Packard 1050 series high performance
liquid chromatography system fitted with a diode array detector and
autosampler. The optimal separation and the sensitivity for isoproturon,
simazine, and propazine was achieved using a X-Terra RP 18 column of 3.0
mm x 150 mm (particle size 3.5 μm) for the stationary phase, and a mobile
phase of 43% acetonitrile, 57 % water, at a flow rate of 0.7 ml/min, a column
temperature 30 °C, and a detector wavelength 254 mm. 3 injections were
carried out for each sample. The response of the detector to each component
was displayed on a chromatogram.
Figure 3.10 Schematic diagram of HPLC

94
3.7.2 Ultraviolet-visible Spectroscopy (UV-Vis)
Different molecules absorb radiation at different wavelengths. An absorption
spectrum will show a number of absorption bands corresponding to the
structural groups within the molecule.
This technique is based on Beer-Lambert’s law:
A = ε ℓc (3.1)
where A is absorbance (A= log10 (I0/I)), where I0 and I are the intensity (or
power) of the incident light and the transmitted ε: molar absorptivity (L mol-1
cm-1
), ℓ: path length of the sample (cm), c: concentration (mol-1
).
A double-beam spectrophotometer works by sharing the light path to be
directed through the sample and the reference cell, as shown in Figure 3.11.
In this thesis, spectrophotometric measurements were performed to measure
the extinction coefficient of the supercritical water hydrothermal synthesised
titanium (ScWHS TiO2) and P-25 TiO2 suspensions.
The photocatalyst was weighed and suspended in the ultrapure water. The
suspension is maintained under the condition of permanent magnetic stirring
during the course of the spectrophotometric measurement. After that, the
sample is pipetted into quartz cell 2 mm and 10 mm optical path length. The
measurement is taken immediately at the wavelength 310-380 nm. During the
measurement, 2 separate readings are taken for each sample and compared.
After the measurement, the cell was rinsed to eliminate traces of TiO2 left
from the previous run.

95
Figure 3.11 Double beam UV-Vis spectophotometer
3.7.3 Scanning Electron Microscopy (SEM) and Energy Dispersive X-ray
Spectroscopy (EDAX)
SEM is an analytical technique that uses a high energetic electron beam on a
fine scale to examine the materials. In SEM, an electron beam from an
electron source is focused by a fine probe that raster scans over the surface of
the specimen under vacuum. Figure 3.12 shows the electron beam passes
through the scan coils and the objective lens that deflect horizontally and
vertically on the sample surface. As the electrons penetrate the surface,
interactions occur that result in the emission of electrons or photons from or
through the surface. Using a cathode ray tube (CRT), every point that the
beam strikes on the sample is mapped directly onto a corresponding point on
the screen.
Another application of the electron microscopy is to characterise the elements
of a material by Energy Dispersive X-ray Spectroscopy or EDAX. The sample
is bombarded with the electrons from the atoms on the surface of the
specimens. This results in the electron vacancy which is then filled by another

96
electron from a higher shell. To balance the energy difference between the two
electrons, an X-ray is emitted. The EDAX measures the number of emitted X-
rays versus their energy, which is the characteristic of the element.
Figure 3.12 The basic layout of a scanning electron microscope
In this thesis, SEM was used to characterise the surface structure of TiO2 (both
ScWHS and P-25 TiO2) coated the stainless steel plate of TFFBR system.
EDAX was used to determine the possible composing elements.
3.7.4 Transmission Electron Microscope (TEM)
TEM is an analytical technique which uses an electron beam to interact and
pass through a sample in the specimen. The configuration of the TEM system
is shown in Figure 3.13. The electron beam is emitted from an electron source
and is confined by the two condenser lenses. It then passes through the
condenser aperture and hits the sample surface. Scattered electrons pass
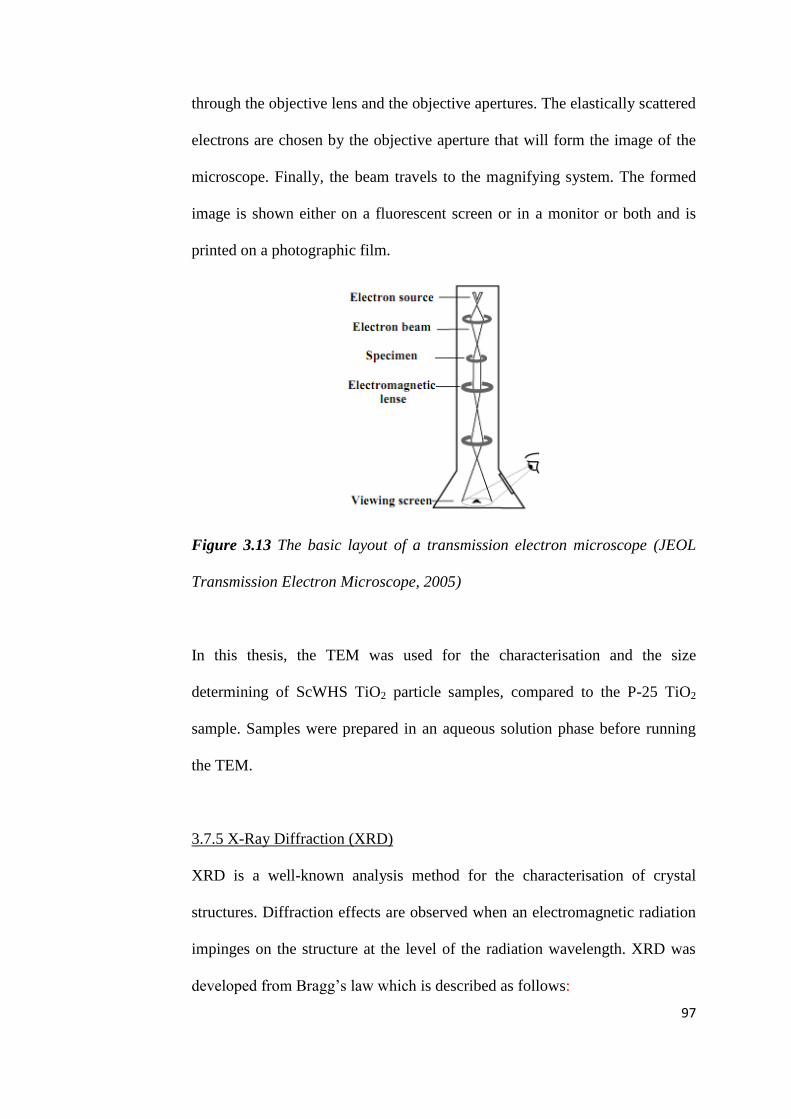
97
through the objective lens and the objective apertures. The elastically scattered
electrons are chosen by the objective aperture that will form the image of the
microscope. Finally, the beam travels to the magnifying system. The formed
image is shown either on a fluorescent screen or in a monitor or both and is
printed on a photographic film.
Figure 3.13 The basic layout of a transmission electron microscope (JEOL
Transmission Electron Microscope, 2005)
In this thesis, the TEM was used for the characterisation and the size
determining of ScWHS TiO2 particle samples, compared to the P-25 TiO2
sample. Samples were prepared in an aqueous solution phase before running
the TEM.
3.7.5 X-Ray Diffraction (XRD)
XRD is a well-known analysis method for the characterisation of crystal
structures. Diffraction effects are observed when an electromagnetic radiation
impinges on the structure at the level of the radiation wavelength. XRD was
developed from Bragg’s law which is described as follows:

98
nλ = 2d sinө (3.1)
Although Bragg's law was used to explain the interference patterns of X-rays
scattered by the crystals, the diffraction has been developed to study the
structure of all the states of the matter with any beam; e.g. ion electrons,
neutrons, and protons, with a wavelength similar to the distance between the
atomic or the molecular structures of the interest. Because a pure substance
has a unique diffraction pattern, the powder diffraction method is suitable for
the characterisation and identification of the polycrystalline phases. The
sample is pressed into a sample holder to create a smooth flat surface. When
an X-ray beam hits an atom, the electrons around the atom start to oscillate
with the same frequency as the incoming beam; this results in constructive or
destructive interference, depending on the structure. Planes going through
areas with high electron density will reflect strongly, planes with low electron
density will give weak intensities. The schematic diagram of the XRD is
shown in Figure 3.14.

99
Figure 3.14 Schematic diagram of XRD (Connolly, 2007)
In this research, XRD was performed on the ScWHS TiO2 at the different
sintering temperatures, to see how the structure changes after increasing the
sintering temperature. This information has a significant role in explaining the
properties of ScWHS TiO2.
3.8 Calibration curves for pesticides quantification
High performance liquid chromatography (HPLC) is an analytical technique
(as explained in Section 3.7.1) which is used to determine the concentration of
chemical solutions by measurement of the area of the peak. The Y-axis
represents the magnitude of the detector signal (mAU) and X-axis shows the
retention time (min). The data was compiled by the diode array detector which
is one part of the HPLC analysis shown in Figure 3.10. The system was
operated using the Chemstation software and used for the sample analysis

100
during photocatalytic experiments. For isoproturon, simazine and propazine,
HPLC was operating under the following conditions:
In theory, HPLC was an instrument that separated the composition of a sample
by the interaction of the solute with the mobile phase and the stationary phase.
These interactions depend on the polarity, which is related to the functional
groups, hydrophobic (dispersive), electronic charge such as dipole-dipole and
ionic, and molecular size.
The area of the peak is proportional to the concentration of the pesticide. The
height and width of the peak depend on how fast the pesticides move during
injection. The attraction force of the solute with the mobile phase and the
stationary phase determines how slow the solute comes out. If the shape of the
peak is tall and thin, this means the separation process was speeded up.
The results are illustrated by the peaks of the chromatography, shown in
Figure 3.15 for isoproturon, simazine and propazine. It can be claimed that
simazine came out first and then isoproturon and finally propazine. The
retention times of these three pesticides are different related to the molecular
Column Type X-Terra RP 18 column
Size of column 3.0 mm x 150 mm (particle size 3.5 μm)
Mobile phase composition 43% acetonitrile, 57 % water
Flow rate 0.7 mL/min
Column temperature 30 ˚C
Detector wavelength 254 mm

101
weight and the polarity; the times also depend on the mobile phase, the type of
column and the injection volume. For this X-Terra column with acetonitrile
43% and water 57% as mobile phase, the retention time was 6.27 min for
isoproturon, 4.89 min for simazine, and 7.2 min for propazine, as shown in
Figure 3.15. Simazine and propazine had similar structures, except the radical
molecule was different (Trajkovska et al., 2004).
Figure 3.15 Overall chromatograph peak at concentration 5 ppm (5000
μg/L): blue line-isoproturon, green line-simazine, red line-propazine. The Y-
axis show magnitude of detector signal (mAU) and X-axis show retention time
(min)

102
Compound R1 R2 R3
simazine Cl NH-C2H5 NH-C2H5
propazine Cl NH-CH(CH3)2 NH-CH(CH3)2
Figure 3.16 Structure of triazines (Trajkovska et al., 2004)
Compound Molecular weight
isoproturon 206.3
simazine 201
propazine 229.71
Table 3.1 Comparing molecular weight of three chosen pesticides
From Figure 3.16 and Table 3.1, it can be seen that propazine has the highest
molecular weight when compared to the other pesticides. In terms of the
polarity, simazine has the smaller hydrophobic part as R3 of simazine is
shorter than R3 of propazine (Figure 3.16). Then acetonitrile and water, a
mobile phase, had a stronger attractive force to simazine than propazine. This
meant that simazine emerged from the column first.
However, this retention time is quite different from that reported by others in
2006 (Gora et al., 2006), as shown in Figure 3.17, which used the different
column and HPLC conditions. However, the orientation of the peak was still
in the same order; first simazine then isoproturon and finally propazine.

103
In this HPLC analysis, the concentration of pesticide in the range of 2500-
20,000 μg/litre was tested.
The calibration curves for these three pesticides were made by known
concentration of isoproturon, simazine and propazine stock solutions which
were related to the area under the chromatograph peaks, as illustrated in
Figures 3.18, 3.19 and 3.20. For the same pesticide concentration, i.e. 2500-
20,000 μg litre-1
, the resulting area was in the range of 100 for isoproturon, 12
for simazine, and 10 for propazine.
The response factor (RF) is the ratio between the signal produced by the solute
and the quantity of solute which produces the signal. RF of each chemical is
individual value. The response factor (RF) can be expressed on a molar,
volume or mass basis:
RFi = Ai RF std (3.2)
Ast
A is peak area and the subscript i indicates the sample and the subscript st
indicates the standard. The RF value was used to calculate the concentration of
sample when the peak area was known. RF can be found from the relationship
between peak area (A) and concentration (C, μg/l or ppm), as follows:
A = RF*C (3.3)
1) for isoproturon

104
From Figure 3.18, an equation from the calibration curve is
A = 4.5273 C
Therefore, RF = 4.5273
2) for simazine
From Figure 3.19, an equation from the calibration curve is
A = 0.3886 C
Therefore, RF = 0.3886
3) for propazine
From Figure 3.20, an equation from the calibration curve is
A = 0.4082 C
Therefore, RF = 0.4082
For these calibration curves, 3 injections per vial were carried out for
each sample. The error bars in the graphs were calculated by the
instrumentation error 5%.

105
Figure 3.18 Isoproturon calibration curve
Figure 3.19 Simazine calibration curve
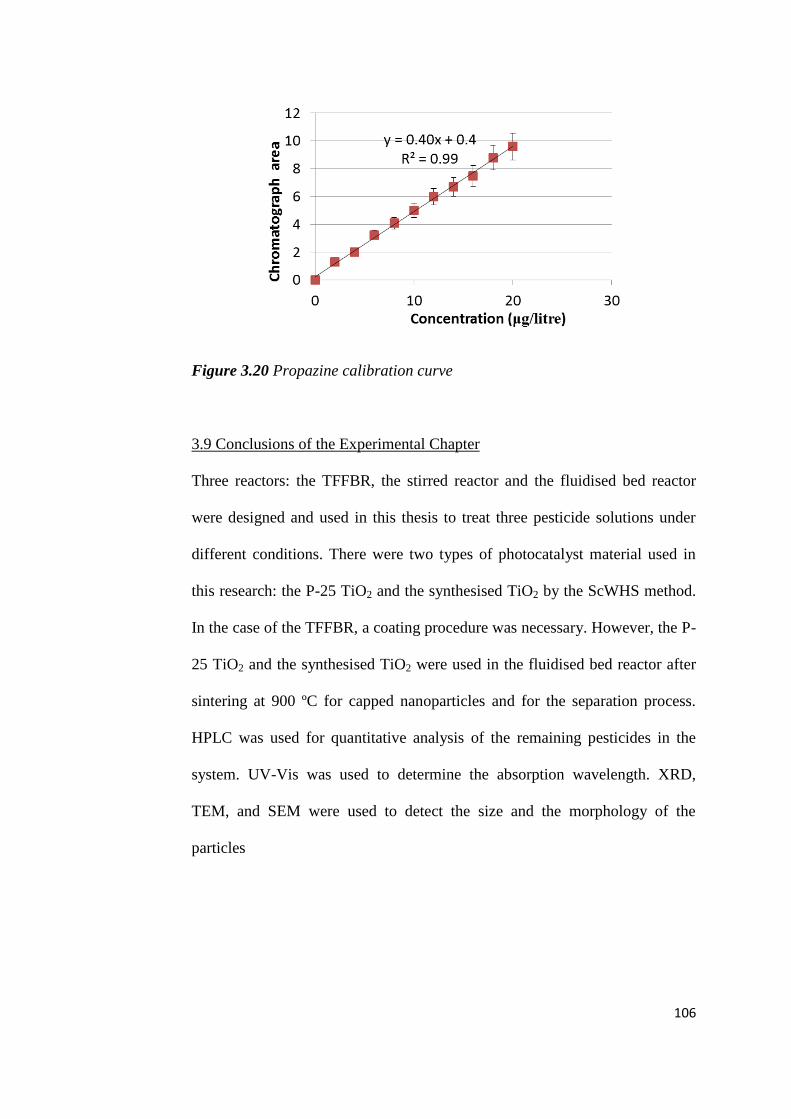
106
Figure 3.20 Propazine calibration curve
3.9 Conclusions of the Experimental Chapter
Three reactors: the TFFBR, the stirred reactor and the fluidised bed reactor
were designed and used in this thesis to treat three pesticide solutions under
different conditions. There were two types of photocatalyst material used in
this research: the P-25 TiO2 and the synthesised TiO2 by the ScWHS method.
In the case of the TFFBR, a coating procedure was necessary. However, the P-
25 TiO2 and the synthesised TiO2 were used in the fluidised bed reactor after
sintering at 900 ºC for capped nanoparticles and for the separation process.
HPLC was used for quantitative analysis of the remaining pesticides in the
system. UV-Vis was used to determine the absorption wavelength. XRD,
TEM, and SEM were used to detect the size and the morphology of the
particles
107
Chapter 4
PHOTOCATALYTIC DEGRADATION
OF PESTICIDES USING A THIN FILM
FIXED BED REACTOR
4.1 Introduction to TFFBR results
This chapter discusses the results from the degradation of a range of pesticides
(isoproturon, simazine, and propazine) using a thin film fixed bed reactor
(TFFBR). Previous application of similar thin film reaction systems for the
reduction of pesticides was discussed in Section 2.12. TFFBR is one type of
immobilized catalyst reactor. In this reactor, the photocatalyst particles are
bonded as the top layer of the bed, which is set as a sloping plate. The feed
solution is controlled by a peristaltic pump and then covers the plate as a thin
film. This system is attractive for application in the photocatalytic degradation
of pesticides because such a technique does not require a light concentrating
system and catalyst separation process after treatment. In the past, TFFBR has
been used in many studies (Zayani et al., 2009; Bahnemann et al., 2004;
Bickley et al., 2005).
Details of the thin film reactor used in this study, how the catalysts were
loaded onto the plates and the experimental conditions have been described in
Section 3.4. A detailed description of the analytical techniques used to

108
quantify the degradation of the three pesticides studied was presented in
Section 3.8. The research described in this chapter investigates and describes
the performance of different catalysts (commercial P-25 TiO2 and the
synthesised TiO2) and UV wavelengths on the three pesticides studied, in
order to determine the effectiveness and optimal operation conditions for the
TFFBR.
4.2. Aims and Objectives of TFFBR experiments
The objectives of this chapter are to determine and optimise the performance
of the thin film fixed bed reactor (TFFBR) for the removal of pesticides from
water. Experiments using the TFFBR were conducted by varying the
experimental conditions to determine the optimum conditions for operation.
Analysis of the treated pesticide solutions was conducted to determine the rate
of reaction of the different pesticides. Full details of the experimental
procedures used for the TFFBR and the analysis and quantification of the
pesticides have been presented in Section 3.4. and Section 3.8, respectively.
(i) Determination of the loss of pesticide from aqueous solution in the
presence of catalyst, but absence of UV light.
(ii) Determination of the photocatatlytic rate of pesticide degradation in
the presence of catalyst and UV irradiation.
(iii) Evaluation of the influence of different feed flow rates and pesticide
concentration on the rate of pesticide loss.

109
(iv) Investigation of the pesticide removal performance of two different
catalyst types on pesticides degradation.
(v) Determination the effect of different UV wavelengths (UVA and
UVC) on the rate of pesticide degradation.
(vi) Comparison of the photocatalytic removal efficiency of each pesticide
(isoproturon, simazine, and propazine).
4.3 Characterisation of the TiO2 photocatalysts: Scanning Electron
Microscope (SEM) image and Energy Dispersive X-ray Spectroscopy
(EDAX) data
The SEM images of P-25 TiO2 coated surface and the synthesised TiO2
surface (Figures 3.5 and 3.6, respectively). It was observed at a
magnification of 200 μm, particle size of the synthesised TiO2 was much
smaller than that of P-25 TiO2 whereas there was a large agglomerate area
in case of P-25 TiO2. Figure 4.31 and Figure 4.32 show EDAX data and
atomic composition of the P-25 surface and the synthesised surface,
respectively. The data was collected after carrying out the experiments.
This result proved that after photocatalytic reaction occurred, the structure
of the surface of titania changed by reduction and oxidation reaction, based
on photocatalytic reaction as a result of received photon energy from
UVC. Ti2+
had been reduced to TiK as shown in Figure 4.1, the amount of
TiK (Ti after losing electrons) was approximately 50 %.

110
Figure 4.1 EDAX data of surface structure of 40 % wt of P-25 TiO2 on
TFFBR
Figure 4.2 EDAX data of surface structure of 14 % wt of synthesised TiO2 on
TFFBR
In Figure 4.2, EDAX analysis shows the highest peak of the carbon atoms, as
the impurities from DDSA molecules were added in the drying process, which
led to TiK in the synthesised TiO2 being drastically lower than the P-25 TiO2
surface. The other reason why TiK was in lower amounts in the synthesised
TiO2 surface is due to the difference in the initial loading concentrations,
Element Wt% At%
CK 05.62 11.17
OK 40.31 60.16
TiK 49.37 24.61
Element Wt% At%
CK 64.70 73.28
OK 28.45 24.19
TiK 03.11 00.88

111
which was 40 % wt for P-25 TiO2 coated on the stainless steel surface,
whereas, there was only 14 % wt for the synthesised TiO2 on the other plate.
4.4. Control experiments to determine the difference between photolysis and
photocatalytic reaction
Prior to determining the influence of the different variables possible for the
TFFBR, as described in the aims, it is important to conduct control
experiments to determine the loss of any pesticides in the reactor by routes
other than photocatalytic degradation by UV irradiation. An example would
be losses from coating of the pesticide onto the surface of the catalyst and
reactor. To determine these losses control experiments were conducted for the
aqueous solutions at a concentration of 20 ppm of three selected pesticides;
isoproturon, simazine, and propazine. The two different conditions used to
determine the baseline rate of loss of the pesticides are as follows:
(i) in the absence of UV or any light, but in the presence of TiO2
(ii) in the presence of UV, but in the absence of TiO2
All the experiments were conducted separately but using the same TFFBR
design (Chapter 3, Figure 3.2). All experiments were repeated 3 times to allow
for the determination of standard errors which will determine the confidence
level for comparison of the results between the different conditions. The error
bars in the graphs were calculated by using the standard deviation and an
average value of decreased concentration.

112
4.4.1 Determination of the rate of loss of pesticides in the absence of UV
excitation but the presence of the presence of TiO2
The control experiment was conducted without any UV irradiation. Solution
of the three chosen pesticides (isoproturon, simazine, and propazine), with an
initial concentration of 20 ppm at a flow rate of 20 ml min-1
, was fed on P-25
TiO2 stainless steel plate. All experiments were conducted at room
temperature over a total of 5 cycles; each cycle had a retention time of 1.35
min on the plate (Section 4.6).
Figure 4.3 shows the rate of loss of the three pesticides when flowing through
the reactor in contact with P-25 TiO2, but in the absence of UV light. Results
are presented as a function of retention time versus concentration (in % of the
original loading). The results show that the concentration of all pesticides
decreased by approximately 10% after 7 minutes of contact with the TiO2
surface. The rate of loss of the three pesticides appears to be similar and
within the experimental error determined for each of the different molecules.
It is proposed that, as these experiments were conducted in the absence of UV
irradiation or any light source, these losses occured as a result of absorption of
the pesticides from the aqueous phase onto the surface of the TiO2 catalyst.
The significant loss of pesticide concentration (10 % of initial concentration)
of the three pesticides (isoproturon, simazine, and propazine) through
adsorption of the pesticide onto the surface of the catalyst is taken as the
baseline for future experiments conducted in the presence of UV.
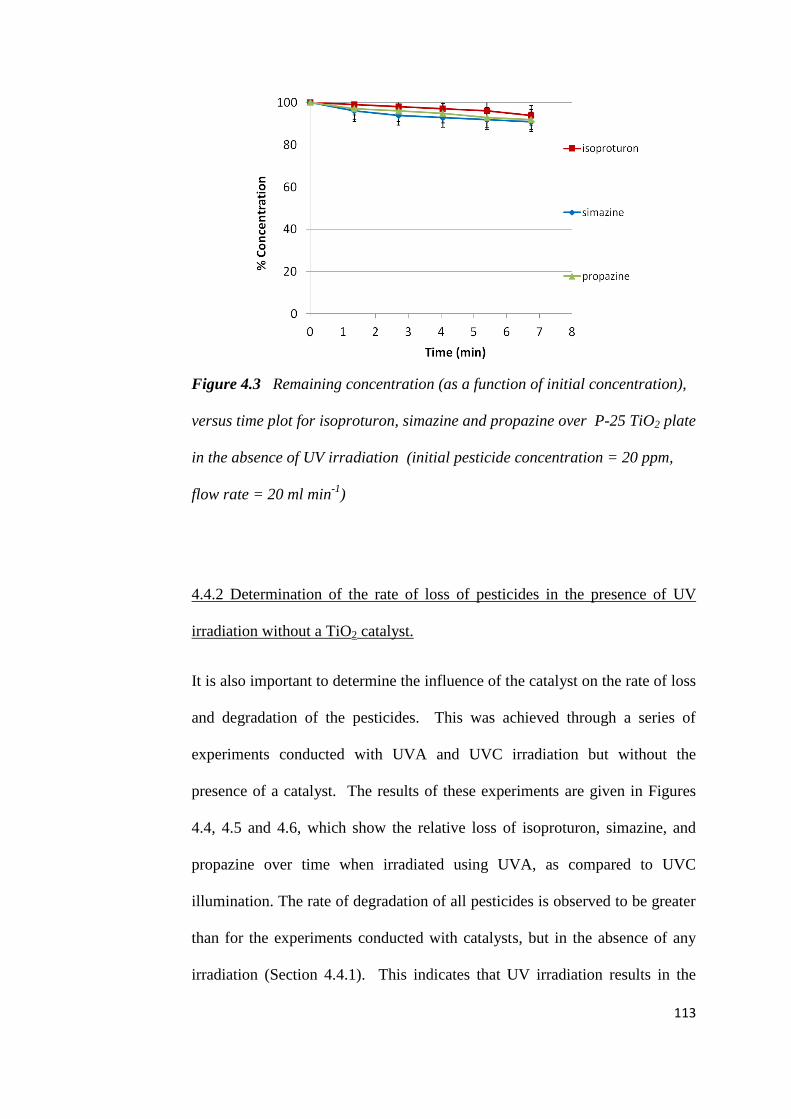
113
Figure 4.3 Remaining concentration (as a function of initial concentration),
versus time plot for isoproturon, simazine and propazine over P-25 TiO2 plate
in the absence of UV irradiation (initial pesticide concentration = 20 ppm,
flow rate = 20 ml min-1
)
4.4.2 Determination of the rate of loss of pesticides in the presence of UV
irradiation without a TiO2 catalyst.
It is also important to determine the influence of the catalyst on the rate of loss
and degradation of the pesticides. This was achieved through a series of
experiments conducted with UVA and UVC irradiation but without the
presence of a catalyst. The results of these experiments are given in Figures
4.4, 4.5 and 4.6, which show the relative loss of isoproturon, simazine, and
propazine over time when irradiated using UVA, as compared to UVC
illumination. The rate of degradation of all pesticides is observed to be greater
than for the experiments conducted with catalysts, but in the absence of any
irradiation (Section 4.4.1). This indicates that UV irradiation results in the

114
degradation of the pesticides, even in the absence of a catalyst. This
phenomenon has been reported previously and will be discussed in more detail
later in this section. From the results it can be seen that the rate of pesticide
degradation for all three pesticides studied, using UVC radiation, occurs at an
apparently higher rate than with UVA. As in Section I.1 (Appendix I), the
student T-test of UVA compared to UVC photolysis of isoproturon, simazine
and propazine, showed that there was a significant difference of decreased
concentration of three pesticides between UVA and UVC photolysis, since the
probability for the two-tail test was higher than critical value (0.05). These
results are consistent with previous findings (Legrinl et al., 1993; Bhatkhande
et al., 2001; Hirahara et al., 2001; Khor, 2004). Photolysis is generally
triggered by the adsorpiton of light by the chemical compound; the most
important factor affecting the UV photolysis is UV wavelength. This
corresponds with the photon theory and can be explained by Planck’s equation
(Equation 2.23); the wavelength is inversely proportional to the energy. UVA
wavelength is approximately 315-400 nm, whereas UVC wavelength is
approximately 100-280 nm, as previously presented in Chapter 2, Section
2.11. Based on this theory, the shorter wavelength the higher the energy,
resulting in more potential for increased activity and a higher probability of
photocatalytic reaction This theory is supported by a previous experimental
study of photolysis and photocatalytic degradation of formaldehyde using
silver titanium oxide in a cylindrical Pyrex reactor (Shei et al., 2008). The
proportion of formaldehyde degraded using UVC photolysis was
approximately 60 % after 400 min, compared to 20% for UVA photolysis.
Similar results were also reported for the photolysis of isoproturon, using an

115
annular photoreactor (Khor, 2004). This study reported that UVC photolysis
reduced the isoproturon concentration by approximately 10% in an hour. In
contrast, no isoproturon degradation was recorded when photolysis was
conducted using UVA. A comparison of UVA photolysis and UVC photolysis
and UVA-TiO2 photocatalysis for the removal of 1, 4-dioxane and the natural
(17-oestradiol, oestriol) and synthetic (17-ethynyloestradiol) oestrogens in
water was carried out by Coleman et al., (2007).
Results of this study demonstrated that degradation under UVC photolysis was
far higher, equal to 100 % after 2 hours, which was significantly greater than
UVA photolysis (30 % in 2 hours).
Figure 4.4 Remaining percentage after loss of isoproturon versus time: effect
of light wavelength on the photolysis reaction (without catalyst), Initial
concentration 20 ppm, flow rate = 20 ml min -1

116
Figure 4.5 Remaining percentage after loss of simazine versus time: effect of
light wavelength on the photolysis reaction of simazine (without catalyst).
Initial concentration 20 ppm, flow rate = 20 ml min -1
Figure 4.6 Remaining percentage after loss of propazine versus time: effect of
light wavelength on the photolysis reaction of propazine (without catalyst).
Initial concentration 20 ppm, flow rate = 20 ml min-1

117
Amongst UVC photolysis of the three pesticides shown in Figure 4.7, the
decreased concentrations of simazine and propazine due to photolysis were
higher than isoproturon (approximately 20%). The set of average values and
variance of data was shown in Section I.4-I.6 (Appendix I). From these results
it can be assumed that photolysis of simazine and propazine was preferred
when using TFFBR with UVC, which has a wavelength equal to 254 nm. Chu
et al., (2009) reported that the photolysis of simazine occurred at a faster rate
when using UVC photolysis. The degradation concentration was
approximately 90% in 5 minutes, which was higher than using TiO2-
photocatalytic, as shown in Figure 4.8. Also, there were the results obtained
for simazine and atrazine by Comber (1999) that photolysis of simazine had
been observed at approximately 300 nm or lower wavelengths. He found that
even at natural sunlight, the intensity was sufficient to promote photolysis.
That means some photolysis degradation of simazine and atrazine can occur
under conditions of normal sunlight. In 2002 and 2004, the photolysis pathway
of simazine was studied by many researchers (Evgenidou and Fytianos, 2002:
Gunasekara, 2004). Photolysis affected molecule breakdown which leads to
alkyl group loss and subsequent production of deisopropylatrazine (B) and
diaminochlorotriazine (C), as shown in Figure 4.9.

118
Figure 4.7 UVC photolysis on isoproturon, simazine, and propazine without
any photocatalyst, initial concentration = 20 ppm, flow rate = 20 ml min-1
Figure 4.8 Simazine degradation by direct photolysis and photocatalysis. 8
UV lamps, initial simazine concentration was 2.5 x 10⁻⁵
M, TiO2 dosage = 0.1
g litre-1, and initial pH = 5.6. (Chu et al., 2009)

119
(A)
(B)
(C)
Figure 4.9 General degradation pathways of simazine (A) where (B) is
deisopropyl atrazine and (C) is diamino chlorotriazine produced by photolytic
loss of alkyl groups (Evgenidou and Fytianos, 2002, Gunasekara, 2004)
In summary, results from the control experiments show that
(i) Experiments on the absence of light, but with a catalyst, result in a
decrease in the concentration of all pesticides at a similar rate. This
was proposed to be as a result of the pesticide coating on the surface of
the catalyst. This loss should be considered in future experiments as
the baseline against which photocatalytic degradation should be
assessed.

120
(ii) Photolysis, reaction in the absence of a catalyst, occurs at a
greater rate in UVC compared to UVA. Isoproturon was more stable
compared to simazine and propazine. The reason why isoproturon has
a different photolysis rate, when compared to simazine and propazine,
was that it has a different functional group which is phenylurea,
whereas simazine and propazine are triazine. The photolysis pathway
of simazine and propazine are different from isoproturon. The main
principle of photolysis of isoproturon is the hydroxylation of the
aromatic ring in ortho and meta position of urea function,
demethylation and methyl oxidation to obtain the formyl compound
(Azizi et al., 2013). However, in the case of simazine, photolysis
affected molecule breakdown, which leads to alkyl group loss and
subsequent production of deisopropylatrazine and
diaminochlorotriazine. These results corresponding to the studies in the
literature review (Comber, 1999; Chu et al., 2009; Evgenidou and
Fytianos, 2002; Gunasekara, 2004)
4.5 Photocatalytic degradation, effect of TiO2 and the feed flow rate
In the previous sections, the rate of loss and degradation of the pesticides has
been reported both with and without catalyst and UV light. Now that the
baseline for these experiments with TFFBR has been established, it is possible
to determine and compare the rate of degradation under photolysis and
photocatalytic reaction conditions.
Figures 4.10 to 4.12 illustrate the rate of loss of isoporturon, simazine and
propazine respectively under irradiation with UVA. Each of the figures

121
compare the rate of pesticide loss as a function of the presence of a catalyst
(photolysis versus photocatalysis) and also the impact of flow rate of the
pesticide solution. The influence of varying the feed flow rate from 100 ml
min-1
to 20 ml min-1
was also compared in these experiments. Different
results were observed for the different pesticides, with the loss of simazine
(Figure 4.11) occuring at a faster rate than for the other two pesticides.
In most cases, the rate of loss of each pesticide was observed to occur at a
faster rate in the presence of the TiO2 catalyst. The influence of flow rate was
observed to vary between pesticides. A similar rate of loss is observed for
isoproturon (Figure 4.10) and propazine (Figure 4.12) for both the high and
low flow rates. However, this trend again differed for simazine (Figure 4.11),
where the high flow rate and reduced residence time reduced the amount of
pesticide loss from the solution.
Figure 4.10 Degradation of isoproturon (initial concentration = 20 ppm)
using P-25 TiO2 under UVA with high and low flow rate (100 ml min-1
and 20
ml min-1
, respectively)

122
Figure 4.11 Degradation of simazine (initial concentration = 20 ppm) using
P-25 TiO2 under UVA with high and low flow rate (100 ml min-1
and 20 ml
min-1
, respectively)
Figure 4.12 Degradation of propazine (initial concentration = 20 ppm) using
P-25 TiO2 under UVA with high and low flow rate (100 ml min-1
and 20 ml
min-1
, respectively)

123
The same experiments were conducted with irradiation by UVC (Figures 4.13
– 4.15). Similar trends were observed as for the UVA experiments as
described previously, for example the greater degradation of simazine and the
increase in reaction rate at decreased flow rate. Similarly to the photolysis
experiments (Section 4.4.2) the rate of degradation of the pesticides is greater
in the presence of UVC. These results and trends will be discussed in more
detail in the following text.
Figure 4.13 Remaining percentage after loss of isoproturon versus time
(initial concentration = 20 ppm) using P-25 TiO2 under UVC irradiation.
High and low flow rate (100 ml min-1
and 20 ml min-1
, respectively)

124
Figure 4.14 Remaining percentage after loss of simazine versus time (initial
concentration = 20 ppm) using P-25 TiO2 under UVC irradiation. High and
low flow rate (100 ml min-1
and 20 ml min-1
, respectively)
Figure 4.15 Remaining percentage after loss of propazine versus time (initial
concentration = 20 ppm) using P-25 TiO2 under UVC with high and low flow
rate (100 ml min-1
and 20 ml min-1
, respectively)

125
The flow rate of the pesticide solution was observed to influence the rate of
degradation of most of the pesticides under both UVA and UVC. The student
T-test for all sets of data was carried out and shown in Section I.10-I.15
(Appendix I). In general, degradation of the three pesticides occurred at a
lower rate under a high feed flow, in comparison to a low feed flow rate. As
the flow rate has a significant effect on the retention time of the pesticide on
the catalyst bed, this is proposed to be the main cause of the difference in
reactivity. The residence time can be calculated as follows:
Assume that layer of the solution = 0.1 cm
Dimension of the plate: length = 12 inch, width = 3.5 inch
Total volume of the solution on the top of plate
= 12 x 2.54 x 3.5 x 2.54 x 0.1 = 27 cm3
Retention time per cycle = total volume = 27 cm3 = 1.35 min
flow rate 20 ml/min
The shorter residence time on the bed at a high flow rate leads to a reduced
probability of photocatalytic. This is an important consideration for the future
design of photocatalytic bed reaction systems, in terms of optimising the bed
size and flow rate to maximise the rate of pesticide degradation. A similar
relationship between residence time and rate of degradation has been
previously reported by Khan et al., (2012) in a series of degradation
experiments of the aquaculture pathogen, aeromonas hydrophila, using P-25

126
TiO2 coated on a pilot scale TFFBR. The researchers varied 3 values of water
flow rate (4.8 litre hr-1
, 8.4 litre hr-1
and 16.8 litre hr-1
) under the sunlight
intensity ranging from 300-1200 w m-2
. When comparing the low (4.8 litre hr-
1) and high (16.8 litre hr
-1) water flowrates, the highest photocatalytic activity
was observed at the low flow rate, being twice that observed at the high flow
rate. Li Puma (2003) proposed a thin-film slurry photocatalytic reactor to be
affected by radiation scattering. It was proposed that, at the higher water flow
rate, the falling film changed from laminar flow to turbulent flow. Therefore,
in the case of a water falling film, laminar flow has a different flow
configuration than that of the turbulent flow, resulting in a different film
thickness. The Reynolds number is different at each position on the plate.
Figure 4.16 is based on the assumptions that (i) water has constant physical
properties (Newtonian fluid), (ii) catalyst particles were uniformly distributed
on the surface (iii) the concentration of solids is not high enough to cause
substantial changes in the rheological properties of water.
In this thesis, the TFFBR was used, which is different from the reactor used in
Li Puma’s research. However, this based on the assumptions above that
consider as only fluid/water flow. When the flow rate is higher, the residence
time is shorter (as per the calculation above). Flow regime will change from
laminar to turbulent flow (as defined in Li Puma, 2003) when the Reynolds
number is higher than 2000. This results in a complex direction leading to
higher shear stress and pressure loss, as shown in Figure 4.17

127
Figure 4.16 Different flow structure (a) FFLF is falling film laminar flow,
(b)PF is plug flow, and (c) SF is slit flow (δ and ξ related to dimensionless
Raynolds number, ξ* = ξ/δ) (Li Puma, 2003)
Figure 4.17 The difference between laminar flow and turbulent flow

128
Under both low and and high flow rate conditions, isoproturon is seen to be
the most stable molecule (Figures 4.18 and 4.19). Simazine and propazine are
lost to a similar degree at high flow rates (Figure 4.18), whilst the loss of
simazine is greater at low flow rates (Figure 4.19). The results obtained at
high feed and low feed flow rate give a different order of reactivity for the
three pesticides, in comparison to photocatalytic studies using a range of
reactors (discussed later in Chapters 5 and 6). In the review of literature, the
stability of the three pesticides were reported to decrease in the following
order (as the remaining % of intial concentration after 15 minutes):
isoproturon 50% < simazine 75% < propazine 90% (Gora et al., 2006). In
Figure 2.11, Gora and co-workers carried out the experiment of single
pesticide component using annular photocatalytic system and discovered that
the highest photocatalytic reaction rate belonged to isoproturon by L-H
kinetics.
Figure 4.18 Comparison of photocatalytic degradation of three pesticides at
high flow rate (initial concentration = 20 ppm) using P-25 TiO2 under UV
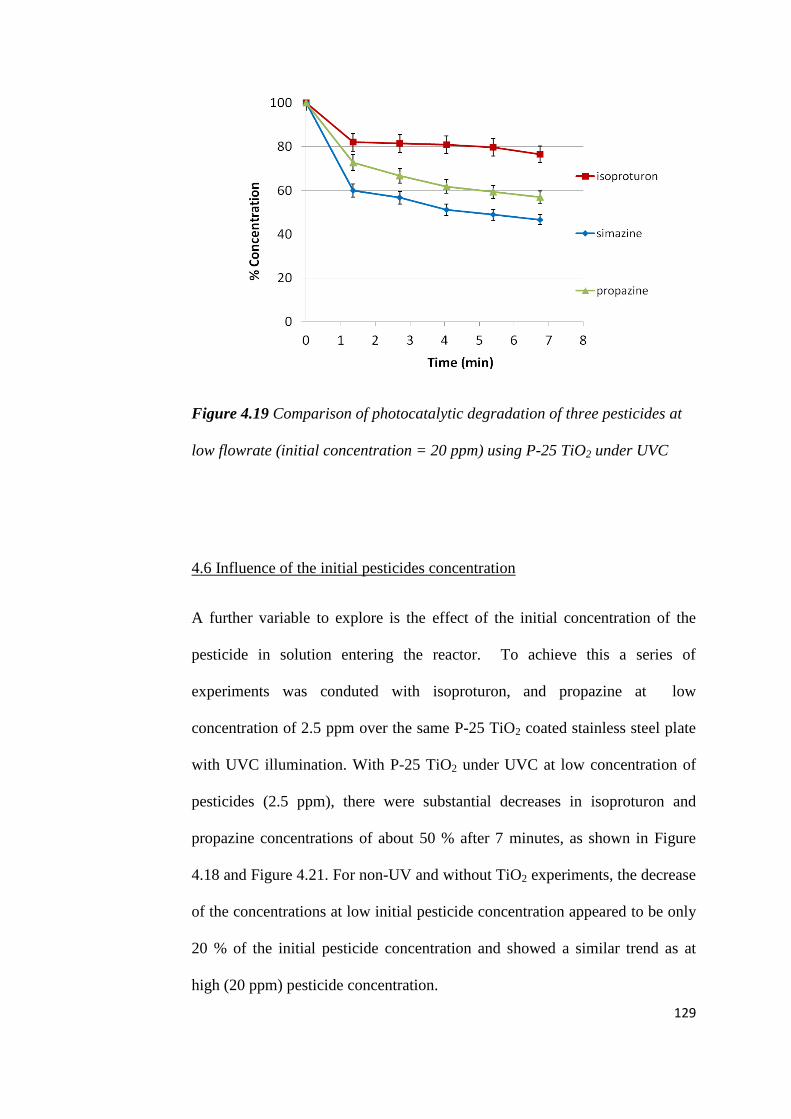
129
Figure 4.19 Comparison of photocatalytic degradation of three pesticides at
low flowrate (initial concentration = 20 ppm) using P-25 TiO2 under UVC
4.6 Influence of the initial pesticides concentration
A further variable to explore is the effect of the initial concentration of the
pesticide in solution entering the reactor. To achieve this a series of
experiments was conduted with isoproturon, and propazine at low
concentration of 2.5 ppm over the same P-25 TiO2 coated stainless steel plate
with UVC illumination. With P-25 TiO2 under UVC at low concentration of
pesticides (2.5 ppm), there were substantial decreases in isoproturon and
propazine concentrations of about 50 % after 7 minutes, as shown in Figure
4.18 and Figure 4.21. For non-UV and without TiO2 experiments, the decrease
of the concentrations at low initial pesticide concentration appeared to be only
20 % of the initial pesticide concentration and showed a similar trend as at
high (20 ppm) pesticide concentration.
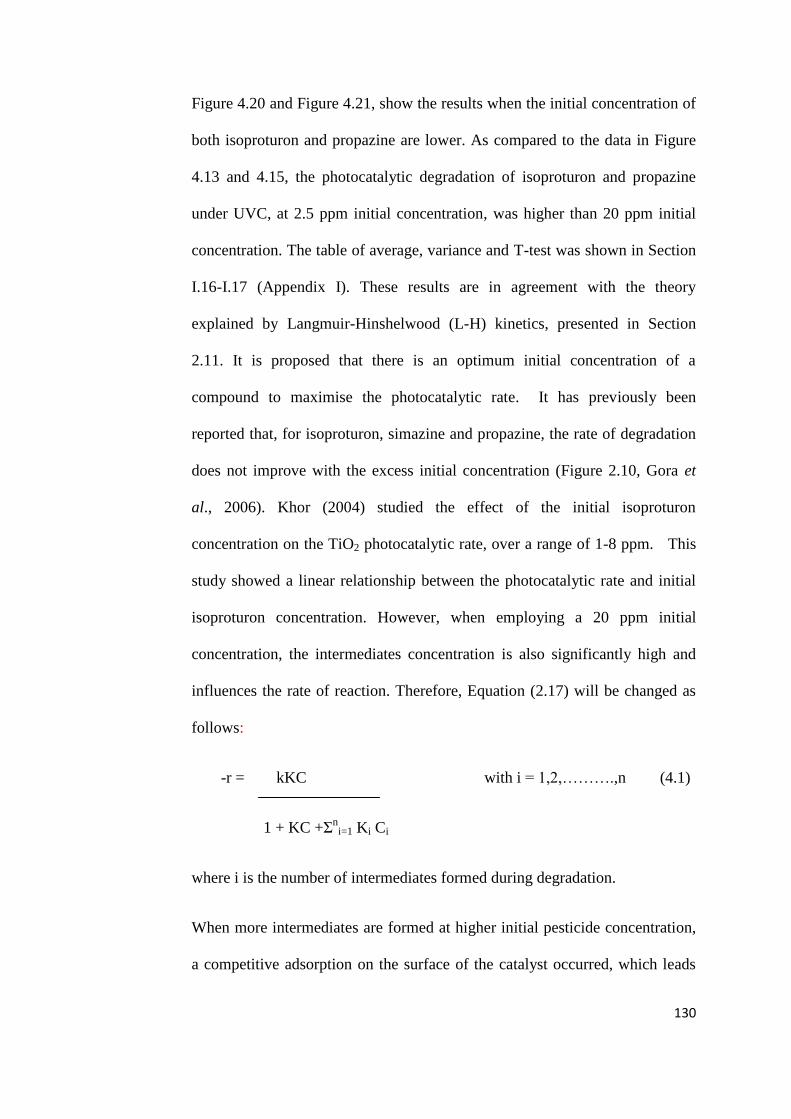
130
Figure 4.20 and Figure 4.21, show the results when the initial concentration of
both isoproturon and propazine are lower. As compared to the data in Figure
4.13 and 4.15, the photocatalytic degradation of isoproturon and propazine
under UVC, at 2.5 ppm initial concentration, was higher than 20 ppm initial
concentration. The table of average, variance and T-test was shown in Section
I.16-I.17 (Appendix I). These results are in agreement with the theory
explained by Langmuir-Hinshelwood (L-H) kinetics, presented in Section
2.11. It is proposed that there is an optimum initial concentration of a
compound to maximise the photocatalytic rate. It has previously been
reported that, for isoproturon, simazine and propazine, the rate of degradation
does not improve with the excess initial concentration (Figure 2.10, Gora et
al., 2006). Khor (2004) studied the effect of the initial isoproturon
concentration on the TiO2 photocatalytic rate, over a range of 1-8 ppm. This
study showed a linear relationship between the photocatalytic rate and initial
isoproturon concentration. However, when employing a 20 ppm initial
concentration, the intermediates concentration is also significantly high and
influences the rate of reaction. Therefore, Equation (2.17) will be changed as
follows:
-r = kKC with i = 1,2,……….,n (4.1)
1 + KC +Σn
i=1 Ki Ci
where i is the number of intermediates formed during degradation.
When more intermediates are formed at higher initial pesticide concentration,
a competitive adsorption on the surface of the catalyst occurred, which leads

131
to a decrease of reaction rate, as described by Equation 4.1 (Khor, 2004, Li
Puma et al., 2007, Toepfer et al., 2006).
Figure 4.20 Remaining percentage after loss of isoproturon versus time
(initial concentration = 2.5 ppm) using P-25 TiO2 under UVC with low flow
rate
Figure 4.21 Remaining percentage after loss of propazine versus time (initial
concentration = 2.5 ppm) using P-25 TiO2 under UVC with low flow rate

132
4.7 Influence of photocatalyst type, comparison of commercial P-25 with TiO2
synthesised in supercritical water
In this section, the performance of the synthesised TiO2 coated plate was
analysed in comparison to the plate coated with commercially available P-25
TiO2. Comparison between the performance of the commercial P-25 catalyst
and TiO2, synthesised using supercritical water hydrothermal synthesis
(ScWHS) (Section 3.3), was achieved by performing experiments under
identical conditions. The synthesised TiO2 was coated on the stainless steel
plate using the same process as previously (Section 3.4.1). The first plate was
loaded with P-25 TiO2 at approximately 40 % wt on the stainless steel plate.
However, the loading amount of synthesised TiO2 on the second plate was
lower, equal to 14 %. Experiments were conducted with two initial pesticide
concentrations, 20 ppm (high concentration) and 2.5 ppm (low concentration).
Photocatalytic degradation was performed under both UVA and UVC
irradiation with a feed flow rate at 20 ml min-1
.
The performance of the two different catalysts studied varied between
different pesticides and their initial concentration in the aqueous solution. The
remaining concentration of the pesticides, after using the synthesised TiO2,
was calculated per gram of photocatalyst and plotted to compare the
photocatalytic efficiency with P-25.
The degradation of isoproturon was observed to be similar for both catalysts
under the conditions studied (Figures 4.22 – 4.25). Taking into account the
experimental errors and uncertainty for the different conditions explored
(concentration, UVA or UVC), the performance of the catalyst can be

133
assumed to be similar for the duration of the experiments studied. Isoproturon
was shown to be the most resistant to photocatalytic degradation for this
reactor (see Section 4.5). Given the low rate of loss of this pesticide during
both photolysis and photocatalytic experiments, the difference in performance
of the catalyst are not that surprising.
Figure 4.22 Remaining percentage (per gram of catalyst) after loss of
isoproturon versus time (initial concentration = 20 ppm) under UVA using P-
25 TiO2 comparing to synthesised TiO2

134
Figure 4.23 Remaining percentage (per gram of catalyst) after loss of
isoproturon versus time (initial concentration = 2.5 ppm) under UVA using P-
25 TiO2 comparing to synthesised TiO2
Figure 4.24 Remaining percentage (per gram of catalyst) after loss of
isoproturon versus time (initial concentration = 20 ppm) under UVC using P-
25 TiO2 comparing to synthesised TiO2

135
Figure 4.25 Remaining percentage (per gram of catalyst) after loss of
isoproturon versus time (initial concentration = 2.5 ppm) under UVC using P-
25 TiO2 comparing to synthesised TiO2
For TFFBR, simazine was found to be more reactive under photocatalytic
conditions when compared to isoproturon. Under UVA or UVC illumination,
the supercritical water synthesised TiO2 had lower photocatalytic efficiency
when compared to P-25 for degrading the pesticide (Figure 4.26 and 4.27).
The largest difference in performance was recorded for the high (20 ppm)
concentration of simazine under UVC conditions, where P-25 resulted in
significantly greater degradation of the pesticide (approx. 50%) when
compared to the synthesised catalyst (20%, Figure 4.26). The decrease in the
concentration of simazine was no greater that observed for the photolytic
degradation of the pesticide under UVC (Figure 4.5). These results suggest
that over the duration of the experiments conducted, synthesised TiO2 catalyst

136
has little activity. This effect was less pronounced in the case of a low
concentration (2.5 ppm) of simazine
Figure 4.26 Remaining percentage (per gram of catalyst) after loss of
simazine versus time (initial concentration = 20 ppm) under UVC using P-25
TiO2 comparing to synthesised TiO2
Figure 4.27 Remaining percentage (per gram of catalyst) after loss of
simazine versus time (initial concentration = 2.5 ppm) under UVC using P-25
TiO2 comparing to synthesised TiO2

137
Figures 4.28 to 4.31 show photocatalytic degradation of propazine under
different conditions, after using the synthesised TiO2 as compared with P-25
TiO2. In the case of propazine, the results differed from those of simazine and
isoproturon degradation under UVC and UVA. The assumption was made
why the decrease of the concentration of propazine, after using the synthesised
TiO2, was higher than after using P-25 TiO2. In the case of the synthesised
TiO2 plate, dodecenyl succinic anhydride (DDSA), a curing epoxy agent, was
added onto the stainless steel plate during drying process before experiments.
The structure of DDSA can be defined as surfactant (composed of non-ionic
and anionic part) which was a hydrophilic copolymer. As shown in Figure
4.32, the non-ionic part composed of nonpolar hydrocarbon chain, which has
the number of carbon atoms nearly equal to that of propazine. Therefore, the
polarity of DDSA and propazine are compatible, leads to London dispersion
force (intermolecular attraction of nonpolar molecules) between DDSA and
propazine. This can be confirmed by research conducted by Matveeva et al.,
(1997) who studied the reverse micelle system, n-octane containing reverse
micelles of sodium bis (2-ethyl-hexyl) sulfosuccinate in binding with
hydrophobic pesticide propazine. They found that the removal concentration
of propazine, by using reverse micelles of sodium bis (2-ethyl-hexyl)
sulfosuccinate, was up to 42 %. This study proves that there is the possibility
of using nonpolar organic solvents to extract propazine. Therefore, this
discovery confirms that the reason why high concentration loss occurred in
propazine experiments using the synthesised TiO2-coated plate could be due to
high removal of propazine by DDSA molecules, a main polymer in the curing
agent.

138
Figure 4.28 Remaining percentage (per gram of catalyst) after loss of
propazine versus time (initial concentration = 20 ppm) under UVA using P-25
TiO2 comparing to synthesised TiO2
Figure 4.29 Remaining percentage (per gram of catalyst) after loss of
propazine versus time (initial concentration = 2.5 ppm) under UVA using P-
25 TiO2 comparing to synthesised TiO2

139
Figure 4.30 Remaining percentage (per gram of catalyst) after loss of
propazine versus time (initial concentration = 20 ppm) under UVC using P-25
TiO2 comparing to synthesised TiO2
Figure 4.31 Remaining percentage (per gram of catalyst) after loss of
propazine versus time (initial concentration = 2.5 ppm) under UVC using P-
25 TiO2 comparing to synthesised TiO2

140
Figure 4.32 Structure of dodecenyl succinic anhydride (DDSA)
4.8 Conclusions of TFFBR experiments
All the results from TFFBR were discussed in this chapter. The experiments
were carried out under controlled conditions, in the presence of TiO2 but
absence of UV. There was an overall loss of 10% of pesticide concentration
(isoproturon, simazine and propazine) due to adsorption onto the TiO2 surface.
However, when adding TiO2 under UV illumination, the photocatalytic
reaction appared and showed a higher degradation rate than in the case of only
UV photolysis (without TiO2) It can be concluded that TiO2 was one of the
main factor exerting a significant effect on the photocatalytic rate. The other
factors are feed flow rate, pesticide concentration, type of catalyst and UV
wavelength. At low feed flow rate (20 ml min-1
), the degradation
concentration was higher due to a longer residence time for photocatalytic
reaction. According to the L-H model, the high initial concentration of
pesticides between 1-8 ppm (in this thesis, the initial concentration of
pesticides = 2.5 ppm) leads to a higher photocatalytic reaction rate. However,
in excess of the initial concentration, at 20 ppm, the photocatalytic reaction
rate is lower due to high amounts of intermediate competitive adsorption on
the TiO2 surface. The synthesised TiO2 from supercritical water hydrothermal
synthesis (ScWHS) had no potential in photocatalytic treatment, as compared

141
to the commercial TiO2, since the results with or without the synthesised
catalyst were similar. The possible reason for this similarity was then
addressed in the EDAX analysis, indicating that the synthesised TiO2 had
considerably high impurities, as compared to P-25 TiO2. UVC showed higher
photolysis and photocatalytic rates than UVA, since UVC has a shorter
wavelength (254 nm) when compared to UVA (365 nm). TiO2 absorbs light at
lower wavelength better than at higher wavelength; this fact also related to
Planck’s Equation that the shorter wavelength corresponds to higher photon
energy. For this reactor, amongst the three pesticides, simazine degraded the
most as was seen in both the photolysis and photocatalytic degradation results,
under UVA and UVC, using a P-25 TiO2 plate.
142
Chapter 5
PHOTOCATALYTIC DEGRADATION
OF PESTICIDES USING
A STIRRED PHOTOREACTOR
5.1 Introduction to stirred photoreactor results
This chapter discusses all the results of pesticide degradation experiments
carried out in the stirred reactor, a small-scale reactor which works under UV
irradiation, as previously described in Section 3.5. The stirred reactor is
suitable for small scale experiments, in order to study the photocatalytic
reaction and the influencing parameters, prior to designing a pilot plant or
large scale reactor. Although the volume size of sample, per experiment, is a
small amount compared to other systems, the efficiency is sufficient to
understand the photocatalytic reaction under difference conditions. It has full
UV irradiation as lamp alignment is in the middle and the container is made of
quartz and placed under an 8 watt UV lamp, as shown in Figure 3.7. The
container held 200 ml of isoproturon, simazine and propazine solution. TiO2
photocatalyst was used at different types and at different concentrations (0.5,
1, 2.5, 5, 10 g litre-1
). The magnetic stirrer at 900 rpm was used in this system

143
to achieve good mixing, leading to a high contacting area between catalyst
molecules and pesticides.
This chapter is divided into 4 parts and investigates: the effect of catalyst
concentration on the photocatalytic degradation, effect of catalyst types on the
photocatalytic degradation, and adsorption of isoproturon, simazine and
propazine onto P-25 TiO2 surface under the absence of UV.
The experimental technique used with the stirred reactor was performed as a
simple batch system with the commercial P-25 TiO2 and the synthesised TiO2.
A detailed description of the experimental set-up was provided in Section 3.5.
For comparison, an in-house synthesised TiO2 was prepared by using
supercritical water hydrothermal synthesis (ScWHS) (Section 3.2 and Section
3.3). The decreased concentration of isoproturon, simazine and propazine were
then evaluated using high performance liquid chromatography (HPLC)
(Section 3.7.1 and Section 3.8).
5.2 Aims and Objectives
The stirred reactor was used in this chapter to study the effects of various
operation parameters on the photocatalytic reaction. The principal aim of this
chapter is to understand the rate of the photocatalytic reaction and investigate
the degradation mechanism. The other aims of this chapter are to find the most
appropriate concentration of P-25 TiO2 and to investigate the photocatalytic
performance of the synthesised TiO2.
The main objectives of this chapter are as follows:

144
(i) Determination of the influence of P-25 TiO2 concentration on the
photocatalytic degradation and optimisation of the most appropriate P-
25 TiO2 concentration.
(ii) Determination of the influence of catalyst types on photocatalytic
degradation (commercial P-25 TiO2 and the synthesised TiO2).
(iii) Evaluation of the pesticide concentration adsorbed on TiO2, under the
absence of UV.
(iv) Explain the photocatalytic reaction and mechanism in terms of the
reaction law and relate the results to the Langmuir–Hinshelwood (L–
H) theory (Section 2.11).
5.3 Control experiments to determination the rate of pesticide loss in the
absence of UV but the presence of TiO2
To determine if loss of the pesticides occurred within the reactor as a result of
coating of the surfaces of the catalyst or reactor, a series of experiments were
conducted in the reactor in the presence of the P-25 TiO2 catalyst, but without
UV irradiation. All three pesticides, isoproturon, simazine, and propazine,
were analysed in order to determine whether the adsorption of the pesticide
onto the catalyst plays any role in the rate of pesticide loss. Figure 5.1 shows
the amount of loss of the three pesticides in the reactor. In all cases, there was
an apparent decrease of 5-10 % in the concentration of the pesticide in
solution. There was no statistical difference in the loss concentration among
the three pesticides, as shown in student T-test in Appendix II. This decrease

145
suggests that there is some adsorption of the pesticides onto the surface of the
P-25 TiO2 catalyst. This observation agrees with previous studies of
isoproturon in a stirred photoreactor containing 0.4 g litre-1
of the TiO2 in
suspension (Khor, 2004). A similar amount of isoproturon was adsorbed onto
the catalyst, as shown in Figure 5.2. The led to the loss of approximately
0.15% of the initial pesticide concentration for an initial concentration of
isoproturon equal to 3 ppm. In the experiments here presented, when using P-
25 TiO2 at the highest concentration of 5 g litre-1
with an initial concentration
of isoproturon 2.5 ppm, the adsorption was lower than 10 %. There was a
study carried out by Gora and co-workers (Gora et al., 2006) that investigated
the dark adsorption (in the absence of UV but the presence of P-25 TiO2) of
isoproturon onto TiO2. They explained that in the initial concentration range of
up to approximately 3 mg litre−1
, isoproturon molecules were adsorbed to be a
mono layer, a result which fitted with Langmuir’s model, Equation (5.1).
When the concentration increased, there was a multilayer adsorption allowing
a larger coverage onto TiO2.
Ceq = 1 + C eq (5.1)
q qmax Kdark qmax
q = number of moles of herbicide adsorbed per gram of TiO2 (mol g-1
)
Ceq = herbicide equilibrium concentration (mol litre -1
)
qmax = the maximum number of herbicide molecules that can be adsorbed as a
monolayer onto a gram of TiO2 (mol g-1
)

146
Kdark = the binding constant observed under dark adsorption (litre mol-1
)
In future experiments, it is important to consider that approximately 5% loss
of each of the pesticides will occur as a result of adsorption of the pesticide
onto the catalyst.
Figure 5.1 Degradation rate of pesticides in the absence of UV but the
presence of P-25 TiO2 = 5 g litre-1

147
Figure 5.2 Adsorbed concentration of isoproturon in the absence of UV onto
TiO2 at different isoproturon concentration. TiO2 concentration = 0.4 g litre-1
and isoproturon concentration = 1-8 ppm (Khor, 2004)
5.4 Determination of the effect of P-25 TiO2 concentration on photocatalytic
degradation
The loading of catalyst into the stirred reactor is an important variable in the
design and operation of the reactor. In this section, the effect of P-25 TiO2
loadings on the rate of degradation of the pesticides was studied to determine
the optimum catalyst loading for the stirred reactor.
A series of experiments was conducted using UVA irradiation with various
concentrations of P-25 TiO2 of 0.5, 1, 2.5, 5, and 10 g litre-1
for an initial
concentration of pesticides equal to 2.5 ppm at 25 ºC and 900 rpm. The results
are shown in Figure 5.3, 5.4 and 5.5 for the photocatalytic degradation of
isoproturon, simazine, and propazine, respectively. The experiments were
carried out over 60 minutes and each sample was taken out every 10 minutes.
The rate of degradation of the three pesticides is presented in Figures 5.3, 5.4,
5.5. All of the three pesticides studies are observed to degrade significantly on
irradiation with UV, in all cases decreasing from an initial concentration of
2500 mg litre-1
to less than 500 mg litre-1
. There is clearly a far greater loss of
the three pesticides compared to the control experiments conducted in the
absence of UV irradiation (Section 5.3). It is proposed that this loss is as a
result of the photocatalytic degradation of the pesticides.

148
It is clear that the rate at which the concentration of isoproturon, simazine and
propazine decreases is a function of the catalyst concentration. The rate of
degradation is observed to increase up to a catalyst concentration of 5 g litre-1
.
However, above this concentration, the amount of pesticide degraded over the
duration of the experiment decreases. This trend clearly demonstrates that
there is a trade off between catalyst concentration and the rate of
photocatalytic reaction.
Figure 5.3 Effect of P-25 TiO2 loadings on the degradation of isoproturon
versus time under UVA irradiation

149
Figure 5.4 Effect of P-25 TiO2 loadings on the degradation of simazine under
versus time UVA irradiation
Figure 5.5 Effect of P-25 TiO2 loadings on the degradation of propazine
versus time under UVA irradiation
The results of using the stirred reactor can be explained as a simple batch
system. The batch recirculation system was successfully modelled using an
approximation of the Langmuir–Hinshelwood (L–H) theory, as proposed by

150
Toepfer (2006) as explained in Equation (2.16). For a case with a low
pesticide concentration of less than 12 ppm, with only a single pesticide in
solution, Equation (2.16) can be simply rewritten as follows:
Rate = k [CR] (5.1)
where k = krK , and 1+KCR ≈ 1
kr = proportional constant which provides a measure of the intrinsic reactivity
of the photoactivated surface with the pesticide
K = Langmuir adsorption constant of pesticide on TiO2 surface
CR = concentration of the pesticide
The rate reaction, involving materials A,B,….,D, can be approximated by the
concentration of the chemicals: where a,b,….,d are not necessarily related to
the stoichiometric coefficients. Thus, the reaction is ath order with respect to
A, bth order with respect to B, nth order overall (Levenspiel, 1999)
(5.2)
For brevity, elementary reactions are often represented by the equation
(5.3)
for this would imply that the rate expression is
(5.4)
The photocatalytic reaction was the first order reaction, as shown in Figure 5.6

151
Figure 5.6 ln [CR]/[C0] (Remaining concentration divide by initial
concentration of isoproturon when using 10 g litre-1
of P-25 TiO2) versus time
which related to slope as reaction rate constant or k, for this figure k =0.04
min -1
Figure 5.7 shows that reaction rate constant (k) as a function of catalyst
loading. The overall trend is the same for all three pesticides studied, with
simazine having similar rate constants to propazine, whilst the rate constant
for isoproturon is higher in all cases. Generally, the rate constant and the rate
of degradation increase with the catalyst loading. This is proposed to be as a
result of the higher surface area of the catalyst available for adsorption and
degradation of the pesticide in solution. However, the photocatalytic
degradation rate of isoproturon, simazine and propazine decreased when TiO2
concentration exceeded 5 g litre-1
. When the concentration of TiO2 is
extremely high, a screening effect is caused by the TiO2 particles. This results
in the degradation rates of the three pesticides decreasing as a result of the
ln [
CR]/
[C0]

152
excessive opacity of the solutions, which prevents the catalyst from receiving
light. This results in a higher the amount of UV being reflected from the
mixture, resulting in a decrease in the UV absorption intensity onto the
catalyst surface.
Figure 5.7 Optimum P-25 TiO2 loading of the stirred reactor under UVA, k
value was calculated from Figure 5.1, Figure 5.2, and Figure 5.3
This result agrees with previous research for which the same catalyst loading
phenomenon was observed, as discussed in Section 2.11. There have been
many studies in the past that have investigated the issue of establishing an
optimum catalyst concentration for each system (Carp et al., 2004;
Konstantinou and Albanis, 2004; Cao et al., 2005; Akpan and Hameed, 2009;
Chong et al., 2010). When the catalyst concentration exceeded the optimum
value, the light scattering increased. This led to non-uniformity of light
intensity and lower photocatalytic efficiency. Each catalyst has an optimum
concentration, depending on which type it is. Overall optimum concentration

153
of the catalysts in each reported research lies in a wide range (from 0.15 to 8 g
litre-1
), which can be a result of a number of factors, such as different systems,
operational parameters, chemical compounds, and the reactor design (Carp et
al., 2004). Haque and Muneer, (2003) reported the optimum concentration for
the photocatalytic degradation of isoproturon using the P-25 TiO2 in an
immersion well reactor to be approximately 3 g litre-1
, a similar value to that
found in this study. Reddy et al., (2010) using C, N, S doped TiO2, reported
that a lower optimum catalyst concentration was 1 g litre-1
at neutral pH for
efficient degradation of isoproturon in a small stirred reactor. A more recent
study (Lopez-Munoz et al., 2013) discovered the optimum concentration of P-
25 TiO2 was 1.95 g litre-1
at pH 3.8 for the photocatalytic degradation of 5 mg
litre-1
of isoproturon in a Pyrex batch reactor. Due to different conditions, the
optimum P-25 TiO2 concentration in this reaction system was equal to 5 g
litre-1
, at neutral pH in a stirred reactor. The screening effect can be explained
with a six-flux absorption-scattering model (SFM) (Khor, 2004; Li Puma et
al., 2004; Li Puma 2005; Toepfer et al., 2006). The model has many
assumptions as follows:
(i) large spaced particles
(ii) particles randomly distribution inside the space considered
(iii) the fluid is transpatent to the UV irradiation
(iv) there is no emission by the heterogeneous system
(v) when a photon hits a particle only scattering or absorption occurs

154
(vi) the scattering can only occur along six directions of the Cartesian
coordinates, as shown in Figure 5.5
(vii) for symmetry considerations, the probability of scattering along any
of four directions of the plane normal to the incoming direction is the
same
Figure 5.8 The six principal directions of photons scattering in the six-flux
model (SFM) and the scattering probabilities (Li Puma, 2005)
Based on this theory, above the optimal catalyst loading, the increased
particles present in the volume of the reactor cause more scattering and
absorption of the light. However, as the scattering can occur in only six
directions, this results in a high possibility for the particles close to the light
source adsorbing the light onto the catalyst surface but not fully scattering the
light to other catalyst particles. Therefore, the efficiency of the reactor

155
becomes limited by the opacity, which reduces the number of particles being
exposed to the light penetration.
5.5 Influence of catalyst type on the photocatalytic degradation (P-25 TiO2 VS
synthesised TiO2)
A comparison was made between the photocatalytic degradation of the
pesticides using two different catalysts, a commercially available P-25 catalyst
and TiO2 nanoparticles that were synthesised using the supercritical water
hydrothermal synthesis (ScWHS) rig at the University of Nottingham (Section
3.3). The efficiency of the synthesised TiO2 in the photocatalytic reaction was
studied with isoproturon, simazine, and propazine. The synthesised TiO2 or
ScWHS TiO2 was used for treatment of pesticide solutions by adding
nanoparticles into the stirred reactor under UVA or the UVC irradiation. The
photolysis experiment, without the synthesised TiO2, was also carried out to
compare the amount of the pesticides’ degradation.
Figure 5.9 shows the photodegradation results of propazine with the fresh
synthesised TiO2, compared with P-25 TiO2 and at a mixing ratio of 50:50 (P-
25 TiO2: the synthesised TiO2) by % weight under the UVA at TiO2
concentration = 0.5 g litre-1
. The results show that P-25 TiO2 is more active as
a photocatalyst than the synthesised TiO2. The photocatalytic degradation of
propazine using P-25 TiO2 results in nearly 100 % loss of the compound after
an hour, which is far greater than the reaction under identical conditions using
the synthesised TiO2 (ScWHS TiO2) where only 40 % loss was recorded over

156
the same time period. The mixture of P-25 TiO2 and the synthesised TiO2
resulted in an intermediate rate of photocatalytic degradation in comparison to
the use of the two catalysts in isolation.
Figure 5.9 Degradation of propazine (initial concentration = 2.5 ppm) using
P-25 TiO2 and synthesised TiO2 under UVA
The phase of the catalyst has previously been reported to significantly
influence the photocatalytic activity of that catalyst (Section 2.11). P-25 TiO2
phase contains both anatase and some amount of rutile phase, which has an
impact on the photocatalytic efficiency of P-25 TiO2. As the rutile acted as an
electron trap, the exchange of electrons and holes between rutile and anatase
easily occurs. The mixture between anatase and rutile reduced the oxidation
and reduction limit when compared to the case of anatase or rutile only, as
shown in Figure 2.10. The presence of the rutile phase in the photocatalyts

157
results in photocatalytic performance at a rate higher than when only pure
anatase phase is present (Sato and Taya, 2006; Yeredla and Xu, 2008; Qourzal
et al., 2008; Hurum et al., 2003). It is for this reason that P-25 has the highest
photocatalytic efficiency when compared to other commercial TiO2 catalysts
(Bhatkhande et al., 2001; Singh et al., 2003; Singh et al., 2007; Singh and
Muneer 2004; Rahman and Muneer, 2005; Qamar and Muneer, 2005; Qourzal
et al., 2008; Qamar and Muneer., 2009; Singh et al., 2007; Muneer et al.,
2005; Rafqah et al., 2005). The sintering temperature affects the structural
stability as discovered by Wang and co-workers (Wang et al., 2005). They
studied the effect of the sintering temperature on the oxidization of ethylene
in a gas-phase medium. They found that when the catalyst calcined at 350 °C,
it possessed a macro/mesoporous structure and showed photocatalytic
reactivity about 60% higher than that of commercial P-25 TiO2 due to its
larger surface area. Therefore, the assumption was then made with the case of
the synthesised TiO2 to find out the photocatalytic efficiency after high
temperature sintering.
To determine if the performance of the synthesised TiO2 catalyst from
supercritical water hydrothermal synthesis (ScWHS) could be improved, it
was sintered at 900 ºC, above the 700 ºC temperature at which the rutile phase
of TiO2 has been reported to occur (Rath et al., 2009). To test this hypothesis a
series of experiments was conducted using the hydrothermal synthesised TiO2,
dried at 80 °C for two days and sintered at 900 °C for an hour.
As in Figure 5.10 after sintering at 900 ºC, the particles developed to more
agglomeration which led to larger grain size. However, the agglomerates

158
were hand milled using mortar and pestle to smaller than 5 mm-particles
before starting the experiments.
Figure 5.10 Photograph of synthesised TiO2 after sintering at 900 °C for an
hour
It should be noted there was no phase transition at temperatures from 30-1000
º C, as shown in XRD results in Section 5.6. Figure 5.11 to Figure 5.13
compare the rate of loss of isoproturon, simazine and propazine containing the
sintered TiO2 with UVA irradiation, compared to UVA photolysis of the
solution (UVA only). The same results are reported for the three pesticides,
with the loss of the pesticides occurring at the same rate with or without the
catalyst present.

159
Figure 5.11 Degradation of isoproturon (initial concentration = 2.5ppm)
using the synthesised TiO2 under UVA, [TiO2] = 5 g litre-1
after drying at 80
°C and sintering at 900 °C
Figure 5.12 Degradation of simazine (initial concentration = 2.5ppm) using
the synthesised TiO2 under UVA, [TiO2] = 5 g litre-1
after drying at 80 °C and
sintering at 900 °C

160
Figure 5.13 Degradation of propazine (initial concentration = 2.5ppm) using
the synthesised TiO2 under UVA, [TiO2] = 5 g litre-1
after drying at 80 °C and
sintering at 900 °C
The same trend is observed for the irradiation of the pesticides under UVC
irradiation (Figure 5.14 to Figure 5.16 for isoproturon, simazine and propazine
, respectively). Overall, there is no difference between the rate of degradation
with or without a catalyst present. Therefore, over the time studied in these
experiments, it can be concluded that the synthesised TiO2 (after sintering) has
no activity in the stirred reactor system. It is clear that the rate of degradation
with UVC irradiation occurs at a faster rate than in UVA for all three
pesticides.

161
Figure 5.14 Degradation of isoproturon (initial concentration = 2.5ppm)
using the synthesised TiO2 under UVC, [TiO2] = 5 g litre-1
after drying at 80
°C and sintering at 900 °C
Figure 5.15 Degradation of simazine (initial concentration = 2.5ppm) using
the synthesised TiO2 under UVC, [TiO2] = 5 g litre-1
after drying at 80 °C and
sintering at 900 °C

162
Figure 5.16 Degradation of propazine (initial concentration = 2.5ppm) using
the synthesised TiO2 under UVC, [TiO2] = 5 g litre-1
after drying at 80 °C and
sintering at 900 °C
Figure 5.17 illustrates that the rate of pesticide degradation in the synthesised
TiO2 after sintering seems to have lower photocatalytic efficiency than the
catalyst without sintering. This result conflicts with the assumption that
photocatalytic degradation will occur at a higher rate after sintering and
increase in the concentration of the rutile phase. To determine the reason for
the loss of performance of the catalyst, further analysis of the catalyst before
and after sintering was conducted and is discussed in the following section.

163
Figure 5.17 Degradation of propazine using the synthesised TiO2 under UVA
[TiO2] = 5 g litre-1
after drying at 80 °C and sintering at 900 °C compared
with the non-sintering synthesised TiO2
5.6 X-ray Diffraction (XRD) results at different sintering temperature
XRD analysis of the different catalyst (Figure 5.18) can be used to explain
why the synthesised TiO2 has a lower photocatalytic efficiency compared to P-
25 TiO2. Contrary to previous studies (Rath et al., 2009) no rutile phase has
developed in the catalyst after sintering of the hydrothermally synthesised
TiO2 at temperatures of between 30-1000 ºC). Despite heat treatment and
sintering over a range of temperatures up to 1000 ºC, the synthesised TiO2
remains predominantly composed of anatase. However, commercial P-25 TiO2
is composed of both the active rutile as well as the anatase phase. These
phases had already been proved to have co-operative performance in
photocatalytic reaction (Qourzal et al., 2008; Hurum et al., 2003; Yeredla and

164
Xu, 2008). Yeredla and Xu (2008) reported that the mixed phase P-25 TiO2
exhibited higher activity for the photo-oxidation of acetaldehyde than anatase
and rutile alone. The pure rutile phase has lowest activity as the decomposed
acetaldehyde was approximately 30% when using the mixed phase TiO2 (P-25
TiO2). However the result of the pure anatase sample was lower than the
mixed phase for 10%. There was a basic explanation that, as P-25 TiO2 is
composed of small nano-crystallites of rutile dispersed within an anatase
matrix, the smaller band gap of rutile catches the photons generating
electron/hole pairs. The electron then transfers from rutile (conduction band)
which acted as electron traps, to anatase phase (Qourzal et al., 2008). Hurum
(2003) explained the enhanced photocatalytic activity of P-25 TiO2 using
electron paramagnetic resonance (EPR) spectroscopy. They proposed that the
increased activity of P-25 TiO2 is due to a rutile sink, preventing anatase
recombination and allowing an anatase-originating hole to move to the
surface. Sato and Taya (2006) carried out research using various anatase to
rutile ratios in the catalyst (0 %, 30 %, 50 %, 70%, and 100% anatase). They
discovered that the highest photocatalytic activity occurred for materials
containing 70% anatase (30% rutile), with the lowest activity reported for the
0% anatase (100% rutile) catalyst. Therefore, the synthesised TiO2 had
lower efficiency compared to P-25 TiO2 because it did not have any rutile
phase.
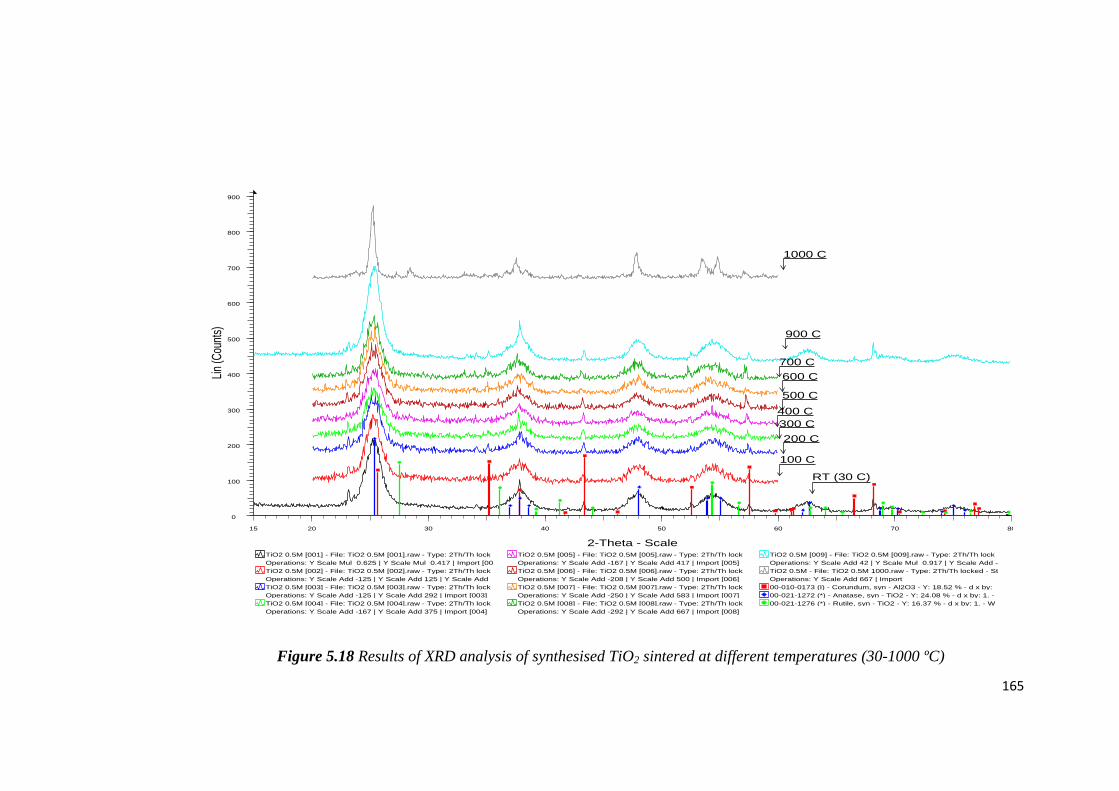
165
00-021-1276 (*) - Rutile, syn - TiO2 - Y: 16.37 % - d x by: 1. - W
00-021-1272 (*) - Anatase, syn - TiO2 - Y: 24.08 % - d x by: 1. -
00-010-0173 (I) - Corundum, syn - Al2O3 - Y: 18.52 % - d x by:
Operations: Y Scale Add 667 | Import
TiO2 0.5M - File: TiO2 0.5M 1000.raw - Type: 2Th/Th locked - St
Operations: Y Scale Add 42 | Y Scale Mul 0.917 | Y Scale Add -
TiO2 0.5M [009] - File: TiO2 0.5M [009].raw - Type: 2Th/Th lock
Operations: Y Scale Add -292 | Y Scale Add 667 | Import [008]
TiO2 0.5M [008] - File: TiO2 0.5M [008].raw - Type: 2Th/Th lock
Operations: Y Scale Add -250 | Y Scale Add 583 | Import [007]
TiO2 0.5M [007] - File: TiO2 0.5M [007].raw - Type: 2Th/Th lock
Operations: Y Scale Add -208 | Y Scale Add 500 | Import [006]
TiO2 0.5M [006] - File: TiO2 0.5M [006].raw - Type: 2Th/Th lock
Operations: Y Scale Add -167 | Y Scale Add 417 | Import [005]
TiO2 0.5M [005] - File: TiO2 0.5M [005].raw - Type: 2Th/Th lock
Operations: Y Scale Add -167 | Y Scale Add 375 | Import [004]
TiO2 0.5M [004] - File: TiO2 0.5M [004].raw - Type: 2Th/Th lock
Operations: Y Scale Add -125 | Y Scale Add 292 | Import [003]
TiO2 0.5M [003] - File: TiO2 0.5M [003].raw - Type: 2Th/Th lock
Operations: Y Scale Add -125 | Y Scale Add 125 | Y Scale Add
TiO2 0.5M [002] - File: TiO2 0.5M [002].raw - Type: 2Th/Th lock
Operations: Y Scale Mul 0.625 | Y Scale Mul 0.417 | Import [00
TiO2 0.5M [001] - File: TiO2 0.5M [001].raw - Type: 2Th/Th lock
Lin
(Cou
nts)
0
100
200
300
400
500
600
700
800
900
2-Theta - Scale
15 20 30 40 50 60 70 80
1000 C
900 C
700 C
600 C
500 C
400 C
300 C
100 C
RT (30 C)
200 C
Figure 5.18 Results of XRD analysis of synthesised TiO2 sintered at different temperatures (30-1000 ºC)

166
In 2007, Gemelli and Camargo studied the XRD results of pure commercial
titanium oxidation in the temperature range 400 – 800 °C, Figure 5.19. Above
718 °C, phase transition from anatase to rutile occurred, which indicated that
anatase is no longer stable, converting to rutile, which is the only stable phase.
However, in case of the synthesised TiO2 that has been used in this thesis,
XRD showed only anatase from room temperature until 900 °C and still with
dominant peaks of anatase at 1000 °C. However, there were some small
amounts of rutile that started to nucleate at 1000 °C (at 2 = 54° and 57°).
Therefore, there is probablity for phase transition of the synthesised TiO2,
when the sintering temperature was higher than 1000 °C. The suspicious point
in this discovery leads to future study and further experiments.

167
Figure 5.19 XRD of pure titanium when oxidation in the temperature range
400 – 800 °C (Gemelli and Camargo, 2007) A: Anatase, R: Rutile and T:
Titanium

168
5.7 Conclusions of stirred photoreactor experiments
In this chapter, the experimental results carried out with stirring batch system
were discussed. The influence of photocatalyst was studied at different
concentrations of P-25 TiO2 under UVA. The optimum concentration of P-25
TiO2 for use with the stirring reactor was found to be 5 g litre-1
. The
experiments with synthesised TiO2 (after sintering and non-sintering) were
carried out to compare the photocatalytic performance with the commercial
TiO2. The sintering sample had a lower photocatalytic efficiency than
expected and than the non-sintering case due to no phase transition occurring.
After using the sintered, synthesised TiO2 treatment with polluted-water, there
was rarely difference in the degradation concentration of the three pesticides
from UVA or UVC photolysis (UVA or UVC only). It can be concluded that
the sintered, synthesised TiO2 was barely active as a photocatalyst in this
system, which is different from the case of P-25 TiO2. In the absence of UV
experiments, there was no significant difference of the degradation
concentration amongst the three pesticides. The concentration loss was equal
to 10%, which corresponds with TFFBR (Chapter 4). The photocatalytic
reaction rates of the three pesticides under UVA illumination was defined as
first order reaction and followed the L-H (Langmuir–Hinshelwood) theory.

169
Chapter 6
PHOTOCATALYTIC DEGRADATION
OF PESTICIDES USING A FLUIDISED
BED PHOTOREACTOR
6.1 Introduction to fluidised bed photoreactor results
This chapter presents the results from the degradation of the three pesticides
used in this study using a fluidised bed photoreactor. A fluidised bed
photoreactor has previously been demonstrated to have good potential as a
reactor that uses immobilized photocatalysts (Section 2.12, Alexander et al.,
2000, Rowan and Andrew, 2009). The reactor is constructed to allow counter-
current mixing of air introduced at the bottom of the reactor and TiO2, so
creating a high contact, well mixed contact area between oxygen molecules,
contaminated solution and catalyst surfaces. Therefore, in this thesis, the
photocatalytic experiments with a fluidised bed photoreactor are the major
priority, which was observed after using both P-25 TiO2 and the TiO2 catalyst
synthesised in a supercritical water reactor.
The details of the experiments and the reactor design were previously
described in Section 3.6.
A series of experiments have been conducted and will be described in this
chapter, to establish the performance of the reactor. Initial control experiments

170
were conducted on solutions of isoproturon, simazine, and propazine in the
presence of the P-25 TiO2 catalyst at a concentration of 5 g litre-1
but in the
absence of UV irradiation. A comparison will also be drawn between the
degradation results of the pesticides under UVA and UVC photolysis,
compared to photocatalytic degradation in the presence of P-25 TiO2 at a range
of concentrations. Finally the effect of different catalyst types, and the results
of various characterisations are also presented, including Transmission
Electron Microscopy (TEM), X-ray Diffraction (XRD), and Ultraviolet-visible
Spectroscopy (UV-Vis), (analytical techniques which were previously
described in Section 3.7).
The performance of the supercritical water synthesised TiO2 (Section 3.3) in
the fluidised bed photoreactor is also studied and compared to the commercial
TiO2.
6.2 Aims and Objectives
The principal aim of this chapter is to develop the fluidised bed photoreactor,
and, through conducting a series of experiments under a range of experimental
conditions, to determine and optimise the performance of the photocatalytic
treatment. More detailed objectives of this chapter are as follows:
(i) Determine the pesticide concentration adsorped onto the TiO2 surface
under absence of UV

171
(ii) Determine the rate of pesticide degradation using UV photolysis (in the
absence of a catalyst) to allow comparison with a photocatalytic
reaction using P-25 TiO2
(iii) Determine the influence of UV wavelength in the photocatalytic
reaction and comparison with previous results using a thin film fixed
bed reactor (Chapter 4)
(iv) Optimization of the appropriate TiO2 concentration to achieve the
highest reactor performance as compared with the results using the
stirred reactor (Chapter 5)
(v) Determine the photocatalytic mechanism occurring during pesticide
degradation using the fluidised bed photoreactor and determine the
reaction rate law and relate the results to the Langmuir–Hinshelwood
(L–H) theory (Section 2.11).
(vi) Determine the performance of the synthesised TiO2 after sintering and
compare performance with the commercial P-25 TiO2
(vii) Characterization of the synthesised TiO2 from the ScWHS technique
using Transmission Electron Microscopy (TEM), X-ray Diffraction
(XRD), and Ultraviolet-visible Spectroscopy (UV-Vis)

172
6.3 Control experiments, determination of the rate of loss of pesticides in the
absence of UV but in the presence of TiO2
A series of control experiments were conducted using the fluidised bed reactor
for the three pesticides (isoproturon, simazine, and propazine) in the presence
of the P-25 TiO2 catalyst but in the absence of UV irradiation. An initial set of
experiments was conducted to confirm that the amount of adsorption of the
pesticide onto the catalyst to determine a baseline for the photolysis and
photocatalytic experiments. P-25 TiO2 was added at a concentration of 5 g
litre-1
for all of the experiments without the UV illumination.
The rate of loss from solutions of isoproturon, simazine, and propazine are
shown in Figure 6.1. In all cases there is a small initial decrease in the
concentration of the pesticides in the solution. Overall a decrease of
approximately 10% - 15% of the pesticide is observed (The standard deviation
for isoproturon, simazine and propazine data were 3.44, 2.17, 4.63 % of initial
pesticide concentration, respectively). These results are in the same direction
as the results from TFFBR (Chapter 4) and stirred photoreactor (Chapter 5),
though the loss amount was higher due to higher TiO2 concentration (5 g litre-
1). Taking into account the uncertainty in the loss of the pesticides as a result
of analytical experimental errors, it is assumed that the rate of loss of the
different pesticides is equal. It is proposed that this is as a result of the
adsorption of the pesticides onto the surface of the P-25 TiO2 catalyst surface.
It is possible that volatiles loss of the pesticide could account for this decrease
in concentration. However, this is predicted to be minimal as the pesticide
solutions are in liquid phase and rapidly transfer to the reactor. There is also a

173
low surface area for evaporation to occur from the top of the column, due to
the column dimension that has a high length-width ratio (48:1). This decrease
in the concentration of the pesticides under the control experiments, in the
absence of UV irradiation, is equivalent to that observed for all of the different
reactors used in this study (Section 4.3.1, and Section 5.3).
Figure 6.1 Decrease in the concentration of pesticides in the absence of UV
irradiation but in the presence of P-25 TiO2 (5 g litre-1
)
6.4 UVA and UVC photolysis
To determine the rate of loss of the three pesticides in the absence of UV
irradiation, a number of experiments were conducted with UVA and UVC in
the absence of a catalyst. The efficiency of UVA and UVC photolysis of the
three pesticides was also compared. Figure 6.2 shows the results of UVA
photolysis in the fluidised bed photoreactor, without adding any photocatalyst.
UVA photolysis leads to a 20-30 % decrease in the concentration of the
pesticides in solution. The rate of degradation varied for the three pesticides

174
studied, with the initial rate and total degradation of simazine after 80 minutes
of treatment being the greatest (Figure 6.2). The statistical values of the
remaining pesticide concentration were shown in Section III.4-III.6 (Appendix
III). The results are consistent with those from the thin film fixed bed reactor
in Section 4.4.
Figure 6.2 UVA photolysis of isoproturon, simazine, and propazine without
any catalyst
The rate of loss for all three pesticides under UVC irradiation was seen to be
greater than that of UVA (Figure 6.3). For all of the three pesticides studied,
a decrease in concentration of approximately 80 % was observed after 50
minutes (Figure 6.3). This relates to the theory that the light wavelength did
have influence on the photolysis, as previously described in Section 4.4. UVC
has a shorter wavelength (100-280 nm), which resulted in the higher energy of
the photon emission compared to the UVA, which has a longer wavelength

175
(315-400 nm) (Section 2.11). These results are consistent with the study of
Liang et al., (2010) on the photolysis and TiO2-photocatalytic reduction of
diphenamid. They found that photolysis by UVC alone was highly efficient,
resulting in up to 100% degradation of diphenamid after 360 minutes. In
comparison, the heterogeneous photocatalytic reduction of the same
compound with TiO2 and UVA showed a lower rate of degradation, resulting
in a residual concentration of 51% after the same treatment time.
Figure 6.3 UVC photolysis of isoproturon, simazine, and propazine without
any catalyst
6.5 Photocatalytic degradation of pesticides
Figure 6.4, Figure 6.5 and Figure 6.6 show the results of four different
experimental conditions on the degradation of isoproturon, simazine and
propazine (initial concentration of pesticides = 2.5 ppm), respectively, which
are:

176
(i) the UVA photolysis reaction
(ii) the UVC photolysis reaction
(iii) the photocatalytic reaction with P-25 TiO2 at a concentration of 5 g
litre-1
under the UVA
(iv) the photocatalytic reaction with P-25 TiO2 at a concentration of 5 g
litre-1
under the UVC
The higher rate of pesticide degradation was observed when the reaction was
conducted in the presence of P-25 TiO2 under UVC irradaition. In all cases,
nearly complete degradtion of all three pesticides was observed after 80
minutes. Over the first ten minutes of the experiments, significant differences
are reported in the rate of degradation of the three compounds in the following
order: isoproturon > propazine> simazine.
The results clearly demonstrate that both photolysis and photocatalytic
reaction occur at a significantly higher rate in UVC compared to UVA. Whilst
the addition of the catalyst under UVA irradiation provided a higher
photocatalytic degradation rate than only UVA, this approach for all three
pesticides was less effective at degrading the compounds than UVC irradiation
alone. These results are in accordance with the observation in the previous
chapter (Section 4.3) where photocatalytic reaction occured when adding P-25
TiO2, which had higher degradation rates than UV photolysis. Photocatalytic
reaction is different from photolysis reaction, since there is a photocatalyst
involved in the reaction. In photolysis, the reaction is mainly affected by light
intensity and light wavelength. However, in photocatalytic reaction, the

177
photocatalysts play a main role to oxidise the substrate activated by light
illumination. The oxidation rate of a photocatalytic reaction depends on
hydroxyl radicals, which are formed by reaction between TiO2, water, and
oxygen molecules (Section 2.7 and Figure 2.1) These results agree with a large
number of studies for a range of pesticides (isoproturon: Khor, 2004; alachlor:
Wong 2003; malathion, isomalathion and malaoxon: Kralj et al., 2007) which
demonstrate that the degradation rate of pesticides or organic compounds due
to photocatalytic oxidation was significantly higher than photolysis alone
(only UV). In this thesis, the photocatalytic rate under UVC of isoproturon
was twice as much as the UVC photolysis rate referred to in Figure 6.4.
It can also be observed from Figures 6.5 that the photocatalytic rate reaction of
isoproturon, simazine and propazine improves under UVC at a greater rate
than under UVA. The activity of the photocatalyst depends strongly on the
light-illumination (energy per unit area) or the photon flux on the surface of
the catalyst. For photocatalytic reaction, the efficient photon has to be
considered as a reactant. The photon energy can be explained as Planck’s
equation (Section 2.11.7). In this theory, it depended on the light wavelength;
the shorter the light wavelength, the higher the photon energy.
However, there are other possible reasons explained by Khor (2004) that the
appropriate absorption wavelength of TiO2 is near 254 nm (UVC) which
therefore provides enough energy to overcome the energy band gap.

178
(i) The penetration distance of photons into particles is shorter when under the
shorter wavelength. Therefore, TiO2 particles absorbed the shorter wavelength
more strongly than the longer wavelength.
(ii) Photoelectrons and holes are formed closer to the surface of the catalyst
particles, which reduces the possibilities of the electron-hole recombination.
Previous studies have reported high rates of organic compound degradation in
fluidised photocatalytic reactors. The degradation efficiency of three
pesticides using a fluidised bed photoreactor is high. The efficient degradation
of similar compounds has been demonstrated in previous studies (Nam et al.,
2002; Lee et al., 2004; Kanki et al., 2005). Nam et al. (2002) carried out
photocatalytic treatment of methyl orange in a fluidised bed photoreactor,
using TiO2 as the photocatalyst. They reported the decomposition results of
100 % after 1.5 hr passed (at TiO2 concentration = 0.2 g litre-1
, air flow rate =
1.5 litre min-1
). In 2004, photocatalytic oxidation of microcystin-LR in a
fluidised bed reactor using TiO2-coated activated carbon was carried out by
Lee and colleagues. This compound is a cyclic heptapeptide containing 3-
amino -9- methoxy -2, 6 ,8- trimethyl -10- phenyldeca -4, 6-dienoic acid, with
leucine (L) and arginine (R). They succeeded in achieving high photocatalytic
activity as 100 % degradation of microcystin-LR within 20 minutes. In 2005,
Kanki and co-workers used a fluidised bed for bisphenol A treatment with
TiO2-coated ceramic particles. Their results showed that 10 mg dm-3
in 2 litre
water of bisphenol A can be decomposed almost 100% in about 200 min.

179
Figure 6.4 Effect of light wavelength on the photocatalytic oxidation rate of
isoproturon, [TiO2] = 5 g litre-1
, initial concentration of isoproturon = 2.5
ppm, P-25 TiO2 sintered at 900 °C for an hour
Figure 6.5 Effect of light wavelength on the photocatalytic oxidation rate of
simazine, [TiO2] = 5 g litre-1
, initial concentration of simazine = 2.5 ppm, P-
25 TiO2 sintered at 900 °C for an hour

180
Figure 6.6 Effect of light wavelength on the photocatalytic oxidation rate of
propazine, UVA [TiO2] = 5 g litre-1
, UVC [TiO2]= 5 g litre-1
, initial
concentration of simazine = 2.5 ppm, P-25 TiO2 sintered at 900 °C for an
hour
The fluidised bed photoreactor has the highest efficiency compared to the
other two reactors, the thin film reactor (Chapter 4) and the stirred
photoreactor (Chapter 5). As shown from Section III.10-III.21 (Appendix III)
the average value of % remaining concentration of the three pesticides from
UVA and UVC photolysis, using a fluidised bed photoreactor were lower than
using other reactors. A number of explanations are possible for the difference
in performance.
Light intensity can play a significant role in the rate of degradation of organic
compounds under both photolysis and photocatalytic conditions. The fluidised
bed photoreactor has two parallel 36 watt-UV lamps which are located in
parallel and close to the column (Section 3.6). The column has dimensions of

181
120 cm length and 1 inch diameter, which is an extreme length-width ratio (
fludisied bed = 48:1, whereas stirred photoreactor = 5:3). This results in an
increased illuminated area for the UV photolysis. The distance between the
light source and the column also important. The closer the light source, the
higher the light intensity. As previously described in Section 2.11, light
intensity has a great influence on photocatalytic reactions (Ahmed et al., 2011;
Cassano and Alfano, 2000). The relationship between the rate of the
photocatalytic removal and light intensity has previously been reported for
TiO2 photocatalytic systems. Greater surface irradiation leads to more
hydroxyl radicals being present, which play an important role in the
photocatalytic mechanism (Pourata et al., 2009; Liu et al., 2009; Faramazpour
et al., 2009; Kaneco et al., 2009).
The introduction and mixing of oxygen into the reactor is also another
important variable between the different reactor types. The fluidised bed
photoreactor has a continuous stream of air introduced at the base, whilst there
was no continuous source of oxygen flow in both the stirred reactor and the
thin film fixed bed reactor (TFFBR). Hence, due to the low concentration of
oxygen, the potential for the photocatalytic reaction in these two models is
predicted to be lower than in the fluidised bed reactor. In the case of the
fluidised bed photoreactor, an air supply was fed from the bottom of the
column at a flow rate of 0.8 ml min-1
. During the experimental period of 90
minutes, the volume of oxygen can be calculated as follows,
The total volume of oxygen = 0.8 x 90 = 72 ml
When the dimension of the column,

182
radius of the column = R = 0.5 inch = 1.27 cm,
the height of the column = h = 120 cm;
The volume of column = ¶ R2 h
= ¶ (1.27) 2 x120 = 608.04 ml
The volume of solution equal to ¾ of total reactor volume = 608.04 x 0.75 =
456 ml
oxygen ratio per total volume = 72 = 0.158 = 15.8 % by volume
456
From the calculation above, the volume ratio of the oxygen compared to the
total volume was equal to 15.8 %. The oxygen concentration was higher than
in the stirred reactor and the thin film fixed bed reactor (TFFBR), which had
no oxygen source.
Previous studies of fluidised bed reactors have shown that the oxygen flowrate
has a significant impact on photocatalytic activity. The higher the oxygen
flowrate, the higher the photocatalytic activity (Nam et al., 2002; Dong et al.,
2008) Nam et al., (2002) studied 4 values of oxygen flowrate (0.5, 1, 1.5, 2
litre min-1
). They discovered that the highest decomposition rate of methyl
orange occurred at 1.5 litre min-1
(75% decreased concentration in an hour).
Gong et al., (2008) and co-workers carried out research using a fluidised bed
photoreactor with titanium dioxide immobilised onto activated carbon for
phenol degradation. They found that there was the optimum limit of the
oxygen flowrate in photocatalytic reaction, as shown in Figure 6.7. In this

183
graph, at oxygen flowrate equal to 5 litre min-1
, the degradation fraction of
phenol was lower than at 3 litre min-1
oxygen flow rate by approximately 10 -
15 %.
Figure 6.7 Effect of air flow rate on liquid phase phenol degradation fraction
(Gong et al., 2008)
6.6 Effect of P-25 TiO2 concentration on the photocatalytic degradation
The concentration of the catalyst is another important variable in the operation
of the fluidised bed reactor. In this section, P-25 TiO2 was sintered at 900 °C
for an hour to increase the particle size before being added to the reactor in
order to stop clogging of particles in the bottom of reactor. Experiments were
conducted as follows to determine the influence of catalyst concentration
under a range of different conditions:

184
(i) The photocatalytic effect was compared under UVA for the
degradation of isoproturon and simazine, as shown in Figure 6.8 and
6.9, respectively.
(ii) Comparison of the photocatalytic degradation of isoproturon, simazine,
and propazine with P-25 TiO2 under UVC irradiation or a range of
catalyst loadings.
Comparison of the different catalyst loadings under UVA at three different
concentrations (2.5, 5, 7.5 g litre-1
) shows that there is not a linear relationship
between the rate of polymer degradation and the concentration of the catalyst.
In the case of isoproturon degradation (Figure 6.8), the rate of loss of the
pesticide is seen to increase up to 5 g litre-1
, but decrease as the catalyst
concentration is raised above this point. The same trend is also seen with
simazine in Figure 6.9 at the two different concentrations (5, and 7.5 g litre -1
)
of P-25 TiO2. The photocatalytic degradation of isoproturon and simazine,
using different P-25 TiO2 concentrations are compared with the blank sample
(UVA photolysis or UVA only).
The most appropriate amount of P-25 TiO2 for photocatalytic treatment of
pesticides in a fluidised bed photoreactor is 5 g litre-1
as shown in both graphs
(Figure 6.8 and 6.9) since the decreased concentration of isoproturon and
simazine were the highest when using P-25 TiO2 at 5 g litre-1
. This result
corresponds to the result using the stirred reactor, that 5 g litre-1
is the
optimum P-25 TiO2 concentration (Section 5.3).

185
Figure 6.8 Photocatalytic degradation of isoproturon using fluidised bed
reactor under UVA with P-25 TiO2 concentration 2.5, 5 and 7.5 g litre -1
Figure 6.9 Photocatalytic degradation of simazine using fluidised bed reactor
under UVA with P-25 TiO2 concentration 5 and 7.5 g litre-1
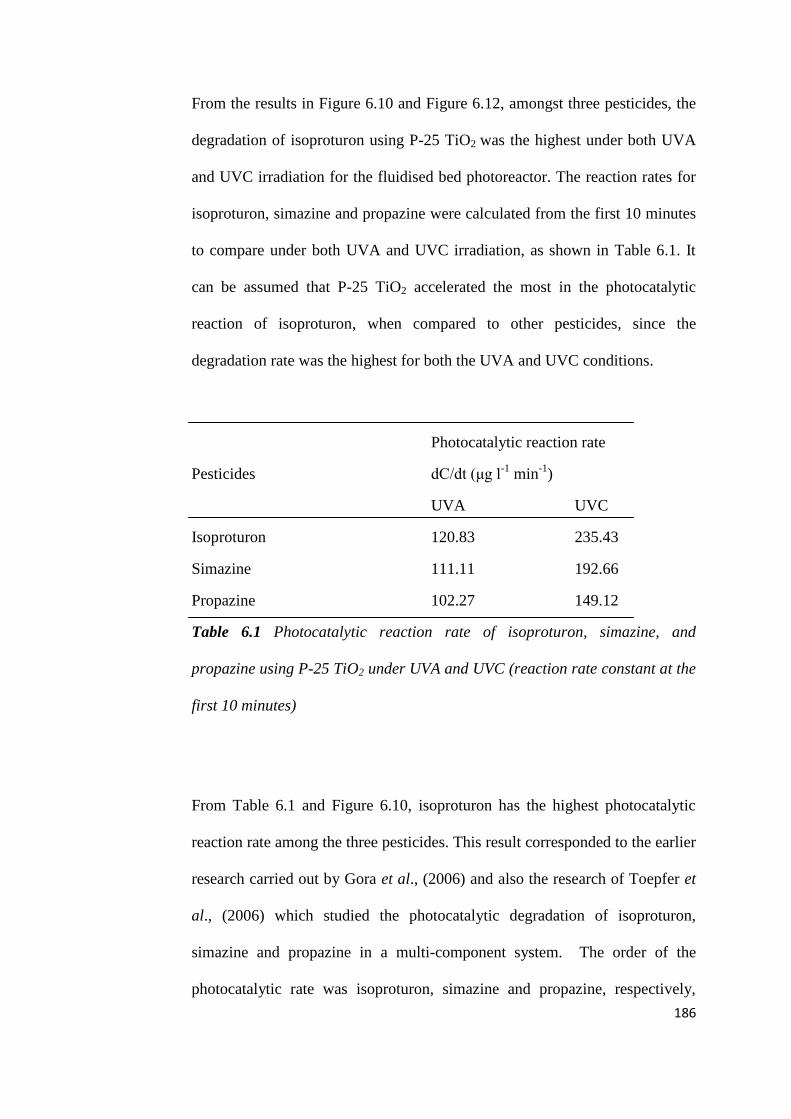
186
From the results in Figure 6.10 and Figure 6.12, amongst three pesticides, the
degradation of isoproturon using P-25 TiO2 was the highest under both UVA
and UVC irradiation for the fluidised bed photoreactor. The reaction rates for
isoproturon, simazine and propazine were calculated from the first 10 minutes
to compare under both UVA and UVC irradiation, as shown in Table 6.1. It
can be assumed that P-25 TiO2 accelerated the most in the photocatalytic
reaction of isoproturon, when compared to other pesticides, since the
degradation rate was the highest for both the UVA and UVC conditions.
Photocatalytic reaction rate
Pesticides dC/dt (μg l-1
min-1
)
UVA UVC
Isoproturon 120.83 235.43
Simazine 111.11 192.66
Propazine 102.27 149.12
Table 6.1 Photocatalytic reaction rate of isoproturon, simazine, and
propazine using P-25 TiO2 under UVA and UVC (reaction rate constant at the
first 10 minutes)
From Table 6.1 and Figure 6.10, isoproturon has the highest photocatalytic
reaction rate among the three pesticides. This result corresponded to the earlier
research carried out by Gora et al., (2006) and also the research of Toepfer et
al., (2006) which studied the photocatalytic degradation of isoproturon,
simazine and propazine in a multi-component system. The order of the
photocatalytic rate was isoproturon, simazine and propazine, respectively,

187
which is the same as in the review of literature, explained in Section 2.11 and
Section 4.5. Therefore, it can be concluded that isoproturon has the lowest
stability when compared to the other two chemicals. The reason for this lack
of stability is due to different structure or functional groups (Scribner et al.,
2000; Konstantinou and Albanis 2003; Benitez et al., 2006; Lopez-Munoz et
al., 2011). Isoproturon is the phenylurea, whereas simazine and propazine are
s-triazine (Section 1.1.5). Therefore, the degradation pathways are different,
resulting in different degradation rates and different intermediates or by-
products (Section 2.9). In the case of isoproturon, phenylurea herbicides, the
structure breaks up due to (i) the attack of hydroxy radicals on the aromatic
ring and (ii) abstraction of hydrogen atoms of the methyl group, followed by
the addition of oxygen and decarboxylation. However, in the case of simazine
and propazine (s-triazines), the degradation pathway start from displacement
of the substituent at the position 2, side alkyl chain oxidation appears,
followed by dealkylation and deamination. S-triazine is a group of pesticides
which has highest tolerant against photocatalytic oxidation. However, the
cyanouric acid, which is a by-product, exhibits very low toxicity.

188
Figure 6.10 Photocatalytic degradation of isoproturon, simazine and
propazine using fluidised bed reactor under UVA with P-25 TiO2
concentration 5 g litre-1
The effect of different catalyst loadings seems to differ for irradiation with
UVC compared to UVA. As shown in Figure 6.11, the degradation
concentrations of isoproturon using different P-25 TiO2 concentrations under
UVC were the same within the experimental error. For all three
concentrations of UVC, the amount of catalyst has no influence on the
degradation rate, since all samples had a decreased concentration equal to 90
% of the initial concentration in the first 10 minutes. In all cases, the
photocatalytic rate of degradation is significantly greater than results when a
catalyst is not present.
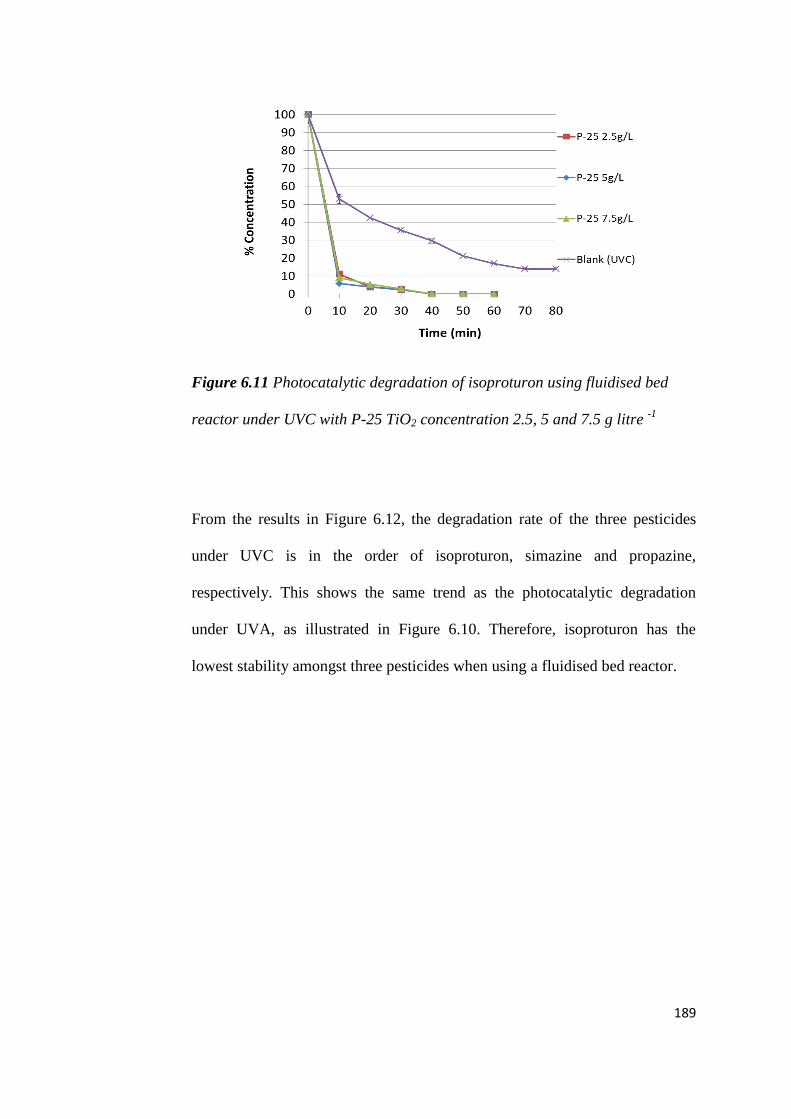
189
Figure 6.11 Photocatalytic degradation of isoproturon using fluidised bed
reactor under UVC with P-25 TiO2 concentration 2.5, 5 and 7.5 g litre -1
From the results in Figure 6.12, the degradation rate of the three pesticides
under UVC is in the order of isoproturon, simazine and propazine,
respectively. This shows the same trend as the photocatalytic degradation
under UVA, as illustrated in Figure 6.10. Therefore, isoproturon has the
lowest stability amongst three pesticides when using a fluidised bed reactor.

190
Figure 6.12 Photocatalytic degradation of isoproturon, simazine and
propazine using fluidised bed reactor under UVC with P-25 TiO2
concentration 5 g litre-1
From the reaction law in Section 5.2, the photocatalytic reaction in the
fluidised bed when using UVA was a first order reaction since there was a
linear relationship between ln [CR]/[C0] and time, as shown in Figure 6.13. In
Figure 6.14, the plot of ln [CR]/[C0]versus time was non-linear, when CR =
concentration of pesticides.
Rate = dC/dt = k [CR] , k = min -1
(6.1)

191
Figure 6.13 The linear relationship between ln [CR]/[C0] (remaining
concentration divide by the initial concentration of isoproturon using P-25 7.5
g litre-1
under UVA) and time, in this graph k = 0.018 min-1
The optimum curves relating to under UVA and UVC photocatalysis were
plotted between the reaction rate constant of isoproturon and variable
concentration of P-25 TiO2, as shown in Figure 6.14. The data confirms that
the optimum concentration of P-25 TiO2 was equal to 5 g litre-1
, the same
value as in the stirred system reported in Chapter 5. It can be seen from Figure
6.14 that beyond the optimum P-25 TiO2 concentration, the reaction rate
constant of isoproturon drastically decreased in the case of UVA and remained
almost constant in the case of UVC.
ln [
CR]/
[C0]

192
Figure 6.14 Optimum P-25 TiO2 loading of the fluidised bed photoreactor
under UVA (a), and UVC (b) irradiation for photocatalytic degradation of
isoproturon, k value was calculated from Figure 6.8, and Figure 6.12 of
isoproturon degradation
6.7 Influence of catalyst type (P-25 TiO2 VS synthesised TiO2)
In this section, degradation of the pesticides was conducted using the
synthesised TiO2 from ScWHS (Section 3.3) to compare the photocatalytic
efficiency with P-25 TiO2 under the same conditions. The TiO2 synthesised
Figure 6.14 (a)
Figure 6.14 (b)

193
by ScWHS was further modified by drying at 80 °C for two days, followed by
sintered at 900 °C for an hour. Both sets of experiments with the two TiO2
catalysts were studied at a concentration of 5 g litre-1
.The P-25 TiO2 catalyst
was also sintered at the same temperature.
The results under UVA and UVC of the degradation of isoproturon are shown
in Figures 6.15 and 6.16. The results of the degradation of the three pesticides
photolysis using this fluidised bed photoreactor without any catalyst were also
plotted in every graph to provide a baseline against which to measure the
effectiveness of the catalyst. Both Figure 6.15 and Figure 6.16 clearly show
that there was no difference in the rate of degradation of the pesticide in the
presence of the synthesised TiO2 as compared to the UVA and UVC
photolysis of isoproturon.
Figure 6.15 Photocatalytic degradation of isoproturon under UVA using
synthesised TiO2 5 g litre-1
compared with using P-25 TiO2 5 g litre-1

194
Figure 6.16 Photocatalytic degradation of isoproturon under UVC using
synthesised TiO2 5g litre-1
compared with using P-25 TiO2 5 g litre-1
The results under UVA and UVC of the degradation of simazine using the
synthesised TiO2 after sintering at 900º C are compared with the sintered P-25
TiO2 in Figure 6.17 and Figure 6.18. With simazine, the synthesised TiO2 has
a lower photocatalytic performace than P-25 TiO2 after using both UVA and
UVC.

195
Figure 6.17 Photocatalytic degradation of simazine under UVA using
synthesised TiO2 5 g litre-1
compared with using P-25 TiO2 5 g litre-1
Figure 6.18 Photocatalytic degradation of simazine under UVC using
synthesised TiO2 5 g litre-1
compared with using P-25 TiO2 5 g litre-1
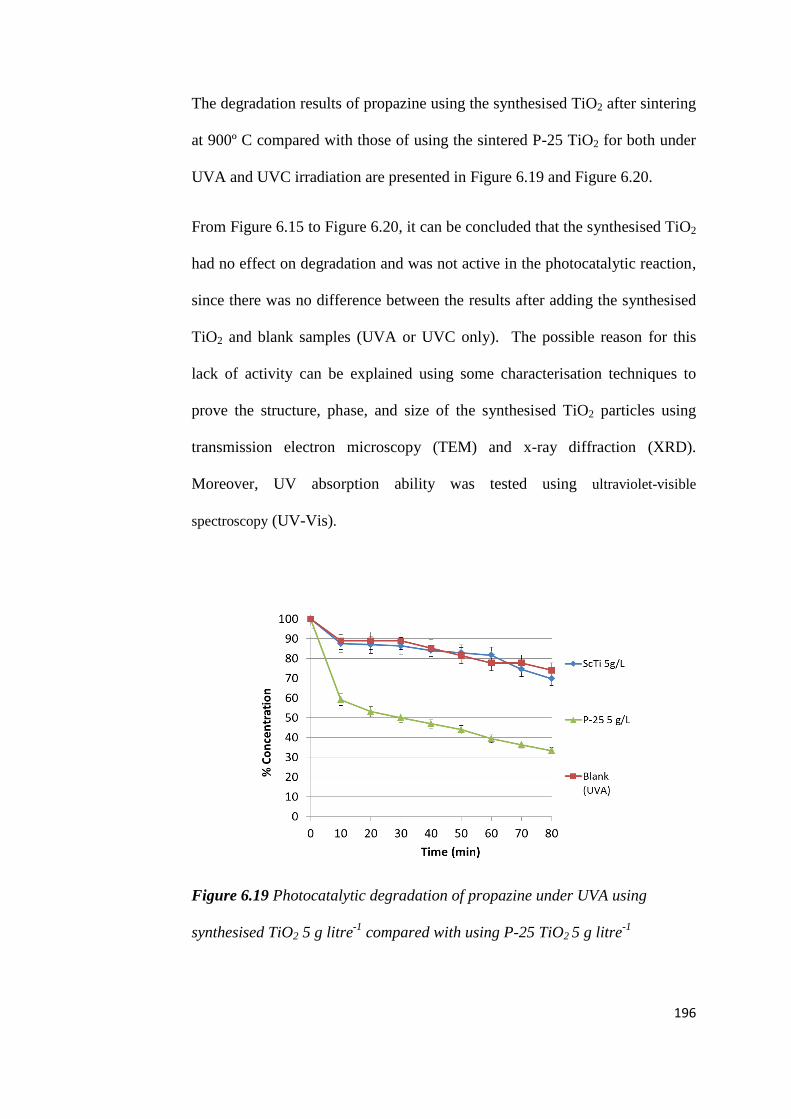
196
The degradation results of propazine using the synthesised TiO2 after sintering
at 900º C compared with those of using the sintered P-25 TiO2 for both under
UVA and UVC irradiation are presented in Figure 6.19 and Figure 6.20.
From Figure 6.15 to Figure 6.20, it can be concluded that the synthesised TiO2
had no effect on degradation and was not active in the photocatalytic reaction,
since there was no difference between the results after adding the synthesised
TiO2 and blank samples (UVA or UVC only). The possible reason for this
lack of activity can be explained using some characterisation techniques to
prove the structure, phase, and size of the synthesised TiO2 particles using
transmission electron microscopy (TEM) and x-ray diffraction (XRD).
Moreover, UV absorption ability was tested using ultraviolet-visible
spectroscopy (UV-Vis).
Figure 6.19 Photocatalytic degradation of propazine under UVA using
synthesised TiO2 5 g litre-1
compared with using P-25 TiO2 5 g litre-1

197
Figure 6.20 Photocatalytic degradation of propazine under UVC using
synthesised TiO2 5 g litre-1
compared with using P-25 TiO2 5 g litre-1
6.7 Transmission Electron Microscopy (TEM) results
TEM characterisations of both commercial P-25 TiO2 and the synthesised
TiO2 were carried out to compare the particle size, as shown in Figure 6.21
and Figure 6.22 for P-25 TiO2 and the synthesised TiO2, respectively. As seen
in Figure 6.21, the particle size of P-25 TiO2 is varied from 25-50 nm. The
size of the synthesised TiO2 was smaller than P-25 TiO2, which was 10-15 nm.
However, the high surface area of the synthesised TiO2 leads to the
agglomeration of particles, as can be seen in Figure 6.27 (b). This
agglomeration is one of the reasons why the synthesised TiO2 had lower
photocatalytic efficiency compared to P-25 TiO2. In addition, the synthesised
TiO2 was not as active as the commercial P-25 TiO2, since the data showed the
same trend as the blank.

198
Figure 6.21 TEM photograph of P-25 TiO2 in aqueous suspension

199
Figure 6.22 TEM photograph of synthesised TiO2 in aqueous suspension (a
fine particles with the size of 10-15 nm (b) start to agglomerate due to high
surface area
(a)
(b)

200
6.8 X-Ray Diffraction (XRD) results
Bulk TiO2 in anatase phase underwent the transition to rutile phase when
heated to a temperature above 700 º C, as described in Section 2.11 (Radwan,
2005; Pelaez et al., 2012; Ahmed et al., 2011). For the synthesised TiO2 from
the supercritical water hydrothermal synthesis (ScWHS), the phase remains
anatase even at temperatures as high as 1000 ºC, as shown in the XRD results
in Chapter 5, Figure 5.19. This is the other reason why this TiO2 had lower
photocatalytic performance than P-25 TiO2 at any temperature. From the
review of the literature in Chapter 2, P-25 TiO2 composed of 75 % anatase
phase and 25 % rutile (Singh and Muneer 2004; Singh et al., 2007; Ahmed et
al., 2011) which suggests a co-operative performance in photocatalytic
reaction, as proposed by many researchers (Qourzal et al., 2008; Hurum et al.,
2003; Yeredla and Xu, 2008).
6.9 Ultraviolet-visible Spectroscopy (UV-Vis) results
The UV-Vis characterisation of the synthesised TiO2, compared with the
commercial P-25 TiO2, was performed in this section. The result of UV-Vis
absorption on both types of TiO2 is shown in Figure 6.25. The synthesised
TiO2 had higher absorptivity at low wavelength (at 200 nm to 350 nm) when
compared to the P-25 TiO2. From Figure 6.23, the commercial P-25 TiO2 has
better UV absorption than the synthesised variety. The cut-off wavelength, the
wavelength that has lowest UV absorptivity, of P-25 TiO2 was equal to 410.57
nm. In the case of the synthesised TiO2, the cut-off wavelength was equal to
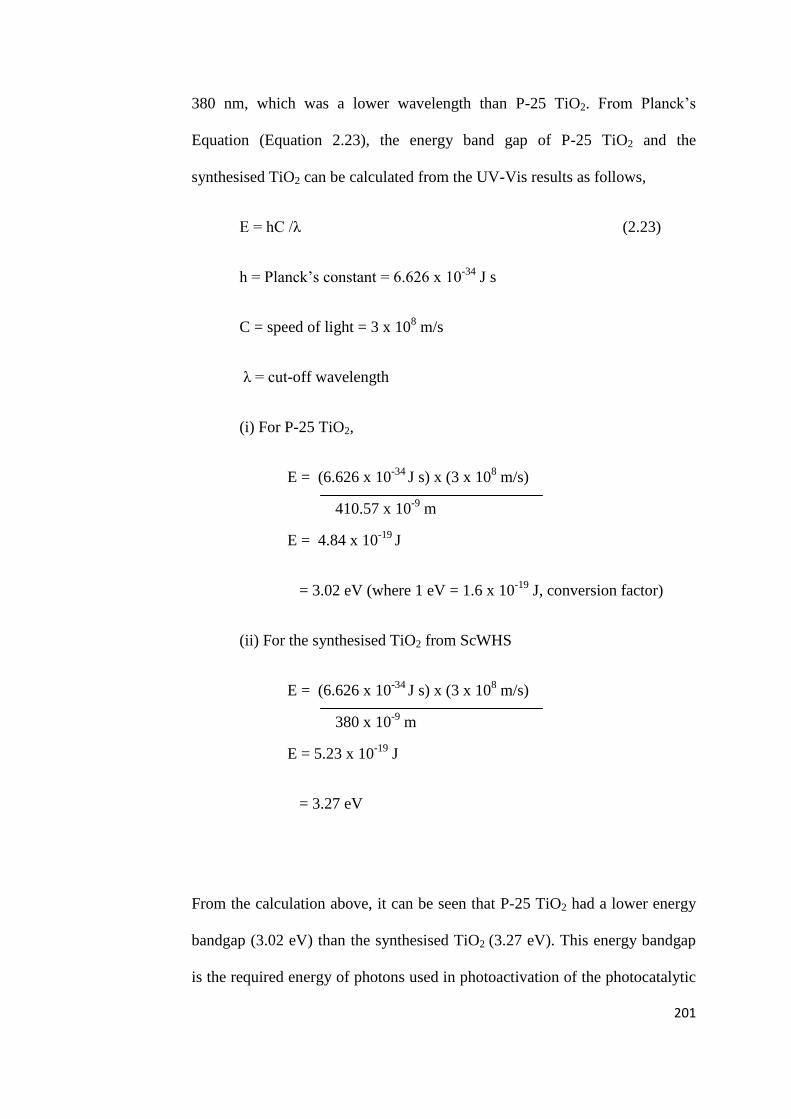
201
380 nm, which was a lower wavelength than P-25 TiO2. From Planck’s
Equation (Equation 2.23), the energy band gap of P-25 TiO2 and the
synthesised TiO2 can be calculated from the UV-Vis results as follows,
E = hC /λ (2.23)
h = Planck’s constant = 6.626 x 10⁻³⁴
J s
C = speed of light = 3 x 10⁸ m/s
λ = cut-off wavelength
(i) For P-25 TiO2,
E = (6.626 x 10⁻³⁴
J s) x (3 x 10⁸ m/s)
410.57 x 10⁻⁹
m
E = 4.84 x 10⁻¹⁹
J
= 3.02 eV (where 1 eV = 1.6 x 10⁻¹⁹
J, conversion factor)
(ii) For the synthesised TiO2 from ScWHS
E = (6.626 x 10⁻³⁴
J s) x (3 x 10⁸ m/s)
380 x 10-9
m
E = 5.23 x 10⁻¹⁹
J
= 3.27 eV
From the calculation above, it can be seen that P-25 TiO2 had a lower energy
bandgap (3.02 eV) than the synthesised TiO2 (3.27 eV). This energy bandgap
is the required energy of photons used in photoactivation of the photocatalytic

202
reaction. If the photocatalyst has a low energy bandgap, the required energy
for photocatalytic reaction is also low. This means there is a high possibility of
a photocatalytic reaction occurring even at low photon energy levels; the
lower the bandgap, the higher the efficiency of the photocatalyst. Therefore,
the synthesised TiO2 had inferior photocatalytic efficiency when compared to
P-25 TiO2.
The synthesised TiO2 has pure anatase phase which can absorb only the lower
wavelength, whereas the commercial P-25 TiO2 has 25 wt% rutile, which can
absorb at the longer wavelength up to 400 nm, as explained in Section 2.11.
Figure 6.23 UV-Vis spectroscopy of the P-25 TiO2 comparing with the
synthesised TiO2
6.10 Conclusions of fluidised bed photoreactor experiments
In this chapter, several experiments were carried out using a fluidised bed
photoreactor. The pesticide concentration adsorbed on TiO2 particles was

203
between 10-15%, due to high concentration of TiO2. There was almost no
difference between the concentration loss of isoproturon, simazine, and
propazine. In photolysis and photocatalytic reaction, UVC showed higher
performance than UVA, which is in accordance with the results using other
types of reactor (Chapter 4: TFFBR and Chapter 5: stirred photoreactor).
Amongst the three reactors studied, the fluidised bed showed the highest
photodegradation efficiency, yielding the highest degradation concentration of
the three pesticides from both UVA and UVC photolysis and photocatalytic.
The fluidised bed photoreactor has counter-current mixing of air bubbling
from the bottom of the column, while the sintered TiO2 was introduced from
the top, and dropped to the bottom of the column by gravity. This increases the
contact area and contact time between oxygen molecules and the TiO2 surface.
Moreover, the UV intensity is another reason, since there is high surface for
UV illumination in the length dimension of the column. The influence of
different photocatalyst loading on the pesticide degradation was performed
and resulted in the optimal TiO2 concentration = 5 g litre -1
, which was similar
to the case of the stirred photoreactor (Chapter 5). The photocatalytic
mechanism of UVC illumination was different from UVA. In the case of
UVA, the reaction rate was defined as the first order, whereas for UVC it was
defined as the second order. For the fluidised bed reactor, isoproturon has the
lowest stability amongst the three chosen pesticides. Photolysis and
photocatalytic of pesticide solutions under the UVA and the UVC irradiation
were studied and compared, using the P-25 TiO2 and the synthesised TiO2.
The P-25 TiO2 had extremely performance in photocatalytic activity.
However, the (sintered) synthesised TiO2 showed inferior photocatalytic

204
efficiency. This result corresponds with the results from the other two reactors
(Chapter 4: TFFBR, Chapter 5: stirred photoreactor). The various
characterisations of TiO2, which was synthesised by the super critical water
hydrothermal synthesis process (ScWHS) were also carried out. In TEM
images, the particle size of the synthesised TiO2 was approximately 10-15 nm,
which was smaller than P-25 TiO2 (25-50 nm). However, an agglomeration
was clearly shown, which may be one reason why the synthesised TiO2 had
low efficiency. The results from XRD at different sintering temperatures also
supported this discovery, by showing no phase transition appear at any
temperature from 30-1000 ºC. In addition, UV-Vis results disclosed that the
commercial TiO2 absorb at the visible wavelength better than the synthesised
one.

205
Chapter 7
CONCLUSIONS AND RECOMMENDATIONS
7.1 Overview of results and experimental work
This chapter concludes the main achievements of work presented in this thesis
and suggests recommendations for future work.
The main objectives of this study are reiterated:
(i) To use TiO2 nanoparticles synthesised by the supercritical water in the
waste water treatment
(ii) To characterise TiO2 produced via hydrothermal synthesis using
Scanning Electron Microscopy (SEM), Transmission Electron
Microscopy (TEM), Ultraviolet-Visible absorption spectroscopy
(UV-Vis) and X-Ray Diffraction (XRD)
(iii)To design, construct and develop three different types of reactors (thin
film fixed bed reactor, stirred reactor and fluidised bed
photoreactor) for the treatment of the water polluted by three
pesticides
(iv) To evaluate the effectiveness of commercial P-25 TiO2 compared with
ScWHS synthesised TiO2 when applied to the photocatalytic
degradation of the aqueous solutions of three selected pesticides
(isoproturon, simazine and propazine)

206
(v) To study the effect of the operating parameters such as catalyst
concentration, pesticide concentration, and the wavelength of light
on the photocatalytic degradation of the pesticides
7.2 Conclusions
(i) The adsorption mechanism of pesticide solutions onto TiO2 has no
influence on the photocatalytic degradation of isoproturon, simazine and
propazine. The results suggested that the decreases of the three pesticide
concentrations, under darkness, were only 10% of the initial
concentration.
(ii) UVC has more effect on both photolysis and photocatalytic reaction
when compared to UVA. Under UVC illumination, the decrease of the
concentrations of isoproturon, simazine, and propazine was higher than
under UVA, after 90 minutes. This corresponds to Planck’s equation, a
relationship between photon energy and light wavelength.
(iii) The commercial TiO2 (P-25 TiO2) has high performance and is the
important part of the photocatalytic reaction, since photolysis showed
lower pesticide degradation than in the case of a photocatalytic (adding
TiO2). The optimum concentration of P-25 TiO2 was found to be
equivalent to 5 g/litre while using the fluidised bed photoreactor and
stirred reactor.
(iv) The efficiency of the synthesised TiO2 from ScWHS techniques is
lower than that of P-25 TiO2. It can be referred to many results in

207
Chapter 5 and 6 that degradation of isoproturon, simazine and propazine
was nearly the same amount as without any photocatalyst (UV alone or
photolysis reaction). In addition, P-25 TiO2 has superior photocatalytic
performance, since degradation levels of the concentration of
isoproturon, simazine and propazine, after using P-25 TiO2, were
significantly higher than after using the synthesised TiO2.
(v) The fluidised bed photoreactor presented the highest performance
among the three types of reactor, because there was a counter-current
flow of water and oxygen, initiating a thorough mixing process which
helps oxygen molecules to attach themselves onto photocatalyst
surfaces. Moreover, the design of the fluidised bed photoreactor had the
advantage that two UV lamps were set up nearby and covered almost all
the surface area of the reactor (quartz tube).
(vi) Amongst the three selected pesticides, photocatalytic degradation of
isoproturon was the highest. However, in case of photolysis, the
decrease of simazine concentration was higher than isoproturon and
propazine.
(vii) There was an assumption that there was some effect from
dodecenyl succinic anhydride (DDSA) on adsorption of propazine on the
synthesised TiO2 surface, due to its polarity. DDSA is an additional
surfactant in the drying process for coating synthesised TiO2 on stainless
steel plate of the Thin Film Fixed Bed Reactor (TFFBR) in Chapter 4.

208
(viii) The synthesised TiO2 on the surface of the TFFBR has small
particles, as shown by SEM images in Chapter 4, when compared to the
TiO2 surface. EDAX data proposed that the surface of synthesised TiO2
contained high quantities of carbon molecules, which came from DDSA
and reduced photocatalytic efficiency.
(ix) The characterisation results of synthesised TiO2 in Chapter 6
showed that UV absorption slightly shifts to a visible wavelength from
Ultraviolet-visible Spectroscopy (UV-Vis) for P-25 TiO2, when compared
to the synthesised TiO2. However, there was a higher grain size due to
agglomeration of fine particles as shown in Transmission Spectroscopy
Microscope (TEM). Also, after sintering at 900 °C, the phase of
synthesised TiO2 was still anatase, having not changed to the rutile, as
seen from X-Ray Diffraction (XRD) results at different temperatures.
This led to inferior photocatalytic performance, when compared to P-25
TiO2.
7.3 Recommendations for future work
More characterisation techniques of synthesised TiO2 (by ScWHS) might be
advantage to explain in depth-detail for this study. A study of photocatalytic
kinetics over a wide concentration range of initial pesticides (0.5, 1, 2, 3, 4, 5,
6, 7, 8, 9, 10 ppm), using a stirred reactor and a fluidised bed photoreactor,
would be carried out to investigate the influence of pesticide concentration on
photocatalytic reaction rate and also optimise the most efficient initial

209
concentration that would achieve the highest degradation. Morover, the studies
of other operation parameters, such as oxygen flowrate, H2O2 or using
different light intensities should be included. Further development of
synthesised TiO2 by the supercritical water hydrothermal method, or other
techniques, would be beneficial for the photocatalytic treatment of water.
Adding some metals or chemical compounds into the nanoparticles synthesis
process would also be interesting to investigate; particularly whether they help
improve the ability of UV absorption and assist the photocatalytic reaction. In
addition, the impact of using supercritical water on oxidation would also be
valuable to study, as a challenging option for water treatment.
The main recommendations for future work are then related to the synthesis of
immobilised photocatalysts by coating TiO2 on ceramics, polymers, or
activated carbon to improve fluidised bed efficiency, working on the pilot
plant scale, doing simulation and evaluating the cost of the fluidised bed as it
has high performance in photocatalytic reaction compared to other reactor.

210
APPENDICES
These appendices (I, II, III) show the average remaining concentration (in %
of initial concentration of pesticide), variance, and the probability from two-
tail T-tests comparing two sets of data, as an analysis database, to find out
whether there are significant differences.
(i) When the probability value of the T-test is higher than 0.05 (critical
value): there is no significant difference between two sets of data
(ii) When the probability value of the T-test is lower than or equal to 0.05
(critical value): there is a significant difference between two sets of
data
Appendix I: Student T-test for TFFBR results
Appendix II: Student T-test for stirred photoreactor results
Appendix III: Student T-test for fluidised bed photoreactor
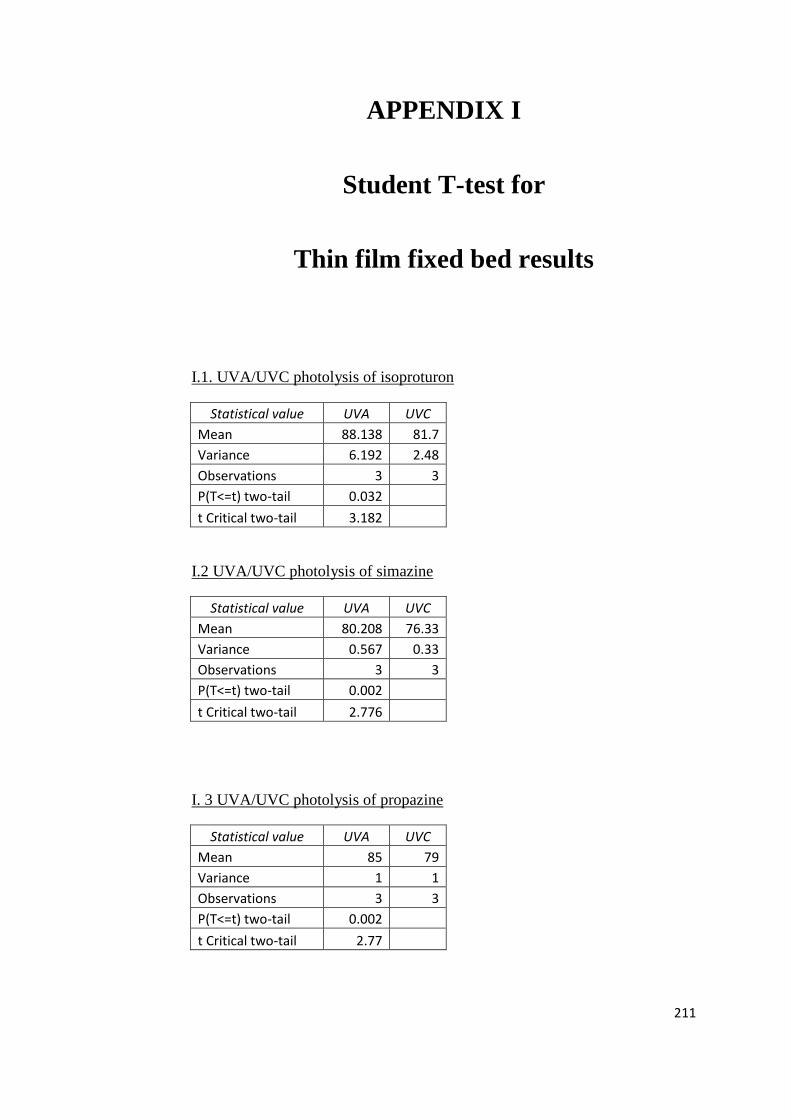
211
APPENDIX I
Student T-test for
Thin film fixed bed results
I.1. UVA/UVC photolysis of isoproturon
Statistical value UVA UVC
Mean 88.138 81.7
Variance 6.192 2.48
Observations 3 3
P(T<=t) two-tail 0.032
t Critical two-tail 3.182
I.2 UVA/UVC photolysis of simazine
Statistical value UVA UVC
Mean 80.208 76.33
Variance 0.567 0.33
Observations 3 3
P(T<=t) two-tail 0.002
t Critical two-tail 2.776
I. 3 UVA/UVC photolysis of propazine
Statistical value UVA UVC
Mean 85 79
Variance 1 1
Observations 3 3
P(T<=t) two-tail 0.002
t Critical two-tail 2.77

212
I.4 UVC photolysis of isoproturon VS simazine
Statistical value Isoproturon Simazine
Mean 82.268 76.454
Variance 0.062 0.26
Observations 3 3
P(T<=t) two-tail 0
t Critical two-tail 3.182
I.5 UVC photolysis of simazine VS propazine
Statistical value Simazine Propazine
Mean 76.454 78
Variance 0.256 1
Observations 3 3
P(T<=t) two-tail 0.011
t Critical two-tail 3.182
I.6 UVC photolysis of isoproturon VS propazine
Statistical value Isoproturon Propazine
Mean 82.26 78
Variance 0.062 1
Observations 3 3
P(T<=t) two-tail 0
t Critical two-tail 2.776
I.7 UVA photolysis of isoproturon VS simazine
Statistical value Isoproturon Simazine
Mean 87.5 79.04
Variance 0.25 0.043
Observations 3 3
P(T<=t) two-tail 0
t Critical two-tail 3.182

213
I.8 UVA photolysis of simazine VS propazine
Statistical value Simazine Propazine
Mean 79.04 83.6
Variance 0.043 0.28
Observations 3 3
P(T<=t) two-tail 0.002
t Critical two-tail 3.182
I.9 UVA photolysis of isoproturon VS propazine
Statistical value Isoproturon Propazine
Mean 87.5 83.6
Variance 0.25 0.28
Observations 3 3
P(T<=t) two-tail 0
t Critical two-tail 2.776
I.10 UVA photocatalytic of isoproturon at high flow rate (100 ml min-1
) VS
low flow rate (20 ml min-1
)
Statistical value High flow Low flow
Mean 75.17 73.6
Variance 1.088 2.325
Observations 3 3
P(T<=t) two-tail 0.219
t Critical two-tail 2.776
I.11 UVA photocatalytic of simazine at high flow rate (100 ml min-1
) VS low
flow rate (20 ml min-1
)
Statistical value High flow Low flow
Mean 63.814 46.85
Variance 2.547 3.8
Observations 3 3
P(T<=t) two-tail 0
t Critical two-tail 2.776

214
I.12 UVA photocatalytic of propazine at high flow rate (100 ml min-1
)VS low
flow rate (20 ml min-1
)
Statistical value High flow Low flow
Mean 71.178 68.7
Variance 4.095 2.37
Observations 3 3
P(T<=t) two-tail 0.167
t Critical two-tail 2.776
I.13 UVC photocatalytic of isoproturon at high flow rate (100 ml min-1
)VS
low flow rate (20 ml min-1
)
Statistical value High flow Low flow
Mean 86.18 76.154
Variance 1.1 1.07
Observations 3 3
P(T<=t) two-tail 0
t Critical two-tail 2.776
I.14 UVC photocatalytic of simazine at high flow rate (100 ml min-1
) VS low
flow rate (20 ml min-1
)
Statistical value High flow Low flow
Mean 54.148 46.2
Variance 1.065 1.148
Observations 3 3
P(T<=t) two-tail 0
t Critical two-tail 2.776
I.15 UVC photocatalytic of propazine at high flow rate (100 ml min-1
) VS low
flow rate (20 ml min-1
)
Statistical value High flow Low flow
Mean 60.2 55.328
Variance 4.129 2.309
Observations 3 3
P(T<=t) two-tail 0.029
t Critical two-tail 2.776

215
I.16 UVC photocatalytic of isoproturon at low initial concentration (2.5 ppm)
VS high initial concentration (20 ppm)
Statistical value 2.5 ppm 20ppm
Mean 51.44 77.154
Variance 0.26 0.607
Observations 3 3
P(T<=t) two-tail 0
t Critical two-tail 3.18
I.17 UVC photocatalytic of propazine at low initial concentration (2.5 ppm)
VS high initial concentration (20 ppm)
Statistical value 2.5 ppm 20 ppm
Mean 48.69 56.895
Variance 0.073 0.128
Observations 3 3
P(T<=t) two-tail 0
t Critical two-tail 2.776

216
APPENDIX II
Student T-test for
Stirred photoreactor results
II.1 Adsorption concentration of isoproturon VS simazine in the absence of
UV
Statistical value Isoproturon Simazine
Mean 95.883 95.561
Variance 8.317 6.414
Observations 3 3
P(T<=t) two-tail 0.804
t Critical two-tail 2.120
II.2 Adsorption concentration of simazine VS propazine in the absence of UV
Statistical value Simazine Propazine
Mean 95.561 96.325
Variance 6.414 2.446
Observations 3 3
P(T<=t) two-tail 0.455
t Critical two-tail 2.160

217
II.3 Adsorption concentration of isoproturon VS propazine in the absence of
UV
Statistical value Isoproturon Propazine
Mean 95.883 96.325
Variance 8.317 2.446
Observations 3 3
P(T<=t) two-tail 0.693
t Critical two-tail 2.179

218
APPENDIX III
Student T-test for
Fluidised bed photoreactor results
III.1 Adsorption concentration of isoproturon VS simazine in the absence of
UV
Statistical value Isoproturon Simazine
Mean 91.764 95.238
Variance 11.86 4.75
Observations 3 3
P(T<=t) two-tail 0.023
t Critical two-tail 2.145
III.2 Adsorption concentration of simazine VS propazine in the absence of UV
Statistical value Simazine Propazine
Mean 95.238 89.379
Variance 4.75 21.5
Observations 3 3
P(T<=t) two-tail 0.006
t Critical two-tail 2.201

219
III.3 Adsorption concentration of isoproturon VS propazine in the absence of
UV
Statistical value Isoproturon Propazine
Mean 91.764 89.379
Variance 11.86 21.5
Observations 3 3
P(T<=t) two-tail 0.235
t Critical two-tail 2.131
III.4 UVA photolysis of isoproturon VS simazine
Statistical value Isoproturon simazine
Mean 76 68.57
Variance 1 0
Observations 3 3
P(T<=t) two-tail 0.005
t Critical two-tail 4.3
III.5 UVA photolysis of simazine VS propazine
Statistical value Simazine Propazine
Mean 68.5 74.183
Variance 0.01 0.015
Observations 3 3
P(T<=t) two-tail 0
t Critical two-tail 2.77
III.6 UVA photolysis of isoproturon VS propazine
Statistical value Isoproturon Propazine
Mean 76 74.183
Variance 1 0.015
Observations 3 3
P(T<=t) two-tail 0.089
t Critical two-tail 4.3
III.7 UVC photolysis of isoproturon VS simazine

220
Statistical value Isoproturon Simazine
Mean 13.8 18.13
Variance 0.01 0.023
Observations 3 3
P(T<=t) two-tail 0
t Critical two-tail 3.18
III.8 UVC photolysis of simazine VS propazine
Statistical value Simazine Propazine
Mean 18.13 15.36
Variance 0.023 0.003
Observations 3 3
P(T<=t) two-tail 0.001
t Critical two-tail 4.3
III.9 UVC photolysis of isoproturon VS propazine
Statistical value Isoproturon Propazine
Mean 13.8 15.36
Variance 0.01 0.003
Observations 3 3
P(T<=t) two-tail 0
t Critical two-tail 3.18
III.10 UVA photolysis of isoproturon using fluidised bed VS stirred
photoreactor
Statistical value Fluidised bed Stirred reactor
Mean 76 87.33
Variance 1 1.33
Observations 3 3
P(T<=t) two-tail 0
t Critical two-tail 2.776
III.11 UVA photolysis of isoproturon using fluidised bed VS TFFBR

221
Statistical value Fluidised bed TFFBR
Mean 76 87.17
Variance 1 0.08
Observations 3 3
P(T<=t) two-tail 0.003
t Critical two-tail 4.3
III.12 UVA photolysis of simazine using fluidised bed VS stirred photoreactor
Statistical value Fluidised bed Stirred reactor
Mean 68.5 85
Variance 0.01 0.25
Observations 3 3
P(T<=t) two-tail 0
t Critical two-tail 4.3
III.13 UVA photolysis of simazine using fluidised bed VS TFFBR
Statistical value Fluidised bed TFFBR
Mean 68.5 79.04
Variance 0.01 0.043
Observations 3 3
P(T<=t) two-tail 0.003
t Critical two-tail 4.3
III.14 UVA photolysis of propazine using fluidised bed VS stirred
photoreactor
Statistical value Fluidised bed Stirred reactor
Mean 74.18 87
Variance 0.016 0
Observations 3 3
P(T<=t) two-tail 0
t Critical two-tail 4.3
III.15 UVA photolysis of propazine using fluidised bed VS TFFBR

222
Statistical value Fluidised bed TFFBR
Mean 74.18 83.6
Variance 0.015 0.28
Observations 3 3
P(T<=t) two-tail 0
t Critical two-tail 3.182446305
III.16 UVC photolysis of isoproturon using fluidised bed VS stirred
photoreactor
Statistical value Fluidised bed Stirred reactor
Mean 13.8 65.5
Variance 0.01 0.25
Observations 3 3
P(T<=t) two-tail 0
t Critical two-tail 4.3
III.17 UVC photolysis of isoproturon using fluidised bed VS TFFBR
Statistical value Fluidised bed TFFBR
Mean 13.8 82.268
Variance 0.01 0.062
Observations 3 3
P(T<=t) two-tail 0
t Critical two-tail 4.3
III.18 UVC photolysis of simazine using fluidised bed VS stirred photoreactor
Statistical value Fluidised bed Stirred reactor
Mean 18.13 67
Variance 0.023 0
Observations 3 3
P(T<=t) two-tail 0
t Critical two-tail 4.3
III.19 UVC photolysis of simazine using fluidised bed VS TFFBR

223
Statistical value Fluidised bed TFFBR
Mean 18.13 76.454
Variance 0.023 0.26
Observations 3 3
P(T<=t) two-tail 0
t Critical two-tail 3.18
III.20 UVC photolysis of propazine using fluidised bed VS stirred
photoreactor
Statistical value Fluidised bed Stirred reactor
Mean 15.36 68
Variance 0.003 0
Observations 3 3
P(T<=t) two-tail 0
t Critical two-tail 4.30
III.21 UVC photolysis of propazine using fluidised bed VS TFFBR
Statistical value Fluidised bed TFFBR
Mean 15.36 78
Variance 0.003 1
Observations 3 3
P(T<=t) two-tail 0
t Critical two-tail 4.3
III.22 UVA photocatalytic of isoproturon using fluidised bed VS stirred
photoreactor

224
Statistical value Fluidised bed Stirred reactor
Mean 11.58 0
Variance 0.453 0
Observations 3 3
P(T<=t) two-tail 0.001
t Critical two-tail 4.3
III.23 UVA photocatalytic of simazine using fluidised bed VS stirred
photoreactor
Statistical value Fluidised bed Stirred reactor
Mean 23.456 0
Variance 0.134 0
Observations 3 3
P(T<=t) two-tail 0
t Critical two-tail 4.3
III. 24 UVA photocatalytic of propazine using fluidised bed VS stirred
photoreactor
Statistical value Fluidised bed Stirred reactor
Mean 28.29 0
Variance 0.24 0
Observations 3 3
P(T<=t) two-tail 0
t Critical two-tail 4.3
BIBIOLOGRAPHY

225
Abramovic B. F., Anderluh V. B., Topalov A. S. and Gaal F. F., Titanium
dioxide mediated photocatalytic degradation of 3-amino-2-chloropyridine
App. Cat. B: Environ. 48 (2004) 213-221.
Ahmed S., Rasul M.G., Brown R., Hashib M.A. Influence of parameters on
the heterogeneous photocatalytic degradation of pesticides and phenolic
contaminants in wastewater: A short review. J. Env. Man. 92 (2011) 311-330.
Aimable A.,Muhr H.,Gentric C.,Bernard F., Le Cras F., Aymes D. Continuous
hydrothermal synthesis of inorganic nanopowders in supercritical water:
Towards a better control of the process Powd. Tech. 190(1-2)(2009) 99-106.
Akpan U.G. and Hameed B.H. Parameters affecting the photocatalytic
degradation of dyes using TiO2-based photocatalysts: A review J. Haz. Mat.
170 (2009) 520–529.
Alexander V. V., Evgueni N. S. and Panagiotis G. S., Vibrofluidized- and
fixed-bed photocatalytic reactors: case of gaseous acetone photooxidation
Chem. Eng. Sci. 55(21) (2000) 5089-5098.
Aungpradit T., Sutthivaiyakit P., Martens D., Sutthivaiyakit S., Kettrup A. A.
F. Photocatalytic degradation of triazophos in aqueous titanium dioxide
suspension: Identification of intermediates and degradation pathways J.
Hazard. Mat. 146 (2007) 204-213.
Aramendia M. A., Marinas A., Marinas J. M., Moreno J. M., Urbano F.
Photocatalytic degradation of herbicide fluoroxypyr in aqueous suspensions of
TiO2 Cat. Today 101 (2005) 187-193.
Atashfaraz, M., M. Shariaty-Niassar, et al. Effect of titanium dioxide solubility
on the formation of BaTiO3 nanoparticles in supercritical water Fluid Phase
Equ. 257(2) (2007) 233-237.
Axelsson A.K. and Dunne L.J. Mechanism of photocatalytic oxidation of 3, 4-
dichlorophenol on TiO2 semiconductor surfaces J. Photochem. Photobio. A:
Chem. 144(2-3) (2001) 205-213.
Azizi S., Sehili T., Djebbar K., Comparative Study of Phototransformation of
Isoproturon Aqueous Solution by UV/H2O2 Treatment, Fenton’s Reagent,
Photo-Fenton and Photocatalytic Processes J. Env. Eng. Tech. 2 (1) (2013)
17-24.
Barcelo D., Durand G., Bertrand N., Albaiges J. Determination of aquatic
photodegradation products of selected pesticides by gas chromatography-mass

226
spectrometry and liquid chromatography-mass spectrometry Sci. Total Env.
132 (2–3) (1993), 283–296.
Bahnemann D., Photocatalytic water treatment: solar energy applications. Solar Energy 77 (2004) 445-459.
Bambang V. and Jae-Duck K. Supercritical water oxidation for the destruction
of toxic organic wastewaters: A review. J. Env. Sci. 19 (2007): 513-522.
Benitez J., Real F. J., Acero J. L., Garcia C. Photochemical oxidation
processes for the elimination of phenyl-urea herbicides in waters J. Hazard.
Mat. B 138 (2006) 278–287
Bermejo M. D. and Cocero M.J. Supercritical water oxidation: a technical
review AIChE J. 52 (11) (2006) 3933-3951
Bickley, R. I., M. J. Slater, et al. Operating experience and performance
evaluation of a photocatalytic Reactor Proc. Safety Env. Prot. 83 (3) (2005)
217-223.
Bickley R. I., Slater M. J., Wang W. J., Engineering development of a
photocatalytic reactor for waste water treatment Proc. Safety Env. Prot. 83
(B3) (2005) 205-216.
Bigda, R. Consider Fenton’s chemistry for wastewater treatment. Chem. Eng.
Prog. 91 (12) (1995) 62-66.
Bhatkhande, D. S., Pangarkar, V.G., Beenackers, AA. CM., Photocatalytic
degradation for environmental applications:a review J. Chem. Tech. Bio. 77
(2011) 102-116.
Bozzi A., Dhananjeyan M., Guasaquillo I., Parra S., Pulgarin C., Weins C.,
and Kiwi J. Evolution of toxicity during melamine photocatalysis with TiO2
suspensions, J. Photochem. Photobio. A 162(1) (2004) 179–185.
Braham R. J. and Harris A. T., Review of major design and scale-up
considerations for solar photocatalytic reactors Ind. Eng. Chem. Res. 48
(2009) 8890-8905.
Byrappa K. and Adschiri T. Hydrothermal technology for nanotechnology Prog. Crys. Growth Char. Mat. 53(2) (2007) 117-166.
Cabanas A., Li J., Blood P.,Chudoba T., Lojkowski W., Poliakoff M., Lester
E. Synthesis of nanoparticulate yttrium aluminum garnet in supercritical
water-ethanol mixtures J. Supercritical Fluids 40(2) (2007) 284-292.
Cabanas A., Darr J. A.,Lester E., Poliakoff M., J. Mat. Chem. 11 (2) (2001)
561-568.

227
Cabanas A. and Poliakoff M. Continuous hydrothermal synthesis of inorganic
materials in a near-critical water flow reactor; the one-step synthesis of nano-
particulate Ce1-xZrxO2 (x=0-1) solid solutions J. Mat. Chem. 11 (2001)
1408-1416.
Calza P., Massolino C., Pelizzetti E., Light induced transformations of
selected organophosphorus pesticides on titanium dioxide: pathways and by-
products evaluation using LC–MS technique J. Photochem. Photobio. A:
Chem. 199 (2008) 42-49.
Calza P., Sakkas V. A., Villioti A., Massolino C., Boti V., Pelizzetti E.,
Albanis T., Multivariate experimental design for the photocatalytic
degradation of imipramine: determination of the reaction pathway and
identification of intermediate product App. Cat. B: Environ. 84 (2008) 379-
388.
Calza P., Massolino C., Pelizzetti E., Photo-induced transformation of
hexaconazole and dimethomorph over TiO2 suspension J. Photochem.
Photobio. A: Chem. 200 (2008) 356-363.
Carp O., Huisman C. L., and Reller A. Photoinduced reactivity of titanium
dioxide Prog. Solid State Chem. 32 (2004) 33–177.
Cassano A. E., and Alfano O. M., Reaction engineering of suspended solid
heterogeneous photocatalytic reactors, Cat. Today 58 (2000) 167-197.
Chong, M.N., Lei, S., Jin, B., Saint, C., Chow, C.W.K. Optimisation of an
annular photoreactor process for degradation of Congo red using a newly
synthesized titania impregnated kaolinite nano-photocatalyst. Sep. Purif.
Tech. 67 (2009) 355-363.
Chong, M. N., B. Jin, et al., Recent developments in photocatalytic water
treatment technology: a review Water Res.44 (10) (2010) 2997-3027.
Chu W., Rao Y., Hui W. Y. Removal of simazine in a UV/TiO2 heterogeneous
system J. Agric. Food Chem 57 (2009) 6944–6949.
Chudoba T., Lester E.,Lojkowski W.,Poliakoff M., Li J., Grzanka E., Presz A.
Synthesis of nano-sized yttrium-aluminum garnet in a continuous-flow reactor
in supercritical fluids J. Chem. Sci.63 (6) (2008) 756-764.
Comber S. DW., Abiotic persistence of atrazine and simazine in water Pestic.
Sci. 55 (1999) 696-702.
Comninellis C., Kapalka A., Malato S., Parsons S. A., Poulious I.,
Mantzavinos D., Perspective advanced oxidation processes for water
treatment: advances and trends for R&D J. Chem. Tech. Biotech. 83 (2008)
769-776.

228
Coleman H.M., Vimonses V., Leslie G. and Amal R. Removal of
contaminants of concern in water using advanced oxidation techniques Water
Sci. Tech. 55 (12) (2007) 301–306.
Colina-Marquez J., Machuca-Martinez F. and Li Puma G., Photocatalytic
mineralization of commercial herbicides in a pilot-scale solar CPC reactor:
photoreactor modeling and reaction kinetics constants independent of radiation field
Env. Sci. Tech. 43 (2009) 8953-8960.
Croll, B. T., Pesticides in surface waters and groundwaters J. Insti Water and
Env. man.5 (4) (1991) 389-395.
Devipriya S. and Yesodharan S., Photocatalytic degradation of pesticide
contaminants in water Solar Energy Mat. Solar Cells 86 (2005) 309-348.
Dijkstra M. F. J., Koerts E. C. B., Beenackers A. A. C. M., Wesselingh J. A.,
Performance of immobilized photocatalytic reactors in continuous mode AIChE J. (2003) 734-744.
Diosyniou D. D., Barasubramanian G., Suidan M.T., Khoddadoust A.P.,
Baudin I. and Laine J.-M. Rotating disk photocatalytic reactor: development,
characterization, and evaluation for destruction of organic pollutants in water
Wat. Res. 34 (11) (2000) 2927-2940.
Dong S., Zhou D., Bi X. T. Effects of liquid and gas flow rates on the
performance of a fluidized bed photocatalytic reactor Int. J. Chem. Reactor
Eng. 6 (2008) Article A100 1-15.
Echavia G. R. M., Matzusawa F., Negishi N., Photocatalytic degradation of
organophosphate and phosphonoglycine pesticides using TiO2 immobilized on
silica gel Chemosphere 76 (2009) 595-600.
Edwards H. K.,Evans E.,McCaldin S.,Blood P.,Gregory D. H.,Poliakoff
M.,Lester E.,Walker G. S., Brown P. D., Hydrothermally synthesised Fe2O3
nanoparticles as catalyst precursors for the CVD production of graphitic
nanofibres EMAG-NANO 2005: Imaging, Analysis and Fabrication on the
Nanoscale 26 (2006) 195-198.
Evgenidou, E., and Fytianos, K. Photodegradation of trazine herbicides in
aqueous solutions and natural waters. J. Agric. Food Chem. 50(2002) 6423-
6427.
Fang, Z. Rapid production of micro- and nano-particles using supercritical
water Eng. Mat. 30(2011) 11-27.
Faramazpour M., Vossough M., Borghei M., Photocatalytic degradation of
furfural by titania nanoparticles in a floating-bed photoreactor Chem. Eng. J.
146 (2009) 79-85.

229
Feitz A.J., Boyden B.H and Waite T.D., Evaluation of two solar pilot scale
fixed-bed photocatalytic reactors Water Res. 34 (2000) (16) 3927.
Florencio M. H., Pires D.E., Castro A. L., Nunes M. R., Borges C., Costa F.
M., Photodegradation of diquat and paraquat in aqueous solutions by titanium
dioxide: evolution of degradation reactions and characterization of
intermediates Chemosphere 55 (2004) 345-355.
Fox, M. A., Dulay, M.T. Heterogeneous photocatalysis Chem. Rev. 93 (1993)
341-357.
Fujishima, A., Honda, K., Electrochemical photolysis of water at a
semiconductor electrode Nature 238 (1972) 37-38.
Galvez J.B. and Rodriguez S.M. Solar detoxification.
(http://unesdoc.unesco.org/images/0012/001287/128772e.pdf)
Garcia J. C., Takashima K., Photocatalytic degradation of imazaquin in an
aqueous suspension of titanium dioxide J. Photochem. Photobio. A: Chem.
155 (2003) 215-222.
Garcia, A. M. A., A. Arques ,R. Sanchis ,W. Gernjak,M. I. Maldonado, I.
Oller, S. Malato, Detoxification of aqueous solutions of the pesticide “Sevnol”
by solar photocatalysis Env. Chem. Lett. 3 (2006)169-172.
Gemelli, E. and Camargo, N.H.A. Oxidation kinetics of commercially pure
titanium Revista Matéria 12(3) (2007) 525 – 531.
http://www.materia.coppe.ufrj.br/sarra/artigos/artigo10919
Gora A., Toepfer B., Puddu V., Li Puma G., Photocatalytic oxidation of
herbicides in single-component and multicomponent systems: Reaction
kinetics analysis App. Cat. B: Env. 65 (2006) 1-10.
Gunasekara A.S., Environmental fate of simazine, 2004
(www.cdpr.ca.gov/docs/emon/pubs/fatememo/simazine.pdf)
Hamilton D. J., Ambrus A., Dieterle R.M., Felsot A.S., Harris, C.A., Holland
P.T., Katayama A., Kurihara N., Linders J., Unsworth J. and Wong S.S.,
Regulatory limits for pesticide residues in water (IUPAC technical report)
Pure Appl. Chem.75 (8) (2003) 1123–1155.
Han S., Li J., Xi H., Xu D., Zuo Y., Zhang J., Photocatalytic decomposition of
acephate in irradiated TiO2 suspensions J. Hazard. Mat. 163 (2009) 1165-
1172.
Hatakeda K., Ikushima Y., Sato O., Aizawa T., and Saito N. Supercritical
water oxidation of polychlorinated biphenyls using hydrogen peroxide Chem.
Eng. Sci. 54 (1999) 3079.

230
Haque M. M., and Muneer M., Photodegradation of norfloxacin in aqueous
suspensions of titanium dioxide J. Hazard. Mat. 145 (2007) 51-57.
Haque M. M. and Muneer M., Heterogeneous photocatalysed degradation of a
herbicide derivative, isoproturon in aqueous suspension of titanium dioxide J.
Env. Man. 69 (2003) 169-176.
Hequet V., Gonzalez C., Le Cloirec P., Photochemical processes for atrazine
degradation: methodological approach Water Res. 35 (18) (2001) 4253-4260.
Herrmann, J.M. Heterogeneous photocatalysis: fundamentals and applications
to the removal of various types of aqueous pollutants Cat. Today 53 (1999)
115-129.
Hirahara Y., Ueno H., and Nakamuro K., Comparative photodegradation study
of fenthion and disulfoton under irradiation of different light sources in liquid-
and solid-phases J. Health Sci. 47(2) (2001) 129-135.
Hincapie M., Maldonado M.I., Oller I., Gernjak W., Sanchez-Perez J.A.,
Ballesteros M.M., Malato S. Solar photocatalytic degradation and
detoxification of EU priority substances Cat. Today 101 (2005) 203–210.
Hobbs H., Briddon S., Lester E. The synthesis and fluorescent properties of
nanoparticulate ZrO2 doped with Eu using continuous hydrothermal synthesis
Green Chem. 11(4) (2009) 484-491.
Hoffmann M.R., Martin S.T., Choi W., and Bahnemann D.W. Environmental
applications of semiconductor photocatalysis Chem. Rev. 95 (1995) 69-96.
Horikoshi S., Hidaka H. Non-degradable triazine substrates of atrazine and
cyanuric acid hydrothermally and in supercritical water under the UV-
illuminated photocatalytic cooperation Chemosphere 51 (2003) 139-142.
Hurum D. C., Agrios A. G., Gray K.A., Rajh T. and Thurnauer M. C.
Explaining the enhanced photocatalytic activity of Degussa P-25 mixed-phase
TiO2 using EPR J. Phys. Chem. B 107 (2003) 4545-4549.
Igor M. S. and Andriy P. Supercritical water oxidation of o-dichlorobenzene:
degradation studies and simulation insights J. Supercritical Fluids 37(2006):
94-101.
Kaneco S., Li N., Itoh K., Katsumata H., Suzuki T., Ohta K., Titanium dioxide
mediated solar photocatalytic degradation of thiram in aqueous solution:
kinetics and mineralization Chem. Eng. J. 148 (2009) 50-56.
Kanki T., Hamasaki S., Sano N., Toyoda A., Hirano K. Water purification
in a fluidized bed photocatalytic reactor using TiO2-coated ceramic particles
Chem. Eng. J. 108 (1–2) (2005) 155–160.
231
Kawasaki S-I.,Xiuyi Y.,Sue K.,Hakuta Y.,Suzuki A., Arai K. Continuous
supercritical hydrothermal synthesis of controlled size and highly crystalline
anatase TiO2 nanoparticles J. Supercritical Fluids 50 (3) (2009) 276-282.
Khor J. N. Oxidation of pesticides in photocatalytic reactors (2004) PhD.
Thesis, School of chemical and environmental engineering, University of
Nottingham
Kim T.S., Kim J.K, Choi K., Stenstrom M.K., and Zoh K.D. Degradation
mechanism and the toxicity assessment in TiO2 photocatalysis and photolysis
of parathion Chemosphere 62 (6) (2006) 926–933.
Kitsiou V., Filippidis N., Mantzavinos D., Poulios I., Heterogeneous and
homogeneous photocatalytic degradation of the insecticide imidacloprid in
aqueous solutions App. Cat. B: Env. 86 (2009) 27-35.
Konstantinou I. K., and Albanis T. A., Photocatalytic transformation of pesticides
in aqueous titanium dioxide suspensions using artificial and solar light: intermediates
and degradation pathways. Applied Cat. B : Env. 42 (2003) 319-335.
Konstantinou.K. and Albanis T.A., TiO2-assisted photocatalytic degradation of
azo dyes in aqueous solution: kinetic and mechanistic investigations: A review
Appl. Catal. B: Env. 49 (2004) 1-14.
Kumar K. V., Porkodi K., Rocha F., Langmuir-Hinshelwood kinetics-a
theoretical study Cat. Comm., 9 (1) (2008) 82-84.
Lasa H., Serrano B., Salaices M. Photocatalytic Reaction Engineering (2005)
19-21.
Lee D. K., Kim S. C., Cho I. C., Kim J. S., Kim S. W. Photocatalytic
oxidation of microcystin-LR in a fluidized bed reactor having TiO2-coated
activated carbon Sep. and Purifica. Tech. 34 (1–3) (2004) 59–66.
Legrini O., O. E., Braun, A.M., Photochemical process for water treatment
Chem. Rev. 93 (1993) 671-698.
Lester E., Blood P., Denyer J., Giddings D., Azzopardi B., Poliakoff M.,
Reaction engineering: The supercritical water hydrothermal synthesis of nano-
particles J. Supercritical Fluids 37 (2006) 209-214.
Levenspiel O., Chemical reaction engineering (1999) 15-17.
Lhomme L., Brosillon S., Wolbert, D. Photocatalytic degradation of pesticides
in pure water and a commercial agricultural solution on TiO2 coated media
Chemosphere 70 (2008) 381-386.
Li Puma G., Modeling of thin-film slurry photocatalytic reactors affected by
radiation scattering Env. Sci. Tech., 37 (24) (2003) 5783–5791.

232
Li Puma G., Khor J. N., Brucato A., Modeling of an annular photocatalytic
reactor for water purification: oxidation of pesticides Env. Sci. Tech. 38
(2004) 3737-3745.
Li Puma G., Dimensionless analysis of photocatalytic reactors using
suspended solid photocatalysts, Chem. Eng. Res. Des. 83 (A7) (2005) 820-
826
Li Puma G., Toepfer B., Gora A., Photocatalytic oxidation of multicomponent
systems of herbicides: scale-up of laboratory kinetics rate data to plant scale
Cat. Today 124 (2007) 124-132.
Li Puma G., Yue P.L., The modeling of a fountain photocatalytic reactor with
a parabolic profile Chem. Eng. Sci. 56 (2001) 721-726.
Li Puma G., Yue P.L., A novel fountain photocatalytic reactor: model
development and experimental validation Chem. Eng. Sci. 56 (2001) 2733-
2744.
Li D. and Qu J., The progress of catalytic technologies in water purification: a
review J. Env. Sci. 21 (2009) 713-719.
Liang H.C., Li X. Z., Yang Y. H., Sze K. H., Comparison of the degradations
of diphenamid by homogeneous photolysis and heterogeneous photocatalysis
in aqueous solution Chemosphere 80 (4) (2010) 366-374.
Linsebigler A. L., Lu G. and Yates J. T., Photocatalysis on TiO2 surfaces:
principles, mechanisms, and selected results Chem. Rev. 95 (1995) 735-758.
Liu W., Chen S., Zhao W., Zhang S., Study on the photocatalytic degradation
of trichlorfon in suspension of titanium dioxide Desalination 249 (2009)
1288-1293.
Lopez-Munoz M. J., Aguado J., Revilla A. Photocatalytic removal of s-
triazines: evaluation of operational parameters Cat. Today 161 (2011) 153-162
Lopez-Munoz M. J., Aguado J., Revilla A. Heterogeneous photocatalytic
degradation of isoproturon in aqueous solution: experimental design and
intermediate products analysis Cat. Today (2013) In press, corrected-proof
Lu C., Chen C., Mai F., Li H., Identification of the degradation pathways of
alkanolamines with TiO2 photocatalysis J. Hazard. Mat. 165 (2009) 306-316.

233
Lu J., Minami K. , Takami S., Shibata M., Kaneko Y, Adschiri T.
Supercritical hydrothermal synthesis and in situ organic modification of
indium tin oxide nanoparticles using continuous-flow reaction system. Appl.
Mater. Interfaces 4 (1) (2012) 351–354.
Madani M.E., Guillard C., Perol N., Chovelon J.M., El Azzouzi M., Zrineh A.,
Herrmann J. M. Photocatalytic degradation of diuron in aqueous solution in
presence of two industrial titania catalyst, either as suspended powders or a
deposit on flexible industrial photoresistant papers. App. Cat. B: Env. 65
(2006) 70-76.
Mahmoodi N., Arami M., Limaee N., Gharanjig K., Photocatalytic
degradation of agricultural N-heterocyclic organic pollutants using
immobilized nanoparticles of titania. J. Hazard. Mat. 145 (2007) 65-71.
Mahmoodi N. M., Arami M., Gharanjig K., Nourmohammadian F., Bidokhti
A.Y., Purification of water containing agricultural organophosphorus pollutant
using titania nanophotocatalysis: laboratory studies and numerical modeling.
Desalination 230 (2008) 183-192.
Mahmoodi N. M., Arami M., Limaee N. Y., Gharanjig K., Nourmohammadian
F. Nanophotocatalysis using immobilized titanium dioxide nanoparticle:
degradation and mineralization of water containing organic pollutant: case
study of Butachlor Mat. Res. Bull. 42 (5) (2007) 797-806.
Malato S., Blanco J., Alarcon D.C., Maldonado M. I., Fernandezz-Ibanez P.,
Gernjak W., Photocatalytic decontamination and disinfection of water with
solar collectors Cat. Today 122 (2007) 137-149.
Malato S., Blanco J., Caceres J., Fernandez-Alba A. R., Aguera A., Rodriguez
A., Photocatalytic treatment of water-soluble pesticides by photo-Fenton and
TiO2 using solar energy Cat. Today 76 (2002) 209-220.
Malato S., Blanco J., Richter C., Fernandez P.,. Maldonado M. I, Solar
photocatalyticmineralization of commercial pesticides: oxamyl Solar Energy
Mat. & Solar Cells 64 (2000) 1-14.
Malato S., Blanco J., Alarcon D. C., Maldonado M. I., Fernandezz-Ibanez P.,
Gernjak W., Photocatalytic treatment of diuron by solar photocatalysis:
evaluation of main intermediates and toxicity Solar Energy 75 (2003) 329-
336.
Malato S., Fernandez-Ibanez P., Maldonado M. I., Blanco J., Gernjak W.,
Decontamination and disinfection of water by solar photocatalysis: recent
overview and trends Cat. Today, 147 (2009) 1-59.

234
Malato S., Blanco J., Vidal A., Richter C. , Photocatalysis with solar energy at
a pilot-plant scale: an overview App. Cat. B: Env. 37 (2002) 1-15.
Matveeva, E. G., Samsonova, J. V., Eremin, S. A.
A quenching
fluoroimmunoassay for analysis of the pesticide propazine in an apolar organic
solvent, reverse micelles of AOT inn-octane: effect of the micellar matrix and
labeled antigen structure J. Fluorescence 7 (3) (1997) 211 - 216.
Matsui K., Noguchi T., Islam N.M., Hakuta Y., Hayashi H. Rapid synthesis of
BaTiO3 nanoparticles in supercritical water by continuous hydrothermal flow
reaction system J. Crys. Growth 310(10)(2008) 2584-2589.
Mills, A., LeHunte, S., An overview of semiconductor photocatalysis J.
Photochem. Photobio. A: Chem. 108 (1997) 1-35.
Mills, A., Davies, R.H., Worsley, D., Water purification by semiconductor
photocatalysis. Chem. Soc. Rev. 22 (1993) 417-425.
Miguel N., Ormad M.P., Mosteo R., and Ovelleiro J. Photocatalytic
degradation of pesticides in natural water: effect of hydrogen peroxide Int. J.
Photoenergy, Article ID 371714 (2012) 1-11.
Muller P., Glossary of terms used in physical organic chemistry (IUPAC
recommendation 1994), Pure Appl. Chem. 66(5) (1994) 1077-1184.
Muneer M., Qamar M., Saquib M., Bahnemann D. W., Heterogeneous
photocatalysed reaction of three selected pesticide derivatives, propham,
propachlor and tebuthiuron in aqueous suspensions of titanium dioxide
Chemosphere 61 (2005) 457-468.
Moctezuma E., Leyva E., Palestino G., De Lasa H., Photocatalytic
degradation of methyl parathion: reaction pathways and intermediate reaction
products J. Photochem. Photobio. A: Chem. 186 (2007)71-84.
Mohapatra S. P., Michell A., Drinking water quality standards in Ontario-
are they tough? (2003) 8.
Muneer M., Qamar M., Saquib M., Bahnemann D. W. Heterogeneous
photocatalysed reaction of three selected pesticide derivatives, propham,
propachlor and tebuthiuron in aqueous suspensions of titanium dioxide
Chemosphere 61 (2005) 457-468.
Muneer M. and Boxall C., Photocatalyzed degradation of a pesticide
derivative glyphosate in aqueous suspensions of titanium dioxide Int J.
Photoenergy 2008 (2008) 1-7.
Nam W., Kim J., Han G. Photocatalytic oxidation of methyl orange in a three-
phase fluidized bed reactor Chemosphere 47 (9) (2002) 1019–1024.

235
Oancea P., and Oncescu T. The photocatalytic degradation of dichlorvos under
solar irradiation J. Photochem. Photobio. A: Chem.199 (2008) 8-13.
Oller I., Gernjak W., Maldonado M. I., Perez-Estrada L. A., Sanchez-Perez J.
A., Malato S. Solar photocatalytic degradation of some hazardous water-
soluble pesticides at pilot-plant scale J. Hazard. Mat. B 138 (2006) 507-517.
Paritam K. Dutta, A. K. R. Experimental investigation of Taylor vortex
photocatalytic reactor for water purification Chem. Eng. Sci. 59 (2004) 5249-
5259.
Parra S., Stanca S. E., Guasaquillo I., Thampi K. R. Photocatalytic degradation
of atrazine using suspended and supported TiO2 App. Cat. B: Env. 51 (2004)
107-116.
Perez-Estrada L. A., Malato S., Aguera A., Fernandez-Alba A. R.,
Degradation of dipyrone and its main intermediates by solar AOPs
identification of intermediate products and toxicity assessment Cat. Today 129
(2007) 207-214.
Pelaeza M., N. T. Nolanb, Pillai S.C., Seeryc M.K., Falarasd P., Kontosd
A.G., Dunlope P. S. M., Hamiltone J.W.J., Byrnee J.A., O’Sheaf K.,
Entezari M.H., Dionysiou D. D. A review on the visible light active
titanium dioxide photocatalysts for environmental applications App. Cat. B:
Env. 125 (2012) 331– 349.
Pizarro P., Guillard C., Perol N., Herrmann J. M. Photocatalytic degradation
of imazapyr in water: comparison of activities of different supported and
unsupported TiO2-based catalysts. Cat. Today 101 (2005) 211-218.
Pirkanniemi, K., Sillanpaa, M. Heterogeneous water phase catalysis as an
environmental application: a review Chemosphere 48 (2002) 1047-1060.
Pourata R., Khataee A.R., Aber S., Daneshvar N., Removal of the herbicide
Bentazon from contaminated water in the presence of synthesized
nanocrystalline TiO2 powders under irradiation of UV-C light Desalination
249 (2009) 301-307.
Qamar M., and Muneer M. Comparative photocatalytic study of two selected
pesticide derivatives, indole-3-acetic acid and indole-3-butyric acid in aqueous
suspensions of titanium dioxide J. Hazard. Mat. B 120 (2005) 219-227.
Qamar M., Muneer M., Bahnemann D. Heterogeneous photocatalysed
degradation of two selected pesticide derivatives, triclopyr and daminozid in
aqueous suspensions of titanium dioxide J. Env. Man. 80 (2006) 99-106.
Qamar M. and Muneer M. A comparative photocatalytic activity of titanium
dioxide and zinc oxide by investigating the degradation of vanillin Desalination 249 (2009) 535-540.

236
Qamar M., Saquib M., Muneer M. Photocatalytic degradation of two selected
dye derivatives, chromotrope 2B and amido black 10B, in aqueous
suspensions of titanium dioxide. Dyes and Pigments 65 (2005) 1-9.
Qourzal S., Barka N., Tamimi M., Assabbane A., Ait-Ichou Y.,
Photodegradation of 2-naphthol in water by artificial light illumination using
TiO2 photocatalyst: identification of intermediates and the reaction pathway
App. Cat. A: Gen. 334 (2008) 386-393.
Radwan A. A-R. Water Treatment by Heterogeneous Photocatalysis: an
Overview. SWCC acquired experience symposium (2005).
Rafqah S., Wong-Wah-Chung P., Aamili A., Sarakha M. Degradation of
metsulfuron methyl by heterogeneous photocatalysis on TiO2 in aqueous
suspensions: kinetic and analytical studies. J. Mol. Cat. A: Chem. 237 (2005)
50-59.
Rahman M. A. and Muneer M. Photocatalysed degradation of two selected
pesticides derivatives, dichlorvos and phosphamidon in aqueous suspension of
titanium dioxide Desalination 181 (2005) 161-172.
Rath H., Anand S., Mohapatra M., Dash P., Som T., Singh U. P. , Mishra N.
C., Effect of thermal annealing on the structure and microstructure of TiO2
thin films Indian J. Phys. 83 (4) (2009) 559-565.
Reddy P. A. K., Reddy P. V. L., Sharma V. M., Srinivas B., Kumari V.D.,
Subrahmanyam M. Photocatalytic degradation of isoproturon pesticide on C,
N and S doped TiO2 J. Water Res. and Protec.(2010) 2, 235-24.
Rowan J. B. and Andrew T. H. Review of major design and scale-up
considerations for solar photocatalytic reactors. Ind. Eng. Chem. Res. 48
(2009), 8890–8905.
Sanches S., Crespo M. T. B., Pereira V. J. Drinking water treatment of priority
pesticides using low pressure UV photolysis and advanced oxidation
processes. Water Res. 44, (2010) 1809-1818.
Sato T. and Taya M. Enhancement of phage inactivation using photocatalytic
titanium dioxide particles with different crystalline structures Biochem. Eng.
J. 28 (2006) 303–308.
Schwarz P. F., Turro N. J., Bossmann S. H., Braun A. M., Abdel Wahab A.-
M. A., Duerr H. A new method to determine the generation of hydroxyl
radicals in illuminated TiO2 suspensions. J. Phys. Chem. B 101 (1997) 7127-
7134.

237
Scribner E. A., Thurman E. M., Zimmerman L. R. Analysis of selected
herbicide metabolites in surface and ground water of the United States. Sci.
Total Env. 248 (2000) 157-167.
Senthilnathan J., Philip L. Removal of mixed pesticides from drinking water
system by photodegradation using suspended and immobilized TiO2. J. Env.
Sci. and Health: B 44 (2009) 262-270.
Serpone N. and Emeline A.V. Fundamentals in Metal-oxide Heterogeneous
Photocatalysis, (2004), 275-391.
Shie J. L., Lee C. H., Chiou C. S., Chang C.T., Chang C.C., Chang C.Y.
Photodegradation kinetics of formaldehyde using light sources of UVA, UVC,
and UVLED in the presence of composed silver titanium oxide photocatalyst.
J. Hazard. Mat. 155 (2008) 164-172.
Shifu C. and Yunzhang L. Study on the photocatalytic degradation of
glyphosate by TiO2 photocatalyst. Chemosphere 67 (2007) 1010-1017.
Shukla S. S., Dorris K. L., Chikkaveeraiah B. V. Photocatalytic degradation of
2,4-. dinitrophenol. J. Hazard. Mat. 164 (2009) 310-314.
Sharma M.V.P., Sadanandam G., Ratnamala A., Kumari V., Subrahmanyam
M. An efficient and novel porous nanosilica supported TiO2 photocatalyst for
pesticide degradation using solar light. J. Hazard. Mat. 171 (2009) 626-633.
Singh H. K., Muneer M., and Bahnemann D. Photocatalysed degradation of a
herbicide derivative, bromacil, in aqueous suspensions of titanium dioxide
Photochem. Photobiol. Sci. 2 (2003) 151–156.
Singh H. K., Saquib M., Haque M. M., Muneer M. Heterogeneous
photocatalyzed degradation of uracil and 5-bromouracil in aqueous
suspensions of titanium dioxide. J. Hazard. Mat. 142(2007) 425-430.
Sirtori C., Zapata A., Malato S., Gernjal W., Fernandez-Alba A. R. and
Aguera A. Solar photocatalytic treatment of quinolones: intermediates and
toxicity evaluation. Photochem. Photobio. Sci . 8 (2009), 644-651.
Sobczyński A., Dobosz A. Water purification by photocatalysis on
semiconductors. Polish J. Env. Studies 10(4) (2001), 195-205
Sojic D. V., Anderluh V. B., Orcic D.A., Abramovic B. F. Photodegradation
of clopyralid in TiO2 suspensions: identification of intermediates and reaction
pathways. J. Hazard. Mat. 168 (2009) 94-101.
Stapleton D. R., Konstantinou I. K., Mantazavinos D., Hela D., Papadaki M.
On the kinetics and mechanisms of photolytic/TiO2-photocatalytic degradation
of substituted pyridines in aqueous solutions. App. Cat. B: Env. 95 (2010)
100-109.

238
Sue K.,Kimura K.,Murata K., Arai K. Effect of cations and anions on
properties of zinc oxide particles synthesized in supercritical water. J.
Supercritical Fluids 30(3) (2004) 325-331.
Tariq M. A., Faisal M., Muneer M., Bahnemann D., Photochemical reactions
of few selected pesticide derivatives and other priority organic pollutants in
aqueous suspensions if titanium dioxide. J. Mol. Cat. A: Chem. 265 (2007)
231-236.
Toepfer B., Gora A., Li Puma G. Photocatalytic oxidation of multicomponent
solutions of herbicides: Reaction kinetics analysis with explicit photon
absorption effects App. Cat. B: Env. 68 (2006) 171-180.
Topalov A., Molnar-Gabor D., Kosanic M., Abramovic B.,
Photomineralization of the herbicide mecoprop dissolved in water sensitized
by TiO2 Water Res. 34(5) (2000) 1473-1478.
Trajkovska V., Petrovska-Jovanovi S., Pavlova V. Separation of simazine,
atrazine and propazine using reversed-phase high-performance liquid
chromatography Proceeding book in 4th
AACD Congress 29 Sept - 3 Oct
2004, Turkey (2004), 85-87.
Turner L., Simazine analysis of risks to endangered and threaten salmon
and steelhead (2003), 3-5.
Wang X., Yu J. C., Ho C., Hou Y., Fu X., Photocatalytic activity of a
hierarchically macro/mesoporous titania Langmuir 21 (2005) 2552-2559.
Wang Y, Hong C-S. TiO2 mediated photomineralization of 2- chlorobiphenyl:
the role of O2. Water Res. 34 (2000) 2791-2797.
Ward N., Clark J., Lowe P., Seymour S. Water pollution from agricultural
pesticides. (1993) 1-83.
Wei L., Shifu C.,Wei Z., Sujuan Z., Titanium dioxide mediated photocatalytic
degradation of methamidophos in aqueous phase J. Hazard. Mat. 164 (1)
(2009) 154–160.
Wei L., Shifu C., Wei Z., Sujuan Z., Study on the photocatalytic degradation
of trichlorfon in suspension of titanium dioxide. J. Hazard. Mat. 164 (2009)
154-160.
Wong C.C., The direct photolysis and photocatalytic degradation of alachlor at
different TiO2 and UV sources. Chemosphere 50 (2003) 981-987.
Wu R., Chen C., Chen M., Lu C., Titanium dioxide-mediated heterogeneous
photocatalytic degradation of terbufos: parameter study and reaction
pathways. J. Hazard. Mat. 162 (2009) 945-953.
239
Wu R., Chen C., Lu C., Hsu P., Chen M. Phorate degradation by TiO2
photocatalysis: parameter and reaction pathway investigations. Desalination
250 (2010) 869-875.
Vora J.J., Chauhan S.K., Parmar K.C., Vasava S.B., Sharma S., and Bhutadiya
L.S. Kinetic study of application of ZnO as a photocatalyst in heterogeneous
medium. E-J. Chem. 6(2) (2009) 531-536.
Voutou B. and Stefanaki E-C., Electron Microscopy: the basics. Phys. Adv.
Mat. Winter Sch. (2008) 1-11.
Vrielynck L., Dupuy N., Kister J., and Nowogrocki G. Molecular structure and
vibrational spectroscopy of isoproturon. J. Mol. Struct. 788 (2006) 232-237.
Yeredla R. R. and Xu H. An investigation of nanostructured rutile and anatase
plates for improving the photosplitting of water Nanotech. 19 (2008) 055706.
Zalazar C. S., Satuf M. L., Alfano O. M., Cassano A. E., Comparison of
H2O2/UV and heterogeneous photocatalytic processes for the degradation of
dichloroacetic acid in water. Env. Sci. Tech. 42 (2008) 6198-6204.
Zayani G., Bousselmi L., Mhenni F., Ghrabi A., Solar photocatalytic
degradation of commercial textile azo dyes: performance of pilot plant scale
thin film fixed-bed reactor. Desalination 246 (1-3) (2009), 344-352.
Zhou Q., Xiao J., Ding Y., Sensitive determination of fungicides and
prometryn in environmental water samples using multiwalled carbon
nanotubes solid-phase extraction cartridge. Analytica Chimica Acta, 602 (2)
(2007) 223-228.
The Food and Environment Research Agency
(http://pusstats.csl.gov.uk/myindex.cfm)
EPA: United states Environmental Protection Agency
(http://water.epa.gov/type/rsl/monitoring/vms52.cfm)