Embed Size (px)
Citation preview
1
Electronic Supplementary Information (ESI)
Engineering Heteroatom with Atomic Precision in Donor-
Acceptor Covalent Triazine Frameworks to Boost
Photocatalytic Hydrogen Production
Liping Guoa, Yingli Niub, Haitao Xua, Qingwei Lic, Shumaila Razzaquea, Qi Huanga Shangbin Jin* a, and Bien Tan*a
a Key Laboratory of Material Chemistry for Energy Conversion and Storage, Ministry
of Education, School of Chemistry and Chemical Engineering, Huazhong University of
Science and Technology, Luoyu Road No. 1037, 430074, Wuhan, China.
Email:, [email protected], [email protected]
bDepartment of Physics, School of Science, Beijing Jiaotong University, Shangyuancun
No. 3, Beijing100044, China.
cWuhan National Laboratory for Optoelectronics (WNLO), Huazhong University of
Science and Technology, Luoyu Road No. 1037, Wuhan 430074, China.
Electronic Supplementary Material (ESI) for Journal of Materials Chemistry A.This journal is © The Royal Society of Chemistry 2018

2
1. Materials
3,6-dibromo-9-ethylcarbazole, 2,8-dibromodibenzothiophene, 2,8-dibromodibenzo-
furan, Lithium bis(trimethylsilyl)amide, terephthalonitrile, p-tolylboronic acid and
terakis(triphenylphosphine) palladium (0) were purchased from TCI; dimethyl
sulfoxide (DMSO), and acetyl chloride were purchased from Aladdin. Dioxane,
tetrahydrofuran (THF), ether, N, N-dimethylformamide (DMF), potassium carbonate
and triethanolamine (TEOA), dichloromethane, diatomite, methanol and ethanol were
purchased from Sinopharm Chemical reagent Co., Ltd. All chemicals were used
without any further purification except for THF, which was distilled to exclude residual
water. Terephthalamidine dihydrochloride was synthesized following the literature
method.1
2. The calculations of apparent quantum yield
The apparent quantum yield (AQY) was calculated according to the following
equation2:
2
A
2 number of evolved H moleculesAQY (%)= 100%number of incident photons
2 CN = 100%Pt /hc
where C is the amount of H2 evolution per hour; is the irradiation light wavelength,
NA is the Avogadro constant; h is the plank constant, c is light speed, t is the light
irradiation time, and P is the incident light intensity.
3. Synthesis of Monomers
3.1 Synthesis of 3,6-dicarbaldehyde-N-ethylcarbazoled (Monomer-N)

3
3,6-dibromo-9-ethylcarbazole (0.75 g, 2.0 mmol), p-tolylboronic acid (1.18 g, 8.0
mmol), potassium carbonate(1.35 g, 10 mmol) and terakis(triphenylphosphine)
palladium(0.12 g, 1.0 mmol,) were mixed and then added in dioxane (16.0 mL) and
water (3.6 mL). The mixture was stirred and bubbled with N2 at room temperature for
30 min, and then stirred at 105 °C for 48 h. After cooling to room temperature, the
reaction mixture was poured into water and then extracted with dichloromethane three
times. Then organic phase was futher filtered with diatomite. The product was purified
via recrystallization by methanol/dichloromethane. The precipitate was dried under
vacuum to afford 3, 6-dicarbaldehyde-N-ethylcarbazole (0.42 mg, 54 %). 1H-NMR
(400MHz, CDCl3): δ = 10.08 (s, 2H, -CHO); δ = 8.46 (s, 2H, Ar-H); δ = 8.00 (d, J =
8.0 Hz, 4H, Ar-H); δ = 7.91 (d, J = 8.0 Hz, 4H, Ar-H); δ = 7.82 (d, J = 7.2 Hz, 2H, Ar-
H); δ = 7.55 (d, J = 8.0 Hz, 2H, Ar-H); δ = 4.46 (q, J = 7.2 Hz, 2H, -CH2-); δ = 1.52 (t,
J = 7.2 Hz, 3H, -CH3); 13C-NMR (75 MHz, CDCl3): 191.79; 147,99; 134.65; 131.14;
130.39; 127.59; 125.72; 123.72; 119.50; 109.33; 37.99; 13.90.
3.2 Synthesis of 2,8-dicarbaldehyde dibenzothiophe (Monomer-S)
2,8-dibromodibenzothiophene (0.68 g, 2.0 mmol), p-tolylboronic acid (1.18 g, 8.0
mmol), potassium carbonate (1.35 g, 10 mmol) and terakis(triphenylphosphine)
palladium (0.12 g, 1.0 mmol) were mixed and then added in dioxane (16.0 mL) and
water (3.6 mL). The mixture was stirred and bubbled with N2 at room temperature for

4
30 min, and then stirred at 105 °C for 48 h. After cooling to room temperature, the
reaction mixture was poured into water and then extracted with dichloromethane three
times. Then organic phase was further filtered with diatomite. The purification of
product was conducted by recrystallization from methanol/dichloromethane. The
precipitate was dried under vacuum to afford 2,8-dicarbaldehyde dibenzothiophe (0.64
mg, 82%). 1H-NMR (400MHz, CDCl3): δ = 10.11 (s, 2H, -CHO); δ = 8.48 (s, 2H, Ar-
H); δ = 8.03 (d, J = 8.0 Hz, 4H, Ar-H); δ = 8.00 (d, J = 8.8 Hz, 2H, Ar-H); δ = 7.91 (d,
J = 8.0 Hz, 4H, Ar-H); δ = 7.79 (d, J = 7.2 Hz, 2H, Ar-H); 13C-NMR (75 MHz, CDCl3):
191.87; 146.79; 140.30; 136.63; 135.30; 130.43; 127.92; 126.48; 123.56; 120.39.
3.3 Synthesis of 2,8-dicarbaldehyde –dibenzofuran (Monomer-O)
2,8-dibromodibenzofuran (0.63 g, 2.0 mmol), p-tolylboronic acid(1.18 g, 8.0 mmol) ,
potassium carbonate(1.35 g, 10 mmol) and terakis(triphenylphosphine) palladium(0.12
g, 1.0 mmol,) were mixed and then added in dioxane (16.0 mL) and water (3.6 mL).
The mixture was stirred and bubbled with N2 at room temperature for 30 min, and then
stirred at 105 °C for 48 h. After cooling to room temperature, the reaction mixture was
poured into water and then extracted with dichloromethane three times. Then organic
phase was futher filtered with diatomite. The purification of product was conducted by
recrystallization with methanol/dichloromethane. The precipitate was dried under
vacuum to afford 2,8-dicarbaldehyde dibenzothiophe (0.57 mg, 76%). 1H-NMR (400

5
MHz, CDCl3): δ = 10.10 (s, 2H, -CHO); δ = 8.28 (s, 2H, Ar-H); δ = 8.02 (d, J = 8.0 Hz,
4H, Ar-H); δ = 7.87 (d, J = 8.4 Hz, 4H, Ar-H); δ = 7.79 (d, J = 8.8 Hz, 2H, Ar-H); δ =
7.71 (d, J =8.4 Hz, 2H, Ar-H); 13C-NMR (75 MHz, CDCl3): 191.89; 147,10; 135.19;
135.13; 130.40; 127.91; 127.21; 124.81; 119.68; 112.39.
3.4 Synthesis of 2,8-dicarbaldehyde -9H-fluorene ( Monomer-C )
The first step was followed by the literature.3 The second step was synthesized as
following: 2,8-dibromo-9H- fluorene (0.63 g, 2.0 mmol), p-tolylboronic acid (1.18 g,
8.0 mmol), potassium carbonate (1.35 g, 10.0 mmol) and terakis (triphenylphosphine)
palladium (0.12 g, 1 mmol,) were mixed and then added in toluene (16.0 mL) and water
(3.6 mL). The mixture was stirred and bubbled with N2 to purge O2 for 30 min, and
then stirred at 105 °C for 48 h. After cooling, the reaction mixture was poured into
water and then extracted with dichloromethane for three times. Then organic phase was
futher filtered through diatomite. The purification of product was conducted by
recrystallization from petroleum ether and dichloromethane. The precipitate was dried
under vacuum to afford 2,8-dicarbaldehyde dibenzothiophe (0.35 mg, 47%). 1H-NMR
(400MHz, CDCl3: ppm): δ = 10.09 (s, 2H, -CHO); δ = 8.12 (s, 2H, Ar-H); δ = 8.00 (d,
J = 8.40 Hz, 4H, Ar-H); δ = 7.87 (d, J = 8.00 Hz, 4H, Ar-H); δ = 7.69 (d, J =8.00 Hz,
2H, Ar-H); δ = 7.63 (d, J = 6.8 Hz, 2H, Ar-H); 13C-NMR (75 MHz, CDCl3): 191.95;
147,49; 143.96; 142.15; 138.84; 135.21; 130.35; 127.85; 126.55; 125.69; 118.86.

6
Figure S1. FT-IR of CTFs and monomers.
Figure S2. The survey XPS of CTFs (a); and high-resolution spectra of N 1s for CTF-
N (b), CTF-S (c) and CTF-O (d).

7
Figure S3. Thermogravimetric analysis of CTFs. Compared with CTF-S and CTF-O,
CTF-N starts to lose weight at lower temperature because of the decomposition of ethyl
groups in CTF-N.
Figure S4. Powder X-ray diffraction pattern of CTF samples.

8
Figure S5. Mott-Schottky plots of (a) CTF-N, (b) CTF-S and (c) CTF-O samples.
Figure S6. (a) High-resolution TEM image of CTF-N sample after loading Pt
nanopartiles (the image indicates the Pt nanopartilces are uniformly distributed among
CTF-N matrix); (b) The caluclation of the size distribution of Pt nanoparitlces in
CTF-N.
9
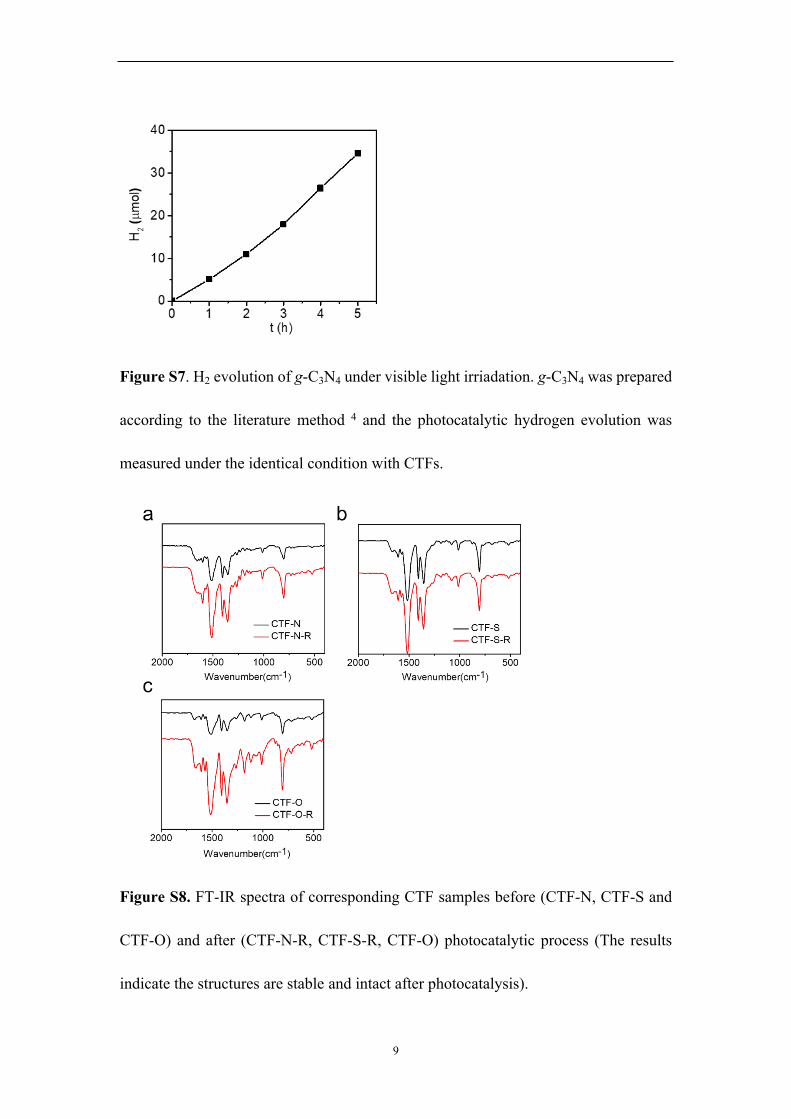
Figure S7. H2 evolution of g-C3N4 under visible light irriadation. g-C3N4 was prepared
according to the literature method 4 and the photocatalytic hydrogen evolution was
measured under the identical condition with CTFs.
Figure S8. FT-IR spectra of corresponding CTF samples before (CTF-N, CTF-S and
CTF-O) and after (CTF-N-R, CTF-S-R, CTF-O) photocatalytic process (The results
indicate the structures are stable and intact after photocatalysis).

10
Figure S9. (a) FT-IR of CTF-C and monomer-C; (b) 13C-NMR spectrum of CTF-C.
Figure S10. (a) Nitrogen sorption isotherm curve of CTF-C; (b) corresponding pore
size distributions of CTF-C.
11
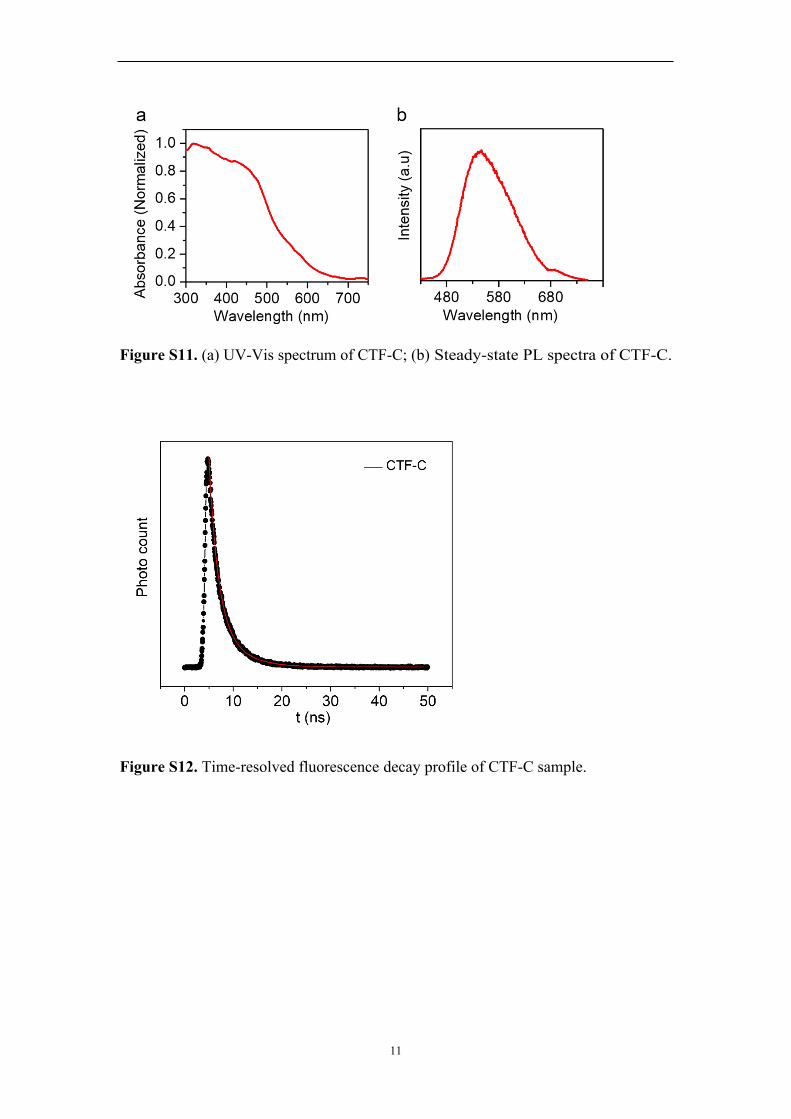
Figure S11. (a) UV-Vis spectrum of CTF-C; (b) Steady-state PL spectra of CTF-C.
Figure S12. Time-resolved fluorescence decay profile of CTF-C sample.

12
Table S1.Summary of the elemental analysis results of CTFs
a Theoretical elemental content calculated based on infinite network structures;
b The average elemental content of twice measurements.
Samples C (%) H (%) N (%) S (%)
CTF-Na 81.3 3.6 15.1 /
CTF-Nb 74.9 4.5 14.0 /
CTF-Sa 78.5 3.4 13.1 5.0
CTF-Sb 71.0 3.8 12.4 4.3
CTF-Oa 80.5 3.5 13.4 /
CTF-Ob 73.5 3.9 12.3 /
CTF-Ca 82.8 3.7 13.5 /
CTF-Cb 72.8 4.0 11.9 /
13
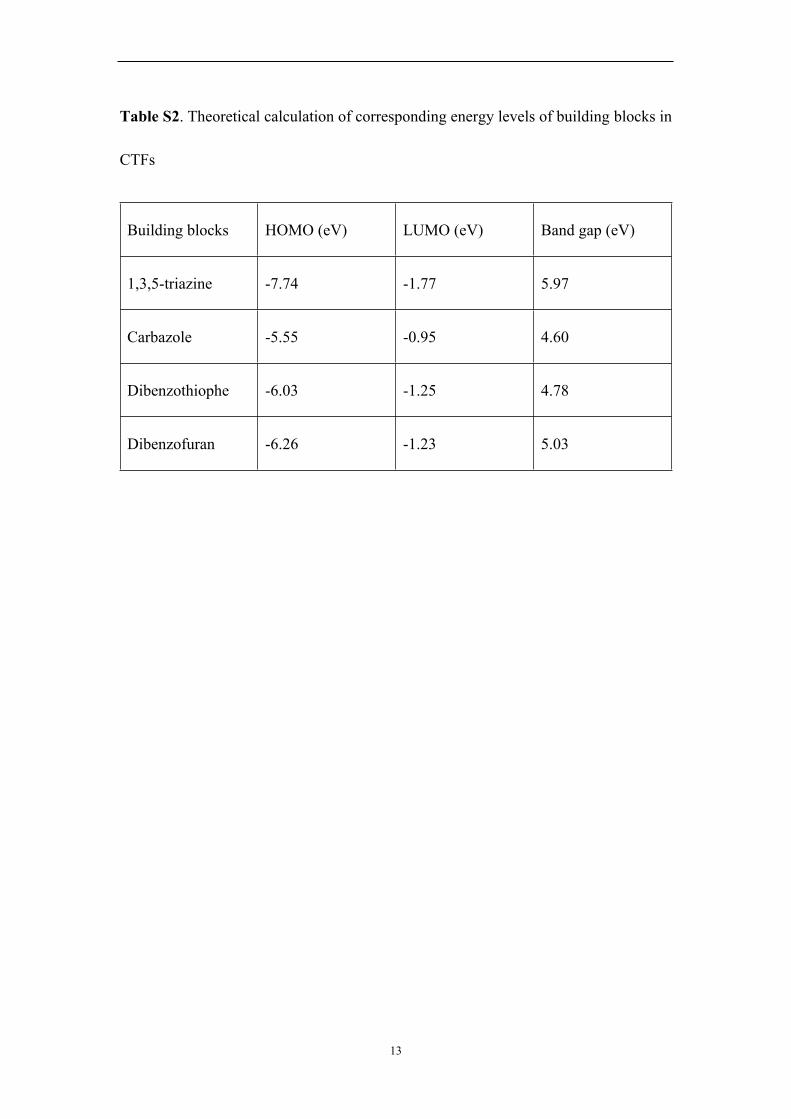
Table S2. Theoretical calculation of corresponding energy levels of building blocks in
CTFs
Building blocks HOMO (eV) LUMO (eV) Band gap (eV)
1,3,5-triazine -7.74 -1.77 5.97
Carbazole -5.55 -0.95 4.60
Dibenzothiophe -6.03 -1.25 4.78
Dibenzofuran -6.26 -1.23 5.03
14
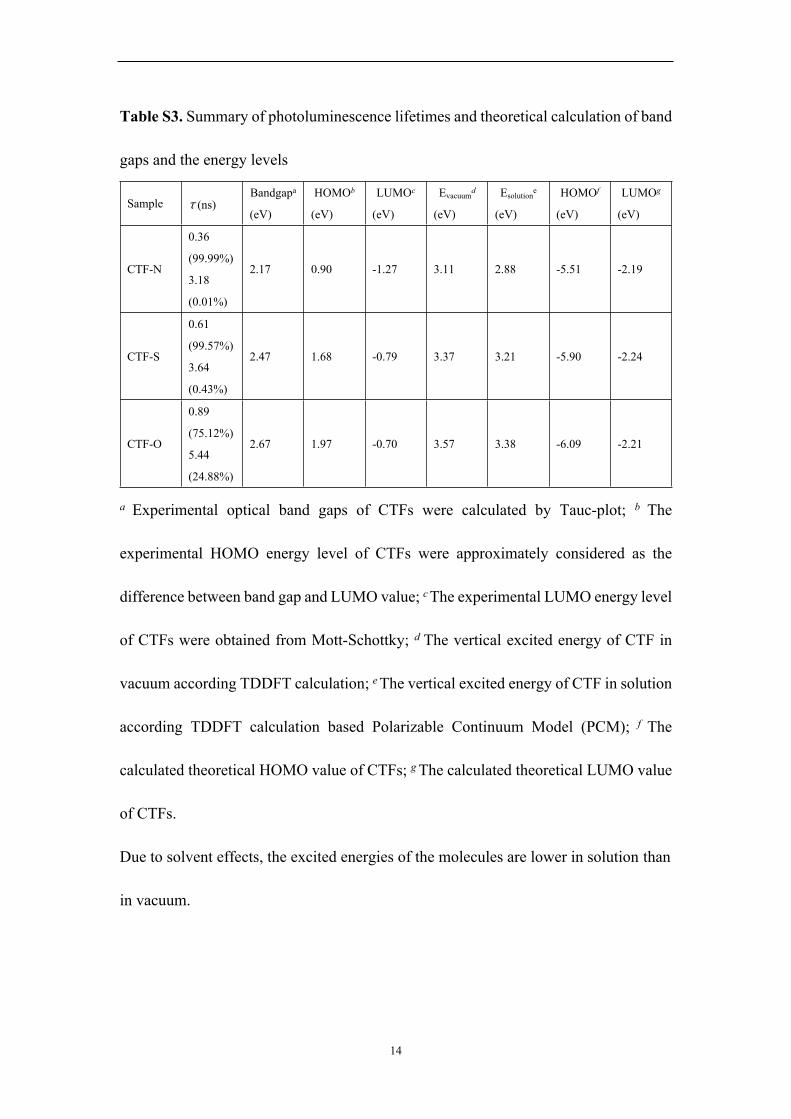
Table S3. Summary of photoluminescence lifetimes and theoretical calculation of band
gaps and the energy levels
Sample τ (ns)Bandgapa
(eV)
HOMOb
(eV)
LUMOc
(eV)
Evacuumd
(eV)
Esolutione
(eV)
HOMOf
(eV)
LUMOg
(eV)
CTF-N
0.36
(99.99%)
3.18
(0.01%)
2.17 0.90 -1.27 3.11 2.88 -5.51 -2.19
CTF-S
0.61
(99.57%)
3.64
(0.43%)
2.47 1.68 -0.79 3.37 3.21 -5.90 -2.24
CTF-O
0.89
(75.12%)
5.44
(24.88%)
2.67 1.97 -0.70 3.57 3.38 -6.09 -2.21
a Experimental optical band gaps of CTFs were calculated by Tauc-plot; b The
experimental HOMO energy level of CTFs were approximately considered as the
difference between band gap and LUMO value; c The experimental LUMO energy level
of CTFs were obtained from Mott-Schottky; d The vertical excited energy of CTF in
vacuum according TDDFT calculation; e The vertical excited energy of CTF in solution
according TDDFT calculation based Polarizable Continuum Model (PCM); f The
calculated theoretical HOMO value of CTFs; g The calculated theoretical LUMO value
of CTFs.
Due to solvent effects, the excited energies of the molecules are lower in solution than
in vacuum.

15
Table S4. Photocatalytic performance of literature reported conjugated porous
polymers.
Catalyst ConditionAmount
of catalyst(mg)
Hydrogen evolution rate
(μmol h-1)
AQY(%)
Ref.
Planarized fluorine-type polymer
>420 nm;MeOH / TEA
25 37 7.2
(420 nm)5
Solution-Processable
Polymer
>420 nm;MeOH / TEA
40 220.56
(420 nm)6
Conjugated polybenzodiazoles
>420 nm;TEOA
3 wt% Pt50 116
4.01(420 nm)
7
CMPs>420nm
TEA100 17 / 8
PyBT-2 >420nmTEOA
100 30 / 9
N3-COF>420 nmTEOA
3wt%Pt5 9
0.45(450 nm)
10
TFPT-COF>420 nm;
TEOA10 20 2.2 11
Phenyl-triazine oligomers
>400 nmTEOA
2.2 wt%PtpH = 7.0
10 11 9.9
(400 nm)12
CTF-2>420 nmTEOA
3 wt% Pt25 7
1.6(420 nm)
13
CTF-S10
>420 nmTEOA
1 wt% Pt20 40 / 14
CTF-1-100W>420 nmTEOA
2.01 wt% Pt50 275
6(420 nm)
15

16
CTF-N>420 nmTEOA
~2 wt%Pt50 538
4.07(420 nm)
This work
References
1 K. Wang, L. M. Yang, X. Wang, L. Guo, G. Cheng, C. Zhang, S. Jin, B. Tan, A.
Cooper, Angew. Chem. Int. Ed., 2017, 56, 14149-14153.
2 X. Zhang, B. Peng, S. Zhang, T. Peng, ACS Sustain. Chem. Eng., 2015, 3, 1501-
1509.
3 Y. Song, W. Xu, D. Zhu. Tetrahedron Lett., 2010, 51, 4894-4897.
4 L. Lin, H. Ou, Y. Zhang, X. Wang, ACS Catal., 2016, 6, 3921−3931.
5 R. Sprick, B. Bonillo, R. Clowes, P. Guiglion, N. Brownbill, B. Slater, F. Blanc, M.
Zwijnenburg, D. Adams, A. Cooper, Angew. Chem. Int. Ed., 2016, 128, 1824-1828.
6 D. J. Woods; R. S. Sprick; C. L. Smith; A. J. Cowan, A. I. Cooper, Adv. Energy
Mater., 2017, 7, 1700479.
7 G. Zhang, Z.A. Lan, X. Wang, Angew. Chem. Int. Ed., 2016, 55, 15712-15727.
8 R. Sprick, J. X. Jiang, B. Bonillo, S. Ren, T. Ratvijitvech, P. Guiglion, M.
Zwijnenburg, D. Adams, A. Cooper, J. Am. Chem. Soc., 2015, 137, 3265-3270.
9 Y. Xu, N Mao, C. Zhang, X. Wang, J. Zeng, Y. Chena, F. Wang, J. X. Jiang, Appl.
Catal. B-Environ., 2018, 228, 1-9.
10 V. S. Vyas, F. Haase, L. Stegbauer, G. Savasci, F. Podjaski, C. Ochsenfeld, B. V.
Lotsch, Nat. Commun., 2015, 6, 8508.
11 L. Stegbauer, K. Schwinghammer, B. V. Lotsch, Chem. Sci., 2014, 5, 2789-2793.
12 K. Schwinghammer, S. Hug, M. Mesch, J. Senkerd, B. V. Lotsch, Energ. Environ.
Sci., 2015, 8, 3345-3353.
13 C. B. Meier, R. S. Sprick, A. Monti, P. Guiglion, J. S. M. Lee, M.A. Zwijnenburg,
A. I. Cooper. Polymer, 2017, 126, 283-290.

17
14 L. Li, W. Fang, P. Zhang, J. Bi, Y. He, J. Wangc, W. Su, J. Mater. Chem. A, 2016,
4, 12402-12406.
15 J. Xie, S. A. Shevlin, Q. Ruan, S. A. Moniz, Y. Liu, X. Liu, Y. Li, C. C. Lau, Z. X.
Guo, J. Tang, Energ. Environ. Sci., 2018, 11, 1617-1624.


![N-doped graphitic carbon-incorporated g-C3N4 for ... · [7]), to photocatalysis for solar water splitting and pollutants photodegradation [8], etc. Besides, g-C3N4 can be applied](https://img.pdfslide.us/doc/110x75/5f0aa6f97e708231d42cac08/n-doped-graphitic-carbon-incorporated-g-c3n4-for-7-to-photocatalysis-for.jpg)