Embed Size (px)
Citation preview

S-1
Supporting Information
Enhanced photocatalytic efficiency of C3N4/BiFeO3 heterojunctions: synergistical effects of band
alignment and ferroelectricity
Xian-Zhu Denga, Chuang Songa, Yin-Lin Tonga, Guoliang Yuanb, Feng Gaoa, Dan-Qing Liuc,*, Shan-Tao
Zhanga,*
aNational Laboratory of Solid State Microstructures and Department of Materials Science and Engineering,
College of Engineering and Applied Science & Collaborative Innovation Center of Advanced Microstructures,
Nanjing University, Nanjing 210093, P.R. China
bSchool of Materials Science and Engineering, Nanjing University of Science and Technology, Nanjing
210000, P.R. China
cSchool of Chemical and Environmental Engineering, Harbin University of Science and Technology, Harbin
150040, P.R. China
Corresponding Author
*Email (D. Q. Liu): [email protected]
*Email (S-T Zhang):[email protected]
Electronic Supplementary Material (ESI) for Physical Chemistry Chemical Physics.This journal is © the Owner Societies 2018
S-2
Table of Contents:
1. The FT-IR spectra of C3N4, BiFeO3, S1, S3, S4 and S5 sample.
2. The morphology of C3N4, BiFeO3, S1, S2, S3, S4 and S5 sample.
3. The typical EDS spectrum and the elemental mapping of S5 sample.
4. The chemical composition of C3N4, BiFeO3, S5 and composite sample.
5. The thermal characterization of C3N4/xBiFeO3 sample.
6. The N2 adsorption-desorption isotherms and pore size distributing of g-C3N4, BiFeO3, S1, S3, S4 and S5
sample.
7. Ultraviolet photoelectron spectrum of g-C3N4 and BiFeO3.
8. Band energies of g-C3N4 and BiFeO3 by UV-visible DRS and UPS.

S-3
1. The FT-IR spectra of C3N4, BiFeO3, S1, S3, S4 and S5 sample.
Fig. S1. FT-IR spectra of the g-C3N4, BiFeO3 and g-C3N4/xBiFeO3 samples. In terms of the g-C3N4, the
absorption band centered at 806 cm-1 is ascribed to s-triazine ring modes. Severe absorption peaks located at
1200-1700 cm-1 might result from C-N heterocycles stretching vibrations. The broad absorption band at 3100
cm-1 is mainly due to N-H stretching vibrations.1 In the spectrum of BiFeO3, the absorption peak at 553 cm-1 is
characteristics of the octahedral FeO6 groups and result from Fe-O stretching and bending vibrations.2 As for
the g-C3N4/xBiFeO3 samples (S1, S3, S4, S5, please note S2 has the same composition with S5, so the result of
S2 is not demonstrated), the absorption peaks of the g-C3N4 exist in all samples, while the absorption peak of
BiFeO3 can be observed in S3, S4, S5 samples except S1 sample (indicated by arrow), which is due to the low
content of BiFeO3 (10wt.%) in S1 sample.

S-4
2. The morphology of C3N4, BiFeO3, S1, S2, S3, S4 and S5 sample.
Fig. S2. The SEM images of (a) the g-C3N4 (Scale bar, 5 m), (b) BiFeO3 (Scale bar, 2 m), and (c~g) g-
C3N4/xBiFeO3 samples (S1, S2, S3, S4, S5, Scale bar, 10 m), respectively. The morphology of the g-C3N4
demonstrates relatively larger anisotropic 2D-like shape characteristics of graphite, whereas BiFeO3 shows a
typical isotropic particle shape, some small BiFeO3 particles with size of ~100 nm tend to aggregate into large
particle with the size of ~1m. The relatively larger 2D-like grains in the S1, S2, S3, S4, S5 samples are
attributed to g-C3N4, whereas some smaller grains are BiFeO3 particles, which are attached to the matrix of g-
C3N4. It is noted that the S5 sample exhibits the smallest particles with the best size uniformity compared with
other g-C3N4/xBiFeO3 samples, especially compared with the S2 sample which has the same composition. This
observation indicates that S5 might have the best photocatalytic performance in our cases.

S-5
3. The typical EDS spectrum and the elemental mapping of S5 sample.
Fig. S3. (a)-(b) The typical EDS spectrum, and (c)-(f) the corresponding elemental mapping images of the S5
sample. The EDS spectrum has shown that the Bi, Fe, C and N elements exist in the S5 sample simultaneously.
The elemental mapping images show a homogeneous distribution of C and N, however, the Bi and Fe elements
only occupy some isolated regions. This observation suggests that the isolated BiFeO3 particles are embedded
in the g-C3N4 matrix.
S-6
4. The chemical composition of C3N4, BiFeO3, S5 and composite sample.
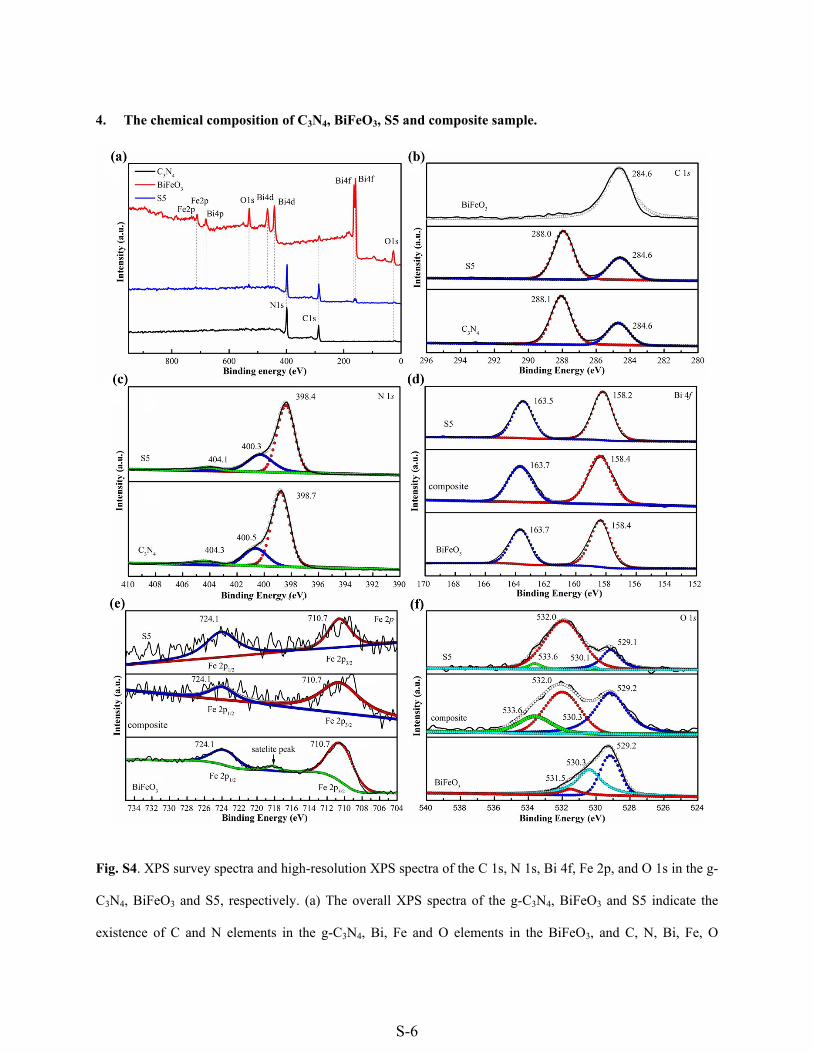
Fig. S4. XPS survey spectra and high-resolution XPS spectra of the C 1s, N 1s, Bi 4f, Fe 2p, and O 1s in the g-
C3N4, BiFeO3 and S5, respectively. (a) The overall XPS spectra of the g-C3N4, BiFeO3 and S5 indicate the
existence of C and N elements in the g-C3N4, Bi, Fe and O elements in the BiFeO3, and C, N, Bi, Fe, O

S-7
elements in the S5. The binding energies were calibrated with respect to the signal from the adventitious
carbon (binding energy =284.6eV) (b) the C 1s XPS spectra of the g-C3N4, BiFeO3 and S5, the peaks at ~284.6
eV in these three samples result from adventitious carbon of the instrument or the adventitious carbon
depositing on the surface of samples. As for g-C3N4, the binding energy peak around ~288.1 eV is attribute to
the sp2 hybridized C (C–(N)3). However, this peak in the S5 sample has shifted slightly to 288.0 eV. (c) the
characteristic N 1s peak of g-C3N4 at 398.7 eV is due to the sp2-hybridized aromatic nitrogen bonded to carbon
atoms (C=N-C). The peak at 400.5 eV is ascribed to tertiary nitrogen (N–(C3)) groups in form of structural
motif (C6N7) or amino groups carrying hydrogen (H-N-(C)2).3 And the peak at 404.3 eV is assigned to the
effects of the charging reaction or the π-excitations. The corresponding N 1s peaks for S5 have shifted to
398.4, 400.3, and 404.1 eV, respectively. (d) the two strong Bi 4f peaks of BiFeO3 at 158.4 eV and 163.7 eV
result from Bi 4f7/2 and Bi 4f5/2 respectively,4 the corresponding peaks for S5 have decreased slightly to 158.2
eV and 163.5 eV respectively. (e) The Fe 2p XPS spectra of the BiFeO3 and S5. The two main peaks at 724.1
eV and 710.7 eV of BiFeO3 correspond to the binding energy of Fe 2p1/2 and Fe 2p3/2, respectively.5 It is noted
that a satellite peak (~718.3 eV) is 5.8 eV higher than the Fe 2p3/2 peak, indicating that the chemical state of Fe
ion is Fe3+ ionic states, but not Fe2+ ionic states.6 However, these peaks fail to appear at the corresponding
positions in the Fe 2p XPS spectra of the S5, though some traces of Fe3+ could be founded by simulating the
XPS spectra. This observation may be mainly due to the low content of BiFeO3 in the S5 sample. (f) The board
asymmetric O 1s peaks of BiFeO3 could be deconvoluted into three components. The characteristic peak at
529.2 eV is attributed to Bi-O band, the second peak at 530.3 eV is assigned to Fe-O band,7 and the third peak
at 531.5 eV is ascribed to surface adsorbed hydroxyl groups (O-H).8 As for the O 1s spectra of the S5, the peak
could be deconvoluted into four peaks, the peak at 529.1 eV and 530.1eV can be assigned to Bi-O and Fe-O
band.1,7 The peak at 532.0 eV is ascribed to surface adsorbed hydroxyl groups. The last peak at 533.6 eV is
belong to band of C-O in the g-C3N4.7 In general, the shift of the C 1S, N 1s, O 1s and Bi 4f in the S5 sample
indicates that intensity interface interaction between the g-C3N4 and BiFeO3, i.e., the C3N4/BiFeO3
heterojunction is formed.
S-8
5. The thermal characterization of C3N4/xBiFeO3 sample.
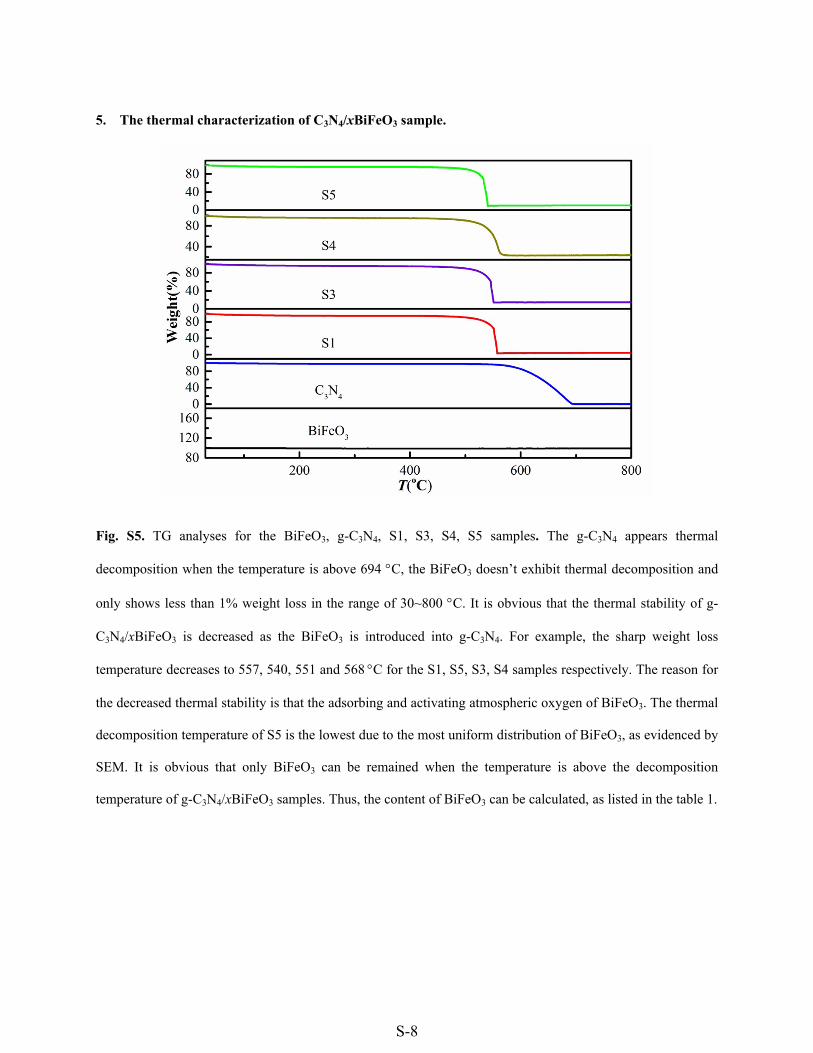
Fig. S5. TG analyses for the BiFeO3, g-C3N4, S1, S3, S4, S5 samples. The g-C3N4 appears thermal
decomposition when the temperature is above 694 C, the BiFeO3 doesn’t exhibit thermal decomposition and
only shows less than 1% weight loss in the range of 30~800 C. It is obvious that the thermal stability of g-
C3N4/xBiFeO3 is decreased as the BiFeO3 is introduced into g-C3N4. For example, the sharp weight loss
temperature decreases to 557, 540, 551 and 568 C for the S1, S5, S3, S4 samples respectively. The reason for
the decreased thermal stability is that the adsorbing and activating atmospheric oxygen of BiFeO3. The thermal
decomposition temperature of S5 is the lowest due to the most uniform distribution of BiFeO3, as evidenced by
SEM. It is obvious that only BiFeO3 can be remained when the temperature is above the decomposition
temperature of g-C3N4/xBiFeO3 samples. Thus, the content of BiFeO3 can be calculated, as listed in the table 1.
S-9
6. The N2 adsorption-desorption isotherms and pore size distributing of g-C3N4, BiFeO3, S1, S3, S4 and S5 sample.
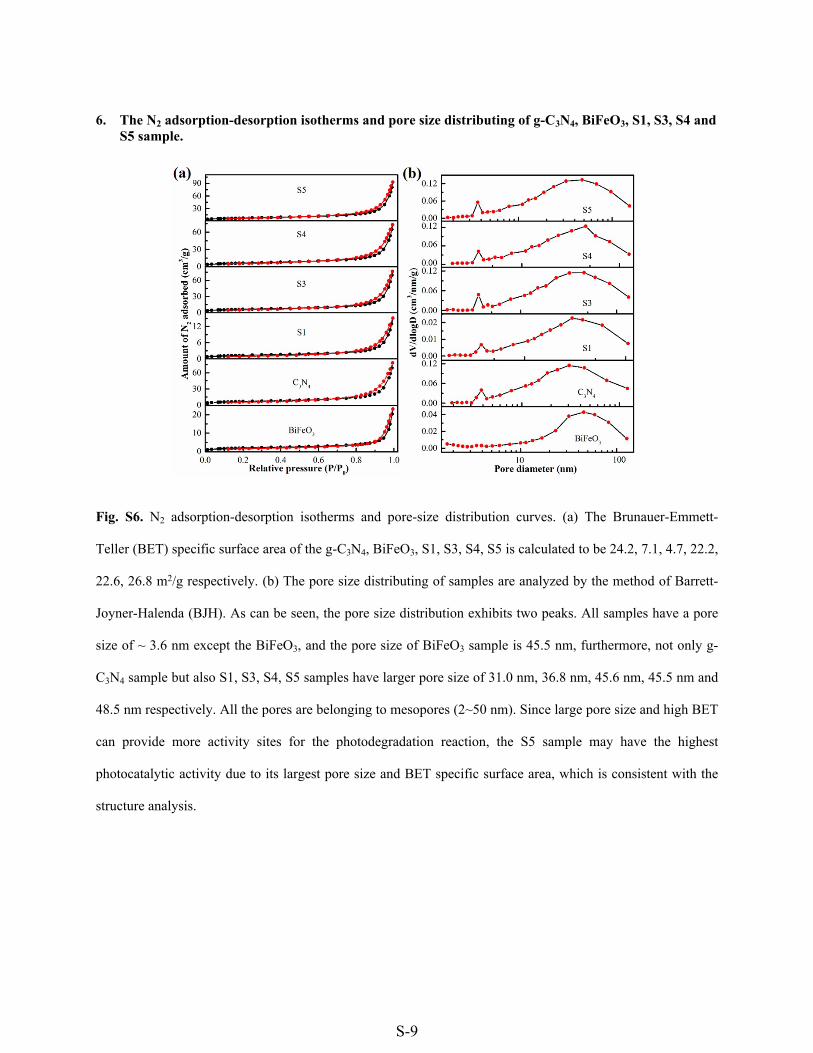
Fig. S6. N2 adsorption-desorption isotherms and pore-size distribution curves. (a) The Brunauer-Emmett-
Teller (BET) specific surface area of the g-C3N4, BiFeO3, S1, S3, S4, S5 is calculated to be 24.2, 7.1, 4.7, 22.2,
22.6, 26.8 m2/g respectively. (b) The pore size distributing of samples are analyzed by the method of Barrett-
Joyner-Halenda (BJH). As can be seen, the pore size distribution exhibits two peaks. All samples have a pore
size of ~ 3.6 nm except the BiFeO3, and the pore size of BiFeO3 sample is 45.5 nm, furthermore, not only g-
C3N4 sample but also S1, S3, S4, S5 samples have larger pore size of 31.0 nm, 36.8 nm, 45.6 nm, 45.5 nm and
48.5 nm respectively. All the pores are belonging to mesopores (2~50 nm). Since large pore size and high BET
can provide more activity sites for the photodegradation reaction, the S5 sample may have the highest
photocatalytic activity due to its largest pore size and BET specific surface area, which is consistent with the
structure analysis.
S-10
7. Ultraviolet photoelectron spectrum of g-C3N4 and BiFeO3.
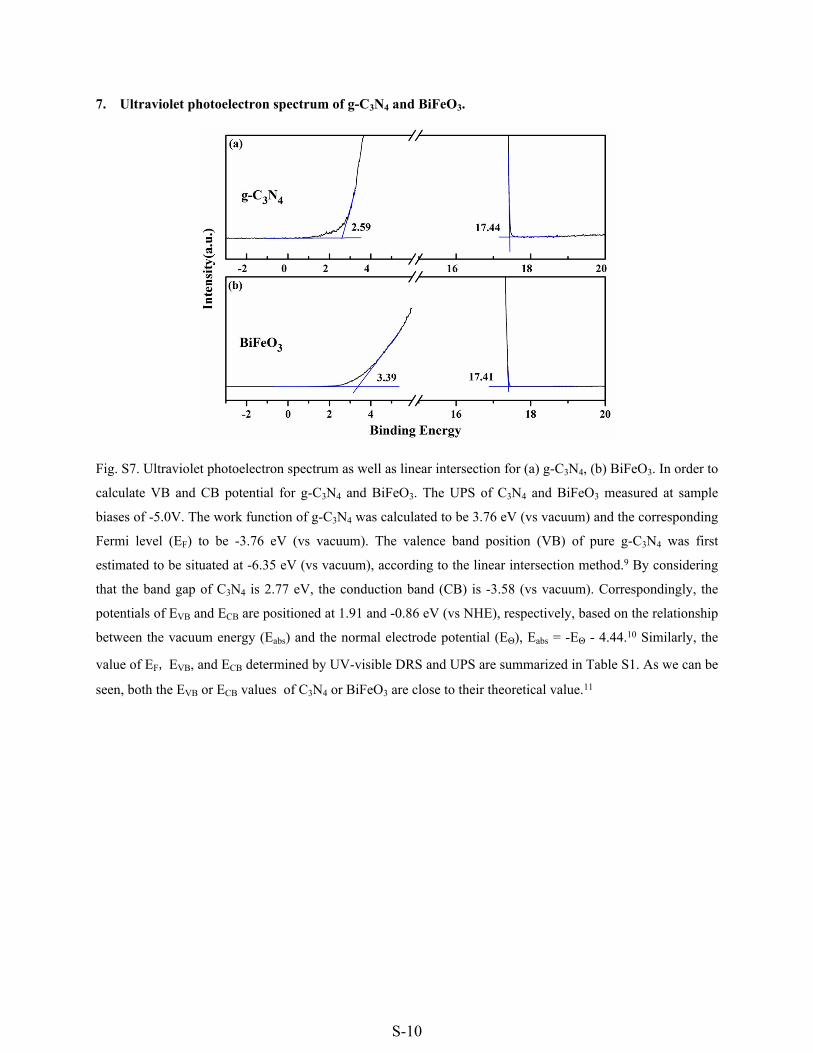
Fig. S7. Ultraviolet photoelectron spectrum as well as linear intersection for (a) g-C3N4, (b) BiFeO3. In order to
calculate VB and CB potential for g-C3N4 and BiFeO3. The UPS of C3N4 and BiFeO3 measured at sample
biases of -5.0V. The work function of g-C3N4 was calculated to be 3.76 eV (vs vacuum) and the corresponding
Fermi level (EF) to be -3.76 eV (vs vacuum). The valence band position (VB) of pure g-C3N4 was first
estimated to be situated at -6.35 eV (vs vacuum), according to the linear intersection method.9 By considering
that the band gap of C3N4 is 2.77 eV, the conduction band (CB) is -3.58 (vs vacuum). Correspondingly, the
potentials of EVB and ECB are positioned at 1.91 and -0.86 eV (vs NHE), respectively, based on the relationship
between the vacuum energy (Eabs) and the normal electrode potential (EΘ), Eabs = -EΘ - 4.44.10 Similarly, the
value of EF, EVB, and ECB determined by UV-visible DRS and UPS are summarized in Table S1. As we can be
seen, both the EVB or ECB values of C3N4 or BiFeO3 are close to their theoretical value.11

S-11
8. Band energies of g-C3N4 and BiFeO3 by UV-visible DRS and UPS.
Table. S1. Band energies of g-C3N4 and BiFeO3 by UV-visible DRS and UPS
EF EVB ECB
Sample vs
Vacuum
vs
NHE
vs
Vacuum
vs
NHE
vs
Vacuum
vs
NHE
C3N4 -3.76 -0.68 -6.35 1.91 -3.58 -0.86
BiFeO3 -3.81 -0.63 -7.2 2.76 -5.04 0.6

S-12
References:
1 Y. Guo, J. Li, Z. Gao, X. Zhu, Y. Liu, Z. Wei, W. Zhao, C. Sun. Appl. Catal. B: Environ. 2016, 192, 57-
71.
2 T. Liu, Y. Xu, S. Feng, J. Zhao, J. Am. Ceram. Soc. 2011, 94, 3060-3063.
3 S. W. Cao, Y. P. Yuan, J. Fang, M. M. Shahjamali, F. Y. Boey, J. Barber, S. C. J. Loo, C. Xue, Int. J.
Hydrogen Energy. 2013, 38, 1258-1266.
4 S. Han, C. Sung Kim, J. Appl. Phys. 2013, 113, 17D921.
5 K. Chakrabarti, K. Das, B. Sarkar, S. Ghosh, S. K. De, G. Sinha, J. Lahtinen, Appl. Phys. Lett. 2012, 101,
042401.
6 Mocherla, P. S.; Karthik, C.; Ubic, R.; Ramachandra Rao, M. S.; Sudakar, C. Tunable Bandgap in BiFeO3
Nanoparticles: The Role of Microstrain and Oxygen Defects. Appl. Phys. Lett. 2013, 103, 022910.
7 Z. Li, Y. Shen, C. Yang, Y. Lei, Y. Guan, Y. Lin, D. Liu, C. W. Nan, J. Mater. Chem. A. 2013, 1, 823-
829.
8 H. Li, J. Liu, W. Hou, N. Du, R. Zhang, X. Tao, Appl. Catal. B-Environ. 2014, 160, 89-97.
9 J. C. Wang, H. C. Yao, Z. Y. Fan, L. Zhang, J. S. Wang, S. Q. Zang and Z. J. Li, ACS Appl. Mater.
Interfaces. 2016, 8, 3765-3775.
10 G. Xiao, X. Wang, D. Li and X. Fu, J. Photochem. Photobiol., A. 2008, 193, 213-221.
11 F. Gao, X. Y. Chen, K. B. Yin, S. Dong, Z. F. Ren, F. Yuan, T. Yu and J. M. Liu, Adv. Mater. 2007, 19,
2889-2892.


![N-doped graphitic carbon-incorporated g-C3N4 for ... · [7]), to photocatalysis for solar water splitting and pollutants photodegradation [8], etc. Besides, g-C3N4 can be applied](https://img.pdfslide.us/doc/110x75/5f0aa6f97e708231d42cac08/n-doped-graphitic-carbon-incorporated-g-c3n4-for-7-to-photocatalysis-for.jpg)