Embed Size (px)
Citation preview


he Renewable Energy Atlas of Alaska is
designed as a resource for the public, policy
makers, advocates, landowners, developers, utility
companies and others interested in furthering
the production of electricity, heat and fuels from
hydro, wind, biomass, geothermal, solar, and
ocean power resources. Produced with the use of
geographic information system (GIS) technology,
this Atlas brings together renewable resource
maps and data into a single comprehensive
publicly available document. The maps contained
in this Atlas do not eliminate the need for on-site
resource assessment. However, they do provide
an estimate of the available resources.
The Atlas is posted on the Alaska Energy Authority (AEA)
website, AKenergyauthority.org, and the
Renewable Energy Alaska Project (REAP) website,
Alaskarenewableenergy.org. The revised map data is
expected to be available by April 2016 in
interactive format at the State of Alaska’s energy
inventory website at AKenergyinventory.org.
Table of Contents
..................................................................2
.............................................................................................................6
.....................................................................................................8
................................................................................................10
...............................................................12
.................................................................................................................14
................................................................................................................16
..........................................................................18
.....................................20
.....................................................................22
........................................................................................26
................................................28
..........................................................................................................30
................................................................................................32
................................................................................33
.............................................................33
T
Photo CreditsBelow, left to right: Marsh Creek LLC, Cordova Electric Cooperative, Alaska Energy Authority, Alaska Energy Authority, Alaska Energy Authority, Chena Hot Springs Resort.
Alaska’s Energy Infrastructure
Biomass
Geothermal
Hydroelectric
Ocean and River Hydrokinetic
Solar
Wind
Renewable Energy Fund
Renewable Energy Fund Project Highlights
Renewable Energy Policies
Energy E�ciency
Energy E�ciency Program Highlights
Glossary
Data Sources
For More Information
Acknowledgments and Thanks
Why Renewable Energy is Important
enewable resources, over the long term, can provide energy at a known cost that can hedge against volatile fuel prices and dampen the e�ects of in�ation. With some of the best renewable energy resources in the country, Alaska has an opportunity to invest locally in sustainable infrastructure, save communities millions of dollars in energy costs each year, and bring new revenue streams into the state’s economy.
As concerns about volatile fossil fuel prices, energysecurity, and climate change increase, renewableresources play a key role in sustaining communities with local, clean, and inexhaustible energy to supply Alaska’s growing demand for electricity, heat, and transportation fuel. Because there are limited fuel costs associated with generating electricity and heat from renewable sources, more Alaskans are looking to resources like hydropower, wind, biomass, geothermal, solar, tides, and waves. Alaskans are also increasingly saving heat and electricity through energy e�ciency and conservation measures, keeping dollars in the state’s economy, creating more stable and resilient communities, and helping to achieve the state goal of 50 percent renewable energy by 2025.
R
o
S E AB E R I N G
I S L A N D SA L E U T I A N
Wrangell
3
2
A R C T I C O C E A N
GU
L FO F A L A S K
A
Valdez
Unalaska / Dutch Harbor
Homer
Kenai / Soldotna
Kodiak
Kotzebue
Nome
Ketchikan
Sitka
Barrow
Bethel
Fairbanks
Juneau
PalmerAnchorage
Galena
Tok
Dillingham
Wasilla
2
3
0 150 30075
Miles
Infrastructure
fuel
Alaska’s Energy Infrastructure
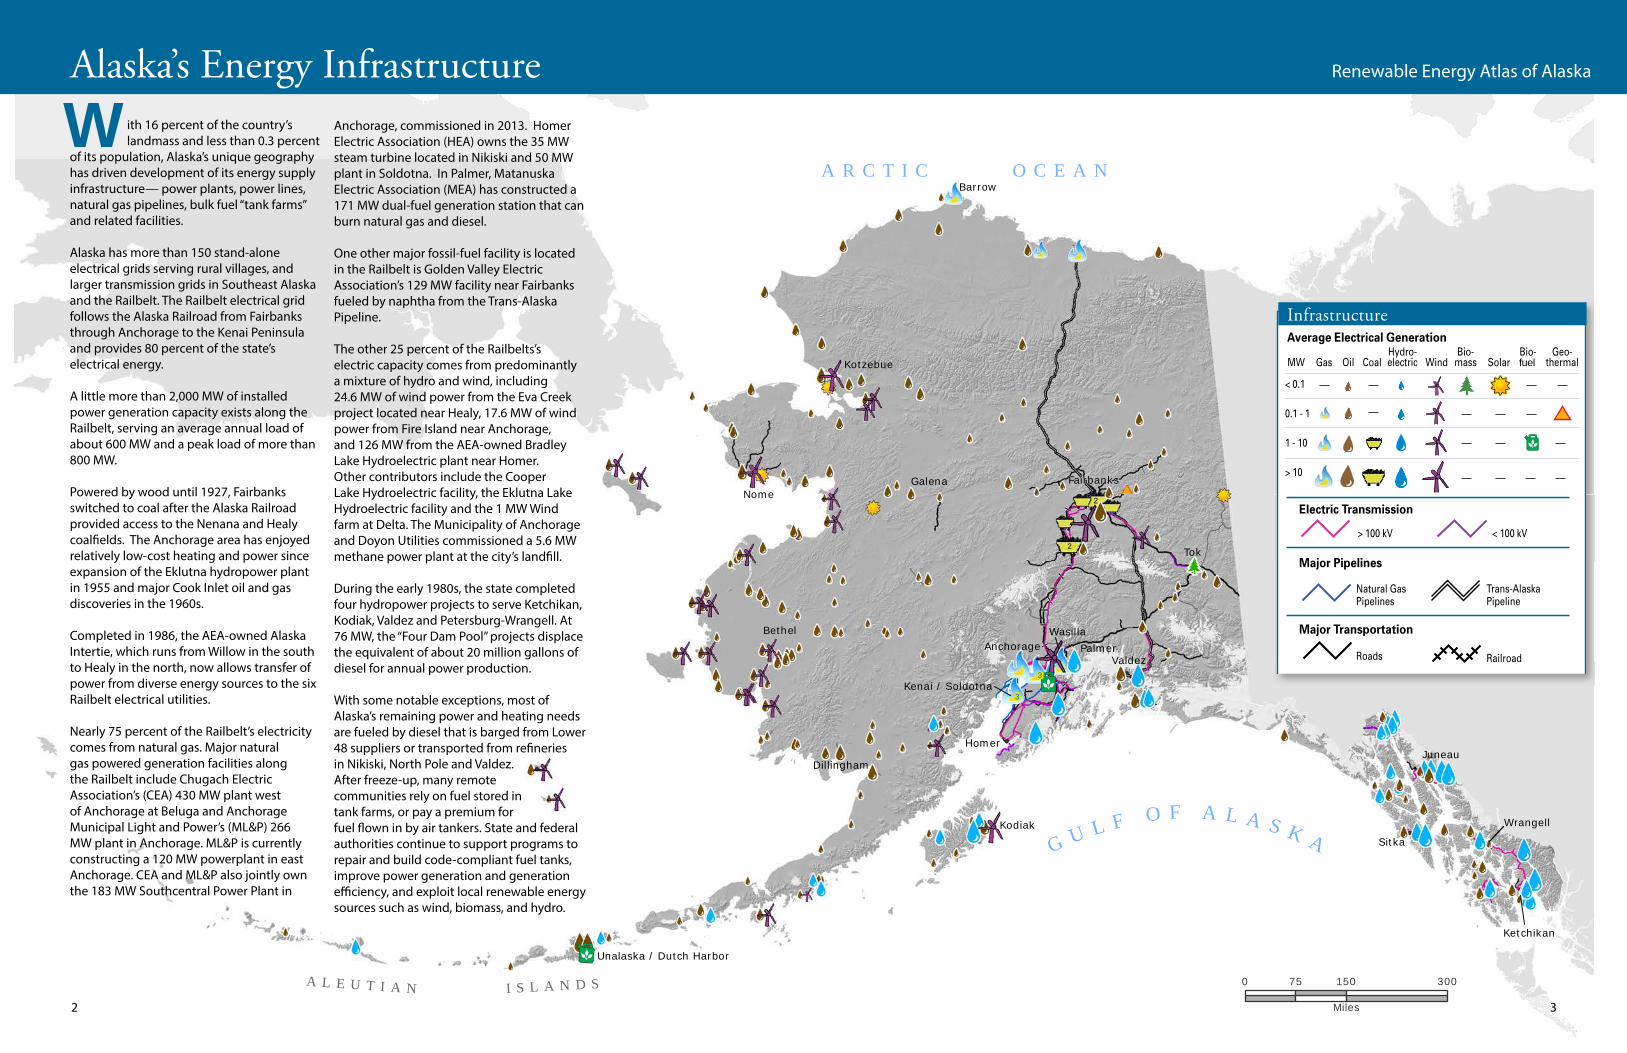
W ith 16 percent of the country’s landmass and less than 0.3 percent of its population, Alaska’s unique geography has driven development of its energy supply infrastructure— power plants, power lines, natural gas pipelines, bulk fuel “tank farms” and related facilities.
Alaska has more than 150 stand-alone electrical grids serving rural villages, and larger transmission grids in Southeast Alaska and the Railbelt. The Railbelt electrical grid follows the Alaska Railroad from Fairbanks through Anchorage to the Kenai Peninsula and provides 80 percent of the state’s electrical energy.
A little more than 2,000 MW of installed power generation capacity exists along the Railbelt, serving an average annual load of about 600 MW and a peak load of more than 800 MW.
Powered by wood until 1927, Fairbanks switched to coal after the Alaska Railroad provided access to the Nenana and Healy coal�elds. The Anchorage area has enjoyed relatively low-cost heating and power since expansion of the Eklutna hydropower plant in 1955 and major Cook Inlet oil and gas discoveries in the 1960s.
Completed in 1986, the AEA-owned Alaska Intertie, which runs from Willow in the south to Healy in the north, now allows transfer of power from diverse energy sources to the six Railbelt electrical utilities.
Nearly 75 percent of the Railbelt’s electricity comes from natural gas. Major natural gas powered generation facilities along the Railbelt include Chugach Electric Association’s (CEA) 430 MW plant west of Anchorage at Beluga and Anchorage Municipal Light and Power’s (ML&P) 266 MW plant in Anchorage. ML&P is currently constructing a 120 MW powerplant in east Anchorage. CEA and ML&P also jointly own the 183 MW Southcentral Power Plant in
2 3
Renewable Energy Atlas of Alaska
Anchorage, commissioned in 2013. Homer Electric Association (HEA) owns the 35 MW steam turbine located in Nikiski and 50 MW plant in Soldotna. In Palmer, Matanuska Electric Association (MEA) has constructed a 171 MW dual-fuel generation station that can burn natural gas and diesel. One other major fossil-fuel facility is located in the Railbelt is Golden Valley Electric Association’s 129 MW facility near Fairbanks fueled by naphtha from the Trans-Alaska Pipeline.
The other 25 percent of the Railbelts’s electric capacity comes from predominantly a mixture of hydro and wind, including 24.6 MW of wind power from the Eva Creek project located near Healy, 17.6 MW of wind power from Fire Island near Anchorage, and 126 MW from the AEA-owned Bradley Lake Hydroelectric plant near Homer. Other contributors include the Cooper Lake Hydroelectric facility, the Eklutna Lake Hydroelectric facility and the 1 MW Wind farm at Delta. The Municipality of Anchorage and Doyon Utilities commissioned a 5.6 MW methane power plant at the city’s land�ll.
During the early 1980s, the state completed four hydropower projects to serve Ketchikan, Kodiak, Valdez and Petersburg-Wrangell. At 76 MW, the “Four Dam Pool” projects displace the equivalent of about 20 million gallons of diesel for annual power production.
With some notable exceptions, most of Alaska’s remaining power and heating needs are fueled by diesel that is barged from Lower 48 suppliers or transported from re�neries in Nikiski, North Pole and Valdez. After freeze-up, many remote communities rely on fuel stored in tank farms, or pay a premium for fuel �own in by air tankers. State and federal authorities continue to support programs to repair and build code-compliant fuel tanks, improve power generation and generation e�ciency, and exploit local renewable energy sources such as wind, biomass, and hydro.

!
!
!
!
!
!
!
!
!
!
!
!
!
!
!
!
!
!
!
!
!
!
!
9
99
99
9
9
9
9
9
9
9
9
9
9
9
99
9
99
9
9
9
99
9
9
99
9
9
9
9
9
9
9
9
99
9
9
9
9
9
LutakTen Mile
SouthFork Black Beak Lk.
Whitman Lake
Gartina Falls
Skagway
Klukwan
Hyder
Klawock
Sitka
Ketchikan
Juneau
Port Alexander
Blind Slough
Metlakatla
Kasaan
Kake
Hoonah
Hollis
Haines
Angoon
Yakutat
Pelican
Nautaki
Wrangell
Hydaburg
Whale Pass
Thorne Bay
Elfin Cove
Coffman Cove
Craig
TenakeeSprings
Goat Lake
Swan Lake
Blue Lk.
Tyee LakeGreen Lk.
Snettisham
Gold Creek
Purple Lake
Annex Creek
Dewey Lakes
Salmon Creek
Beaver Falls
Chester Lk.
Pelican Creek
Falls Creek
Black Bear Lk.
Lake Dorothy
Kasidaya Creek
Ketchikan & Silvis Lks.
9
9
9
9
9
9
9
9
9
9
9
McCarthy
Chenega Bay
Chicken
Eklutna Lake
SolomonGulch
Power Creek
2
Fire Island
Eva Creek
2
Homer
Kenai
Anchorage
WasillaPalmer
Eagle RiverValdez
Glennallen
Tok
Cordova
Cantwell
2
3
CooperLake
Pedro Bay
Kokhanok
Igiugig
Iliamna
Tazimina
Chena
Lime Village
Port Alsworth
Telida
NondaltonNewhalen
Slana
Whittier
Paxson
Delta Junction
Susitna
Dot Lake
Skwentna
Dry Creek
Tanacross
Fort Greely
Lake Louise
Lake Minchumina
Manley
MintoTanana
Healy Lake
Tetlin
Tatitlek
Chistochina
Nikolai
McGrath
Takotna
Ruby
Seldovia
Chitina
MentastaLake
Nanwalek
North Pole
Talkeetna
Seward
Tyonek
Bradley Lake
Humpback Creek
Beluga
Nikiski
Fairbanks
Eielson AFB
Clear AFB
Healy
CO
OK
I
NL
ET
P R I N C E W I L L I A M
S O U N D
G U L F O F A L A S K A
!
!
!
!
!
!
9
9
9
9
99
9
9
9
9
Akhiok
Karluk
Aleneva
Old Harbor
Chiniak
Kodiak
Larsen Bay
Womens Bay
Ouzinkie
Port Lions
Terror LakeSH
EL
IK
OF
ST
RA
IT
4 5
Infrastructure: Fairbanks to Kodiak Infrastructure: Southeast Alaska
Average Electrical Generation
Electric Transmission
Electric Service Areas
Major Pipelines
MW
> 100 kV
Anchorage Municipal Light & Power
Chugach Electric Association
Copper Valley Electric Association
Golden Valley Electric Association
Homer Electric Association
Matanuska Electric Association
City of Seward Electric
< 100 kV
Gas Oil CoalHydro-electric Wind
Bio-mass Solar
Geo-thermal
< 0.1
0.1 - 1
1 - 10
> 10
Natural GasPipelines
Trans-AlaskaPipeline
Major Transportation
Roads Railroad
Infrastructure
Bio-fuel

laska’s primary biomass fuels are wood, sawmill wastes, �sh byproducts and municipal waste.
Wood remains an important renewable energy source for Alaskans. More than100,000 cords of wood are burned in the form of cordwood, chips and pellets annually.
Closure of major pulp mills in Sitka and Ketchikan in the 1990s ended large-scale, wood-�red power generation in Alaska. However, the price of oil has raised interest in using sawdust and wood wastes for lumber drying, space heating, and small-scale power production.
In 2010 the Tok School installed a chip-�red boiler, displacing approximately 65,000 gallons of fuel oil annually. Also in 2010, Sealaska Corporation installed the state’s �rst large-scale pellet boiler at its headquarters in Juneau.
More than 30 woody biomass heating systems are operational in Alaska, including the communities of Craig, Kasilof, Tanana, Co�man Cove, Thorne Bay, Ketchikan, and Gulkana.
In 2012, the Tok School upgraded their biomass heating system to produce electricity and heat. They are now producing about 50 kW of power in addition to heating the school, becoming the �rst school in the United States to operate a combined heat and power plant.
A
Biomass pellets, like those used to power the Sealaska Corporation headquarters in Juneau.
6 7
Ala
ska
Ener
gy A
utho
rity
Biomass Renewable Energy Atlas of Alaska
Savings in energy costs from the installation of biomass systems are having signi�cant impact on our communities. The schools in Tok, Kaasan, and Thorne Bay have installed greenhouses to grow fresh vegetables for their cafeterias and to incorporate horticulture into their curriculum. The Tok School and Thorne Bay School have installed greenhouses heated with their biomass boilers. Students now have fresh vegetables in their cafeteria and are learning math and science with hands-on experience in the greenhouse.
There is also interest in the in-state manufacture of wood pellets. Currently, there are small and large-scale plants operating in Alaska. The largest facility, Superior Pellets, is located in North Pole and is capable of producing an estimated 30,000 tons of pellets per year. Small-scale pellet mills are operating in Dry Creek and Ketchikan.
Biodiesel refers to a vegetable-oil or animal-fat based diesel fuel. Every year ground�sh processors in Unalaska, Kodiak and other locations produce approximately 8-million gallons of pollack oil as a byproduct of �shmeal plants. The oil is used as boiler fuel for drying the �shmeal or exported to Paci�c Rim markets for livestock and aquaculture feed supplements and other uses.
In 2001, with assistance from the State of Alaska, processor UniSea Inc. conducted successful tests of raw �sh oil/diesel blends in a 2.2 MW engine generator. Today UniSea uses about 1.5-million gallons of �sh oil a year to operate their generators, boilers and �shmeal dryers.
Alaskans generate approximately 650,000 tons of garbage per year. In 2012, the Municipality of Anchorage and Doyon Utilities commissioned a 5.6 MW methane power plant at the city’s land�ll to provide over 25 percent of Joint Base Elmendorf Richardson’s electrical load.
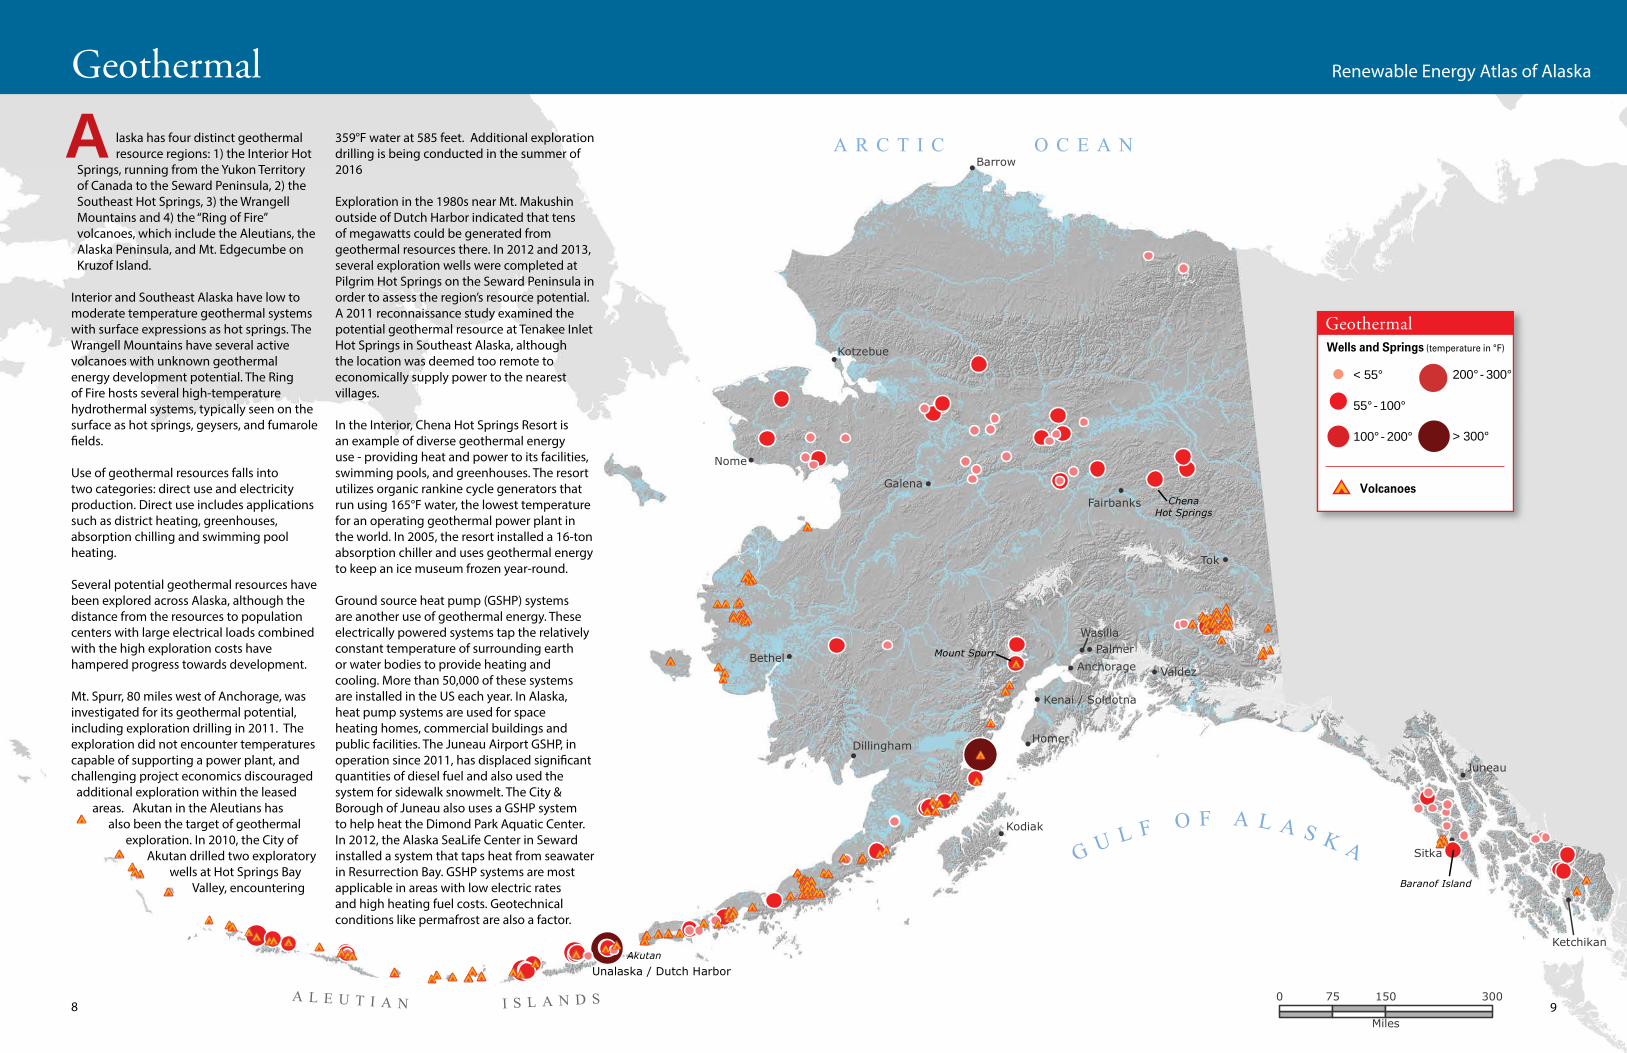
laska has four distinct geothermal resource regions: 1) the Interior Hot Springs, running from the Yukon Territory of Canada to the Seward Peninsula, 2) the Southeast Hot Springs, 3) the Wrangell Mountains and 4) the “Ring of Fire” volcanoes, which include the Aleutians, the Alaska Peninsula, and Mt. Edgecumbe on Kruzof Island.
Interior and Southeast Alaska have low to moderate temperature geothermal systems with surface expressions as hot springs. The Wrangell Mountains have several active volcanoes with unknown geothermal energy development potential. The Ring of Fire hosts several high-temperature hydrothermal systems, typically seen on the surface as hot springs, geysers, and fumarole �elds.
Use of geothermal resources falls into two categories: direct use and electricity production. Direct use includes applications such as district heating, greenhouses, absorption chilling and swimming pool heating.
Several potential geothermal resources have been explored across Alaska, although the distance from the resources to population centers with large electrical loads combined with the high exploration costs have hampered progress towards development.
Mt. Spurr, 80 miles west of Anchorage, was investigated for its geothermal potential, including exploration drilling in 2011. The exploration did not encounter temperatures capable of supporting a power plant, and challenging project economics discouraged additional exploration within the leased
areas. Akutan in the Aleutians has also been the target of geothermal
exploration. In 2010, the City of Akutan drilled two exploratory
wells at Hot Springs Bay Valley, encountering
A
8 9
Geothermal
< 55°
55° - 100°
100° - 200°
200° - 300°
> 300°
Geothermal Renewable Energy Atlas of Alaska
359°F water at 585 feet. Additional exploration drilling is being conducted in the summer of 2016
Exploration in the 1980s near Mt. Makushin outside of Dutch Harbor indicated that tens of megawatts could be generated from geothermal resources there. In 2012 and 2013, several exploration wells were completed at Pilgrim Hot Springs on the Seward Peninsula in order to assess the region’s resource potential. A 2011 reconnaissance study examined the potential geothermal resource at Tenakee Inlet Hot Springs in Southeast Alaska, although the location was deemed too remote to economically supply power to the nearest villages.
In the Interior, Chena Hot Springs Resort is an example of diverse geothermal energy use - providing heat and power to its facilities, swimming pools, and greenhouses. The resort utilizes organic rankine cycle generators that run using 165°F water, the lowest temperature for an operating geothermal power plant in the world. In 2005, the resort installed a 16-ton absorption chiller and uses geothermal energy to keep an ice museum frozen year-round.
Ground source heat pump (GSHP) systems are another use of geothermal energy. These electrically powered systems tap the relatively constant temperature of surrounding earth or water bodies to provide heating and cooling. More than 50,000 of these systems are installed in the US each year. In Alaska, heat pump systems are used for space heating homes, commercial buildings and public facilities. The Juneau Airport GSHP, in operation since 2011, has displaced signi�cant quantities of diesel fuel and also used the system for sidewalk snowmelt. The City & Borough of Juneau also uses a GSHP system to help heat the Dimond Park Aquatic Center. In 2012, the Alaska SeaLife Center in Seward installed a system that taps heat from seawater in Resurrection Bay. GSHP systems are most applicable in areas with low electric rates and high heating fuel costs. Geotechnical conditions like permafrost are also a factor.

!
!
!!!!!!!!
!
!!
!
!
!
!
!!
!!
!
!!
!!!!!
!
!
!
!
!
!!
!
!!
!
!
!!
!!
!!
!!
!
!
!
!!
!
!
!
!
!
!
!
!!
!
!
!!
!
!
!
!
!!
!
!
!!!
!
!!!
!
!
!
!
!
!!
!!
!
!
!
!!!
!
!
!
!
!
!
!
!!!
!
!
!
!!
!
!
!!
!
!
!
!!
!
!
!
!
!
!
!
!
! !
!!!!! !
!
!
!
!
!
!
!
!!!!!!
!!!
!
!
!
!!
!
!!!
!
!!
!!
!
!
!!
!
!
!
!!!!!!
!
!
!
!
!!!
!
!
!
!
!
!
!!
!
!!
!
!!
!
!
!!!
!!!!!
!
!
!
!
!
!
!!!!
!
!!
!
!
!
!!!!
!
!
!!
!
!
!
!
!
!
!
!
!!
!!
!
!
!
!
!
!!!
!!!
!!!!!
!!!!
!!!
!
!
!
!
!
!
!
!!
!
!
!!!
!
!
!
!!
!
!
!!
!
!!!!
!
!
!!
!!!
!
!
!!!
!!
!
!
!!
!
!
!
!
!
!
! !
!!
!!
!
!
!
!
!!
!
!
!
!
!
!
!
!
!
!
!
!
!!!
!
!
!
!!
!!
!!
!
!
!
!
!
!
!
!
!
!
!
!!
!
!!!
!!
!
!
!!
!
!
!!
!
!
!!
!
!! !!!
!
!
!
!
!!
!
!
!!
!
!!
!
!
!
!
!
!
!
!
!
!
!
!
!
!!
!
!
!
!!!
!!!!!
!
!!
!
!
!!
!
!
!!!
! !!
!!!!!
!!
!
!
!!
!
!
!
!
!
!!!!!!!
!
!
!!
!
!
!
!
!!
!
!
!
!
!!
!
!!!
!
!
!
!
!
!!
!
!
!!
!
!
!
!!!!
!
!!
!!
!
!
!
!!!!!
!
!
!
!
!!
!!
!
!
!
!
!!!
!
!
!
!
!
!!
!!!
!
!
!
!
!!
!
!
!!
!
!
!
!
!!
!!!!!!!!!!
!!!
!!!!!!
!!!
!!!
!!!!!!
!
!!
!
!
!
!!!!!!
!!!!!!!!!
!!
!!
!!!!
!
!
!!!!!
!!
!
!
!
!!!!!
!
!
!
!
!
!!!!! !!!!!!!
!
!!
!
! !!
!
!
!
!
!
!
!
!!
!
!!
!
!
!!!
!
!
!!! !
!!
!
!
!
!
!
!!
!
!
!
!
!!
! !
!!
!!!
!
!
!
!
!
!
!!!
!
!
!!
!
!
!!
!!!!
!
!
!
!!!!
!
!
!!
!
!!
!!
!
!!!!!!
!
!
!
!
!!
!
!!
!!!!!
!
!
!
! !
!
!!!
!
!!!
!!!
!
!
!
!!
!
!
!!
!
!
!!
!
!!
!!
!
!
!
!
!
!
!
!
!! !
!
!
!
!
!
!
!
!
!
!
!
!
!
!
!!
!
S E AB E R I N G
A L E U T I A N I S L A N D S
A R C T I C O C E A N
GU
L FO F A L A S K
A
Valdez
Unalaska / Dutch Harbor
Homer
Kenai / Soldotna
Kodiak
Kotzebue
Nome
Ketchikan
Sitka
Barrow
Bethel
Fairbanks
Juneau
Wasilla
Anchorage
Galena
Tok
Dillingham
Palmer
0 150 30075
Miles
ydroelectric power, Alaska’s largest source of renewable energy, supplies 24.9 percent of the state’s electricity in an average water year. In 2014, 45 hydro projects provided power to Alaska utility customers, including the 126 MW AEA-owned Bradley Lake project near Homer, which supplies about eight percent of the Railbelt’s electricity.
Most of the state’s developed hydro resources are located in Southcentral, the Alaska Peninsula, and Southeast – mountainous regions with moderate to high precipitation. Outside the Railbelt, major communities supplied with hydropower are Juneau, Ketchikan, Sitka, Wrangell, Petersburg, Haines, Skagway, Kodiak, Valdez, Akutan, Atka, Pelican, Chignik, Gustavus, Cordova and Glennallen.
In 2014, the City of Sitka increased the capacity of the Blue Lake Dam and powerhouse replacement bringing the installed capacity to 16.9 MW. Annual energy potential from the project increased by 50 percent adding another 32 GWh.
Kodiak Electric Association completed installation of the third, and �nal turbine at the Terror Lake powerhouse adding another 11.25 MW impulse unit bringing the total power capacity to 34 MW. This added capacity will meet peak load demands without operating diesel generators. Terror Lake also acts as an energy reservoir by collecting in�ow for future hydropower generation during times when the wind farm at Pillar Mountain is actively producing power. As a result, the City of Kodiak is nearly 100 percent renewable.
Other projects provide hydro storage without dam construction through the
natural impoundment of existing lakes. The 31 MW Crater Lake
H
10 11
Hydroelectric Renewable Energy Atlas of Alaska
project, part of the AIDEA-owned Snettisham project near Juneau, includes a “lake tap” near the bottom of the lake that supplies water to a powerhouse at sea level through a 1.5-mile long tunnel. Eklutna Lake, near Anchorage, is also a lake tap system.
Still other projects increase annual energy production by diverting rivers to existing hydroelectric storage reservoirs and power plants. These projects allow more e�cient use of existing infrastructure, including intake structures and dams, powerhouses and generation equipment, roads and transmission lines. The diversion of Stetson Creek to Cooper Lake near Cooper Landing was completed in 2015. A diversion of Battle Creek to Bradley Lake near Homer is in the planning stages.
Smaller “run-of-river” projects use more modest structures to divert a portion of the natural river �ow through penstocks to turbines making power. The 824 kW Tazimina project near Iliamna diverts water into an intake 250 feet upstream from a 100-foot waterfall through a steel penstock to an underground powerhouse, and then releases it back into the river near the base of the falls. Other run-of-river projects include Falls Creek at Gustavus and Chuniisax Creek in Atka. Projects on Packers Creek in Chignik Lagoon and the Gartina Falls near Hoonah are recently completed run-of-river hydro projects serving small rural communities.
A major hydroelectric project �rst proposed in the 1980s is again under consideration. AEA is pursuing a Federal Energy Regulatory Commission (FERC) license for Susitna-Watana Hydro. The hydroelectric storage project at Mile 184 of the Susitna River would provide 2,800 GWh annually. Susitna-Watana Hydro is a proposed 705-foot dam that would provide more than half the Railbelt’s average annual electric load.
Hydroelectric

laska has thousands of miles of coastline, providing vast potential for tidal and wave energy development. Alaska rivers can also be a potential resource, using in-river hydrokinetic devices and tidal energy technologies that could supply some of Alaska’s energy needs.
While there are many opportunities, signi�cant environmental and technical challenges remain for the widespread commercial deployment of wave, tidal, and in-river devices. However, these technologies are evolving rapidly and are being demonstrated at more sites around the world each year.
Tidal and river in-stream energy can be extracted using hydrokinetic devices placed directly into a river or tidal current and powered by the kinetic energy of moving water. The available power is a function of the water current’s speed. In contrast, traditional hydropower uses a diversion structure or a dam to supply a combination of hydraulic head and water volume to a turbine generating power. Hydrokinetic devices require a minimum current and water depth to operate. Ideal locations for hydrokinetic devices provide signi�cant �ow throughout the year and are not susceptible to serious �ood events, turbulence, debris or extended periods of low water.
Tidal energy is a concentrated form of the gravitational energy exerted by the moon and, to a lesser extent, the sun. Cook Inlet,
with North America’s second largest tidal range, has attracted interest as
an energy source for the Railbelt. To quantify this, AEA partnered
with the National Oceanic
12
Ocean and River Hydrokinetic
13
Ocean and River Hydrokinetic
1500 - 1700220 - 450
50 - 220 600 - 900
Identified Wave Power Density
< 1010 - 2020 - 30
1.3 - 2525 - 100
100 - 220
30 - 4040 - 5050 - 60
ARenewable Energy Atlas of Alaska
and Atmospheric Administration (NOAA) to create a model of Cook Inlet’s tidal energy potential at di�erent depths.
Wave energy is the result of wind acting on the ocean surface. Alaska has one of the strongest wave resources in the world, with parts of the Aleutian Islands coast averaging more than 50 kW per meter of wave front. The challenge is lack of energy demand near the resource. Much of Alaska’s wave energy is dissipated on remote, undeveloped shorelines. Other substantial wave energy areas include the southern side of the Alaska Peninsula and coastlines of Kodiak and Southeast Alaska.
The best prospect for wave energy development in Alaska may be at Yakutat, where measurements of the wave energy and additional modelling has been conducted in order to provide potential developers the ability to forecast wave intensity days in advance in order to optimize energy extraction. The study was completed by the University of Alaska Fairbanks with funding from the City and Borough of Yakutat and AEA.
Many rural Alaskan communities situated along navigable waterways have the potential to host in-river hydrokinetic device installations. With support from AEA’s Emerging Energy Technology Fund, several devices have been tested in the Kvichak and Tanana Rivers. In order to help alleviate the problem of debris that is common in most Alaska rivers, the University of Alaska Fairbanks has developed a debris mitigation device capable of shielding devices during operation.
Sea Ice present for more than two-thirds of the year
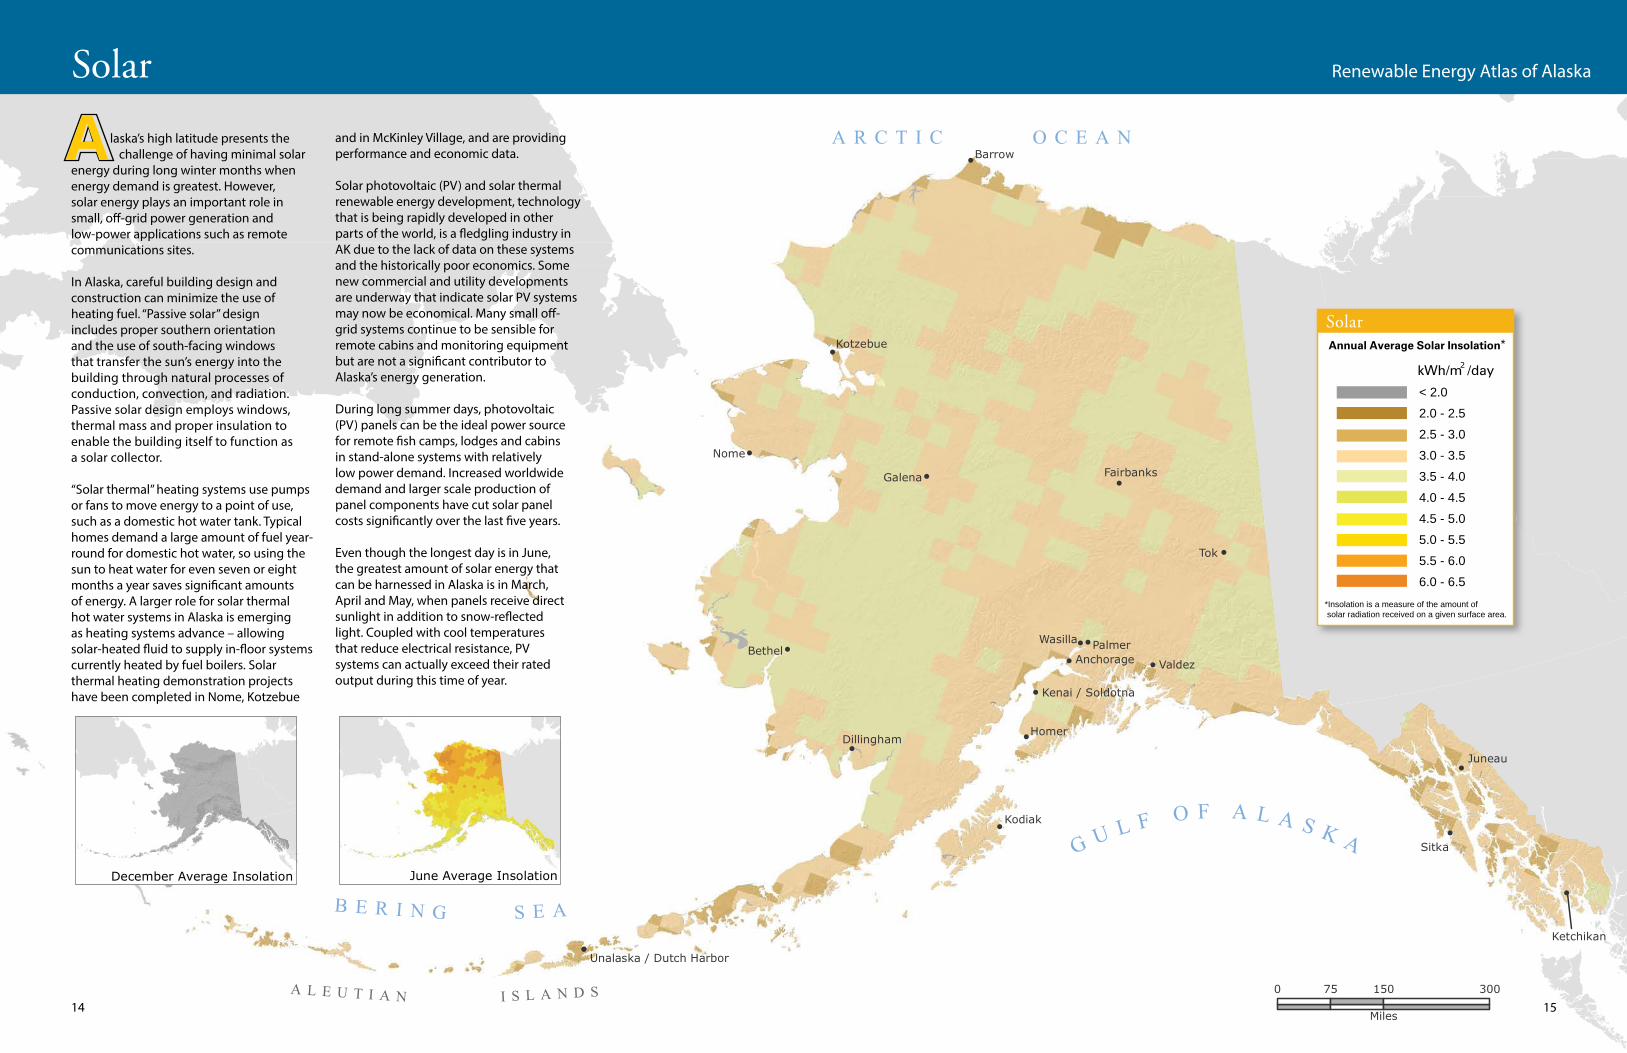
Solar laska’s high latitude presents the challenge of having minimal solar energy during long winter months when energy demand is greatest. However, solar energy plays an important role in small, o�-grid power generation and low-power applications such as remote communications sites.
In Alaska, careful building design and construction can minimize the use of heating fuel. “Passive solar” design includes proper southern orientation and the use of south-facing windows that transfer the sun’s energy into the building through natural processes of conduction, convection, and radiation. Passive solar design employs windows, thermal mass and proper insulation to enable the building itself to function as a solar collector.
“Solar thermal” heating systems use pumps or fans to move energy to a point of use, such as a domestic hot water tank. Typical homes demand a large amount of fuel year-round for domestic hot water, so using the sun to heat water for even seven or eight months a year saves signi�cant amounts of energy. A larger role for solar thermal hot water systems in Alaska is emerging as heating systems advance – allowing solar-heated �uid to supply in-�oor systems currently heated by fuel boilers. Solar thermal heating demonstration projects have been completed in Nome, Kotzebue
A
*
*Insolation is a measure of the amount of solar radiation received on a given surface area.
Solar
< 2.02.0 - 2.52.5 - 3.03.0 - 3.53.5 - 4.04.0 - 4.54.5 - 5.05.0 - 5.55.5 - 6.06.0 - 6.5
14 15
Renewable Energy Atlas of Alaska
and in McKinley Village, and are providing performance and economic data.
Solar photovoltaic (PV) and solar thermal renewable energy development, technology that is being rapidly developed in other parts of the world, is a �edgling industry in AK due to the lack of data on these systems and the historically poor economics. Some new commercial and utility developments are underway that indicate solar PV systems may now be economical. Many small o�-grid systems continue to be sensible for remote cabins and monitoring equipment but are not a signi�cant contributor to Alaska’s energy generation.
During long summer days, photovoltaic (PV) panels can be the ideal power source for remote �sh camps, lodges and cabins in stand-alone systems with relatively low power demand. Increased worldwide demand and larger scale production of panel components have cut solar panel costs signi�cantly over the last �ve years.
Even though the longest day is in June, the greatest amount of solar energy that can be harnessed in Alaska is in March, April and May, when panels receive direct sunlight in addition to snow-re�ected light. Coupled with cool temperatures that reduce electrical resistance, PV systems can actually exceed their rated output during this time of year.

A Wind power technologies that are used in Alaska range from small systems at o�-grid homes and remote camps, to medium-sized wind-diesel hybrid power systems in isolated villages, to large industrial turbines on the Railbelt and in communities like Kodiak, Kotzebue and Nome.
On the Railbelt, utilities and independent power producers have installed three wind projects to diversify the region’s energy mix and provide a hedge against volatile-priced fossil fuels. Those projects are a 17.6 MW wind farm near Anchorage on Fire Island, Golden Valley Electric Association’s 24.6 MW Eva Creek wind farm near Healy, and a 1.9 MW wind farm near Delta Junction. At the beginning of 2016, Alaska had a total installed wind capacity of 67 MW.
Rural Alaska, which is largely powered by expensive diesel fuel, has seen rapid development of community-scale wind-diesel systems in recent years.
In 2009, Kodiak Electric Association (KEA) installed the state’s �rst megawatt-scale turbines and then doubled the size of its wind farm in 2012. The project’s six 1.5 MW turbines supply more than 18 percent of the community’s electricity. Combined with the Terror Lake hydroelectric project, KEA can now shut o� their diesel generators almost all year.
Alaska Village Electric Cooperative has wind-diesel hybrid systems installed in ten of the 56 Western and Interior villages it serves, and is developing projects in at least �ve other communities. Unalakleet Valley Electric Cooperative added a 600 kW wind farm in 2009. Kotzebue added two 900 kW turbines in 2012, more than doubling its wind capacity.
There are now 27 wind installations operating in rural communities outside of the Railbelt
laska has abundant wind resources available for energy development.
Increased costs associated with fossil fuel-based generation and improvements in wind-power technology make this clean, renewable energy resource attractive to many communities.
The wind map on these pages shows the potential for wind energy development. The colors represent the estimated Wind Power Class in each area, with Class 1 being the weakest and Class 7 the strongest. The quality of a wind resource is key to determining the feasibility of a project, but other important factors to consider include the size of a community’s electrical load, the price of displaced fuels such as diesel, turbine foundation costs, the length of transmission lines and other site-speci�c variables.
Alaska’s best wind resources are largely located in the western and coastal portions of the state. In parts of Southwest Alaska turbines may actually need to be sited away from the strongest winds to avoid extreme gusts and turbulence.
While average wind speeds tend to be much lower in the Interior, areas such as Healy and Delta Junction have strong wind resources. The quality of the wind resource is very site speci�c so it is critical to measure the wind resource before starting development.
Site-speci�c wind resource data from around the state has been collected through AEA’s anemometer loan program and is available at Akenergyauthority.org.
Wind
PoorMarginalFairGoodExcellentOutstandingSuperb
< 200200 - 300300 - 400400 - 500500 - 600600 - 700> 800
Wind Power Class
Resource Potential
Wind PowerDensity at 50m
Watts/m2
16 17
Wind Renewable Energy Atlas of Alaska
1
2
3
4
5
6
7

#
o
!!
9
o
9
!!
o
o
9
!!
o
9
!!
!!
q
#
o
!!
!!
!!
!!
o
!!
#
9
o
o 9o
q
o
9
!!
o
!!
9 9
!!
!!
!!
!!
o
9
q
9
9
!!
!!
!!
!!
!!
o
9
9
!!
o
9 o
!!
!!!!
!!
!!
!!
!!
!!
!!
o
!!
o
o
o
o
o
S E AB E R I N G
A L E U T I A N I S L A N D S
Juneau
Anchorage
Buckland/Deering/Noorvik Wind Farm
Transmission Line from Fire Island Wind
Mentasta Woody Biomass
Galena Biomass
Hughes Biomass
Koyukuk Biomass
Anvik Biomass
A R C T I C O C E A N
GU
L FO F A L A S K
A
Valdez
Homer
Kenai / Soldotna
Kodiak
Nome
Ketchikan
Sitka
Barrow
Fairbanks
Wasilla
Dillingham
PalmerRailbelt
North Slope
Southeast
Bristol Bay
Bering Straits
Aleutians
Yukon-Koyukuk/Upper Tanana
Northwest Arctic
Lower Yukon-Kuskokwim
Kodiak
Copper River/Chugach
Juneau Airport GSHP
Gulkana CentralWood Heating
Wrangell Excess Hydro to Heat
Falls Creek Hydroelectric
Chistochina CentralWood Heating
Humpback CreekHydroelectric
North Prince of WalesIsland Intertie Project
Cordova Wood Processing Plant
Haines CentraWood Heating
Whitman Lake Hydroelectric
Banner Peak Transmission
Tok Gateway School Wood Heating
Unalakleet Wind Farm
Chuniisax Creek Hydroelectric
McGrath Heat RecoveryConstruction
Anchorage Landfill Gas
Quinhagak Wind
Toksook Wind
St. George Wind
Delta Area Wind
North Pole HeatRecovery Construction
Kwigillingok Wind
McKinley Village Solar
Juneau Aquatic Ctr. GSHP
Delta JunctionWood Chip Heating
Kotzebue Heat Recovery
Point Lay Heat Recovery
Unalaska Heat Recovery
Tuntutuliak Wind
Emmonak/Alakanuk Wind
Ambler Heat RecoveryConstruction
Sand Point Wind
Ft. Yukon Distric Wood Heat
Saint Paul Heat Recovery
Alaska Sealife Ctr.Seawater Heat Pump
Akutan Hydroelectric
Tanana Biomass
Pilot Point Wind
St. Paul Wind
Kotzebue Wind
Craig Biomass Fuel Dryer
GVEA Eva Creek Wind
Reynolds Creek Hydroelectric
Thorne Bay Wood Boiler
Kaltag Solar
Kenny Lake SchoolWood Fired Boiler
Terror Lake Hydroelectric
Snettishsham Transmission Line
Lake and PeninsulaWood Boilers
Hoonah Heat Recovery
Pelican Hydroelectric
Pillar Mountain Wind
Thayer Lake Hydroelectric
Nome Wind Farm
Russian MissionHeat Recovery Sleetmute Heat Recovery �
Power Plant to Water Plant
Shishmaref Heat Recovery
Togiak Heat Recovery
Mekoryuk Wind
Shaktoolik Wind
Gambell Wind
Tanacross Woody Biomass
Tazimina Hydroelectric
Eagle SolarArray
Blue Lake Hydroelectric
Gartina Falls Hydroelectric
Savoonga Heat Recovery
Atmautluak Heat Recovery
Quinhagak Heat Recovery
Stebbins Heat Project
New StuyahokHeat Recovery
Community Facilities Woody Biomass Space Heating Project
Allison Creek Hydroelectric
Atka DispatchableHeat
Seldovia Heat Recovery
Minto Biomass Heat
Packers Creek Hydroelectric
Ketchikan Gateway BoroughBiomass Heating Project
Brevig Mission Heat Recovery
Chevak Heat Recovery
St. Mary�s Heat Recovery
Venetie ClinicHeat Recovery
Nunam Iqua Heat Recovery
Yakutat Heat Recovery
Emmonak Heat Recovery
Kongiganak Wind
Stetson Creek Diversion CooperLake Dam Facilities
Tuntutuliak Heat Recovery
Kake CommunityEnergy
0 150 30075
Miles
A laska’s Renewable Energy Fund (REF) was created by the Alaska Legislature in 2008 with the intent to appropriate $50 million a year for �ve years to develop renewable energy projects across the state, particularly in areas with the highest energy costs. In 2012 the Legislature extended the program for another 10 years, until 2023.
The REF is administered by the Alaska Energy Authority (AEA) and has been a major stimulus for renewable energy projects across Alaska. Since 2008, the Legislature has appropriated $259 million for 287 qualifying projects. Grants have been awarded for reconnaissance and feasibility studies, as well as design and construction projects covering a wide range of technologies and geographic areas – from wind turbines in Quinhagak to a hydroelectric project in Gustavus to a ground source heat pump system at the Juneau airport to a heat recovery system in North Pole. In 2016, the Alaska Energy Authority is estimating that renewable projects constructed with funding from the Renewable Energy Fund will displace 30 million gallons of diesel fuel.
The program is helping communities stabilize energy prices by reducing their dependence on costly diesel fuel for power generation and space heating. In the 2015, 54 projects displaced an estimated 22 million gallons of diesel fuel worth nearly $61 million. These numbers are expected to increase again in 2016 as many more
projects become operational. Newer projects include the construction of
biomass boilers in the Lake and Peninsula Borough, the Blue
Renewable Energy Fund
18 19
Renewable Energy Atlas of Alaska
Projects Completed/Under Development
Biomass
Biofuel
Geothermal
Heat Recovery
Hydro
Ocean / River
Solar
Transmission
Wind
Lake hydroelectric expansion in Sitka, the Saint Paul heat recovery upgrade, and the wind-to-heat project in Gambell.
The present value of the capital expenditures used to build the �st 54 generating projects is $494 million and the present value of bene�ts is $1.237 billion. Based on the present value of capital costs and future bene�ts, these project have an overall bene�t-cost ratio of 2.5. The REF invested $128.3 million of total project cost to these 54 projects in order to generate the $1.237 billion of lifecycle bene�ts.
One completed project is Gartina Falls in Hoonah that displaces about one-third of the community’s diesel used for electricity generations. Other projects completed are Chevak and Gambell surplus wind-to-heat water, wood boilers in Kokhanok, and Packers Creek Hydroelectric in Chignik Lagoon.
With low state revenues in recent years, AEA has been working with the Renewable Energy Fund Advisory Committee (REFAC) to adapt the program to changing times. Recent years have seen additional emphasis placed on funding early-stages of development that cannot easily be �nanced and providing assistance to applicants to �nd �nancing options to construct feasible projects.
To qualify for funding, project developers must submit applications to AEA, which ranks them based on economic and technical feasibility, local support, matching funding and the community’s cost of energy. These rankings are submitted to the Legislature, which approves the projects and appropriates funding.

Renewable Energy Fund Project Highlights
20 21
Renewable Energy Atlas of Alaska
In 2015 Chignik Lagoon experienced a dramatic change within the community. The noise and emissions from the diesel generator plant ceased but the power was still on. The shift from powering the community with diesel to a water powered generator, a vastly simpler system, occurred with the �ick of a switch. Yet the path to building the hydroelectric generation project was not so simple.
Chignik Lagoon, with a 2010 census population of 78, is one of three communities in the vicinity of the Chignik River located on the south shore of the Alaska Peninsula 450 miles southwest of Anchorage. In 1980 a regional reconnaissance study found two economical projects (Through Creek and Crazy Creek). The next known investigation was the 1995 feasibility for development on Packers Creek.
Alaska’s REF grant program jump started the development and later awarded grants for �nal design and construction. The 167 kW project now generates about 85 percent of Chignik Lagoon’s electrical needs. Construction of the project also improved other infrastructure and opportunities in the community. A new mile-long gravel road leading to the Packer Creek dam nearly doubles the total amount of road in Chignik Lagoon opening up new areas for recreation and subsistence. The project also improved electrical distribution, reduced noise and diesel emissions, and will potentially motivate new business and stimulate the local economy due to lower cost power.
In partnership with the Alaska Energy Authority, Unalakleet Valley Electric Cooperative (UVEC) completed the design and construction of a wind to heat project in Unalakleet, Alaska. The project installed six Northern Power 100 kW wind turbines, constructed a new power plant, and installed a transmission line to connect the turbines to UVEC’s electrical distribution system. Any excess energy generated by the turbines is directed from the wind farm to an electric boiler in the heat recovery loop that feeds the Unalakleet School, using “waste heat” to warm the school gym and several o�ces.
The project became operational in December of 2009. Since then, the turbines have generated 4,670 Megawatt hours of electricity and 552 MMBtu of thermal energy. This has allowed UVEC to displace 334,000 gallons of diesel fuel, saving the community $1,195,000 in reduced fuel costs. Over its 20-year projected lifespan, the project has a calculated bene�t/cost ratio of 2.06, meaning that the project will realize a 206 percent return on investment. This wind project now provides for 35 percent of Unalakleet’s electricity needs.
The Alaska Energy Authority’s Renewable Energy Fund (REF) grant contributed $4,000,000 to the design and construction of the project. Local funds contributed $201,492 for the same project phases.
Total cost: $5.5 millionREF funding: $4.5 million
Generation: 550 MWh annuallyExpected life: 50 years
B/C ratio: 1.06
Total cost: $4.2 millionREF funding: $4 million
Generation: 550 MWh annuallyExpected life: 20 years
B/C ratio: 2.06
Unalakleet Wind to Heat
Chignik Lagoon Hydroelectric
In Southeast Island School District’s Thorne Bay School greenhouse, students are learning the science of growing food, healthy eating, and how to run a successful business. In 2013, the school self-funded and built a hydroponic greenhouse that captures excess heat generated by the school’s cordwood boiler.
The boiler was purchased using a Renewable Energy Fund grant made possible through AEA and the e�orts of the Alaska Wood Energy Development Task Group’s (AWEDTG’s) pre-feasibility and feasibility study process.
In the Thorne Bay School, in addition to displacing heating fuel, the biomass boiler and greenhouse have been incorporated into the curriculum: science, horticulture, math and business are all taught hands-on. The school’s greenhouse grows fresh vegetables for the school cafeteria, improving the quality of school lunch. Excess food is sold to the community as a part of the student-led business and families can deliver wood to the boilers to help fund sports and other extracurricular activities.
Thorne Bay School is generating cheaper, more sustainable heat while championing a successful model of hands-on learning and local economic development that can be replicated around the region. This REF success story is an example of the great things that can be accomplished through collaboration and creativity.
The City of Seward used a Round III grant from the Renewable Energy Fund (REF) to complete the installation of a seawater heat pump system to supply space heating to the Alaska SeaLife Center. This REF grant was combined with an award from the Denali Commission’s Emerging Energy Technology Grant Program and local matching funds to complete the project.
The seawater heat pump system has been fully operational since late 2012, when the fuel oil boilers were shut o� (one has since been removed). Since completion, the system has o�set the equivalent of over 100,000 gallons of diesel fuel.
Heat pumps use a working �uid run in a refrigeration cycle to move heat from a lower temperature source to a higher temperature load. The SeaLife Center was able to take advantage of an existing seawater intake which draws water from Resurrection Bay for use in the facility’s marine life tanks and exhibits. By pumping seawater—with temperatures ranging from 37 to 52 F—through a titanium heat exchanger, the heat pump system uses the 900 foot deep bay itself as a heat source. The seawater temperature is su�cient to boil the heat pump’s refrigerant. The resulting vapor is then compressed, further elevating its temperature in order to supply 100 to 120 F hydronic �uid to heat the building’s air handlers, domestic hot water supply, and outdoor pavement for snow and ice melt.
Total cost: $220,179REF funding: $178,179
Total cost: $830,000REF funding: $286, 580
Alaska SeaLife Center Seawater
Throne Bay School Biomass

Renewable Portfolio Standards
Twenty-nine states, Washington DC and three U.S. territories have adopted policies known as a renewable portfolio standards, or RPS. An additional eight states and one territory have renewable portfolio goals. In 2010 Alaska set a non-binding goal to generate 50% of the state’s electricity from renewable sources by 2025.
An RPS is a state law requiring utility companies to generate a speci�ed percentage of their electricity from
renewable resources by a certain date. For example, Nevada law mandates investor-owned utilities within its jurisdiction to produce 25% of their electricity from renewables by 2025. The percentage and end date vary widely from state to state. In 2015, Hawaii increased its RPS to 100% by 2045. Utilities are typically given interim milestones, and pay a �ne if they do not reach those milestones. Most states allow utilities to purchase
renewable energy credits (RECs) to meet their RPS and avoid �nes. The RPS approach forces di�erent entities and renewable energy resources to compete to meet the standard.
Clean Energy Funds
Most Clean Energy Funds are supported through small, mill rated utility surcharges called system bene�t charges. Depending on the state, these Funds are also known as “Renewable Energy” or “Public Bene�t” Funds. Clean Energy Funds support the development of renewable energy and energy e�ciency by helping remove market barriers, lowering �nancing costs, developing infrastructure, supporting research and development and public educating. For example, system bene�t charges in Oregon are deposited into the independent Energy Trust of Oregon to fund eligible e�ciency, wind, solar electric, biomass, small-scale hydro, tidal, geothermal, and fuel cell projects through grants, loans, rebates, equity investments, and other �nancing mechanisms.
Terms of these funds vary. Some states have funds scheduled to last only �ve years while others have open-ended funds. Longer-term funds provide greater stability for renewable energy developers. Alaska’s Renewable Energy Fund was established in 2008 to support
renewable energy development and is funded through year-to-year appropriations by the state legislature. The Fund is authorized through 2023. Although legislative intent language calls for $50 million in annual appropriations to the Fund, Alaska’s year-to-year �scal realities dictate how much money the legislature appropriates to the Fund each year.
In states with both a RPS and a Clean Energy Fund, the two policies work together to stimulate the renewable energy market. RPS standards “pull” renewable energy technologies into a state by providing long-term market certainty that reduces investment risk and levels the playing �eld for developers. Clean Energy Funds “push” clean energy technologies by lowering market investment barriers through direct incentives that support infrastructure needed to develop renewable energy. As a result, Clean Energy Funds help states meet their RPS requirements.
Feed-In Tariffs
Feed-in tari�s are used in more than 20 countries worldwide and are considered by many to be the most successful policy mechanism for stimulating rapid renewable energy development. They give renewable energy producers guaranteed access to the electric grid at a price set by the regulatory authority, providing producers the contractual certainty needed to �nance renewable energy projects. They also enable homeowners, farmers, cooperatives, and others to participate on equal footing with commercial renewable energy developers. Performance-based payment levels give producers incentive to maximize the overall output and e�ciency of each project. Tari�s are typically di�erentiated by technology and project size. Tari�s for new projects are also subject to periodic review to determine if the program is su�ciently robust, and prices paid for renewable electricity are often reduced over time as technologies mature. Vermont, California, Maine, Washington, Oregon, and Hawaii all have some form of statewide feed-in tari� designed to incentivize technology development and deployment.
Renewable Energy Policies
S tate and federal policies, including subsidies, play a crucial role in energy development. In 2014, International Energy Agency estimates that fossil-fuel consumption subsidies amounted to $493 billion. This is down $39 billion from 2013 “in part due to drop in international energy prices. Subsidies to oil products represent half the total. These subsidies were over four times the value of subsidies to renewable energy.
In the United States, the federal production tax credit (PTC) has been the primary incentive tool for renewable energy development. Congress passed the PTC in 1992 to even the playing �eld between the renewable energy industry and the fossil fuel and nuclear industries. However, since then the credit has been reauthorized just one or two years at a time, creating uncertainty in the industry about federal support of renewables. The current iteration of the credit allows the owners of qualifying wind, geothermal and biomass projects to take 2.3 cents o� their tax bill for every kilowatt-hour generated during the �rst ten years of the project, but only if the projects were deemed eligible as of December 31, 2014. Other qualifying renewable energy technologies are allowed a 1.1 cent/kWh tax reduction. All solar technologies can take advantage of a 30%federal investment tax credit (ITC) or grant for facilitiesplaced in service by the end of 2019. Between 2020 and 2022 the credit is phased down. By 2022, commercial solar systems will receive a 10% credit, while residential solar tax credits are phased out.
Because of the uncertainty surrounding federal policy, state policies have historically been the primary drivers of renewable energy development in the United States. Four important policy mechanisms used across the country are renewable portfolio standards, clean energy funds, feed-in tari�s and net metering. In addition, there are a variety of other state and federal grant, loan and rebate programs designed to promote renewable energy development.
This home in Kasilof is one of the early members ofHomer Electric Association net metering program.
At 67,870 MW generation capacity, US wind power accounted for 6% of the nation’s total electricity generation in 2015. The US was second only to China in the amount of total installed wind generation.
22 23
Emily
Bin
nian
Renewable Energy Atlas of Alaska
Ala
ska
Ener
gy A
utho
rity
Renewable energy creates jobs for Alaskans.
Nat
iona
l Ren
ewab
le E
nerg
y La
bora
tory

considered to be the world’s most successful policy mechanisms for stimulating rapid renewable energy development. They give renewable energy producers guaranteed access to the electric grid at a price set by the regulatory authority, providing producers the contractual certainty needed to �nance renewable energy projects. They also enable homeowners, farmers, cooperatives, and others to participate on equal footing with commercial renewable energy developers. Performance-based payment levels give producers incentive to maximize the overall output and e�ciency of each project.
ARTs are the modern version of Feed Laws, although they di�er from simpler feed laws in several important ways. Tari�s are di�erentiated by technology, project size, or, in the case of wind energy, by resource productivity. Tari�s for new projects are also subject to periodic review to determine if the program is su�ciently robust, and prices paid for renewable electricity are often reduced over time as technologies mature.
The Canadian province of Ontario enacted North America’s �rst comprehensive program of Advanced Renewable Tari�s in 2009, and revised it in 2010. The program o�ers “microFIT“ 20- to 40-year contracts to
Renewable Energy Policies
Renewable Energy Credits (RECs)
Utilities recognized years ago that there was market demand for clean, renewable energy when customers agreed to pay more for resources like wind. However, with the price of wind and solar dropping quickly over the last several years, today almost all utilities sell the social and environmental attributes of renewable energy separate from the actual electrons rather than charging a premium for renewable power. Also known as “green tags,” renewable energy certi�cates (RECs) are essentially the bragging rights created when renewable energy is produced. Each REC represents the production of one megawatt hour of renewable energy and the displacement of approximately 1,400 pounds of CO2 emissions. Buyers of RECs include utilities in compliance markets trying to meet state RPS requirements, and federal agencies, municipalities and corporations committed to voluntarily supporting increased renewable energy production. For example, Microsoft Corporation, Unilever, Georgetown University and the National Hockey League all purchase RECs to o�set 100% or more of their electricity use.
Electricity Feed Laws and Advanced Renewable Tariffs
Electricity feed laws and advanced renewable tari�s (ARTs) are used in a number of countries and are
producers of wind, hydro, biomass, land�ll gas, and solar photovoltaic energy at prices ranging from 10 to 80 cents/kWh. Contracts di�erentiate between small and large energy producers, and are available to homeowners, businesses and commercial energy producers. Additional �nancial incentives are o�ered for projects developed by First Nations, farmers, cooperatives, and community groups.
In 2009 Vermont adopted a modest version of an Advanced Renewable Tari�. The program is currently capped at 127.5MW by 2022 of small DG acceptable to the program and o�ers 25-year contracts for renewable energy producers, with prices varying from 11.8 to 27.1 cents/kWh. The town of Gainesville, Florida also generated widespread publicity in 2009 for adopting a feed-in-tari� to spur installation of solar photovoltaic systems. The tari� o�ers 20-year contracts that pay between 15 and 21 cents/kWh, depending on the size and con�guration of the system. Installations of solar in Gainesville have increased from less than 350 kW in 2009 to over 7,000 kW today. Several other American jurisdictions have enacted some form of feed-in tari�, and feed-in tari� legislation is being debated in several states.
Net Metering
State net metering rules provide an incentive for individuals and businesses to invest in their own small renewable energy systems by allowing them to sell excess power they produce back into the grid. Forty-four states, three territories and the District of Columbia have set mandatory net metering rules. Di�erent standards in each state determine the maximum amount of power an individual can sell back to the utility, the price paid by the utility, and the length of time an individual producer can “bank” the power they produce before a “net” bill. Alaska’s net metering regulations, which were promulgated by the Regulatory Commission of Alaska, went into e�ect in 2010. They apply to renewable energy systems of 25 kW or less, and require large utilities to purchase up to 1.5% of the utility’s average load from customers who build projects at a price equivalent to the avoided cost.
Alaska
2008 was a landmark year for renewable energy and energy e�ciency in Alaska. The passage of HB 152, which established the Renewable Energy Fund (REF) administered by the Alaska Energy Authority (AEA). Through the �rst eight rounds of funding, the State Legislature has appropriated $259 million for 287 grants across the state. In 2015, the 54 projects that have been
The Denali Education Center is approximately 6 miles south of Denali National Park. They host youth camps and other informational gatherings related to the park and the outdoors. The solar system includes a 1/4 - mile hot water loop for the various cabins fed by 1300 sq. ft. of solar thermal panels.
Steam vent on Kiska Volcano in the Aleutian Islands. Several communities in the Aleutians are considering developing their geothermal resources.
constructed with REF support saved the equivalent of 22 million gallons of diesel fuel per year. Also, the Cold Climate Housing Research Center published the �rst of two reports outlining recommended state programs, initiatives, and goals to reduce end-use energy demand and keep hundreds of millions of dollars in the State’s economy each year, and the State Legislature appropriated $360 million for home weatherization and rebate programs.
In 2010, the Alaska State Legislature passed two other important bills – SB 220 and HB 306. House Bill 306 established goals to produce 50% of the state’s electricity from renewable resources by 2025 and reduce energy use 15% per capita by 2020. Among other provisions, SB 220 mandated that 25% of the state’s public buildings be energy retro�tted by 2020 and created a $250 million revolving loan fund administered by the Alaska Housing Finance Corporation (AHFC) to help �nance that work.
Senate Bill 220 also established the Emerging Energy Technology Fund (EETF), which is aimed at supporting the development of new technologies not funded under the REF. Administered by AEA, with �nancial support from the State and the Denali Commission, the EETF has awarded 19 grants for a range of projects that use technologies not yet tested in Alaska as well as technologies that are still in development but could be commercially viable within �ve years.
24 25
REA
P
Ala
ska
Volc
ano
Obs
erva
tory
Ala
ska
Ener
gy A
utho
rity
Renewable Energy Atlas of Alaska
Kodiak Electric Association installed three 1.5 MW wind turbines on Pillar Mountain in 2009 and then doubled the size of the wind farm in 2012. The project now supplies more than 18% of the community’s electricity. Combined with the Terror Lake hydroelectric project, KEA can shut o� their diesel generators almost all year.

!
!
!
!
!
!
!
!
!
!
!
!
!
!
!
!
!
!
!!
B E R I N G
A R C T I C O C E A N
S E A
A L E U T I A N I S L A N D S
GU
L FO F A L A S K
A
Valdez
Homer
Kenai / Soldotna
Kodiak
Kotzebue
Nome
Ketchikan
Sitka
Barrow
Bethel
Fairbanks
Juneau
Wasilla
Anchorage
Dillingham
Galena
Tok
Palmer
Unalaska / Dutch Harbor
0 150 30075
Miles
Energy E�ciency nergy e�ciency is a common-sense �rst step in realizing sustainable energy goals. Energy e�cient buildings, lighting, heating systems and appliances provide the same level of service as less e�cient ones but use fewer kilowatt hours and BTU’s. Energy e�ciency is typically the least expensive, most cost e�ective and fastest energy improvement that can be made. In 2010, the state adopted a goal to reduce per capita energy consumption 15 percent by 2020. With the same legislation the state also declared that by 2025, 50 percent of power should come from renewable energy sources. Improving e�ciency not only saves energy and money, it allows generated energy to stretch further. Energy e�ciency creates a strong foundation for renewable energy. Each year Alaska’s residential and commercial sectors use an estimated 118 trillion BTU’s of energy for power and space heat. Of this, 45 percent is used in residential buildings and 55 percent is used in public and private commercial buildings and facilities. Reducing energy use in these two sectors by 15 percent would save nearly 18 trillion BTU’s annually. At $4/gallon for diesel fuel, this reduction through energy e�ciency improvement in residential, commercial and public buildings would keep $500 million in the state’s economy each year. The State of Alaska is working to reduce cost and consumption through programs housed at the the Alaska Energy Authority (AEA), Alaska Housing Finance Corporation (AHFC), and the Department of Transportation and Public Facilities (DOT&PF).
The Alaska Energy Authority administers two non-residential e�ciency programs; the Commercial Building Energy Audit (CBEA) program and the Village Energy E�ciency Program (VEEP). The CBEA has provided rebates for more than 230 privately owned non-residential buildings since 2011, identifying an average 28 percent potential savings and a six-year simple payback through economic e�ciency measures. VEEP is a grant program which has implemented energy e�ciency measures in public and tribal buildings and facilities in 61 small communities since 2005. These improvements are savings rural communities millions of dollars annually while extending the useful life of public infrastructure.
Until recently, Alaska Housing Finance Corporation administerd two residential energy e�ciency programs: Home Energy Rebate Program and Weatherization. Between 2008 and 2015, the Home Energy Rebate and Weatherization programs provided e�ciency improvements to more than 40,000 households across Alaska, resulting in an average energy savings of 30 percent, the creation of more than 4,000 jobs, and an estimated $56 million in energy saving to Alaskans per year. Weatherization is still available for income eligible households.
The Alaska Department of Transportation and Public Facilities works to improve the e�ciency of State of Alaska buildings and facilities through their Energy Program o�ce. Between 2010 and 2015, DOT&PF’s Energy Program facilitated e�ciency improvements to over 25 percent of state-owned facilities, achieving a cumulative annual cost avoidance of more than $2.4 million.
E
E�ciency OpportunityTotal Potential Savings
Gallons of Diesel Equivalent/Year
> 100,000
100,000 - 1,000,000
< 5,000,000
1,000,000 - 5,000,000
26 27
Renewable Energy Atlas of Alaska

nergy e�ciency improvements help individuals, businesses and governments use less energy, save money, and strengthen local economies. E�ciency measures also help achieve the state’s energy e�ciency and renewable energy goals. While the availability of natural resources varies by location, energy e�ciency is available in every corner of the state.
Rural Alaska Case Study – Revisiting the Whole Village Retrofit
In 2008, AEA and several project partners undertook an intensive energy e�ciency improvement e�ort in the small, rural community of Nightmute. This Whole Village Retro�t (WVR) included energy e�cient lighting and weatherization upgrades in 13 community buildings, four teacher-housing units along with powerhouse and transmission system improvements. The e�ort was intended to maximize energy savings and mitigate the e�ects of rising heating oil prices. With state and federal funding complemented by signi�cant local cash and in-kind match, the project reduced electricity use by an estimated 59% and displaced nearly 5,000 gallons of heating oil annually through the public building improvements alone.
Energy e�ciency is consistently rising to the top of local energy project priority lists across the state through the AEA-led regional energy planning process. The success in Nightmute suggests that this multi-agency service delivery model is one worth replicating, especially if private sector investment can be secured rather than relying exclusively on state grant funding. AEA and partners are exploring the potential to pilot a next generation, fully �nanced WVR.
EEnergy E�ciency Program Highlights
training needs. LED interior and exterior lighting, setback thermostats, minor weatherization, heating system e�ciency improvements, and new controls to reduce the heating demand of circulating water and sewer system were implemented in 2014 with funding from the State of Alaska and the United States Department of Agriculture, Rural Development. This e�ort included substantial energy e�ciency training for the operators of the sanitation system. The community has recognized a 66% reduction in fuel usage and a 33% reduction in electricity usage in the sanitation system since energy e�ciency retro�ts and training have been implemented.
Data Collection and Management
The Alaska Retro�t Information System (ARIS) is the state’s database to store energy audit and consumption information for both residential and non-residential buildings. ARIS, managed by AHFC, is a useful tool for assessing the current state of residential housing and commercial building stock with respect to energy e�ciency. Maintaining building characteristic and energy use information in ARIS allows researchers and energy specialists to more accurately study the impacts of di�erent programs; evaluate technology performance in cold climates; and identify opportunities to decrease energy use through e�ciency. Local governments and tribes can also use ARIS to track the energy use in their buildings. AIn an e�ort to re�ect the value of e�ciency in a home’s sale price, an appraisal tool uses ARIS data to show appraisers comparable residential energy use.
The Alaska A�ordable Energy Strategy (AkAES), a program mandated by the legislature as part of the AKLNG legislation in 2014, is required to deliver a plan and proposed legislation to provide more a�ordable energy to the parts of the state that would not have direct access to a North Slope natural gas pipeline. The AkAES has led to an extensive data collection and modeling e�ort to estimate the consumption and e�ciency opportunity in the AkAES region’s residential, non-residential, and water systems in order to compare the e�ciency to other energy cost reduction strategies in communities. By collecting available building information from nearly 6,000 non-residential buildings; 17,000 residential buildings from AHFC’s BEES, Weatherization, and Home Energy Rebate programs; water system data from ANTHC; and various other sources, communities’ heating and electricity consumption has been estimated. The community-level e�ciency opportunity draws from these same sources as well as building audit information. All deliverables for the AkAES, including the e�ciency opportunity, will be available through AEA’s website.
Alaska Energy Efficiency Partnership The Alaska Energy E�ciency Partnership is a group of more than 70 public, private and non-pro�t entities that meet quarterly to share information and �nd collaborative
cruise through the upgrades in two months. My wife and I scraped the bottom of the barrel of our �nances, holding on to the hope that we were doing everything correctly. Our energy rater was a massive resource. We spent $12,000 and put a lot of sweat equity into the project including BBQ work parties with friends to fuel our projects. Finishing up with AHFC felt so streamlined and getting the rebate check was such a surreal event. My wife and I are so truly grateful and appreciative for the Home Energy Rebate program. We have learned so much and made improvements that otherwise would have not been �nancially possible.”
Non-Residential Energy Efficiency Case Study
In summer 2015 the Department of Transportation and Public Facilities (DOT&PF) closed a precedent-setting $3.5 million deal for energy e�ciency upgrades to 16 maintenance facilities in nine di�erent communities in its Northern Region. With an estimated annual energy savings of more than $240,000, this Public Facilities Energy Program project is the �rst to be �nanced privately, demonstrating potential for similar public-private partnerships in the future.
DOT&PF’s energy program works with other state agencies to facilitate energy e�ciency projects that reduce energy consumption and operating expenses in public facilities. Each project is developed to be budget neutral; the guaranteed savings pay for the �nancing of the energy e�ciency improvements over time. DOT&PF administers an ongoing Energy Savings Performance Contracting (ESPC) Term Agreement to assist state and public agencies in procuring the services of Energy Services Companies (ESCO).
The contract for the Northern Region Energy Upgrades project was awarded to Siemens Industry, Inc. in February 2014. With approval from DOT&PF, Siemens solicited proposals for project �nancing from four institutions familiar with ESCO-based energy projects. Ultimately, Bank of America was selected. The loan transaction was completed in June 2015, creating a clear pathway to procuring private �nancing solutions for state agencies.
This and future EE projects help the state save energy by improving existing infrastructure, reducing operating costs and creating additional jobs for Alaskans.
Water System Case Study
In 2012, the Alaska Native Tribal Health Consortium (ANTHC) conducted a holistic assessment of energy usage across all the facilities and equipment used to provide clean water and sewer services to the community of Pilot Station. The community has implemented simple retro�t measures on their own accord after receiving the results of the energy audit, and worked with ANTHC to identify funding to complete the more expensive retro�ts and
28 29
Energy Efficiency is an Investment Opportunity
Energy e�ciency is more than swapping out lightbulbs and adding insulation – it creates economic opportunity while improving comfort and it can be done without compromising convenience. Using electricity and heat is an unavoidable reality in our state, where the associated costs for these critical services are double or triple what our friends outside pay. And, despite relatively short-lived trends to the contrary, energy prices generally only go up over time. The longer you wait to take action, the longer you continue to waste energy and money unnecessarily. Take action today, save today and every day after. Your energy e�ciency investment grows incrementally, generating savings that can be continuously reinvested in your home, your business, or your community. An investment in energy e�ciency is an investment in your future.
Like any good investment, investing in e�ciency requires a �nancial commitment. The savings opportunity, however, can be signi�cant enough that it’s worth taking a loan to make this commitment. The cost of repaying that loan is often smaller than the savings generated by the e�ciency improvements the loan a�ords. We’re talking about energy e�ciency �nancing, and it’s the way of the future.
To �nance your energy e�ciency investment, you need to start with information. Have your building or facility audited to see what kind of savings is possible. Have the project cost and savings estimates veri�ed. Develop a scope of work. Consider working with a project developer. Initiate negotiations with a lender, public or private. Make sure you get the savings you were promised. And then reap the rewards of your hard work with lower energy bills, a healthier indoor air quality, and more money to spend on other, more important things. For more information about �nancing energy e�ciency projects, go to www.akenergye�ciency.org/�nancing.
Renewable Energy Atlas of Alaska
Commercial Energy Efficiency Case Study Levi and Anna Thomas participated in Alaska Housing Finance Corporation’s Home Energy Rebate program and went from a 2-star home energy rating to a 5-star rating, cutting their gas usage by 65 percent. The couple sent the following note to program managers: “When I �rst heard of the program it seemed so elusive and daunting. But from my �rst audit, I was able to
opportunities in the pursuit of shared goals. The Partnership’s mission is “[t]o improve the coordination of e�orts promoting the adoption of greater end-use energy e�ciency measures and energy conservation behaviors in Alaska through information sharing and integrated planning so that Alaska may become the most energy e�cient state in the nation.”
Ala
ska
Ener
gy A
utho
rity

Ocean Energy Systems - Energy conversion technologies that harness the energy in tides, waves, and thermal gradients in the oceans.
Organic Rankine cycle (ORC) – A closed system that uses an organic working �uid instead of water to spin a turbine, and therefore can operate at lower temperatures and pressures than a conventional steam process.
Panel (Solar) - A term applied to individual solar collectors, and typically to solar photovoltaic collectors or modules.
Passive Solar Design - Construction of a building to maximize solar heat gain in the winter and minimize it in the summer without the use of fans or pumps, thereby reducing the use of mechanical heating and cooling systems.
Peak load – The amount of electricity required to meet customer demand at its highest.
Penstock - A component of a hydropower plant; a pipe that delivers water to the turbine.
Photovoltaics (PV) - Devices that convert sunlight directly into electricity using semiconductor materials. Most commonly found on a �xed or movable panel; also called solar panels.
Power - Energy that is capable of doing work; the time rate at which work is performed, measured in horsepower, Watts, or Btu per hour.
Production Tax Credit (PTC) – An incentive that allows the owner of a qualifying energy project to reduce their taxes by a speci�ed amount. The federal PTC for wind, geothermal, and closed-loop biomass is 1.9 cents per kWh.
Radiation - The transfer of heat through matter or space by means of electromagnetic waves.
Railbelt - The portion of Alaska near the Alaska Railroad, including Fairbanks, Anchorage, and the Kenai Peninsula.
Renewable Resource - Energy sources which are continuously replenished by natural processes, such as wind, solar, biomass, hydroelectric, wave, tidal, and geothermal.
Run-of-River Hydroelectric - A type of hydroelectric facility that uses a portion of the river �ow with minimal impoundment of the water.
Small-scale or Residential-scale - A generating facility designed to output enough electricity to o�set the needs of a residence, farm or small group of farms, generally 250 kW or smaller.
Solar Energy - Electromagnetic energy transmitted from the sun (solar radiation). The amount that reaches the earth is equal to one billionth of total solar energy generated, or the equivalent of about 420 trillion kilowatt-hours.
Solar Radiation - A general term for the visible and near visible (ultraviolet and near-infrared) electromagnetic radiation that is emitted by the sun. It has a spectral, or wavelength, distribution that corresponds to di�erent energy levels; short wavelength radiation has a higher energy than long-wavelength radiation.
Tidal Power - The power available from either the rise and fall or �ow associated with ocean tides.
Transmission Grid - The network of power lines and associated equipment required to deliver electricity from generating facilities to consumers through electric lines at high voltage, typically 69kV and above.
Turbine - A device for converting the �ow of a �uid (air, steam, water, or hot gases) into mechanical motion. Wave Energy - Energy derived from the motion of ocean waves.
Wind Energy - Energy derived from the movement of the wind across a landscape caused by the heating of the atmosphere, earth, and oceans by the sun. Wind Turbine - A device that converts energy in the wind to electrical energy, typically having two or three blades.
Windmill - A device that converts energy in the wind to mechanical energy that is used to grind grain or pump water.
Wind Power Class - A class based on wind power density ranging from 1 (worst) to 7 (best).
Wind Power Density - The amount of power per unit area of a free windstream.
Wind Resource Assessment - The process of characterizing the wind resource and its energy potential, for a speci�c site or geographical area.
UNITS
Ampere - A unit of measure for an electrical current; the amount of current that �ows in a circuit at an electromotive force of one Volt and at a resistance of one Ohm. Abbreviated as amp.
Amp-Hours - A measure of the flow of current (in amperes) over one hour.
Barrel (Petroleum) - Equivalent to 42 U.S. gallons (306 pounds of oil, or 5.78 million Btu).
British Thermal Unit (Btu) - The amount of heat required to raise the temperature of one pound of water one degree Fahrenheit; equal to 252 calories.
Cord (of Wood) - A stack of wood 4 feet by 4 feet by 8 feet.
Gigawatt (GW) - A unit of power equal to 1 billion watts, 1 million kilowatts, or 1,000 megawatts.
Gigawatt-hour (GWh) - One million kilowatt-hours or 1 billion watt-hours.
Hertz - A measure of the number of cycles or wavelengths of electrical energy per second; U.S. electricity supply has a standard frequency of 60 hertz.
Horsepower (hp) - A measure of time rate of mechanical energy output; usually applied to electric motors as the maximum output; 1 electrical hp is equal to 0.746 kilowatts or 2,545 Btu per hour.
Kilowatt (kW) - A standard unit of electrical power equal to one thousand watts, or to the energy consumption at a rate of 1000 Joules per second.
Kilowatt-hour (kWh) - A common measurement of electricity equivalent to one kilowatt of power generated or consumed over the period of one hour; equivalent to 3,412 Btu. Megawatt (MW) - One thousand kilowatts or 1 million watts; standard measure of electric power plant generating capacity.
Megawatt-hour (MWh) - One thousand kilowatt-hours or 1 million watt-hours. Mill - A common monetary measure equal to one-thousandth of a dollar or a tenth of a cent. Quad - One quadrillion Btu.
Therm - A unit of heat containing 100,000 British thermal units (Btu).
Terawatt (TW) - A unit of electrical power equal to one trillion watts or one million megawatts.
Tonne - A unit of mass equal to 1,000 kilograms or 2,204.6 pounds, also known as a metric ton.
Volt (V) - A unit of electrical force equal to that amount of electromotive force that will cause a steady current of one ampere to �ow through a resistance of one ohm. Voltage - The amount of electromotive force, measured in volts, that exists between two points.
Watt (W) - Instantaneous measure of power, equivalent to one ampere under an electrical pressure of one volt. One watt equals 1/746 horsepower, or one joule per second. It is the product of Voltage and Current (amperage).
Watt-hour - A unit of electricity consumption of one Watt over the period of one hour.
Watts per Square Meter (W/m2) - Unit used to measure wind power density, measured in Watts per square meter of blade swept area.
Absorption Chiller - A device that uses heat energy rather than mechanical energy to cool an interior space through the evaporation of a volatile �uid.
Active Solar - A solar water or space-heating system that use pumps or fans to circulate the heat transfer medium (water, air or heat-transfer �uid like diluted antifreeze) from the solar collectors to a storage tank subsystem or conditioned space.
Alternative Fuels - A term for “non-conventional” transportation fuels derived from natural gas (propane, compressed natural gas, methanol, etc.) or biomass materials (ethanol, methanol, or biodiesel).
Anemometer - An instrument for measuring the velocity of wind; a wind gauge.
ASTM - Abbreviation for the American Society for Testing and Materials, which is responsible for the issue of many standard methods used in the energy industry.
Availability - It refers to the number of hours that a power plant is available to produce power divided by the total hours in a set time period, usually a year.
Avoided Cost - The incremental cost to an electric power producer to generate or purchase a unit of electricity or capacity or both.
Biodiesel - A domestic, renewable fuel for diesel engines derived from natural oils like �sh and vegetable oil; produced by a chemical process that removes the glycerin from the oil and meets a national speci�cation (ASTM D 6751).
Biomass - Organic matter that is available on a renewable basis, including agricultural crops and agricultural wastes and residues, wood and wood wastes and residues, animal wastes, municipal wastes, and aquatic plants.
Bioenergy – Electrical, mechanical, or thermal energy or fuels derived from biomass. Capacity Factor - The ratio of the average power output of a generating unit to the capacity rating of the unit over a speci�ed period of time, usually a year.
Co-�ring - Using more than one fuel source to produce electricity in a power plant. Common combinations include biomass and coal, biomass and natural gas, or natural gas and coal.
Cogeneration - The generation of electricity and the concurrent use of rejected thermal energy from the conversion system as an auxiliary energy source.
Conduction - The transfer of heat through a material by the transfer of kinetic energy from particle to particle; the �ow of heat between two materials of di�erent
temperatures that are in direct physical contact.
Convection - The transfer of heat by means of air or �uid movement.
Dam - A structure for impeding and controlling the �ow of water in a water course that increases the water elevation to create hydraulic head. The reservoir creates, in e�ect, stored energy.
District Heating System - Local system that provides thermal energy through steam or hot water piped to buildings within a speci�c geographic area. Used for space heating, water heating, cooling, and industrial processes. A common application of geothermal resources.
Distributed Generation - Localized or on-site power generation, which can be used to reduce the load on a transmission system by generating electricity close to areas of customer need.
Distribution Line - One or more circuits of an electrical distribution system on the same line or poles or supporting structures, usually operating at a lower voltage than a transmission line.
Domestic Hot Water - Water heated for residential washing, bathing, etc.
Electrical Energy - The amount of work accomplished by electrical power, usually measured in kilowatt-hours (kWh). One kWh is 1,000 watt hours and is equal to 3,413 Btu.
Energy - The capability of doing work; di�erent forms of energy can be converted to other forms, but the total amount of energy remains the same.
Energy Conservation - Reducing energy consumption by changing a behavior or level of service.
Energy Crop - A plant grown with the express purpose to be used in biomass electricity or thermal generation.
Energy E�ciency - Applying better technology and practices to get the same level of service while using less energy.
Energy Storage - The process of converting energy from one form to another for later use. Storage devices and systems include batteries, conventional and pumped storage hydroelectric, �ywheels, compressed gas, hydrogen, and thermal mass.
Ethanol - A colorless liquid that is the product of fermentation used in alcoholic beverages, in industrial processes, and as a fuel.
Feedstock - A raw material that can be converted to one or more products.
Fossil Fuels - Fuels formed in the ground from the remains of dead plants and animals, including oil, natural gas, and coal. It takes millions of years to form fossil fuels.
Fuel - Any material burned to make energy.
Fuel Oil - Any liquid petroleum product burned for the generation of heat in a furnace or �rebox, or for the generation of power in an engine. Domestic (residential) heating fuels are classed as Nos. 1, 2, 3; Industrial fuels as Nos. 4, 5, and 6.
Generator - A device for converting mechanical energy to electrical energy.
Geothermal Energy - Energy produced by the internal heat of the earth; geothermal heat sources include: hydrothermal convective systems; pressurized water reservoirs; hot dry rocks; thermal gradients; and magma. Geothermal energy can be used directly for heating and cooling or to produce electric power.
Head – A measure of �uid pressure, commonly used in water pumping and hydro power to express height that a pump must lift water, or the distance water falls. Total head accounts for friction and other head losses.
Heat Pump - An electricity powered device that extracts available heat from one area (the heat source) and transfers it to another (the heat sink) to either heat or cool an interior space or to extract heat energy from a �uid.
Hybrid System - An energy system that includes two di�erent types of technologies that produce the same type of energy; for example, a wind turbine and a diesel system combined to meet electric power demand.
Hydroelectric Power Plant - A power plant that produces electricity by the force of water moving through a hydro turbine that spins a generator.
Hydrogen - A chemical element that can be used as a fuel since it has a very high energy content. Although it is often thought of as a fuel, hydrogen is better classi�ed as an energy storage medium because it requires energy, typically from electricity or natural gas, to produce it.
Insolation - A measure of the amount of solar radiation energy received on a given surface area.
Land�ll Gas - Naturally occurring methane produced in land�lls that can be burned in a boiler to produce heat or in a gas turbine or engine-generator to produce electricity.
Large-scale or Utility-scale - A power generating facility designed to output enough electricity for purchase by a utility.
Load - Amount of electricity required to meet customer demand at any given time.
Meteorological (Met) Tower - A structure instrumented with anemometers, wind vanes, and other sensors to measure the wind resource at a site.
Glossary
30 31
Renewable Energy Atlas of Alaska

For More InformationAlaskaAlaska Energy Authoritywww.akenergyauthority.orgRenewable energy resource maps, reports, programs, planning, and �nancing information.
Alaska Energy E�ciency Partnershiphttp://akenergye�ciency.orgState-run clearinghouse for information on energy e�ciency in Alaska.
Alaska Housing Finance Corporationwww.ahfc.state.ak.usResidential and community building energy e�ciency programs, energy resources library, programs, and �nancing information.
Denali Commissionwww.denali.govIndependent federal agency created by Congress to provide basic facilities to remote Alaskan communities.
Renewable Energy Alaska Projectwww.realaska.orgA coalition of over 70 utilities, developers, Alaska Native corporations, conservation groups and other NGOs that educate the public and policy makers about renewable energy and energy e�ciency.
University of Alaska Center for Energy and Power at the University of Alaska Fairbanks www.uaf.edu/acep/ Applied energy research focused on lowering energy costs and developing economic opportunities
University of Alaska FairbanksCooperative Extension Servicewww.uaf.edu/coop-ext/faculty/seifert/energy.htmlProvides housing technology information to Alaskan home owners and builders.
E�ciencyAmerican Council for an Energy E�cient Economy www.aceee.orgA nonpro�t that acts as a catalyst to advance energy e�ciency policies, programs, technologies, investments and behaviors through in-depth technical and policy analysis
Nationwide and RegionalNational Renewable Energy Laboratory www.nrel.govUSDOE’s premier laboratory for renewable energy research and development.
US Department of Energy www.energy.govUSDOE home page provides information on federal programs relating to energy.
Rocky Mountain Institutewww.rmi.orgAn independent, non-partisan nonpro�t that drives the e�cient and restorative use of resources by engaging businesses, communities, and institutions to cost-e�ectively shift to e�ciency and renewables.
Policies Supporting: Renewable Energy Database of State Incentives for Renewables & E�ciency www.dsireusa.orgInformation on tax incentives, rebate programs, portfolio standards, green power programs, and other state-level policies.
National Association of State Energy O�cials www.naseo.orgRepresents governor-designated o�cials from each state.
RE100www.there100.org/RE100 is a collaborative, global initiative of in�uential businesses committed to 100% renewable electricity, working to massively increase corporate demand for renewable energy.
Biomass National Biodiesel Boardwww.biodiesel.orgNational trade association representing the biodiesel industry.
Bioenergy Technologies O�ce www.energy.gov/eere/bioenergy/bioenergy-technologies-o�ceUSDOE’s biomass energy program.
Paci�c Regional Biomass Energy Partnership www.paci�cbiomass.orgPromotes bioenergy development in Alaska, Hawaii, Idaho, Montana, Oregon, and Washington.
Geothermal Geothermal Resources Council www.geothermal.orgInternational association for geothermal education including industry, researchers, and government. Geothermal Technologies Program www.energy.gov/eere/renewables/geothermalUSDOE’s geothermal energy program.
OceanElectric Power Research Institute: Ocean Energy Programwww.epri.com/oceanenergy/Tidal and wave energy webpage for independent, nonpro�t energy research center.
Solar Alaska Sunwww.uaf.edu/ces/energy/alaskasunAlaskans supporting solar energy with link to Solar Design Manual for Alaska.
American Solar Energy Society www.ases.orgA national association dedicated to advancing the use of solar energy.
Solar Energy Technologies Program www1.eere.energy.gov/solarUSDOE’s solar energy technology website.
Wind WindExchangewww.energy.gov/eere/wind/windexchangeLeads the U.S. DOE’s e�orts to accelerate the deployment of wind power technologies through improved performance, lower costs, and reduced market barriers by working with national laboratories, industry, universities, and other federal agencies to conduct research and development activities.
National Wind Technology Center www.nrel.gov/windUSDOE’s wind energy research and development facility.
American Wind Energy Association www.awea.orgNational trade association representing wind developers, manufactures, utilities, and others involved in the wind industry.
Data SourcesReferences
Common Map LayersCommunities: Alaska Department of Commerce, Community, and Economic Development. Community Database Online. www.commerce.alaska.gov/dca/commdb/CF_COMDB.htm
Lakes, Streams, and Glaciers: Alaska Department of Natural Resources. www.asgdc.alaska.gov
Grayscale Elevation Hillshade Image: Resource Data Inc. The elevation image was developed using a 300 meter digital elevation model from U.S. Geological Survey EROS Alaska Field O�ce. agdc.usgs.gov/data/usgs/erosafo/300m/dem/metadata/dem300m.html
Canada and Russia: Alaska Departmentof Natural Resources. www.asgdc.alaska.gov
InfrastructureCoal, Gas Turbine, Hydro, and Diesel Sites*: Average generation from Alaska Energy Statistics, 1960-2008, University of Alaska Anchorage Institute of Social and Economic Research, 2011. www.iser.uaa.alaska.edu/Publications/AlaskaEnergyStatistics2011.pdf Average oil, gas, and hydroelectricalgeneration data augmented via personalcommunication with AEA sta�, operating utilities, Alaska Energy Statistics 1960-2011, preliminary tables.
Pie chart from: Non Utility Data: U.S. Department of Energy, Energy Information Admisnistration, Form 923 Data File F923www.eia.gov/electricity/data/eia923/
Existing Utility Hydroelectric sites: Alaska Energy Authority hydroelectric database. Spatial location and attributedata updated by HDR Alaska Inc. in 2006 , AEA in 2013 and 2015.
Wind Sites*: Average wind generation from the Statistical Report of the Power Cost Equalization Program, FY2011 and augmented by AEA. Includes projects currently under commissioning and expected to be in operation by the end of 2012. http://www.akenergyauthority.org/PDF%20�les/FY11PCEreport.pdf
Electrical Interties: Interties aggregated from data provided by Alaska Electric Light & Power Company, Alaska Power & Telephone Company, Alaska Village Electric Cooperative, Chugach Electric Association, City of Sitka Electric Department, Copper Valley Electric Association, Four Dam Pool Association, Golden Valley Electric Association, Homer Electric Association, Naknek Electric Association, Nushagak Cooperative, and AEA.
Natural Gas Pipelines: ENSTAR Natural Gas Company.
Electric Service Areas: Chugach Electric Association.
Trans-Alaska Pipeline: Alaska Department of Natural Resources. www.asgdc.alaska.gov
Roads: Alaska Department of Natural Resources & Alaska Department of Transportation. www.asgdc.alaska.gov
Energy E�ciencyFrom www.akenergye�ciencymap.org, a project of Alaska Energy Authority. Map currently depicts only three projects funded through the American Recovery and Reinvestment Act, 2010 – 2012.
Estimated statewide energy use comes from the 2010 Energy Information Administration.
BiomassUSDA Forest Service Forest Inventory and Analysis, Remote Sensing Applications Center 2008 based on J.A. Blackard, et.al. Mapping U.S. forest biomass using nationwide forest inventory data and moderate resolution information. Remote Sensing of Environment 112:1658-1677 http://www.�a.fs.fed.us/
Shore-based Seafood Processors*: Alaska Department of Fish and Game. 2010 Commercial Operators Annual Report, data compiled by the Alaska Fisheries Information Network (AKFIN). www.ak�n.org
Class I Land�lls*: Alaska Department of Environmental Conservation.
Sawmills*: Alaska Wood Products Manufacturers Directory, September 2004. Juneau Economic Development Council Wood Products Development Service. Dataset augmented via personal communication with Dan Parrent, USFS. http://jedc.org/wood.shtml
GeothermalVolcanic Vents Wells and Springs by Temperature and Potential Geothermal Resources: Geothermal Resources of Alaska, Motyka, R.J., Moorman, M.A., and Liss, S.A., 1983, Geothermal Resources of Alaska: Miscellaneous Publication MP 8, Alaska, Department of Natural Resources, Division of Geological & Geophysical Surveys, Fairbanks, Alaska – USA www.dggs.dnr.state.ak.us/pubs/pubs?reqtype=citation&ID=671
Wells and Springs by Temperature: Kolker, Amanda, Stelling, Pete, and Cummming, William. Geothermal Exploration at Akutan, Alaska: Favorable Indications for a High-EnthalpyHydrothermal Resource Near a Remote Market. Geothermal Resources Council (GRC) Annual Meeting, October 24-27, 2010. Sacramento, CA.www.geothermal-library.org/index.php?mode=pubs&action=view&record=1028703
HydroelectricExisting and Potential Hydroelectric sites: Alaska Energy Authority hydroelectric database. Spatial location and attribute data updated by HDR Alaska Inc. in 2006, AEA in 2013 and 2015.
Ocean & River HydrokineticTidal Electric Generation Potential: Brian Polagye, 2007. Tidal resource was quanti�ed for 35 transects across tidal channels, perpendicular to the �ow. The analysis used NOAA time series of currents and tidal range, as well as bathymetric data. Due to map scale each study site is depicted as a point location rather than a linear transect.
The Wave Energy Resource Assessment project is a joint venture between NREL, EPRI, and Virginia Tech. EPRI is the prime contractor, Virginia Tech is responsible for development of the models and estimating the wave resource, and NREL serves as an independent validator and also develops the �nal GIS-based display of the data. GIS data from National Renewable Energy Laboratory (NREL) 2011 http://en.openei.org/datasets/�les/868/pub/wave_power_density.zip
In-Stream Hydrokinetic: Jacobson, Paul T., Ravens, Thomas, Cunningham, Keith. Assessment of U.S. In-Stream Hydrokinetic Energy Resources. Electric Power Research Institute Presentation. February 8, 2011. Power density estimates based on the cross-section average velocity at the open-water average �ow rate at the given site. Open-water power density at the fast �owing portions of the river are several times greater than levels reported here.
SolarSolar Insolation: U.S. Department of Energy, National Renewable Energy Laboratory, 1999. Data layer provides annual average daily total solar resource averaged over surface cells of approximately 40 km by 40 km in size. http://www.nrel.gov/gis/data.html
WindWind Power: AWS Truepower, LLC Wind Resource Maps of Alaska using the MesoMap® system and historical weatherdata prepared for the Alaska Energy Authority, September, 2010. Although it is believed to represent an accurate overall picture of the wind energy resource, estimates at any location should be con�rmed by measurement. All datasets were clipped to the coastline.
*For data sources with descriptive pointlocations, the spatial positions werederived by matching the descriptivelocation to the community location using the U.S. Geological Survey Geographic Names Information System.
Text, editing, and maps by Alaska Energy Authority (Sean Skaling, Katie Conway, Cady Lister, Devany Plentovich, Rich Stromberg, Josh Craft, Alan Baldivieso, David Lockard, Kirk Warren, Jed Drolet, Justin Crowther, Sam Tapen, Daniel Hertrich, Sara Fisher-Goad and Emily Ford) and Renewable Energy Alaska Project sta� (Chris Rose and Piper Foster Wilder). Maps and design by Resource Data, Inc and updated by AEA (Justin Crowther).
Acknowledgments and �anksThanks to Alaska Electric Light and Power Company, Alaska Power and Telephone Company, Alaska Village Electric Cooperative, Chugach Electric Association, Homer Electric Association, City of Sitka Electric Department, Copper Valley Electric Association, Enstar Natural Gas Company, Southeast AK Power Authority, Kodiak Electric Association, Copper Valley Electric Association, Naknek Electric Association, and Nushagak Cooperative for power and natural gas system information for the infrastructure section. 32
Cost Block Information:The Renewable Energy Atlas of Alaska wasproduced by the Alaska Energy Authority.It was printed by Northern Printing Inc. inAnchorage at a cost of $2.99 each. Atlas Published: April 2016Maps Data: December 2015
33

Alaska Energy Authority813 West Northern Lights Blvd. Anchorage, Alaska 99503
Phone (907) 771-3000Toll Free in Alaska (888) 300-8534
Fax (907) 771-3044www.akenergyauthority.org
REAP: Renewable Energy Alaska Project308 G Street, Suite 225, Anchorage, Alaska 99501
Phone (907) 929-7770www. alaskarenewableenergy.org


![The Cordova daily times. (Cordova, Alaska). 1922-02-01 [p 2]....Title The Cordova daily times. (Cordova, Alaska). 1922-02-01 [p 2]. Subject Page from The Cordova daily times. (Cordova,](https://img.pdfslide.us/doc/110x75/5f8f03bfcfa04450ab46065f/the-cordova-daily-times-cordova-alaska-1922-02-01-p-2-title-the-cordova.jpg)