Embed Size (px)
Citation preview
Phosphate Market Outlook
1
Society for Mining, Metallurgy and Exploration
Regional ConferenceOctober 12, 2016
Andy JungDirector, Market and Strategic Analysis
The Mosaic Company
This document contains forward-looking statements within the meaning of the Private Securities Litigation Reform Act of 1995. Such statements
include, but are not limited to, statements about the Wa’ad Al Shamal Phosphate Company (also known as MWSPC) and other proposed or
pending future transactions or strategic plans and other statements about future financial and operating results. Such statements are based upon
the current beliefs and expectations of The Mosaic Company’s management and are subject to significant risks and uncertainties. These risks
and uncertainties include but are not limited to risks and uncertainties arising from the ability of MWSPC to obtain additional planned funding in
acceptable amounts and upon acceptable terms, the timely development and commencement of operations of production facilities in the
Kingdom of Saudi Arabia, the future success of current plans for MWSPC and any future changes in those plans; difficulties with realization of
the benefits of our long term natural gas based pricing ammonia supply agreement with CF Industries, Inc., including the risk that the cost
savings initially anticipated from the agreement may not be fully realized over its term or that the price of natural gas or ammonia during the term
are at levels at which the pricing is disadvantageous to Mosaic; customer defaults; the effects of Mosaic’s decisions to exit business operations
or locations; the predictability and volatility of, and customer expectations about, agriculture, fertilizer, raw material, energy and transportation
markets that are subject to competitive and other pressures and economic and credit market conditions; the level of inventories in the distribution
channels for crop nutrients; the effect of future product innovations or development of new technologies on demand for our products; changes in
foreign currency and exchange rates; international trade risks and other risks associated with Mosaic’s international operations and those of joint
ventures in which Mosaic participates, including the risk that protests against natural resource companies in Peru extend to or impact the Miski
Mayo mine; changes in government policy; changes in environmental and other governmental regulation, including expansion of the types and
extent of water resources regulated under federal law, greenhouse gas regulation, implementation of numeric water quality standards for the
discharge of nutrients into Florida waterways or efforts to reduce the flow of excess nutrients into the Mississippi River basin, the Gulf of Mexico
or elsewhere; further developments in judicial or administrative proceedings, or complaints that Mosaic’s operations are adversely impacting
nearby farms, business operations or properties; difficulties or delays in receiving, increased costs of or challenges to necessary governmental
permits or approvals or increased financial assurance requirements; resolution of global tax audit activity; the effectiveness of Mosaic’s
processes for managing its strategic priorities; adverse weather conditions affecting operations in Central Florida, the Mississippi River basin, the
Gulf Coast of the United States or Canada, and including potential hurricanes, excess heat, cold, snow, rainfall or drought; actual costs of various
items differing from management’s current estimates, including, among others, asset retirement, environmental remediation, reclamation or other
environmental regulation, Canadian resources taxes and royalties, or the costs of the MWSPC, its existing or future funding and Mosaic’s
commitments in support of such funding; reduction of Mosaic’s available cash and liquidity, and increased leverage, due to its use of cash and/or
available debt capacity to fund financial assurance requirements and strategic investments; brine inflows at Mosaic’s Esterhazy, Saskatchewan,
potash mine or other potash shaft mines; other accidents and disruptions involving Mosaic’s operations, including potential mine fires, floods,
explosions, seismic events, sinkholes or releases of hazardous or volatile chemicals; and risks associated with cyber security, including
reputational loss, as well as other risks and uncertainties reported from time to time in The Mosaic Company’s reports filed with the Securities
and Exchange Commission. Actual results may differ from those set forth in the forward-looking statements.
Safe Harbor
The Mosaic Company Today
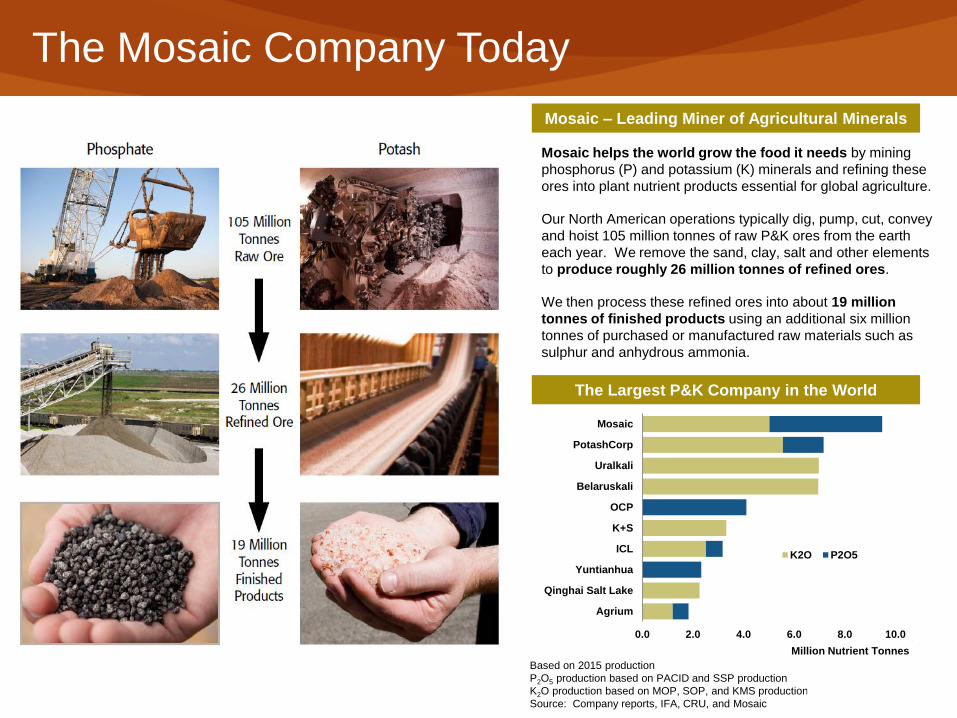
Mosaic helps the world grow the food it needs by mining
phosphorus (P) and potassium (K) minerals and refining these
ores into plant nutrient products essential for global agriculture.
Our North American operations typically dig, pump, cut, convey
and hoist 105 million tonnes of raw P&K ores from the earth
each year. We remove the sand, clay, salt and other elements
to produce roughly 26 million tonnes of refined ores.
We then process these refined ores into about 19 million
tonnes of finished products using an additional six million
tonnes of purchased or manufactured raw materials such as
sulphur and anhydrous ammonia.
The Largest P&K Company in the World
Mosaic – Leading Miner of Agricultural Minerals
Based on 2015 production
P2O5 production based on PACID and SSP production
K2O production based on MOP, SOP, and KMS production
Source: Company reports, IFA, CRU, and Mosaic
0.0 2.0 4.0 6.0 8.0 10.0
Mosaic
PotashCorp
Uralkali
Belaruskali
OCP
K+S
ICL
Yuntianhua
Qinghai Salt Lake
Agrium
Million Nutrient Tonnes
K2O P2O5
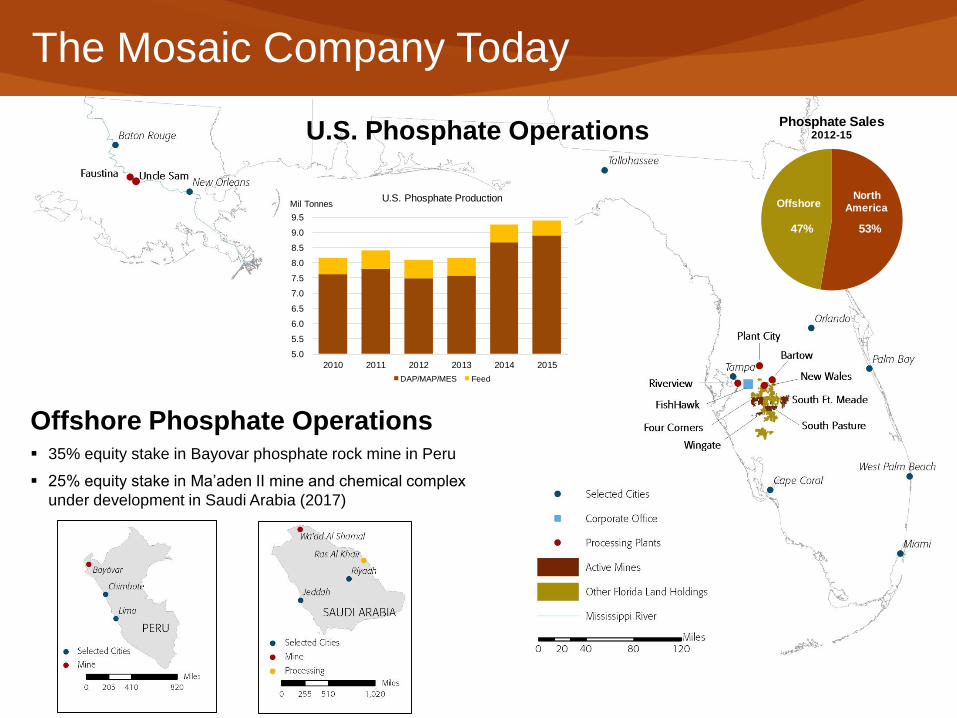
The Mosaic Company Today
U.S. Phosphate Operations
Offshore Phosphate Operations 35% equity stake in Bayovar phosphate rock mine in Peru
25% equity stake in Ma’aden II mine and chemical complex
under development in Saudi Arabia (2017)
53%47%
Phosphate Sales2012-15
North America Offshore
5.0
5.5
6.0
6.5
7.0
7.5
8.0
8.5
9.0
9.5
2010 2011 2012 2013 2014 2015
Mil TonnesU.S. Phosphate Production
DAP/MAP/MES Feed
5
Ag Market Outlook
Click to edit Master title style
6
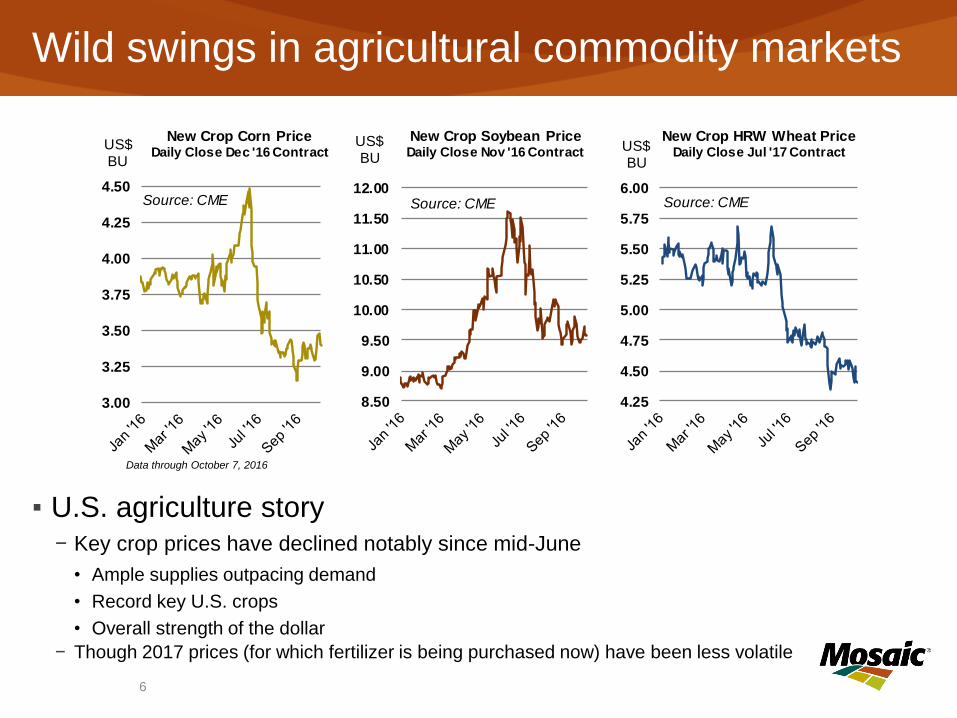
Wild swings in agricultural commodity markets
▪ U.S. agriculture story− Key crop prices have declined notably since mid-June
• Ample supplies outpacing demand
• Record key U.S. crops
• Overall strength of the dollar
− Though 2017 prices (for which fertilizer is being purchased now) have been less volatile
3.00
3.25
3.50
3.75
4.00
4.25
4.50
US$ BU
New Crop Corn PriceDaily Close Dec '16 Contract
Source: CME
8.50
9.00
9.50
10.00
10.50
11.00
11.50
12.00
US$ BU
New Crop Soybean PriceDaily Close Nov '16 Contract
Source: CME
4.25
4.50
4.75
5.00
5.25
5.50
5.75
6.00
US$ BU
New Crop HRW Wheat PriceDaily Close Jul '17 Contract
Source: CME
Data through October 7, 2016
Click to edit Master title style
7
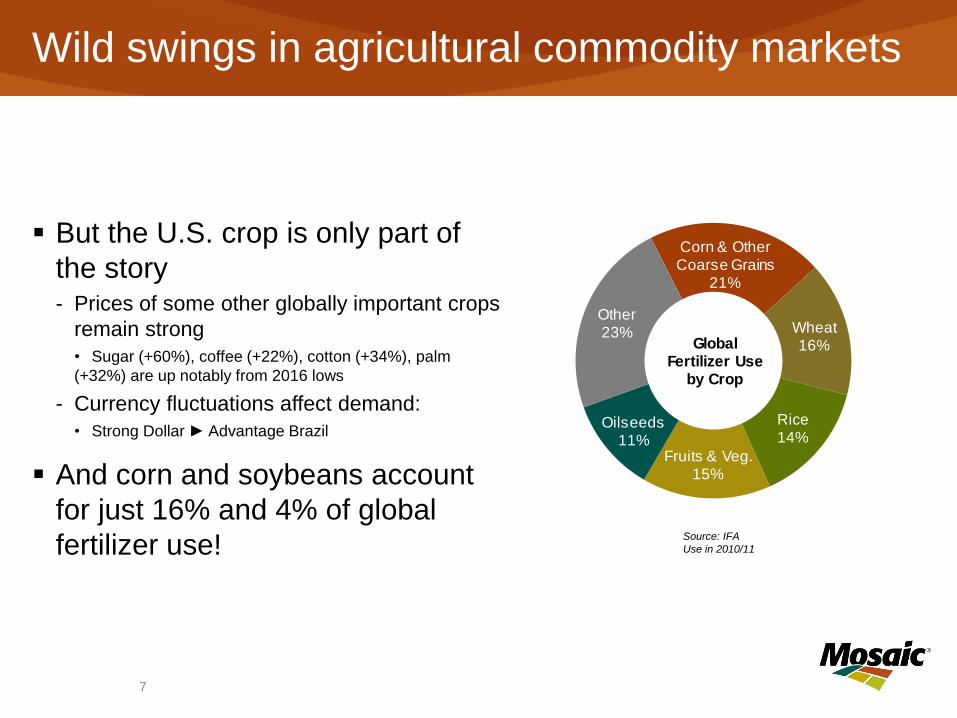
Wild swings in agricultural commodity markets
But the U.S. crop is only part of
the story- Prices of some other globally important crops
remain strong
• Sugar (+60%), coffee (+22%), cotton (+34%), palm
(+32%) are up notably from 2016 lows
- Currency fluctuations affect demand:
• Strong Dollar ► Advantage Brazil
And corn and soybeans account
for just 16% and 4% of global
fertilizer use!
Corn & Other Coarse Grains
21%
Wheat16%
Rice14%
Fruits & Veg.15%
Oilseeds11%
Other23%
Global Fertilizer Use
by Crop
Source: IFA
Use in 2010/11
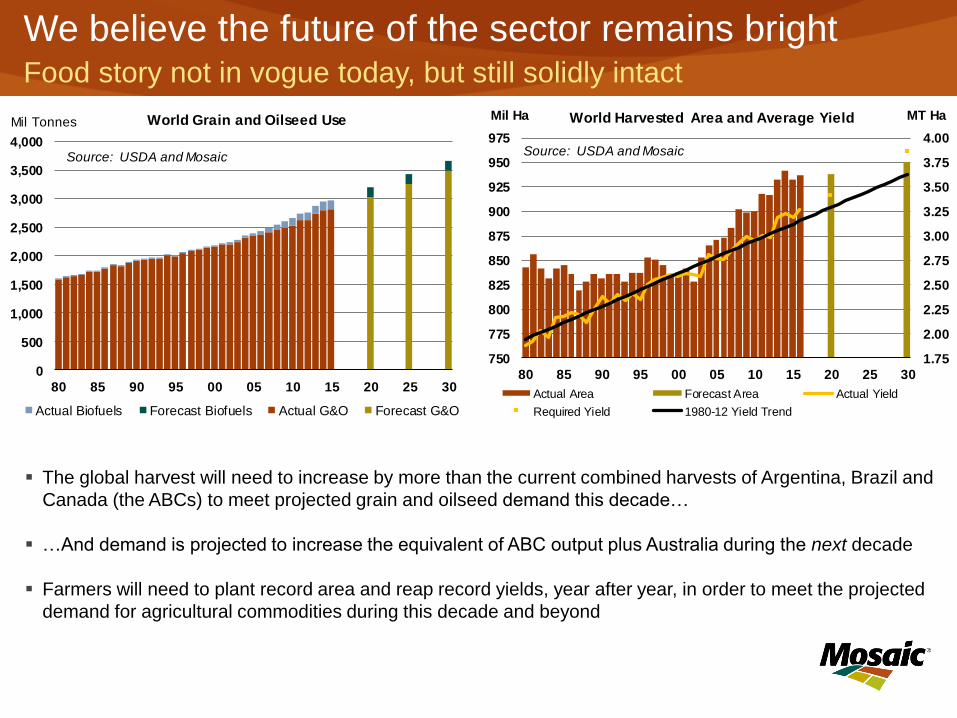
We believe the future of the sector remains brightFood story not in vogue today, but still solidly intact
The global harvest will need to increase by more than the current combined harvests of Argentina, Brazil and
Canada (the ABCs) to meet projected grain and oilseed demand this decade…
…And demand is projected to increase the equivalent of ABC output plus Australia during the next decade
Farmers will need to plant record area and reap record yields, year after year, in order to meet the projected
demand for agricultural commodities during this decade and beyond
1.75
2.00
2.25
2.50
2.75
3.00
3.25
3.50
3.75
4.00
750
775
800
825
850
875
900
925
950
975
80 85 90 95 00 05 10 15 20 25 30
MT HaMil Ha World Harvested Area and Average Yield
Actual Area Forecast Area Actual Yield
Required Yield 1980-12 Yield Trend
Source: USDA and Mosaic
0
500
1,000
1,500
2,000
2,500
3,000
3,500
4,000
80 85 90 95 00 05 10 15 20 25 30
Mil Tonnes
Source: USDA and Mosaic
World Grain and Oilseed Use
Actual Biofuels Forecast Biofuels Actual G&O Forecast G&O
Phosphate Industry Review and Outlook
Click to edit Master title style
10
100
200
300
400
500
600
700
90 92 94 96 98 00 02 04 06 08 10 12 14 16
$ MT
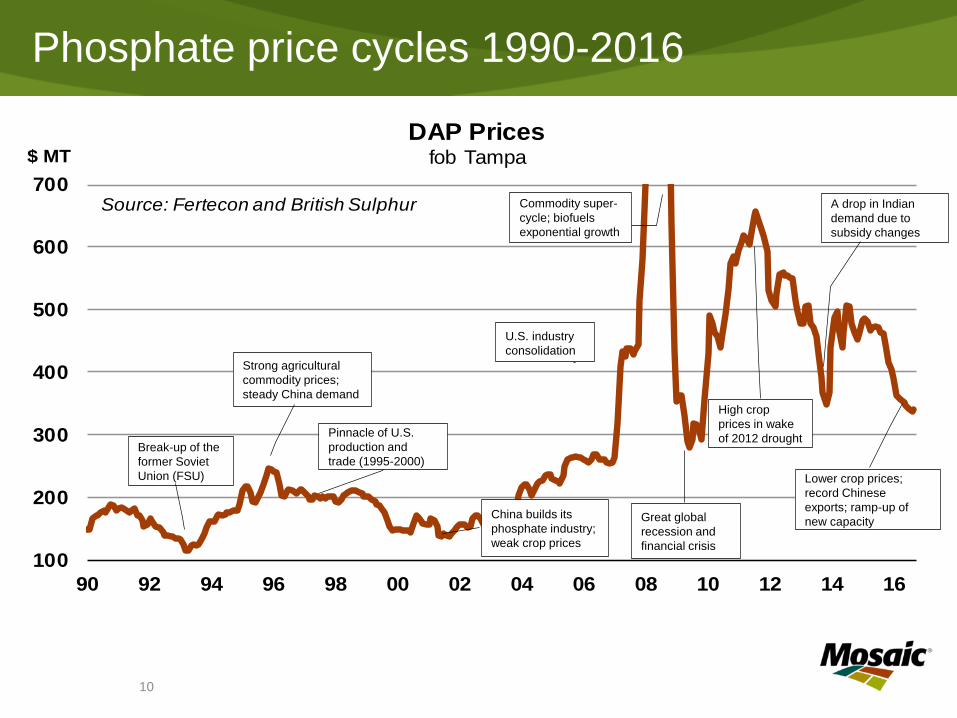
DAP Pricesfob Tampa
Source: Fertecon and British Sulphur
Phosphate price cycles 1990-2016
Break-up of the
former Soviet
Union (FSU)
A drop in Indian
demand due to
subsidy changes
Strong agricultural
commodity prices;
steady China demand
U.S. industry
consolidation
High crop
prices in wake
of 2012 droughtPinnacle of U.S.
production and
trade (1995-2000)
China builds its
phosphate industry;
weak crop prices
Commodity super-
cycle; biofuels
exponential growth
Great global
recession and
financial crisis
Lower crop prices;
record Chinese
exports; ramp-up of
new capacity
Click to edit Master title style
11
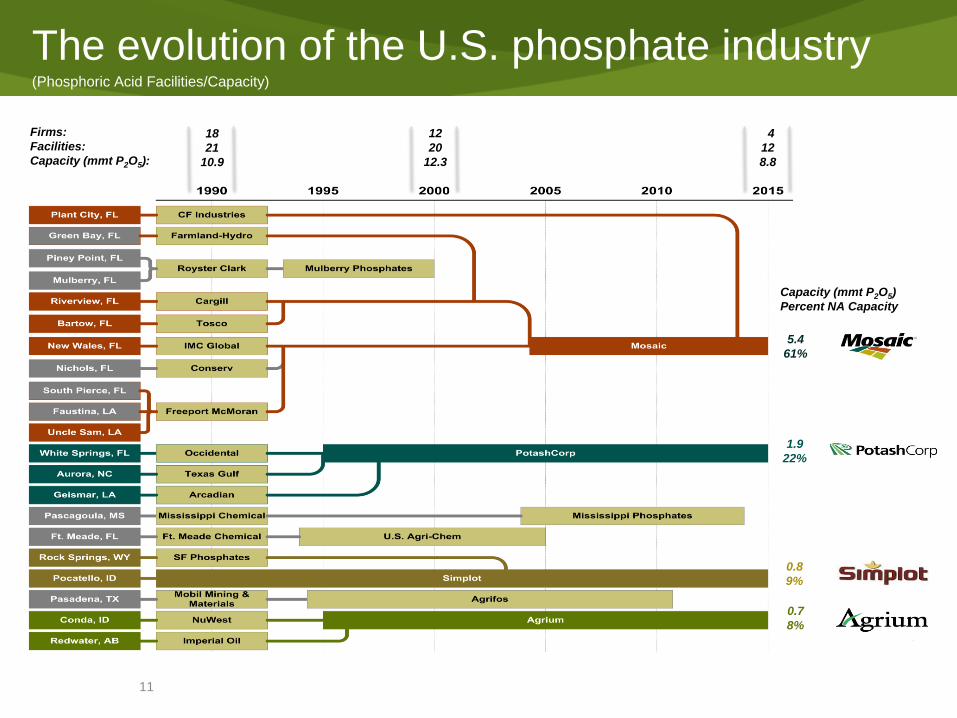
The evolution of the U.S. phosphate industry (Phosphoric Acid Facilities/Capacity)
Capacity (mmt P2O5)
Percent NA Capacity
12
20
12.3
4
12
8.8
5.4
61%
1.9
22%
0.8
9%
0.7
8%
18
21
10.9
Firms:
Facilities:
Capacity (mmt P2O5):
Click to edit Master title style
12
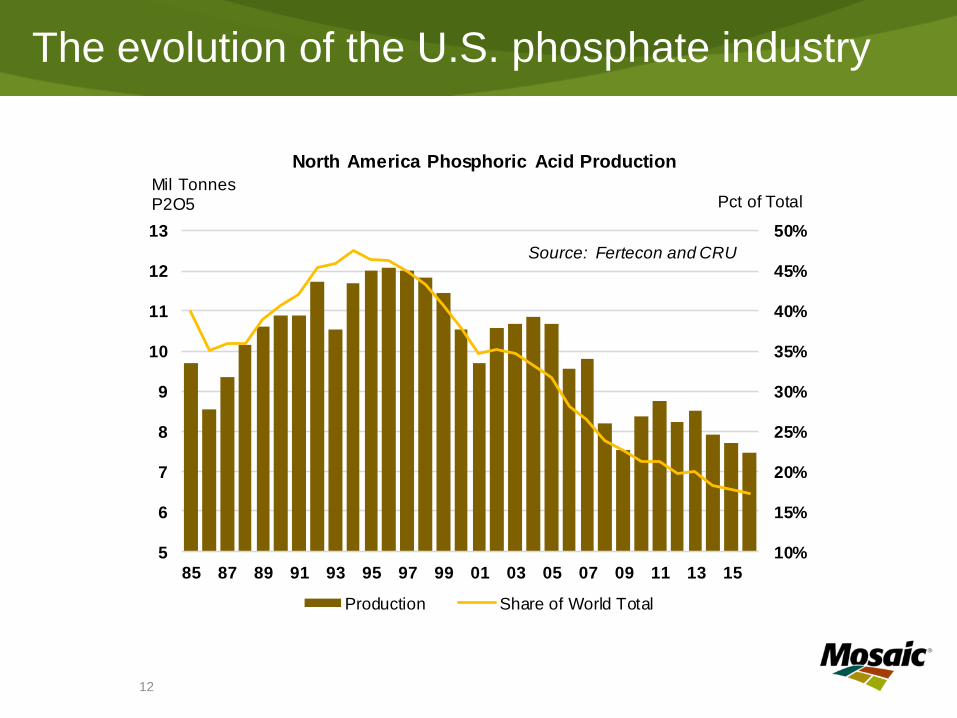
The evolution of the U.S. phosphate industry
10%
15%
20%
25%
30%
35%
40%
45%
50%
5
6
7
8
9
10
11
12
13
85 87 89 91 93 95 97 99 01 03 05 07 09 11 13 15
Pct of TotalMil TonnesP2O5
Source: Fertecon and CRU
North America Phosphoric Acid Production
Production Share of World Total
Click to edit Master title style
13
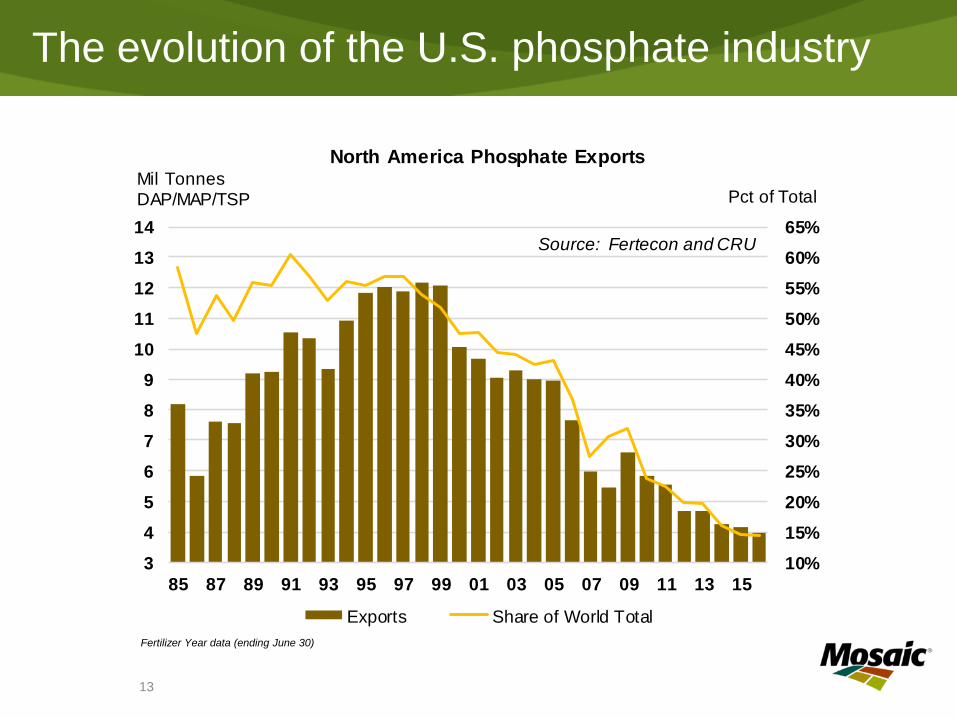
The evolution of the U.S. phosphate industry
10%
15%
20%
25%
30%
35%
40%
45%
50%
55%
60%
65%
3
4
5
6
7
8
9
10
11
12
13
14
85 87 89 91 93 95 97 99 01 03 05 07 09 11 13 15
Pct of TotalMil TonnesDAP/MAP/TSP
Source: Fertecon and CRU
North America Phosphate Exports
Exports Share of World Total
Fertilizer Year data (ending June 30)
Click to edit Master title style
14
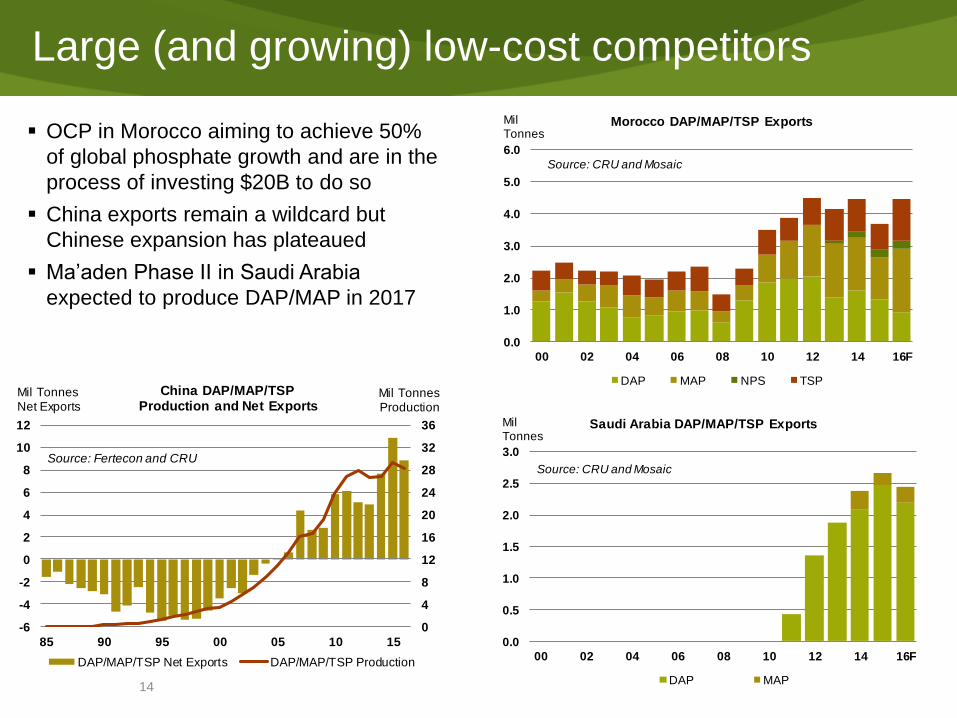
Large (and growing) low-cost competitors
0
4
8
12
16
20
24
28
32
36
-6
-4
-2
0
2
4
6
8
10
12
85 90 95 00 05 10 15
Mil TonnesProduction
Mil TonnesNet Exports
China DAP/MAP/TSPProduction and Net Exports
DAP/MAP/TSP Net Exports DAP/MAP/TSP Production
Source: Fertecon and CRU
0.0
1.0
2.0
3.0
4.0
5.0
6.0
00 02 04 06 08 10 12 14 16F
Morocco DAP/MAP/TSP Exports
DAP MAP NPS TSP
Mil Tonnes
Source: CRU and Mosaic
0.0
0.5
1.0
1.5
2.0
2.5
3.0
00 02 04 06 08 10 12 14 16F
Saudi Arabia DAP/MAP/TSP Exports
DAP MAP
Mil Tonnes
Source: CRU and Mosaic
OCP in Morocco aiming to achieve 50%
of global phosphate growth and are in the
process of investing $20B to do so
China exports remain a wildcard but
Chinese expansion has plateaued
Ma’aden Phase II in Saudi Arabia
expected to produce DAP/MAP in 2017
Click to edit Master title style
15
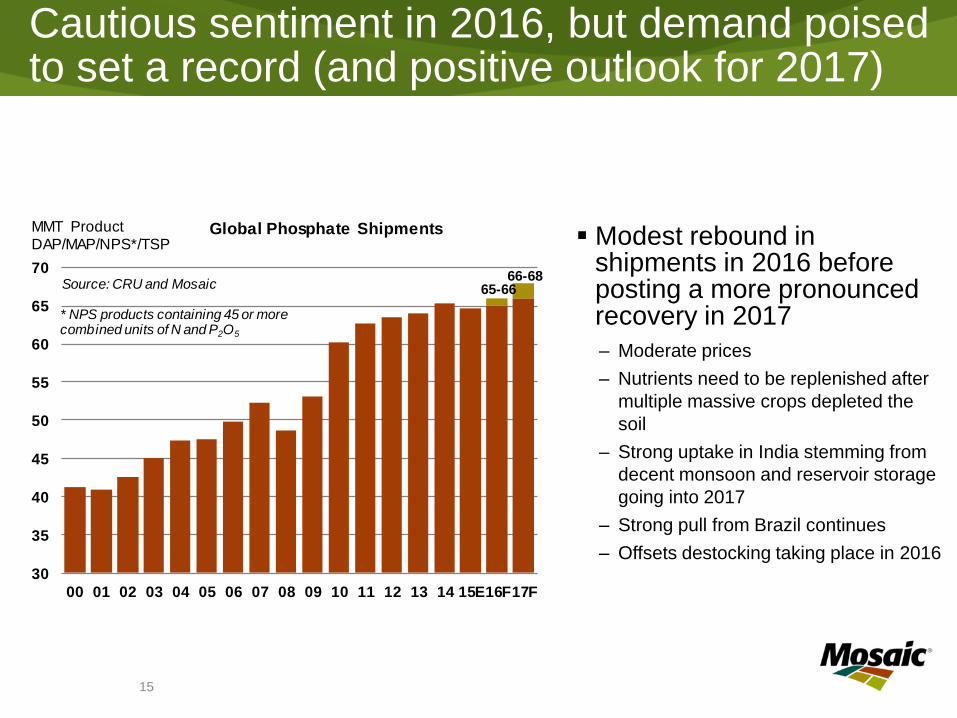
Cautious sentiment in 2016, but demand poised to set a record (and positive outlook for 2017)
Modest rebound in shipments in 2016 before posting a more pronounced recovery in 2017
– Moderate prices
– Nutrients need to be replenished after
multiple massive crops depleted the
soil
– Strong uptake in India stemming from
decent monsoon and reservoir storage
going into 2017
– Strong pull from Brazil continues
– Offsets destocking taking place in 2016
65-6666-68
30
35
40
45
50
55
60
65
70
00 01 02 03 04 05 06 07 08 09 10 11 12 13 14 15E16F17F
Global Phosphate ShipmentsMMT ProductDAP/MAP/NPS*/TSP
Source: CRU and Mosaic
* NPS products containing 45 or more combined units of N and P2O5
Click to edit Master title style
16
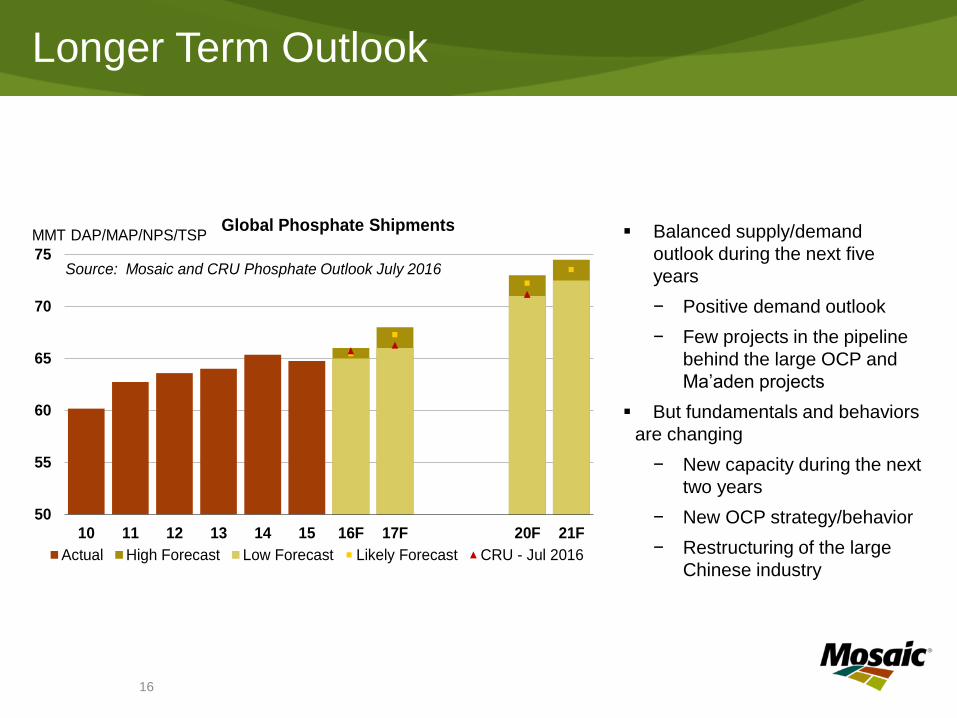
Longer Term Outlook
Balanced supply/demand
outlook during the next five
years
− Positive demand outlook
− Few projects in the pipeline
behind the large OCP and
Ma’aden projects
But fundamentals and behaviors
are changing
− New capacity during the next
two years
− New OCP strategy/behavior
− Restructuring of the large
Chinese industry
50
55
60
65
70
75
10 11 12 13 14 15 16F 17F 20F 21F
Global Phosphate Shipments
Actual High Forecast Low Forecast Likely Forecast CRU - Jul 2016
MMT DAP/MAP/NPS/TSP
Source: Mosaic and CRU Phosphate Outlook July 2016
Questions?
Phosphate Market Outlook
Society for Mining, Metallurgy and Exploration
Regional ConferenceOctober 12, 2016
Andy JungDirector, Market and Strategic Analysis
The Mosaic Company


![British Columbia Labour Market Outlook 2010 - 2020 · Labour Market OutlookLabour Market Outlook British Columbia Labour Market Outlook: 2010-2020 [2] B.C. Labour Market Outlook,](https://img.pdfslide.us/doc/110x75/5e167e8e481eae63a43f8127/british-columbia-labour-market-outlook-2010-2020-labour-market-outlooklabour-market.jpg)