Embed Size (px)
Citation preview
Valley Metro Rail, Inc. Phoenix, Arizona
Comprehensive Annual Financial Report Fiscal Year Ended June 30, 2012


VALLEY METRO RAIL, INC. Phoenix, Arizona
Comprehensive Annual Financial Report For the fiscal year ended
June 30, 2012
Prepared by: Finance Department

2011 Facts and Figures
LIGHT RAIL SYSTEM
System Overview• Numberofmiles:20
• Numberofstations:28
• Numberofvehicles:50
• Numberofparkingspaces:3,600
• Totaltraveltime:65minutes
• Openingdate:Dec.27,2008
• Costtobuild:$1.4billion
• Costtooperate:$35millioninFY13
• Costtoride:$1.75perride; $3.50forallday
0
5
10
15
20
25
30
35
40
45
0
10
20
30
40
50
60
WeekdayR
ide
rs (
in T
ho
usa
nd
s)
Rid
ers
(in
Th
ou
san
ds)
AverageSaturday Sunday Sept. 9 April 8 Sept. 23
•13.2milliontotalriders
•Increaseof4.3%over2010
Valley Metro Rail, Inc. (METRO) is responsible for the development and operation of the region’s high-capacity transit system. The 20-mile light rail starter line opened December 2008 and served 13.2 million riders in 2011, exceeding the prior year by four percent. The system has well-exceeded all system projections.
Design and ConstructionMETRO’s 20-mile light rail line is the longest starter line in federal New Starts grant history. It was built entirely in-street using a train-only trackway and traffic signals to allow trains to safely move through the cities of Phoenix, Tempe and Mesa, Arizona. The cost was $1.4 billion paid for using a $587 million federal New Starts grant, $59 million from federal Congestion Mitigation and Air Quality funding and local tax dollars. The local funds are a mix of sales tax revenue from the cities of Phoenix and Tempe, General Fund from Mesa and the county’s Proposition 400 half-cent sales tax.
There are 28 stations, primarily located in the center of the roadway, and designed using a kit-of-parts infrastructure with significant consideration given to the desert heat. Artwork is an integral part of the system and incorporated into each station area. The art pieces were designed using community input and several local, as well as national artists.
Nine park-and-rides feed the system where free parking can be enjoyed by riders. The more than 3,600 spaces are available on a first-come, first-serve basis and, like the rest of the system, monitored using security cameras.
Ridership
•40,712
•31,008
•20,930
0
5
10
15
20
25
30
35
40
45
0
10
20
30
40
50
60
Weekday
Rid
ers
(in
Th
ou
san
ds)
Rid
ers
(in
Th
ou
san
ds)
AverageSaturday Sunday Sept. 9 April 8 Sept. 23
•Sept.9–D’backs,ASUfootball
•April8–D’backshomeopener,DisneyonIce
•Sept.23–D’backs,WomenofFaith
•60,437•55,828 •55,113
Highest ridership days
Top five busiest stations
•Sycamore/MainSt
•Montebello/19thAve
•UniversityDr/Rural
•VeteransWay/CollegeAve
•CentralStation
continued

08-14-12
METRO has 50 vehicles in its fleet, each with a comfort capacity of 175 passengers. The vehicles are state-of-the-art technology and, similar to the stations, customized for the desert climate and operating environment.
OperationsMETRO operates 365 days a year, 20 hours a day, Sunday – Thursday, and almost 24 hours on Friday and Saturday. Trains arrive every 12 minutes during the weekday peak period; every 15 minutes during the Saturday peak; and every 20 minutes during all other hours, Sundays and holidays.
Light rail service is coordinated with bus service to provide a seamless network for customers. An all-day pass or greater is good for both rail and bus. Passes can be purchased at fare vending machines located at each station, online or from retail outlets Valleywide. Security officers regularly patrol the system and ask passengers at random for proof of payment. Fare evasion is cited with a fine that starts at $50, but can increase to $500.
For many, the METRO system provides connection to work, school and play. There are several sports and entertainment venues, arts and culture organizations and restaurants and bars that attract riders to the line. METRO also connects to Phoenix Sky Harbor International Airport with a shuttle bus accessible from the 44th Street/Washington transit center.
Future ExpansionMETRO is responsible for building a 57-mile high-capacity transit system as defined in the Regional Transportation Plan by 2032. Planning, design and/or construction has initiated on the six extensions that make up the remainder of the 37 miles yet to be built; a study is also underway for South Central Phoenix. Three of the extensions have been defined as light rail corridors: the Central Mesa, Northwest and Phoenix West. A 2.6-mile modern streetcar line will be built in central Tempe. The other two – Glendale and Northeast Phoenix – have yet to determine a specific transit route and mode.
ValleyMetro.org 602-253-5000
LIGHT RAIL SYSTEM
10
17
101
17
101
202
143
60
202
202
51
10110
Note: Dates indicate calendar year openings
METRO Light Rail Line
Light Rail Extension
Light Rail Extension (Unfunded)
Streetcar
Streetcar Extension (Unfunded)
Future High Capacity / Light Rail Corridors for Further Study
South Central Alternatives Analysis
LEGENDBell Rd
Indian School Rd
McDowell Rd
Broadway Rd
Baseline Rd
Buckeye Rd
Thunderbird Rd
Peoria Ave
Bethany Home Rd
99th
Ave
83rd
Ave
67th
Ave
51st
Ave
35th
Ave
19th
Ave
Cent
ral A
ve
24th
St
40th
St
56th
St
Rura
l Rd
Pric
e Rd
Alm
a Sc
hool
Rd
Mes
a Dr
Gilb
ert R
d
Val V
ista
Dr
McKellips Rd
University Dr
Southern Ave
Guadalupe Rd
Warner Rd
Northern AveParadise
Valley
Scottsdale
Tempe
Glendale
Mesa
Chandler
Peoria
Phoenix
Tolleson
Gilbert
Avondale
Phoenix
20322032
20262026
20232023
2026202620162016
2016201620162016
Valley Metro Rail, Inc. Table of Contents Comprehensive Annual Financial Report Fiscal Year Ended June 30, 2012 Page Introductory Section Letter of Transmittal iii Certificate of Achievement for Excellence in Financial Reporting x Policy Organizational Chart xi List of Appointed Officials xii Financial Section Independent Auditors' Report 1 Management's Discussion and Analysis (Required Supplementary Information) 3 Basic Financial Statements Statement of Net Assets 9 Statement of Revenues, Expenses and Changes in Fund Net Assets 10 Statement of Cash Flows 11 Notes to the Financial Statements 12 Other Supplementary Information Schedule of Operations - Budget and Actual 24 Statistical Section Financial Trends Net Assets by Component 26 Changes in Net Assets 27 Demographic and Economic Information Growth in Regional Transit Usage 28 Member Cities' Area Growth 29 Top Employers in Maricopa County 30 System Map - Initial 20-Mile Segment 31 System Map - Northwest Extension 32 System Map - Central Mesa 33 System Map - Tempe Streetcar 34 Operating Information Full-Time Equivalent Positions 35 Pay Grades and Ranges 37 Schedule of Insurance Coverage 39 Design & Construction Milestones 41
INTRODUCTORY SECTION The Introductory Section includes METRO’s transmittal letter, policy organizational chart,
and list of appointed officials
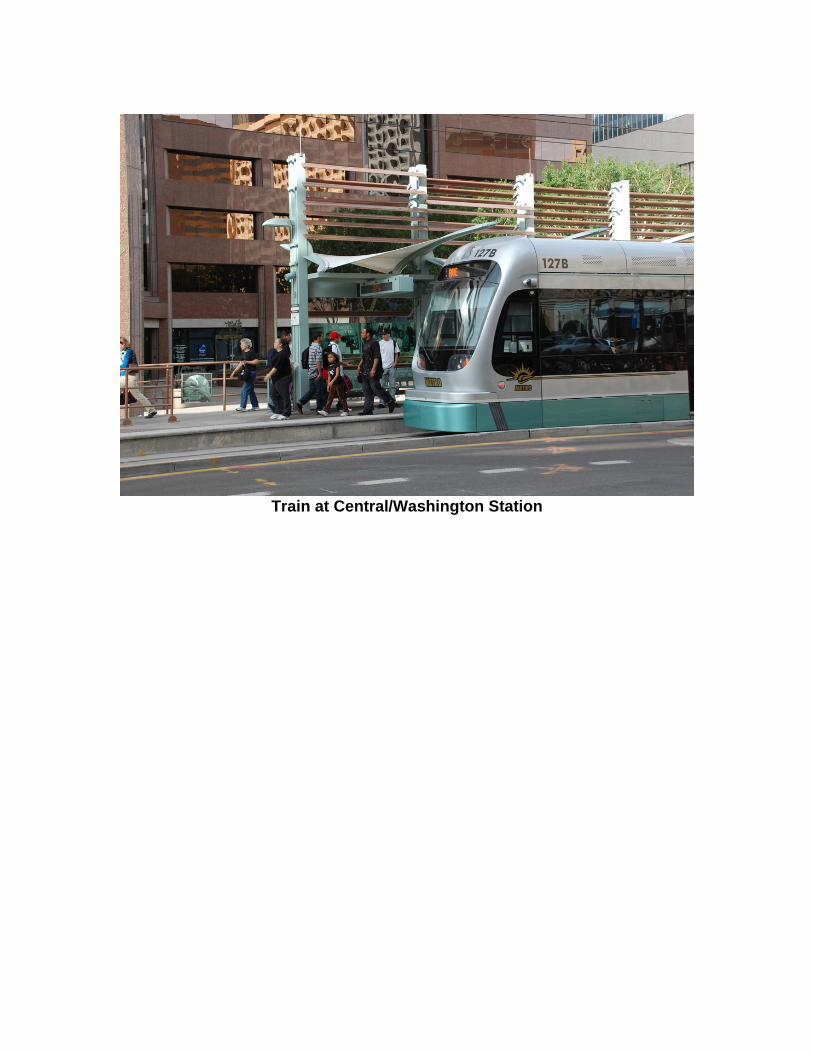
Train at Central/Washington Station
iii
101 North 1st Avenue
Suite 1300 Phoenix, AZ 85003
November 30, 2012 To Chairman and Members of the Valley Metro Rail, Inc. Board of Directors:
The comprehensive annual financial report of Valley Metro Rail, Inc. (METRO) for the fiscal year ended June 30, 2012, is hereby submitted in accordance with the requirements of the Bylaws and Board directives. Responsibility for both the accuracy of the data and the completeness and fairness of the presentation, including all disclosures, rests with management. To the best of our knowledge and belief, the enclosed data is accurate in all material respects and is reported in a manner that presents fairly the financial position, results of operations and cash flows of METRO. All disclosures necessary to enable the reader to gain an understanding of METRO’s activities have been included. These financial statements have been prepared in accordance with accounting principles generally accepted in the United States of America (GAAP) for local governments as prescribed by the Governmental Accounting Standards Board (GASB) and the American Institute of Certified Public Accountants (AICPA). The independent auditors, Heinfeld, Meech & Co., P.C., whose report is included herein, have examined the basic financial statements and related notes. As stated in the independent auditors’ report, the goal of the independent audit was to provide reasonable assurance that the basic financial statements of METRO as of and for the fiscal year ended June 30, 2012, are free from material misstatement. The independent audit involved examining, on a test basis; evidence supporting the amounts and disclosures in the financial statements; assessing accounting principles used and significant estimates made by management; and evaluating the overall financial statement presentation. The independent auditors concluded, based upon their audit, that there was a reasonable basis for rendering an unqualified opinion that the basic financial statements of METRO for the fiscal year ended June 30, 2012, are fairly presented, in all material respects, in conformity with GAAP. The independent auditors’ report is presented as the first component of the financial section of this report. Additionally, METRO is required to have an independent audit of expenditures of federal awards received (Single Audit) by METRO directly from federal agencies, or passed through to METRO by other governmental entities during the fiscal year. The standards governing Single Audit engagements require the independent auditor to report not only on the fair presentation of the financial statements, but also on METRO’s internal controls and compliance with legal requirements having a direct and material impact on major programs, with special emphasis on internal controls and compliance requirements involving the administration of major federal awards. The results of METRO’s Single Audit for the fiscal year ended June 30, 2012, found no instances of material weakness in the internal control structure or significant violations of applicable laws and regulations with respect to major programs. The auditors’ reports on internal controls and compliance with applicable laws and regulations are included in a separately issued Single Audit Report.
Valley Metro Rail, Inc. Letter of Transmittal (Continued)
iv
The financial statements are prepared and presented in conformity with accounting principles generally accepted in the United States of America. More information about the presentation can be found in Management’s Discussion and Analysis (MD&A) beginning on page 3 and also discussed in the notes to the financial statements beginning on page 12. This transmittal letter is designed to complement MD&A and should be read in conjunction with it. THE FINANCIAL REPORTING ENTITY METRO was established in October 2002 as a public nonprofit corporation formed by the cities of Glendale, Mesa, Phoenix, and Tempe to manage design, construction, and operation of the Light Rail Transit (LRT) System within the Metropolitan Area. The cities of Chandler and Peoria became contributing member cities in 2007. The City of Scottsdale joined in April of 2008 and withdrew membership effective July 1, 2009. Subsequent to the close of fiscal year 2010-2011, the City of Peoria withdrew membership effective July 1, 2011. During the fiscal year 2011-2012, a five member Board of Directors governed METRO, consisting of the mayors or their designated representatives from each member city. The Board of Directors establishes overall policies for management and administration of the LRT System, provides oversight over the design, construction and operation of light rail, and receives and disburses funds and grants from federal, state, local, and other funding sources. A Chief Executive Officer, appointed by the Board of Directors, is responsible for the day-to-day management of the organization. In February 2012, the Boards of Directors of METRO and the Regional Public Transportation Authority (RPTA) took action to appoint Mr. Stephen R. Banta as the Chief Executive Officer to manage the two financial entities under a single integrated agency. RPTA and METRO entered into an intergovernmental agreement providing for the single CEO to serve both organizations effective March 1, 2012 with the preservation of both RPTA and METRO Boards of Directors. LOCAL ECONOMIC CONDITION AND OUTLOOK METRO serves the cities of Chandler, Glendale, Mesa, Phoenix, and Tempe that are centrally located in Maricopa County, Arizona. These cities have constituted a well-established growth area since 1945, and collectively encompass approximately 1,000 square miles. Together they form a significant portion of the greater metropolitan Phoenix area, which is the economic, political, and population center of Arizona. The combined five cities have grown from 2.4 million residents in the year 2000 to 2.5 million residents in 2010, an increase of approximately 10.5% in the last ten years. The five cities’ population represents almost 66% of the total Maricopa County population. According to the Greater Phoenix Economic Council, population in the region is projected to grow at more than twice the national rate for the next few decades, growing from 4.0 million in 2008 to 6.3 million in 2030. In 2007 and 2008, the region’s historically strong economic growth slowed and sales tax revenues fell with the nation-wide recession. In fiscal years 2009 and 2010 regional revenues fell 13.7% and 8.9% respectively. METRO responded to the times with staff reductions in 2009 and with service reductions in 2010. In fiscal year 2011 and 2012 regional revenues have rebounded, growing by 3.4% and 4.3% respectively. Due to the strong financial plan established for the 20 mile initial light rail system, the funding for operation of the system is secure.

Valley Metro Rail, Inc. Letter of Transmittal (Continued)
v
Despite the recent downturn, increases in population and new home construction have led to increased demands for quality public transportation and improved air quality. Over the last five years, public transportation ridership grew by 22.5 percent in the region. With the commencement of rail passenger operations in December 2008, the LRT System added new capacity to the regional transportation system. Since opening, the METRO light rail line has experienced strong passenger growth with average weekday ridership reaching 41,925 passengers in fiscal year 2012 up from 33,440 riders per day in fiscal year 2009. With the passage of Proposition 400, and the creation of the Public Transportation Fund, light rail extensions in Mesa, Phoenix, and Tempe are in the planning or design stages which will continue to add capacity to the region’s transportation system in the years ahead. FINANCIAL CONTROLS Accounting and Administrative Controls As previously noted, METRO’s management is responsible for establishing and maintaining an internal control structure designed to ensure that the assets of METRO are protected from loss, theft or misuse and to ensure that adequate accounting data are compiled to allow for the preparation of financial statements in conformity with generally accepted accounting principles. METRO’s internal control structure is designed to provide reasonable, but not absolute, assurance that these objectives are met. The concept of reasonable assurance recognizes that: (1) the cost of a control should not exceed the benefits likely to be derived; and (2) the valuation of costs and benefits requires estimates and judgments by management. As a sub-recipient of federal financial assistance, METRO is also responsible for ensuring that an adequate internal control structure is in place to ensure and document compliance with applicable laws and regulations related to these programs. This internal control structure is subject to periodic evaluation by management and by METRO’s independent auditor. As part of METRO’s Single Audit, tests were made of the internal control structure and of its compliance with applicable laws and regulations, including those related to federal awards. Although this testing is limited in scope and is not sufficient to support an opinion on METRO’s internal control system or its compliance with laws and regulations, the audit for the year ended June 30, 2012, disclosed no material internal control weaknesses or material violations of laws and regulations. The audit of METRO’s compliance with requirements applicable to each major program and internal control over compliance resulted in an unqualified opinion of compliance and noted no material weaknesses in internal controls. Budgetary Systems and Controls The objective of the budgetary controls maintained by METRO is to ensure compliance with legal provisions embodied in the annual appropriated budget approved by the Board of Directors. The by-laws require a balanced budget to be adopted by the METRO Board each fiscal year. The level of budgetary control, i.e., the level at which expenditures cannot legally exceed appropriations, is the total operating budget. METRO maintains budgetary control by conducting quarterly evaluations of expenditures against appropriations and through close monitoring of revenues. Encumbrance accounting is not utilized and all appropriations lapse at year-end. As demonstrated by the statements included in the financial section of this report, METRO continues to meet its responsibility for sound financial management. In addition to the annual budget, METRO also prepares a Five-Year Capital Program and
Valley Metro Rail, Inc. Letter of Transmittal (Continued)
vi
Operating Forecast and the Transit Life Cycle Plan (TLCP) update. The five-year forecast starts with the annual budget information and extends it an additional four years to provide information about the anticipated schedule, costs, and revenues. The TLCP gives a longer term perspective by outlining the sources and uses of funds for specific capital projects and the corresponding costs and funding to operate each project out through fiscal year 2025. For each major capital construction project, METRO regularly reports the project budget status to the Board showing by project element the Full Funding Grant Agreement (FFGA) budget amount versus commitments, actual expenditures, and forecasted cost at completion. METRO evaluates project contractual costs and estimates the cost at completion as part of the regular project reporting process. Should anticipated contractual costs appear to exceed the Board approved project budget, METRO staff will seek Board action to adjust project scope or approve additional funding. During construction, significant issues are addressed in narrative reports included in the project progress report submitted to the Board on a quarterly basis. With the commencement of passenger operations in December 2008, METRO has continued to refine detailed cost estimates for manpower, contracted costs, utilities and insurance to construct the annual operations budget. Analysis and comparisons of METRO’s planned costs to peer city light rail systems have been conducted. Actual costs are tracked against budget and reported to Member Cites on a monthly basis with significant variances analyzed and communicated. Member Cities fund the cost of the operations based upon the ratio of route miles in operation within each jurisdiction. In the first forty-two (42) months of operations, METRO has successfully operated within budget while achieving on-time and reliability performance targets. With respect to fare revenues, METRO has engaged an armored car service contractor to pick up fare payments deposited by customers in the fare vending machines. The armored car service deposits daily collections into the City of Phoenix regional fare revenue depository. METRO works in collaboration with the City of Phoenix to compute and distribute fare revenues to the Member Cities. In the first forty-two months, METRO’s fare revenues have exceeded budget and METRO’s fare recovery ratio exceeded 40% in fiscal year 2012 comparing favorably with peer agencies located in the western United States. MAJOR INITIATIVES Design and Construction of Light Rail and Modern Streetcar In addition to the successful construction of the 20 mile Central Phoenix/East Valley Light Rail Transit (CP/EV LRT) Project, METRO is advancing design and construction of new rail extensions. The Northwest Extension, the first planned LRT extension, is now on track for completion in 2016. With the economic recovery and a revitalized funding plan, design and real estate acquisition activities are underway and construction will commence in early 2013. The Central Mesa Light Rail Extension has completed the preliminary engineering phase and is commencing final design, real estate acquisition and utility relocation work for an anticipated line opening in 2015. In Tempe, a 2.6 mile modern streetcar alignment has completed the planning phase and anticipated to commence design and construction for a line opening in 2016. In Phoenix, planning for the 11 mile Phoenix West Light Rail Extension along the Interstate 10 corridor is complete, with the City of Phoenix Council selecting the locally preferred alternative route in May of 2012. (See pages 31-34 for system maps)
Valley Metro Rail, Inc. Letter of Transmittal (Continued)
vii
Central Phoenix/East Valley Light Rail Transit (CP/EV LRT) Project The CP/EV LRT project is a 19.6 mile LRT System that connects north central Phoenix, Tempe, and Mesa. As the initial starter segment, the CP/EV LRT project extends from 19th Avenue and Bethany Home Road in Phoenix to Main and Sycamore Road in Mesa. Phoenix, Tempe, and Mesa share responsibility for funding the non-federal share of capital costs and the on-going operations and maintenance (O&M) costs of the project. The CP/EV LRT project complements existing and proposed bus services to be implemented by Phoenix, Tempe, and Mesa. Construction of the project began in FY 2005 and was completed on-time with passenger operations commencing on December 27, 2008. Revenue operations commenced January 1, 2009 providing service from 5AM to 11PM seven days a week. Weekday riders have access to trains every 12 minutes from 7AM to 7PM. Weekend and off-peak weekday service frequencies range from 15 to 20 minutes. Northwest Extension LRT Project The Northwest Extension is a 4.6 mile light rail project starting at the northwest termination point of the Central Phoenix/East Valley Light Rail project. The project follows 19th Avenue to Dunlap Avenue, then west on Dunlap Avenue to 25th Avenue and then runs on 25th Avenue to Mountain View Road. In March 2007 the Phoenix City Council approved an initial 3.2 mile phase to be locally funded, without federal funding support. In 2009, with the economic downturn, construction of the first phase, which includes the 19th Avenue to Dunlap portion of the project, was suspended based upon availability of funding. From 2009 through mid-2012, real estate was acquired, private utility lines were relocated and neighborhood mitigation improvements were made to prepare for light rail construction. In July of 2012, the Regional Council of the Maricopa Association of Governments (MAG) approved the 2012 Transit Life Cycle Plan Update which allocates monies from the Public Transportation Fund (PTF) for the Northwest Extension Project. On June 20, 2012, the Phoenix City Council approved $60,000,000 from transit sales tax funds to accelerate the project construction, with repayment from the PTF to come in 2017. These funding actions have enabled the project to complete design work and commence construction for the 3.1 mile first phase. The extension is planned to open in 2016 with ridership estimated at approximately 4,000 riders per day. The total capital cost of the project is $311.0 million to be funded with a combination of City of Phoenix and Public Transportation Funds. Central Mesa Light Rail Extension Project In March, 2010, the Mesa City Council approved a 3.1 mile extension of the LRT system and in August 2010, the Federal Transit Administration (FTA) approved the alignment for project development. In September 2012, the FTA completed review of the $75.0 million Section 5309 Small Start application and submitted the grant to Congress for final approval. The extension begins at the eastern limits of METRO’s existing light rail system (Sycamore) and extends east on Main Street to Mesa Drive. The entire extension is within the City of Mesa. There are four stations on Main Street including a station at Alma School Road, Country Club Drive, Center Street, and Mesa Drive. The extension is planned to open in 2015 with ridership estimated at approximately 4,750 riders per day. The total capital cost of the project is $199.0 million to be funded with a combination of federal and regional funds.

Valley Metro Rail, Inc. Letter of Transmittal (Continued)
viii
Funding Milestones On November 2, 2004, the voters of Maricopa County approved Proposition 400, the continuation of the transportation tax, for a twenty year period, beginning in calendar year 2006. A major milestone in transportation funding and service in the region, the proposition had unanimous support from the Mayors of all of the cities in the region and the Maricopa County Board of Supervisors, the Maricopa Association of Governments Regional Council, and the Arizona Department of Transportation. This initiative is forecasted to generate $1.2 billion (in year of expenditure dollars) in revenue over the 20 year period to fund construction of an additional 14 miles of light rail extension and 2.6 miles of modern streetcar. In March 2006, METRO began to receive funds from the Public Transportation Fund. Initial funds were used for the relocation of non-prior rights utilities impacted by LRT construction. InAugust 2006, the Regional Public Transportation Authority (RPTA) and METRO executed the LRT Program Agreement. Under the agreement, RPTA designates METRO as the Lead Agency to plan, design, and construct the LRT program as defined by the Maricopa Association of Governments Regional Transportation Plan. As of June 30, 2012, $310.0 million of Public Transportation Funds have been received to fund METRO rail programs. In December 2007, the Phoenix City Council approved $34.7 million to fund pre-construction activities for the Northwest Extension. In July 2009, in response to reductions in sales tax revenues, the Council took action to phase construction activities pending availability of funds. In June 2012, the Council took action to advance $60.0 million to restart and accelerate construction of the 3.1 mile Northwest Extension Phase I Project. In June 2009, the Regional Public Transportation Authority (RPTA) issued Transportation Excise Tax Revenue Bonds in the amount of $100,075,000. A portion of the bonds will pay or reimburse LRT capital expenditures as designated in the Regional Transportation Plan. In December 2009, METRO submitted application with the FTA to enter Project Development for the Central Mesa LRT Extension. In August of 2010 FTA approved the project to move forward into design under the Sec 5309 Small Starts program. In August of 2011, the FTA approved the project environmental submittal enabling right of way acquisition and utility relocation eligible for federal funding. In October of 2012, the FTA awarded a $75.0 million Project Construction Grant Agreement for the Central Mesa Extension. OTHER INFORMATION Awards The Government Finance Officers Association of the United States and Canada (GFOA) awarded a Certificate of Achievement for Excellence in Financial Reporting to Valley Metro Rail, Inc. for its comprehensive annual financial report for the fiscal year ended June 30, 2011. In order to be awarded a Certificate of Achievement, a government must publish an easily readable and efficiently organized comprehensive annual financial report. This report must satisfy both generally accepted accounting principles and applicable legal requirements. A Certificate of Achievement is valid for a period of one year only. We believe that our current comprehensive annual financial report continues to meet the Certificate of Achievement Program’s requirements and we are submitting it to GFOA to determine eligibility for another certificate.

x
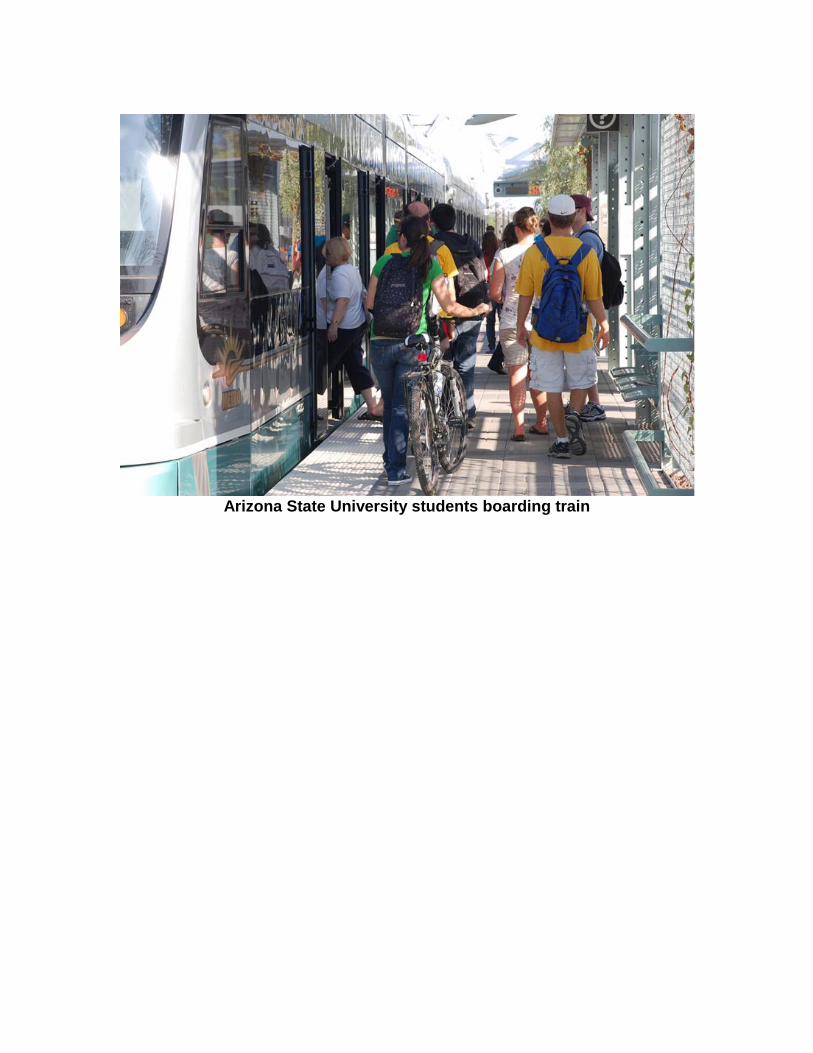
Arizona State University students boarding train

xi
VALLEY METRO RAIL, INC. Policy Organizational Chart
Fiscal Year Ended June 30, 2012

xii
Board Chairman Mayor Greg Stanton, Phoenix Vice Chairman Councilmember Dennis Kavanaugh, MesaBoard Member Councilmember Shana Ellis, TempeBoard Member Councilmember Rick Heumann, ChandlerBoard Member Mayor Elaine M. Scruggs, Glendale
Chief Executive Officer Stephen R. BantaChief of Staff Jyme Sue MclarenChief Operations Officer Raymond AbrahamDirector, Communication and Marketing Hillary FooseDirector, Planning and Development Wulf GroteChief, Safety and Security Gardner TabonGeneral Counsel Mike LadinoChief Financial Officer John McCormack
Executive Management Team
VALLEY METRO RAIL, INC.List of Appointed Officials
Fiscal Year Ended June 30, 2012
Board of Directors

FINANCIAL SECTION The Financial Section includes the Independent Auditors’ Report, Management’s Discussion and Analysis (MD&A), the basic financial statements, and notes to the financial statements.

INDEPENDENT AUDITORS’ REPORT Board of Directors Valley Metro Rail, Inc. We have audited the accompanying financial statements of the business-type activities of Valley Metro Rail, Inc. (METRO), as of and for the year ended June 30, 2012, as listed in the table of contents. These financial statements are the responsibility of the METRO’s management. Our responsibility is to express an opinion on these financial statements based on our audit. We conducted our audit in accordance with auditing standards generally accepted in the United States of America and the standards applicable to financial audits contained in Government Auditing Standards, issued by the Comptroller General of the United States. Those standards require that we plan and perform the audit to obtain reasonable assurance about whether the financial statements are free of material misstatement. An audit includes examining, on a test basis, evidence supporting the amounts and disclosures in the financial statements. An audit also includes assessing the accounting principles used and the significant estimates made by management, as well as evaluating the overall financial statement presentation. We believe that our audit provides a reasonable basis for our opinion. In our opinion, the financial statements referred to above present fairly, in all material respects, the financial position of the business-type activities of Valley Metro Rail, Inc., as of June 30, 2012, and the changes in financial position and cash flows, where applicable, thereof for the year then ended in conformity with accounting principles generally accepted in the United States of America. In accordance with Government Auditing Standards, we have also issued our report dated November 15, 2012, on our consideration of Valley Metro Rail, Inc.’s internal control over financial reporting and on our tests of its compliance with certain provisions of laws, regulations, contracts, and grant agreements and other matters. The purpose of that report is to describe the scope of our testing of internal control over financial reporting and compliance and the results of that testing, and not to provide an opinion on the internal control over financial reporting or on compliance. That report is an integral part of an audit performed in accordance with Government Auditing Standards and should be considered in assessing the results of our audit.
TUCSON • PHOENIX • FLAGSTAFF • ALBUQUERQUEwww.heinfeldmeech.com
10120 N. Oracle RoadTucson, Arizona 85704
Tel (520) 742-2611Fax (520) 742-2718
Accounting principles generally accepted in the United States of America require that the management’s discussion and analysis on pages 3 through 8 be presented to supplement the basic financial statements. Such information, although not a part of the basic financial statements, is required by Governmental Accounting Standards Board, who considers it to be an essential part of financial reporting for placing the basic financial statements in an appropriate operational, economic, or historical context. We have applied certain limited procedures to the required supplementary information in accordance with auditing standards generally accepted in the United States of America, which consisted of inquiries of management about the methods of preparing the information and comparing the information for consistency with management’s responses to our inquiries, the basic financial statements, and other knowledge we obtained during our audit of the basic financial statements. We do not express an opinion or provide any assurance on the information because the limited procedures do not provide us with sufficient evidence to express an opinion or provide any assurance. Our audit was conducted for the purpose of forming opinions on the financial statements that collectively comprise METRO’s financial statements as a whole. The accompanying supplementary information such as the introductory section, other supplementary information, and statistical section are presented for purposes of additional analysis and are not a required part of the financial statements. The other supplementary information, as listed in the table of contents, has been subjected to the auditing procedures applied in the audit of the financial statements and certain additional procedures, including comparing and reconciling such information directly to the underlying accounting and other records used to prepare the financial statements or to the financial statements themselves, and other additional procedures in accordance with auditing standards generally accepted in the United States of America. In our opinion, the information is fairly stated in all material respects in relation to the financial statements as a whole. The introductory and statistical sections have not been subjected to the auditing procedures applied in the audit of the basic financial statements and, accordingly, we do not express an opinion or provide any assurance on them. HEINFELD, MEECH & CO., P.C. CPAs and Business Consultants November 15, 2012
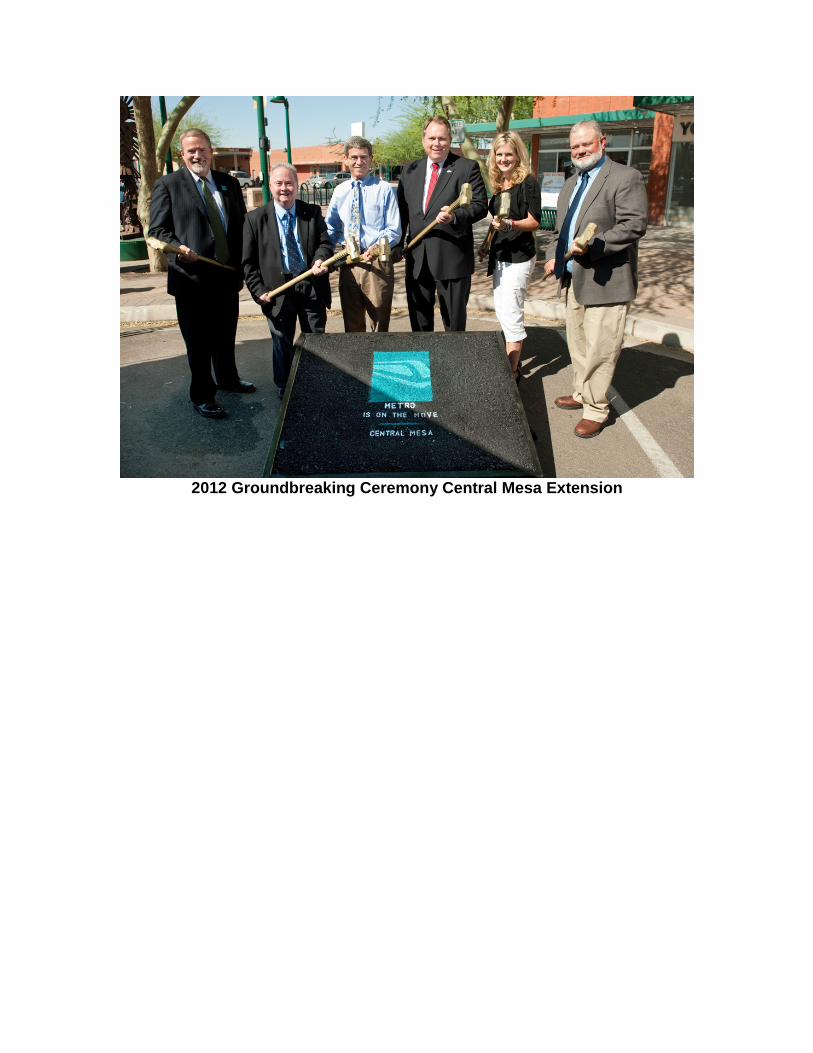
2012 Groundbreaking Ceremony Central Mesa Extension
Valley Metro Rail, Inc. Management’s Discussion and Analysis
3
As management of Valley Metro Rail, Inc. (METRO), we offer this narrative overview and analysis of the financial activities of METRO for the fiscal year ended June 30, 2012. We encourage readers to consider the information presented here in conjunction with additional information that we have furnished in our letter of transmittal, which can be found on pages iii – ix of this report. This discussion and analysis is designed to (1) assist the reader in focusing on significant financial issues, (2) provide an overview of METRO’s financial activity, (3) identify changes in METRO’s financial position, (4) identify any material deviations from the financial plan (adopted annual budget), and (5) identify other issues or concerns. Financial Highlights • METRO’s total net assets decreased $19.5 million in FY 2012. The decrease was caused
by scheduled depreciation charges, which exceeded new capital asset growth. Total net assets for METRO were $1.139 billion at June 30, 2012.
• METRO’s operating revenues for FY 2012 were $31.0 million, an increase of approximately
$0.2 million from the prior period. Operating revenues consisted of contributions from METRO member cities ($14.3 million), passenger fares ($11.9 million), FTA operating grants ($3.6 million) and other revenues ($1.2 million). Passenger operating costs were reduced by $2.1 million and fare revenues were increased by $1.7 million. The combination of cost savings measures, increased ridership (fare revenue) and utilization of federal grant funding resulted in reduced contributions from Member Cities by $5.2 million.
• Capital contributions totaled $27.7 million consisting of Member City Contributions of $0.3
million, Public Transportation Funds of $18.3 million and Federal Transit Administration Capital Grants totaling $9.1 million. Capital projects funded include the remaining $5.2 million of reimbursements to member cities for the CPEV 20 mile light rail system, $11.0 million for the Central Mesa 3.1 mile LRT extension and a $10.0 million capital lease payment for 14 light rail vehicles.
OVERVIEW OF THE FINANCIAL STATEMENTS METRO’s financial statements are presented in accordance with accounting principles generally accepted in the United States of America (“GAAP”). GAAP requires that the financial statements be accompanied by a narrative introduction and analytical overview of the government’s financial activities in the form of “Management’s Discussion and Analysis” (MD&A). The financial section of the Comprehensive Annual Financial Report (CAFR) for METRO consists of this discussion and analysis and the basic financial statements. This report also contains other supplementary schedules presented after the basic financial statements. METRO’s basic financial statements include a statement of net assets; a statement of revenues, expenses and changes in net assets; a statement of cash flows; and the notes to the financial statements. METRO’s financial statements are prepared on an accrual basis of accounting in accordance with accounting principles generally accepted in the United States of America promulgated by the Governmental Accounting Standards Board (GASB). Fund Financial Statements – METRO is presented as an enterprise fund. Enterprise funds are used for activities that primarily serve customers outside the governmental unit. A fund is a grouping of related accounts that is used to maintain control over resources that have been segregated for specific activities or conditions. Funds are used to ensure and demonstrate
Valley Metro Rail, Inc. Management’s Discussion and Analysis (Continued)
4
compliance with finance-related legal requirements as well as for managerial control to demonstrate fiduciary responsibility over the assets of METRO. The statement of net assets presents information on all of METRO’s assets and liabilities, with the difference between the two reported as net position. Over time, increases or decreases in net assets may serve as a useful indicator of whether the financial position of METRO is improving or deteriorating. The statement of revenues, expenses and changes in fund net assets presents information showing how the agency’s net assets changed during the most recent fiscal year. All changes in net assets are reported as soon as the underlying event giving rise to the change occurs, regardless of the timing of related cash flows. Thus, revenues and expenses are reported in this statement for some items that will result in cash flows in future fiscal periods (e.g., uncollected grant revenues). Notes to the Financial Statements – The notes to the financial statements provide additional information that is essential to a full understanding of the data provided in the financial statements and should be read with the financial statements. The notes can be found beginning on page 12. Enterprise Operations – METRO was formed in October 2002 by the cities of Glendale, Mesa, Phoenix and Tempe as a public nonprofit corporation to manage design, construction and operation of the Light Rail Transit (LRT) System within the Metropolitan Area. The city of Chandler became the fifth contributing member in April of 2007. The member cities pay for their share of METRO’s operating expenses based on expense allocation methods approved in the by-laws of METRO. See Note 1 for a summary of METRO’s significant accounting policies.
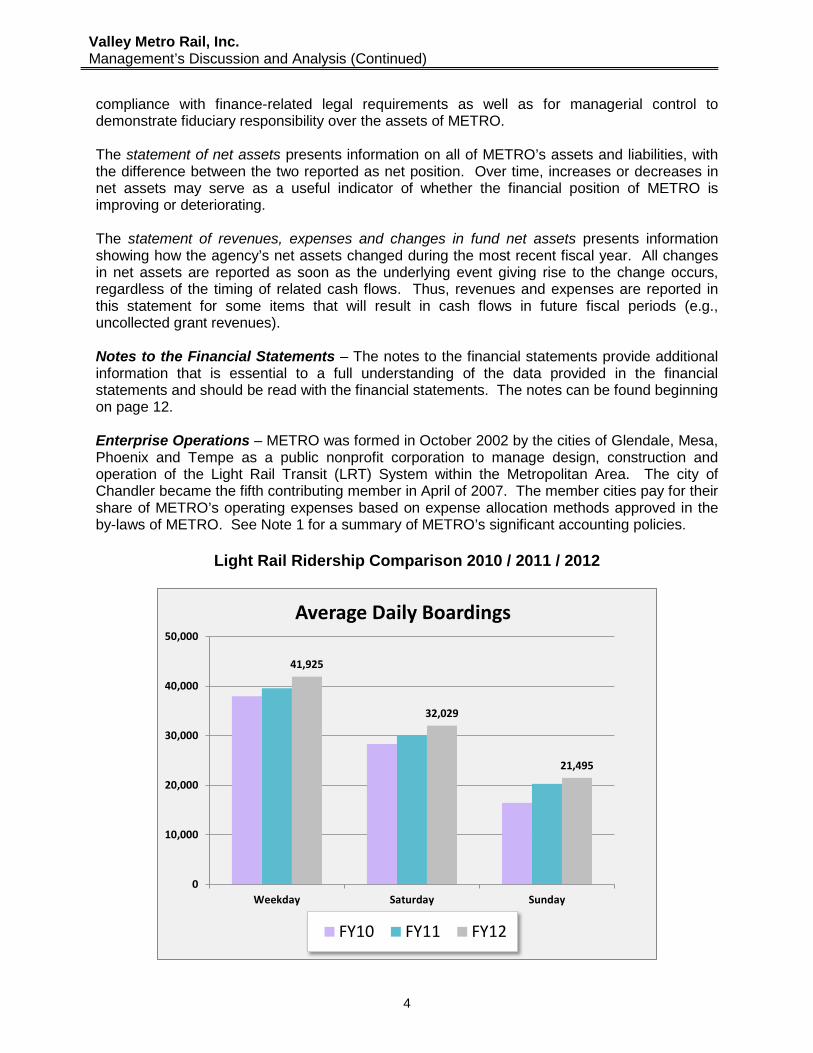
Light Rail Ridership Comparison 2010 / 2011 / 2012
41,925
32,029
21,495
0
10,000
20,000
30,000
40,000
50,000
Weekday Saturday Sunday
Average Daily Boardings
FY10 FY11 FY12

Valley Metro Rail, Inc. Management’s Discussion and Analysis (Continued)
5
FINANCIAL ANALYSIS OF METRO The following tables and analysis discuss the financial position and changes to the financial position for METRO as a whole as of and for the year ended June 30, 2012, with comparative information for the previous period. Net Assets – Net assets may serve over time as a useful indicator of METRO’s financial position. The following table reflects the condensed Statement of Net Assets as of June 30, 2012, compared to the prior period.
Total net assets represent the sum of METRO’s unrestricted net position plus investment in capital assets, net of related debt. The largest portions of the investment are capital assets for the Central Phoenix /East Valley Light Rail Transit Project (CP/EV LRT). In December 2008, METRO placed these capital assets into service for operation of the light rail transit system and in day-to-day operations of METRO. It is not METRO’s intention to sell these assets and they are therefore not available for future spending. Net position decreased $19.5 million largely due to the annual charge for depreciation on the completed 20 mile system.
2012 2011 ChangePercent Change
Current assets 40,472,072$ 40,821,064$ (348,992)$ -0.9%Noncurrent assets 1,158,677,475 1,185,084,002 (26,406,527) -2.2% Total assets 1,199,149,547 1,225,905,066 (26,755,519) -2.2% Current Liabilities 36,581,615 36,612,801 (31,186) -0.1%Noncurrent Liabilities 23,701,501 30,919,628 (7,218,127) -23.3% Total liabilities 60,283,116 67,532,429 (7,249,313) -10.7% Invested in Capital Assets, net of related debt 1,136,804,227 1,153,352,954 (16,548,727) -1.4%Unrestricted 2,062,204 5,019,683 (2,957,479) -58.9% Total Net Assets 1,138,866,431$ 1,158,372,637$ (19,506,206)$ -1.7%
VMR's Condensed Statement of Net AssetsAs of June 30, 2012 and 2011
Valley Metro Rail, Inc. Management’s Discussion and Analysis (Continued)
6
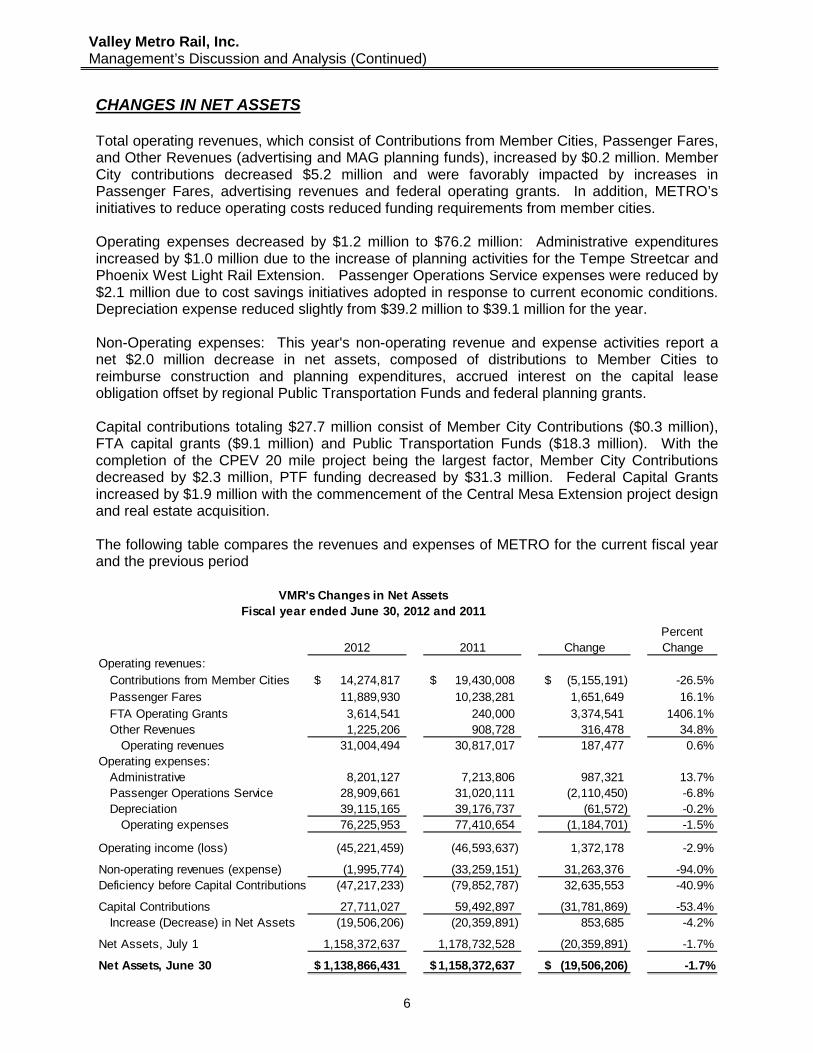
CHANGES IN NET ASSETS Total operating revenues, which consist of Contributions from Member Cities, Passenger Fares, and Other Revenues (advertising and MAG planning funds), increased by $0.2 million. Member City contributions decreased $5.2 million and were favorably impacted by increases in Passenger Fares, advertising revenues and federal operating grants. In addition, METRO’s initiatives to reduce operating costs reduced funding requirements from member cities. Operating expenses decreased by $1.2 million to $76.2 million: Administrative expenditures increased by $1.0 million due to the increase of planning activities for the Tempe Streetcar and Phoenix West Light Rail Extension. Passenger Operations Service expenses were reduced by $2.1 million due to cost savings initiatives adopted in response to current economic conditions. Depreciation expense reduced slightly from $39.2 million to $39.1 million for the year. Non-Operating expenses: This year's non-operating revenue and expense activities report a net $2.0 million decrease in net assets, composed of distributions to Member Cities to reimburse construction and planning expenditures, accrued interest on the capital lease obligation offset by regional Public Transportation Funds and federal planning grants. Capital contributions totaling $27.7 million consist of Member City Contributions ($0.3 million), FTA capital grants ($9.1 million) and Public Transportation Funds ($18.3 million). With the completion of the CPEV 20 mile project being the largest factor, Member City Contributions decreased by $2.3 million, PTF funding decreased by $31.3 million. Federal Capital Grants increased by $1.9 million with the commencement of the Central Mesa Extension project design and real estate acquisition. The following table compares the revenues and expenses of METRO for the current fiscal year and the previous period
2012 2011 ChangePercent Change
Operating revenues: Contributions from Member Cities 14,274,817$ 19,430,008$ (5,155,191)$ -26.5% Passenger Fares 11,889,930 10,238,281 1,651,649 16.1% FTA Operating Grants 3,614,541 240,000 3,374,541 1406.1%
Other Revenues 1,225,206 908,728 316,478 34.8% Operating revenues 31,004,494 30,817,017 187,477 0.6%Operating expenses: Administrative 8,201,127 7,213,806 987,321 13.7% Passenger Operations Service 28,909,661 31,020,111 (2,110,450) -6.8% Depreciation 39,115,165 39,176,737 (61,572) -0.2% Operating expenses 76,225,953 77,410,654 (1,184,701) -1.5% Operating income (loss) (45,221,459) (46,593,637) 1,372,178 -2.9% Non-operating revenues (expense) (1,995,774) (33,259,151) 31,263,376 -94.0%Deficiency before Capital Contributions (47,217,233) (79,852,787) 32,635,553 -40.9% Capital Contributions 27,711,027 59,492,897 (31,781,869) -53.4% Increase (Decrease) in Net Assets (19,506,206) (20,359,891) 853,685 -4.2% Net Assets, July 1 1,158,372,637 1,178,732,528 (20,359,891) -1.7% Net Assets, June 30 1,138,866,431$ 1,158,372,637$ (19,506,206)$ -1.7%
VMR's Changes in Net AssetsFiscal year ended June 30, 2012 and 2011
Valley Metro Rail, Inc. Management’s Discussion and Analysis (Continued)
7
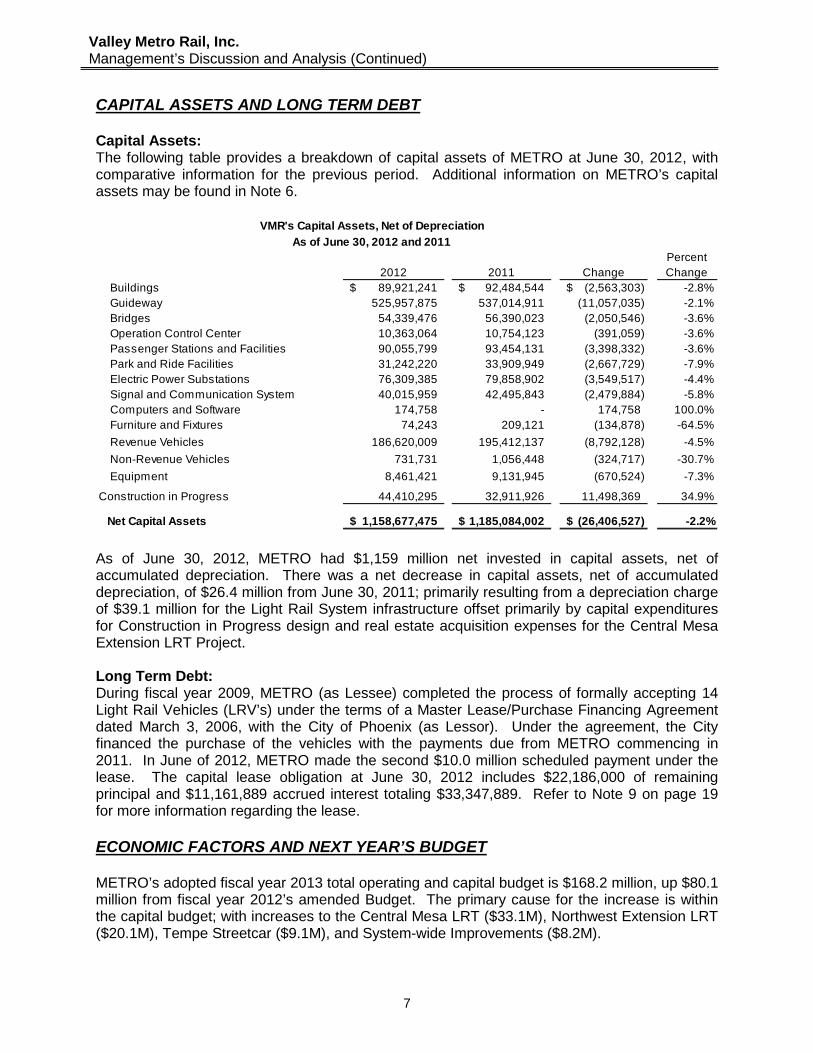
CAPITAL ASSETS AND LONG TERM DEBT Capital Assets: The following table provides a breakdown of capital assets of METRO at June 30, 2012, with comparative information for the previous period. Additional information on METRO’s capital assets may be found in Note 6.
As of June 30, 2012, METRO had $1,159 million net invested in capital assets, net of accumulated depreciation. There was a net decrease in capital assets, net of accumulated depreciation, of $26.4 million from June 30, 2011; primarily resulting from a depreciation charge of $39.1 million for the Light Rail System infrastructure offset primarily by capital expenditures for Construction in Progress design and real estate acquisition expenses for the Central Mesa Extension LRT Project. Long Term Debt: During fiscal year 2009, METRO (as Lessee) completed the process of formally accepting 14 Light Rail Vehicles (LRV’s) under the terms of a Master Lease/Purchase Financing Agreement dated March 3, 2006, with the City of Phoenix (as Lessor). Under the agreement, the City financed the purchase of the vehicles with the payments due from METRO commencing in 2011. In June of 2012, METRO made the second $10.0 million scheduled payment under the lease. The capital lease obligation at June 30, 2012 includes $22,186,000 of remaining principal and $11,161,889 accrued interest totaling $33,347,889. Refer to Note 9 on page 19 for more information regarding the lease. ECONOMIC FACTORS AND NEXT YEAR’S BUDGET METRO’s adopted fiscal year 2013 total operating and capital budget is $168.2 million, up $80.1 million from fiscal year 2012’s amended Budget. The primary cause for the increase is within the capital budget; with increases to the Central Mesa LRT ($33.1M), Northwest Extension LRT ($20.1M), Tempe Streetcar ($9.1M), and System-wide Improvements ($8.2M).
2012 2011 ChangePercent Change
Buildings 89,921,241$ 92,484,544$ (2,563,303)$ -2.8%Guideway 525,957,875 537,014,911 (11,057,035) -2.1%Bridges 54,339,476 56,390,023 (2,050,546) -3.6%Operation Control Center 10,363,064 10,754,123 (391,059) -3.6%Passenger Stations and Facilities 90,055,799 93,454,131 (3,398,332) -3.6%Park and Ride Facilities 31,242,220 33,909,949 (2,667,729) -7.9%Electric Power Substations 76,309,385 79,858,902 (3,549,517) -4.4%Signal and Communication System 40,015,959 42,495,843 (2,479,884) -5.8%Computers and Software 174,758 - 174,758 100.0%Furniture and Fixtures 74,243 209,121 (134,878) -64.5%Revenue Vehicles 186,620,009 195,412,137 (8,792,128) -4.5%Non-Revenue Vehicles 731,731 1,056,448 (324,717) -30.7%Equipment 8,461,421 9,131,945 (670,524) -7.3%
Construction in Progress 44,410,295 32,911,926 11,498,369 34.9%
Net Capital Assets 1,158,677,475$ 1,185,084,002$ (26,406,527)$ -2.2%
VMR's Capital Assets, Net of DepreciationAs of June 30, 2012 and 2011
Valley Metro Rail, Inc. Management’s Discussion and Analysis (Concluded)
8
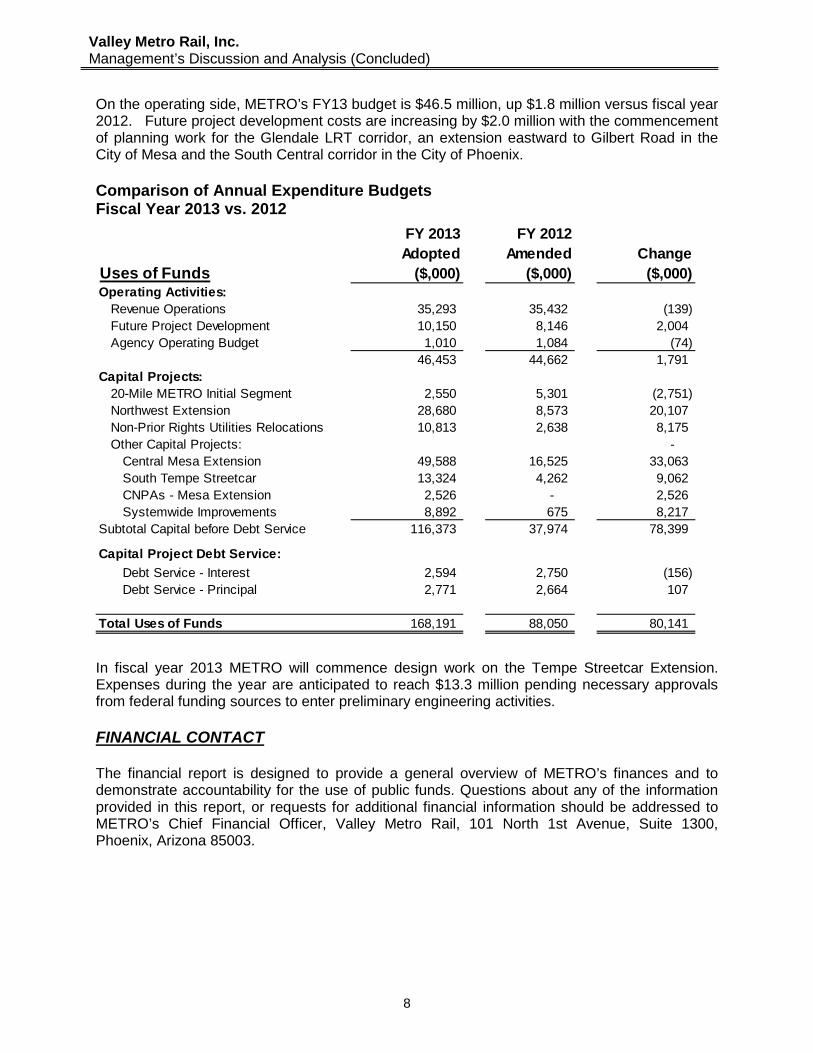
On the operating side, METRO’s FY13 budget is $46.5 million, up $1.8 million versus fiscal year 2012. Future project development costs are increasing by $2.0 million with the commencement of planning work for the Glendale LRT corridor, an extension eastward to Gilbert Road in the City of Mesa and the South Central corridor in the City of Phoenix. Comparison of Annual Expenditure Budgets Fiscal Year 2013 vs. 2012
In fiscal year 2013 METRO will commence design work on the Tempe Streetcar Extension. Expenses during the year are anticipated to reach $13.3 million pending necessary approvals from federal funding sources to enter preliminary engineering activities. FINANCIAL CONTACT The financial report is designed to provide a general overview of METRO’s finances and to demonstrate accountability for the use of public funds. Questions about any of the information provided in this report, or requests for additional financial information should be addressed to METRO’s Chief Financial Officer, Valley Metro Rail, 101 North 1st Avenue, Suite 1300, Phoenix, Arizona 85003.
Uses of Funds
FY 2013Adopted
($,000)
FY 2012 Amended
($,000)Change
($,000)Operating Activities: Revenue Operations 35,293 35,432 (139) Future Project Development 10,150 8,146 2,004 Agency Operating Budget 1,010 1,084 (74)
46,453 44,662 1,791 Capital Projects: 20-Mile METRO Initial Segment 2,550 5,301 (2,751) Northwest Extension 28,680 8,573 20,107 Non-Prior Rights Utilities Relocations 10,813 2,638 8,175 Other Capital Projects: - Central Mesa Extension 49,588 16,525 33,063 South Tempe Streetcar 13,324 4,262 9,062 CNPAs - Mesa Extension 2,526 - 2,526 Systemwide Improvements 8,892 675 8,217 Subtotal Capital before Debt Service 116,373 37,974 78,399
Capital Project Debt Service: Debt Service - Interest 2,594 2,750 (156) Debt Service - Principal 2,771 2,664 107
Total Uses of Funds 168,191 88,050 80,141
BASIC FINANCIAL STATEMENTS

9
Valley Metro Rail, Inc.Statement of Net AssetsFiscal Year Ended June 30, 2012
AssetsCurrent Assets Cash and Investments 14,694,159$ Receivables, Net 504,401 Due from Other Governments 10,443,455 Inventory 14,038,921 Restricted Assets 312,752 Other Assets 478,384 Total Current Assets 40,472,072 Noncurrent Assets Capital Assets, not being depreciated 44,410,295 Capital Assets, net of accumulated depreciation 1,114,267,180 Total Noncurrent Assets 1,158,677,475 Total Assets and Other Debits 1,199,149,547
LiabilitiesCurrent Liabilities: Accounts Payable 7,990,609 Labor Compliance Withholding 21,903 Other Accrued Expenses 215,289 Compensated Absences 499,646
Capital Lease Obligation - Current portion 10,000,000 Reserve for General Liability Claims 503,764 Due to Other Governments 1,149,537 Unearned Revenue 1,063,898 Member Cities Deposits 15,136,969 Total Current Liabilities 36,581,615
Noncurrent Liabilities: Compensated Absences 353,612 Capital Lease Obligation 12,186,000 Interest payable 11,161,889
Total Liabilities and Other Credits 60,283,116
Net AssetsInvested in Capital Assets, Net of Related Debt 1,136,804,227 Unrestricted 2,062,204 Total Net Assets 1,138,866,431$
The accompanying notes to the financial statements are an integral part of this statement.

10
Valley Metro Rail, Inc.Statement of Revenues, Expenses, and Changes in Fund Net AssetsFiscal Year Ended June 30, 2012
Operating Revenues: Contributions from Member Cities 14,274,817$ Passenger Fares 11,889,930 Receipts from Federal Operating Grants 3,614,541 Other Revenues 1,225,206 Total Operating Revenues 31,004,494
Operating Expenses: Administrative 8,201,127 Passenger Operations Service 28,909,661 Depreciation 39,115,165 Total Operating Expenses 76,225,953
Operating Income (Loss) (45,221,459)
Non-Operating Revenue / (Expense): Federal Transit Administration Planning Grants 1,059,848 Public Transportation Funds 6,469,470 Distributions to Member Cities (6,664,230) Private Utilities Relocations (56,477) Interest on Capital Lease Obligation (2,827,876) Other Non-Operating Income 23,491 Total Non-Operating Revenue / (Expense): (1,995,774)
Deficiency Revenues under Expenses (47,217,233)
Capital Contributions: Capital Contributions from Member Cities 330,700 Public Transportation Funds Capital 18,255,237 Federal Transit Administration Capital Grants 9,125,090 Total Capital Contributions: 27,711,027
Changes in Net Assets (19,506,206) Net Assets, Beginning of Period 1,158,372,637 Net Assets, End of Period 1,138,866,431$
The accompanying notes to the financial statements are an integral part of this statement.
11
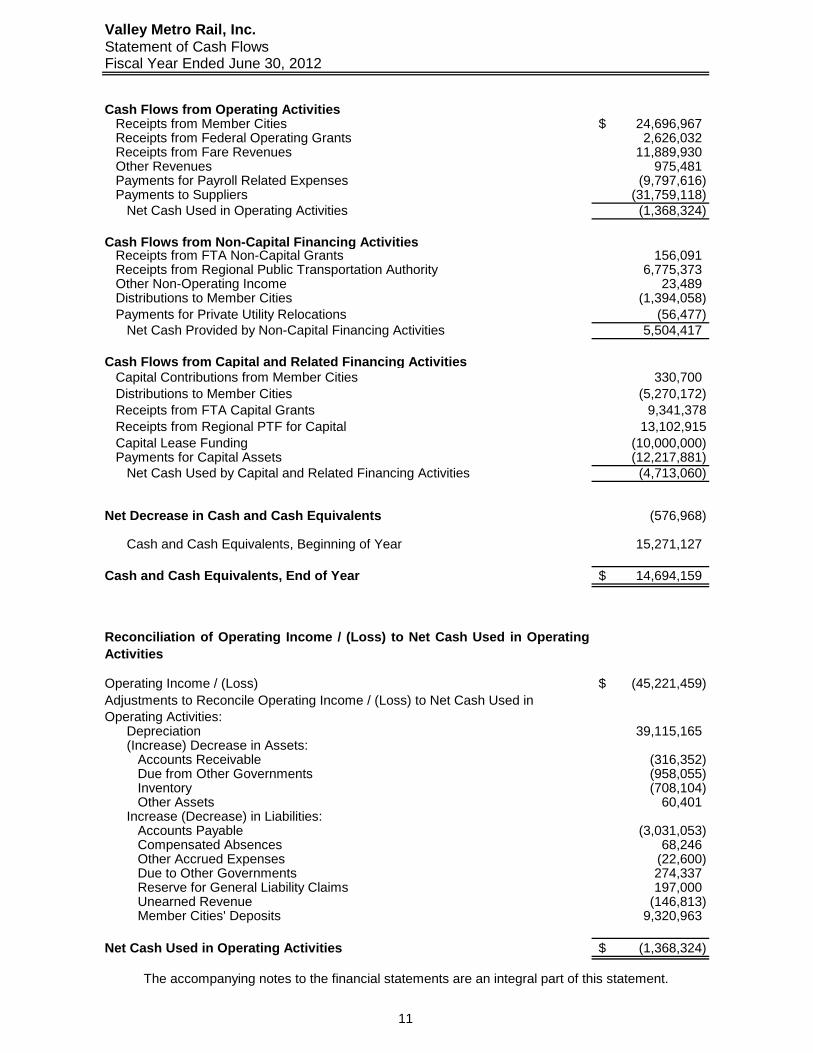
Valley Metro Rail, Inc.Statement of Cash FlowsFiscal Year Ended June 30, 2012
Cash Flows from Operating Activities Receipts from Member Cities 24,696,967$ Receipts from Federal Operating Grants 2,626,032 Receipts from Fare Revenues 11,889,930 Other Revenues 975,481 Payments for Payroll Related Expenses (9,797,616) Payments to Suppliers (31,759,118) Net Cash Used in Operating Activities (1,368,324)
Cash Flows from Non-Capital Financing Activities Receipts from FTA Non-Capital Grants 156,091 Receipts from Regional Public Transportation Authority 6,775,373 Other Non-Operating Income 23,489 Distributions to Member Cities (1,394,058) Payments for Private Utility Relocations (56,477) Net Cash Provided by Non-Capital Financing Activities 5,504,417
Cash Flows from Capital and Related Financing Activities Capital Contributions from Member Cities 330,700 Distributions to Member Cities (5,270,172) Receipts from FTA Capital Grants 9,341,378 Receipts from Regional PTF for Capital 13,102,915 Capital Lease Funding (10,000,000) Payments for Capital Assets (12,217,881) Net Cash Used by Capital and Related Financing Activities (4,713,060)
Net Decrease in Cash and Cash Equivalents (576,968)
Cash and Cash Equivalents, Beginning of Year 15,271,127
Cash and Cash Equivalents, End of Year 14,694,159$
Reconciliation of Operating Income / (Loss) to Net Cash Used in OperatingActivities
Operating Income / (Loss) (45,221,459)$ Adjustments to Reconcile Operating Income / (Loss) to Net Cash Used in Operating Activities: Depreciation 39,115,165 (Increase) Decrease in Assets: Accounts Receivable (316,352) Due from Other Governments (958,055) Inventory (708,104) Other Assets 60,401 Increase (Decrease) in Liabilities: Accounts Payable (3,031,053) Compensated Absences 68,246 Other Accrued Expenses (22,600) Due to Other Governments 274,337
Reserve for General Liability Claims 197,000 Unearned Revenue (146,813) Member Cities' Deposits 9,320,963
Net Cash Used in Operating Activities (1,368,324)$
The accompanying notes to the financial statements are an integral part of this statement.

Valley Metro Rail, Inc. Notes to the Financial Statements Fiscal Year Ended June 30, 2012
12
1. Summary of Significant Accounting Policies
The accounting policies of Valley Metro Rail, Inc. (METRO) conform to accounting principles generally accepted in the United States of America (GAAP) as applicable to governmental units. The Governmental Accounting Standards Board (GASB) is the accepted standard-setting body for establishing governmental accounting and financial reporting principles.
a. Financial Reporting Entity
In October 2002, the city councils of Glendale, Mesa, Phoenix and Tempe approved the formation of a government entity with a nonprofit status by the name of Valley Metro Rail, Inc. The nonprofit corporation was organized under A.R.S. 11-952 and 40-1152. The initial members entered into a Joint Powers Agreement which provides that this Corporation be organized as the instrumentality to plan, design, construct, and operate the Light Rail Transit Project (“LRT”). Prior to October 2002, the Regional Public Transportation Authority (RPTA) performed these roles. METRO contracts with the RPTA for certain administrative functions, including personnel, HR administration, and computer support services. All METRO staff is hired and employed by RPTA but works solely under the direction of Valley Metro Rail, Inc., and its Board of Directors, through a contractual arrangement with RPTA. The Board of Directors of METRO is solely responsible for the governance of LRT and METRO is not a component unit of RPTA; economic resources received by METRO are entirely for the direct benefit of METRO, and RPTA is not entitled to and has no ability to otherwise access any of the economic resources received or held by METRO.
b. Basic Financial Statements
These financial statements are presented in accordance with GASB Statement No. 34 – Basic Financial Statements and Management’s Discussion and Analysis for State and Local Governments (GASB No. 34). METRO is engaged only in business-type activities and is required to present the financial statements required for enterprise funds which are part of proprietary funds. METRO does not report any component units.
c. Basis of Presentation
Proprietary funds account for activities of METRO similar to those found in the private sector, where cost recovery and the determination of net income is useful or necessary for sound fiscal management. The focus of proprietary fund measurement is upon the determination of operating income, changes in net assets, financial position and cash flows. Currently, enterprise funds are the only type of proprietary fund that METRO uses.
d. Measurement Focus and Basis of Accounting The Statement of net assets and statement of revenues, expenses and changes in fund net assets are reported using the flow of economic resources measurement focus and accrual basis of accounting. Revenues are recorded when earned and expenses are recorded when a liability is incurred, regardless of the timing of related cash flows. Grants and similar items are recognized as revenue as soon as all eligibility requirements imposed by the provider have been met. Such revenue is subject to review by the funding agency, which may result in disallowance in subsequent periods.
Valley Metro Rail, Inc. Notes to the Financial Statements (Continued) Fiscal Year Ended June 30, 2012
13
All of METRO's activities are accounted for in a single proprietary or business-type fund. Proprietary funds distinguish operating revenues and expenses from non-operating items and capital contributions. Operating revenues and expenses generally result from providing services and producing and delivering goods in connecting with a proprietary fund's principal ongoing operations. Revenues and expenses not meeting this definition are reported as either non-operating revenues and expenses or capital contributions. Private-sector standards of accounting and financial reporting issued prior to December 1, 1989 generally are followed in the proprietary fund financial statements to the extent that those standards do not conflict with or contradict guidance of the Governmental Accounting Standards Board. Governments have the option of following subsequent private-sector guidance for the business-type activities, subject to this same limitation. METRO has elected not to follow subsequent private-sector guidance.
e. Cash and Investments State statutes authorize METRO to invest in obligations of the U.S. Treasury and any of its agencies, corporations or instrumentalities, collateralized repurchase agreements, certificates of deposit, and the Local Government Investment Pool. METRO’s investments are stated at fair value. Fair value is based on quoted market prices as of the valuation date. METRO considers short-term investments in mutual fund-money markets, U.S. Treasury bills and notes with maturities of three months or less at acquisition date to be cash equivalents.
f. Receivables Management analyzes receivables periodically to determine the adequacy of the allowance for doubtful accounts. There is no current provision required for possible bad debts.
g. Inventory
Inventories consist of expendable supplies held for consumption. Inventories are valued at cost using the average cost method. Inventories are expensed when the resources are used.
h. Prepaid Expenses
Certain payments to vendors reflect costs applicable to future accounting periods and are recorded as prepaid items. The prepaid items are included in Other Assets under Current Assets on the Statement of Net Assets.
i. Capital Assets
Capital assets are defined as assets with an initial, individual cost of more than $5,000 and an estimated useful life greater than one year. Capital assets are recorded at cost or estimated historical cost if purchased or constructed. Donated capital assets are recorded at the estimated fair value at the date of donation.
Valley Metro Rail, Inc. Notes to the Financial Statements (Continued) Fiscal Year Ended June 30, 2012
14
METRO capitalizes all costs incurred in connection with the construction of the Central Phoenix/East Valley (CP/EV) 20-mile alignment. The costs for the non-federal agency operating, Rail Operations, and the initial planning costs of additional extensions are recorded as annual operating expenses. METRO is not the legal owner of any land. The land required for the LRT system is acquired and owned by the Member Cities and is the subject of a long-term use agreement between each City and METRO. Land, subject to the above agreement, is recorded on the books of member cities. The costs included as construction in progress consist primarily of project administration, engineering, construction management, utilities relocation, facility construction, equipment procurement, and other costs related to construction. No depreciation is provided on construction in progress until construction is completed and the assets are placed in service.
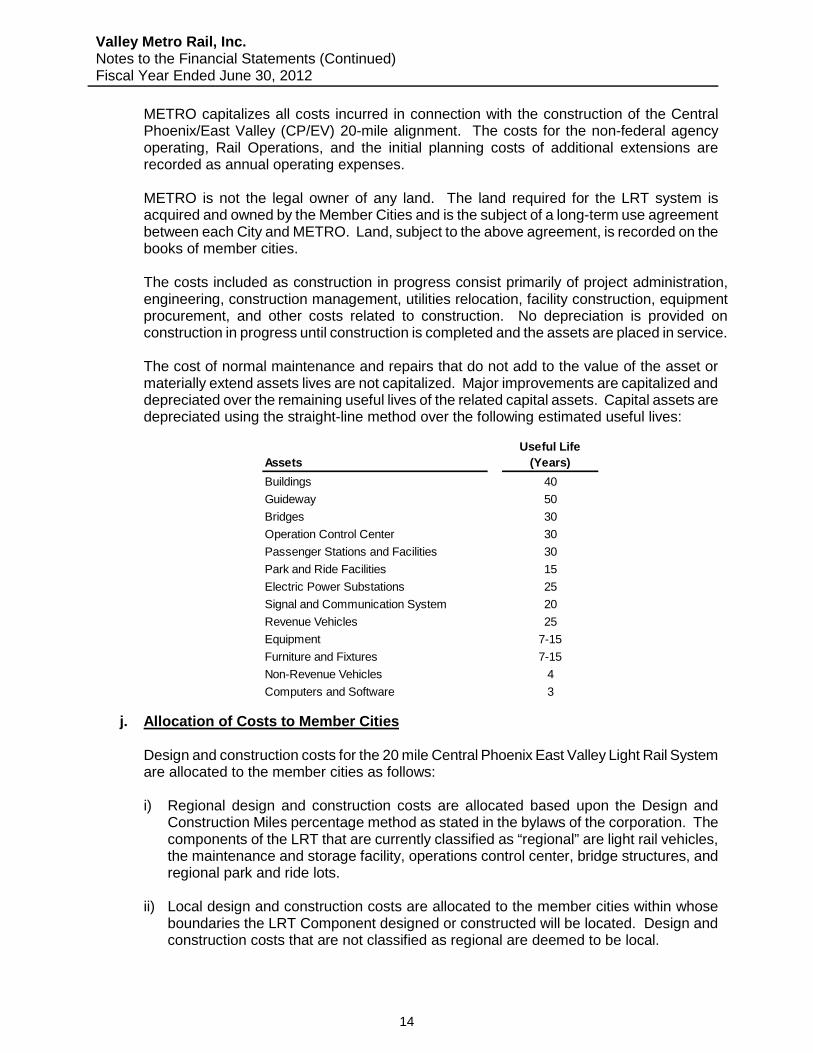
The cost of normal maintenance and repairs that do not add to the value of the asset or materially extend assets lives are not capitalized. Major improvements are capitalized and depreciated over the remaining useful lives of the related capital assets. Capital assets are depreciated using the straight-line method over the following estimated useful lives:
j. Allocation of Costs to Member Cities Design and construction costs for the 20 mile Central Phoenix East Valley Light Rail System are allocated to the member cities as follows: i) Regional design and construction costs are allocated based upon the Design and
Construction Miles percentage method as stated in the bylaws of the corporation. The components of the LRT that are currently classified as “regional” are light rail vehicles, the maintenance and storage facility, operations control center, bridge structures, and regional park and ride lots.
ii) Local design and construction costs are allocated to the member cities within whose
boundaries the LRT Component designed or constructed will be located. Design and construction costs that are not classified as regional are deemed to be local.
AssetsUseful Life
(Years)Buildings 40Guideway 50Bridges 30Operation Control Center 30Passenger Stations and Facilities 30Park and Ride Facilities 15Electric Power Substations 25Signal and Communication System 20Revenue Vehicles 25Equipment 7-15Furniture and Fixtures 7-15Non-Revenue Vehicles 4Computers and Software 3

Valley Metro Rail, Inc. Notes to the Financial Statements (Continued) Fiscal Year Ended June 30, 2012
15
iii) Under the Design and Construction project agreements, the Member Cities provide project funding to METRO as expenditures are incurred. As federal and regional funding for the capital project is received by METRO, the members receive cash distributions to reimburse the prior expenditures.
Design and construction costs for future LRT extensions are funded based upon Design and Construction Agreements which are executed in accordance with the adopted Transit Life Cycle Plan. If a member city’s share of the LRT costs for a fiscal year is determined to be less than $50,000, such member city’s share of the LRT costs shall be $50,000. The purpose of the Minimum Cost is so that all member cities will contribute to payment of the overhead expense of the Corporation for matters such as the cost of meetings of the Board of Directors, administrative support to the Board of Directors, and support to member cities by the Rail Program Staff. Passenger Operations Service Expenses are funded by the Member Cities according to the ratio of LRT route mileage currently in service. Member Cities also contribute amounts to fund local security costs related to fare inspection, on-board security and park and ride security within their respective jurisdictions.
k. Use of Estimates The preparation of financial statements in conformity with accounting principles generally accepted in the United States of America necessarily requires management to make estimates and assumptions that affect the reported amounts of assets and liabilities, disclosure of contingent assets and liabilities at the date of the financial statements and the reported amounts of revenue and expenses during the reporting financial period. Actual results could differ from these estimates.
l. Net Assets METRO’s net assets consist of unrestricted net assets and net assets invested in capital assets, net of related debt.
2. Budgetary Basis of Accounting
An annual budget of revenues and expenses is prepared and adopted by the Board of Directors each fiscal year. The legal level of budgetary control is the total annual appropriated budget. The annual budget is adopted on the modified accrual basis. Encumbrance accounting is not used and all appropriations lapse at year end. Depreciation expense is not included in the annual budget. Prior to final adoption, a proposed budget is presented to the Board of Directors for review and public comment is received. Final adoption of the budget must be on or before June 30 of each year.
During the fiscal year, the Board of Directors modified the original budget. A schedule of actual operating revenues and expenses versus original budget and final budget is presented as supplementary information. See Page 24.

Valley Metro Rail, Inc. Notes to the Financial Statements (Continued) Fiscal Year Ended June 30, 2012
16
3. Cash and Investments
Cash deposits and investments at June 30, 2012, consisted of the following:
METRO has deployed Ticket Vending Machines (TVM’s) which contain coin and bill vaults to accommodate the purchase of fares. At June 30, 2012, the total cash contained in the coin and bill vaults totaled $154,037. METRO's bank deposits at June 30, 2012, had a carrying value of $14,040,569 and the bank ledger balance was $14,218,401. The difference of $177,832 represents deposits in transit and outstanding checks. The Self Insurance Reserve Trust Account totaling $499,553 was covered by collateral held by the pledging financial institution in METRO’s name. Custodial Credit Risk – Custodial credit risk is the risk that in the event of bank failure METRO’s deposits may not be returned. METRO does not have a deposit policy for custodial credit risk. All of METRO’s bank deposits are in non-interest bearing accounts. At year end, all of METRO’s bank deposits were covered under the Dodd-Frank Wall Street Reform and Consumer Protection Act. Interest Rate Risk. METRO’s formal investment policy limits type of investment as a means of managing its exposure to fair value losses arising from increasing interest rates. During FY 2012 all investment durations were shorter than 90 days. Credit Risk. State Statutes and METRO’s Investment Policy authorize METRO to invest in bank demand deposit accounts and obligations of the U.S. Treasury. Concentration of Credit Risk. METRO’s Investment Policy limits the total investments by type of account including, General Operating, Imprest Fund, Self-Insurance Reserve and TVM Credit Card. At June 30, 2012, METRO maintains all available cash in these accounts.
Cash on Hand and in Bank 14,194,606$ Insurance Trust Fund 499,553 Total Cash and Investments 14,694,159$
Valley Metro Rail, Inc. Notes to the Financial Statements (Continued) Fiscal Year Ended June 30, 2012
17
4. Accounts Receivable and Due From Other Governments
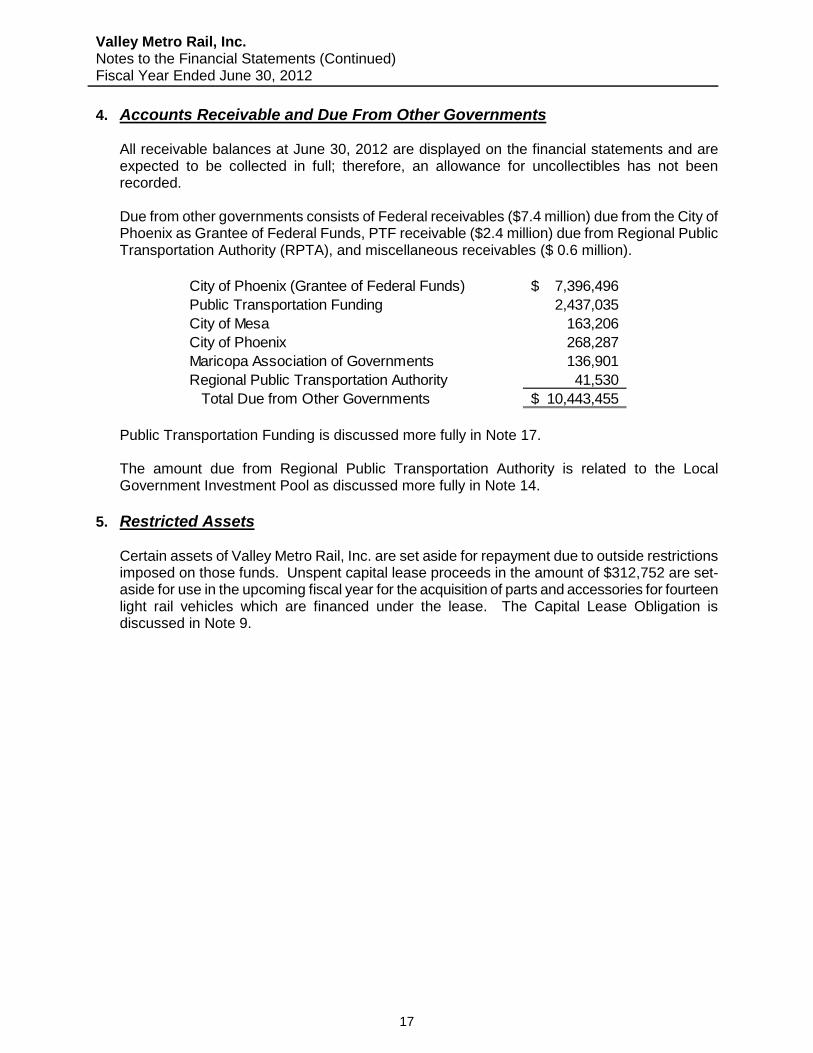
All receivable balances at June 30, 2012 are displayed on the financial statements and are expected to be collected in full; therefore, an allowance for uncollectibles has not been recorded. Due from other governments consists of Federal receivables ($7.4 million) due from the City of Phoenix as Grantee of Federal Funds, PTF receivable ($2.4 million) due from Regional Public Transportation Authority (RPTA), and miscellaneous receivables ($ 0.6 million).
Public Transportation Funding is discussed more fully in Note 17. The amount due from Regional Public Transportation Authority is related to the Local Government Investment Pool as discussed more fully in Note 14.
5. Restricted Assets
Certain assets of Valley Metro Rail, Inc. are set aside for repayment due to outside restrictions imposed on those funds. Unspent capital lease proceeds in the amount of $312,752 are set-aside for use in the upcoming fiscal year for the acquisition of parts and accessories for fourteen light rail vehicles which are financed under the lease. The Capital Lease Obligation is discussed in Note 9.
City of Phoenix (Grantee of Federal Funds) 7,396,496$ Public Transportation Funding 2,437,035 City of Mesa 163,206 City of Phoenix 268,287 Maricopa Association of Governments 136,901 Regional Public Transportation Authority 41,530
Total Due from Other Governments 10,443,455$

Valley Metro Rail, Inc. Notes to the Financial Statements (Continued) Fiscal Year Ended June 30, 2012
18
6. Capital Assets
Capital asset and construction in progress activity for the year ended June 30, 2012 were as follows:
7. Member Cities’ Deposits The member cities advance monies to cover the cost of operations plus the federal and local share of project costs. In addition, unpaid expenses to be funded by member contributions are accrued for each city. A summary of member cities’ deposits at June 30, 2012 follows:
Balances, Balances,June 30, 2011 Increases Decreases June 30, 2012
Nondepreciable assets: Construction in progress 32,911,926$ 11,781,839$ (283,470)$ 44,410,295$ Depreciable assets:
Buildings 102,532,106 102,532,106 Guideway 565,278,854 249,373 565,528,227 Bridges 61,516,388 61,516,388 Operation Control Center 11,731,770 11,731,770 Passenger Stations and Facilities 101,949,950 101,949,950 Park and Ride Facilities 40,015,939 40,015,939 Electric Power Substations 88,737,919 88,737,919 Signal and Communication System 48,566,678 (52,203) 48,514,475 Computers and Software 1,343,087 346,786 1,689,873 Furniture and Fixtures 1,126,926 11,348 1,138,274 Revenue Vehicles 219,803,204 219,803,204 Non-Revenue Vehicles 2,023,279 52,631 2,075,910 Equipment 12,785,504 602,334 13,387,838
Total depreciable assets at historical cost 1,257,411,604 1,262,472 (52,203) 1,258,621,873 Less accumulated depreciation for:
Buildings (10,047,562) (2,563,303) - (12,610,865) Guideway (28,263,943) (11,306,408) (39,570,351) Bridges (5,126,366) (2,050,546) (7,176,912) Operation Control Center (977,648) (391,059) (1,368,707) Passenger Stations and Facilities (8,495,820) (3,398,332) (11,894,152) Park and Ride Facilities (6,105,990) (2,667,729) (8,773,719) Electric Power Substations (8,879,017) (3,549,517) (12,428,534) Signal and Communication System (6,070,835) (2,427,681) (8,498,516) Computers and Software (1,343,087) (172,028) (1,515,115) Furniture and Fixtures (917,805) (146,226) (1,064,031) Revenue Vehicles (24,391,067) (8,792,128) (33,183,195) Non-Revenue Vehicles (966,831) (377,348) (1,344,179) Equipment (3,653,559) (1,272,858) (4,926,417)
Total accumulated depreciation (105,239,529) (39,115,165) - (144,354,693) Total capital assets being depreciated 1,152,172,076 (37,852,693) (52,203) 1,114,267,180 Business-type activities, capitalassets, net 1,185,084,002$ (26,070,854)$ (335,673)$ 1,158,677,475$
City of Chandler 43,682$ City of Glendale 42,516 City of Mesa 1,502,743 City of Peoria 92,288 City of Phoenix 9,703,709 City of Tempe 3,752,031
15,136,969$
Valley Metro Rail, Inc. Notes to the Financial Statements (Continued) Fiscal Year Ended June 30, 2012
19
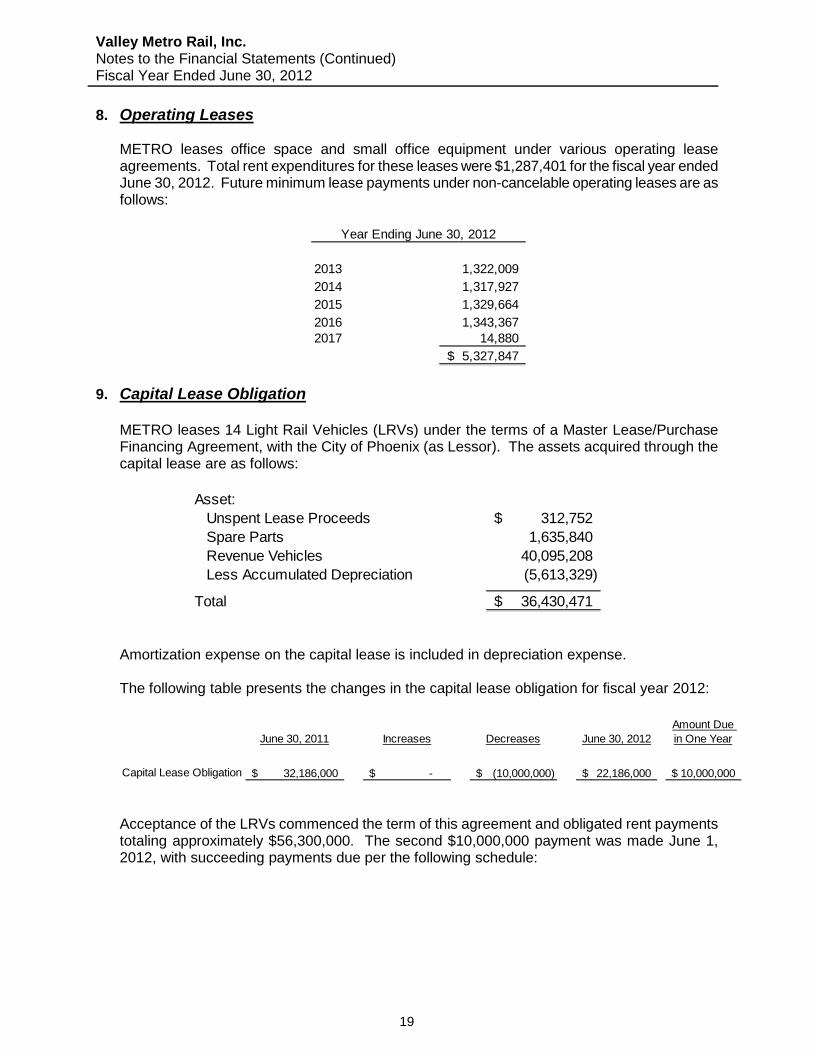
8. Operating Leases METRO leases office space and small office equipment under various operating lease agreements. Total rent expenditures for these leases were $1,287,401 for the fiscal year ended June 30, 2012. Future minimum lease payments under non-cancelable operating leases are as follows:
9. Capital Lease Obligation
METRO leases 14 Light Rail Vehicles (LRVs) under the terms of a Master Lease/Purchase Financing Agreement, with the City of Phoenix (as Lessor). The assets acquired through the capital lease are as follows:
Amortization expense on the capital lease is included in depreciation expense. The following table presents the changes in the capital lease obligation for fiscal year 2012:
Acceptance of the LRVs commenced the term of this agreement and obligated rent payments totaling approximately $56,300,000. The second $10,000,000 payment was made June 1, 2012, with succeeding payments due per the following schedule:
2013 1,322,0092014 1,317,9272015 1,329,6642016 1,343,3672017 14,880
5,327,847$
Year Ending June 30, 2012
Asset: Unspent Lease Proceeds 312,752$
Spare Parts 1,635,840 Revenue Vehicles 40,095,208 Less Accumulated Depreciation (5,613,329)
Total 36,430,471$
June 30, 2011 Increases Decreases June 30, 2012Amount Due in One Year
Capital Lease Obligation 32,186,000$ -$ (10,000,000)$ 22,186,000$ 10,000,000$
Valley Metro Rail, Inc. Notes to the Financial Statements (Continued) Fiscal Year Ended June 30, 2012
20
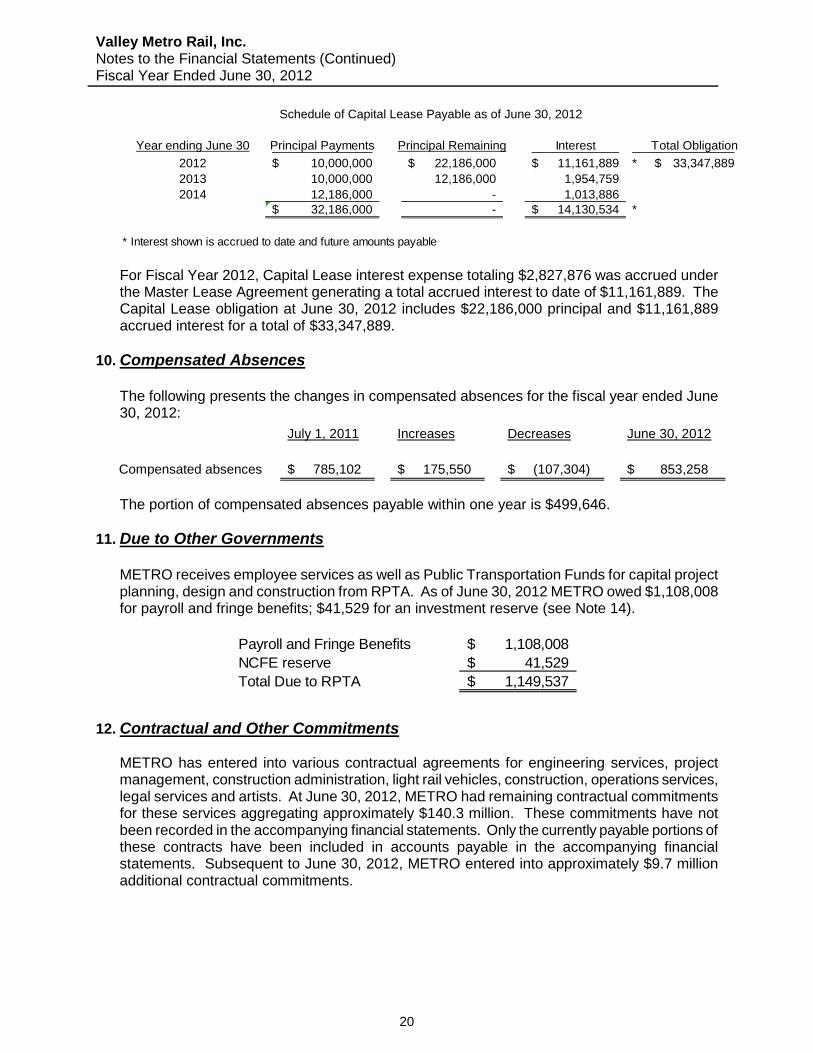
For Fiscal Year 2012, Capital Lease interest expense totaling $2,827,876 was accrued under the Master Lease Agreement generating a total accrued interest to date of $11,161,889. The Capital Lease obligation at June 30, 2012 includes $22,186,000 principal and $11,161,889 accrued interest for a total of $33,347,889.
10. Compensated Absences
The following presents the changes in compensated absences for the fiscal year ended June 30, 2012:
The portion of compensated absences payable within one year is $499,646. 11. Due to Other Governments
METRO receives employee services as well as Public Transportation Funds for capital project planning, design and construction from RPTA. As of June 30, 2012 METRO owed $1,108,008 for payroll and fringe benefits; $41,529 for an investment reserve (see Note 14).
12. Contractual and Other Commitments
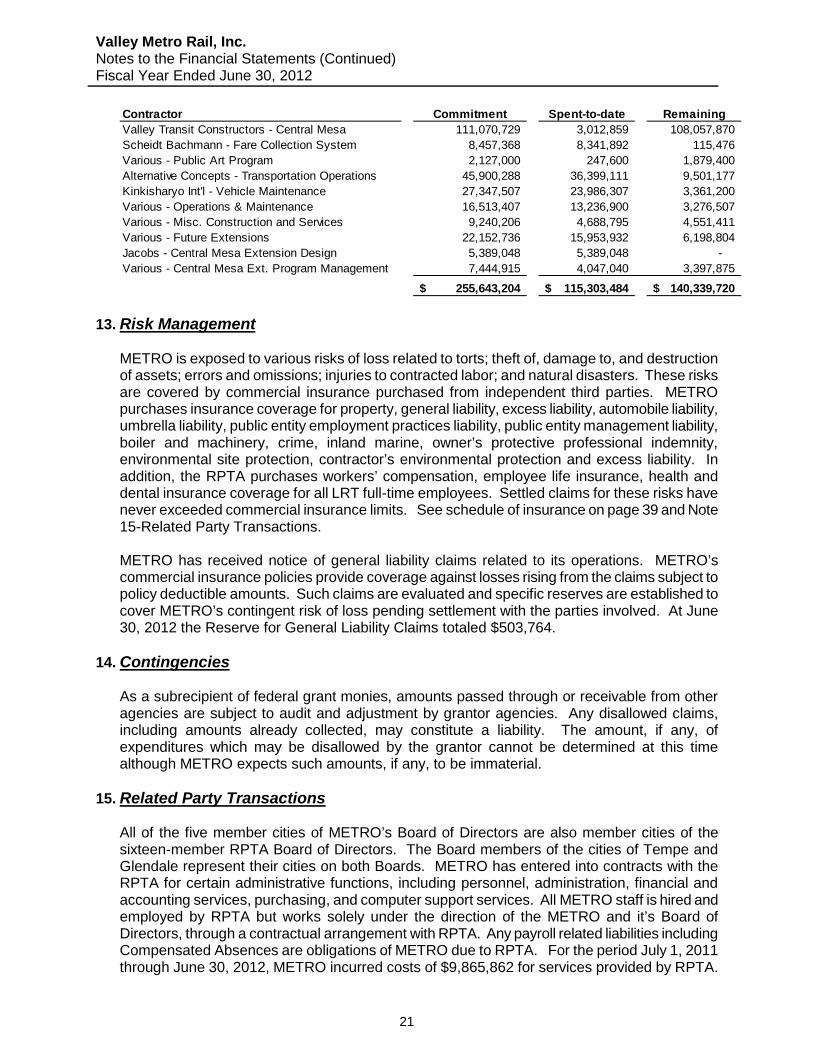
METRO has entered into various contractual agreements for engineering services, project management, construction administration, light rail vehicles, construction, operations services, legal services and artists. At June 30, 2012, METRO had remaining contractual commitments for these services aggregating approximately $140.3 million. These commitments have not been recorded in the accompanying financial statements. Only the currently payable portions of these contracts have been included in accounts payable in the accompanying financial statements. Subsequent to June 30, 2012, METRO entered into approximately $9.7 million additional contractual commitments.
Year ending June 30 Principal Payments Principal Remaining Interest Total Obligation2012 10,000,000$ 22,186,000$ 11,161,889$ * 33,347,889$ 2013 10,000,000 12,186,000 1,954,759 2014 12,186,000 - 1,013,886
32,186,000$ - 14,130,534$ *
* Interest shown is accrued to date and future amounts payable
Schedule of Capital Lease Payable as of June 30, 2012
Payroll and Fringe Benefits 1,108,008$ NCFE reserve 41,529$ Total Due to RPTA 1,149,537$
July 1, 2011 Increases Decreases June 30, 2012 Compensated absences $ 785,102 $ 175,550 $ (107,304) $ 853,258
Valley Metro Rail, Inc. Notes to the Financial Statements (Continued) Fiscal Year Ended June 30, 2012
21
13. Risk Management METRO is exposed to various risks of loss related to torts; theft of, damage to, and destruction of assets; errors and omissions; injuries to contracted labor; and natural disasters. These risks are covered by commercial insurance purchased from independent third parties. METRO purchases insurance coverage for property, general liability, excess liability, automobile liability, umbrella liability, public entity employment practices liability, public entity management liability, boiler and machinery, crime, inland marine, owner’s protective professional indemnity, environmental site protection, contractor’s environmental protection and excess liability. In addition, the RPTA purchases workers’ compensation, employee life insurance, health and dental insurance coverage for all LRT full-time employees. Settled claims for these risks have never exceeded commercial insurance limits. See schedule of insurance on page 39 and Note 15-Related Party Transactions. METRO has received notice of general liability claims related to its operations. METRO’s commercial insurance policies provide coverage against losses rising from the claims subject to policy deductible amounts. Such claims are evaluated and specific reserves are established to cover METRO’s contingent risk of loss pending settlement with the parties involved. At June 30, 2012 the Reserve for General Liability Claims totaled $503,764.
14. Contingencies As a subrecipient of federal grant monies, amounts passed through or receivable from other agencies are subject to audit and adjustment by grantor agencies. Any disallowed claims, including amounts already collected, may constitute a liability. The amount, if any, of expenditures which may be disallowed by the grantor cannot be determined at this time although METRO expects such amounts, if any, to be immaterial.
15. Related Party Transactions
All of the five member cities of METRO’s Board of Directors are also member cities of the sixteen-member RPTA Board of Directors. The Board members of the cities of Tempe and Glendale represent their cities on both Boards. METRO has entered into contracts with the RPTA for certain administrative functions, including personnel, administration, financial and accounting services, purchasing, and computer support services. All METRO staff is hired and employed by RPTA but works solely under the direction of the METRO and it’s Board of Directors, through a contractual arrangement with RPTA. Any payroll related liabilities including Compensated Absences are obligations of METRO due to RPTA. For the period July 1, 2011 through June 30, 2012, METRO incurred costs of $9,865,862 for services provided by RPTA.
Contractor Commitment Spent-to-date RemainingValley Transit Constructors - Central Mesa 111,070,729 3,012,859 108,057,870 Scheidt Bachmann - Fare Collection System 8,457,368 8,341,892 115,476 Various - Public Art Program 2,127,000 247,600 1,879,400 Alternative Concepts - Transportation Operations 45,900,288 36,399,111 9,501,177 Kinkisharyo Int'l - Vehicle Maintenance 27,347,507 23,986,307 3,361,200 Various - Operations & Maintenance 16,513,407 13,236,900 3,276,507 Various - Misc. Construction and Services 9,240,206 4,688,795 4,551,411 Various - Future Extensions 22,152,736 15,953,932 6,198,804 Jacobs - Central Mesa Extension Design 5,389,048 5,389,048 - Various - Central Mesa Ext. Program Management 7,444,915 4,047,040 3,397,875
255,643,204$ 115,303,484$ 140,339,720$

Valley Metro Rail, Inc. Notes to the Financial Statements (Continued) Fiscal Year Ended June 30, 2012
22
In September 2010, the METRO Board authorized the Chief Executive Officer (CEO) to enter into a sublease with the Regional Public Transportation Authority (RPTA) for a portion of the office space currently leased and occupied by METRO. Commencing in December 2010 and ending in June 2016, office space lease costs that METRO pays monthly to the landlord will be prorated and charged to RPTA based on square footage used by RPTA. The total sublease over the 66-month period is estimated to equal $3,167,304. As of June 30, 2012, the remaining lease payments under the sublease agreement total $2,345,153.
16. Arizona State Retirement System
Plan Description – METRO contributes to a cost-sharing multiple-employer defined benefit pension plan administered by the Arizona State Retirement System. Benefits are established by state statute and generally provide retirement, death, long-term disability, survivor, and health insurance premium benefits. The system is governed by the Arizona State Retirement System Board according to the provisions of A.R.S. Title 38, Chapter 5, Article 2. The System issues a comprehensive annual financial report that includes financial statements and required supplementary information. The most recent report may be obtained by writing the System, 3300 North Central Avenue, P.O. Box 33910, Phoenix, AZ 85067-3910 or by calling (602) 240-2000 or (800) 621-3778. Funding Policy - The Arizona State Legislature establishes and may amend active plan members' and the METRO’s contribution rate. For the year ended June 30, 2012, active plan members and METRO were each required by statute to contribute at the actuarially determined rate of 10.74 percent (9.85 percent retirement, 0.65 percent health plan, and 0.24 percent long-term disability) of the members' annual covered payroll. METRO’s contribution to the System for the year ended June 30, 2012 and 2011 was $700,325 and $542,211 respectively, which was equal to the required contributions for the year.
Schedule of Retirement and Long Term Disability Benefits Accrued
17. Public Transportation Funding
In November 2004, the voters of Maricopa County approved Proposition 400, the continuation of the transportation tax, for a twenty year period beginning in calendar year 2006. On August 14, 2006, METRO and RPTA executed an intergovernmental agreement (IGA) that formally designated METRO as Lead Agency to plan, design, and construct the light rail transit (LRT) program. Among other things, the IGA specifies that RPTA will reimburse METRO, from the Public Transportation Fund, for eligible incurred expenses.
Health Benefit Long-TermRetirement Supplement Disability Total
Years ended June 30, Fund Fund Fund Benefits2012 642,290$ 42,385$ 15,650$ 700,325$ 2011 495,971 32,478 13,762 542,211 2010 480,091 37,993 23,026 541,110
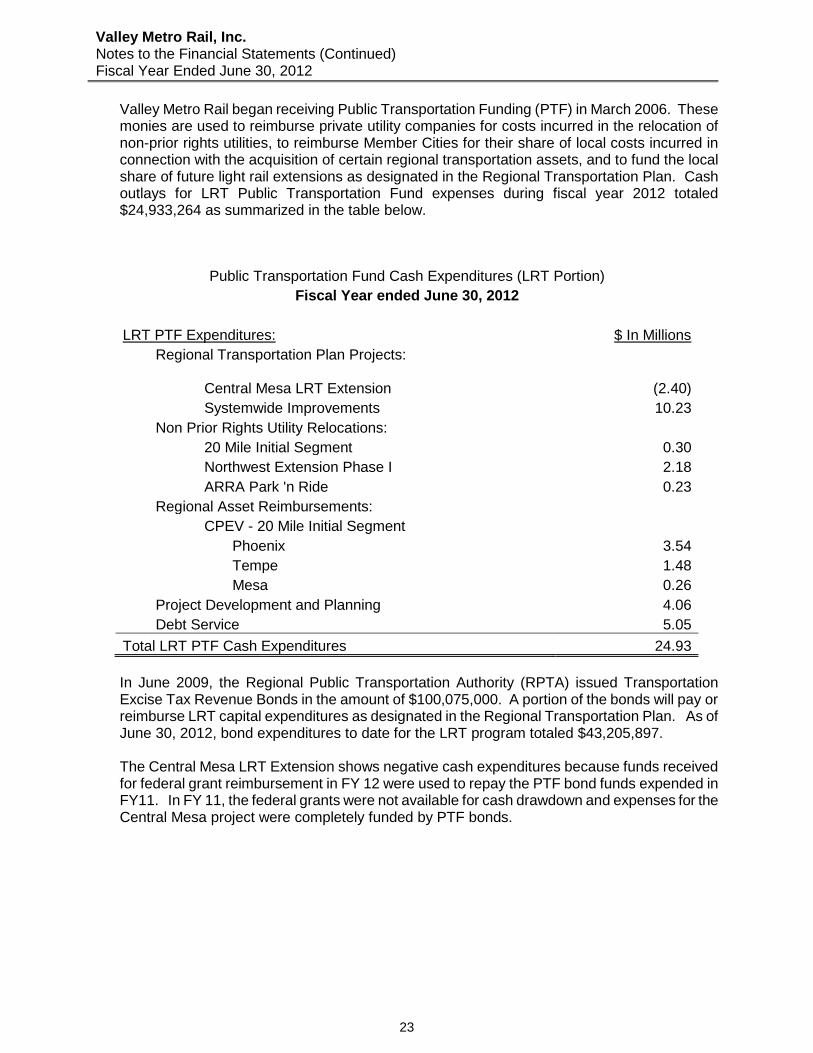
Valley Metro Rail, Inc. Notes to the Financial Statements (Continued) Fiscal Year Ended June 30, 2012
23
Valley Metro Rail began receiving Public Transportation Funding (PTF) in March 2006. These monies are used to reimburse private utility companies for costs incurred in the relocation of non-prior rights utilities, to reimburse Member Cities for their share of local costs incurred in connection with the acquisition of certain regional transportation assets, and to fund the local share of future light rail extensions as designated in the Regional Transportation Plan. Cash outlays for LRT Public Transportation Fund expenses during fiscal year 2012 totaled $24,933,264 as summarized in the table below.
Public Transportation Fund Cash Expenditures (LRT Portion) Fiscal Year ended June 30, 2012
LRT PTF Expenditures: $ In Millions
Regional Transportation Plan Projects:
Central Mesa LRT Extension
(2.40)
Systemwide Improvements 10.23
Non Prior Rights Utility Relocations:
20 Mile Initial Segment 0.30
Northwest Extension Phase I 2.18
ARRA Park 'n Ride 0.23
Regional Asset Reimbursements:
CPEV - 20 Mile Initial Segment
Phoenix 3.54
Tempe 1.48
Mesa 0.26
Project Development and Planning 4.06
Debt Service 5.05
Total LRT PTF Cash Expenditures 24.93 In June 2009, the Regional Public Transportation Authority (RPTA) issued Transportation Excise Tax Revenue Bonds in the amount of $100,075,000. A portion of the bonds will pay or reimburse LRT capital expenditures as designated in the Regional Transportation Plan. As of June 30, 2012, bond expenditures to date for the LRT program totaled $43,205,897. The Central Mesa LRT Extension shows negative cash expenditures because funds received for federal grant reimbursement in FY 12 were used to repay the PTF bond funds expended in FY11. In FY 11, the federal grants were not available for cash drawdown and expenses for the Central Mesa project were completely funded by PTF bonds.

OTHER SUPPLEMENTARY INFORMATION This Section includes the Schedule of Operations – Budget and Actual.
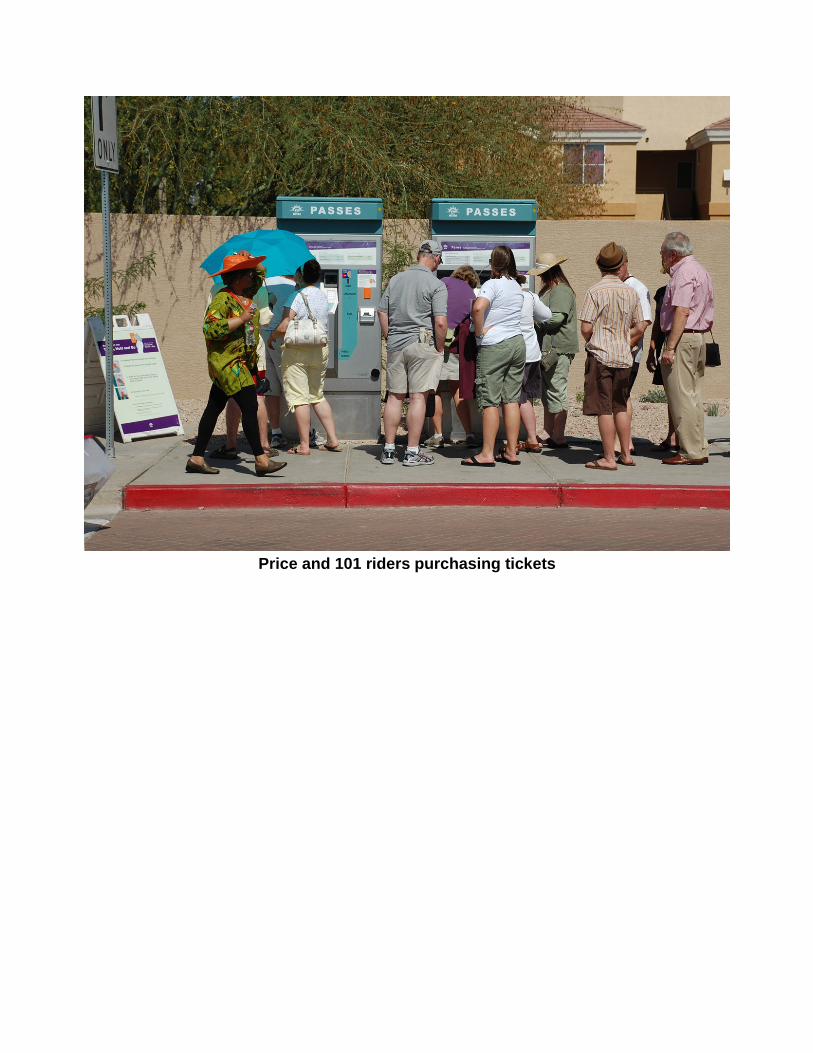
Price and 101 riders purchasing tickets
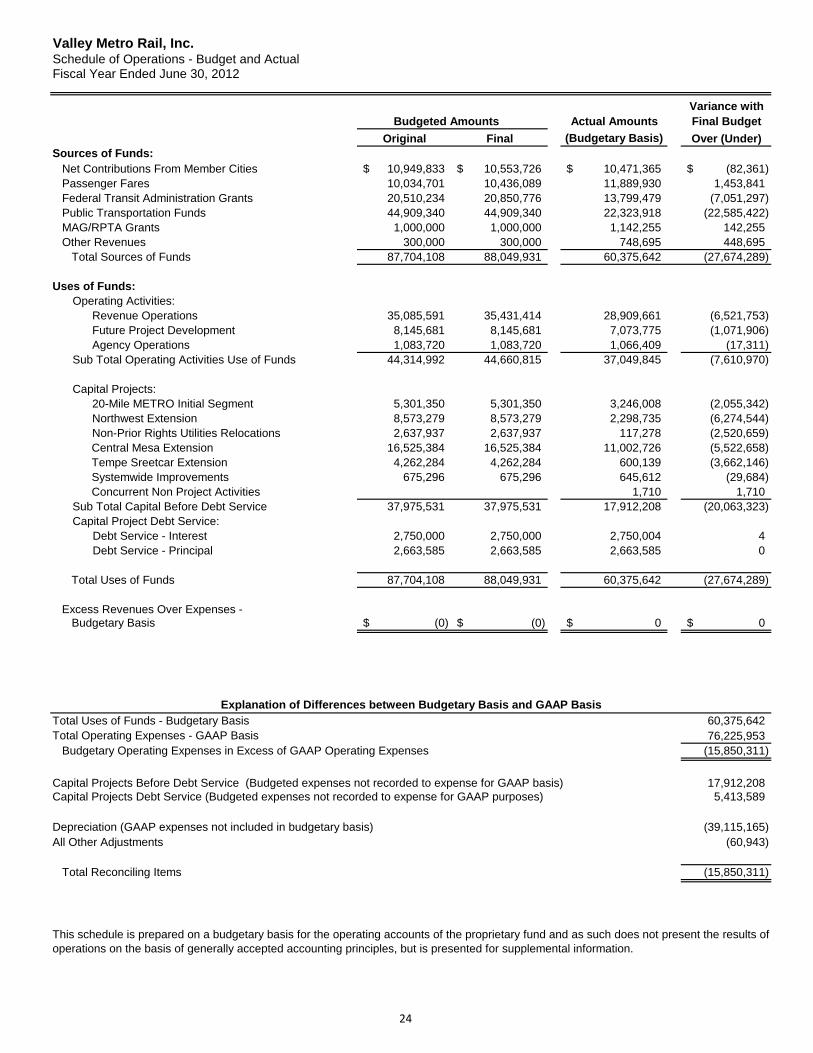
24
Valley Metro Rail, Inc.Schedule of Operations - Budget and ActualFiscal Year Ended June 30, 2012
Variance withBudgeted Amounts Actual Amounts Final Budget
Original Final (Budgetary Basis) Over (Under)Sources of Funds: Net Contributions From Member Cities 10,949,833$ 10,553,726$ 10,471,365$ (82,361)$ Passenger Fares 10,034,701 10,436,089 11,889,930 1,453,841 Federal Transit Administration Grants 20,510,234 20,850,776 13,799,479 (7,051,297) Public Transportation Funds 44,909,340 44,909,340 22,323,918 (22,585,422) MAG/RPTA Grants 1,000,000 1,000,000 1,142,255 142,255 Other Revenues 300,000 300,000 748,695 448,695 Total Sources of Funds 87,704,108 88,049,931 60,375,642 (27,674,289) Uses of Funds:
Operating Activities: Revenue Operations 35,085,591 35,431,414 28,909,661 (6,521,753) Future Project Development 8,145,681 8,145,681 7,073,775 (1,071,906) Agency Operations 1,083,720 1,083,720 1,066,409 (17,311)
Sub Total Operating Activities Use of Funds 44,314,992 44,660,815 37,049,845 (7,610,970)
Capital Projects: 20-Mile METRO Initial Segment 5,301,350 5,301,350 3,246,008 (2,055,342) Northwest Extension 8,573,279 8,573,279 2,298,735 (6,274,544) Non-Prior Rights Utilities Relocations 2,637,937 2,637,937 117,278 (2,520,659)
Central Mesa Extension 16,525,384 16,525,384 11,002,726 (5,522,658) Tempe Sreetcar Extension 4,262,284 4,262,284 600,139 (3,662,146) Systemwide Improvements 675,296 675,296 645,612 (29,684) Concurrent Non Project Activities 1,710 1,710 Sub Total Capital Before Debt Service 37,975,531 37,975,531 17,912,208 (20,063,323) Capital Project Debt Service:
Debt Service - Interest 2,750,000 2,750,000 2,750,004 4 Debt Service - Principal 2,663,585 2,663,585 2,663,585 0
Total Uses of Funds 87,704,108 88,049,931 60,375,642 (27,674,289)
Excess Revenues Over Expenses - Budgetary Basis (0)$ (0)$ 0$ 0$
Total Uses of Funds - Budgetary Basis 60,375,642 76,225,953
Budgetary Operating Expenses in Excess of GAAP Operating Expenses (15,850,311)
Capital Projects Before Debt Service (Budgeted expenses not recorded to expense for GAAP basis) 17,912,208 Capital Projects Debt Service (Budgeted expenses not recorded to expense for GAAP purposes) 5,413,589
Depreciation (GAAP expenses not included in budgetary basis) (39,115,165) All Other Adjustments (60,943)
Total Reconciling Items (15,850,311)
Explanation of Differences between Budgetary Basis and GAAP Basis
Total Operating Expenses - GAAP Basis
This schedule is prepared on a budgetary basis for the operating accounts of the proprietary fund and as such does not present the results ofoperations on the basis of generally accepted accounting principles, but is presented for supplemental information.

Regular passengers and visitors enjoy riding through a unique blend of urban and desert landscape
STATISTICAL SECTION The Statistical Section includes selected financial and demographic information regarding METRO, including financial trends, revenue capacity, demographic and economic information, and operating
information.

25
Statistical SectionComprehensive Annual Financial ReportFiscal Year Ended June 30, 2012
This part of METRO's comprehensive financial report presents information as a context forunderstanding what the information in the financial statements, footnotes, andsupplementary information says about METRO's overall financial condition. METRO'sprinicipal activities consist of planning, designing, constructing and operating the light railtransit system in Maricopa County, Arizona.
Contents Page
Financial Trends 26These schedules contain trend information to help the reader understand how METRO'sfinancial performance and well-being have changed over time.
Revenue Capacity N/AMETRO's principal source of operating revenues are contributions from Member Cities.With repect to capital projects, METRO receives federal grants and utilizes PublicTransportation Funds administered by the Regional Public Transportation Authority(RPTA). (Refer to Note 17 in the Notes to the Financial Statements section.)
Debt Capacity N/AMETRO has no current bond indebtedness. See Notes to the Financial Statements; referto Note number 17, Public Transportation Funding for information regarding revenue bondsissued by RPTA which provide funding for LRT capital expenditures. Refer to Notenumber 9, Capital Lease Obligation for information related to METRO's current debtobligations.
Demographic and Economic Information 28These schedules offer demographic and economic indicators to help the reader understandthe environment within which METRO's financial activities take place.
Operating Information 34These schedules contain service and infrastructure data to help the reader understand howthe information in METRO's financial report relates to the services METRO provides andthe activities it performs.
Sources: Unless otherwise noted, the information in these schedules is derived from thecomprehensive annual financial reports for the relevant year. METRO's first financialreporting as a separate entity was for the intial period ended June 30, 2003.
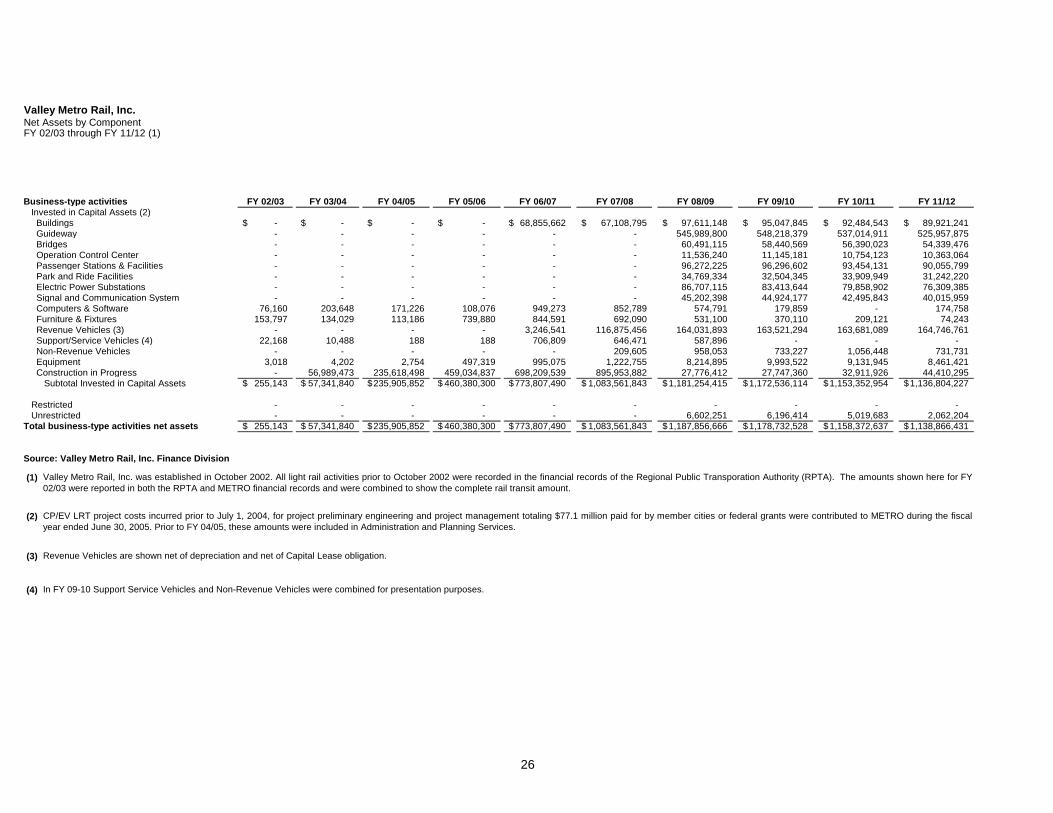
26
Business-type activities FY 02/03 FY 03/04 FY 04/05 FY 05/06 FY 06/07 FY 07/08 FY 08/09 FY 09/10 FY 10/11 FY 11/12 Invested in Capital Assets (2) Buildings -$ -$ -$ -$ 68,855,662$ 67,108,795$ 97,611,148$ 95,047,845$ 92,484,543$ 89,921,241$ Guideway - - - - - - 545,989,800 548,218,379 537,014,911 525,957,875 Bridges - - - - - - 60,491,115 58,440,569 56,390,023 54,339,476 Operation Control Center - - - - - - 11,536,240 11,145,181 10,754,123 10,363,064 Passenger Stations & Facilities - - - - - - 96,272,225 96,296,602 93,454,131 90,055,799 Park and Ride Facilities - - - - - - 34,769,334 32,504,345 33,909,949 31,242,220 Electric Power Substations - - - - - - 86,707,115 83,413,644 79,858,902 76,309,385 Signal and Communication System - - - - - - 45,202,398 44,924,177 42,495,843 40,015,959 Computers & Software 76,160 203,648 171,226 108,076 949,273 852,789 574,791 179,859 - 174,758 Furniture & Fixtures 153,797 134,029 113,186 739,880 844,591 692,090 531,100 370,110 209,121 74,243 Revenue Vehicles (3) - - - - 3,246,541 116,875,456 164,031,893 163,521,294 163,681,089 164,746,761 Support/Service Vehicles (4) 22,168 10,488 188 188 706,809 646,471 587,896 - - - Non-Revenue Vehicles - - - - - 209,605 958,053 733,227 1,056,448 731,731 Equipment 3,018 4,202 2,754 497,319 995,075 1,222,755 8,214,895 9,993,522 9,131,945 8,461,421 Construction in Progress - 56,989,473 235,618,498 459,034,837 698,209,539 895,953,882 27,776,412 27,747,360 32,911,926 44,410,295 Subtotal Invested in Capital Assets 255,143$ 57,341,840$ 235,905,852$ 460,380,300$ 773,807,490$ 1,083,561,843$ 1,181,254,415$ 1,172,536,114$ 1,153,352,954$ 1,136,804,227$
Restricted - - - - - - - - - - Unrestricted - - - - - - 6,602,251 6,196,414 5,019,683 2,062,204 Total business-type activities net assets 255,143$ 57,341,840$ 235,905,852$ 460,380,300$ 773,807,490$ 1,083,561,843$ 1,187,856,666$ 1,178,732,528$ 1,158,372,637$ 1,138,866,431$
Source: Valley Metro Rail, Inc. Finance Division
(1)
(2)
(3)
(4) In FY 09-10 Support Service Vehicles and Non-Revenue Vehicles were combined for presentation purposes.
Valley Metro Rail, Inc.Net Assets by ComponentFY 02/03 through FY 11/12 (1)
Valley Metro Rail, Inc. was established in October 2002. All light rail activities prior to October 2002 were recorded in the financial records of the Regional Public Transporation Authority (RPTA). The amounts shown here for FY02/03 were reported in both the RPTA and METRO financial records and were combined to show the complete rail transit amount.
CP/EV LRT project costs incurred prior to July 1, 2004, for project preliminary engineering and project management totaling $77.1 million paid for by member cities or federal grants were contributed to METRO during the fiscalyear ended June 30, 2005. Prior to FY 04/05, these amounts were included in Administration and Planning Services.
Revenue Vehicles are shown net of depreciation and net of Capital Lease obligation.
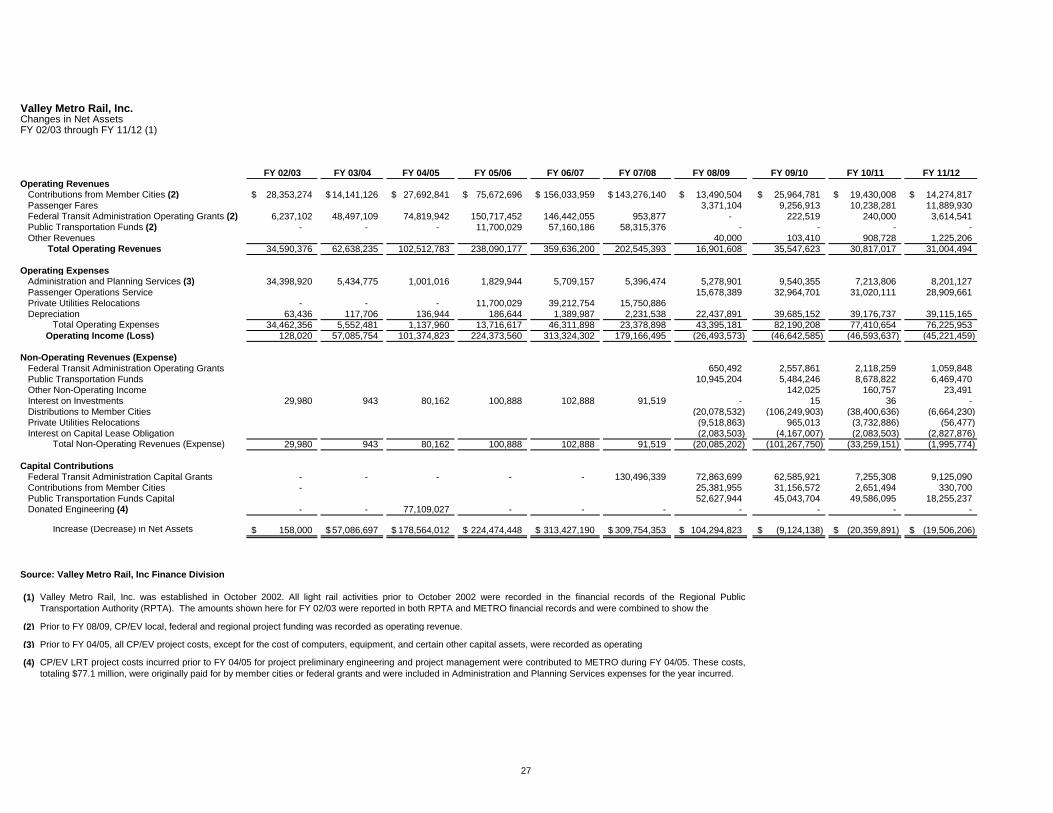
27
FY 02/03 FY 03/04 FY 04/05 FY 05/06 FY 06/07 FY 07/08 FY 08/09 FY 09/10 FY 10/11 FY 11/12Operating Revenues Contributions from Member Cities (2) 28,353,274$ 14,141,126$ 27,692,841$ 75,672,696$ 156,033,959$ 143,276,140$ 13,490,504$ 25,964,781$ 19,430,008$ 14,274,817$ Passenger Fares 3,371,104 9,256,913 10,238,281 11,889,930 Federal Transit Administration Operating Grants (2) 6,237,102 48,497,109 74,819,942 150,717,452 146,442,055 953,877 - 222,519 240,000 3,614,541 Public Transportation Funds (2) - - - 11,700,029 57,160,186 58,315,376 - - - - Other Revenues 40,000 103,410 908,728 1,225,206
Total Operating Revenues 34,590,376 62,638,235 102,512,783 238,090,177 359,636,200 202,545,393 16,901,608 35,547,623 30,817,017 31,004,494
Operating Expenses Administration and Planning Services (3) 34,398,920 5,434,775 1,001,016 1,829,944 5,709,157 5,396,474 5,278,901 9,540,355 7,213,806 8,201,127 Passenger Operations Service 15,678,389 32,964,701 31,020,111 28,909,661 Private Utilities Relocations - - - 11,700,029 39,212,754 15,750,886 Depreciation 63,436 117,706 136,944 186,644 1,389,987 2,231,538 22,437,891 39,685,152 39,176,737 39,115,165
Total Operating Expenses 34,462,356 5,552,481 1,137,960 13,716,617 46,311,898 23,378,898 43,395,181 82,190,208 77,410,654 76,225,953 Operating Income (Loss) 128,020 57,085,754 101,374,823 224,373,560 313,324,302 179,166,495 (26,493,573) (46,642,585) (46,593,637) (45,221,459)
Non-Operating Revenues (Expense) Federal Transit Administration Operating Grants 650,492 2,557,861 2,118,259 1,059,848 Public Transportation Funds 10,945,204 5,484,246 8,678,822 6,469,470 Other Non-Operating Income 142,025 160,757 23,491 Interest on Investments 29,980 943 80,162 100,888 102,888 91,519 - 15 36 - Distributions to Member Cities (20,078,532) (106,249,903) (38,400,636) (6,664,230) Private Utilities Relocations (9,518,863) 965,013 (3,732,886) (56,477) Interest on Capital Lease Obligation (2,083,503) (4,167,007) (2,083,503) (2,827,876)
Total Non-Operating Revenues (Expense) 29,980 943 80,162 100,888 102,888 91,519 (20,085,202) (101,267,750) (33,259,151) (1,995,774)
Capital Contributions Federal Transit Administration Capital Grants - - - - - 130,496,339 72,863,699 62,585,921 7,255,308 9,125,090 Contributions from Member Cities - 25,381,955 31,156,572 2,651,494 330,700 Public Transportation Funds Capital 52,627,944 45,043,704 49,586,095 18,255,237 Donated Engineering (4) - - 77,109,027 - - - - - - -
Increase (Decrease) in Net Assets 158,000$ 57,086,697$ 178,564,012$ 224,474,448$ 313,427,190$ 309,754,353$ 104,294,823$ (9,124,138)$ (20,359,891)$ (19,506,206)$
Source: Valley Metro Rail, Inc Finance Division
(1)
(2)
(3)
(4) CP/EV LRT project costs incurred prior to FY 04/05 for project preliminary engineering and project management were contributed to METRO during FY 04/05. These costs,totaling $77.1 million, were originally paid for by member cities or federal grants and were included in Administration and Planning Services expenses for the year incurred.
Valley Metro Rail, Inc.Changes in Net AssetsFY 02/03 through FY 11/12 (1)
Prior to FY 04/05, all CP/EV project costs, except for the cost of computers, equipment, and certain other capital assets, were recorded as operating
Valley Metro Rail, Inc. was established in October 2002. All light rail activities prior to October 2002 were recorded in the financial records of the Regional PublicTransportation Authority (RPTA). The amounts shown here for FY 02/03 were reported in both RPTA and METRO financial records and were combined to show the
Prior to FY 08/09, CP/EV local, federal and regional project funding was recorded as operating revenue.
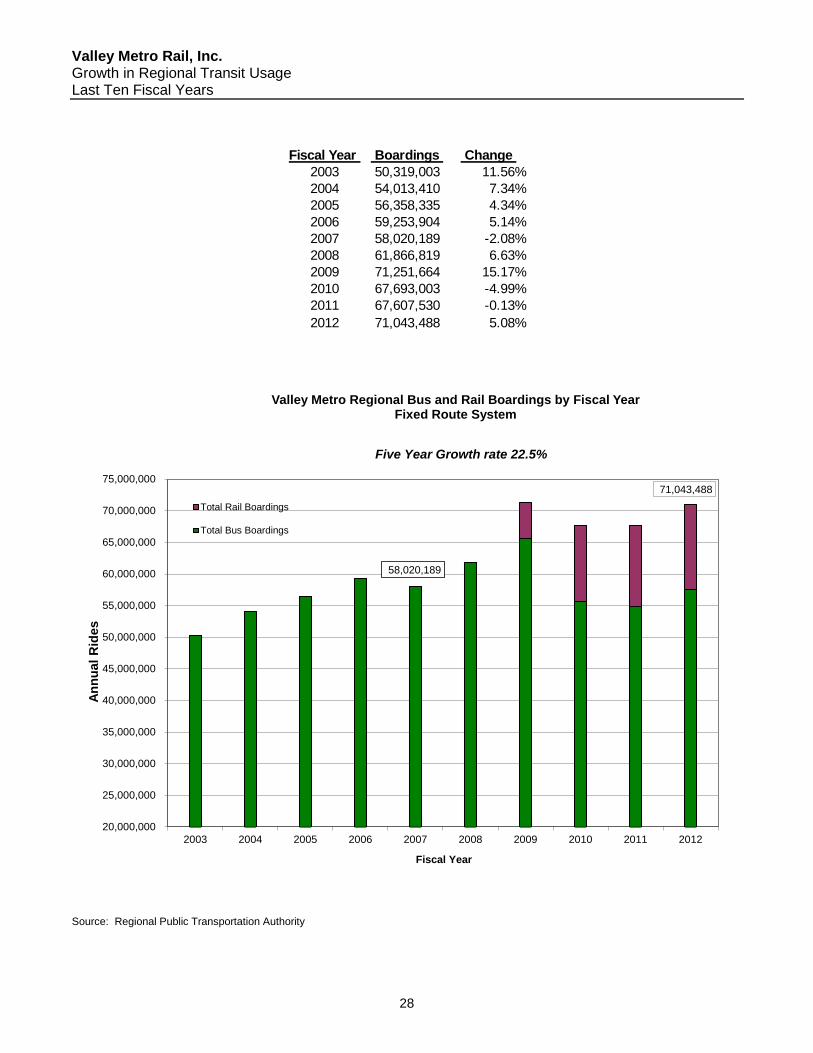
Valley Metro Rail, Inc. Growth in Regional Transit Usage Last Ten Fiscal Years
28
Source: Regional Public Transportation Authority
Fiscal Year Boardings Change 2003 50,319,003 11.56%2004 54,013,410 7.34%2005 56,358,335 4.34%2006 59,253,904 5.14%2007 58,020,189 -2.08%2008 61,866,819 6.63%2009 71,251,664 15.17%2010 67,693,003 -4.99%2011 67,607,530 -0.13%2012 71,043,488 5.08%
58,020,189
71,043,488
20,000,000
25,000,000
30,000,000
35,000,000
40,000,000
45,000,000
50,000,000
55,000,000
60,000,000
65,000,000
70,000,000
75,000,000
2003 2004 2005 2006 2007 2008 2009 2010 2011 2012
Annu
al R
ides
Fiscal Year
Valley Metro Regional Bus and Rail Boardings by Fiscal YearFixed Route System
Total Rail Boardings
Total Bus Boardings
Five Year Growth rate 22.5%

Valley Metro Rail, Inc. Population Growth Ten Years from 2001 to 2010
29
Year Chandler Glendale Mesa Phoenix Tempe
2001 189,498 218,812 420,525 1,352,394 158,625
2002 201,263 227,614 431,874 1,375,906 159,425
2003 211,984 231,288 434,585 1,455,440 159,426
2004 224,644 233,000 445,354 1,492,420 159,615
2005 238,930 235,987 451,223 1,525,400 160,820
2006 241,910 235,987 455,151 1,560,380 165,796
2007 247,100 246,382 460,155 1,595,260 166,625
2008 247,100 248,731 463,397 1,630,340 167,458
2009 244,376 248,435 459,682 1,561,485 172,641
2010 236,123 226,721 439,041 1,445,632 161,719
Source: Maricopa Association of Governments
-
200,000
400,000
600,000
800,000
1,000,000
1,200,000
1,400,000
1,600,000
1,800,000
2001 2002 2003 2004 2005 2006 2007 2008 2009 2010
Popu
latio
n
For the Years 2001 through 2010
Valley Metro Rail, Inc. Member Cities' Population Growth
Chandler Glendale Mesa Phoenix Tempe

30
Valley Metro Rail, Inc.Top Employers in Maricopa CountyFor the Years 2011 and 2002
Employer Employees Rank % of Total Employees Rank % of Total
State of Arizona 24,200 1 1.50% 59,348 1 3.82%Banner Health Systems 23,100 2 1.43% 13,973 4 0.90%Wal-Mart Stores, Inc. 15,000 3 0.93% 13,800 6 0.89%City of Phoenix 13,500 4 0.84% 12,917 7 0.83%Maricopa County 13,500 5 0.84% 13,860 5 0.89%Frys Food Stores 12,600 6 0.78% 9,837 8 0.63%Bank of America 12,000 7 0.74%Wells Fargo & Company 10,100 8 0.63%Intel Corporation 10,100 9 0.63%Honeywell 8,800 10 0.54% 17,500 2 1.13%Motorola 15,500 3 1.00%US Postal Service - Arizona District 9,756 9 0.63%Raytheon Missile Systems 9,700 10 0.62%
Total for Principal Employers 142,900 8.85% 176,191 11.34%
Total Employment in Maricopa Cty 1,615,100 1,552,400
Source: Maricopa County Association of Governments, Employer Database (2011)
2011 2002
Phoenix Business Journal Book of Lists Arizona Department of Administration, Current Employment Statistics (CES)
24.2
23.1
15.0 13.5 13.5
12.6
12.0
10.1 10.1 8.8
2011 - Employees (000s)
State of Arizona Banner Health Systems Wal-Mart Stores, Inc. City of Phoenix
Maricopa County Frys Food Stores Bank of America Wells Fargo & Company
Intel Corporation Honeywell
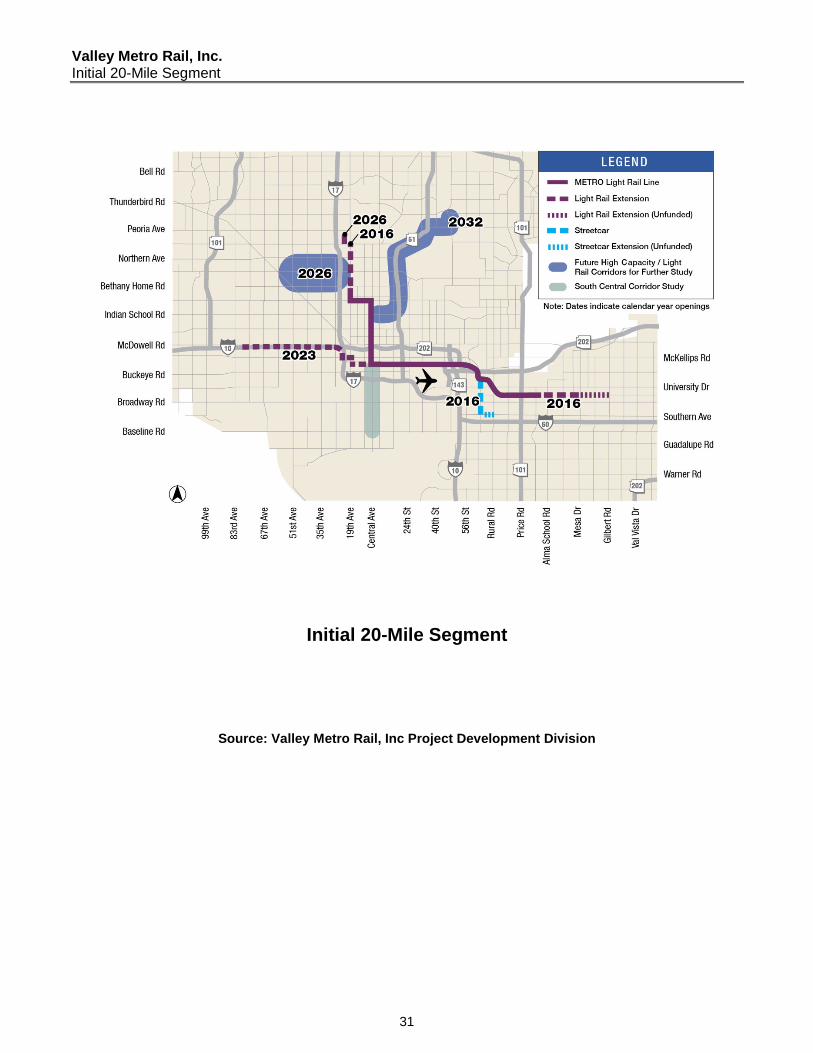
Valley Metro Rail, Inc. Initial 20-Mile Segment
31
Initial 20-Mile Segment
Source: Valley Metro Rail, Inc Project Development Division
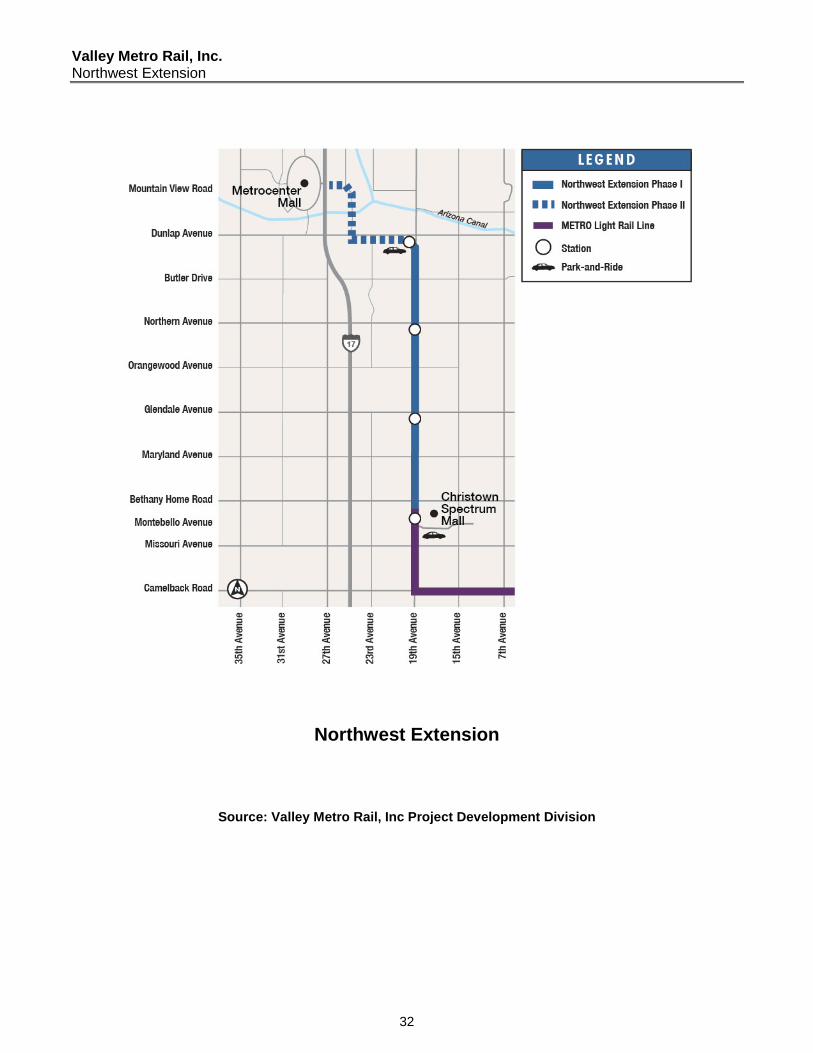
Valley Metro Rail, Inc. Northwest Extension
32
Northwest Extension
Source: Valley Metro Rail, Inc Project Development Division
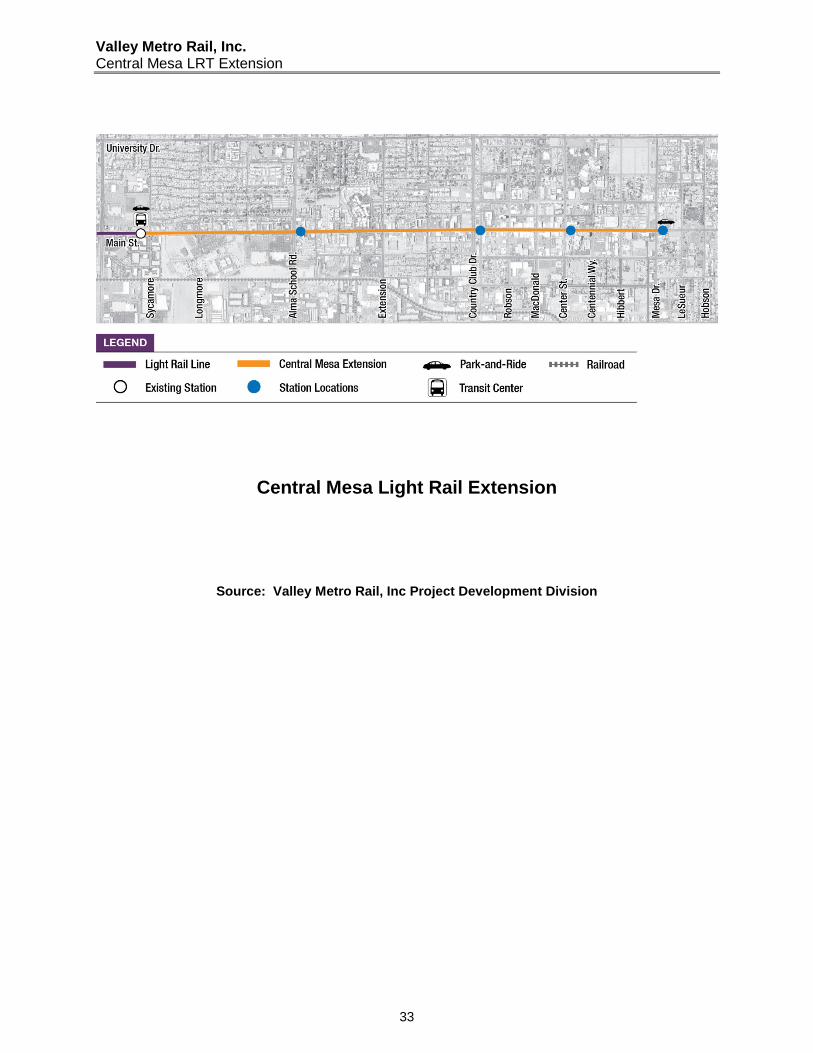
Valley Metro Rail, Inc. Central Mesa LRT Extension
33
Central Mesa Light Rail Extension
Source: Valley Metro Rail, Inc Project Development Division

Valley Metro Rail, Inc. Tempe Streetcar
34
Tempe Streetcar
Source: Valley Metro Rail, Inc Project Development Division

35
Grade RPTA Position Titles FY 2009 FY 2010 FY 2011 FY 2012
I Cleaner 0 0 0 11
III Administrative Support Assistant 1 1 1 1LRV Yard Operator 0 0 0 2Store Clerk 0 0 0 2
IV Accounting Technician 1 1 1 1Administrative Assistant 6 6 6 8Lead Document Control Clerk 1 1 1 1LRV Inspector 0 0 0 8Materials Handler 1 1 1 1
VI LRV Maintenance Technician I 0 0 0 6Paralegal 1 1 1 1Track Maintainer 6 6 6 6
VII Accountant I 1 2 2 2Executive Assistant 2 2 2 2Help Desk Support Specialist 0 0 0 1LRV Maintenance Technician II 0 0 0 11Network Support Analyst 1 0 0 0Signal & Comm Systems Maintainer 6 6 6 6Utility Relocation Specialist 1 1 1 1Vehicle Parts Coordinator 0 0 0 1
VIII Engineering Technician 0 1 1 1Executive Administrative Coordinator 1 1 1 1Information Technology Systems Specialist 1 1 1 1LRV Lead Maintenance Technician 0 0 0 3Maintenance Scheduling 1 1 0 0Materials/Warranty Coordinator 2 2 2 2Sr Communications Specialist 1 0 0 0Signal & Communications Syst Tech 4 4 4 7Traction Power Systems Technician 9 10 10 10
IX Accountant II 1 1 0 0Area Coordinator 2 2 2 2Budget Analyst 1 1Contract Administrator 1 1 1 1LRV Maintenance Supervisor 0 0 0 3Network Systems Engineer 1 1 1 1Planner II 2 1 1 1Supervisor, Facility Maintenance 1 1 1 1Supervisor, Track Maintenance 1 1 1 1
X Engineer (Civil) 0 1 1 1Lead Technician 1 0 0 0Planner III 0 2 2 2Program Control Specialist 1 1 1 1Senior Contract Administrator 2 2 2 2Signals/Communications Maintenance Supervisor 1 1 1 1TES Supervisor 1 2 2 2
Valley Metro Rail, IncFull-Time Equivalent Positions
Source: Valley Metro Rail, Inc Finance and Administration Division
Authorized FTEs
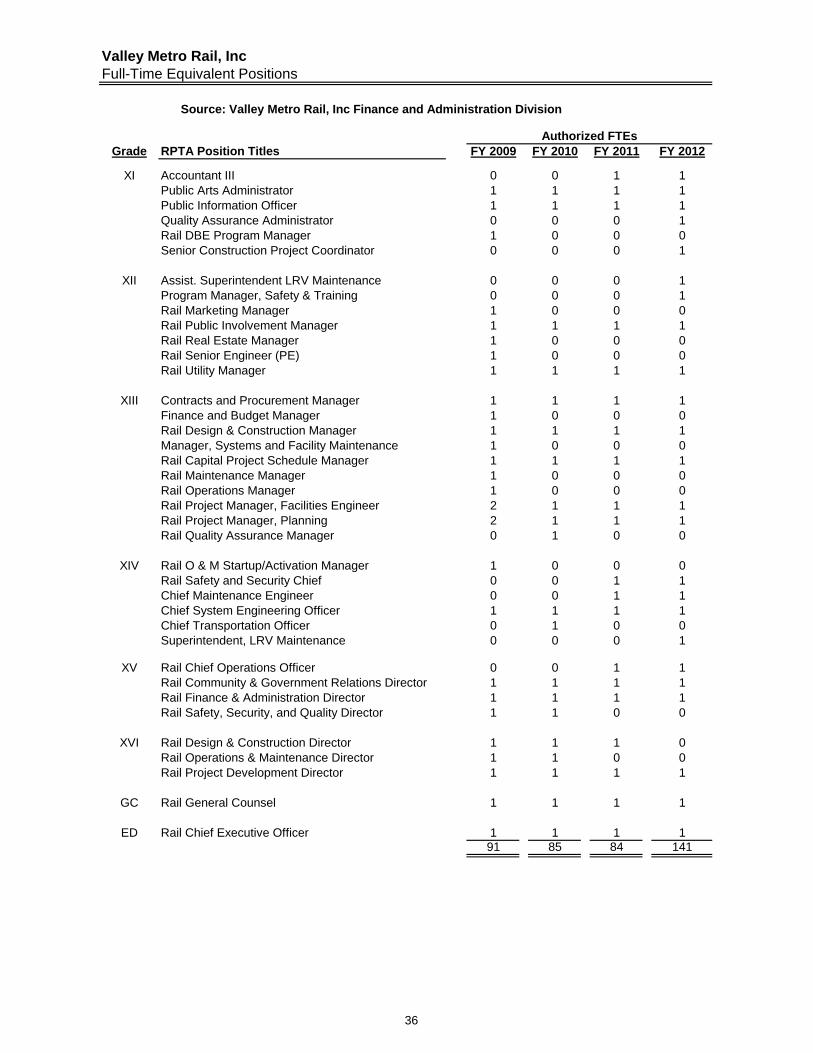
36
Grade RPTA Position Titles FY 2009 FY 2010 FY 2011 FY 2012
Valley Metro Rail, IncFull-Time Equivalent Positions
Source: Valley Metro Rail, Inc Finance and Administration Division
Authorized FTEs
XI Accountant III 0 0 1 1Public Arts Administrator 1 1 1 1Public Information Officer 1 1 1 1Quality Assurance Administrator 0 0 0 1Rail DBE Program Manager 1 0 0 0Senior Construction Project Coordinator 0 0 0 1
XII Assist. Superintendent LRV Maintenance 0 0 0 1Program Manager, Safety & Training 0 0 0 1Rail Marketing Manager 1 0 0 0Rail Public Involvement Manager 1 1 1 1Rail Real Estate Manager 1 0 0 0Rail Senior Engineer (PE) 1 0 0 0Rail Utility Manager 1 1 1 1
XIII Contracts and Procurement Manager 1 1 1 1Finance and Budget Manager 1 0 0 0Rail Design & Construction Manager 1 1 1 1Manager, Systems and Facility Maintenance 1 0 0 0Rail Capital Project Schedule Manager 1 1 1 1Rail Maintenance Manager 1 0 0 0Rail Operations Manager 1 0 0 0Rail Project Manager, Facilities Engineer 2 1 1 1Rail Project Manager, Planning 2 1 1 1Rail Quality Assurance Manager 0 1 0 0
XIV Rail O & M Startup/Activation Manager 1 0 0 0Rail Safety and Security Chief 0 0 1 1Chief Maintenance Engineer 0 0 1 1Chief System Engineering Officer 1 1 1 1Chief Transportation Officer 0 1 0 0Superintendent, LRV Maintenance 0 0 0 1
XV Rail Chief Operations Officer 0 0 1 1Rail Community & Government Relations Director 1 1 1 1Rail Finance & Administration Director 1 1 1 1Rail Safety, Security, and Quality Director 1 1 0 0
XVI Rail Design & Construction Director 1 1 1 0Rail Operations & Maintenance Director 1 1 0 0Rail Project Development Director 1 1 1 1
GC Rail General Counsel 1 1 1 1
ED Rail Chief Executive Officer 1 1 1 191 85 84 141
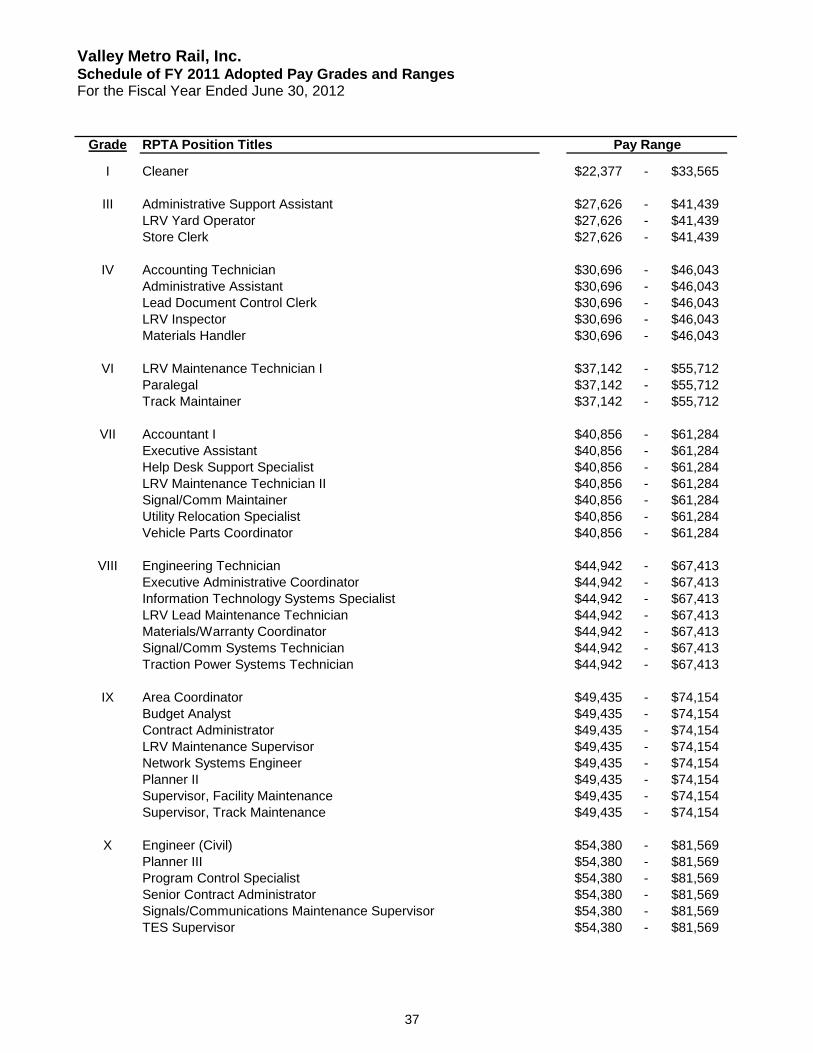
37
Valley Metro Rail, Inc.Schedule of FY 2011 Adopted Pay Grades and RangesFor the Fiscal Year Ended June 30, 2012
Grade RPTA Position Titles
I Cleaner $22,377 - $33,565
III Administrative Support Assistant $27,626 - $41,439LRV Yard Operator $27,626 - $41,439Store Clerk $27,626 - $41,439
IV Accounting Technician $30,696 - $46,043Administrative Assistant $30,696 - $46,043Lead Document Control Clerk $30,696 - $46,043LRV Inspector $30,696 - $46,043Materials Handler $30,696 - $46,043
VI LRV Maintenance Technician I $37,142 - $55,712Paralegal $37,142 - $55,712Track Maintainer $37,142 - $55,712
VII Accountant I $40,856 - $61,284Executive Assistant $40,856 - $61,284Help Desk Support Specialist $40,856 - $61,284LRV Maintenance Technician II $40,856 - $61,284Signal/Comm Maintainer $40,856 - $61,284Utility Relocation Specialist $40,856 - $61,284Vehicle Parts Coordinator $40,856 - $61,284
VIII Engineering Technician $44,942 - $67,413Executive Administrative Coordinator $44,942 - $67,413Information Technology Systems Specialist $44,942 - $67,413LRV Lead Maintenance Technician $44,942 - $67,413Materials/Warranty Coordinator $44,942 - $67,413Signal/Comm Systems Technician $44,942 - $67,413Traction Power Systems Technician $44,942 - $67,413
IX Area Coordinator $49,435 - $74,154Budget Analyst $49,435 - $74,154Contract Administrator $49,435 - $74,154LRV Maintenance Supervisor $49,435 - $74,154Network Systems Engineer $49,435 - $74,154Planner II $49,435 - $74,154Supervisor, Facility Maintenance $49,435 - $74,154Supervisor, Track Maintenance $49,435 - $74,154
X Engineer (Civil) $54,380 - $81,569Planner III $54,380 - $81,569Program Control Specialist $54,380 - $81,569Senior Contract Administrator $54,380 - $81,569Signals/Communications Maintenance Supervisor $54,380 - $81,569TES Supervisor $54,380 - $81,569
Pay Range
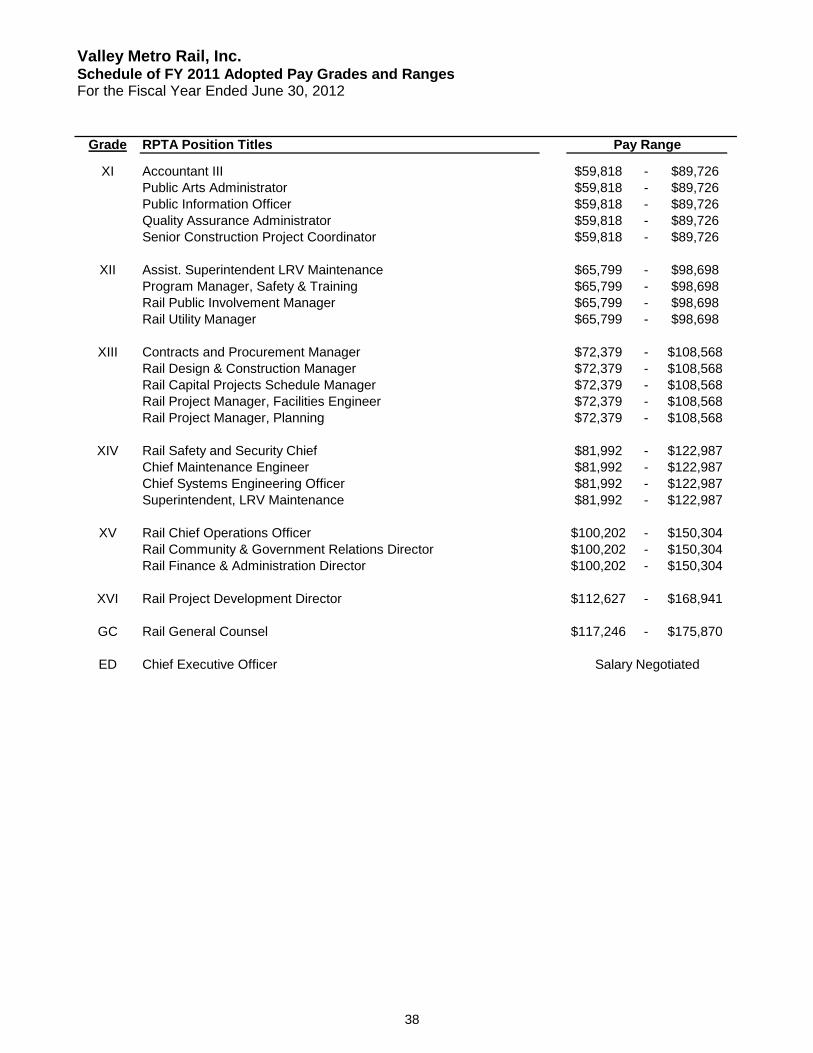
38
Valley Metro Rail, Inc.Schedule of FY 2011 Adopted Pay Grades and RangesFor the Fiscal Year Ended June 30, 2012
Grade RPTA Position Titles Pay Range
XI Accountant III $59,818 - $89,726Public Arts Administrator $59,818 - $89,726Public Information Officer $59,818 - $89,726Quality Assurance Administrator $59,818 - $89,726Senior Construction Project Coordinator $59,818 - $89,726
XII Assist. Superintendent LRV Maintenance $65,799 - $98,698Program Manager, Safety & Training $65,799 - $98,698Rail Public Involvement Manager $65,799 - $98,698Rail Utility Manager $65,799 - $98,698
XIII Contracts and Procurement Manager $72,379 - $108,568Rail Design & Construction Manager $72,379 - $108,568Rail Capital Projects Schedule Manager $72,379 - $108,568Rail Project Manager, Facilities Engineer $72,379 - $108,568Rail Project Manager, Planning $72,379 - $108,568
XIV Rail Safety and Security Chief $81,992 - $122,987Chief Maintenance Engineer $81,992 - $122,987Chief Systems Engineering Officer $81,992 - $122,987Superintendent, LRV Maintenance $81,992 - $122,987
XV Rail Chief Operations Officer $100,202 - $150,304Rail Community & Government Relations Director $100,202 - $150,304Rail Finance & Administration Director $100,202 - $150,304
XVI Rail Project Development Director $112,627 - $168,941
GC Rail General Counsel $117,246 - $175,870
ED Chief Executive Officer Salary Negotiated

39
Valley Metro Rail, Inc.Schedule of Insurance Coverage Source: Valley Metro Rail, Inc Contracts and Procurement DivisionFor the Fiscal Year Ended June 30, 2012
Policy # Coverage Limits Policy Term Premium CarrierKTKCMB2700C768610 Commercial Property 131,687,981 TIV
10,000 Deductible 25,000,000 Flood & EQ 100,000 Flood & EQ Deductible
12/1/2011-12 $109,775 Travelers Indemnity Co.
QT6605833B340TIL10 Inland Marine - Rolling Stock 150,660,000 Limit 100,000 Deductible
12/1/2011-12 $165,726 Travelers P&C Insurance Co.
QT6605833B352TIL10 Inland Marine - Town Lake Bridge 22,581,224 TIV 5,000,000 Flood & EQ 100,000 Deductible
12/1/2011-12 $30,711 Travelers P&C Insurance Co.
I21112951005 DIC - Excess Flood and EQ for Town Lake Bridge
15,000,000 per Occurrence x/o 5,000,000 underlying
12/1/2011-12 $35,932 ACE Fire Underwriters Insurance Co.
CCP006379805 Commercial Crime 1,000,000 Limit 10,000 Deductible
12/1/2011-12 $2,281 Fidelity & Deposit Co. of Maryland
BA1153P23309CAG Auto Liability and Physical Damage 300,000 CSL 2,000 Comp & Coll Deductible except 5,000 Deductible for Brandt and 2009 International
12/1/2011-12 $57,721 Charter Oak Fire Insurance Co. (Travelers)
N1A3RL0000066-02 Primary Excess Liability 10,000,000 x/o 250,000 SIR 12/1/2011-12 $443,129 Princeton Excess & Surplus Lines Insurance Co.
SISCPEL00012511 Excess Liability 10,000,000 x/o 10,000,000 12/1/2011-12 $80,606 Starr Indemnity & Liability Co.
03051169 Excess Liability 15,000,000 x/o 20,000,000 12/1/2011-12 $57,603 Allied World National Assurance Co.
EXC2106221 Excess Liability 25,000,000 x/o 35,000,000 12/1/2011-12 $95,605 Great American Assurance Co.
Valley Metro Rail, Inc (METRO) employs the firm of Arthur J. Gallagher Risk Management Services, Inc. as its broker for the purchase of insurance. METRO's commercial insurance program consists of the following:
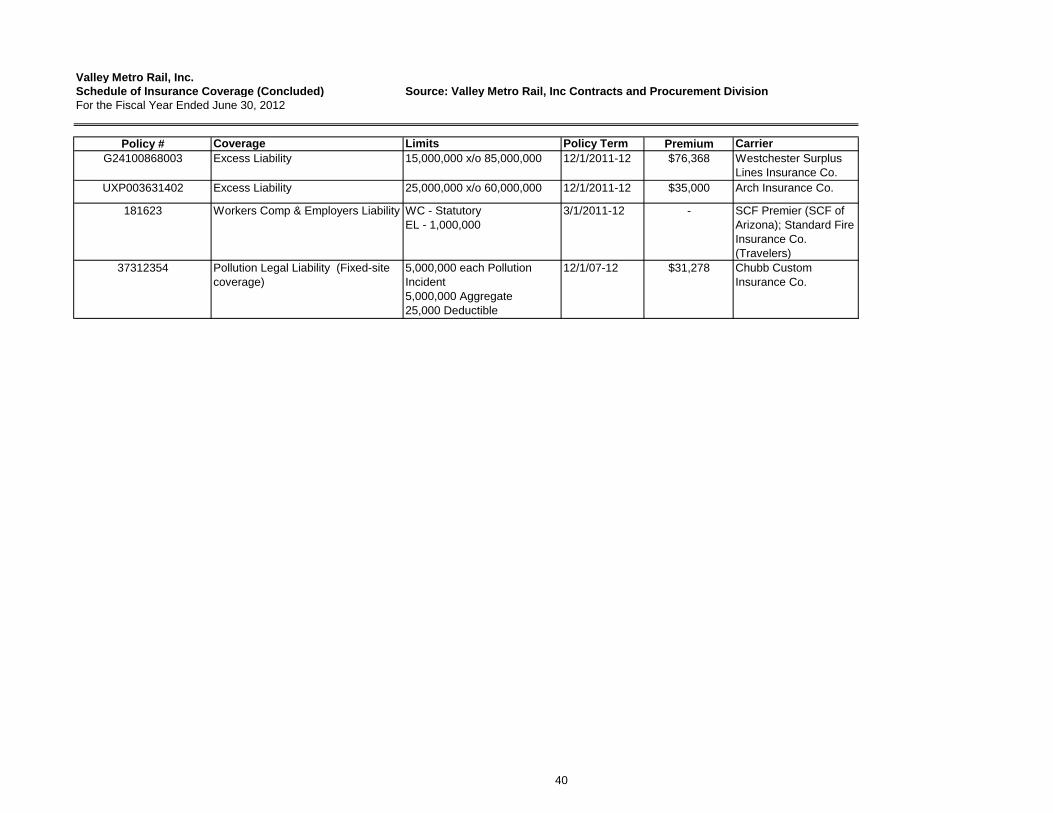
40
Valley Metro Rail, Inc.Schedule of Insurance Coverage (Concluded) Source: Valley Metro Rail, Inc Contracts and Procurement DivisionFor the Fiscal Year Ended June 30, 2012
Policy # Coverage Limits Policy Term Premium CarrierG24100868003 Excess Liability 15,000,000 x/o 85,000,000 12/1/2011-12 $76,368 Westchester Surplus
Lines Insurance Co.UXP003631402 Excess Liability 25,000,000 x/o 60,000,000 12/1/2011-12 $35,000 Arch Insurance Co.
181623 Workers Comp & Employers Liability WC - Statutory EL - 1,000,000
3/1/2011-12 - SCF Premier (SCF of Arizona); Standard Fire Insurance Co. (Travelers)
37312354 Pollution Legal Liability (Fixed-site coverage)
5,000,000 each Pollution Incident 5,000,000 Aggregate 25,000 Deductible
12/1/07-12 $31,278 Chubb Custom Insurance Co.
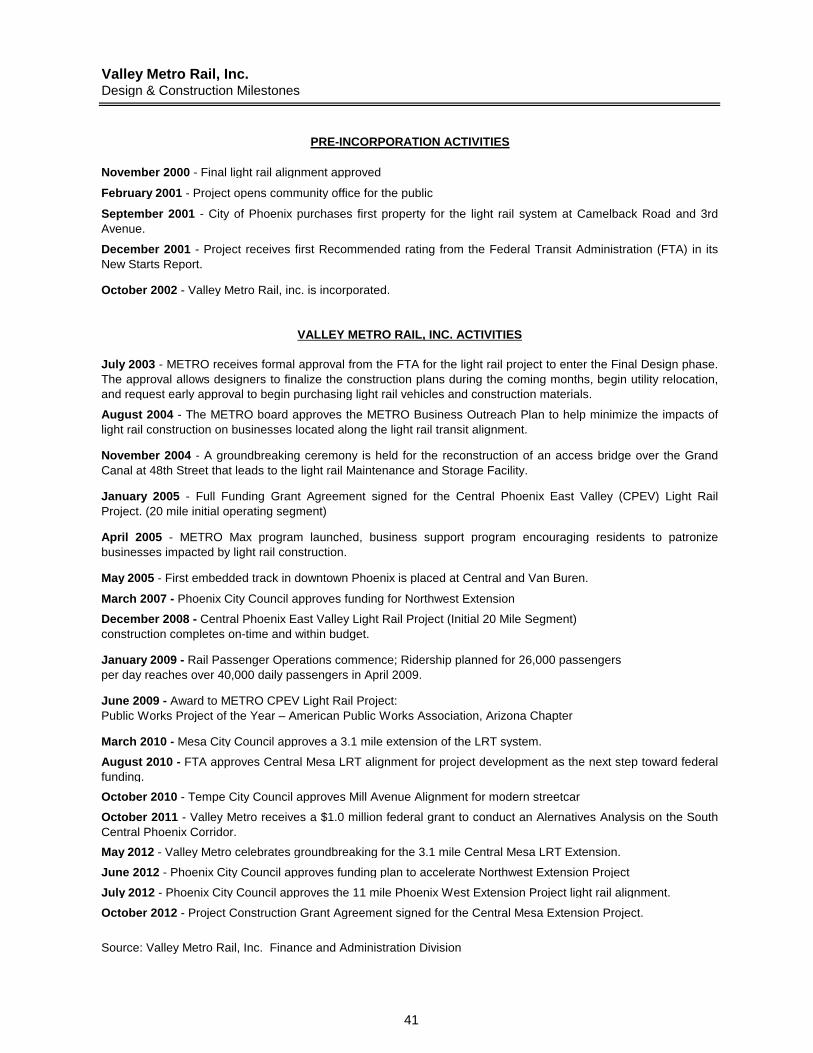
41
Valley Metro Rail, Inc.Design & Construction Milestones
PRE-INCORPORATION ACTIVITIES
November 2000 - Final light rail alignment approved
February 2001 - Project opens community office for the public
September 2001 - City of Phoenix purchases first property for the light rail system at Camelback Road and 3rdAvenue.
December 2001 - Project receives first Recommended rating from the Federal Transit Administration (FTA) in itsNew Starts Report.
October 2002 - Valley Metro Rail, inc. is incorporated.
VALLEY METRO RAIL, INC. ACTIVITIES
July 2003 - METRO receives formal approval from the FTA for the light rail project to enter the Final Design phase.The approval allows designers to finalize the construction plans during the coming months, begin utility relocation,and request early approval to begin purchasing light rail vehicles and construction materials.
August 2004 - The METRO board approves the METRO Business Outreach Plan to help minimize the impacts oflight rail construction on businesses located along the light rail transit alignment.
November 2004 - A groundbreaking ceremony is held for the reconstruction of an access bridge over the GrandCanal at 48th Street that leads to the light rail Maintenance and Storage Facility.
January 2005 - Full Funding Grant Agreement signed for the Central Phoenix East Valley (CPEV) Light RailProject. (20 mile initial operating segment)
April 2005 - METRO Max program launched, business support program encouraging residents to patronizebusinesses impacted by light rail construction.
May 2005 - First embedded track in downtown Phoenix is placed at Central and Van Buren.
March 2007 - Phoenix City Council approves funding for Northwest Extension
December 2008 - Central Phoenix East Valley Light Rail Project (Initial 20 Mile Segment)construction completes on-time and within budget.
January 2009 - Rail Passenger Operations commence; Ridership planned for 26,000 passengersper day reaches over 40,000 daily passengers in April 2009.
June 2009 - Award to METRO CPEV Light Rail Project:Public Works Project of the Year – American Public Works Association, Arizona Chapter
March 2010 - Mesa City Council approves a 3.1 mile extension of the LRT system.
August 2010 - FTA approves Central Mesa LRT alignment for project development as the next step toward federalfunding.
October 2010 - Tempe City Council approves Mill Avenue Alignment for modern streetcar
October 2011 - Valley Metro receives a $1.0 million federal grant to conduct an Alernatives Analysis on the SouthCentral Phoenix Corridor.
May 2012 - Valley Metro celebrates groundbreaking for the 3.1 mile Central Mesa LRT Extension.
June 2012 - Phoenix City Council approves funding plan to accelerate Northwest Extension Project
July 2012 - Phoenix City Council approves the 11 mile Phoenix West Extension Project light rail alignment.
October 2012 - Project Construction Grant Agreement signed for the Central Mesa Extension Project.
Source: Valley Metro Rail, Inc. Finance and Administration Division