Embed Size (px)
Citation preview
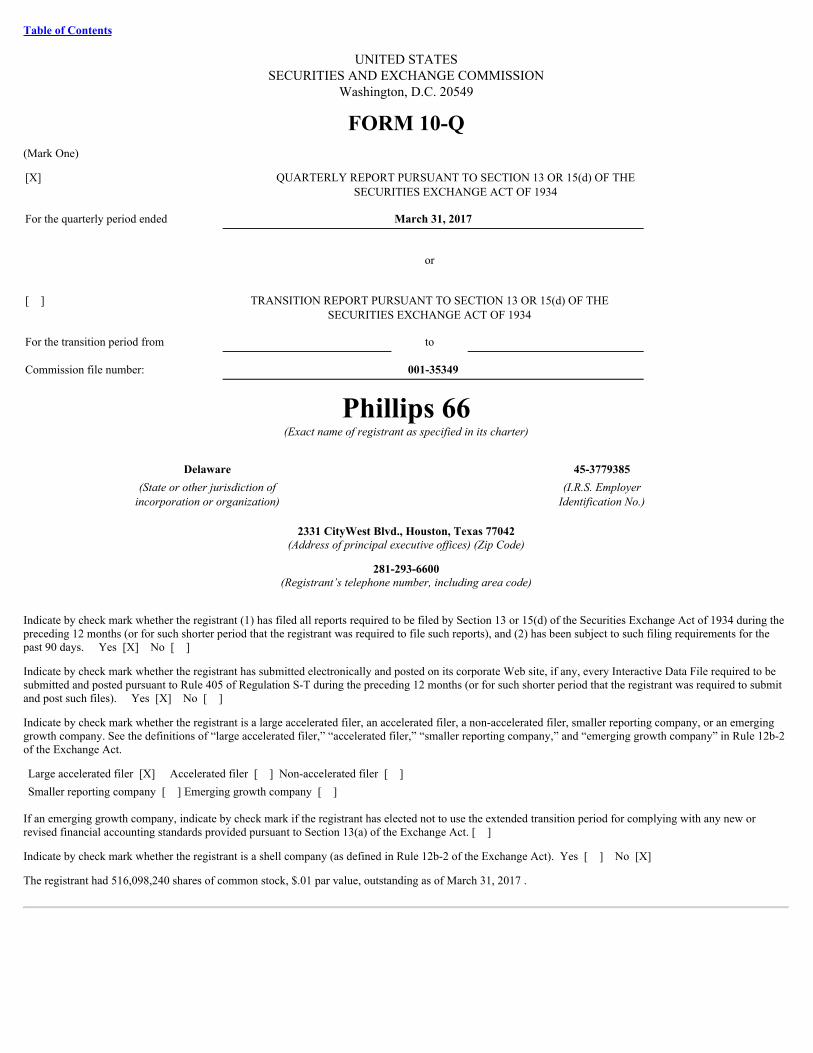
Table of Contents
UNITED STATESSECURITIES AND EXCHANGE COMMISSION
Washington, D.C. 20549
FORM 10-Q(Mark One)
[X] QUARTERLY REPORT PURSUANT TO SECTION 13 OR 15(d) OF THESECURITIES EXCHANGE ACT OF 1934
For the quarterly period ended March 31, 2017
or
[ ] TRANSITION REPORT PURSUANT TO SECTION 13 OR 15(d) OF THESECURITIES EXCHANGE ACT OF 1934
For the transition period from to
Commission file number: 001-35349
Phillips 66(Exact name of registrant as specified in its charter)
Delaware 45-3779385(State or other jurisdiction of
incorporation or organization) (I.R.S. Employer
Identification No.)
2331 CityWest Blvd., Houston, Texas 77042(Address of principal executive offices) (Zip Code)
281-293-6600(Registrant’s telephone number, including area code)
Indicate by check mark whether the registrant (1) has filed all reports required to be filed by Section 13 or 15(d) of the Securities Exchange Act of 1934 during thepreceding 12 months (or for such shorter period that the registrant was required to file such reports), and (2) has been subject to such filing requirements for thepast 90 days. Yes [X] No [ ]
Indicate by check mark whether the registrant has submitted electronically and posted on its corporate Web site, if any, every Interactive Data File required to besubmitted and posted pursuant to Rule 405 of Regulation S-T during the preceding 12 months (or for such shorter period that the registrant was required to submitand post such files). Yes [X] No [ ]
Indicate by check mark whether the registrant is a large accelerated filer, an accelerated filer, a non-accelerated filer, smaller reporting company, or an emerginggrowth company. See the definitions of “large accelerated filer,” “accelerated filer,” “smaller reporting company,” and “emerging growth company” in Rule 12b-2of the Exchange Act.
Large accelerated filer [X] Accelerated filer [ ] Non-accelerated filer [ ] Smaller reporting company [ ] Emerging growth company [ ]
If an emerging growth company, indicate by check mark if the registrant has elected not to use the extended transition period for complying with any new orrevised financial accounting standards provided pursuant to Section 13(a) of the Exchange Act. [ ]
Indicate by check mark whether the registrant is a shell company (as defined in Rule 12b-2 of the Exchange Act). Yes [ ] No [X]
The registrant had 516,098,240 shares of common stock, $.01 par value, outstanding as of March 31, 2017 .

Table of Contents
PHILLIPS 66
TABLE OF CONTENTS
PagePart I – Financial Information
Item 1. Financial Statements Consolidated Statement of Income 1Consolidated Statement of Comprehensive Income 2Consolidated Balance Sheet 3Consolidated Statement of Cash Flows 4Consolidated Statement of Changes in Equity 5Notes to Consolidated Financial Statements 6
Item 2. Management’s Discussion and Analysis of Financial Condition and Results of Operations 33
Item 3. Quantitative and Qualitative Disclosures About Market Risk 52
Item 4. Controls and Procedures 52
Part II – Other Information
Item 1. Legal Proceedings 53
Item 1A. Risk Factors 53
Item 2. Unregistered Sales of Equity Securities and Use of Proceeds 54
Item 6. Exhibits 55
Signatures 56

Table of Contents
PART I. FINANCIAL INFORMATIONItem 1. FINANCIAL STATEMENTS
Consolidated Statement of Income Phillips 66
Millions of Dollars
Three Months Ended
March 31 2017 2016Revenues and Other Income Sales and other operating revenues* $ 22,894 17,409Equity in earnings of affiliates 365 333Net gain on dispositions 1 —Other income 452 18
Total Revenues and Other Income 23,712 17,760
Costs and Expenses Purchased crude oil and products 17,679 11,930Operating expenses 1,270 1,023Selling, general and administrative expenses 384 386Depreciation and amortization 315 280Impairments 2 —Taxes other than income taxes* 3,156 3,461Accretion on discounted liabilities 5 5Interest and debt expense 105 86Foreign currency transaction gains (1) (7)
Total Costs and Expenses 22,915 17,164Income before income taxes 797 596Provision for income taxes 234 198Net Income 563 398Less: net income attributable to noncontrolling interests 28 13Net Income Attributable to Phillips 66 $ 535 385
Net Income Attributable to Phillips 66 Per Share of Common Stock (dollars) Basic $ 1.02 0.72Diluted 1.02 0.72
Dividends Paid Per Share of Common Stock (dollars) $ 0.63 0.56
Average Common Shares Outstanding (in thousands) Basic 521,647 531,739Diluted 524,520 534,709* Includes excise taxes on petroleum products sales: $ 3,036 3,360
See Notes to Consolidated Financial Statements.
1
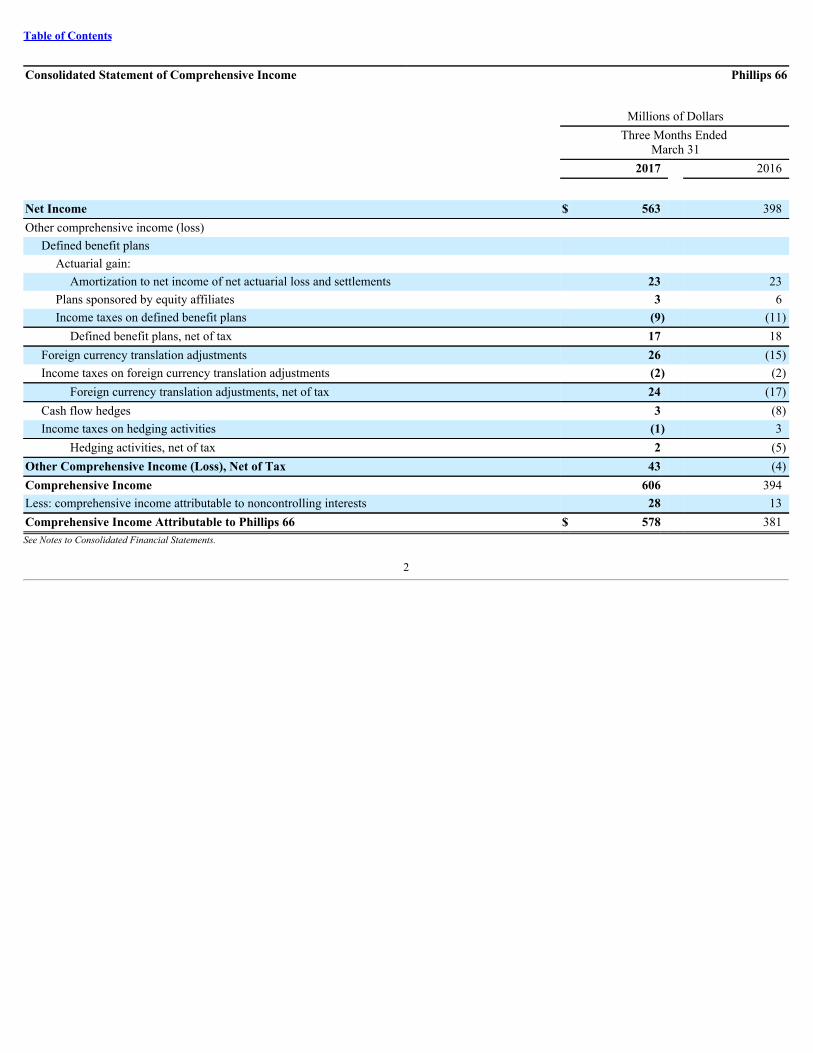
Table of Contents
Consolidated Statement of Comprehensive Income Phillips 66
Millions of Dollars
Three Months Ended
March 31 2017 2016
Net Income $ 563 398Other comprehensive income (loss)
Defined benefit plans Actuarial gain:
Amortization to net income of net actuarial loss and settlements 23 23Plans sponsored by equity affiliates 3 6Income taxes on defined benefit plans (9) (11)
Defined benefit plans, net of tax 17 18Foreign currency translation adjustments 26 (15)Income taxes on foreign currency translation adjustments (2) (2)
Foreign currency translation adjustments, net of tax 24 (17)Cash flow hedges 3 (8)Income taxes on hedging activities (1) 3
Hedging activities, net of tax 2 (5)Other Comprehensive Income (Loss), Net of Tax 43 (4)Comprehensive Income 606 394Less: comprehensive income attributable to noncontrolling interests 28 13Comprehensive Income Attributable to Phillips 66 $ 578 381See Notes to Consolidated Financial Statements.
2

Table of Contents
Consolidated Balance Sheet Phillips 66
Millions of Dollars
March 31
2017 December 31
2016Assets Cash and cash equivalents $ 1,513 2,711Accounts and notes receivable (net of allowances of $34 million in 2017 and $34 million in 2016) 4,979 5,485Accounts and notes receivable—related parties 711 912Inventories 4,387 3,150Prepaid expenses and other current assets 580 422
Total Current Assets 12,170 12,680Investments and long-term receivables 13,359 13,534Net properties, plants and equipment 21,240 20,855Goodwill 3,270 3,270Intangibles 895 888Other assets 471 426Total Assets $ 51,405 51,653
Liabilities Accounts payable $ 5,829 6,395Accounts payable—related parties 543 666Short-term debt 609 550Accrued income and other taxes 853 805Employee benefit obligations 284 527Other accruals 612 520
Total Current Liabilities 8,730 9,463Long-term debt 9,601 9,588Asset retirement obligations and accrued environmental costs 616 655Deferred income taxes 7,254 6,743Employee benefit obligations 1,222 1,216Other liabilities and deferred credits 257 263Total Liabilities 27,680 27,928
Equity Common stock (2,500,000,000 shares authorized at $.01 par value) Issued (2017—642,459,966 shares; 2016—641,593,854 shares)
Par value 6 6Capital in excess of par 19,569 19,559
Treasury stock (at cost: 2017—126,361,726 shares; 2016—122,827,264 shares) (9,073) (8,788)Retained earnings 12,814 12,608Accumulated other comprehensive loss (952) (995)
Total Stockholders’ Equity 22,364 22,390Noncontrolling interests 1,361 1,335Total Equity 23,725 23,725Total Liabilities and Equity $ 51,405 51,653See Notes to Consolidated Financial Statements.
3
Table of Contents
Consolidated Statement of Cash Flows Phillips 66
Millions of Dollars
Three Months Ended
March 31 2017 2016Cash Flows From Operating Activities Net income $ 563 398Adjustments to reconcile net income to net cash provided by (used in) operating
activities Depreciation and amortization 315 280Impairments 2 —Accretion on discounted liabilities 5 5Deferred taxes 493 154Undistributed equity earnings (212) (166)Net gain on dispositions (1) —Gain on consolidation of business (423) —Other 6 51Working capital adjustments
Decrease (increase) in accounts and notes receivable 621 524Decrease (increase) in inventories (1,222) (620)Decrease (increase) in prepaid expenses and other current assets (91) (310)Increase (decrease) in accounts payable (496) 98Increase (decrease) in taxes and other accruals (109) (156)
Net Cash Provided by (Used in) Operating Activities (549) 258 Cash Flows From Investing Activities Capital expenditures and investments (470) (750)Proceeds from asset dispositions* 9 5Advances/loans—related parties — (75)Collection of advances/loans—related parties 325 —Restricted cash received from consolidation of business 318 —Other (24) (42)Net Cash Provided by (Used in) Investing Activities 158 (862) Cash Flows From Financing Activities Issuance of debt 712 50Repayment of debt (773) (100)Issuance of common stock 4 4Repurchase of common stock (285) (391)Dividends paid on common stock (326) (296)Distributions to noncontrolling interests (24) (11)Net proceeds from issuance of Phillips 66 Partners LP common units 40 —Other (34) (39)Net Cash Used in Financing Activities (686) (783) Effect of Exchange Rate Changes on Cash, Cash Equivalents and Restricted Cash 2 36 Net Change in Cash, Cash Equivalents and Restricted Cash (1,075) (1,351)Cash, cash equivalents and restricted cash at beginning of period 2,711 3,074Cash, Cash Equivalents and Restricted Cash at End of Period $ 1,636 1,723* Includes return of investments in equity affiliates.See Notes to Consolidated Financial Statements.

4
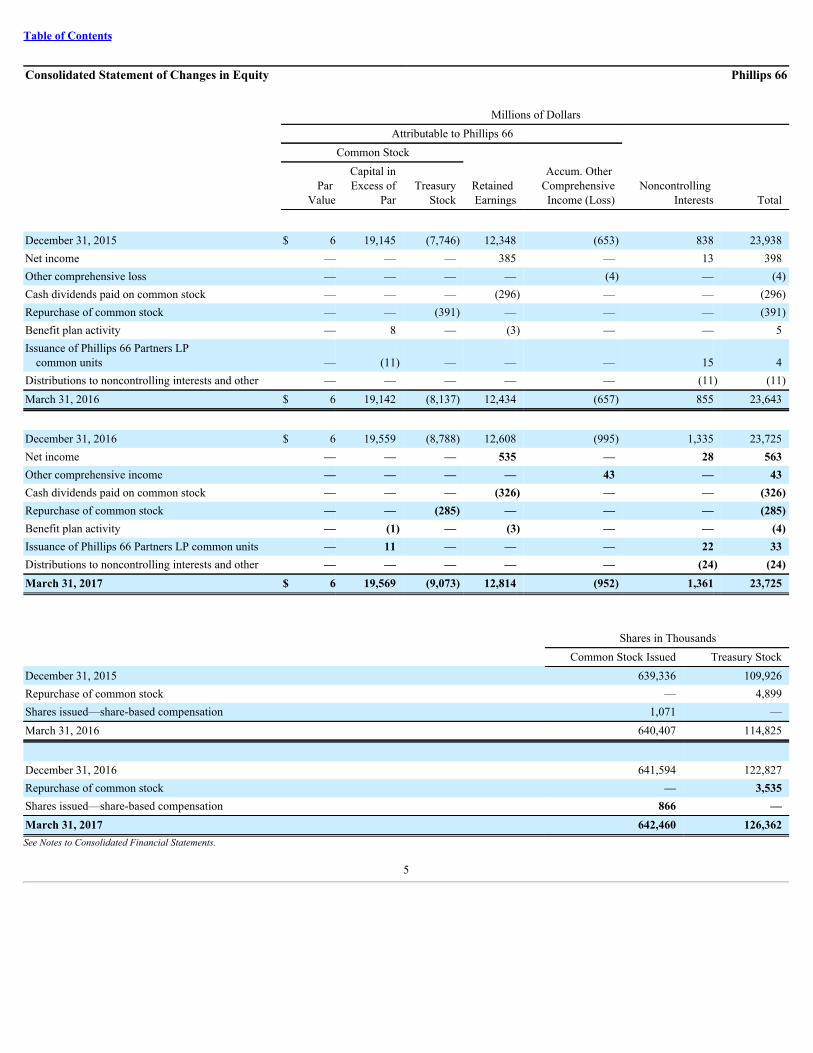
Table of Contents
Consolidated Statement of Changes in Equity Phillips 66
Millions of Dollars Attributable to Phillips 66 Common Stock
Par
Value
Capital inExcess of
ParTreasury
StockRetained Earnings
Accum. Other ComprehensiveIncome (Loss)
Noncontrolling Interests Total
December 31, 2015 $ 6 19,145 (7,746) 12,348 (653) 838 23,938Net income — — — 385 — 13 398Other comprehensive loss — — — — (4) — (4)Cash dividends paid on common stock — — — (296) — — (296)Repurchase of common stock — — (391) — — — (391)Benefit plan activity — 8 — (3) — — 5Issuance of Phillips 66 Partners LP
common units — (11) — — — 15 4Distributions to noncontrolling interests and other — — — — — (11) (11)March 31, 2016 $ 6 19,142 (8,137) 12,434 (657) 855 23,643
December 31, 2016 $ 6 19,559 (8,788) 12,608 (995) 1,335 23,725Net income — — — 535 — 28 563Other comprehensive income — — — — 43 — 43Cash dividends paid on common stock — — — (326) — — (326)Repurchase of common stock — — (285) — — — (285)Benefit plan activity — (1) — (3) — — (4)Issuance of Phillips 66 Partners LP common units — 11 — — — 22 33Distributions to noncontrolling interests and other — — — — — (24) (24)March 31, 2017 $ 6 19,569 (9,073) 12,814 (952) 1,361 23,725
Shares in Thousands Common Stock Issued Treasury StockDecember 31, 2015 639,336 109,926Repurchase of common stock — 4,899Shares issued—share-based compensation 1,071 —March 31, 2016 640,407 114,825
December 31, 2016 641,594 122,827Repurchase of common stock — 3,535Shares issued—share-based compensation 866 —March 31, 2017 642,460 126,362See Notes to Consolidated Financial Statements.
5
Table of Contents
Notes to Consolidated Financial Statements Phillips 66 Note 1— Interim Financial Information
The interim financial information presented in the financial statements included in this report is unaudited and includes all known accruals andadjustments necessary, in the opinion of management, for a fair presentation of the consolidated financial position of Phillips 66 and its results ofoperations and cash flows for the periods presented. Unless otherwise specified, all such adjustments are of a normal and recurring nature. Certain notesand other information have been condensed or omitted from the interim financial statements included in this report. Therefore, these interim financialstatements should be read in conjunction with the consolidated financial statements and notes included in our 2016 Annual Report on Form 10-K. Theresults of operations for the three months ended March 31, 2017 , are not necessarily indicative of the results to be expected for the full year. Certainprior period financial information has been recast to reflect the current year’s presentation.
Note 2— Changes in Accounting Principles
Effective January 1, 2017, we early adopted Financial Accounting Standards Board (FASB) Accounting Standards Update (ASU) No. 2017-04,“Intangibles—Goodwill and Other (Topic 350): Simplifying the Test for Goodwill Impairment,” which eliminates Step 2 from the goodwill impairmenttest. Under the revised test, an entity should perform its annual, or interim, goodwill impairment test by comparing the fair value of a reporting unit withits carrying amount. An entity should recognize an impairment charge for the amount by which the carrying amount exceeds the reporting unit’s fairvalue; however, the loss recognized should not exceed the total amount of goodwill allocated to that reporting unit. We will apply this ASUprospectively to our goodwill impairment test.
Effective January 1, 2017, we early adopted ASU No. 2016-18, “Statement of Cash Flows (Topic 230): Restricted Cash.” The new update clarifies theclassification and presentation of changes in restricted cash. The amendment requires that a statement of cash flows explain the change during theperiod in the total of cash, cash equivalents and amounts generally described as restricted cash and restricted cash equivalents. Adoption of this ASU ona retrospective basis did not have a material impact on our financial statements. See Note 17—Restricted Cash for more information.
Effective January 1, 2017, we early adopted ASU No. 2016-15, “Statement of Cash Flows (Topic 230): Classification of Certain Cash Receipts andCash Payments.” The new update clarifies the treatment of several cash flow categories. In addition, ASU No. 2016-15 clarifies that when cash receiptsand cash payments have aspects of more than one class of cash flows and cannot be separated, classification will depend on the predominant source oruse. Adoption of this ASU on a retrospective basis did not have a material impact on our financial statements.
Effective January 1, 2017, we adopted ASU 2016-09, “Compensation—Stock Compensation (Topic 718): Improvements to Employee Share-BasedPayment Accounting,” which simplifies several aspects of the accounting for share-based payment award transactions including accounting for incometaxes and classification of excess tax benefits on the statement of cash flows, forfeitures and minimum statutory tax withholding requirements.Adoption of this ASU on a prospective basis did not materially impact our financial position, results of operations, or cash flows. We account forforfeitures of awards when they occur and excess tax benefits, which were previously reported in cash flows from financing, are now reported in cashflows from operating activities on a prospective basis.
6
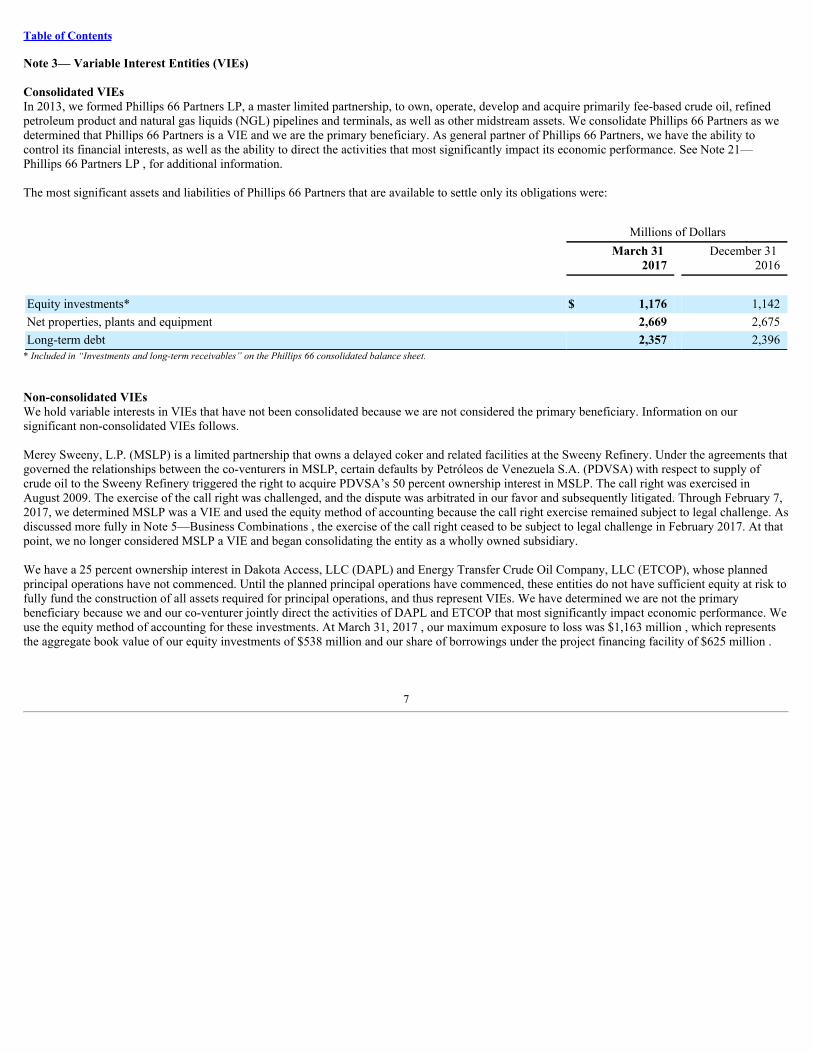
Table of Contents
Note 3— Variable Interest Entities (VIEs)
Consolidated VIEsIn 2013, we formed Phillips 66 Partners LP, a master limited partnership, to own, operate, develop and acquire primarily fee-based crude oil, refinedpetroleum product and natural gas liquids (NGL) pipelines and terminals, as well as other midstream assets. We consolidate Phillips 66 Partners as wedetermined that Phillips 66 Partners is a VIE and we are the primary beneficiary. As general partner of Phillips 66 Partners, we have the ability tocontrol its financial interests, as well as the ability to direct the activities that most significantly impact its economic performance. See Note 21—Phillips 66 Partners LP , for additional information.
The most significant assets and liabilities of Phillips 66 Partners that are available to settle only its obligations were:
Millions of Dollars
March 31
2017 December 31
2016
Equity investments* $ 1,176 1,142Net properties, plants and equipment 2,669 2,675Long-term debt 2,357 2,396
* Included in “Investments and long-term receivables” on the Phillips 66 consolidated balance sheet.
Non-consolidated VIEsWe hold variable interests in VIEs that have not been consolidated because we are not considered the primary beneficiary. Information on oursignificant non-consolidated VIEs follows.
Merey Sweeny, L.P. (MSLP) is a limited partnership that owns a delayed coker and related facilities at the Sweeny Refinery. Under the agreements thatgoverned the relationships between the co-venturers in MSLP, certain defaults by Petróleos de Venezuela S.A. (PDVSA) with respect to supply ofcrude oil to the Sweeny Refinery triggered the right to acquire PDVSA’s 50 percent ownership interest in MSLP. The call right was exercised inAugust 2009. The exercise of the call right was challenged, and the dispute was arbitrated in our favor and subsequently litigated. Through February 7,2017, we determined MSLP was a VIE and used the equity method of accounting because the call right exercise remained subject to legal challenge. Asdiscussed more fully in Note 5—Business Combinations , the exercise of the call right ceased to be subject to legal challenge in February 2017. At thatpoint, we no longer considered MSLP a VIE and began consolidating the entity as a wholly owned subsidiary.
We have a 25 percent ownership interest in Dakota Access, LLC (DAPL) and Energy Transfer Crude Oil Company, LLC (ETCOP), whose plannedprincipal operations have not commenced. Until the planned principal operations have commenced, these entities do not have sufficient equity at risk tofully fund the construction of all assets required for principal operations, and thus represent VIEs. We have determined we are not the primarybeneficiary because we and our co-venturer jointly direct the activities of DAPL and ETCOP that most significantly impact economic performance. Weuse the equity method of accounting for these investments. At March 31, 2017 , our maximum exposure to loss was $1,163 million , which representsthe aggregate book value of our equity investments of $538 million and our share of borrowings under the project financing facility of $625 million .
7
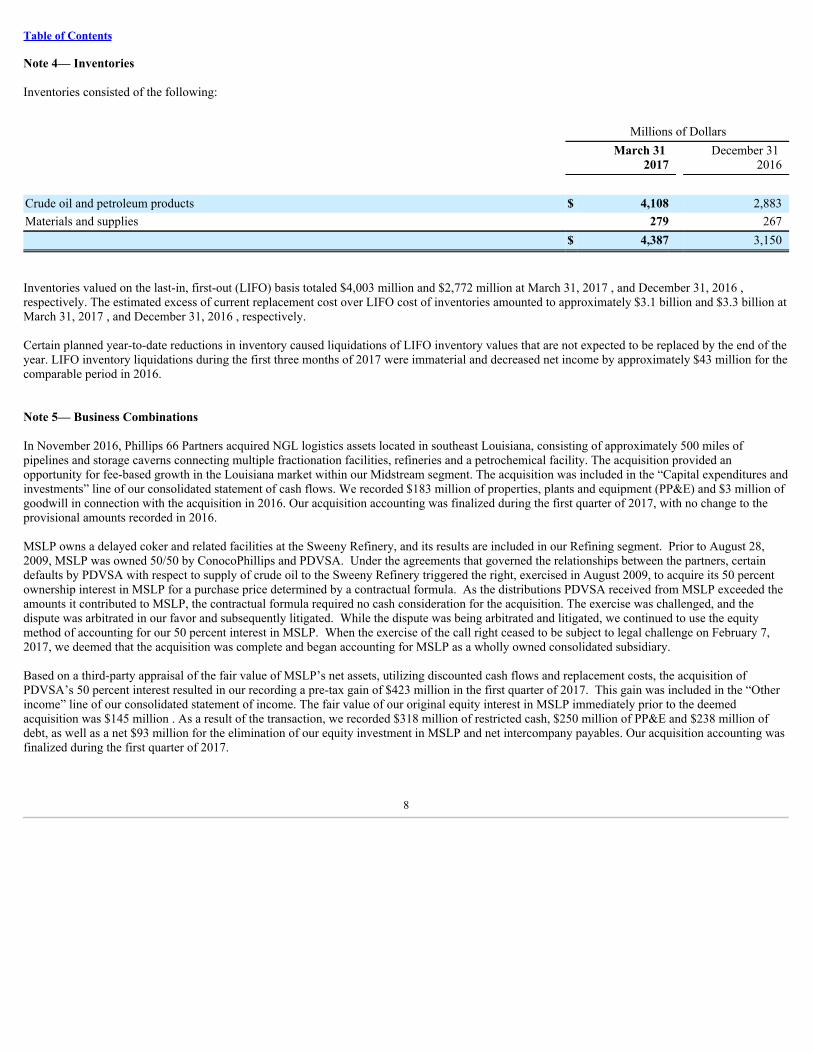
Table of Contents
Note 4— Inventories
Inventories consisted of the following:
Millions of Dollars
March 31
2017 December 31
2016
Crude oil and petroleum products $ 4,108 2,883Materials and supplies 279 267 $ 4,387 3,150
Inventories valued on the last-in, first-out (LIFO) basis totaled $4,003 million and $2,772 million at March 31, 2017 , and December 31, 2016 ,respectively. The estimated excess of current replacement cost over LIFO cost of inventories amounted to approximately $3.1 billion and $3.3 billion atMarch 31, 2017 , and December 31, 2016 , respectively.
Certain planned year-to-date reductions in inventory caused liquidations of LIFO inventory values that are not expected to be replaced by the end of theyear. LIFO inventory liquidations during the first three months of 2017 were immaterial and decreased net income by approximately $43 million for thecomparable period in 2016.
Note 5— Business Combinations
In November 2016, Phillips 66 Partners acquired NGL logistics assets located in southeast Louisiana, consisting of approximately 500 miles ofpipelines and storage caverns connecting multiple fractionation facilities, refineries and a petrochemical facility. The acquisition provided anopportunity for fee-based growth in the Louisiana market within our Midstream segment. The acquisition was included in the “Capital expenditures andinvestments” line of our consolidated statement of cash flows. We recorded $183 million of properties, plants and equipment (PP&E) and $3 million ofgoodwill in connection with the acquisition in 2016. Our acquisition accounting was finalized during the first quarter of 2017, with no change to theprovisional amounts recorded in 2016.
MSLP owns a delayed coker and related facilities at the Sweeny Refinery, and its results are included in our Refining segment. Prior to August 28,2009, MSLP was owned 50/50 by ConocoPhillips and PDVSA. Under the agreements that governed the relationships between the partners, certaindefaults by PDVSA with respect to supply of crude oil to the Sweeny Refinery triggered the right, exercised in August 2009, to acquire its 50 percentownership interest in MSLP for a purchase price determined by a contractual formula. As the distributions PDVSA received from MSLP exceeded theamounts it contributed to MSLP, the contractual formula required no cash consideration for the acquisition. The exercise was challenged, and thedispute was arbitrated in our favor and subsequently litigated. While the dispute was being arbitrated and litigated, we continued to use the equitymethod of accounting for our 50 percent interest in MSLP. When the exercise of the call right ceased to be subject to legal challenge on February 7,2017, we deemed that the acquisition was complete and began accounting for MSLP as a wholly owned consolidated subsidiary.
Based on a third-party appraisal of the fair value of MSLP’s net assets, utilizing discounted cash flows and replacement costs, the acquisition ofPDVSA’s 50 percent interest resulted in our recording a pre-tax gain of $423 million in the first quarter of 2017. This gain was included in the “Otherincome” line of our consolidated statement of income. The fair value of our original equity interest in MSLP immediately prior to the deemedacquisition was $145 million . As a result of the transaction, we recorded $318 million of restricted cash, $250 million of PP&E and $238 million ofdebt, as well as a net $93 million for the elimination of our equity investment in MSLP and net intercompany payables. Our acquisition accounting wasfinalized during the first quarter of 2017.
8
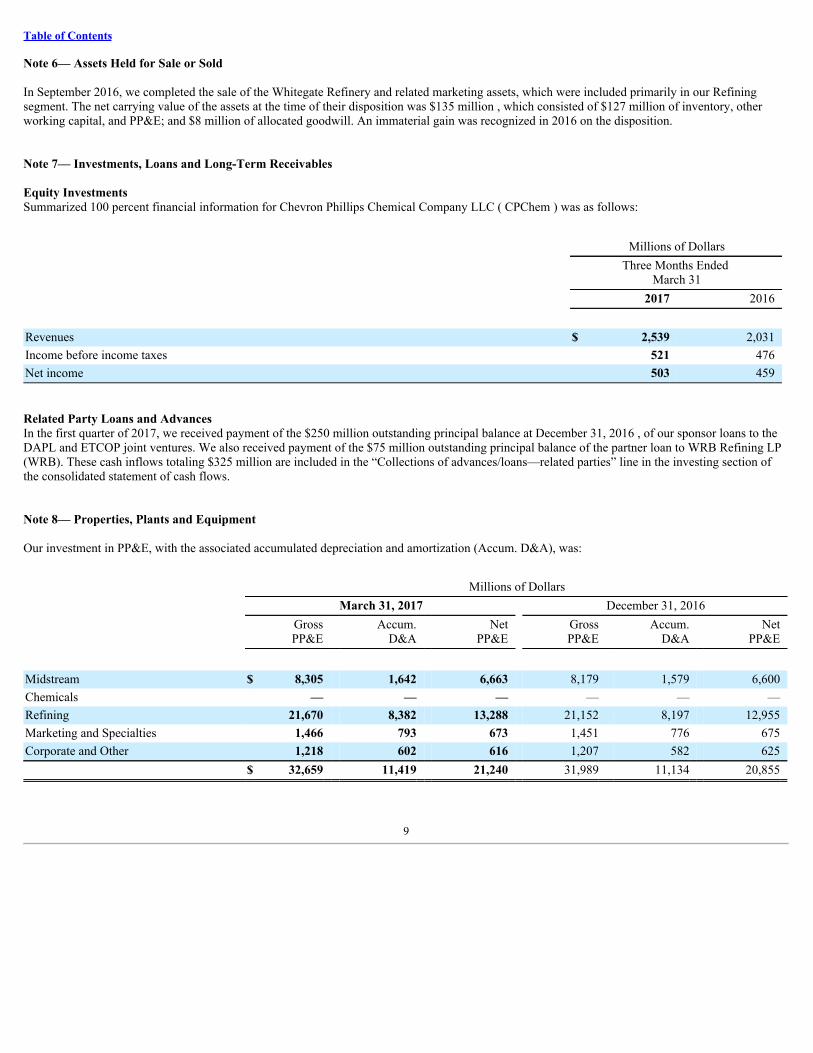
Table of Contents
Note 6— Assets Held for Sale or Sold
In September 2016, we completed the sale of the Whitegate Refinery and related marketing assets, which were included primarily in our Refiningsegment. The net carrying value of the assets at the time of their disposition was $135 million , which consisted of $127 million of inventory, otherworking capital, and PP&E; and $8 million of allocated goodwill. An immaterial gain was recognized in 2016 on the disposition.
Note 7— Investments, Loans and Long-Term Receivables
Equity InvestmentsSummarized 100 percent financial information for Chevron Phillips Chemical Company LLC ( CPChem ) was as follows:
Millions of Dollars
Three Months Ended
March 31 2017 2016
Revenues $ 2,539 2,031Income before income taxes 521 476Net income 503 459
Related Party Loans and AdvancesIn the first quarter of 2017, we received payment of the $250 million outstanding principal balance at December 31, 2016 , of our sponsor loans to theDAPL and ETCOP joint ventures. We also received payment of the $75 million outstanding principal balance of the partner loan to WRB Refining LP(WRB). These cash inflows totaling $325 million are included in the “Collections of advances/loans—related parties” line in the investing section ofthe consolidated statement of cash flows.
Note 8— Properties, Plants and Equipment
Our investment in PP&E, with the associated accumulated depreciation and amortization (Accum. D&A), was:
Millions of Dollars March 31, 2017 December 31, 2016
GrossPP&E
Accum.D&A
NetPP&E
GrossPP&E
Accum.D&A
NetPP&E
Midstream $ 8,305 1,642 6,663 8,179 1,579 6,600Chemicals — — — — — —Refining 21,670 8,382 13,288 21,152 8,197 12,955Marketing and Specialties 1,466 793 673 1,451 776 675Corporate and Other 1,218 602 616 1,207 582 625 $ 32,659 11,419 21,240 31,989 11,134 20,855
9

Table of Contents
Note 9— Earnings Per Share
The numerator of basic earnings per share (EPS) is net income attributable to Phillips 66, reduced by noncancelable dividends paid on unvested share-based employee awards during the vesting period (participating securities). The denominator of basic EPS is the sum of the daily weighted-averagenumber of common shares outstanding during the periods presented and fully vested stock and unit awards that have not yet been issued as commonstock. The numerator of diluted EPS is also based on net income attributable to Phillips 66, which is reduced only by dividend equivalents paid onparticipating securities for which the dividends are more dilutive than the participation of the awards in the earnings of the periods presented. To theextent unvested stock, unit or option awards and vested unexercised stock options are dilutive, they are included with the weighted-average commonshares outstanding in the denominator. Treasury stock is excluded from the denominator in both basic and diluted EPS.
Three Months Ended
March 31 2017 2016 Basic Diluted Basic DilutedAmounts attributed to Phillips 66 Common
Stockholders (millions) : Net income attributable to Phillips 66 $ 535 535 385 385Income allocated to participating securities (1) (1) (1) (1)
Net Income available to common stockholders $ 534 534 384 384
Weighted-average common shares outstanding (thousands) : 517,603 521,647 527,229 531,739Effect of stock-based compensation 4,044 2,873 4,510 2,970Weighted-average common shares outstanding—EPS 521,647 524,520 531,739 534,709
Earnings Per Share of Common Stock (dollars) $ 1.02 1.02 0.72 0.72
Note 10— Debt
At both March 31, 2017 , and December 31, 2016 , we had no direct outstanding borrowings under our $5 billion revolving credit agreement, while $51million in letters of credit had been issued that were supported by it. At March 31, 2017 , $157 million was outstanding under the $750 millionrevolving credit agreement of Phillips 66 Partners, compared with $210 million outstanding under the facility at December 31, 2016 . Accordingly, asof March 31, 2017 , an aggregate $5.5 billion of total capacity was available under these facilities.
At March 31, 2017, we classified $1.05 billion of the 2.95% Senior Notes maturing in 2017 as long-term debt on our consolidated balance sheet, basedon our ability and intent to refinance the obligation on a long-term basis, with such ability demonstrated by our April 2017 debt issuances discussedbelow.
Debt IssuancesOn April 21, 2017, Phillips 66 completed a private offering of $600 million aggregate principal amount of unsecured notes consisting of:
• $300 million of floating rate Notes due 2019.
• $300 million of floating rate Notes due 2020.
The notes are guaranteed by Phillips 66 Company, a wholly owned subsidiary. Phillips 66 expects to use the net proceeds from the notes, together witha portion of the proceeds from $900 million of term loans received in late April 2017, to repay its outstanding 2.95% Senior Notes due 2017, for capitalexpenditures and for general corporate purposes.
10

Table of Contents
Interest is a floating rate equal to three-month LIBOR plus 0.65% per annum for the 2019 Notes and three-month LIBOR plus 0.75% per annum for the2020 Notes. Interest on both series of notes is payable quarterly in arrears on January 15, April 15, July 15 and October 15, commencing in July 2017.The 2019 Notes mature on April 15, 2019, and the 2020 Notes mature on April 15, 2020.
The term loans consist of a $450 million 364 -day facility and a $450 million three -year facility. Interest on the term loans is a floating rate based oneither the Eurodollar rate or the reference rate, plus a margin determined by our long-term credit ratings.
Note 11— Guarantees
At March 31, 2017 , we were liable for certain contingent obligations under various contractual arrangements as described below. We recognize aliability, at inception, for the fair value of our obligation as a guarantor for newly issued or modified guarantees. Unless the carrying amount of theliability is noted below, we have not recognized a liability either because the guarantees were issued prior to December 31, 2002, or because the fairvalue of the obligation is immaterial. In addition, unless otherwise stated, we are not currently performing with any significance under the guaranteeand expect future performance to be either immaterial or have only a remote chance of occurrence.
Guarantees of Joint Venture DebtIn December 2016, as part of the restructuring within DCP Midstream, LLC (DCP Midstream) which occurred effective January 1, 2017, we issued aguarantee in support of DCP Midstream’s newly issued debt. At March 31, 2017, the maximum potential amount of future payments to third partiesunder the guarantee is estimated to be $188 million . Payment would be required if DCP Midstream defaults on this debt obligation. DCP Midstream’sdebt matures in 2019.
Other GuaranteesIn 2016, the operating lease commenced on our headquarters facility in Houston, Texas. Under this lease agreement, we have a residual value guaranteewith a maximum future exposure of $554 million . The operating lease has a term of five years and provides us the option, at the end of the lease term,to request to renew the lease, purchase the facility, or assist the lessor in marketing it for resale.
We have residual value guarantees associated with railcar and airplane leases with maximum future exposures totaling $356 million . At year-end 2016,based on an outside appraisal of the railcars’ fair value at the end of their lease terms, we estimated a total residual value deficiency of $94 million andrecognized $28 million as expense in 2016. During the first quarter of 2017, we recognized an additional $12 million of the residual value deficiency. Beginning March 31, 2017, the remaining residual value deficiency of $54 million will be recognized on a straight-line basis with approximately one-third recognized through October 2017 and two-thirds recognized through May 2019.
IndemnificationsOver the years, we have entered into various agreements to sell ownership interests in certain corporations, joint ventures and assets that gave rise toqualifying indemnifications. Agreements associated with these sales include indemnifications for taxes, litigation, environmental liabilities, permits andlicenses, and employee claims; and real estate indemnity against tenant defaults. The provisions of these indemnifications vary greatly. The majority ofthese indemnifications are related to environmental issues with generally indefinite terms, and the maximum amount of future payments is generallyunlimited. The carrying amount recorded for indemnifications at March 31, 2017 , was $199 million .
We amortize the indemnification liability over the relevant time period, if one exists, based on the facts and circumstances surrounding each type ofindemnity. In cases where the indemnification term is indefinite, we will reverse the liability when we have information the liability is essentiallyrelieved or amortize the liability over an appropriate time period as the fair value of our indemnification exposure declines. Although it is reasonablypossible future payments may exceed amounts recorded, due to the nature of the indemnifications, it is not possible to make a reasonable estimate of themaximum potential amount of future payments. Included in the recorded carrying amount were $109 million of environmental accruals for knowncontamination that were primarily included in “Asset retirement obligations and accrued environmental costs” at March 31, 2017 . For additionalinformation about environmental liabilities, see Note 12—Contingencies and Commitments .
11

Table of Contents
Indemnification and Release AgreementIn 2012, following our separation from ConocoPhillips (the Separation), we entered into the Indemnification and Release Agreement. This agreementgoverns the treatment between ConocoPhillips and us of matters relating to indemnification, insurance, litigation responsibility and management, andlitigation document sharing and cooperation arising in connection with the Separation. Generally, the agreement provides for cross-indemnitiesprincipally designed to place financial responsibility for the obligations and liabilities of our business with us and financial responsibility for theobligations and liabilities of ConocoPhillips’ business with ConocoPhillips. The agreement also establishes procedures for handling claims subject toindemnification and related matters.
Note 12— Contingencies and Commitments
A number of lawsuits involving a variety of claims that arose in the ordinary course of business have been filed against us or are subject toindemnifications provided by us. We also may be required to remove or mitigate the effects on the environment of the placement, storage, disposal orrelease of certain chemical, mineral and petroleum substances at various active and inactive sites. We regularly assess the need for financial recognitionor disclosure of these contingencies. In the case of all known contingencies (other than those related to income taxes), we accrue a liability when theloss is probable and the amount is reasonably estimable. If a range of amounts can be reasonably estimated and no amount within the range is a betterestimate than any other amount, then the minimum of the range is accrued. We do not reduce these liabilities for potential insurance or third-partyrecoveries. If applicable, we accrue receivables for probable insurance or other third-party recoveries. In the case of income-tax-related contingencies,we use a cumulative probability-weighted loss accrual in cases where sustaining a tax position is less than certain.
Based on currently available information, we believe it is remote that future costs related to known contingent liability exposures will exceed currentaccruals by an amount that would have a material adverse impact on our consolidated financial statements. As we learn new facts concerningcontingencies, we reassess our position both with respect to accrued liabilities and other potential exposures. Estimates particularly sensitive to futurechanges include contingent liabilities recorded for environmental remediation, tax and legal matters. Estimated future environmental remediation costsare subject to change due to such factors as the uncertain magnitude of cleanup costs, the unknown time and extent of such remedial actions that may berequired, and the determination of our liability in proportion to that of other potentially responsible parties. Estimated future costs related to tax andlegal matters are subject to change as events evolve and as additional information becomes available during the administrative and litigation processes.
EnvironmentalWe are subject to international, federal, state and local environmental laws and regulations. When we prepare our consolidated financial statements, werecord accruals for environmental liabilities based on management’s best estimates, using all information available at the time. We measure estimatesand base contingent liabilities on currently available facts, existing technology, and presently enacted laws and regulations, taking into accountstakeholder and business considerations. When measuring contingent environmental liabilities, we also consider our prior experience in remediation ofcontaminated sites, other companies’ cleanup experience, and data released by the U.S. Environmental Protection Agency (EPA) or other organizations.We consider unasserted claims in our determination of environmental liabilities, and we accrue them in the period they are both probable andreasonably estimable.
Although liability of those potentially responsible for environmental remediation costs is generally joint and several for federal sites and frequently sofor state sites, we are usually only one of many companies alleged to have liability at a particular site. Due to such joint and several liabilities, we couldbe responsible for all cleanup costs related to any site at which we have been designated as a potentially responsible party. We have been successful todate in sharing cleanup costs with other financially sound companies. Many of the sites at which we are potentially responsible are still underinvestigation by the EPA or the state agencies concerned. Prior to actual cleanup, those potentially responsible normally assess the site conditions,apportion responsibility and determine the appropriate remediation. In some instances, we may have no liability or may attain a settlement of liability.Where it appears that other potentially responsible parties may be financially unable to bear their proportional share, we consider this inability inestimating our potential liability, and we adjust our accruals accordingly. As a result of various acquisitions in the past, we assumed certainenvironmental obligations. Some of these environmental obligations are mitigated by indemnifications made by others for our benefit and some of theindemnifications are subject to dollar and time limits.
12

Table of Contents
We are currently participating in environmental assessments and cleanups at numerous federal Superfund and comparable state sites. After anassessment of environmental exposures for cleanup and other costs, we make accruals on an undiscounted basis (except those pertaining to sitesacquired in a purchase business combination, which we record on a discounted basis) for planned investigation and remediation activities for siteswhere it is probable future costs will be incurred and these costs can be reasonably estimated. At March 31, 2017 , our total environmental accrual was$511 million , compared with $496 million at December 31, 2016 . We expect to incur a substantial amount of these expenditures within the next 30 years. We have not reduced these accruals for possible insurance recoveries. In the future, we may be involved in additional environmentalassessments, cleanups and proceedings.
Legal ProceedingsOur legal organization applies its knowledge, experience and professional judgment to the specific characteristics of our cases, employing a litigationmanagement process to manage and monitor the legal proceedings against us. Our process facilitates the early evaluation and quantification of potentialexposures in individual cases and enables the tracking of those cases that have been scheduled for trial and/or mediation. Based on professionaljudgment and experience in using these litigation management tools and available information about current developments in all our cases, our legalorganization regularly assesses the adequacy of current accruals and determines if adjustment of existing accruals, or establishment of new accruals, isrequired.
Other ContingenciesWe have contingent liabilities resulting from throughput agreements with pipeline and processing companies not associated with financingarrangements. Under these agreements, we may be required to provide any such company with additional funds through advances and penalties for feesrelated to throughput capacity not utilized.
At March 31, 2017 , we had performance obligations secured by letters of credit and bank guarantees of $602 million (of which $51 million was issuedunder the provisions of our revolving credit facility, and the remainder was issued as direct bank letters of credit and bank guarantees) related to variouspurchase and other commitments incident to the ordinary conduct of business.
Note 13— Derivatives and Financial Instruments
Derivative InstrumentsWe use financial and commodity-based derivative contracts to manage exposures to fluctuations in commodity prices, interest rates, foreign currencyexchange rates, or to capture market opportunities. Because we do not apply hedge accounting for commodity derivative contracts, all realized orunrealized gains and losses from commodity derivative contracts are recognized in the consolidated statement of income. Gains and losses fromderivative contracts held for trading not directly related to our physical business are reported net in “Other income” on our consolidated statement ofincome. Cash flows from all our derivative activity for the periods presented appear in the operating section of the consolidated statement of cash flows.
Purchase and sales contracts with fixed minimum notional volumes for commodities that are readily convertible to cash are recorded on theconsolidated balance sheet as derivatives unless the contracts are eligible for, and we elect, the normal purchases and normal sales exception, wherebythe contracts are recorded on an accrual basis. We generally apply the normal purchases and normal sales exception to eligible crude oil, refinedproduct, NGL, natural gas and power commodity contracts to purchase or sell quantities we expect to use or sell in the normal course of business. Allother derivative instruments are recorded at fair value on our consolidated balance sheet. For further information on the fair value of derivatives, seeNote 14—Fair Value Measurements .
Commodity Derivative Contracts —We sell into or receive supply from the worldwide crude oil, refined products, NGL, natural gas and electricpower markets, exposing our revenues, purchases, cost of operating activities, and cash flows to fluctuations in the prices for these commodities.Generally, our policy is to remain exposed to the market prices of commodities; however, we use futures, forwards, swaps and options in variousmarkets to balance physical systems, meet customer needs, manage price exposures on specific transactions, and do a limited, immaterial amount oftrading not directly related to our physical business, all of which may reduce our exposure to fluctuations in market prices. We also use the marketknowledge gained from these activities to capture market opportunities such as moving physical
13
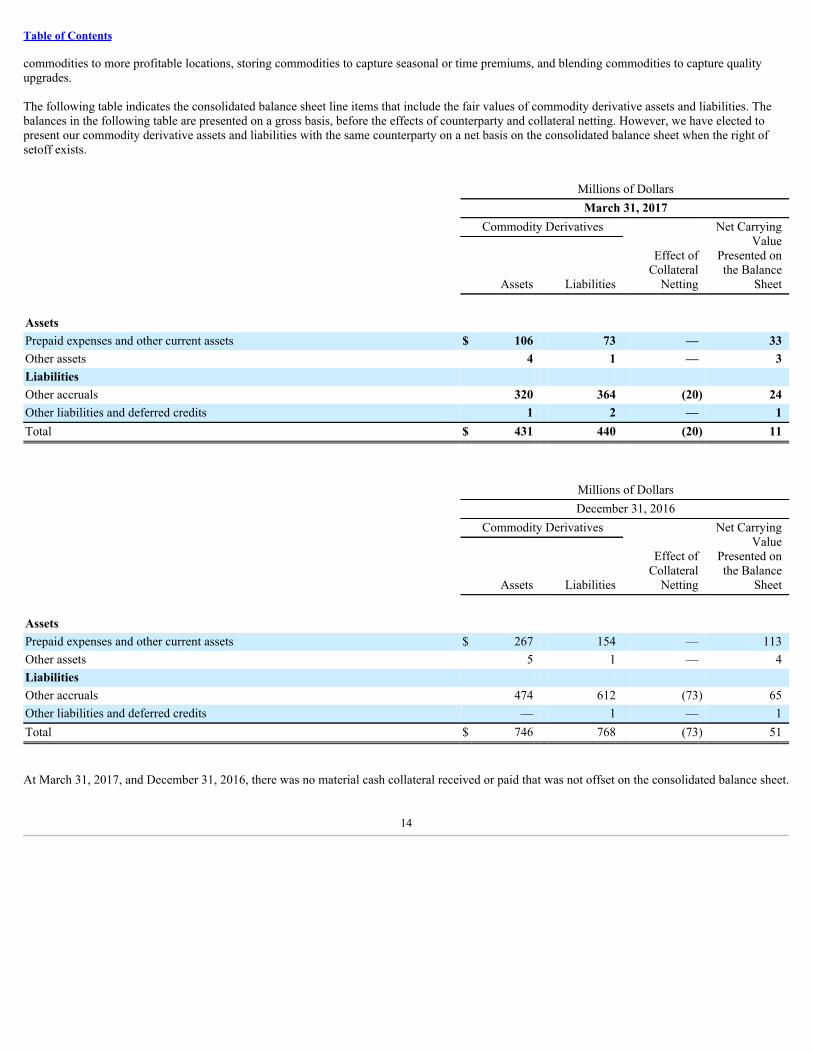
Table of Contents
commodities to more profitable locations, storing commodities to capture seasonal or time premiums, and blending commodities to capture qualityupgrades.
The following table indicates the consolidated balance sheet line items that include the fair values of commodity derivative assets and liabilities. Thebalances in the following table are presented on a gross basis, before the effects of counterparty and collateral netting. However, we have elected topresent our commodity derivative assets and liabilities with the same counterparty on a net basis on the consolidated balance sheet when the right ofsetoff exists.
Millions of Dollars March 31, 2017 Commodity Derivatives
Effect ofCollateral
Netting
Net CarryingValue
Presented onthe Balance
Sheet Assets Liabilities
Assets Prepaid expenses and other current assets $ 106 73 — 33Other assets 4 1 — 3Liabilities Other accruals 320 364 (20) 24Other liabilities and deferred credits 1 2 — 1Total $ 431 440 (20) 11
Millions of Dollars December 31, 2016 Commodity Derivatives
Effect ofCollateral
Netting
Net CarryingValue
Presented onthe Balance
Sheet Assets Liabilities
Assets Prepaid expenses and other current assets $ 267 154 — 113Other assets 5 1 — 4Liabilities Other accruals 474 612 (73) 65Other liabilities and deferred credits — 1 — 1Total $ 746 768 (73) 51
At March 31, 2017, and December 31, 2016, there was no material cash collateral received or paid that was not offset on the consolidated balance sheet.
14

Table of Contents
The gains (losses) incurred from commodity derivatives, and the line items where they appear on our consolidated statement of income, were:
Millions of Dollars
Three Months Ended
March 31 2017 2016
Sales and other operating revenues $ 68 (86)Other income 9 9Purchased crude oil and products 45 (36)Net gain (loss) from commodity derivative activity $ 122 (113)
The following table summarizes our material net exposures resulting from outstanding commodity derivative contracts. These financial and physicalderivative contracts are primarily used to manage price exposure on our underlying operations. The underlying exposures may be from non-derivativepositions such as inventory volumes. Financial derivative contracts may also offset physical derivative contracts, such as forward sales contracts. Thepercentage of our derivative contract volumes expiring within the next 12 months was at least 98 percent at March 31, 2017 , and December 31, 2016 .
Open PositionLong/(Short)
March 31
2017 December 31
2016Commodity Crude oil, refined products and NGL (millions of barrels) (33) (18)
Interest-Rate Derivative Contracts —During the first quarter of 2016, we entered into interest-rate swaps to hedge the variability of anticipated leasepayments on our new headquarters. These monthly lease payments will vary based on monthly changes in the one-month LIBOR and changes, if any,in the Company’s credit rating over the five -year term of the lease. The pay-fixed, receive-floating interest rate swaps have an aggregate notional valueof $650 million and end on April 25, 2021. They qualify for and are designated as cash-flow hedges.
At March 31, 2017, and December 31, 2016, the aggregate net fair value of these swaps, which is included in the “Other accruals” and “Other assets”lines of our consolidated balance sheet, amounted to $10 million and $8 million , respectively.
We report the effective portion of the mark-to-market gain or loss on our interest rate swaps designated and qualifying as a cash flow hedginginstrument as a component of other comprehensive income/loss and reclassify such gains and losses into earnings in the same period during which thehedged forecasted transaction affects earnings. Gains and losses due to ineffectiveness are recognized in general and administrative expenses. We didnot recognize any material hedge ineffectiveness gain or loss in the consolidated income statement for the three months ended March 31, 2017 and2016. Net realized loss from settlements of the swaps was immaterial for the three months ended March 31, 2017 and 2016.
We estimate that pre-tax losses of $1 million will be reclassified from accumulated other comprehensive income/loss into general and administrativeexpenses during the next twelve months as the hedged transaction settles; however, the actual amounts that will be reclassified will vary based onchanges in interest rates.
15
Table of Contents
Credit RiskFinancial instruments potentially exposed to concentrations of credit risk consist primarily of over-the-counter (OTC) derivative contracts and tradereceivables.
The credit risk from our OTC derivative contracts, such as forwards and swaps, derives from the counterparty to the transaction. Individualcounterparty exposure is managed within predetermined credit limits and includes the use of cash-call margins when appropriate, thereby reducing therisk of significant nonperformance. We also use futures, swaps and option contracts that have a negligible credit risk because these trades are clearedwith an exchange clearinghouse and subject to mandatory margin requirements until settled; however, we are exposed to the credit risk of thoseexchange brokers for receivables arising from daily margin cash calls, as well as for cash deposited to meet initial margin requirements.
Our trade receivables result primarily from the sale of products from, or related to, our refinery operations and reflect a broad national and internationalcustomer base, which limits our exposure to concentrations of credit risk. The majority of these receivables have payment terms of 30 days or less . Wecontinually monitor this exposure and the creditworthiness of the counterparties and recognize bad debt expense based on historical write-offexperience or specific counterparty collectability. Generally, we do not require collateral to limit the exposure to loss; however, we will sometimes useletters of credit, prepayments, or master netting arrangements to mitigate credit risk with counterparties that both buy from and sell to us, as theseagreements permit the amounts owed by us or owed to others to be offset against amounts due to us.
Certain of our derivative instruments contain provisions that require us to post collateral if the derivative exposure exceeds a threshold amount. Wehave contracts with fixed threshold amounts and other contracts with variable threshold amounts that are contingent on our credit rating. The variablethreshold amounts typically decline for lower credit ratings, while both the variable and fixed threshold amounts typically revert to zero if our creditratings fall below investment grade. Cash is the primary collateral in all contracts; however, many contracts also permit us to post letters of credit ascollateral.
The aggregate fair values of all derivative instruments with such credit-risk-related contingent features that were in a liability position were not materialat March 31, 2017 , or December 31, 2016 .
16
Table of Contents
Note 14— Fair Value Measurements
Recurring Fair Values MeasurementsWe carry certain assets and liabilities at fair value, which we measure at the reporting date using an exit price (i.e., the price that would be received tosell an asset or paid to transfer a liability), and disclose the quality of these fair values based on the valuation inputs used in these measurements underthe following hierarchy:
• Level 1: Fair value measured with unadjusted quoted prices from an active market for identical assets or liabilities.• Level 2: Fair value measured either with: (1) adjusted quoted prices from an active market for similar assets or liabilities; or (2) other valuation
inputs that are directly or indirectly observable.• Level 3: Fair value measured with unobservable inputs that are significant to the measurement.
We classify the fair value of an asset or liability based on the lowest level of input significant to its measurement; however, the fair value of an asset orliability initially reported as Level 3 will be subsequently reported as Level 2 if the unobservable inputs become inconsequential to its measurement orcorroborating market data becomes available. Conversely, an asset or liability initially reported as Level 2 will be subsequently reported as Level 3 ifcorroborating market data becomes unavailable. For the three-month period ended March 31, 2017 , derivative assets with an aggregate value of $30million and derivative liabilities with an aggregate value of $34 million were transferred into Level 1 from Level 2, as measured from the beginning ofthe reporting period. The measurements were reclassified within the fair value hierarchy due to the availability of unadjusted quoted prices from anactive market.
We used the following methods and assumptions to estimate the fair value of financial instruments:
• Cash and cash equivalents —The carrying amount reported on the consolidated balance sheet approximates fair value.• Accounts and notes receivable —The carrying amount reported on the consolidated balance sheet approximates fair value.• Derivative instruments —We fair value our exchange-traded contracts based on quoted market prices obtained from the New York Mercantile
Exchange, the Intercontinental Exchange, or other exchanges, and classify them as Level 1 in the fair value hierarchy. When exchange-clearedcontracts lack sufficient liquidity or are valued using either adjusted exchange-provided prices or non-exchange quotes, we classify thosecontracts as Level 2.OTC financial swaps and physical commodity forward purchase and sales contracts are generally valued using forward quotes provided bybrokers and price index developers such as Platts and Oil Price Information Service. We corroborate these quotes with market data and classifythe resulting fair values as Level 2. When forward market prices are not available, we estimate fair value using the forward price of a similarcommodity, adjusted for the difference in quality or location. In certain less liquid markets or for longer-term contracts, forward prices are notas readily available. In these circumstances, OTC swaps and physical commodity purchase and sales contracts are valued using internallydeveloped methodologies that consider historical relationships among various commodities that result in management’s best estimate of fairvalue. We classify these contracts as Level 3. Financial OTC and physical commodity options are valued using industry-standard models thatconsider various assumptions, including quoted forward prices for commodities, time value, volatility factors, and contractual prices for theunderlying instruments, as well as other relevant economic measures. The degree to which these inputs are observable in the forward marketsdetermines whether the options are classified as Level 2 or 3. We use a mid-market pricing convention (the mid-point between bid and askprices). When appropriate, valuations are adjusted to reflect credit considerations, generally based on available market evidence.We determine the fair value of our interest rate swaps based upon observed market valuations for interest-rate swaps that have notionals,durations, and pay and reset frequencies similar to ours.
• Rabbi trust assets —The deferred compensation investments are measured at fair value using unadjusted prices available from nationalsecurities exchanges; therefore, these assets are categorized as Level 1 in the fair value hierarchy.
17
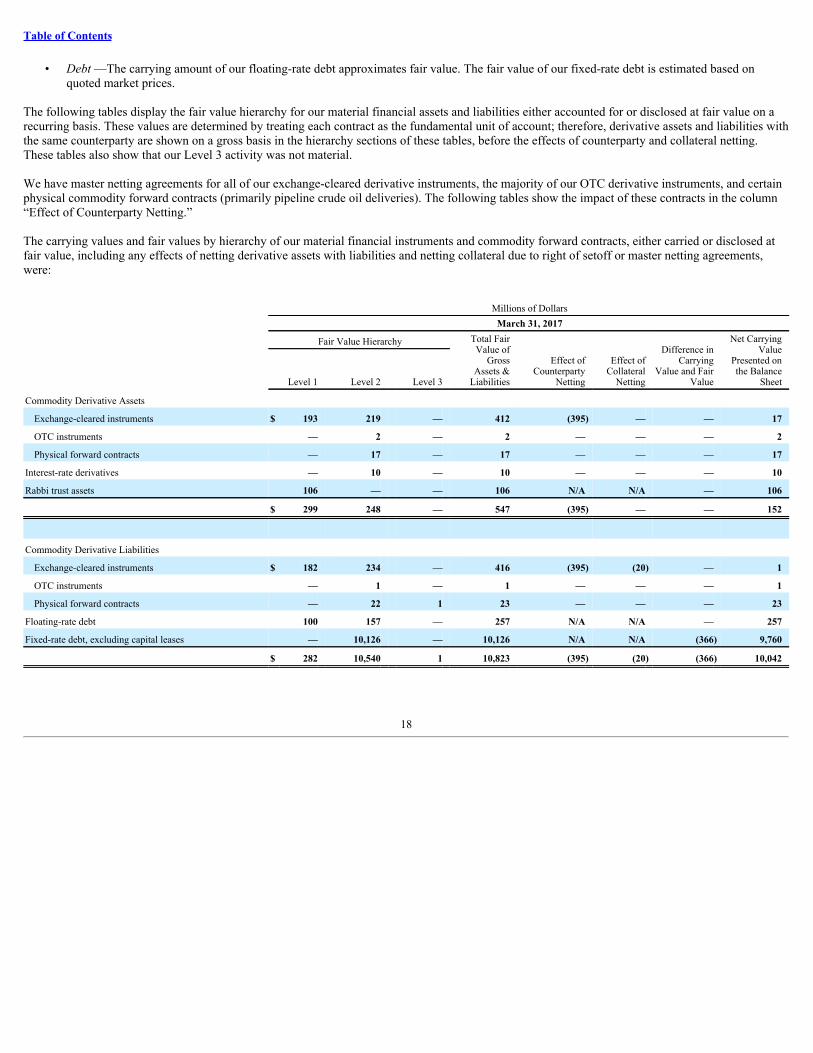
Table of Contents
• Debt —The carrying amount of our floating-rate debt approximates fair value. The fair value of our fixed-rate debt is estimated based onquoted market prices.
The following tables display the fair value hierarchy for our material financial assets and liabilities either accounted for or disclosed at fair value on arecurring basis. These values are determined by treating each contract as the fundamental unit of account; therefore, derivative assets and liabilities withthe same counterparty are shown on a gross basis in the hierarchy sections of these tables, before the effects of counterparty and collateral netting.These tables also show that our Level 3 activity was not material.
We have master netting agreements for all of our exchange-cleared derivative instruments, the majority of our OTC derivative instruments, and certainphysical commodity forward contracts (primarily pipeline crude oil deliveries). The following tables show the impact of these contracts in the column“Effect of Counterparty Netting.”
The carrying values and fair values by hierarchy of our material financial instruments and commodity forward contracts, either carried or disclosed atfair value, including any effects of netting derivative assets with liabilities and netting collateral due to right of setoff or master netting agreements,were:
Millions of Dollars March 31, 2017 Fair Value Hierarchy
Total FairValue of
GrossAssets &
Liabilities
Effect ofCounterparty
Netting
Effect ofCollateral
Netting
Difference inCarrying
Value and FairValue
Net CarryingValue
Presented onthe Balance
Sheet Level 1 Level 2 Level 3
Commodity Derivative Assets
Exchange-cleared instruments $ 193 219 — 412 (395) — — 17
OTC instruments — 2 — 2 — — — 2
Physical forward contracts — 17 — 17 — — — 17
Interest-rate derivatives — 10 — 10 — — — 10
Rabbi trust assets 106 — — 106 N/A N/A — 106
$ 299 248 — 547 (395) — — 152
Commodity Derivative Liabilities
Exchange-cleared instruments $ 182 234 — 416 (395) (20) — 1
OTC instruments — 1 — 1 — — — 1
Physical forward contracts — 22 1 23 — — — 23
Floating-rate debt 100 157 — 257 N/A N/A — 257
Fixed-rate debt, excluding capital leases — 10,126 — 10,126 N/A N/A (366) 9,760
$ 282 10,540 1 10,823 (395) (20) (366) 10,042
18
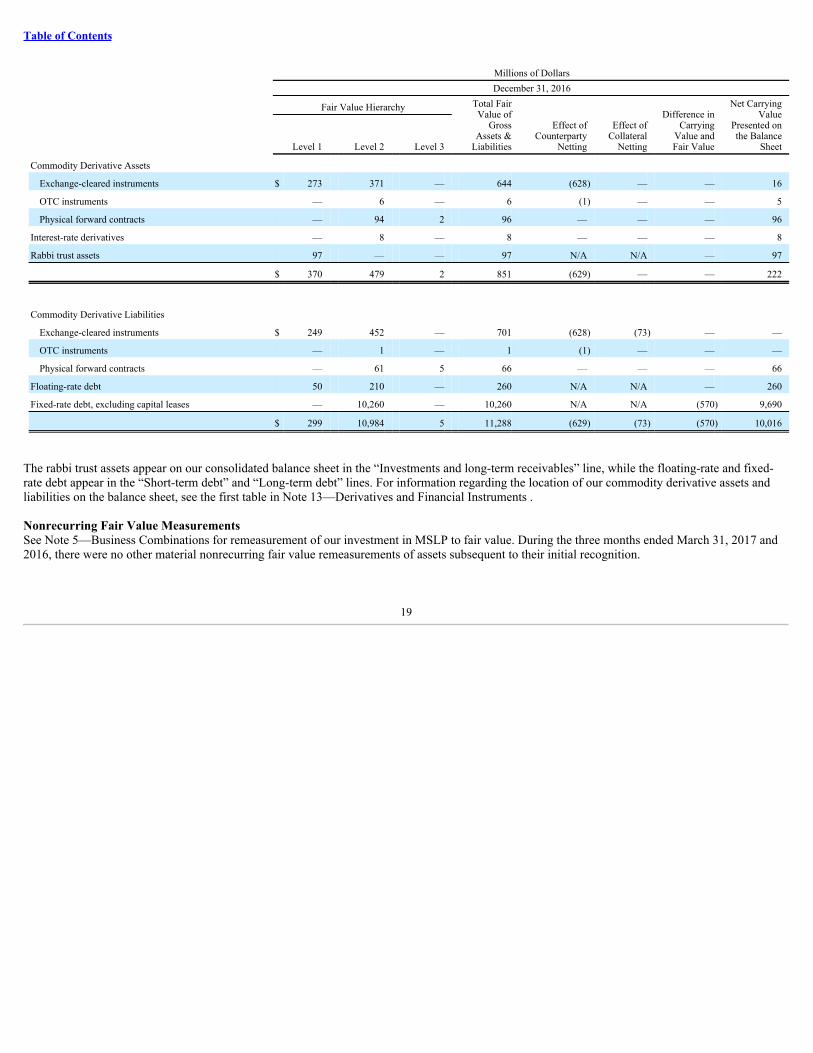
Table of Contents
Millions of Dollars December 31, 2016
Fair Value Hierarchy Total FairValue of
GrossAssets &
Liabilities
Effect ofCounterparty
Netting
Effect ofCollateral
Netting
Difference inCarrying
Value andFair Value
Net CarryingValue
Presented onthe Balance
Sheet Level 1 Level 2 Level 3
Commodity Derivative Assets
Exchange-cleared instruments $ 273 371 — 644 (628) — — 16
OTC instruments — 6 — 6 (1) — — 5
Physical forward contracts — 94 2 96 — — — 96
Interest-rate derivatives — 8 — 8 — — — 8
Rabbi trust assets 97 — — 97 N/A N/A — 97
$ 370 479 2 851 (629) — — 222
Commodity Derivative Liabilities
Exchange-cleared instruments $ 249 452 — 701 (628) (73) — —
OTC instruments — 1 — 1 (1) — — —
Physical forward contracts — 61 5 66 — — — 66
Floating-rate debt 50 210 — 260 N/A N/A — 260
Fixed-rate debt, excluding capital leases — 10,260 — 10,260 N/A N/A (570) 9,690
$ 299 10,984 5 11,288 (629) (73) (570) 10,016
The rabbi trust assets appear on our consolidated balance sheet in the “Investments and long-term receivables” line, while the floating-rate and fixed-rate debt appear in the “Short-term debt” and “Long-term debt” lines. For information regarding the location of our commodity derivative assets andliabilities on the balance sheet, see the first table in Note 13—Derivatives and Financial Instruments .
Nonrecurring Fair Value MeasurementsSee Note 5—Business Combinations for remeasurement of our investment in MSLP to fair value. During the three months ended March 31, 2017 and2016, there were no other material nonrecurring fair value remeasurements of assets subsequent to their initial recognition.
19
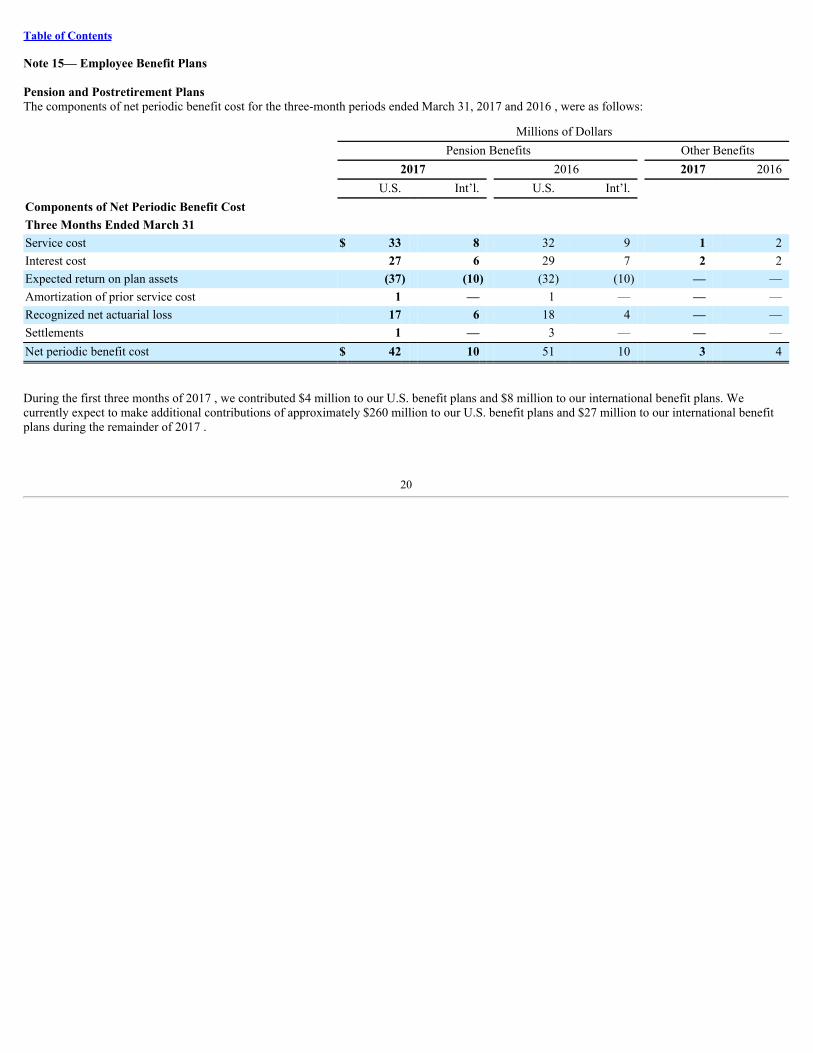
Table of Contents
Note 15— Employee Benefit Plans
Pension and Postretirement PlansThe components of net periodic benefit cost for the three-month periods ended March 31, 2017 and 2016 , were as follows:
Millions of Dollars Pension Benefits Other Benefits 2017 2016 2017 2016 U.S. Int’l. U.S. Int’l. Components of Net Periodic Benefit Cost Three Months Ended March 31 Service cost $ 33 8 32 9 1 2Interest cost 27 6 29 7 2 2Expected return on plan assets (37) (10) (32) (10) — —Amortization of prior service cost 1 — 1 — — —Recognized net actuarial loss 17 6 18 4 — —Settlements 1 — 3 — — —Net periodic benefit cost $ 42 10 51 10 3 4
During the first three months of 2017 , we contributed $4 million to our U.S. benefit plans and $8 million to our international benefit plans. Wecurrently expect to make additional contributions of approximately $260 million to our U.S. benefit plans and $27 million to our international benefitplans during the remainder of 2017 .
20

Table of Contents
Note 16— Accumulated Other Comprehensive Income (Loss)
The following table depicts changes in accumulated other comprehensive income (loss) by component, as well as detail on reclassifications out ofaccumulated other comprehensive income (loss):
Millions of Dollars
Defined
Benefit Plans
ForeignCurrency
Translation Hedging
AccumulatedOther
ComprehensiveIncome (Loss)
December 31, 2015 $ (662) 11 (2) (653)Other comprehensive income (loss) before reclassifications 4 (17) (5) (18)Amounts reclassified from accumulated other comprehensive income (loss)*
Amortization of defined benefit plan items** Actuarial losses and settlements 14 — — 14
Net current period other comprehensive income (loss) 18 (17) (5) (4)March 31, 2016 $ (644) (6) (7) (657)
December 31, 2016 $ (713) (285) 3 (995)Other comprehensive income before reclassifications 2 24 2 28Amounts reclassified from accumulated other comprehensive income (loss)*
Amortization of defined benefit plan items** Actuarial losses and settlements 15 — — 15
Net current period other comprehensive income 17 24 2 43March 31, 2017 $ (696) (261) 5 (952)* There were no significant reclassifications related to foreign currency translation or hedging.
** These accumulated other comprehensive income (loss) components are included in the computation of net periodic benefit cost (see Note 15—Employee Benefit Plans , for additionalinformation).
Note 17— Restricted Cash
The following table provides a reconciliation of cash, cash equivalents and restricted cash as shown in the consolidated statement of cash flows to theamounts reflected in the consolidated balance sheet.
Millions of Dollars
March 31
2017 December 31
2016
Cash and cash equivalents $ 1,513 2,711Restricted cash included in: Prepaid expenses and other current assets 69 — Other assets 54 —Cash, cash equivalents and restricted cash $ 1,636 2,711
Restricted cash in prepaid expenses and other current assets represents amounts set aside in accordance with a lender’s agreement for payment ofMSLP’s operating expenditures and financing principal and interest. Restricted cash in other assets represents amounts set aside in accordance with alender’s agreement for payment of MSLP turnaround expenses expected to be paid in 2018.
21

Table of Contents
Note 18— Related Party Transactions
Significant transactions with related parties were:
Millions of Dollars
Three Months Ended
March 31 2017 2016
Operating revenues and other income (a) $ 571 407Purchases (b) 2,144 1,503Operating expenses and selling, general and administrative expenses (c) 26 33
As discussed more fully in Note 5— Business Combinations , in February 2017, we began accounting for MSLP as a wholly owned consolidatedsubsidiary. Accordingly, processing fees paid to MSLP are only included through the consolidation date in the table above.
(a) We sold NGL and other petrochemical feedstocks, along with solvents, to CPChem, and we sold gas oil and hydrogen feedstocks to ExcelParalubes (Excel). We sold certain feedstocks and intermediate products to WRB and also acted as agent for WRB in supplying crude oil andother feedstocks for a fee. We also sold refined products to our OnCue Holdings, LLC joint venture. In addition, we charged several of ouraffiliates, including CPChem, for the use of common facilities, such as steam generators, waste and water treaters, and warehouse facilities.
(b) We purchased crude oil and refined products from WRB. We also acted as agent for WRB in distributing asphalt and solvents for a fee. Wepurchased natural gas and NGL from DCP Midstream and CPChem, as well as other feedstocks from various affiliates, for use in our refineryand fractionation processes. We paid NGL fractionation fees to CPChem. We also paid fees to various pipeline equity companies for transportingcrude oil, finished refined products and NGL. We purchased base oils and fuel products from Excel for use in our refining and specialtybusinesses.
(c) We paid utility and processing fees to various affiliates.
22
Table of Contents
Note 19— Segment Disclosures and Related Information
Our operating segments are:
1) Midstream— Gathers, processes, transports and markets natural gas; and transports, stores, fractionates and markets NGL in the UnitedStates. In addition, this segment transports crude oil and other feedstocks to our refineries and other locations, delivers refined andspecialty products to market, and provides terminaling and storage services for crude oil and petroleum products. The segment also stores,refrigerates and exports liquefied petroleum gas primarily to Asia and Europe. The Midstream segment includes our master limitedpartnership, Phillips 66 Partners LP, as well as our 50 percent equity investment in DCP Midstream.
2) Chemicals— Consists of our 50 percent equity investment in CPChem, which manufactures and markets petrochemicals and plastics on aworldwide basis.
3) Refining— Buys, sells and refines crude oil and other feedstocks at 13 refineries, mainly in the United States and Europe.
4) Marketing and Specialties— Purchases for resale and markets refined products (such as gasolines, distillates and aviation fuels), mainlyin the United States and Europe. In addition, this segment includes the manufacturing and marketing of specialty products (such as baseoils and lubricants), as well as power generation operations.
Corporate and Other includes general corporate overhead, interest expense, our investments in new technologies and various other corporate activities.Corporate assets include all cash and cash equivalents.
We evaluate segment performance based on net income attributable to Phillips 66. Intersegment sales are at prices that approximate market.
23

Table of Contents
Analysis of Results by Operating Segment
Millions of Dollars
Three Months Ended
March 31 2017 2016Sales and Other Operating Revenues Midstream
Total sales $ 1,659 931Intersegment eliminations (438) (292)
Total Midstream 1,221 639Chemicals 1 1Refining
Total sales 14,292 10,238Intersegment eliminations (8,670) (6,559)
Total Refining 5,622 3,679Marketing and Specialties
Total sales 16,366 13,348Intersegment eliminations (324) (266)
Total Marketing and Specialties 16,042 13,082Corporate and Other 8 8Consolidated sales and other operating revenues $ 22,894 17,409
Net Income (Loss) Attributable to Phillips 66 Midstream $ 77 65Chemicals 181 156Refining 259 86Marketing and Specialties 141 205Corporate and Other (123) (127)Consolidated net income attributable to Phillips 66 $ 535 385
Millions of Dollars
March 31
2017 December 31
2016Total Assets Midstream $ 12,584 12,832Chemicals 6,029 5,802Refining 23,715 22,825Marketing and Specialties 6,051 6,227Corporate and Other 3,026 3,967Consolidated total assets $ 51,405 51,653
24
Table of Contents
Note 20— Income Taxes
Our effective tax rate for the first quarter of 2017 was 29 percent , compared with 33 percent for the corresponding period of 2016 . The decrease in theeffective tax rate was primarily attributable to the relative impact of foreign earnings that are subject to a lower tax rate and the recognition in theincome statement of excess tax benefits associated with share-based compensation.
The effective tax rate varies from the federal statutory tax rate of 35 percent primarily as a result of foreign operations, excess tax benefits associatedwith share-based compensation and the impact of income attributable to noncontrolling interests, partially offset by state tax expense.
Note 21— Phillips 66 Partners LP
Phillips 66 Partners is a publicly traded master limited partnership formed to own, operate, develop and acquire primarily fee-based crude oil, refinedpetroleum product and NGL pipelines and terminals, as well as other midstream assets. Headquartered in Houston, Texas, Phillips 66 Partners’ assetscurrently consist of crude oil, refined petroleum products and NGL transportation, terminaling and storage systems, as well as an NGL fractionator.Phillips 66 Partners conducts its operations through both wholly owned and joint-venture operations. The majority of Phillips 66 Partners’ whollyowned assets are associated with, and integral to the operation of, nine of Phillips 66’s owned or joint-venture refineries.
In June 2016, Phillips 66 Partners began issuing common units under a continuous offering program, which allows for the issuance of up to anaggregate of $250 million of Phillips 66 Partners’ common units, in amounts, at prices and on terms to be determined by market conditions and otherfactors at the time of the offerings (such continuous offering program, or at-the-market program, referred to as the ATM program). For the three monthsended March 31, 2017, on a settlement-date basis, Phillips 66 Partners issued 744,968 common units under the ATM program, which generated netproceeds of $40 million . From inception through March 31, 2017, Phillips 66 Partners has issued an aggregate of 1,091,120 common units under theATM program, generating net proceeds of $58 million .
At March 31, 2017 , we owned a 58 percent limited partner interest and a 2 percent general partner interest in Phillips 66 Partners, while the publicowned a 40 percent limited partner interest. We consolidate Phillips 66 Partners as a variable interest entity for financial reporting purposes. See Note 3—Variable Interest Entities (VIEs) , for additional information on why we consolidate the partnership. As a result of this consolidation, the publicunitholders’ ownership interest in Phillips 66 Partners is reflected as a noncontrolling interest in our financial statements.
Note 22— New Accounting Standards
In January 2017, the FASB issued ASU No. 2017-01, “Business Combinations (Topic 805): Clarifying the Definition of a Business,” which clarifiesthe definition of a business with the objective of adding guidance to assist in evaluating whether transactions should be accounted for as acquisitions ofassets or businesses. The amendment provides a screen for determining when a transaction involves an acquisition of a business. If substantially all ofthe fair value of the gross assets acquired is concentrated in a single identifiable asset or a group of similar identifiable assets, then the transaction doesnot involve the acquisition of a business. If the screen is not met, then the amendment requires that to be considered a business, the operation mustinclude at a minimum an input and a substantive process that together significantly contribute to the ability to create an output. The guidance mayreduce the number of transactions accounted for as business acquisitions. Public business entities should apply the guidance in ASU No. 2017-01 toannual periods beginning after December 15, 2017, including interim periods within those periods, with early adoption permitted. The amendmentsshould be applied prospectively, and no disclosures are required at the effective date. We are currently evaluating the provisions of ASU No. 2017-01.
In June 2016, the FASB issued ASU No. 2016-13, “Financial Instruments—Credit Losses (Topic 326): Measurement of Credit Losses on FinancialInstruments.” The new standard amends the impairment model to utilize an expected loss methodology in place of the currently used incurred lossmethodology, which will result in the more timely recognition of losses. Public business entities should apply the guidance in ASU No. 2016-13 forannual periods beginning after December 15, 2019, including interim periods within those annual periods. Early adoption will be permitted for annual
25
Table of Contents
periods beginning after December 15, 2018. We are currently evaluating the provisions of ASU No. 2016-13 and assessing the impact on our financialstatements.
In February 2016, the FASB issued ASU No. 2016-02, “Leases (Topic 842).” In the new standard, the FASB modified its determination of whether acontract is a lease rather than whether a lease is a capital or operating lease under the previous accounting principles generally accepted in the UnitedStates (GAAP). A contract represents a lease if a transfer of control occurs over an identified property, plant and equipment for a period of time inexchange for consideration. Control over the use of the identified asset includes the right to obtain substantially all of the economic benefits from theuse of the asset and the right to direct its use. The FASB continued to maintain two classifications of leases—financing and operating—which aresubstantially similar to capital and operating leases in the previous lease guidance. Under the new standard, recognition of assets and liabilities arisingfrom operating leases will require recognition on the balance sheet. The effect of all leases in the statement of comprehensive income and the statementof cash flows will be largely unchanged. Lessor accounting will also be largely unchanged. Additional disclosures will be required for financing andoperating leases for both lessors and lessees. Public business entities should apply the guidance in ASU No. 2016-02 for annual periods beginning afterDecember 15, 2018, including interim periods within those annual periods. Early adoption is permitted. Entities are required to adopt the ASU using amodified retrospective approach, subject to certain optional practical expedients, and apply the provisions of ASU No. 2016-02 to leasing arrangementsexisting at or entered into after the earliest comparative period presented in the financial statements. We are currently evaluating the provisions of ASUNo. 2016-02 and assessing its impact on our financial statements.
In January 2016, the FASB issued ASU No. 2016-01, “Financial Instruments—Overall (Subtopic 825-10): Recognition and Measurement of FinancialAssets and Financial Liabilities,” to meet its objective of providing more decision-useful information about financial instruments. The majority of thisASU’s provisions amend only the presentation or disclosures of financial instruments; however, one provision will also affect net income. Equityinvestments carried under the cost method or lower of cost or fair value method of accounting, in accordance with current GAAP, will have to becarried at fair value upon adoption of ASU No. 2016-01, with changes in fair value recorded in net income. For equity investments that do not havereadily determinable fair values, a company may elect to carry such investments at cost less impairments, if any, adjusted up or down for price changesin similar financial instruments issued by the investee, when and if observed. Public business entities should apply the guidance in ASU No. 2016-01for annual periods beginning after December 15, 2017, and interim periods within those annual periods, with early adoption prohibited. We arecurrently evaluating the provisions of ASU No. 2016-01. Our initial review indicates that ASU No. 2016-01 will have a limited impact on our financialstatements.
In May 2014, the FASB issued ASU No. 2014-09, “Revenue from Contracts with Customers (Topic 606).” The new standard converged guidance onrecognizing revenues in contracts with customers under GAAP and International Financial Reporting Standards. This ASU is intended to improvecomparability of revenue recognition practices across entities, industries, jurisdictions and capital markets. In August 2015, the FASB issued ASU No.2015-14, “Revenue from Contracts with Customers (Topic 606): Deferral of the Effective Date.” The amendment in this ASU defers the effective dateof ASU No. 2014-09 for all entities for one year. Public business entities should apply the guidance in ASU No. 2014-09 to annual reporting periodsbeginning after December 15, 2017, including interim reporting periods within that reporting period. Earlier adoption is permitted only as of annualreporting periods beginning after December 31, 2016, including interim reporting periods within that reporting period. As part of our assessment work-to-date, we have formed an implementation work team, completed training on the new ASU’s revenue recognition model and are continuing ourcontract review and documentation. Our expectation is to adopt the standard on January 1, 2018, using the modified retrospective application. Inaddition, we expect to present revenue net of sales-based taxes collected from our customers resulting in no impact to earnings. Sales-based taxesinclude excise taxes on petroleum product sales as noted on our consolidated statement of income. Our evaluation of the new ASU is ongoing, whichincludes understanding the impact of adoption on earnings from equity method investments. Based on our analysis to date, we have not identified anyother material impact on our financial statements other than disclosure.
26
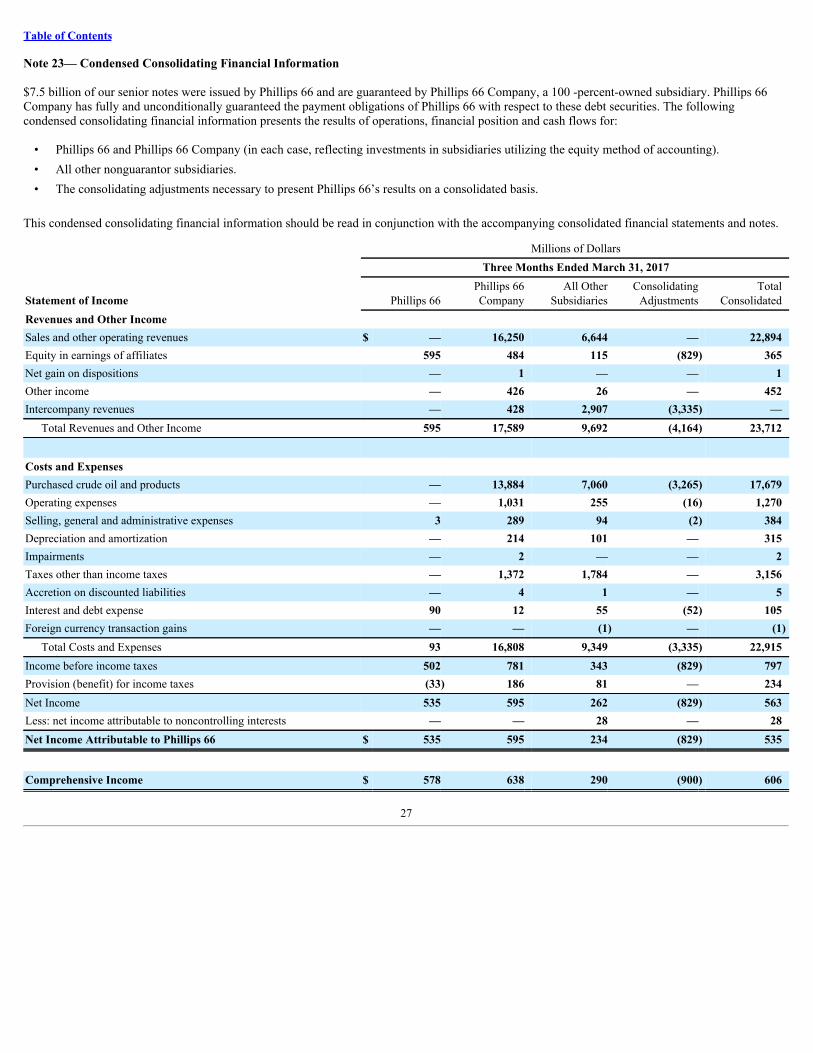
Table of Contents
Note 23— Condensed Consolidating Financial Information
$7.5 billion of our senior notes were issued by Phillips 66 and are guaranteed by Phillips 66 Company, a 100 -percent-owned subsidiary. Phillips 66Company has fully and unconditionally guaranteed the payment obligations of Phillips 66 with respect to these debt securities. The followingcondensed consolidating financial information presents the results of operations, financial position and cash flows for:
• Phillips 66 and Phillips 66 Company (in each case, reflecting investments in subsidiaries utilizing the equity method of accounting).• All other nonguarantor subsidiaries.• The consolidating adjustments necessary to present Phillips 66’s results on a consolidated basis.
This condensed consolidating financial information should be read in conjunction with the accompanying consolidated financial statements and notes.
Millions of Dollars Three Months Ended March 31, 2017
Statement of Income Phillips 66Phillips 66Company
All OtherSubsidiaries
ConsolidatingAdjustments
TotalConsolidated
Revenues and Other Income Sales and other operating revenues $ — 16,250 6,644 — 22,894Equity in earnings of affiliates 595 484 115 (829) 365Net gain on dispositions — 1 — — 1Other income — 426 26 — 452Intercompany revenues — 428 2,907 (3,335) —
Total Revenues and Other Income 595 17,589 9,692 (4,164) 23,712
Costs and Expenses Purchased crude oil and products — 13,884 7,060 (3,265) 17,679Operating expenses — 1,031 255 (16) 1,270Selling, general and administrative expenses 3 289 94 (2) 384Depreciation and amortization — 214 101 — 315Impairments — 2 — — 2Taxes other than income taxes — 1,372 1,784 — 3,156Accretion on discounted liabilities — 4 1 — 5Interest and debt expense 90 12 55 (52) 105Foreign currency transaction gains — — (1) — (1)
Total Costs and Expenses 93 16,808 9,349 (3,335) 22,915Income before income taxes 502 781 343 (829) 797Provision (benefit) for income taxes (33) 186 81 — 234Net Income 535 595 262 (829) 563Less: net income attributable to noncontrolling interests — — 28 — 28Net Income Attributable to Phillips 66 $ 535 595 234 (829) 535
Comprehensive Income $ 578 638 290 (900) 606
27
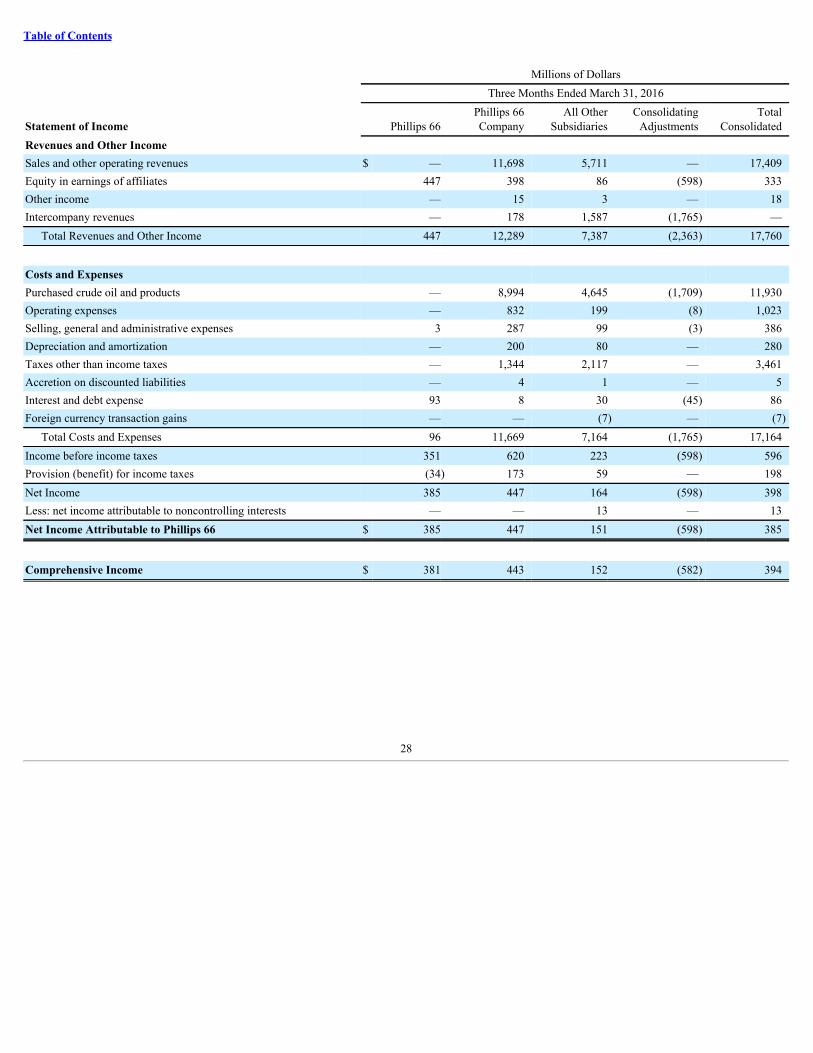
Table of Contents
Millions of Dollars Three Months Ended March 31, 2016
Statement of Income Phillips 66Phillips 66Company
All OtherSubsidiaries
ConsolidatingAdjustments
TotalConsolidated
Revenues and Other Income Sales and other operating revenues $ — 11,698 5,711 — 17,409Equity in earnings of affiliates 447 398 86 (598) 333Other income — 15 3 — 18Intercompany revenues — 178 1,587 (1,765) —
Total Revenues and Other Income 447 12,289 7,387 (2,363) 17,760
Costs and Expenses Purchased crude oil and products — 8,994 4,645 (1,709) 11,930Operating expenses — 832 199 (8) 1,023Selling, general and administrative expenses 3 287 99 (3) 386Depreciation and amortization — 200 80 — 280Taxes other than income taxes — 1,344 2,117 — 3,461Accretion on discounted liabilities — 4 1 — 5Interest and debt expense 93 8 30 (45) 86Foreign currency transaction gains — — (7) — (7)
Total Costs and Expenses 96 11,669 7,164 (1,765) 17,164Income before income taxes 351 620 223 (598) 596Provision (benefit) for income taxes (34) 173 59 — 198Net Income 385 447 164 (598) 398Less: net income attributable to noncontrolling interests — — 13 — 13Net Income Attributable to Phillips 66 $ 385 447 151 (598) 385
Comprehensive Income $ 381 443 152 (582) 394
28

Table of Contents
Millions of Dollars March 31, 2017
Balance Sheet Phillips 66Phillips 66Company
All OtherSubsidiaries
ConsolidatingAdjustments
TotalConsolidated
Assets Cash and cash equivalents $ — 217 1,296 — 1,513Accounts and notes receivable 11 3,935 3,778 (2,034) 5,690Inventories — 3,095 1,292 — 4,387Prepaid expenses and other current assets 1 371 208 — 580
Total Current Assets 12 7,618 6,574 (2,034) 12,170Investments and long-term receivables 29,698 21,203 8,421 (45,963) 13,359Net properties, plants and equipment — 13,110 8,130 — 21,240Goodwill — 2,853 417 — 3,270Intangibles — 729 166 — 895Other assets 330 242 217 (318) 471Total Assets $ 30,040 45,755 23,925 (48,315) 51,405
Liabilities and Equity Accounts payable $ — 5,507 2,899 (2,034) 6,372Short-term debt 450 15 144 — 609Accrued income and other taxes — 330 523 — 853Employee benefit obligations — 254 30 — 284Other accruals 143 370 99 — 612
Total Current Liabilities 593 6,476 3,695 (2,034) 8,730Long-term debt 6,972 51 2,578 — 9,601Asset retirement obligations and accrued
environmental costs — 460 156 — 616Deferred income taxes — 4,773 2,484 (3) 7,254Employee benefit obligations — 954 268 — 1,222Other liabilities and deferred credits 82 3,387 3,781 (6,993) 257Total Liabilities 7,647 16,101 12,962 (9,030) 27,680Common stock 10,502 25,403 10,297 (35,700) 10,502Retained earnings 12,843 5,203 (245) (4,987) 12,814Accumulated other comprehensive loss (952) (952) (450) 1,402 (952)Noncontrolling interests — — 1,361 — 1,361Total Liabilities and Equity $ 30,040 45,755 23,925 (48,315) 51,405
29
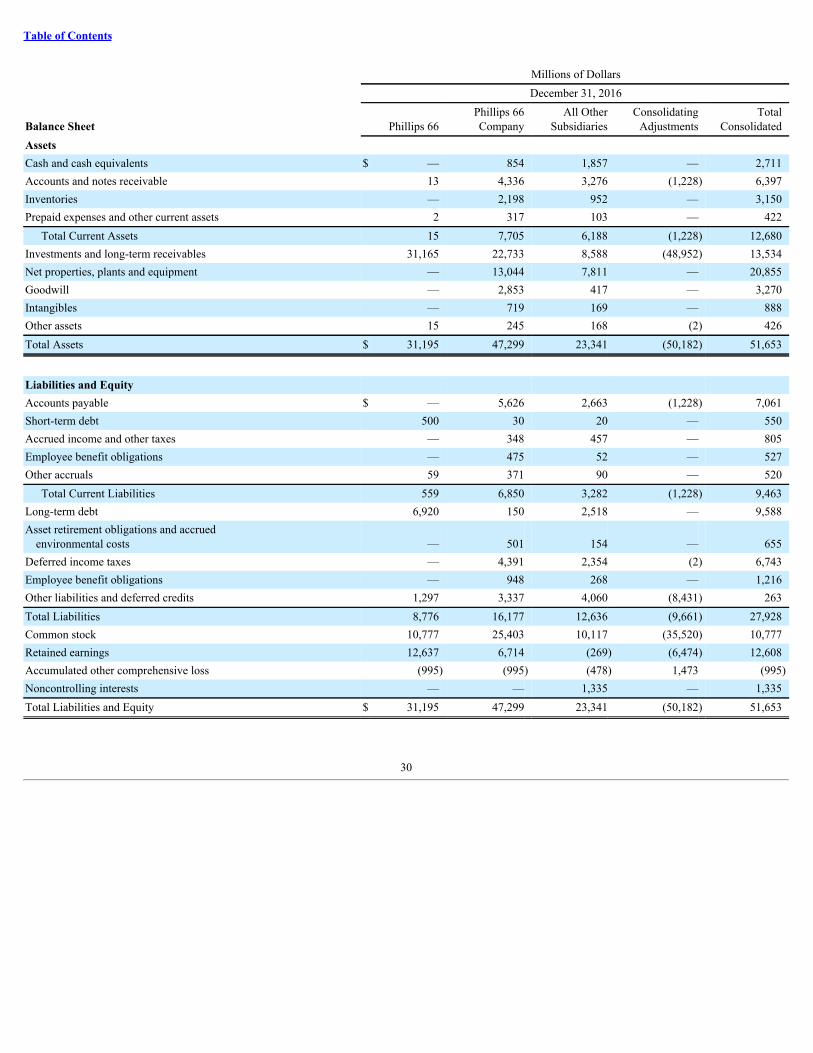
Table of Contents
Millions of Dollars December 31, 2016
Balance Sheet Phillips 66Phillips 66Company
All OtherSubsidiaries
ConsolidatingAdjustments
TotalConsolidated
Assets Cash and cash equivalents $ — 854 1,857 — 2,711Accounts and notes receivable 13 4,336 3,276 (1,228) 6,397Inventories — 2,198 952 — 3,150Prepaid expenses and other current assets 2 317 103 — 422
Total Current Assets 15 7,705 6,188 (1,228) 12,680Investments and long-term receivables 31,165 22,733 8,588 (48,952) 13,534Net properties, plants and equipment — 13,044 7,811 — 20,855Goodwill — 2,853 417 — 3,270Intangibles — 719 169 — 888Other assets 15 245 168 (2) 426Total Assets $ 31,195 47,299 23,341 (50,182) 51,653
Liabilities and Equity Accounts payable $ — 5,626 2,663 (1,228) 7,061Short-term debt 500 30 20 — 550Accrued income and other taxes — 348 457 — 805Employee benefit obligations — 475 52 — 527Other accruals 59 371 90 — 520
Total Current Liabilities 559 6,850 3,282 (1,228) 9,463Long-term debt 6,920 150 2,518 — 9,588Asset retirement obligations and accrued
environmental costs — 501 154 — 655Deferred income taxes — 4,391 2,354 (2) 6,743Employee benefit obligations — 948 268 — 1,216Other liabilities and deferred credits 1,297 3,337 4,060 (8,431) 263Total Liabilities 8,776 16,177 12,636 (9,661) 27,928Common stock 10,777 25,403 10,117 (35,520) 10,777Retained earnings 12,637 6,714 (269) (6,474) 12,608Accumulated other comprehensive loss (995) (995) (478) 1,473 (995)Noncontrolling interests — — 1,335 — 1,335Total Liabilities and Equity $ 31,195 47,299 23,341 (50,182) 51,653
30
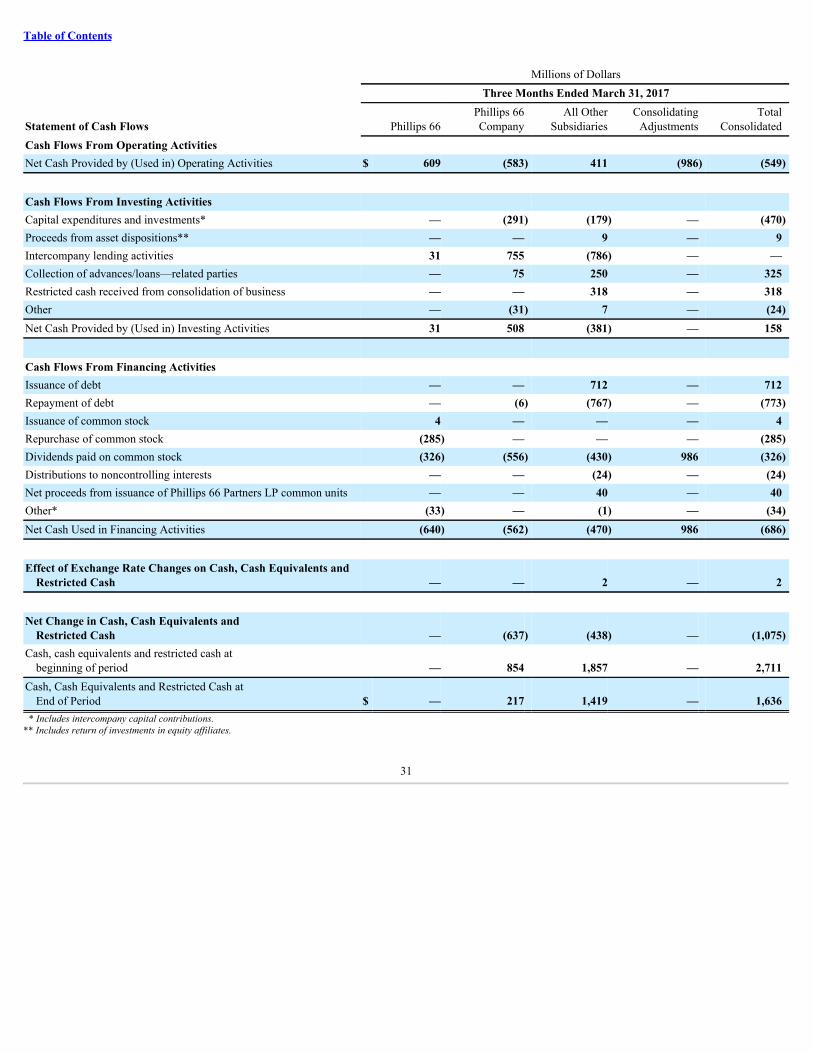
Table of Contents
Millions of Dollars Three Months Ended March 31, 2017
Statement of Cash Flows Phillips 66Phillips 66Company
All OtherSubsidiaries
ConsolidatingAdjustments
TotalConsolidated
Cash Flows From Operating Activities Net Cash Provided by (Used in) Operating Activities $ 609 (583) 411 (986) (549)
Cash Flows From Investing Activities Capital expenditures and investments* — (291) (179) — (470)Proceeds from asset dispositions** — — 9 — 9Intercompany lending activities 31 755 (786) — —Collection of advances/loans—related parties — 75 250 — 325Restricted cash received from consolidation of business — — 318 — 318Other — (31) 7 — (24)Net Cash Provided by (Used in) Investing Activities 31 508 (381) — 158
Cash Flows From Financing Activities Issuance of debt — — 712 — 712Repayment of debt — (6) (767) — (773)Issuance of common stock 4 — — — 4Repurchase of common stock (285) — — — (285)Dividends paid on common stock (326) (556) (430) 986 (326)Distributions to noncontrolling interests — — (24) — (24)Net proceeds from issuance of Phillips 66 Partners LP common units — — 40 — 40Other* (33) — (1) — (34)Net Cash Used in Financing Activities (640) (562) (470) 986 (686)
Effect of Exchange Rate Changes on Cash, Cash Equivalents andRestricted Cash — — 2 — 2
Net Change in Cash, Cash Equivalents andRestricted Cash — (637) (438) — (1,075)
Cash, cash equivalents and restricted cash atbeginning of period — 854 1,857 — 2,711
Cash, Cash Equivalents and Restricted Cash atEnd of Period $ — 217 1,419 — 1,636
* Includes intercompany capital contributions.** Includes return of investments in equity affiliates.
31
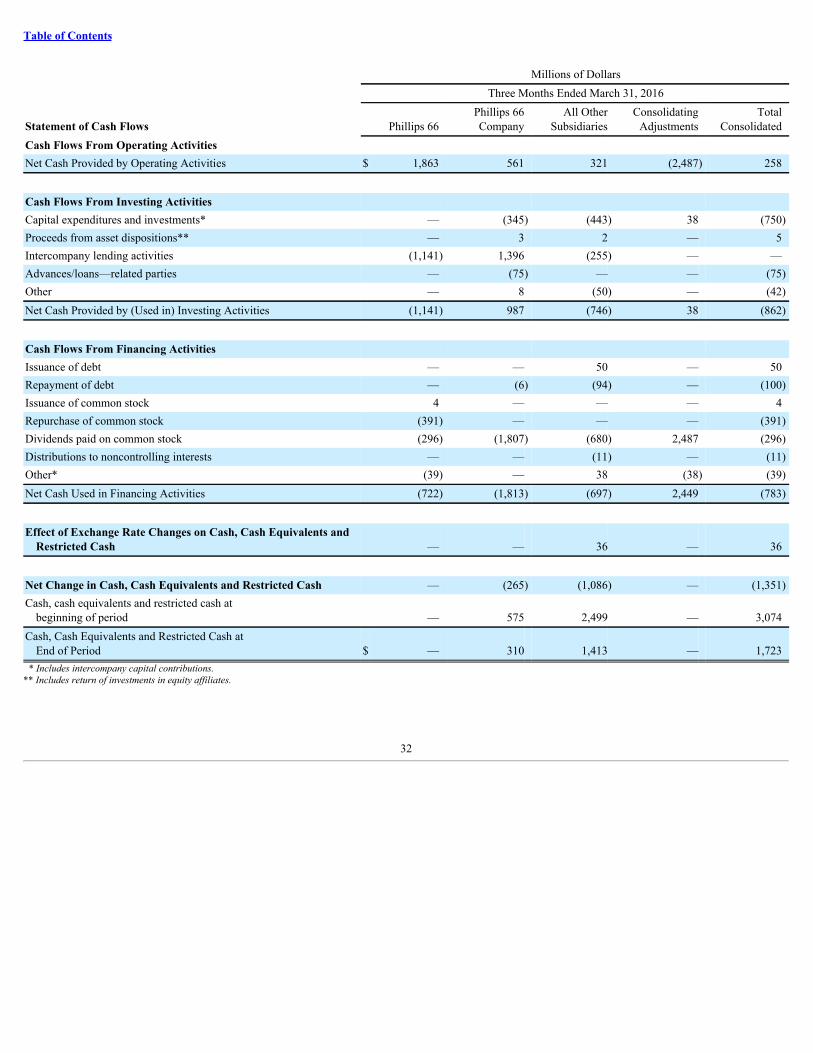
Table of Contents
Millions of Dollars Three Months Ended March 31, 2016
Statement of Cash Flows Phillips 66Phillips 66Company
All OtherSubsidiaries
ConsolidatingAdjustments
TotalConsolidated
Cash Flows From Operating Activities Net Cash Provided by Operating Activities $ 1,863 561 321 (2,487) 258
Cash Flows From Investing Activities Capital expenditures and investments* — (345) (443) 38 (750)Proceeds from asset dispositions** — 3 2 — 5Intercompany lending activities (1,141) 1,396 (255) — —Advances/loans—related parties — (75) — — (75)Other — 8 (50) — (42)Net Cash Provided by (Used in) Investing Activities (1,141) 987 (746) 38 (862)
Cash Flows From Financing Activities Issuance of debt — — 50 — 50Repayment of debt — (6) (94) — (100)Issuance of common stock 4 — — — 4Repurchase of common stock (391) — — — (391)Dividends paid on common stock (296) (1,807) (680) 2,487 (296)Distributions to noncontrolling interests — — (11) — (11)Other* (39) — 38 (38) (39)Net Cash Used in Financing Activities (722) (1,813) (697) 2,449 (783)
Effect of Exchange Rate Changes on Cash, Cash Equivalents andRestricted Cash — — 36 — 36
Net Change in Cash, Cash Equivalents and Restricted Cash — (265) (1,086) — (1,351)Cash, cash equivalents and restricted cash at
beginning of period — 575 2,499 — 3,074Cash, Cash Equivalents and Restricted Cash at
End of Period $ — 310 1,413 — 1,723* Includes intercompany capital contributions.
** Includes return of investments in equity affiliates.
32
Table of Contents
Item 2. MANAGEMENT’S DISCUSSION AND ANALYSIS OF FINANCIAL CONDITION AND RESULTS OF OPERATIONS
Unless otherwise indicated, “the company,” “we,” “our,” “us” and “Phillips 66” are used in this report to refer to the businesses of Phillips 66 andits consolidated subsidiaries. Unless the context requires otherwise, references to “DCP Midstream” include the consolidated operations of DCPMidstream, LLC, including DCP Midstream, LP (formerly named DCP Midstream Partners, LP), the master limited partnership formed by DCPMidstream, LLC.
Management’s Discussion and Analysis is the company’s analysis of its financial performance, its financial condition, and significant trends that mayaffect future performance. It should be read in conjunction with the consolidated financial statements and notes included elsewhere in this report. Itcontains forward-looking statements including, without limitation, statements relating to the company’s plans, strategies, objectives, expectations andintentions that are made pursuant to the “safe harbor” provisions of the Private Securities Litigation Reform Act of 1995. The words “anticipate,”“estimate,” “believe,” “budget,” “continue,” “could,” “intend,” “may,” “plan,” “potential,” “predict,” “seek,” “should,” “will,” “would,”“expect,” “objective,” “projection,” “forecast,” “goal,” “guidance,” “outlook,” “effort,” “target” and similar expressions identify forward-lookingstatements. The company does not undertake to update, revise or correct any of the forward-looking information unless required to do so under thefederal securities laws. Readers are cautioned that such forward-looking statements should be read in conjunction with the company’s disclosuresunder the heading: “CAUTIONARY STATEMENT FOR THE PURPOSES OF THE ‘SAFE HARBOR’ PROVISIONS OF THE PRIVATE SECURITIESLITIGATION REFORM ACT OF 1995.”
The terms “earnings” and “loss” as used in Management’s Discussion and Analysis refer to net income (loss) attributable to Phillips 66.
BUSINESS ENVIRONMENT AND EXECUTIVE OVERVIEW
Phillips 66 is an energy manufacturing and logistics company with midstream, chemicals, refining, and marketing and specialties businesses. AtMarch 31, 2017 , we had total assets of $51 billion . Our common stock trades on the New York Stock Exchange under the symbol “PSX.”
Executive OverviewWe reported earnings of $535 million in the first quarter of 2017 and cash used in operating activities of $549 million . We used available cash to fundcapital expenditures and investments of $470 million , pay dividends of $326 million and repurchase $285 million of our common stock. We ended thefirst quarter of 2017 with $1.5 billion of cash and cash equivalents and approximately $5.5 billion of total capacity available under our liquidityfacilities.
33

Table of Contents
Business EnvironmentCommodity prices remained compressed but generally improved during the first quarter of 2017. The discount of the U.S. benchmark West TexasIntermediate (WTI) crude oil price to the international benchmark Brent crude oil price widened considerably to about $2 per barrel. The sustained low-commodity-price environment had a variety of impacts, both favorable and unfavorable, on our businesses that vary by segment.
Earnings in the Midstream segment, which includes our 50 percent equity investment in DCP Midstream, LLC (DCP Midstream), are closely linked tonatural gas liquids (NGL) prices, natural gas prices and crude oil prices. NGL prices increased in the first quarter of 2017 compared with the fourthquarter and the first quarter of 2016 due to rising NGL exports and declining NGL inventories. Average natural gas prices remained consistentcompared with the fourth quarter of 2016, and improved compared with the first quarter of 2016, benefiting from declining production.
The Chemicals segment consists of our 50 percent equity investment in Chevron Phillips Chemical Company LLC (CPChem). The chemicals andplastics industry is mainly a commodity-based industry where the margins for key products are based on supply and demand, as well as cost factors.The petrochemicals industry continues to experience lower ethylene cash costs in regions of the world where ethylene manufacturing is based uponNGL rather than crude-oil-derived feedstocks. In particular, companies with North American light NGL-based crackers have benefited from lower-priced feedstocks. The ethylene to polyethylene chain margins in the first quarter of 2017 improved compared with the fourth quarter and the firstquarter of 2016.
The results of our Refining segment are driven by several factors including refining margins, cost control, refinery throughput, feedstock costs, andproduct yields. Industry crack spread indicators, the difference between market prices for refined products and crude oil, are used to estimate refiningmargins. The U.S. Gulf Coast 3:2:1 crack spread (three barrels of crude oil producing two barrels of gasoline and one barrel of diesel) increased in thefirst quarter of 2017 compared with the fourth quarter of 2016 due to higher gasoline crack spreads. The U.S. crack spread was also higher comparedwith the first quarter of 2016 due to increased gasoline and distillate crack spreads.
Results for our Marketing and Specialties (M&S) segment depend largely on marketing fuel margins, lubricant margins, and other specialty productmargins. While M&S margins are primarily driven by market factors, largely determined by the relationship between supply and demand, marketingfuel margins, in particular, are influenced by the trend in spot prices for refined products. Generally speaking, a downward trend of spot prices has afavorable impact on marketing fuel margins, while an upward trend of spot prices has an unfavorable impact on marketing fuel margins.
34
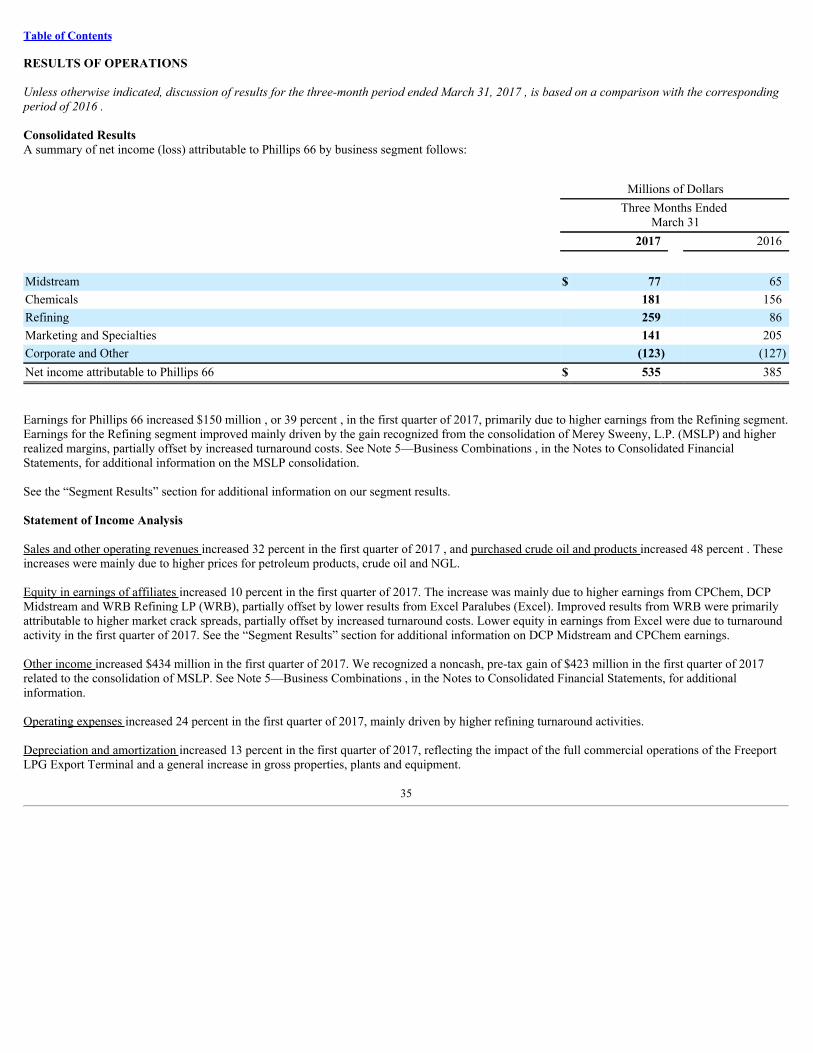
Table of Contents
RESULTS OF OPERATIONS
Unless otherwise indicated, discussion of results for the three-month period ended March 31, 2017 , is based on a comparison with the correspondingperiod of 2016 .
Consolidated ResultsA summary of net income (loss) attributable to Phillips 66 by business segment follows:
Millions of Dollars
Three Months Ended
March 31 2017 2016
Midstream $ 77 65Chemicals 181 156Refining 259 86Marketing and Specialties 141 205Corporate and Other (123) (127)Net income attributable to Phillips 66 $ 535 385
Earnings for Phillips 66 increased $150 million , or 39 percent , in the first quarter of 2017, primarily due to higher earnings from the Refining segment.Earnings for the Refining segment improved mainly driven by the gain recognized from the consolidation of Merey Sweeny, L.P. (MSLP) and higherrealized margins, partially offset by increased turnaround costs. See Note 5—Business Combinations , in the Notes to Consolidated FinancialStatements, for additional information on the MSLP consolidation.
See the “Segment Results” section for additional information on our segment results.
Statement of Income Analysis
Sales and other operating revenues increased 32 percent in the first quarter of 2017 , and purchased crude oil and products increased 48 percent . Theseincreases were mainly due to higher prices for petroleum products, crude oil and NGL.
Equity in earnings of affiliates increased 10 percent in the first quarter of 2017. The increase was mainly due to higher earnings from CPChem, DCPMidstream and WRB Refining LP (WRB), partially offset by lower results from Excel Paralubes (Excel). Improved results from WRB were primarilyattributable to higher market crack spreads, partially offset by increased turnaround costs. Lower equity in earnings from Excel were due to turnaroundactivity in the first quarter of 2017. See the “Segment Results” section for additional information on DCP Midstream and CPChem earnings.
Other income increased $434 million in the first quarter of 2017. We recognized a noncash, pre-tax gain of $423 million in the first quarter of 2017related to the consolidation of MSLP. See Note 5—Business Combinations , in the Notes to Consolidated Financial Statements, for additionalinformation.
Operating expenses increased 24 percent in the first quarter of 2017, mainly driven by higher refining turnaround activities.
Depreciation and amortization increased 13 percent in the first quarter of 2017, reflecting the impact of the full commercial operations of the FreeportLPG Export Terminal and a general increase in gross properties, plants and equipment.
35
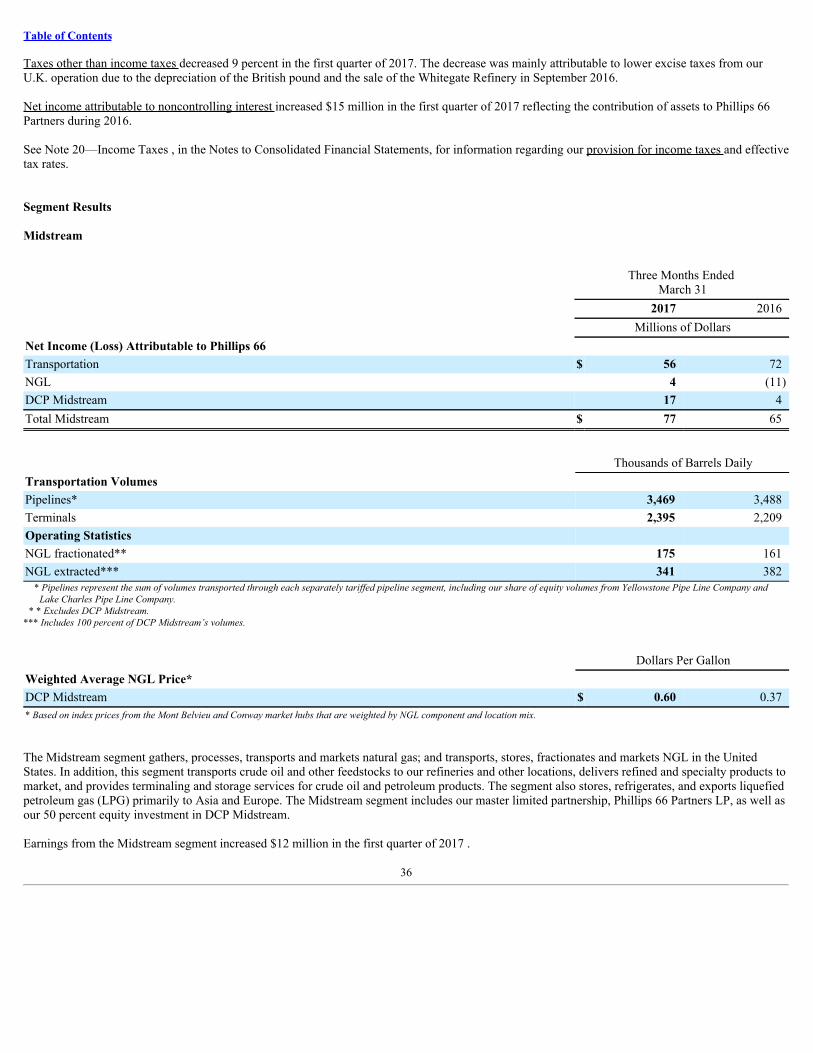
Table of Contents
Taxes other than income taxes decreased 9 percent in the first quarter of 2017. The decrease was mainly attributable to lower excise taxes from ourU.K. operation due to the depreciation of the British pound and the sale of the Whitegate Refinery in September 2016. Net income attributable to noncontrolling interest increased $15 million in the first quarter of 2017 reflecting the contribution of assets to Phillips 66Partners during 2016.
See Note 20—Income Taxes , in the Notes to Consolidated Financial Statements, for information regarding our provision for income taxes and effectivetax rates.
Segment Results
Midstream
Three Months Ended
March 31 2017 2016 Millions of DollarsNet Income (Loss) Attributable to Phillips 66 Transportation $ 56 72NGL 4 (11)DCP Midstream 17 4Total Midstream $ 77 65
Thousands of Barrels DailyTransportation Volumes Pipelines* 3,469 3,488Terminals 2,395 2,209Operating Statistics NGL fractionated** 175 161NGL extracted*** 341 382
* Pipelines represent the sum of volumes transported through each separately tariffed pipeline segment, including our share of equity volumes from Yellowstone Pipe Line Company andLake Charles Pipe Line Company.
* * Excludes DCP Midstream.*** Includes 100 percent of DCP Midstream’s volumes.
Dollars Per GallonWeighted Average NGL Price* DCP Midstream $ 0.60 0.37* Based on index prices from the Mont Belvieu and Conway market hubs that are weighted by NGL component and location mix.
The Midstream segment gathers, processes, transports and markets natural gas; and transports, stores, fractionates and markets NGL in the UnitedStates. In addition, this segment transports crude oil and other feedstocks to our refineries and other locations, delivers refined and specialty products tomarket, and provides terminaling and storage services for crude oil and petroleum products. The segment also stores, refrigerates, and exports liquefiedpetroleum gas (LPG) primarily to Asia and Europe. The Midstream segment includes our master limited partnership, Phillips 66 Partners LP, as well asour 50 percent equity investment in DCP Midstream.
Earnings from the Midstream segment increased $12 million in the first quarter of 2017 .
36

Table of Contents
Transportation earnings decreased $16 million in the first quarter of 2017 . The decrease was mainly due to higher operating costs, primarily related tointegrity and maintenance activities, and higher income attributable to noncontrolling interests, reflecting the contribution of assets to Phillips 66Partners.
Results from our NGL business improved $15 million in the first quarter of 2017 . The quarter benefited from higher realized margins, including a fullquarter of commercial operations at the Freeport LPG Export Terminal, as well as lower project development and other costs. These increases werepartially offset by higher depreciation expenses and income attributable to noncontrolling interests.
Earnings from our investment in DCP Midstream increased $13 million in the first quarter of 2017 . The increase was mainly driven by improvedhedging results, improved margins due to higher commodity prices, and lower operating costs. These increases were partially offset by a favorable legalsettlement recognized in 2016.
Effective January 1, 2017, DCP Midstream, LLC and its master limited partnership (then named DCP Midstream Partners, LP, subsequently renamedDCP Midstream, LP on January 11, 2017, and referred to herein as DCP Partners) closed a transaction in which DCP Midstream, LLC contributedsubsidiaries owning all of its operating assets and its existing debt to DCP Partners, in exchange for approximately 31.1 million DCP Partners units.Following the transaction, we and our co-venturer retained our 50/50 investment in DCP Midstream, LLC and DCP Midstream, LLC retained itsincentive distribution rights in DCP Partners, through its ownership of the general partner of DCP Partners, and held a 38 percent interest in DCPPartners. See the “Equity Affiliates” section of “Significant Sources of Capital” in “Management’s Discussion and Analysis of Financial Condition andResults of Operations” for additional information on this transaction.
See the “Business Environment and Executive Overview” section for information on market factors impacting this quarter’s results.
37

Table of Contents
Chemicals
Three Months Ended
March 31 2017 2016 Millions of Dollars
Net Income Attributable to Phillips 66 $ 181 156
Millions of PoundsCPChem Externally Marketed Sales Volumes* Olefins and Polyolefins (O&P) 4,016 4,002Specialties, Aromatics and Styrenics (SA&S) 1,206 1,254 5,222 5,256* Includes 100 percent of CPChem’s outside sales of produced petrochemical products, as well as commission sales from equity affiliates.
Olefins and Polyolefins Capacity Utilization (percent)* 89% 94* Revised to exclude polyethylene pipe operations. Prior periods recast for comparability.
The Chemicals segment consists of our 50 percent interest in CPChem, which we account for under the equity method. CPChem uses NGL and otherfeedstocks to produce petrochemicals. These products are then marketed and sold or used as feedstocks to produce plastics and other chemicals. Westructure our reporting of CPChem’s operations around two primary business lines: Olefins and Polyolefins (O&P) and Specialties, Aromatics andStyrenics (SA&S).
Earnings from the Chemicals segment increased $25 million in the first quarter of 2017 . The increase was mainly driven by higher O&P volumes andimproved benzene margins. In addition, CPChem recognized a gain from the sale of its K-Resin ® SBC business in the first quarter of 2017. Theseincreases were partially offset by lower equity earnings from CPChem’s SA&S equity affiliates due to an impairment recognized by CPChem, as wellas higher turnaround expenses.
See the “Business Environment and Executive Overview” section for information on market factors impacting this quarter’s results.
38

Table of Contents
Refining
Three Months Ended
March 31 2017 2016 Millions of DollarsNet Income (Loss) Attributable to Phillips 66 Atlantic Basin/Europe $ (50) 4Gulf Coast 328 68Central Corridor 62 20West Coast (81) (6)Worldwide $ 259 86 Dollars Per BarrelRefining Margins * Atlantic Basin/Europe $ 6.29 5.79Gulf Coast 8.03 6.76Central Corridor 10.54 7.41West Coast 9.95 9.70Worldwide 8.55 7.11* Based on total processed inputs and includes proportional share of refining margins contributed by certain equity affiliates. Thousands of Barrels DailyOperating Statistics Refining operations*
Atlantic Basin/Europe Crude oil capacity 520 588Crude oil processed 366 577Capacity utilization (percent) 70% 98Refinery production 457 611
Gulf Coast Crude oil capacity 743 743Crude oil processed 668 679Capacity utilization (percent) 90% 91Refinery production 749 755
Central Corridor Crude oil capacity 493 493Crude oil processed 470 472Capacity utilization (percent) 95% 96Refinery production 493 494
West Coast Crude oil capacity 360 360Crude oil processed 279 323Capacity utilization (percent) 78% 90Refinery production 305 350
Worldwide Crude oil capacity 2,116 2,184Crude oil processed 1,783 2,051Capacity utilization (percent) 84% 94Refinery production 2,004 2,210
* Includes our share of equity affiliates.
39
Table of Contents
The Refining segment buys, sells and refines crude oil and other feedstocks into petroleum products (such as gasoline, distillates and aviation fuels) at13 refineries, mainly in the United States and Europe.
Earnings for the Refining segment increased $173 million in the first quarter of 2017 .
The increase in earnings was due to a gain recognized from the consolidation of MSLP, which owns a delayed coker and related facilities at the SweenyRefinery. See Note 5—Business Combinations , in the Notes to Consolidated Financial Statements, for additional information.
Realized refining margins improved in the first quarter of 2017, resulting from increased market crack spreads, partially offset by lower feedstockadvantage and secondary product margins. This net margin improvement was more than offset by increased turnaround costs.
See the “Business Environment and Executive Overview” section for information on market factors impacting this quarter’s results.
Our worldwide refining crude oil capacity utilization rate was 84 percent in the first quarter of 2017 , compared with 94 percent in the first quarter of2016. The decrease was primarily attributable to higher turnaround activities, mainly in the Atlantic Basin/Europe, Gulf Coast and West Coast Regions.
40

Table of Contents
Marketing and Specialties
Three Months Ended
March 31 2017 2016 Millions of DollarsNet Income Attributable to Phillips 66 Marketing and Other $ 124 162Specialties 17 43Total Marketing and Specialties $ 141 205
Dollars Per BarrelRealized Marketing Fuel Margin* U.S. $ 1.47 1.83International 3.70 3.16* On third-party petroleum products sales.
Dollars Per GallonU.S. Average Wholesale Prices* Gasoline $ 1.82 1.37Distillates 1.75 1.16* Excludes excise taxes.
Thousands of Barrels DailyMarketing Petroleum Products Sales Volumes Gasoline 1,155 1,176Distillates 835 903Other products 15 15Total 2,005 2,094
The M&S segment purchases for resale and markets refined petroleum products (such as gasoline, distillates and aviation fuels), mainly in the UnitedStates and Europe. In addition, this segment includes the manufacturing and marketing of specialty products (such as base oils and lubricants), as wellas power generation operations.
The M&S segment earnings decreased $64 million in the first quarter of 2017 . The decrease reflected lower U.S. realized marketing margins driven bya relatively less favorable spot market compared with the first quarter of 2016, and lower equity earnings due to turnaround activity at Excel.
See the “Business Environment and Executive Overview” section for information on marketing fuel margins and other market factors impacting thisquarter’s results.
41
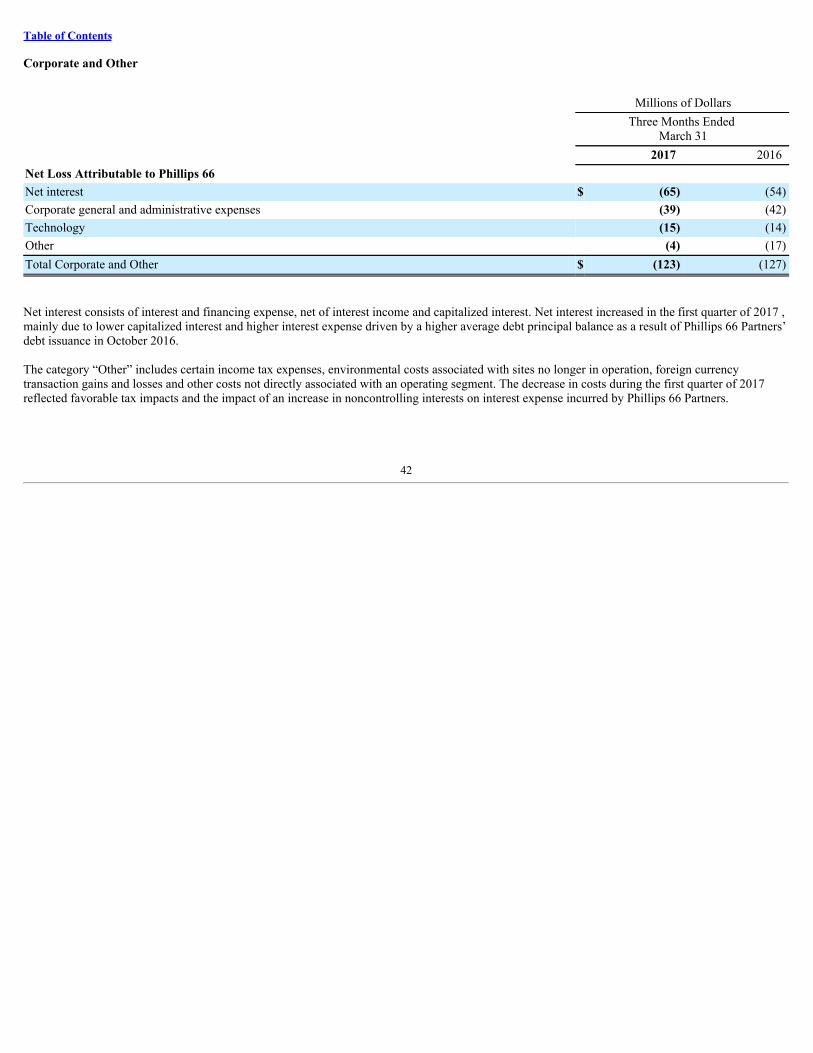
Table of Contents
Corporate and Other
Millions of Dollars
Three Months Ended
March 31 2017 2016Net Loss Attributable to Phillips 66 Net interest $ (65) (54)Corporate general and administrative expenses (39) (42)Technology (15) (14)Other (4) (17)Total Corporate and Other $ (123) (127)
Net interest consists of interest and financing expense, net of interest income and capitalized interest. Net interest increased in the first quarter of 2017 ,mainly due to lower capitalized interest and higher interest expense driven by a higher average debt principal balance as a result of Phillips 66 Partners’debt issuance in October 2016.
The category “Other” includes certain income tax expenses, environmental costs associated with sites no longer in operation, foreign currencytransaction gains and losses and other costs not directly associated with an operating segment. The decrease in costs during the first quarter of 2017reflected favorable tax impacts and the impact of an increase in noncontrolling interests on interest expense incurred by Phillips 66 Partners.
42
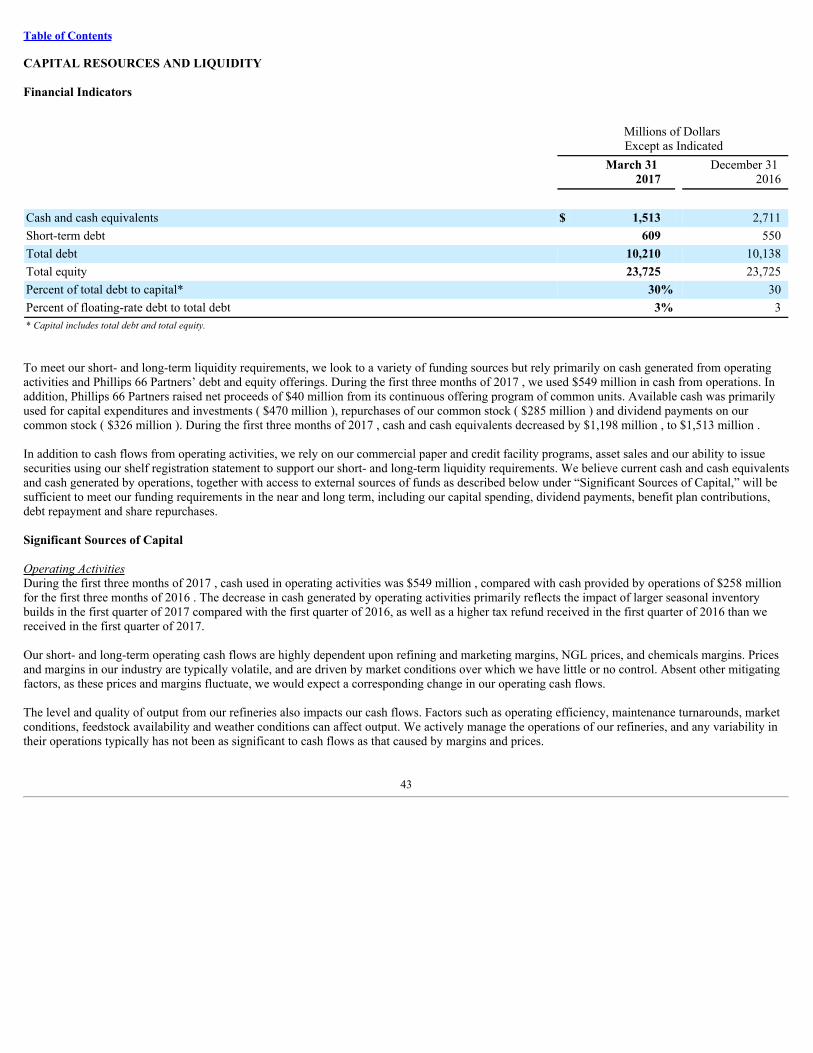
Table of Contents
CAPITAL RESOURCES AND LIQUIDITY
Financial Indicators
Millions of Dollars Except as Indicated
March 31
2017 December 31
2016
Cash and cash equivalents $ 1,513 2,711Short-term debt 609 550Total debt 10,210 10,138Total equity 23,725 23,725Percent of total debt to capital* 30% 30Percent of floating-rate debt to total debt 3% 3* Capital includes total debt and total equity.
To meet our short- and long-term liquidity requirements, we look to a variety of funding sources but rely primarily on cash generated from operatingactivities and Phillips 66 Partners’ debt and equity offerings. During the first three months of 2017 , we used $549 million in cash from operations. Inaddition, Phillips 66 Partners raised net proceeds of $40 million from its continuous offering program of common units. Available cash was primarilyused for capital expenditures and investments ( $470 million ), repurchases of our common stock ( $285 million ) and dividend payments on ourcommon stock ( $326 million ). During the first three months of 2017 , cash and cash equivalents decreased by $1,198 million , to $1,513 million .
In addition to cash flows from operating activities, we rely on our commercial paper and credit facility programs, asset sales and our ability to issuesecurities using our shelf registration statement to support our short- and long-term liquidity requirements. We believe current cash and cash equivalentsand cash generated by operations, together with access to external sources of funds as described below under “Significant Sources of Capital,” will besufficient to meet our funding requirements in the near and long term, including our capital spending, dividend payments, benefit plan contributions,debt repayment and share repurchases.
Significant Sources of Capital
Operating ActivitiesDuring the first three months of 2017 , cash used in operating activities was $549 million , compared with cash provided by operations of $258 millionfor the first three months of 2016 . The decrease in cash generated by operating activities primarily reflects the impact of larger seasonal inventorybuilds in the first quarter of 2017 compared with the first quarter of 2016, as well as a higher tax refund received in the first quarter of 2016 than wereceived in the first quarter of 2017.
Our short- and long-term operating cash flows are highly dependent upon refining and marketing margins, NGL prices, and chemicals margins. Pricesand margins in our industry are typically volatile, and are driven by market conditions over which we have little or no control. Absent other mitigatingfactors, as these prices and margins fluctuate, we would expect a corresponding change in our operating cash flows.
The level and quality of output from our refineries also impacts our cash flows. Factors such as operating efficiency, maintenance turnarounds, marketconditions, feedstock availability and weather conditions can affect output. We actively manage the operations of our refineries, and any variability intheir operations typically has not been as significant to cash flows as that caused by margins and prices.
43

Table of Contents
Equity AffiliatesOur operating cash flows are also impacted by distribution decisions made by our equity affiliates, including DCP Midstream, CPChem and WRB.During the first three months of 2017 , cash from operations included distributions of $ 153 million from our equity affiliates, compared with $ 167million during the same period of 2016 . We cannot control the amount of future dividends from equity affiliates; therefore, future dividend paymentsby these companies are not assured.
Effective January 1, 2017, DCP Midstream, LLC and DCP Partners closed a transaction in which DCP Midstream, LLC contributed subsidiariesowning all of its operating assets, $424 million of cash and $3.15 billion of debt to DCP Partners, in exchange for DCP Partners units which had anestimated fair value of $1.125 billion at the time of the transaction. We and our co-venturer retained our 50/50 investment in DCP Midstream, LLC, andDCP Midstream, LLC retained its incentive distribution rights in DCP Partners through its ownership of the general partner of DCP Partners. After thetransaction, DCP Midstream, LLC held a 38 percent interest in DCP Partners. DCP Midstream, LLC, through its ownership of the general partner, hasagreed, if required, to forgo receipt of incentive distribution rights up to $100 million annually (100 percent basis) through 2019, to support a minimumdistribution coverage ratio for DCP Partners. In connection with the transaction, DCP Midstream, LLC terminated its revolving credit agreement, whichhad previously served to limit distributions to its owners while amounts had been borrowed under the facility. As a result, we expect distributions to theowners of DCP Midstream, LLC to resume in 2017 as it receives distributions from DCP Partners.
Foreign Cash HoldingsAt March 31, 2017, approximately 17 percent of our consolidated cash and cash equivalents balance was available for domestic use without incurringmaterial U.S. income taxes in excess of the amounts already accrued in the financial statements. We believe the remaining amount, primarilyattributable to cash we hold in foreign locations where we have asserted our intention to indefinitely reinvest earnings, does not materially affect ourconsolidated liquidity due to the following factors:
• A substantial portion of our foreign cash supports the liquidity needs and regulatory requirements of our foreign operations.• We have the ability to fund a significant portion of our domestic capital requirements with cash provided by domestic operating activities.• We have access to U.S. capital markets through our $5 billion committed revolving credit facility, commercial paper program, and universal
shelf registration statement.
Phillips 66 Partners LPIn 2016, Phillips 66 Partners began issuing common units under a continuous offering program, which allows for the issuance of up to an aggregate of$250 million of Phillips 66 Partners’ common units, in amounts, at prices and on terms to be determined by market conditions and other factors at thetime of the offerings. We refer to this as an at-the-market, or ATM, program. For the three months ended March 31, 2017, on a settlement-date basis,Phillips 66 Partners issued 744,968 common units under the ATM program, which generated net proceeds of $40 million . From inception throughMarch 31, 2017, Phillips 66 Partners has issued an aggregate of 1,091,120 common units generating net proceeds of $58 million .
Credit Facilities and Commercial PaperAs of March 31, 2017 , no amount had been drawn under our $5 billion credit facility; however, $51 million in letters of credit had been issued thatwere supported by this facility. As of March 31, 2017 , $157 million was outstanding under the $750 million revolving credit agreement of Phillips 66Partners.
We have a $5 billion commercial paper program, supported by our credit facility, for short-term working capital needs. Commercial paper maturitiesare generally limited to 90 days. As of March 31, 2017 , we had no outstanding commercial paper.
44

Table of Contents
Debt IssuancesOn April 21, 2017, Phillips 66 completed a private offering of $600 million aggregate principal amount of unsecured notes consisting of:
• $300 million of floating rate Notes due 2019.
• $300 million of floating rate Notes due 2020.
The notes are guaranteed by Phillips 66 Company, a wholly owned subsidiary. Phillips 66 expects to use the net proceeds from the notes, together witha portion of the proceeds from $900 million of term loans received in late April 2017, to repay its outstanding 2.95% Senior Notes due 2017, for capitalexpenditures and for general corporate purposes.
Interest is a floating rate equal to three-month LIBOR plus 0.65% per annum for the 2019 Notes and three-month LIBOR plus 0.75% per annum for the2020 Notes. Interest on both series of notes is payable quarterly in arrears on January 15, April 15, July 15 and October 15, commencing in July 2017.The 2019 Notes mature on April 15, 2019, and the 2020 Notes mature on April 15, 2020.
The term loans consist of a $450 million 364-day facility and a $450 million three-year facility. Interest on the term loans is a floating rate based oneither the Eurodollar rate or the reference rate, plus a margin determined by our long-term credit ratings.
Shelf RegistrationWe have a universal shelf registration statement on file with the U.S. Securities and Exchange Commission (SEC) under which we, as a well-knownseasoned issuer, have the ability to issue and sell an indeterminate amount of various types of debt and equity securities.
Off-Balance Sheet Arrangements
In 2016, the operating lease commenced on our headquarters facility in Houston, Texas, after construction was deemed substantially complete. Underthis lease agreement, we have a residual value guarantee with a maximum future exposure of $554 million . The operating lease has a term of five yearsand provides us the option, at the end of the lease term, to request to renew the lease, purchase the facility, or assist the lessor in marketing it for resale.
We have residual value guarantees associated with railcar and airplane leases with maximum future exposures totaling $356 million . For informationon our need to perform under the railcar lease guarantee, see the Capital Requirements section to follow, as well as Note 11—Guarantees , in the Notesto Consolidated Financial Statements.
Capital Requirements
For information about our capital expenditures and investments, see the “Capital Spending” section.
Our debt balance at March 31, 2017 , and December 31, 2016 , was $10.2 billion and $10.1 billion , respectively. Our debt-to-capital ratio was 30percent at both March 31, 2017 , and December 31, 2016 . Our target debt-to-capital ratio is between 20 and 30 percent. At March 31, 2017, weclassified $1.05 billion of the 2.95% Senior Notes maturing in 2017 as long-term debt on our consolidated balance sheet, based on our ability and intentto refinance the obligation on a long-term basis, with such ability demonstrated by our April 2017 financing transactions.
On February 8, 2017, our Board of Directors declared a quarterly cash dividend of $0.63 per common share. The dividend was paid on March 1, 2017,to shareholders of record at the close of business on February 21, 2017.
Our Board of Directors at various times has authorized repurchases of our outstanding common stock, which aggregate to a total authorization of up to$9 billion. The share repurchases are expected to be funded primarily through available cash. The shares will be repurchased from time to time in theopen market at our discretion, subject to market conditions and other factors, and in accordance with applicable regulatory requirements. We are notobligated to acquire any particular amount of common stock and may commence, suspend or discontinue purchases at any time or from time to timewithout prior notice. During the first quarter of 2017 , we repurchased 3,534,462 shares at a cost of $285 million .
45

Table of Contents
Since the inception of our share repurchases in 2012 through March 31, 2017 , we have repurchased a total of 108,939,111 shares at a cost of $7,723million . Shares of stock repurchased are held as treasury shares.
We own a 25 percent interest in the Dakota Access, LLC (DAPL) and Energy Transfer Crude Oil Company, LLC (ETCOP) joint ventures, which wereformed to construct pipelines to deliver crude oil produced in the Bakken area of North Dakota to market centers in the Midwest and the Gulf Coast. In2016, we and our co-venturer executed agreements, and an amendment to the original agreements, that provided we and our co-venturer would loanDAPL and ETCOP up to a maximum of $1,411 million and $76 million, respectively, with the amounts loaned by us and our co-venturer beingproportionate to our ownership interests (Sponsor Loans). Also in 2016, DAPL and ETCOP secured a $2.5 billion facility (Facility) with a syndicate offinancial institutions on a limited recourse basis with certain guarantees. Allowable draws under the Facility were initially reduced and finallysuspended in September 2016 pending resolution of permitting delays. As a result, DAPL and ETCOP resumed making draws under the SponsorLoans. In February 2017, DAPL was granted the lone outstanding easement required to complete work beneath the Missouri River. As a result,construction of the pipelines resumed and draws under the Facility were reinitiated and all outstanding Sponsor Loans were paid in February 2017. Asof March 31, 2017, DAPL and ETCOP have an aggregate balance outstanding under the Facility of $2.5 billion; our 25 percent share is $625 million.The book values of our investments in DAPL and ETCOP at March 31, 2017 , were $409 million and $129 million, respectively. Construction on bothpipelines has been completed. Commercial operations are expected to begin by June 1, 2017.
In 2016, we and our co-venturer in WRB each made a $75 million partner loan to provide for WRB’s short-term operating needs. These partner loanswere repaid in the first quarter of 2017.
During the first quarter of 2017, we recognized an additional $12 million of the residual value deficiency of our leased railcars. The residual valuedeficiency of $54 million remaining at March 31, 2017, will be recognized on a straight-line basis with approximately one-third recognized throughOctober 2017 and two-thirds recognized through May 2019. Due to current market uncertainties, changes in the estimated fair values of railcars couldoccur, which could increase or decrease our currently estimated residual value deficiency. As of March 31, 2017, our maximum future exposure underthe residual value guarantees was approximately $317 million . For additional information, see Note 11—Guarantees , in the Notes to ConsolidatedFinancial Statements.
Capital Spending
Millions of Dollars
Three Months Ended
March 31 2017 2016Capital Expenditures and Investments Midstream $ 182 446Chemicals — —Refining 259 261Marketing and Specialties 15 15Corporate and Other 14 28Total consolidated from continuing operations $ 470 750
Selected Equity Affiliates* DCP Midstream $ 44 35CPChem 256 247WRB 42 37 $ 342 319* Our share of capital spending.
46
Table of Contents
MidstreamDuring the first three months of 2017, capital spending in our Midstream segment included construction activities related to increasing storage capacityat our crude oil and petroleum products terminal located near Beaumont, Texas, wrap-up activities related to our Freeport LPG Export Terminal andspending associated with return, reliability and maintenance projects in our Transportation and NGL businesses. Other major construction activities inprogress include the further development of Phillips 66 Partners’ 40-percent owned joint venture Bayou Bridge Pipeline, which will provide Gulf Coastrefineries more efficient and sustainable access to North American crude oil, and the development by our 25-percent owned joint ventures, DAPL andETCOP, of two crude oil pipelines.
During the first three months of 2017 , DCP Midstream had a self-funded capital program, and thus had no new capital infusions from us or our co-venturer. During this period, on a 100 percent basis, DCP Midstream’s capital expenditures and investments were approximately $ 87 million ,primarily for expansion capital expenditures including construction of the Mewbourn 3 plant and investments in the Sand Hills Pipeline joint venture,and maintenance capital expenditures for existing assets.
ChemicalsDuring the first three months of 2017 , CPChem had a self-funded capital program, and thus required no new capital infusions from us or our co-venturer. During this period, on a 100 percent basis, CPChem’s capital expenditures and investments were $ 512 million , primarily for its U.S. GulfCoast Petrochemicals Project. We expect CPChem to self-fund its capital program in 2017 .
RefiningCapital spending for the Refining segment during the first three months of 2017 was primarily for air emission reduction projects to meet newenvironmental standards, refinery upgrade projects to increase accessibility of advantaged crudes and improve product yields, improvements to theoperating integrity of key processing units and safety-related projects.Major construction activities in progress include:
• Installation of facilities to comply with U.S. Environmental Protection Agency (EPA) Tier 3 gasoline regulations at the Sweeny and Baywayrefineries.
• Installation of facilities to improve processing of advantaged crudes at the Billings refinery.• Installation of facilities to improve clean product yield at the Bayway and Ponca City refineries, as well as the jointly owned Wood River
refinery.
Generally, our equity affiliates in the Refining segment are intended to have self-funding capital programs.
Marketing and SpecialtiesCapital spending for the M&S segment during the first three months of 2017 was primarily for reliability and maintenance projects and projectstargeted at developing our new international sites.
Contingencies
A number of lawsuits involving a variety of claims that arose in the ordinary course of business have been filed against us or are subject toindemnifications provided by us. We also may be required to remove or mitigate the effects on the environment of the placement, storage, disposal orrelease of certain chemical, mineral and petroleum substances at various active and inactive sites. We regularly assess the need for financial recognitionor disclosure of these contingencies. In the case of all known contingencies (other than those related to income taxes), we accrue a liability when theloss is probable and the amount is reasonably estimable. If a range of amounts can be reasonably estimated and no amount within the range is a betterestimate than any other amount, then the minimum of the range is accrued. We do not reduce these liabilities for potential insurance or third-partyrecoveries. If applicable, we accrue receivables for probable insurance or other third-party recoveries. In the case of income-tax-related contingencies,we use a cumulative probability-weighted loss accrual in cases where sustaining a tax position is less than certain.
Based on currently available information, we believe it is remote that future costs related to known contingent liability exposures will exceed currentaccruals by an amount that would have a material adverse impact on our consolidated financial statements. As we learn new facts concerningcontingencies, we reassess our position both with respect to
47
Table of Contents
accrued liabilities and other potential exposures. Estimates particularly sensitive to future changes include contingent liabilities recorded forenvironmental remediation, tax and legal matters. Estimated future environmental remediation costs are subject to change due to such factors as theuncertain magnitude of cleanup costs, the unknown time and extent of such remedial actions that may be required, and the determination of our liabilityin proportion to that of other potentially responsible parties. Estimated future costs related to tax and legal matters are subject to change as eventsevolve and as additional information becomes available during the administrative and litigation processes.
Legal and Tax MattersOur legal and tax matters are handled by our legal and tax organizations. These organizations apply their knowledge, experience and professionaljudgment to the specific characteristics of our cases and uncertain tax positions. We employ a litigation management process to manage and monitor thelegal proceedings against us. Our process facilitates the early evaluation and quantification of potential exposures in individual cases and enables thetracking of those cases that have been scheduled for trial and/or mediation. Based on professional judgment and experience in using these litigationmanagement tools and available information about current developments in all our cases, our legal organization regularly assesses the adequacy ofcurrent accruals and determines if adjustment of existing accruals, or establishment of new accruals, is required. In the case of income-tax-relatedcontingencies, we monitor tax legislation and court decisions, the status of tax audits and the statute of limitations within which a taxing authority canassert a liability.
EnvironmentalLike other companies in our industry, we are subject to numerous international, federal, state and local environmental laws and regulations. For adiscussion of the most significant of these environmental laws and regulations, including those with associated remediation obligations, see the“Environmental” section in Management’s Discussion and Analysis of Financial Condition and Results of Operations in our 2016 Annual Report onForm 10-K.
We occasionally receive requests for information or notices of potential liability from the EPA and state environmental agencies alleging that we are apotentially responsible party under the Federal Comprehensive Environmental Response, Compensation and Liability Act (CERCLA) or an equivalentstate statute. On occasion, we also have been made a party to cost recovery litigation by those agencies or by private parties. These requests, notices andlawsuits assert potential liability for remediation costs at various sites that typically are not owned by us, but allegedly contain wastes attributable to ourpast operations. As of December 31, 2016 , we reported that we had been notified of potential liability under CERCLA and comparable state laws at 31sites within the United States. During the first three months of 2017 , there were two new sites for which we received notice of potential liability andtwo sites were deemed resolved and closed, leaving 31 sites with potential liability at March 31, 2017 .
Notwithstanding any of the foregoing, and as with other companies engaged in similar businesses, environmental costs and liabilities are inherentconcerns in our operations and products, and there can be no assurance that material costs and liabilities will not be incurred. However, we currently donot expect any material adverse effect on our results of operations or financial position as a result of compliance with current environmental laws andregulations.
Climate ChangeThere has been a broad range of proposed or promulgated state, national and international laws focusing on greenhouse gas (GHG) emissions reduction,including various regulations proposed or issued by the EPA. These proposed or promulgated laws apply or could apply in states and/or countrieswhere we have interests or may have interests in the future. Laws regulating GHG emissions continue to evolve, and while it is not possible toaccurately estimate either a timetable for implementation or our future compliance costs relating to implementation, such laws potentially could have amaterial impact on our results of operations and financial condition as a result of increasing costs of compliance, lengthening project implementationand agency review items, or reducing demand for certain hydrocarbon products. We continue to monitor legislative and regulatory actions and legalproceedings globally relating to GHG emissions for potential impacts on our operations.
For examples of legislation and regulation or precursors for possible regulation that do or could affect our operations, see the “Climate Change” sectionin Management’s Discussion and Analysis of Financial Condition and Results of Operations in our 2016 Annual Report on Form 10-K.
48
Table of Contents
We consider and take into account anticipated future GHG emissions in designing and developing major facilities and projects, and implement energyefficiency initiatives to reduce such emissions. GHG emissions, legal requirements regulating such emissions, and the possible physical effects ofclimate change on our coastal assets are incorporated into our planning, investment, and risk management decision-making.
NEW ACCOUNTING STANDARDS
In January 2017, the Financial Accounting Standards Board (FASB) issued Accounting Standards Update (ASU) No. 2017-01, “Business Combinations(Topic 805): Clarifying the Definition of a Business,” which clarifies the definition of a business with the objective of adding guidance to assist inevaluating whether transactions should be accounted for as acquisitions of assets or businesses. The amendment provides a screen for determining whena transaction involves an acquisition of a business. If substantially all of the fair value of the gross assets acquired is concentrated in a single identifiableasset or a group of similar identifiable assets, then the transaction does not involve the acquisition of a business. If the screen is not met, then theamendment requires that to be considered a business, the operation must include at a minimum an input and a substantive process that togethersignificantly contribute to the ability to create an output. The guidance may reduce the number of transactions accounted for as business acquisitions.Public business entities should apply the guidance in ASU No. 2017-01 to annual periods beginning after December 15, 2017, including interim periodswithin those periods, with early adoption permitted. The amendments should be applied prospectively, and no disclosures are required at the effectivedate. We are currently evaluating the provisions of ASU No. 2017-01.
In June 2016, the FASB issued ASU No. 2016-13, “Financial Instruments—Credit Losses (Topic 326): Measurement of Credit Losses on FinancialInstruments.” The new standard amends the impairment model to utilize an expected loss methodology in place of the currently used incurred lossmethodology, which will result in the more timely recognition of losses. Public business entities should apply the guidance in ASU No. 2016-13 forannual periods beginning after December 15, 2019, including interim periods within those annual periods. Early adoption will be permitted for annualperiods beginning after December 15, 2018. We are currently evaluating the provisions of ASU No. 2016-13 and assessing the impact on our financialstatements.
In February 2016, the FASB issued ASU No. 2016-02, “Leases (Topic 842).” In the new standard, the FASB modified its determination of whether acontract is a lease rather than whether a lease is a capital or operating lease under the previous accounting principles generally accepted in the UnitedStates (GAAP). A contract represents a lease if a transfer of control occurs over an identified property, plant and equipment for a period of time inexchange for consideration. Control over the use of the identified asset includes the right to obtain substantially all of the economic benefits from theuse of the asset and the right to direct its use. The FASB continued to maintain two classifications of leases—financing and operating—which aresubstantially similar to capital and operating leases in the previous lease guidance. Under the new standard, recognition of assets and liabilities arisingfrom operating leases will require recognition on the balance sheet. The effect of all leases in the statement of comprehensive income and the statementof cash flows will be largely unchanged. Lessor accounting will also be largely unchanged. Additional disclosures will be required for financing andoperating leases for both lessors and lessees. Public business entities should apply the guidance in ASU No. 2016-02 for annual periods beginning afterDecember 15, 2018, including interim periods within those annual periods. Early adoption is permitted. Entities are required to adopt the ASU using amodified retrospective approach, subject to certain optional practical expedients, and apply the provisions of ASU No. 2016-02 to leasing arrangementsexisting at or entered into after the earliest comparative period presented in the financial statements. We are currently evaluating the provisions of ASUNo. 2016-02 and assessing its impact on our financial statements.
In January 2016, the FASB issued ASU No. 2016-01, “Financial Instruments—Overall (Subtopic 825-10): Recognition and Measurement of FinancialAssets and Financial Liabilities,” to meet its objective of providing more decision-useful information about financial instruments. The majority of thisASU’s provisions amend only the presentation or disclosures of financial instruments; however, one provision will also affect net income. Equityinvestments carried under the cost method or lower of cost or fair value method of accounting, in accordance with current GAAP, will have to becarried at fair value upon adoption of ASU No. 2016-01, with changes in fair value recorded in net income. For equity investments that do not havereadily determinable fair values, a company may elect to carry such investments at cost less impairments, if any, adjusted up or down for price changesin similar financial instruments issued by the investee, when and if observed. Public business entities should apply the guidance in ASU No. 2016-01for annual periods beginning after December 15, 2017, and interim periods within those annual periods, with early adoption prohibited. We are
49

Table of Contents
currently evaluating the provisions of ASU No. 2016-01. Our initial review indicates that ASU No. 2016-01 will have a limited impact on our financialstatements.
In May 2014, the FASB issued ASU No. 2014-09, “Revenue from Contracts with Customers (Topic 606).” The new standard converged guidance onrecognizing revenues in contracts with customers under GAAP and International Financial Reporting Standards. This ASU is intended to improvecomparability of revenue recognition practices across entities, industries, jurisdictions and capital markets. In August 2015, the FASB issued ASU No.2015-14, “Revenue from Contracts with Customers (Topic 606): Deferral of the Effective Date.” The amendment in this ASU defers the effective dateof ASU No. 2014-09 for all entities for one year. Public business entities should apply the guidance in ASU No. 2014-09 to annual reporting periodsbeginning after December 15, 2017, including interim reporting periods within that reporting period. Earlier adoption is permitted only as of annualreporting periods beginning after December 31, 2016, including interim reporting periods within that reporting period. Retrospective or modifiedretrospective application of the accounting standard is required. We are currently evaluating the provisions of ASU No. 2014-09 and assessing theimpact on our financial statements. As part of our assessment work to-date, we have formed an implementation work team, completed training on thenew ASU’s revenue recognition model and are continuing our contract review and documentation. Our expectation is to adopt the standard on January1, 2018, using the modified retrospective application. In addition, we expect to present revenue net of sales-based taxes collected from our customersresulting in no impact to earnings. Sales-based taxes include excise taxes on petroleum product sales as noted on our consolidated statement of income.Our evaluation of the new ASU is ongoing, which includes understanding the impact of adoption on earnings from equity method investments. Basedupon our analysis to-date, we have not identified any other material impact on our financial statements other than disclosure.
50
Table of Contents
CAUTIONARY STATEMENT FOR THE PURPOSES OF THE “SAFE HARBOR” PROVISIONS OF THE PRIVATE SECURITIESLITIGATION REFORM ACT OF 1995
This report includes forward-looking statements within the meaning of Section 27A of the Securities Act of 1933 and Section 21E of the SecuritiesExchange Act of 1934. You can identify our forward-looking statements by the words “anticipate,” “estimate,” “believe,” “budget,” “continue,”“could,” “intend,” “may,” “plan,” “potential,” “predict,” “seek,” “should,” “will,” “would,” “expect,” “objective,” “projection,” “forecast,” “goal,”“guidance,” “outlook,” “effort,” “target” and similar expressions.
We based the forward-looking statements on our current expectations, estimates and projections about us and the industries in which we operate ingeneral. We caution you these statements are not guarantees of future performance as they involve assumptions that, while made in good faith, mayprove to be incorrect, and involve risks and uncertainties we cannot predict. In addition, we based many of these forward-looking statements onassumptions about future events that may prove to be inaccurate. Accordingly, our actual outcomes and results may differ materially from what wehave expressed or forecast in the forward-looking statements. Any differences could result from a variety of factors, including the following:
• Fluctuations in NGL, crude oil, petroleum products and natural gas prices and refining, marketing and petrochemical margins.• Failure of new products and services to achieve market acceptance.• Unexpected changes in costs or technical requirements for constructing, modifying or operating our facilities or transporting our products.• Unexpected technological or commercial difficulties in manufacturing, refining or transporting our products, including chemicals products.• Lack of, or disruptions in, adequate and reliable transportation for our NGL, crude oil, natural gas and refined products.• The level and success of drilling and quality of production volumes around DCP Midstream’s assets and its ability to connect supplies to its
gathering and processing systems, residue gas and NGL infrastructure.• Inability to timely obtain or maintain permits, including those necessary for capital projects; comply with government regulations; or make
capital expenditures required to maintain compliance.• Failure to complete definitive agreements and feasibility studies for, and to timely complete construction of, announced and future capital
projects.• Potential disruption or interruption of our operations due to accidents, weather events, civil unrest, political events, terrorism or cyber attacks.• International monetary conditions and exchange controls.• Substantial investment or reduced demand for products as a result of existing or future environmental rules and regulations.• Liability resulting from litigation or for remedial actions, including removal and reclamation obligations under environmental regulations.• General domestic and international economic and political developments including: armed hostilities; expropriation of assets; changes in
governmental policies relating to NGL, crude oil, natural gas or refined product pricing, regulation or taxation; and other political, economic ordiplomatic developments.
• Changes in tax, environmental and other laws and regulations (including alternative energy mandates) applicable to our business.• Limited access to capital or significantly higher cost of capital related to changes to our credit profile or illiquidity or uncertainty in the
domestic or international financial markets.• The operation, financing and distribution decisions of our joint ventures.• Domestic and foreign supplies of crude oil and other feedstocks.• Domestic and foreign supplies of petrochemicals and refined products, such as gasoline, diesel, aviation fuel and home heating oil.• Governmental policies relating to exports of crude oil and natural gas.• Overcapacity or undercapacity in the midstream, chemicals and refining industries.• Fluctuations in consumer demand for refined products.• The factors generally described in Item 1A.—Risk Factors in our 2016 Annual Report on Form 10-K.
51

Table of Contents
Item 3. QUANTITATIVE AND QUALITATIVE DISCLOSURES ABOUT MARKET RISK
Our commodity price risk and interest rate risk at March 31, 2017 , did not differ materially from the risks disclosed under Item 7A of our 2016 AnnualReport on Form 10-K.
Item 4. CONTROLS AND PROCEDURES
We maintain disclosure controls and procedures designed to ensure that information required to be disclosed in reports we file or submit under theSecurities Exchange Act of 1934, as amended (the Act), is recorded, processed, summarized and reported within the time periods specified in SEC rulesand forms, and that such information is accumulated and communicated to management, including our principal executive and principal financialofficers, as appropriate, to allow timely decisions regarding required disclosure. As of March 31, 2017 , with the participation of management, ourChairman and Chief Executive Officer and our Executive Vice President, Finance and Chief Financial Officer carried out an evaluation, pursuant toRule 13a-15(b) of the Act, of the effectiveness of our disclosure controls and procedures (as defined in Rule 13a-15(e) of the Act). Based upon thatevaluation, our Chairman and Chief Executive Officer and our Executive Vice President, Finance and Chief Financial Officer concluded that ourdisclosure controls and procedures were operating effectively as of March 31, 2017 .
There have been no changes in our internal control over financial reporting, as defined in Rule 13a-15(f) of the Act, in the quarterly period endedMarch 31, 2017 , that have materially affected, or are reasonably likely to materially affect, our internal control over financial reporting.
52
Table of Contents
PART II. OTHER INFORMATION
Item 1. LEGAL PROCEEDINGS
The following is a description of reportable legal proceedings, including those involving governmental authorities under federal, state and local lawsregulating the discharge of materials into the environment, for this reporting period. There were no new matters that arose during the first quarter of2017. However, there was one development that occurred with respect to matters previously reported in our 2016 Annual Report on Form 10-K. Whileit is not possible to accurately predict the final outcome of these pending proceedings, if any one or more of such proceedings were decided adversely toPhillips 66, we expect there would be no material effect on our consolidated financial position. Nevertheless, such proceedings are reported pursuant toSEC regulations.
Our U.S. refineries are implementing two separate consent decrees, regarding alleged violations of the Federal Clean Air Act, with the EPA, five statesand one local air pollution agency. Some of the requirements and limitations contained in the decrees provide for stipulated penalties for violations.Stipulated penalties under the decrees are not automatic, but must be requested by one of the agency signatories. As part of periodic reports under thedecrees or other reports required by permits or regulations, we occasionally report matters that could be subject to a request for stipulated penalties. If aspecific request for stipulated penalties meeting the reporting threshold set forth in SEC rules is made pursuant to these decrees based on a givenreported exceedance, we will separately report that matter and the amount of the proposed penalty.
Matters Previously ReportedIn October 2016, after Phillips 66 received a Notice of Intent to Sue from the Sierra Club, Phillips 66 entered into a voluntary settlement with theIllinois Environmental Protection Agency regarding alleged violations of wastewater requirements at the Wood River Refinery. The settlementinvolves certain capital projects and payment of $125,000. After the settlement was filed with the Court for final approval, the Sierra Club sought andwas granted approval to intervene in the case. We are working to obtain Court approval for the settlement.
Item 1A. RISK FACTORS
There have been no material changes from the risk factors disclosed in Item 1A of our 2016 Annual Report on Form 10-K.
53
Table of Contents
Item 2. UNREGISTERED SALES OF EQUITY SECURITIES AND USE OF PROCEEDS
Issuer Purchases of Equity Securities
Millions of Dollars
PeriodTotal Number of Shares
Purchased* Average Price Paid
per Share
Total Number of SharesPurchased
as Part of PubliclyAnnounced Plans
or Programs**
Approximate Dollar Valueof Shares
that May Yet Be PurchasedUnder the Plans or
ProgramsJanuary 1-31, 2017 989,225 $ 84.93 989,225 $ 1,478February 1-28, 2017 1,080,970 79.90 1,080,970 1,392March 1-31, 2017 1,464,267 78.56 1,464,267 1,277Total 3,534,462 $ 80.75 3,534,462 * Includes repurchase of shares of common stock from company employees in connection with the company’s broad-based employee incentive plans, when applicable.
** Our Board of Directors has authorized repurchases totaling up to $9 billion of our outstanding common stock. The current authorization was announced inJuly 2014, in the amount of $2 billion, and increased to $4 billion as announced in October 2015. The authorization does not have an expiration date. Theshare repurchases are expected to be funded primarily through available cash. The shares under these authorizations will be repurchased from time to timein the open market at the company’s discretion, subject to market conditions and other factors, and in accordance with applicable regulatory requirements. We are not obligated to acquireany particular amount of common stock and may commence, suspend or discontinue purchases at any time or from time totime without prior notice. Shares of stock repurchased are held as treasury shares.
54
Table of Contents
Item 6. EXHIBITS
ExhibitNumber Exhibit Description
12 Computation of Ratio of Earnings to Fixed Charges.
31.1 Certification of Chief Executive Officer pursuant to Rule 13a-14(a) under the Securities Exchange Act of 1934.
31.2 Certification of Chief Financial Officer pursuant to Rule 13a-14(a) under the Securities Exchange Act of 1934.
32 Certifications pursuant to 18 U.S.C. Section 1350.
101.INS XBRL Instance Document.
101.SCH XBRL Schema Document.
101.CAL XBRL Calculation Linkbase Document.
101.LAB XBRL Labels Linkbase Document.
101.PRE XBRL Presentation Linkbase Document.
101.DEF XBRL Definition Linkbase Document.
55

Table of Contents
SIGNATURES
Pursuant to the requirements of the Securities Exchange Act of 1934, the registrant has duly caused this report to be signed on its behalf by theundersigned thereunto duly authorized.
PHILLIPS 66
/s/ Chukwuemeka A. Oyolu
Chukwuemeka A. OyoluVice President and Controller
(Chief Accounting and Duly Authorized Officer)
May 5, 2017
56

Exhibit 12
PHILLIPS 66 AND CONSOLIDATED SUBSIDIARIESTOTAL ENTERPRISE
Computation of Ratio of Earnings to Fixed Charges
Millions of Dollars
Three Months Ended
March 31 Years Ended December 31 2017 2016 2015 2014 2013 2012Earnings Available for Fixed Charges Income from continuing operations before
income taxes and noncontrolling intereststhat have not incurred fixed charges $ 797 2,181 6,035 5,711 5,509 6,624
Distributions in excess of (less than) equity inearnings of affiliates (212) (815) 185 197 (354) (872)
Fixed charges, excluding capitalized interest* 143 488 456 397 365 376 $ 728 1,854 6,676 6,305 5,520 6,128
Fixed Charges Interest and expense on indebtedness,
excluding capitalized interest $ 105 338 310 267 275 246Capitalized interest 9 81 106 20 — —Interest portion of rental expense 35 140 140 125 83 121 $ 149 559 556 412 358 367Ratio of Earnings to Fixed Charges 4.9 3.3 12.0 15.3 15.4 16.7* Includes amortization of capitalized interest totaling approximately $3 million for the three months ended March 31, 2017 . Amortization of capitalized interest for the years ended December31, totaled approximately $10 million in 2016 , $7 million in 2015 , $6 million in 2014 , $7 million in 2013 and $9 million in 2012 .
Exhibit 31.1
CERTIFICATION
I, Greg C. Garland, certify that:
1. I have reviewed this quarterly report on Form 10-Q of Phillips 66;
2. Based on my knowledge, this report does not contain any untrue statement of a material fact or omit to state a material fact necessary to make thestatements made, in light of the circumstances under which such statements were made, not misleading with respect to the period covered by thisreport;
3. Based on my knowledge, the financial statements, and other financial information included in this report, fairly present in all material respects thefinancial condition, results of operations and cash flows of the registrant as of, and for, the periods presented in this report;
4. The registrant's other certifying officer and I are responsible for establishing and maintaining disclosure controls and procedures (as defined inExchange Act Rules 13a-15(e) and 15d-15(e)) and internal control over financial reporting (as defined in Exchange Act Rules 13a-15(f) and 15d-15(f)) for the registrant and have:
(a) Designed such disclosure controls and procedures, or caused such disclosure controls and procedures to be designed under our supervision,to ensure that material information relating to the registrant, including its consolidated subsidiaries, is made known to us by others withinthose entities, particularly during the period in which this report is being prepared;
(b) Designed such internal control over financial reporting, or caused such internal control over financial reporting to be designed under oursupervision, to provide reasonable assurance regarding the reliability of financial reporting and the preparation of financial statements forexternal purposes in accordance with generally accepted accounting principles;
(c) Evaluated the effectiveness of the registrant's disclosure controls and procedures and presented in this report our conclusions about theeffectiveness of the disclosure controls and procedures, as of the end of the period covered by this report based on such evaluation; and
(d) Disclosed in this report any change in the registrant's internal control over financial reporting that occurred during the registrant's most recentfiscal quarter (the registrant's fourth fiscal quarter in the case of an annual report) that has materially affected, or is reasonably likely tomaterially affect, the registrant's internal control over financial reporting; and
5. The registrant's other certifying officer and I have disclosed, based on our most recent evaluation of internal control over financial reporting, to theregistrant's auditors and the audit committee of the registrant's board of directors (or persons performing the equivalent functions):
(a) All significant deficiencies and material weaknesses in the design or operation of internal control over financial reporting which arereasonably likely to adversely affect the registrant's ability to record, process, summarize and report financial information; and
(b) Any fraud, whether or not material, that involves management or other employees who have a significant role in the registrant's internalcontrol over financial reporting.
May 5, 2017
/s/ Greg C. Garland Greg C. Garland Chairman and Chief Executive Officer

Exhibit 31.2
CERTIFICATION
I, Kevin J. Mitchell, certify that:
1. I have reviewed this quarterly report on Form 10-Q of Phillips 66;
2. Based on my knowledge, this report does not contain any untrue statement of a material fact or omit to state a material fact necessary to make thestatements made, in light of the circumstances under which such statements were made, not misleading with respect to the period covered by thisreport;
3. Based on my knowledge, the financial statements, and other financial information included in this report, fairly present in all material respects thefinancial condition, results of operations and cash flows of the registrant as of, and for, the periods presented in this report;
4. The registrant's other certifying officer and I are responsible for establishing and maintaining disclosure controls and procedures (as defined inExchange Act Rules 13a-15(e) and 15d-15(e)) and internal control over financial reporting (as defined in Exchange Act Rules 13a-15(f) and 15d-15(f)) for the registrant and have:
(a) Designed such disclosure controls and procedures, or caused such disclosure controls and procedures to be designed under our supervision,to ensure that material information relating to the registrant, including its consolidated subsidiaries, is made known to us by others withinthose entities, particularly during the period in which this report is being prepared;
(b) Designed such internal control over financial reporting, or caused such internal control over financial reporting to be designed under oursupervision, to provide reasonable assurance regarding the reliability of financial reporting and the preparation of financial statements forexternal purposes in accordance with generally accepted accounting principles;
(c) Evaluated the effectiveness of the registrant's disclosure controls and procedures and presented in this report our conclusions about theeffectiveness of the disclosure controls and procedures, as of the end of the period covered by this report based on such evaluation; and
(d) Disclosed in this report any change in the registrant's internal control over financial reporting that occurred during the registrant's most recentfiscal quarter (the registrant's fourth fiscal quarter in the case of an annual report) that has materially affected, or is reasonably likely tomaterially affect, the registrant's internal control over financial reporting; and
5. The registrant's other certifying officer and I have disclosed, based on our most recent evaluation of internal control over financial reporting, to theregistrant's auditors and the audit committee of the registrant's board of directors (or persons performing the equivalent functions):
(a) All significant deficiencies and material weaknesses in the design or operation of internal control over financial reporting which arereasonably likely to adversely affect the registrant's ability to record, process, summarize and report financial information; and
(b) Any fraud, whether or not material, that involves management or other employees who have a significant role in the registrant's internalcontrol over financial reporting.
May 5, 2017
/s/ Kevin J. Mitchell Kevin J. Mitchell
Executive Vice President, Finance
and Chief Financial Officer
Exhibit 32
CERTIFICATIONS PURSUANT TO 18 U.S.C. SECTION 1350
In connection with the Quarterly Report of Phillips 66 (the Company) on Form 10-Q for the period ended March 31, 2017 , as filed with the U.S.Securities and Exchange Commission on the date hereof (the Report), each of the undersigned hereby certifies, pursuant to 18 U.S.C. Section 1350, asadopted pursuant to Section 906 of the Sarbanes-Oxley Act of 2002, that to their knowledge:
(1) The Report fully complies with the requirements of Sections 13(a) or 15(d) of the Securities Exchange Act of 1934; and
(2) The information contained in the Report fairly presents, in all material respects, the financial condition and results of operations of theCompany.
May 5, 2017
/s/ Greg C. Garland Greg C. Garland
Chairman and
Chief Executive Officer
/s/ Kevin J. Mitchell Kevin J. Mitchell
Executive Vice President, Finance and
Chief Financial Officer


![[Bob Phillips] Phillips' Book of Great Thoughts (Book4You)](https://img.pdfslide.us/doc/110x75/563db77e550346aa9a8b927f/bob-phillips-phillips-book-of-great-thoughts-book4you.jpg)