Embed Size (px)
Citation preview
UNITED STATES SECURITIES AND EXCHANGE COMMISSION
Washington, D.C. 20549
FORM 8-K
CURRENT REPORT
Pursuant to Section 13 or 15(d) of the Securities Exchange Act of 1934
Date of Report (date of earliest event reported): July 31, 2015
Phillips 66 (Exact name of registrant as specified in its charter)
3010 Briarpark Drive, Houston, Texas 77042
(Address of principal executive offices and zip code)
Registrant’s telephone number, including area code: (281) 293-6600
Check the appropriate box below if the Form 8-K filing is intended to simultaneously satisfy the filing obligation of the registrant under any of the following provisions:
[ ] Written communications pursuant to Rule 425 under the Securities Act (17 CFR 230.425)
[ ] Soliciting material pursuant to Rule 14a-12 under the Exchange Act (17 CFR 240.14a-12)
[ ] Pre-commencement communications pursuant to Rule 14d-2(b) under the Exchange Act (17 CFR 240.14d-2(b))
[ ] Pre-commencement communications pursuant to Rule 13e-4(c) under the Exchange Act (17 CFR 240.13e-4(c))
Delaware 001-35349 45-3779385 (State or other jurisdiction of incorporation) (Commission File Number) (I.R.S. Employer Identification No.)
Item 2.02 Results of Operations and Financial Condition.
On July 31, 2015 , Phillips 66 issued a press release announcing the company's financial and operating results for the quarter ended June 30, 2015 . A copy of the press release is furnished as Exhibit 99.1 hereto and incorporated herein by reference. Additional financial and operating information about the quarter is furnished as Exhibit 99.2 hereto and incorporated herein by reference.
The information in this report and the exhibits hereto shall not be treated as filed for purposes of the Securities Exchange Act of 1934, as amended.
Item 9.01 Financial Statements and Exhibits.
(d) Exhibits
2
99.1 — Press release issued by Phillips 66 on July 31, 2015.
99.2 — Supplemental financial and operating information.
SIGNATURES
Pursuant to the requirements of the Securities Exchange Act of 1934, the registrant has duly caused this report to be signed on its behalf by the undersigned hereunto duly authorized.
3
PHILLIPS 66
By: /s/ Chukwuemeka A. Oyolu
Chukwuemeka A. Oyolu
Vice President and Controller
July 31, 2015
EXHIBIT INDEX
4
Exhibit
No. Description
99.1 Press release issued by Phillips 66 on July 31, 2015.
99.2 Supplemental financial and operating information.
Phillips 66 Reports Second-Quarter Earnings of $1.0 Billion (Adjusted Earnings of $1.0 Billion)
Phillips 66 Reports Second-Quarter Earnings of $1.0 Billion
or $1.84 Per Share Adjusted earnings of $1.0 billion or $1.83 per share
Highlights
HOUSTON, July 31, 2015 — Phillips 66 (NYSE: PSX), an energy manufacturing and logistics company, announces second -quarter earnings of $1,012 million , compared with earnings of $987 million in the first quarter of 2015 . Adjusted earnings were $1,002 million , an increase of $168 million from the last quarter. “Our Refining, Chemicals, and M&S businesses delivered a strong quarter, providing solid earnings and cash flow,” said Greg Garland, chairman and CEO of Phillips 66. "We operated well, executed major turnaround activity and progressed our capital projects. We also returned more than $600 million to shareholders through dividends and share repurchases." Page 1
• $1.8 billion operating cash flow excluding working capital; $1.4 billion including working capital • Improved Chemicals Olefins & Polyolefins cash chain margins • Sweeny Fractionator One nearing completion • Refining utilization at 90 percent; clean product yield of 84 percent • Increased quarterly dividend 12 percent to $0.56 per common share
Phillips 66 Reports Second-Quarter Earnings of $1.0 Billion (Adjusted Earnings of $1.0 Billion) Midstream
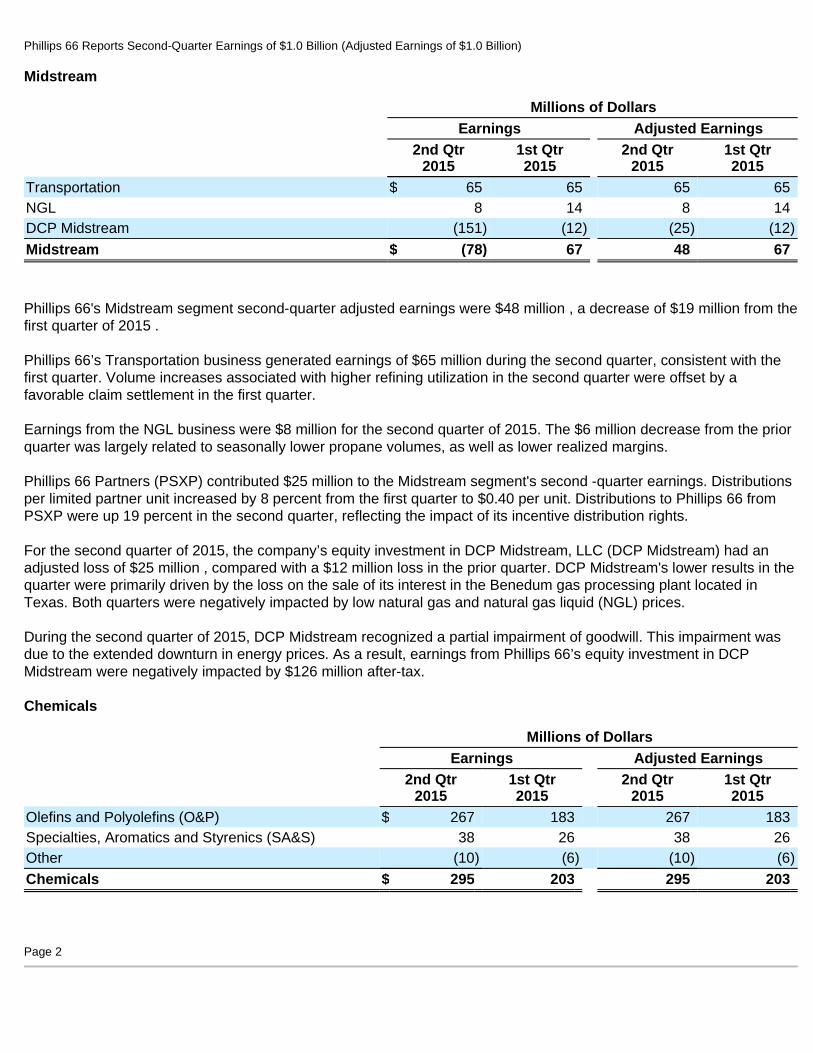
Phillips 66's Midstream segment second-quarter adjusted earnings were $48 million , a decrease of $19 million from the first quarter of 2015 . Phillips 66’s Transportation business generated earnings of $65 million during the second quarter, consistent with the first quarter. Volume increases associated with higher refining utilization in the second quarter were offset by a favorable claim settlement in the first quarter. Earnings from the NGL business were $8 million for the second quarter of 2015. The $6 million decrease from the prior quarter was largely related to seasonally lower propane volumes, as well as lower realized margins. Phillips 66 Partners (PSXP) contributed $25 million to the Midstream segment's second -quarter earnings. Distributions per limited partner unit increased by 8 percent from the first quarter to $0.40 per unit. Distributions to Phillips 66 from PSXP were up 19 percent in the second quarter, reflecting the impact of its incentive distribution rights. For the second quarter of 2015, the company’s equity investment in DCP Midstream, LLC (DCP Midstream) had an adjusted loss of $25 million , compared with a $12 million loss in the prior quarter. DCP Midstream's lower results in the quarter were primarily driven by the loss on the sale of its interest in the Benedum gas processing plant located in Texas. Both quarters were negatively impacted by low natural gas and natural gas liquid (NGL) prices. During the second quarter of 2015, DCP Midstream recognized a partial impairment of goodwill. This impairment was due to the extended downturn in energy prices. As a result, earnings from Phillips 66’s equity investment in DCP Midstream were negatively impacted by $126 million after-tax. Chemicals
Page 2
Millions of Dollars
Earnings Adjusted Earnings
2nd Qtr
2015 1st Qtr 2015
2nd Qtr 2015
1st Qtr 2015
Transportation $ 65 65 65 65 NGL 8 14 8 14 DCP Midstream (151 ) (12 ) (25 ) (12 )
Midstream $ (78 ) 67 48 67
Millions of Dollars
Earnings Adjusted Earnings
2nd Qtr
2015 1st Qtr 2015
2nd Qtr 2015
1st Qtr 2015
Olefins and Polyolefins (O&P) $ 267 183 267 183 Specialties, Aromatics and Styrenics (SA&S) 38 26 38 26 Other (10 ) (6 ) (10 ) (6 )
Chemicals $ 295 203 295 203
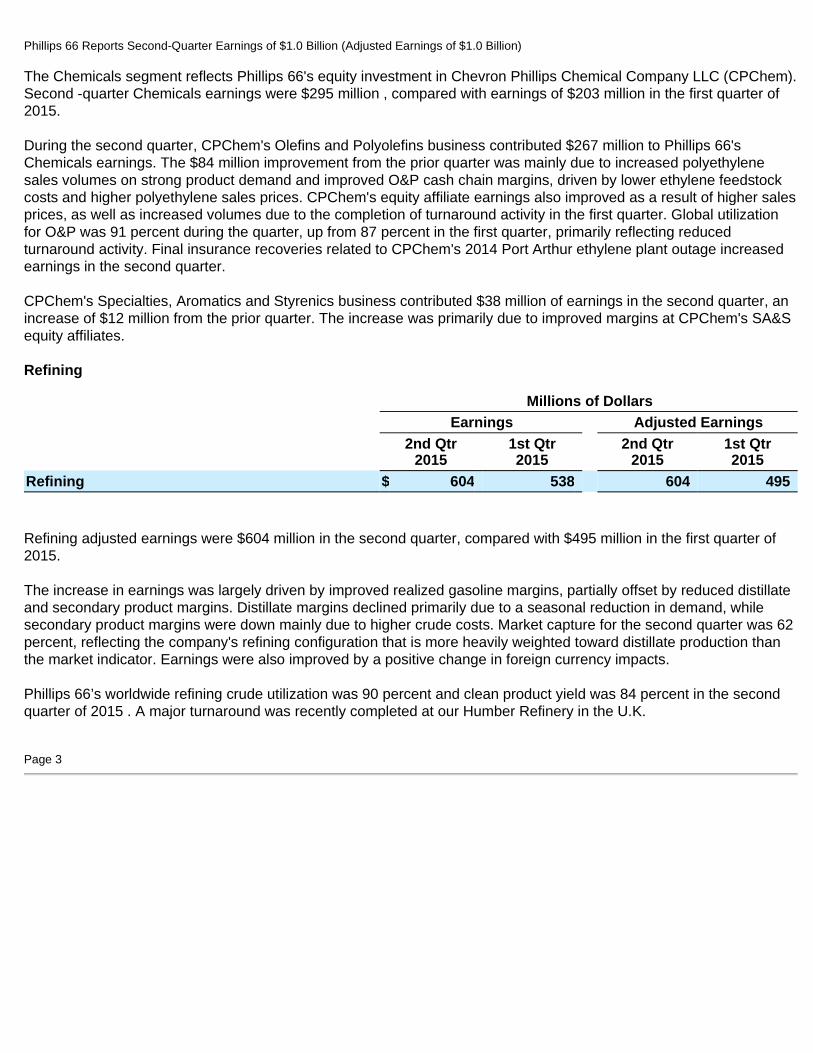
Phillips 66 Reports Second-Quarter Earnings of $1.0 Billion (Adjusted Earnings of $1.0 Billion) The Chemicals segment reflects Phillips 66's equity investment in Chevron Phillips Chemical Company LLC (CPChem). Second -quarter Chemicals earnings were $295 million , compared with earnings of $203 million in the first quarter of 2015. During the second quarter, CPChem's Olefins and Polyolefins business contributed $267 million to Phillips 66's Chemicals earnings. The $84 million improvement from the prior quarter was mainly due to increased polyethylene sales volumes on strong product demand and improved O&P cash chain margins, driven by lower ethylene feedstock costs and higher polyethylene sales prices. CPChem's equity affiliate earnings also improved as a result of higher sales prices, as well as increased volumes due to the completion of turnaround activity in the first quarter. Global utilization for O&P was 91 percent during the quarter, up from 87 percent in the first quarter, primarily reflecting reduced turnaround activity. Final insurance recoveries related to CPChem's 2014 Port Arthur ethylene plant outage increased earnings in the second quarter. CPChem's Specialties, Aromatics and Styrenics business contributed $38 million of earnings in the second quarter, an increase of $12 million from the prior quarter. The increase was primarily due to improved margins at CPChem's SA&S equity affiliates. Refining
Refining adjusted earnings were $604 million in the second quarter, compared with $495 million in the first quarter of 2015. The increase in earnings was largely driven by improved realized gasoline margins, partially offset by reduced distillate and secondary product margins. Distillate margins declined primarily due to a seasonal reduction in demand, while secondary product margins were down mainly due to higher crude costs. Market capture for the second quarter was 62 percent, reflecting the company's refining configuration that is more heavily weighted toward distillate production than the market indicator. Earnings were also improved by a positive change in foreign currency impacts. Phillips 66’s worldwide refining crude utilization was 90 percent and clean product yield was 84 percent in the second quarter of 2015 . A major turnaround was recently completed at our Humber Refinery in the U.K. Page 3
Millions of Dollars
Earnings Adjusted Earnings
2nd Qtr
2015 1st Qtr 2015
2nd Qtr 2015
1st Qtr 2015
Refining $ 604 538 604 495

Phillips 66 Reports Second-Quarter Earnings of $1.0 Billion (Adjusted Earnings of $1.0 Billion) Marketing and Specialties
Marketing and Specialties (M&S) second -quarter adjusted earnings were $182 million , compared with $194 million in the first quarter of 2015 . Adjusted earnings for Marketing and Other were $134 million , a decrease of $10 million from the prior quarter. The business realized strong U.S. margins driven by favorable market conditions and higher volumes; however, earnings were slightly lower than last quarter primarily due to foreign currency impacts. Second-quarter refined product exports were 143,000 barrels per day (BPD), up 57,000 BPD primarily due to favorable distillate export economics combined with increased refinery throughput in the Gulf Coast. Phillips 66’s Specialties businesses generated earnings of $48 million during the second quarter, in line with the first quarter. Corporate and Other
Corporate and Other adjusted costs were $127 million after-tax in the second quarter, consistent with the first quarter of 2015 . Financial Position, Liquidity and Return of Capital During the second quarter, Phillips 66 generated $1.4 billion of cash from operations. Excluding working capital changes, operating cash flow was $1.8 billion . Total cash distributions from CPChem were $873 million. Capital expenditures and investments totaled $1.2 billion , primarily supporting execution of the Midstream growth strategy. Phillips 66 returned $636 million to shareholders in the form of $302 million in dividends and $334 million in repurchases of 4.2 million shares of common stock. Since July 2012, the company has repurchased 83 million shares for $5.6 billion and increased its quarterly dividend by 180 percent to $0.56. Phillips 66 ended the quarter with 538 million shares outstanding and $1.4 billion of remaining capacity under its current share repurchase authorization. Page 4
Millions of Dollars
Earnings Adjusted Earnings
2nd Qtr
2015 1st Qtr 2015
2nd Qtr 2015
1st Qtr 2015
Marketing and Other $ 266 254 134 144 Specialties 48 50 48 50 Marketing and Specialties $ 314 304 182 194
Millions of Dollars
Earnings Adjusted Earnings
2nd Qtr
2015 1st Qtr 2015
2nd Qtr 2015
1st Qtr 2015
Corporate and Other $ (123 ) (125 ) (127 ) (125 )
Phillips 66 Reports Second-Quarter Earnings of $1.0 Billion (Adjusted Earnings of $1.0 Billion)
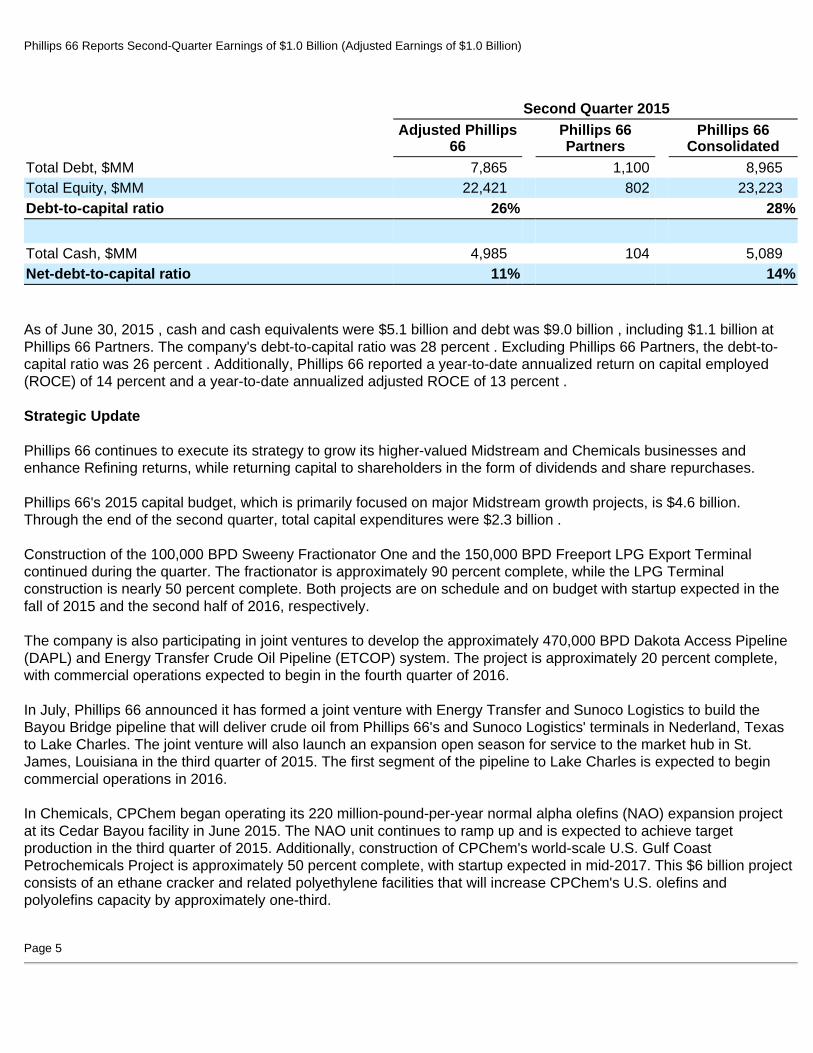
As of June 30, 2015 , cash and cash equivalents were $5.1 billion and debt was $9.0 billion , including $1.1 billion at Phillips 66 Partners. The company's debt-to-capital ratio was 28 percent . Excluding Phillips 66 Partners, the debt-to-capital ratio was 26 percent . Additionally, Phillips 66 reported a year-to-date annualized return on capital employed (ROCE) of 14 percent and a year-to-date annualized adjusted ROCE of 13 percent . Strategic Update Phillips 66 continues to execute its strategy to grow its higher-valued Midstream and Chemicals businesses and enhance Refining returns, while returning capital to shareholders in the form of dividends and share repurchases. Phillips 66's 2015 capital budget, which is primarily focused on major Midstream growth projects, is $4.6 billion. Through the end of the second quarter, total capital expenditures were $2.3 billion . Construction of the 100,000 BPD Sweeny Fractionator One and the 150,000 BPD Freeport LPG Export Terminal continued during the quarter. The fractionator is approximately 90 percent complete, while the LPG Terminal construction is nearly 50 percent complete. Both projects are on schedule and on budget with startup expected in the fall of 2015 and the second half of 2016, respectively. The company is also participating in joint ventures to develop the approximately 470,000 BPD Dakota Access Pipeline (DAPL) and Energy Transfer Crude Oil Pipeline (ETCOP) system. The project is approximately 20 percent complete, with commercial operations expected to begin in the fourth quarter of 2016. In July, Phillips 66 announced it has formed a joint venture with Energy Transfer and Sunoco Logistics to build the Bayou Bridge pipeline that will deliver crude oil from Phillips 66's and Sunoco Logistics' terminals in Nederland, Texas to Lake Charles. The joint venture will also launch an expansion open season for service to the market hub in St. James, Louisiana in the third quarter of 2015. The first segment of the pipeline to Lake Charles is expected to begin commercial operations in 2016. In Chemicals, CPChem began operating its 220 million-pound-per-year normal alpha olefins (NAO) expansion project at its Cedar Bayou facility in June 2015. The NAO unit continues to ramp up and is expected to achieve target production in the third quarter of 2015. Additionally, construction of CPChem's world-scale U.S. Gulf Coast Petrochemicals Project is approximately 50 percent complete, with startup expected in mid-2017. This $6 billion project consists of an ethane cracker and related polyethylene facilities that will increase CPChem's U.S. olefins and polyolefins capacity by approximately one-third. Page 5
Second Quarter 2015
Adjusted Phillips
66 Phillips 66 Partners
Phillips 66 Consolidated
Total Debt, $MM 7,865 1,100 8,965 Total Equity, $MM 22,421 802 23,223 Debt-to-capital ratio 26 % 28 %
Total Cash, $MM 4,985 104 5,089 Net-debt-to-capital ratio 11 % 14 %
Phillips 66 Reports Second-Quarter Earnings of $1.0 Billion (Adjusted Earnings of $1.0 Billion) Later today, members of Phillips 66 executive management will host a webcast at noon EDT to discuss the company’s second -quarter performance and provide an update on strategic initiatives. To access the webcast and view related presentation materials, go to www.phillips66.com/investors and click on "Events & Presentations." For detailed supplemental information, go to www.phillips66.com/supplemental .
Page 6
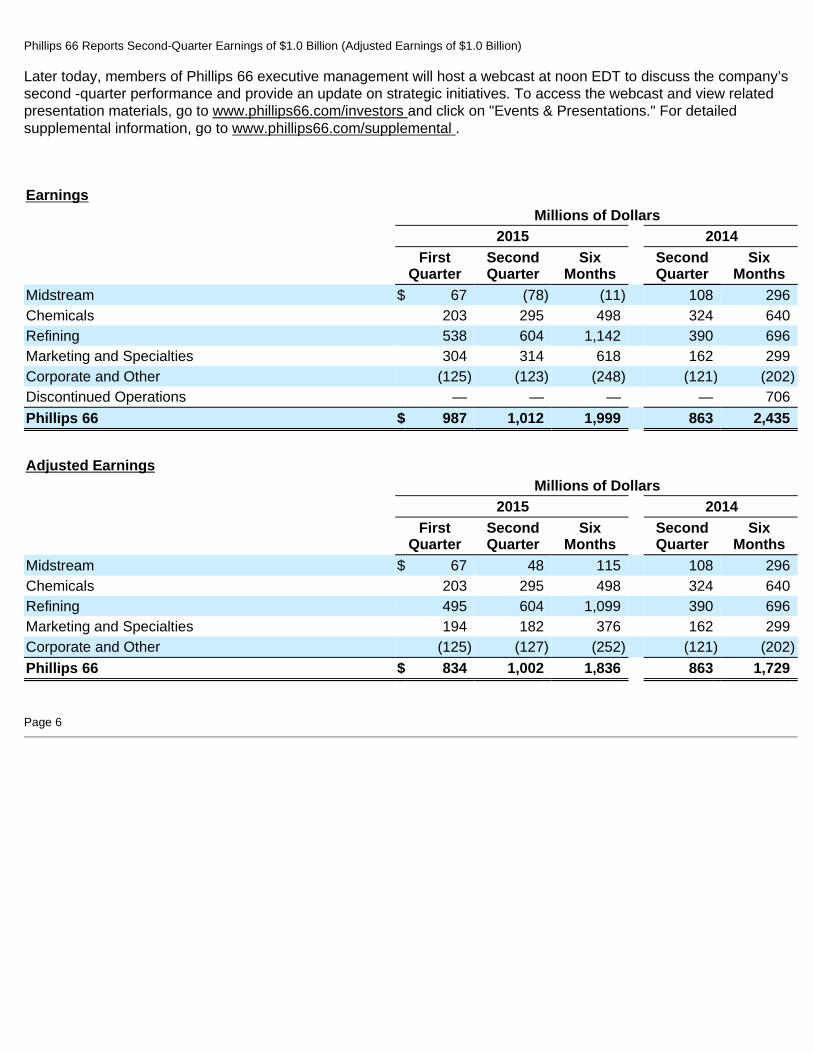
Earnings
Millions of Dollars
2015 2014
First
Quarter Second Quarter
Six Months
Second Quarter
Six Months
Midstream $ 67 (78 ) (11 ) 108 296 Chemicals 203 295 498 324 640 Refining 538 604 1,142 390 696 Marketing and Specialties 304 314 618 162 299 Corporate and Other (125 ) (123 ) (248 ) (121 ) (202 ) Discontinued Operations — — — — 706 Phillips 66 $ 987 1,012 1,999 863 2,435
Adjusted Earnings
Millions of Dollars
2015 2014
First
Quarter Second Quarter
Six Months
Second Quarter
Six Months
Midstream $ 67 48 115 108 296 Chemicals 203 295 498 324 640 Refining 495 604 1,099 390 696 Marketing and Specialties 194 182 376 162 299 Corporate and Other (125 ) (127 ) (252 ) (121 ) (202 )
Phillips 66 $ 834 1,002 1,836 863 1,729
Phillips 66 Reports Second-Quarter Earnings of $1.0 Billion (Adjusted Earnings of $1.0 Billion) About Phillips 66 Phillips 66 is a diversified energy manufacturing and logistics company. With a portfolio of Midstream, Chemicals, Refining, and Marketing and Specialties businesses, the company processes, transports, stores and markets fuels and products globally. Phillips 66 Partners, the company's master limited partnership, is an integral asset in the portfolio. Headquartered in Houston, the company has 14,000 employees committed to safety and operating excellence. Phillips 66 had $50 billion of assets as of June 30, 2015 . For more information, visit www.phillips66.com or follow us on Twitter @Phillips66Co .
- # # # -
CAUTIONARY STATEMENT FOR THE PURPOSES OF THE "SAFE HARBOR" PROVISIONS OF THE PRIVATE SECURITIES LITIGATION REFORM ACT OF 1995
This news release contains certain forward-looking statements within the meaning of Section 27A of the Securities Act of 1933, as amended, and Section 21E of the Securities Exchange Act of 1934, as amended, which are intended to be covered by the safe harbors created thereby. Words and phrases such as “is anticipated,” “is estimated,” “is expected,” “is planned,” “is scheduled,” “is targeted,” “believes,” “intends,” “objectives,” “projects,” “strategies” and similar expressions are used to identify such forward-looking statements. However, the absence of these words does not mean that a statement is not forward-looking. Forward-looking statements relating to Phillips 66’s operations (including joint venture operations) are based on management’s expectations, estimates and projections about the company, its interests and the energy industry in general on the date this news release was prepared. These statements are not guarantees of future performance and involve certain risks, uncertainties and assumptions that are difficult to predict. Therefore, actual outcomes and results may differ materially from what is expressed or forecast in such forward-looking statements. Factors that could cause actual results or events to differ materially from those described in the forward-looking statements include fluctuations in NGL, crude oil, and natural gas prices, and petrochemical and refining margins; unexpected changes in costs for constructing, modifying or operating our facilities; unexpected difficulties in manufacturing, refining or transporting our products; lack of, or disruptions in, adequate and reliable transportation for our NGL, crude oil, natural gas, and refined products; potential liability from litigation or for remedial actions, including removal and reclamation obligations under environmental regulations; limited access to capital or significantly higher cost of capital related to illiquidity or uncertainty in the domestic or international financial markets; and other economic, business, competitive and/or regulatory factors affecting Phillips 66’s businesses generally as set forth in our filings with the Securities and Exchange Commission. Phillips 66 is under no obligation (and expressly disclaims any such obligation) to update or alter its forward-looking statements, whether as a result of new information, future events or otherwise. Use of Non-GAAP Financial Information -- This news release includes the terms adjusted earnings, adjusted earnings per share, adjusted effective tax rate, operating cash flow excluding working capital, and adjusted ROCE. These are non-GAAP financial measures that are included to help facilitate comparisons of company operating performance across periods. References in the release to earnings refer to net income attributable to Phillips 66. Page 7
CONTACTS
Kevin Mitchell (investors) C.W. Mallon (investors)
832-765-2297 832-765-2297
[email protected] [email protected]
Dennis Nuss (media)
832-765-1850
Phillips 66 Reports Second-Quarter Earnings of $1.0 Billion (Adjusted Earnings of $1.0 Billion)
Page 8
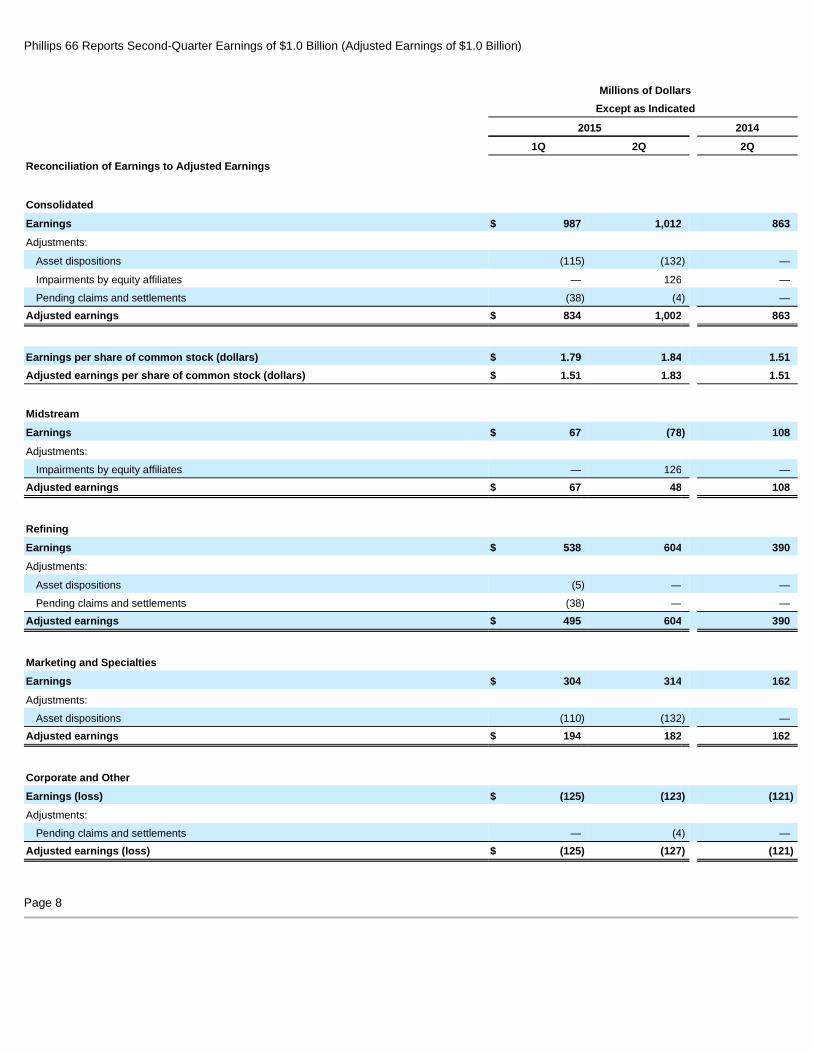
Millions of Dollars
Except as Indicated
2015 2014
1Q 2Q 2Q
Reconciliation of Earnings to Adjusted Earnings
Consolidated
Earnings $ 987 1,012 863 Adjustments:
Asset dispositions (115 ) (132 ) — Impairments by equity affiliates — 126 — Pending claims and settlements (38 ) (4 ) —
Adjusted earnings $ 834 1,002 863
Earnings per share of common stock (dollars) $ 1.79 1.84 1.51 Adjusted earnings per share of common stock (dollars) $ 1.51 1.83 1.51
Midstream
Earnings $ 67 (78 ) 108 Adjustments:
Impairments by equity affiliates — 126 — Adjusted earnings $ 67 48 108
Refining
Earnings $ 538 604 390 Adjustments:
Asset dispositions (5 ) — — Pending claims and settlements (38 ) — —
Adjusted earnings $ 495 604 390
Marketing and Specialties
Earnings $ 304 314 162 Adjustments:
Asset dispositions (110 ) (132 ) — Adjusted earnings $ 194 182 162
Corporate and Other
Earnings (loss) $ (125 ) (123 ) (121 )
Adjustments:
Pending claims and settlements — (4 ) — Adjusted earnings (loss) $ (125 ) (127 ) (121 )
Phillips 66 Reports Second-Quarter Earnings of $1.0 Billion (Adjusted Earnings of $1.0 Billion)
Page 9
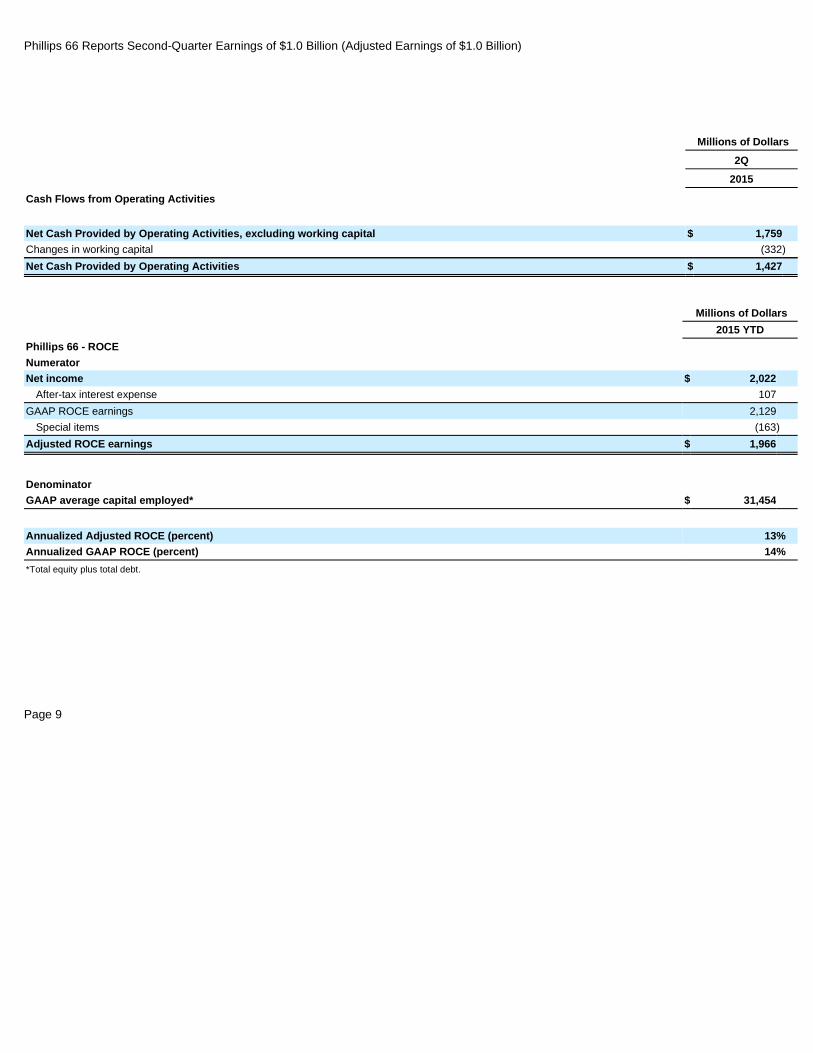
Millions of Dollars
2Q
2015
Cash Flows from Operating Activities
Net Cash Provided by Operating Activities, excludin g working capital $ 1,759 Changes in working capital (332 )
Net Cash Provided by Operating Activities $ 1,427
Millions of Dollars
2015 YTD
Phillips 66 - ROCE
Numerator
Net income $ 2,022 After-tax interest expense 107
GAAP ROCE earnings 2,129 Special items (163 )
Adjusted ROCE earnings $ 1,966
Denominator GAAP average capital employed* $ 31,454 Annualized Adjusted ROCE (percent) 13 % Annualized GAAP ROCE (percent) 14 %
*Total equity plus total debt.
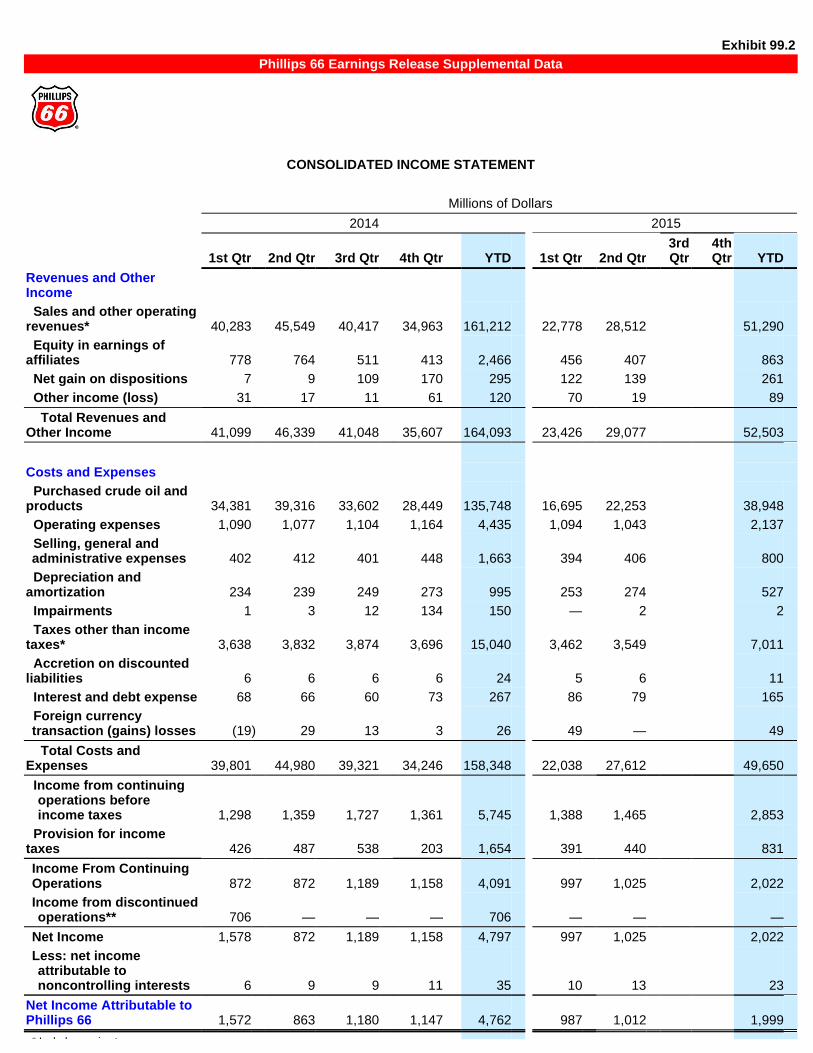
Exhibit 99.2 Phillips 66 Earnings Release Supplemental Data
CONSOLIDATED INCOME STATEMENT
Millions of Dollars
2014 2015
1st Qtr 2nd Qtr 3rd Qtr 4th Qtr YTD 1st Qtr 2nd Qtr 3rd Qtr
4th Qtr YTD
Revenues and Other Income
Sales and other operating revenues* 40,283 45,549 40,417 34,963 161,212 22,778 28,512 51,290 Equity in earnings of affiliates 778 764 511 413 2,466 456 407 863 Net gain on dispositions 7 9 109 170 295 122 139 261 Other income (loss) 31 17 11 61 120 70 19 89 Total Revenues and Other Income 41,099 46,339 41,048 35,607 164,093 23,426 29,077 52,503
Costs and Expenses
Purchased crude oil and products 34,381 39,316 33,602 28,449 135,748 16,695 22,253 38,948 Operating expenses 1,090 1,077 1,104 1,164 4,435 1,094 1,043 2,137 Selling, general and administrative expenses 402 412 401 448 1,663 394 406 800
Depreciation and amortization 234 239 249 273 995 253 274 527 Impairments 1 3 12 134 150 — 2 2 Taxes other than income taxes* 3,638 3,832 3,874 3,696 15,040 3,462 3,549 7,011 Accretion on discounted liabilities 6 6 6 6 24 5 6 11 Interest and debt expense 68 66 60 73 267 86 79 165 Foreign currency transaction (gains) losses (19 ) 29 13 3 26 49 — 49
Total Costs and Expenses 39,801 44,980 39,321 34,246 158,348 22,038 27,612 49,650 Income from continuing
operations before income taxes 1,298 1,359 1,727 1,361 5,745 1,388 1,465 2,853
Provision for income taxes 426 487 538 203 1,654 391 440 831 Income From Continuing Operations 872 872 1,189 1,158 4,091 997 1,025 2,022 Income from discontinued operations** 706 — — — 706 — — —
Net Income 1,578 872 1,189 1,158 4,797 997 1,025 2,022 Less: net income attributable to noncontrolling interests 6 9 9 11 35 10 13 23
Net Income Attributable to Phillips 66 1,572 863 1,180 1,147 4,762 987 1,012 1,999
* Includes excise taxes on
petroleum products sales: 3,522 3,743 3,781 3,652 14,698 3,362 3,463 6,825 ** Net of provision for income taxes
on discontinued operations: 5 — — — 5 — — —
Amounts Attributable to Phillips 66 Common Stockholders:
Income from continuing operations 866 863 1,180 1,147 4,056 987 1,012 1,999 Income from discontinued operations 706 — — — 706 — — —
Net Income Attributable to Phillips 66 1,572 863 1,180 1,147 4,762 987 1,012 1,999
Net Income Attributable to Phillips 66
Per Share of Common Stock (dollars)
Basic
Continuing operations 1.48 1.52 2.11 2.07 7.15 1.80 1.85 3.65 Discontinued operations 1.21 — — — 1.25 — — —
Net Income Attributable to Phillips 66
Per Share of Common Stock 2.69 1.52 2.11 2.07 8.40 1.80 1.85 3.65
Diluted
Continuing operations 1.47 1.51 2.09 2.05 7.10 1.79 1.84 3.63 Discontinued operations 1.20 — — — 1.23 — — —
Net Income Attributable to Phillips 66
Per Share of Common Stock 2.67 1.51 2.09 2.05 8.33 1.79 1.84 3.63
Average Common Shares Outstanding (in thousands)
Basic 584,053 565,799 559,492 554,617 565,902 548,200 544,617 546,398 Diluted 589,575 571,285 564,958 559,023 571,504 552,337 548,926 550,985
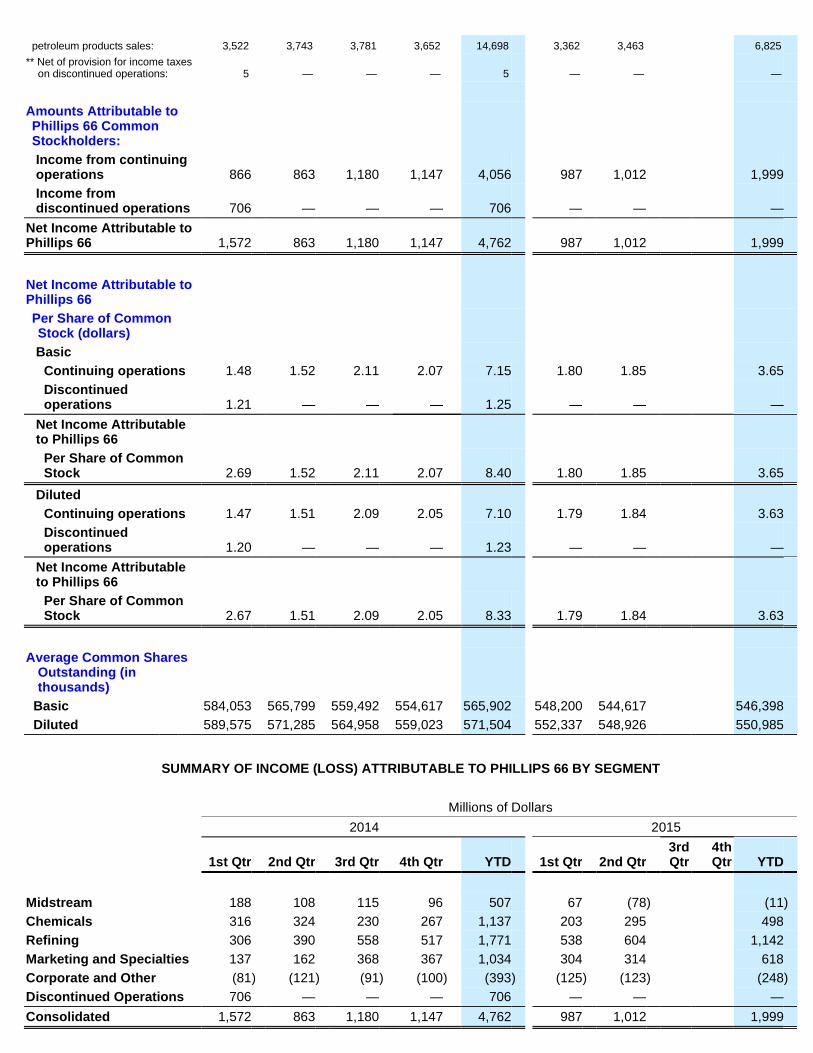
SUMMARY OF INCOME (LOSS) ATTRIBUTABLE TO PHILLIPS 6 6 BY SEGMENT
Millions of Dollars
2014 2015
1st Qtr 2nd Qtr 3rd Qtr 4th Qtr YTD 1st Qtr 2nd Qtr 3rd Qtr
4th Qtr YTD
Midstream 188 108 115 96 507 67 (78 ) (11 ) Chemicals 316 324 230 267 1,137 203 295 498 Refining 306 390 558 517 1,771 538 604 1,142 Marketing and Specialties 137 162 368 367 1,034 304 314 618 Corporate and Other (81 ) (121 ) (91 ) (100 ) (393 ) (125 ) (123 ) (248 ) Discontinued Operations 706 — — — 706 — — — Consolidated 1,572 863 1,180 1,147 4,762 987 1,012 1,999
Page 1
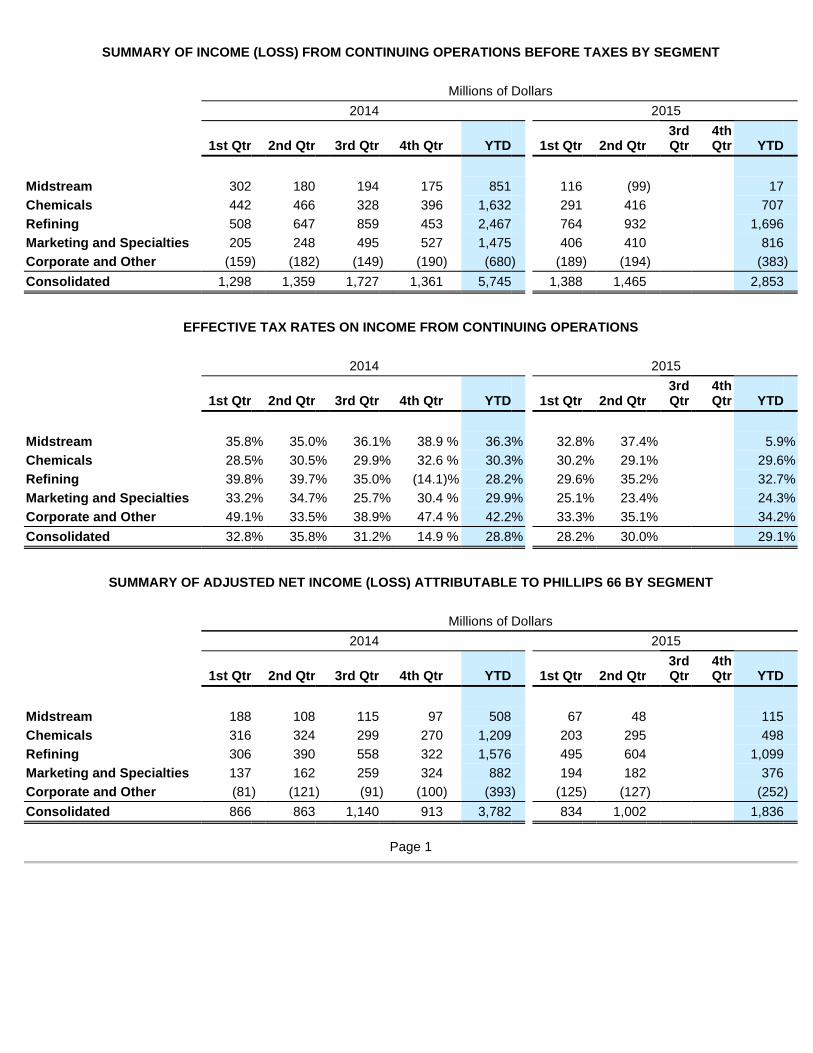
SUMMARY OF INCOME (LOSS) FROM CONTINUING OPERATIONS BEFORE TAXES BY SEGMENT
Millions of Dollars
2014 2015
1st Qtr 2nd Qtr 3rd Qtr 4th Qtr YTD 1st Qtr 2nd Qtr 3rd Qtr
4th Qtr YTD
Midstream 302 180 194 175 851 116 (99 ) 17 Chemicals 442 466 328 396 1,632 291 416 707 Refining 508 647 859 453 2,467 764 932 1,696 Marketing and Specialties 205 248 495 527 1,475 406 410 816 Corporate and Other (159 ) (182 ) (149 ) (190 ) (680 ) (189 ) (194 ) (383 )
Consolidated 1,298 1,359 1,727 1,361 5,745 1,388 1,465 2,853
EFFECTIVE TAX RATES ON INCOME FROM CONTINUING OPERA TIONS
2014 2015
1st Qtr 2nd Qtr 3rd Qtr 4th Qtr YTD 1st Qtr 2nd Qtr 3rd Qtr
4th Qtr YTD
Midstream 35.8 % 35.0 % 36.1 % 38.9 % 36.3 % 32.8 % 37.4 % 5.9 % Chemicals 28.5 % 30.5 % 29.9 % 32.6 % 30.3 % 30.2 % 29.1 % 29.6 % Refining 39.8 % 39.7 % 35.0 % (14.1 )% 28.2 % 29.6 % 35.2 % 32.7 % Marketing and Specialties 33.2 % 34.7 % 25.7 % 30.4 % 29.9 % 25.1 % 23.4 % 24.3 % Corporate and Other 49.1 % 33.5 % 38.9 % 47.4 % 42.2 % 33.3 % 35.1 % 34.2 %
Consolidated 32.8 % 35.8 % 31.2 % 14.9 % 28.8 % 28.2 % 30.0 % 29.1 %
SUMMARY OF ADJUSTED NET INCOME (LOSS) ATTRIBUTABLE TO PHILLIPS 66 BY SEGMENT
Millions of Dollars
2014 2015
1st Qtr 2nd Qtr 3rd Qtr 4th Qtr YTD 1st Qtr 2nd Qtr 3rd Qtr
4th Qtr YTD
Midstream 188 108 115 97 508 67 48 115 Chemicals 316 324 299 270 1,209 203 295 498 Refining 306 390 558 322 1,576 495 604 1,099 Marketing and Specialties 137 162 259 324 882 194 182 376 Corporate and Other (81 ) (121 ) (91 ) (100 ) (393 ) (125 ) (127 ) (252 )
Consolidated 866 863 1,140 913 3,782 834 1,002 1,836
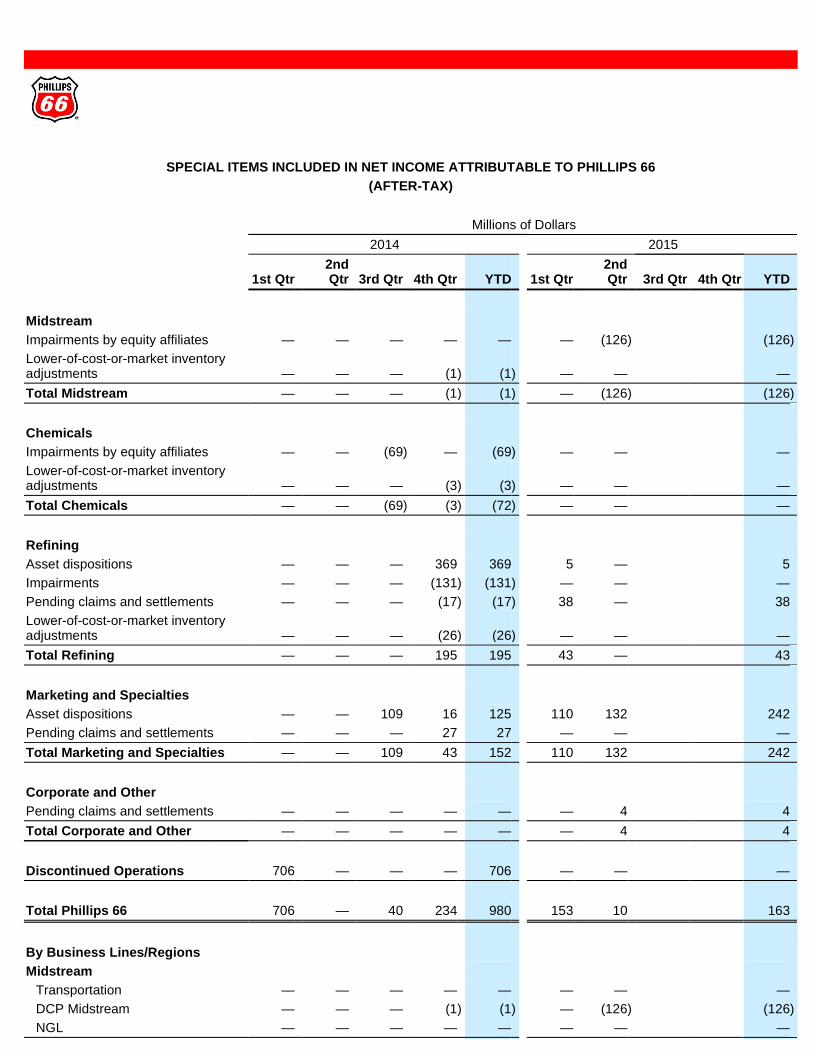
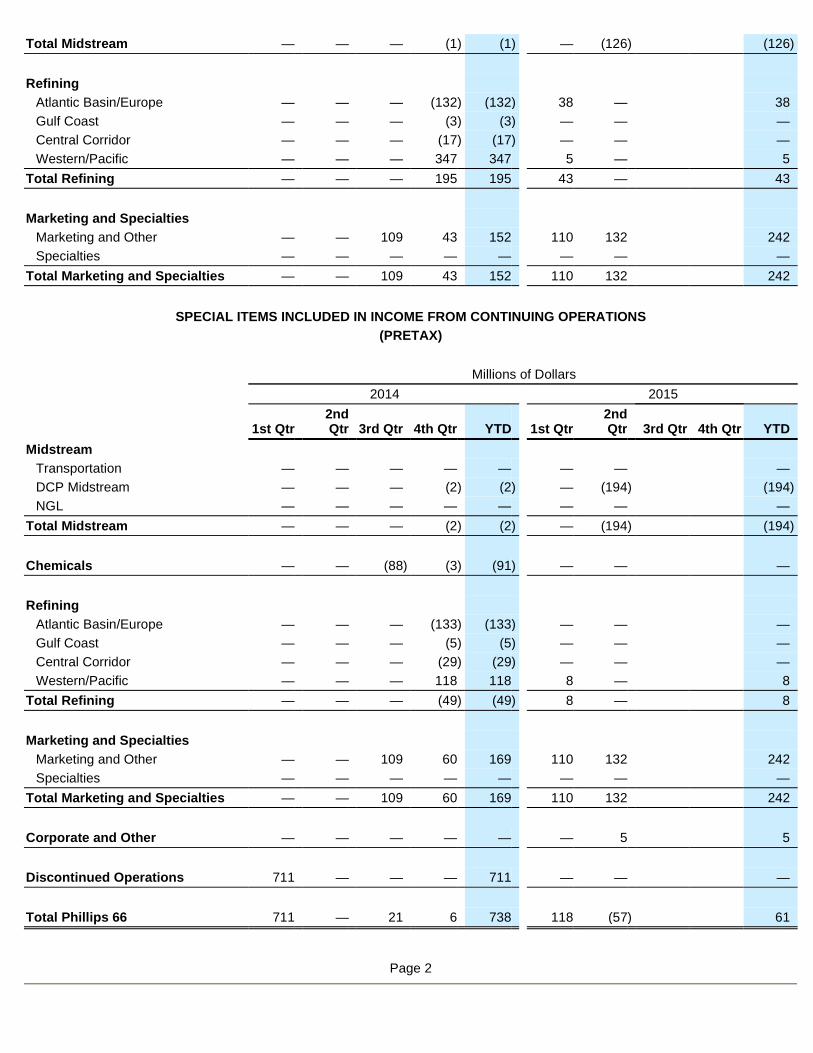
SPECIAL ITEMS INCLUDED IN NET INCOME ATTRIBUTABLE T O PHILLIPS 66 (AFTER-TAX)
Millions of Dollars
2014 2015
1st Qtr 2nd Qtr 3rd Qtr 4th Qtr YTD 1st Qtr
2nd Qtr 3rd Qtr 4th Qtr YTD
Midstream
Impairments by equity affiliates — — — — — — (126 ) (126 ) Lower-of-cost-or-market inventory adjustments — — — (1 ) (1 ) — — — Total Midstream — — — (1 ) (1 ) — (126 ) (126 )
Chemicals
Impairments by equity affiliates — — (69 ) — (69 ) — — — Lower-of-cost-or-market inventory adjustments — — — (3 ) (3 ) — — — Total Chemicals — — (69 ) (3 ) (72 ) — — —
Refining
Asset dispositions — — — 369 369 5 — 5 Impairments — — — (131 ) (131 ) — — — Pending claims and settlements — — — (17 ) (17 ) 38 — 38 Lower-of-cost-or-market inventory adjustments — — — (26 ) (26 ) — — — Total Refining — — — 195 195 43 — 43
Marketing and Specialties
Asset dispositions — — 109 16 125 110 132 242 Pending claims and settlements — — — 27 27 — — — Total Marketing and Specialties — — 109 43 152 110 132 242
Corporate and Other
Pending claims and settlements — — — — — — 4 4 Total Corporate and Other — — — — — — 4 4
Discontinued Operations 706 — — — 706 — — —
Total Phillips 66 706 — 40 234 980 153 10 163
By Business Lines/Regions
Midstream
Transportation — — — — — — — — DCP Midstream — — — (1 ) (1 ) — (126 ) (126 ) NGL — — — — — — — —
Page 2
Total Midstream — — — (1 ) (1 ) — (126 ) (126 )
Refining
Atlantic Basin/Europe — — — (132 ) (132 ) 38 — 38 Gulf Coast — — — (3 ) (3 ) — — — Central Corridor — — — (17 ) (17 ) — — — Western/Pacific — — — 347 347 5 — 5
Total Refining — — — 195 195 43 — 43
Marketing and Specialties
Marketing and Other — — 109 43 152 110 132 242 Specialties — — — — — — — —
Total Marketing and Specialties — — 109 43 152 110 132 242
SPECIAL ITEMS INCLUDED IN INCOME FROM CONTINUING OP ERATIONS (PRETAX)
Millions of Dollars
2014 2015
1st Qtr 2nd Qtr 3rd Qtr 4th Qtr YTD 1st Qtr
2nd Qtr 3rd Qtr 4th Qtr YTD
Midstream
Transportation — — — — — — — — DCP Midstream — — — (2 ) (2 ) — (194 ) (194 ) NGL — — — — — — — —
Total Midstream — — — (2 ) (2 ) — (194 ) (194 )
Chemicals — — (88 ) (3 ) (91 ) — — —
Refining
Atlantic Basin/Europe — — — (133 ) (133 ) — — — Gulf Coast — — — (5 ) (5 ) — — — Central Corridor — — — (29 ) (29 ) — — — Western/Pacific — — — 118 118 8 — 8
Total Refining — — — (49 ) (49 ) 8 — 8
Marketing and Specialties
Marketing and Other — — 109 60 169 110 132 242 Specialties — — — — — — — —
Total Marketing and Specialties — — 109 60 169 110 132 242
Corporate and Other — — — — — — 5 5
Discontinued Operations 711 — — — 711 — — —
Total Phillips 66 711 — 21 6 738 118 (57 ) 61

CASH FLOW INFORMATION
Millions of Dollars
2014 2015
1st Qtr 2nd Qtr 3rd Qtr 4th Qtr YTD 1st Qtr
2nd Qtr 3rd Qtr 4th Qtr YTD
Cash Flows From Operating Activities
Net income 1,578 872 1,189 1,158 4,797 997 1,025 2,022 Depreciation and amortization 234 239 249 273 995 253 274 527 Impairments 1 3 12 134 150 — 2 2 Accretion on discounted liabilities 6 6 6 6 24 5 6 11 Deferred taxes (444 ) (11 ) (72 ) 39 (488 ) (6 ) (75 ) (81 ) Undistributed equity earnings 632 (253 ) (19 ) (163 ) 197 (337 ) 662 325 Net gain on dispositions (7 ) (9 ) (109 ) (170 ) (295 ) (122 ) (139 ) (261 ) Income from discontinued operations (706 ) — — — (706 ) — — — Other (21 ) 90 1 (197 ) (127 ) 90 4 94 Net working capital changes 123 (107 ) (828 ) (208 ) (1,020 ) 472 (332 ) 140
Net cash provided by continuing operating activities 1,396 830 429 872 3,527 1,352 1,427 2,779 Net cash provided by discontinued operations 2 — — — 2 — — — Net Cash Provided by Operating
Activities 1,398 830 429 872 3,529 1,352 1,427 2,779
Cash Flows From Investing Activities
Capital expenditures and investments (572 ) (561 ) (1,514 ) (1,126 ) (3,773 ) (1,081 ) (1,213 ) (2,294 ) Proceeds from asset dispositions* 507 150 6 581 1,244 (9 ) 4 (5 ) Advances/loans—related parties — (3 ) — — (3 ) (50 ) — (50 ) Collection of advances/loans—related parties — — — — — — 50 50
Other 13 21 127 77 238 102 (55 ) 47 Net cash used in continuing investing activities (52 ) (393 ) (1,381 ) (468 ) (2,294 ) (1,038 ) (1,214 ) (2,252 )
Net cash provided by (used in) discontinued operations (34 ) 32 — — (2 ) — — —
Net Cash Used in Investing Activities (86 ) (361 ) (1,381 ) (468 ) (2,296 ) (1,038 ) (1,214 ) (2,252 )
Cash Flows From Financing Activities
Issuance of debt — — — 2,487 2,487 1,169 — 1,169 Repayment of debt (8 ) (9 ) (13 ) (19 ) (49 ) (895 ) (9 ) (904 ) Issuance of common stock (20 ) 8 13 — 1 (25 ) — (25 ) Repurchase of common stock (640 ) (616 ) (494 ) (532 ) (2,282 ) (399 ) (334 ) (733 )
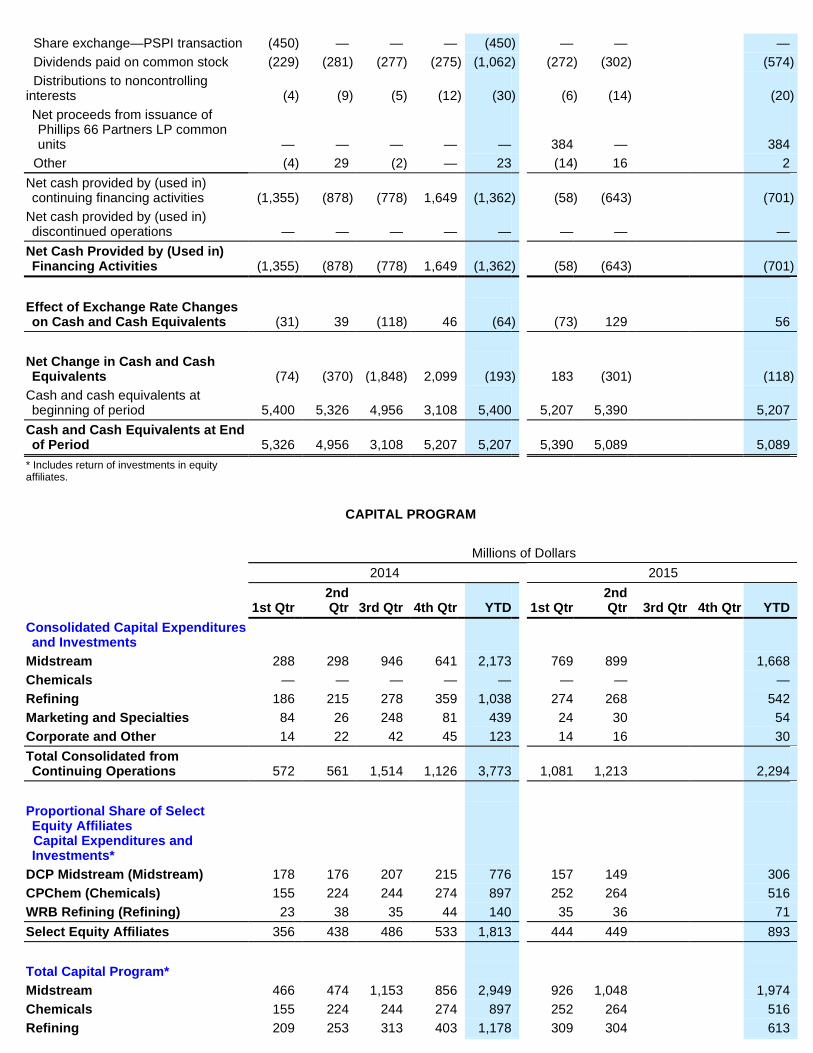
Share exchange—PSPI transaction (450 ) — — — (450 ) — — — Dividends paid on common stock (229 ) (281 ) (277 ) (275 ) (1,062 ) (272 ) (302 ) (574 ) Distributions to noncontrolling interests (4 ) (9 ) (5 ) (12 ) (30 ) (6 ) (14 ) (20 ) Net proceeds from issuance of Phillips 66 Partners LP common units — — — — — 384 — 384
Other (4 ) 29 (2 ) — 23 (14 ) 16 2 Net cash provided by (used in) continuing financing activities (1,355 ) (878 ) (778 ) 1,649 (1,362 ) (58 ) (643 ) (701 )
Net cash provided by (used in) discontinued operations — — — — — — — —
Net Cash Provided by (Used in) Financing Activities (1,355 ) (878 ) (778 ) 1,649 (1,362 ) (58 ) (643 ) (701 )
Effect of Exchange Rate Changes on Cash and Cash Equivalents (31 ) 39 (118 ) 46 (64 ) (73 ) 129 56
Net Change in Cash and Cash Equivalents (74 ) (370 ) (1,848 ) 2,099 (193 ) 183 (301 ) (118 )
Cash and cash equivalents at beginning of period 5,400 5,326 4,956 3,108 5,400 5,207 5,390 5,207
Cash and Cash Equivalents at End of Period 5,326 4,956 3,108 5,207 5,207 5,390 5,089 5,089
* Includes return of investments in equity affiliates.
CAPITAL PROGRAM
Millions of Dollars
2014 2015
1st Qtr 2nd Qtr 3rd Qtr 4th Qtr YTD 1st Qtr
2nd Qtr 3rd Qtr 4th Qtr YTD
Consolidated Capital Expenditures and Investments
Midstream 288 298 946 641 2,173 769 899 1,668 Chemicals — — — — — — — — Refining 186 215 278 359 1,038 274 268 542 Marketing and Specialties 84 26 248 81 439 24 30 54 Corporate and Other 14 22 42 45 123 14 16 30 Total Consolidated from Continuing Operations 572 561 1,514 1,126 3,773 1,081 1,213 2,294
Proportional Share of Select Equity Affiliates
Capital Expenditures and Investments*
DCP Midstream (Midstream) 178 176 207 215 776 157 149 306 CPChem (Chemicals) 155 224 244 274 897 252 264 516 WRB Refining (Refining) 23 38 35 44 140 35 36 71 Select Equity Affiliates 356 438 486 533 1,813 444 449 893
Total Capital Program*
Midstream 466 474 1,153 856 2,949 926 1,048 1,974 Chemicals 155 224 244 274 897 252 264 516 Refining 209 253 313 403 1,178 309 304 613
Page 3
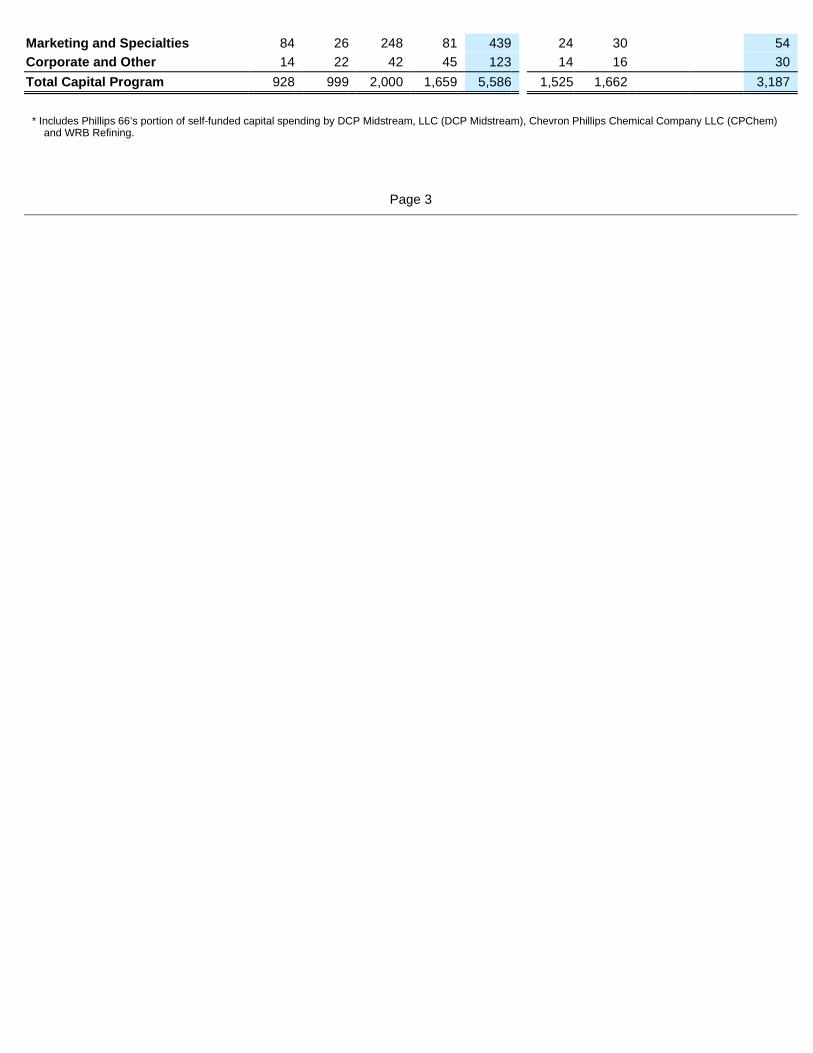
Marketing and Specialties 84 26 248 81 439 24 30 54 Corporate and Other 14 22 42 45 123 14 16 30 Total Capital Program 928 999 2,000 1,659 5,586 1,525 1,662 3,187
* Includes Phillips 66’s portion of self-funded capital spending by DCP Midstream, LLC (DCP Midstream), Chevron Phillips Chemical Company LLC (CPChem)
and WRB Refining.
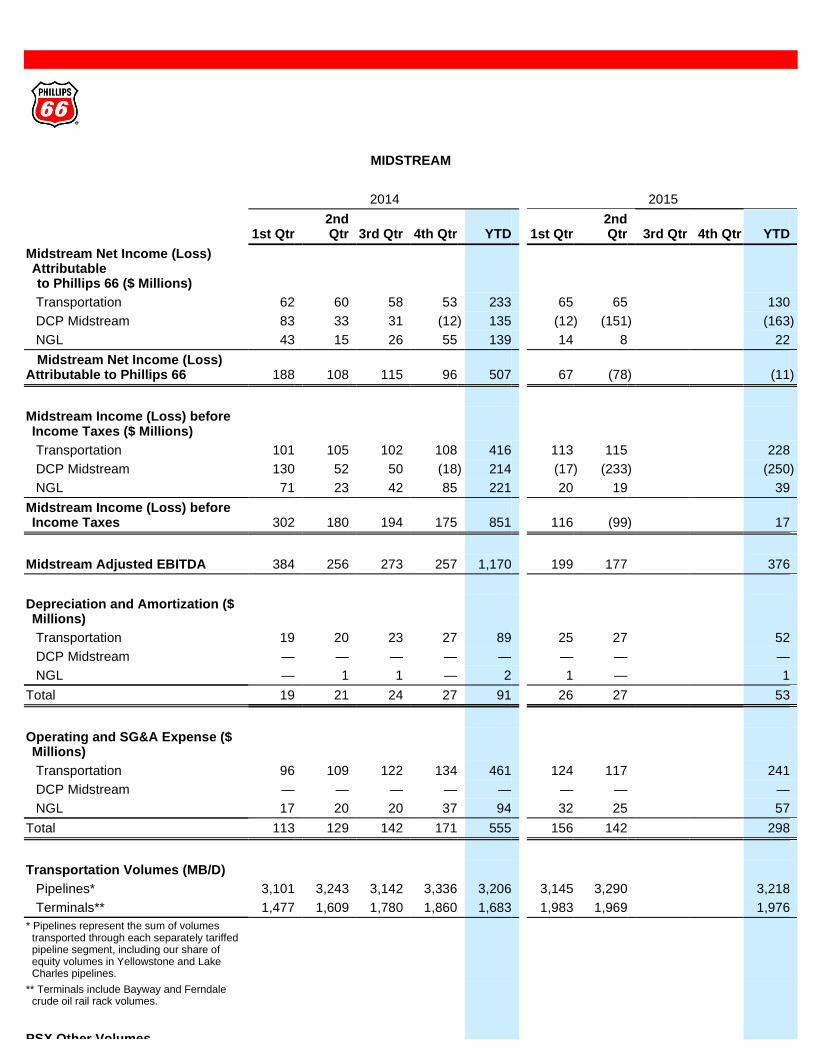
MIDSTREAM
2014 2015
1st Qtr 2nd Qtr 3rd Qtr 4th Qtr YTD 1st Qtr
2nd Qtr 3rd Qtr 4th Qtr YTD
Midstream Net Income (Loss) Attributable
to Phillips 66 ($ Millions)
Transportation 62 60 58 53 233 65 65 130 DCP Midstream 83 33 31 (12 ) 135 (12 ) (151 ) (163 ) NGL 43 15 26 55 139 14 8 22
Midstream Net Income (Loss) Attributable to Phillips 66 188 108 115 96 507 67 (78 ) (11 )
Midstream Income (Loss) before Income Taxes ($ Millions)
Transportation 101 105 102 108 416 113 115 228 DCP Midstream 130 52 50 (18 ) 214 (17 ) (233 ) (250 ) NGL 71 23 42 85 221 20 19 39
Midstream Income (Loss) before Income Taxes 302 180 194 175 851 116 (99 ) 17
Midstream Adjusted EBITDA 384 256 273 257 1,170 199 177 376
Depreciation and Amortization ($ Millions)
Transportation 19 20 23 27 89 25 27 52 DCP Midstream — — — — — — — — NGL — 1 1 — 2 1 — 1
Total 19 21 24 27 91 26 27 53
Operating and SG&A Expense ($ Millions)
Transportation 96 109 122 134 461 124 117 241 DCP Midstream — — — — — — — — NGL 17 20 20 37 94 32 25 57
Total 113 129 142 171 555 156 142 298
Transportation Volumes (MB/D)
Pipelines* 3,101 3,243 3,142 3,336 3,206 3,145 3,290 3,218 Terminals** 1,477 1,609 1,780 1,860 1,683 1,983 1,969 1,976
* Pipelines represent the sum of volumes transported through each separately tariffed pipeline segment, including our share of equity volumes in Yellowstone and Lake Charles pipelines.
** Terminals include Bayway and Ferndale crude oil rail rack volumes.
PSX Other Volumes
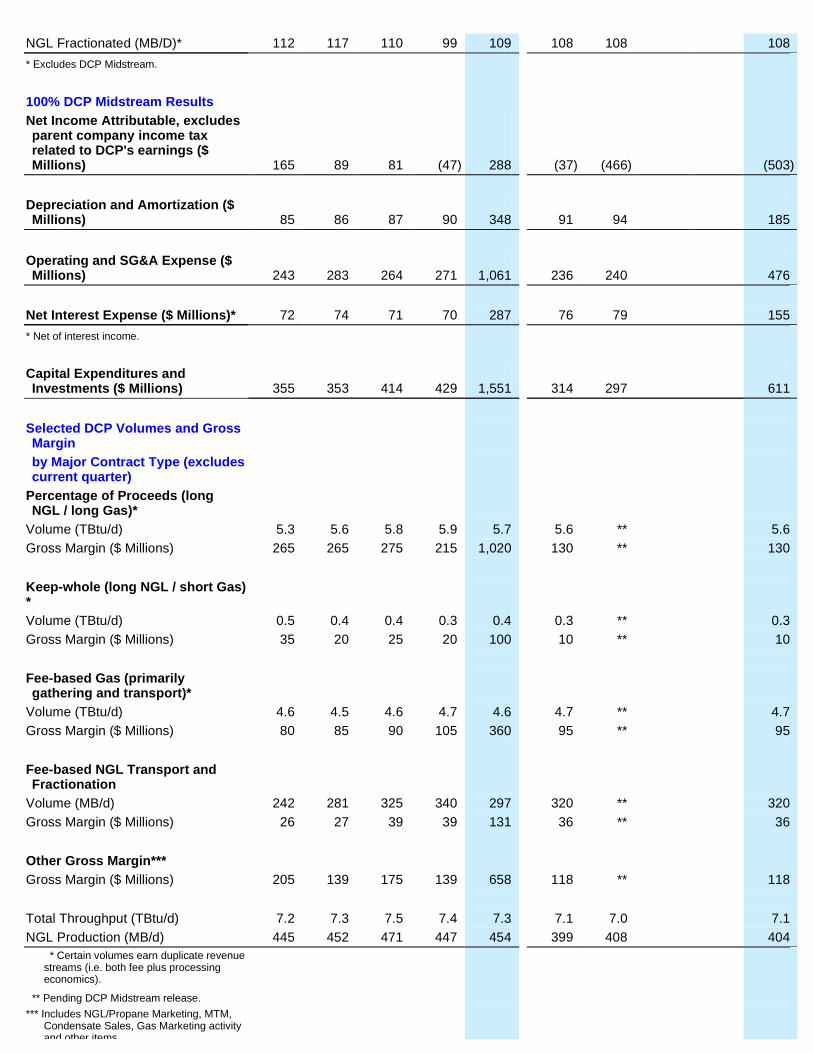
NGL Fractionated (MB/D)* 112 117 110 99 109 108 108 108 * Excludes DCP Midstream.
100% DCP Midstream Results
Net Income Attributable, excludes parent company income tax related to DCP's earnings ($ Millions) 165 89 81 (47 ) 288 (37 ) (466 ) (503 )
Depreciation and Amortization ($ Millions) 85 86 87 90 348 91 94 185
Operating and SG&A Expense ($ Millions) 243 283 264 271 1,061 236 240 476
Net Interest Expense ($ Millions)* 72 74 71 70 287 76 79 155 * Net of interest income.
Capital Expenditures and Investments ($ Millions) 355 353 414 429 1,551 314 297 611
Selected DCP Volumes and Gross Margin
by Major Contract Type (excludes current quarter)
Percentage of Proceeds (long NGL / long Gas)*
Volume (TBtu/d) 5.3 5.6 5.8 5.9 5.7 5.6 ** 5.6 Gross Margin ($ Millions) 265 265 275 215 1,020 130 ** 130
Keep-whole (long NGL / short Gas)*
Volume (TBtu/d) 0.5 0.4 0.4 0.3 0.4 0.3 ** 0.3 Gross Margin ($ Millions) 35 20 25 20 100 10 ** 10
Fee-based Gas (primarily gathering and transport)*
Volume (TBtu/d) 4.6 4.5 4.6 4.7 4.6 4.7 ** 4.7 Gross Margin ($ Millions) 80 85 90 105 360 95 ** 95
Fee-based NGL Transport and Fractionation
Volume (MB/d) 242 281 325 340 297 320 ** 320 Gross Margin ($ Millions) 26 27 39 39 131 36 ** 36
Other Gross Margin***
Gross Margin ($ Millions) 205 139 175 139 658 118 ** 118
Total Throughput (TBtu/d) 7.2 7.3 7.5 7.4 7.3 7.1 7.0 7.1 NGL Production (MB/d) 445 452 471 447 454 399 408 404
* Certain volumes earn duplicate revenue streams (i.e. both fee plus processing economics).
** Pending DCP Midstream release. *** Includes NGL/Propane Marketing, MTM,
Condensate Sales, Gas Marketing activity and other items.

Page 4
Weighted Average NGL Price*
DCP Midstream ($/BBL) 44.52 39.06 37.66 28.45 37.43 20.57 19.99 20.28 DCP Midstream ($/gal) 1.06 0.93 0.90 0.68 0.89 0.49 0.48 0.48 * Based on index prices from the Mont Belvieu
and Conway market hubs that are weighted by NGL component and location mix.
MLP Distributions ($ Millions)*
GP Distribution from PSXP to Phillips 66 1 1 2 4 8 6 9 15
LP Distribution from PSXP to Phillips 66 15 17 17 19 68 21 23 44
GP Distribution from DPM to DCP Midstream*** 26 28 29 31 114 31 ** 31
LP Distribution from DPM to DCP Midstream*** 18 18 19 19 74 19 ** 19
* Cash distributions declared attributable to general partner interest, common unit ownership and incentive distribution rights. These distributions are eliminated
in the respective sponsors consolidated financial statements.
** Pending DCP Midstream release.
*** Represents 100 percent of DCP Midstream's distributions from DPM.
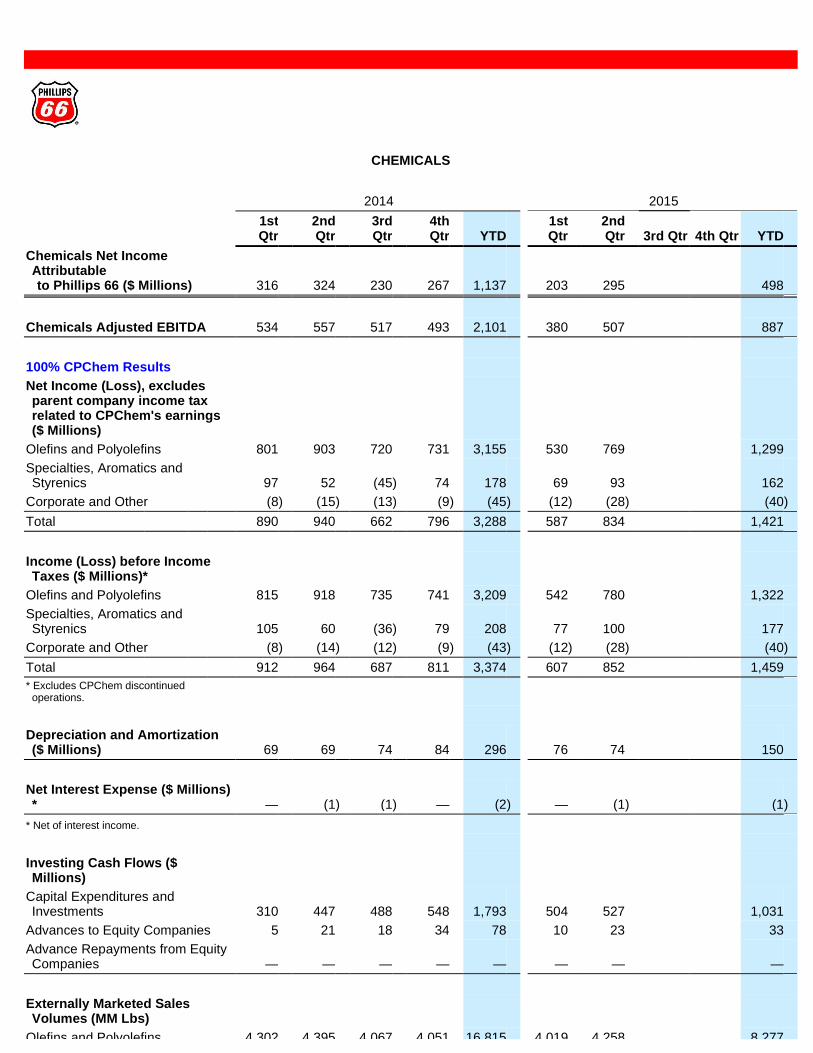
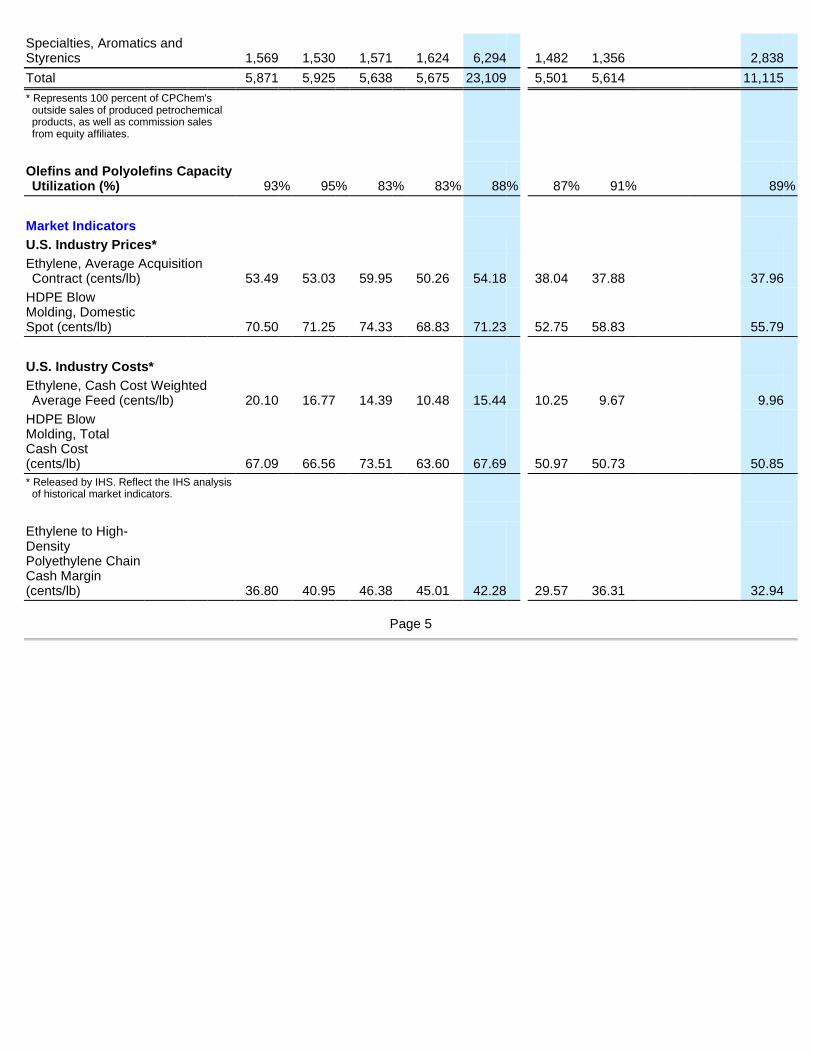
CHEMICALS
2014 2015
1st Qtr
2nd Qtr
3rd Qtr
4th Qtr YTD
1st Qtr
2nd Qtr 3rd Qtr 4th Qtr YTD
Chemicals Net Income Attributable
to Phillips 66 ($ Millions) 316 324 230 267 1,137 203 295 498
Chemicals Adjusted EBITDA 534 557 517 493 2,101 380 507 887
100% CPChem Results
Net Income (Loss), excludes parent company income tax related to CPChem's earnings ($ Millions)
Olefins and Polyolefins 801 903 720 731 3,155 530 769 1,299 Specialties, Aromatics and Styrenics 97 52 (45 ) 74 178 69 93 162
Corporate and Other (8 ) (15 ) (13 ) (9 ) (45 ) (12 ) (28 ) (40 )
Total 890 940 662 796 3,288 587 834 1,421
Income (Loss) before Income Taxes ($ Millions)*
Olefins and Polyolefins 815 918 735 741 3,209 542 780 1,322 Specialties, Aromatics and Styrenics 105 60 (36 ) 79 208 77 100 177
Corporate and Other (8 ) (14 ) (12 ) (9 ) (43 ) (12 ) (28 ) (40 )
Total 912 964 687 811 3,374 607 852 1,459 * Excludes CPChem discontinued
operations.
Depreciation and Amortization ($ Millions) 69 69 74 84 296 76 74 150
Net Interest Expense ($ Millions)* — (1 ) (1 ) — (2 ) — (1 ) (1 )
* Net of interest income.
Investing Cash Flows ($ Millions)
Capital Expenditures and Investments 310 447 488 548 1,793 504 527 1,031
Advances to Equity Companies 5 21 18 34 78 10 23 33 Advance Repayments from Equity Companies — — — — — — — —
Externally Marketed Sales Volumes (MM Lbs)
Olefins and Polyolefins 4,302 4,395 4,067 4,051 16,815 4,019 4,258 8,277
Page 5
Specialties, Aromatics and Styrenics 1,569 1,530 1,571 1,624 6,294 1,482 1,356 2,838 Total 5,871 5,925 5,638 5,675 23,109 5,501 5,614 11,115 * Represents 100 percent of CPChem's
outside sales of produced petrochemical products, as well as commission sales from equity affiliates.
Olefins and Polyolefins Capacity Utilization (%) 93 % 95 % 83 % 83 % 88 % 87 % 91 % 89 %
Market Indicators
U.S. Industry Prices* Ethylene, Average Acquisition Contract (cents/lb) 53.49 53.03 59.95 50.26 54.18 38.04 37.88 37.96
HDPE Blow Molding, Domestic Spot (cents/lb) 70.50 71.25 74.33 68.83 71.23 52.75 58.83 55.79
U.S. Industry Costs* Ethylene, Cash Cost Weighted Average Feed (cents/lb) 20.10 16.77 14.39 10.48 15.44 10.25 9.67 9.96
HDPE Blow Molding, Total Cash Cost (cents/lb) 67.09 66.56 73.51 63.60 67.69 50.97 50.73 50.85 * Released by IHS. Reflect the IHS analysis
of historical market indicators.
Ethylene to High-Density Polyethylene Chain Cash Margin (cents/lb) 36.80 40.95 46.38 45.01 42.28 29.57 36.31 32.94
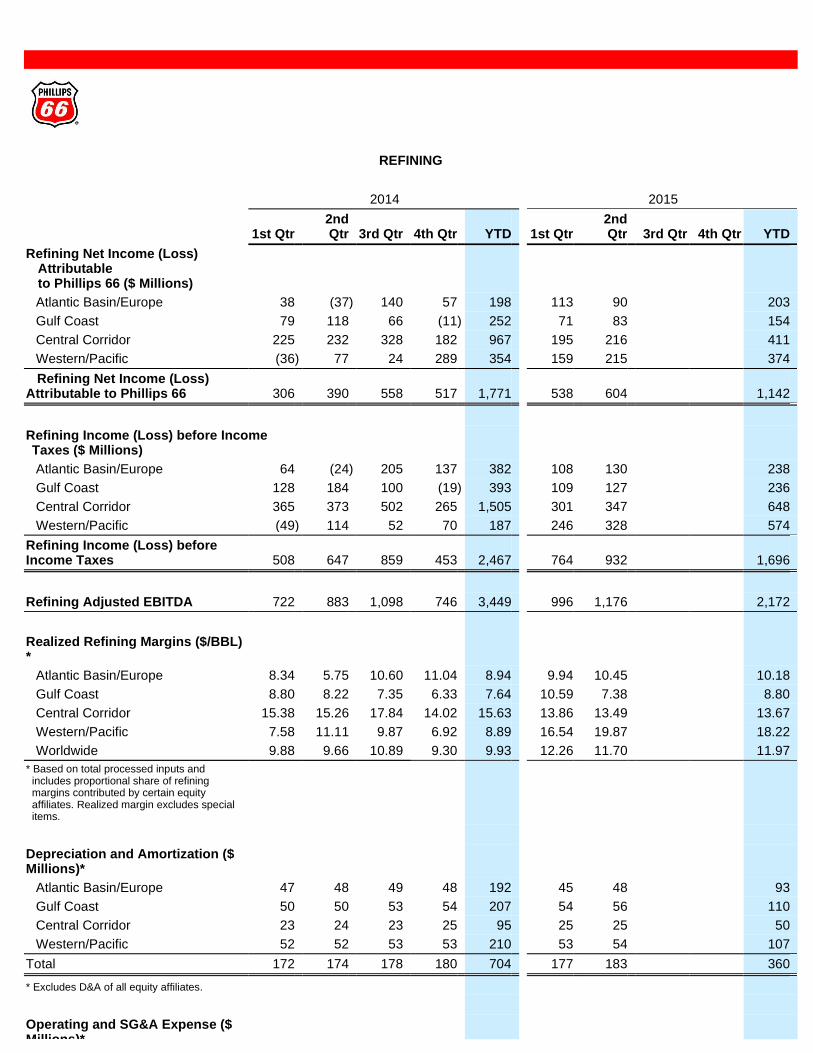
REFINING
2014 2015
1st Qtr 2nd Qtr 3rd Qtr 4th Qtr YTD 1st Qtr
2nd Qtr 3rd Qtr 4th Qtr YTD
Refining Net Income (Loss) Attributable to Phillips 66 ($ Millions)
Atlantic Basin/Europe 38 (37 ) 140 57 198 113 90 203 Gulf Coast 79 118 66 (11 ) 252 71 83 154 Central Corridor 225 232 328 182 967 195 216 411 Western/Pacific (36 ) 77 24 289 354 159 215 374
Refining Net Income (Loss) Attributable to Phillips 66 306 390 558 517 1,771 538 604 1,142
Refining Income (Loss) before Income Taxes ($ Millions)
Atlantic Basin/Europe 64 (24 ) 205 137 382 108 130 238 Gulf Coast 128 184 100 (19 ) 393 109 127 236 Central Corridor 365 373 502 265 1,505 301 347 648 Western/Pacific (49 ) 114 52 70 187 246 328 574
Refining Income (Loss) before Income Taxes 508 647 859 453 2,467 764 932 1,696
Refining Adjusted EBITDA 722 883 1,098 746 3,449 996 1,176 2,172
Realized Refining Margins ($/BBL)*
Atlantic Basin/Europe 8.34 5.75 10.60 11.04 8.94 9.94 10.45 10.18 Gulf Coast 8.80 8.22 7.35 6.33 7.64 10.59 7.38 8.80 Central Corridor 15.38 15.26 17.84 14.02 15.63 13.86 13.49 13.67 Western/Pacific 7.58 11.11 9.87 6.92 8.89 16.54 19.87 18.22 Worldwide 9.88 9.66 10.89 9.30 9.93 12.26 11.70 11.97
* Based on total processed inputs and includes proportional share of refining margins contributed by certain equity affiliates. Realized margin excludes special items.
Depreciation and Amortization ($ Millions)*
Atlantic Basin/Europe 47 48 49 48 192 45 48 93 Gulf Coast 50 50 53 54 207 54 56 110 Central Corridor 23 24 23 25 95 25 25 50 Western/Pacific 52 52 53 53 210 53 54 107
Total 172 174 178 180 704 177 183 360
* Excludes D&A of all equity affiliates.
Operating and SG&A Expense ($ Millions)*

Page 6
Atlantic Basin/Europe 289 259 254 266 1,068 261 287 548 Gulf Coast 365 335 366 401 1,467 386 299 685 Central Corridor 117 129 120 134 500 113 108 221 Western/Pacific 233 233 235 251 952 217 244 461
Total 1,004 956 975 1,052 3,987 977 938 1,915 * Excludes Operating and SG&A Expense of
all equity affiliates.
Turnaround Expense ($ Millions), included in
Operating and SG&A Expense*
Atlantic Basin/Europe 23 9 16 14 62 36 89 125 Gulf Coast 75 35 67 94 271 114 8 122 Central Corridor 5 4 3 6 18 6 1 7 Western/Pacific 22 13 15 23 73 17 46 63
Total 125 61 101 137 424 173 144 317 * Excludes Turnaround Expense of all equity
affiliates.
Taxes Other than Income Taxes, excluding Excise Taxes
($ Millions)
Atlantic Basin/Europe 18 15 15 15 63 16 14 30 Gulf Coast 24 21 20 18 83 23 18 41 Central Corridor 11 7 9 8 35 11 10 21 Western/Pacific 29 26 26 23 104 23 21 44
Total 82 69 70 64 285 73 63 136
Foreign Currency Gains (Losses) After-Tax
($ Millions) 14 (18 ) (6 ) 4 (6 ) (37 ) 3 (34 )
Refining—Equity Affiliate Information ($ Millions)
Equity in earnings of affiliates 150 173 55 (67 ) 311 97 140 237 Less: Share of equity affiliate gross margin included in Realized Refining Margin and other equity affiliate-related costs* (352 ) (364 ) (248 ) (172 ) (1,136 ) (266 ) (303 ) (569 )
Equity-affiliate-related expenses not included in Realized Refining Margins (202 ) (191 ) (193 ) (239 ) (825 ) (169 ) (163 ) (332 )
Regional Totals
Gulf Coast 11 13 3 1 28 11 3 14 Central Corridor (167 ) (156 ) (159 ) (195 ) (677 ) (152 ) (136 ) (288 ) Other Regions** (46 ) (48 ) (37 ) (45 ) (176 ) (28 ) (30 ) (58 )
Total (202 ) (191 ) (193 ) (239 ) (825 ) (169 ) (163 ) (332 )
* Other costs associated with equity affiliates which do not flow through equity earnings.
** Combined equity affiliates reported in Atlantic Basin/Europe and Western/Pacific.
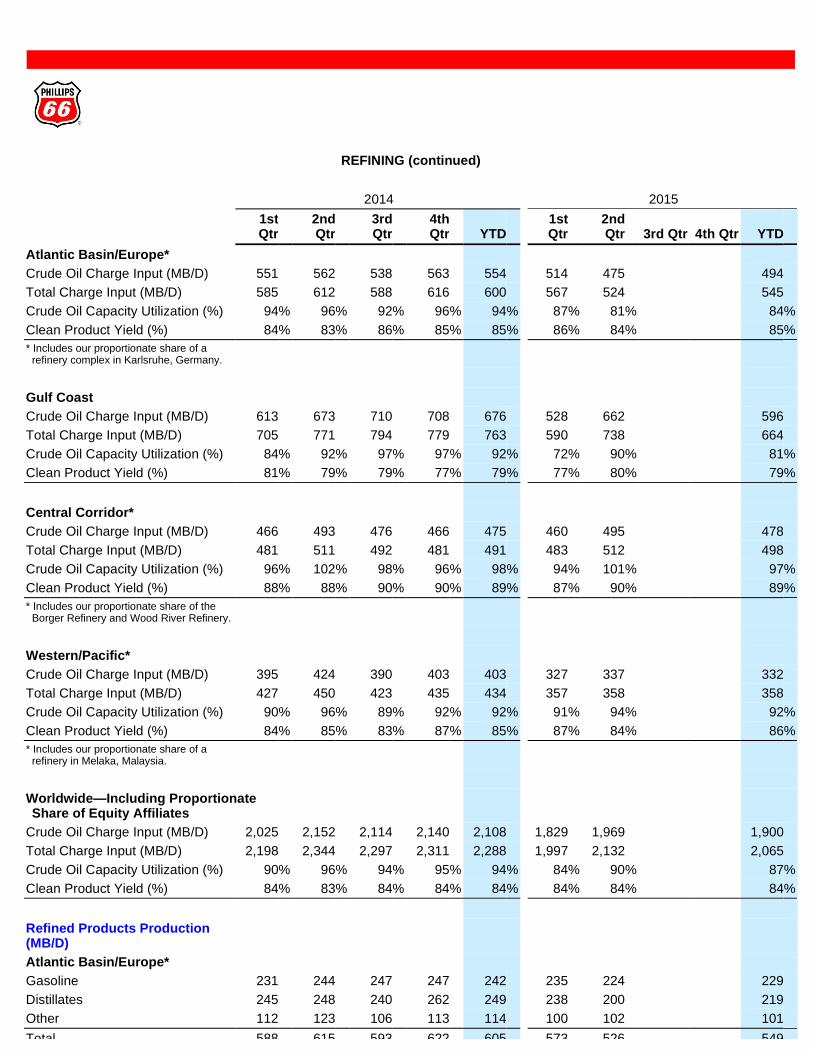
REFINING (continued)
2014 2015
1st Qtr
2nd Qtr
3rd Qtr
4th Qtr YTD
1st Qtr
2nd Qtr 3rd Qtr 4th Qtr YTD
Atlantic Basin/Europe*
Crude Oil Charge Input (MB/D) 551 562 538 563 554 514 475 494 Total Charge Input (MB/D) 585 612 588 616 600 567 524 545 Crude Oil Capacity Utilization (%) 94 % 96 % 92 % 96 % 94 % 87 % 81 % 84 % Clean Product Yield (%) 84 % 83 % 86 % 85 % 85 % 86 % 84 % 85 % * Includes our proportionate share of a
refinery complex in Karlsruhe, Germany.
Gulf Coast
Crude Oil Charge Input (MB/D) 613 673 710 708 676 528 662 596 Total Charge Input (MB/D) 705 771 794 779 763 590 738 664 Crude Oil Capacity Utilization (%) 84 % 92 % 97 % 97 % 92 % 72 % 90 % 81 % Clean Product Yield (%) 81 % 79 % 79 % 77 % 79 % 77 % 80 % 79 %
Central Corridor*
Crude Oil Charge Input (MB/D) 466 493 476 466 475 460 495 478 Total Charge Input (MB/D) 481 511 492 481 491 483 512 498 Crude Oil Capacity Utilization (%) 96 % 102 % 98 % 96 % 98 % 94 % 101 % 97 % Clean Product Yield (%) 88 % 88 % 90 % 90 % 89 % 87 % 90 % 89 % * Includes our proportionate share of the
Borger Refinery and Wood River Refinery.
Western/Pacific*
Crude Oil Charge Input (MB/D) 395 424 390 403 403 327 337 332 Total Charge Input (MB/D) 427 450 423 435 434 357 358 358 Crude Oil Capacity Utilization (%) 90 % 96 % 89 % 92 % 92 % 91 % 94 % 92 % Clean Product Yield (%) 84 % 85 % 83 % 87 % 85 % 87 % 84 % 86 % * Includes our proportionate share of a
refinery in Melaka, Malaysia.
Worldwide—Including Proportionate Share of Equity Affiliates
Crude Oil Charge Input (MB/D) 2,025 2,152 2,114 2,140 2,108 1,829 1,969 1,900 Total Charge Input (MB/D) 2,198 2,344 2,297 2,311 2,288 1,997 2,132 2,065 Crude Oil Capacity Utilization (%) 90 % 96 % 94 % 95 % 94 % 84 % 90 % 87 % Clean Product Yield (%) 84 % 83 % 84 % 84 % 84 % 84 % 84 % 84 %
Refined Products Production (MB/D)
Atlantic Basin/Europe*
Gasoline 231 244 247 247 242 235 224 229 Distillates 245 248 240 262 249 238 200 219 Other 112 123 106 113 114 100 102 101 Total 588 615 593 622 605 573 526 549
* Includes our proportionate share of a refinery complex in Karlsruhe, Germany.
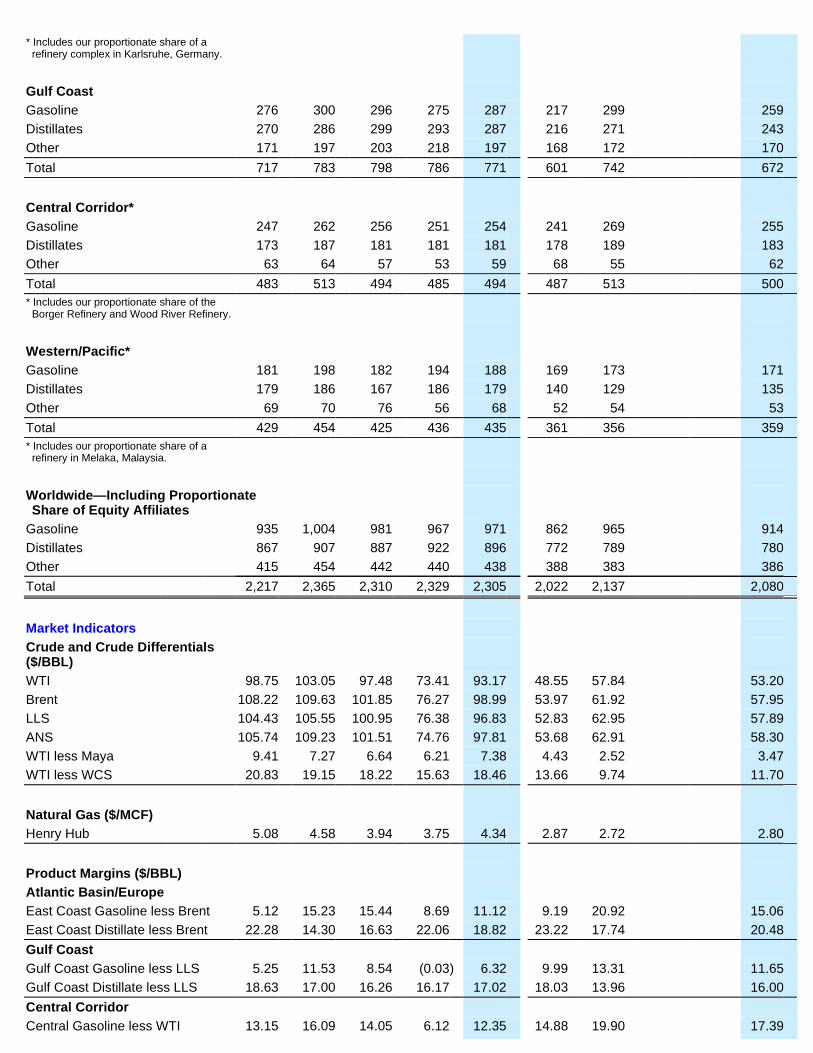
Gulf Coast
Gasoline 276 300 296 275 287 217 299 259 Distillates 270 286 299 293 287 216 271 243 Other 171 197 203 218 197 168 172 170 Total 717 783 798 786 771 601 742 672
Central Corridor*
Gasoline 247 262 256 251 254 241 269 255 Distillates 173 187 181 181 181 178 189 183 Other 63 64 57 53 59 68 55 62 Total 483 513 494 485 494 487 513 500 * Includes our proportionate share of the
Borger Refinery and Wood River Refinery.
Western/Pacific*
Gasoline 181 198 182 194 188 169 173 171 Distillates 179 186 167 186 179 140 129 135 Other 69 70 76 56 68 52 54 53 Total 429 454 425 436 435 361 356 359 * Includes our proportionate share of a
refinery in Melaka, Malaysia.
Worldwide—Including Proportionate Share of Equity Affiliates
Gasoline 935 1,004 981 967 971 862 965 914 Distillates 867 907 887 922 896 772 789 780 Other 415 454 442 440 438 388 383 386 Total 2,217 2,365 2,310 2,329 2,305 2,022 2,137 2,080
Market Indicators
Crude and Crude Differentials ($/BBL)
WTI 98.75 103.05 97.48 73.41 93.17 48.55 57.84 53.20 Brent 108.22 109.63 101.85 76.27 98.99 53.97 61.92 57.95 LLS 104.43 105.55 100.95 76.38 96.83 52.83 62.95 57.89 ANS 105.74 109.23 101.51 74.76 97.81 53.68 62.91 58.30 WTI less Maya 9.41 7.27 6.64 6.21 7.38 4.43 2.52 3.47 WTI less WCS 20.83 19.15 18.22 15.63 18.46 13.66 9.74 11.70
Natural Gas ($/MCF)
Henry Hub 5.08 4.58 3.94 3.75 4.34 2.87 2.72 2.80
Product Margins ($/BBL)
Atlantic Basin/Europe
East Coast Gasoline less Brent 5.12 15.23 15.44 8.69 11.12 9.19 20.92 15.06 East Coast Distillate less Brent 22.28 14.30 16.63 22.06 18.82 23.22 17.74 20.48 Gulf Coast
Gulf Coast Gasoline less LLS 5.25 11.53 8.54 (0.03 ) 6.32 9.99 13.31 11.65 Gulf Coast Distillate less LLS 18.63 17.00 16.26 16.17 17.02 18.03 13.96 16.00 Central Corridor
Central Gasoline less WTI 13.15 16.09 14.05 6.12 12.35 14.88 19.90 17.39
Page 7
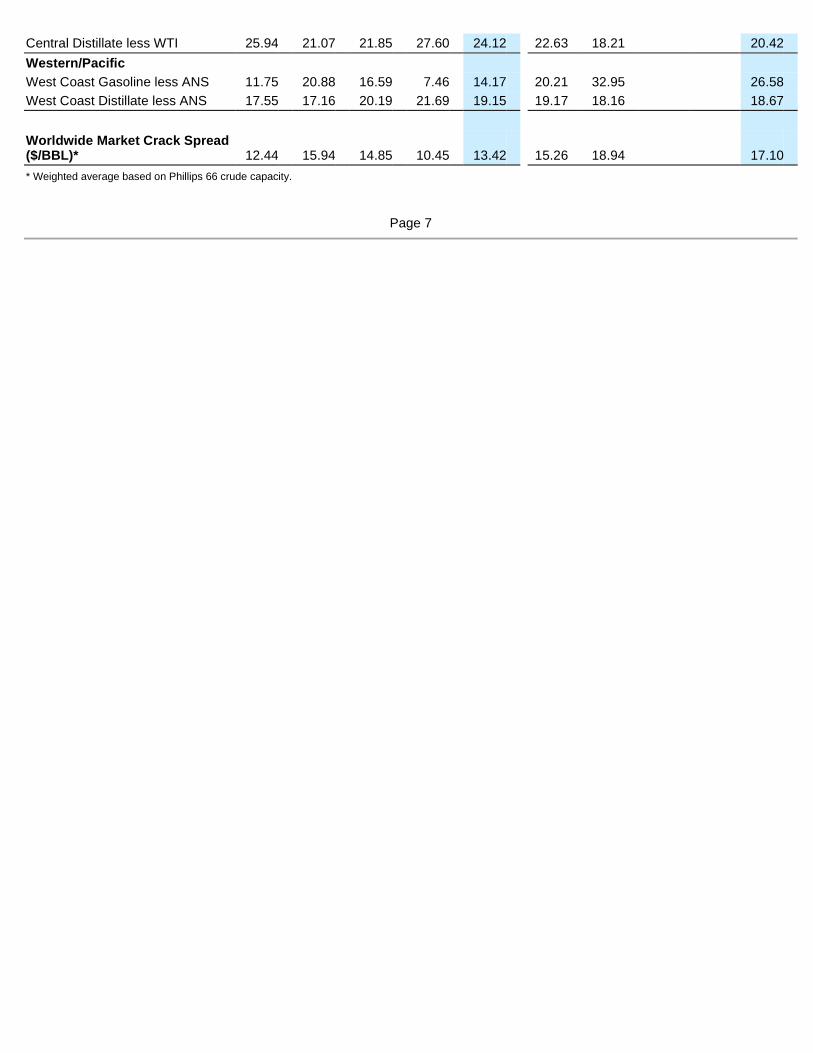
Central Distillate less WTI 25.94 21.07 21.85 27.60 24.12 22.63 18.21 20.42 Western/Pacific
West Coast Gasoline less ANS 11.75 20.88 16.59 7.46 14.17 20.21 32.95 26.58 West Coast Distillate less ANS 17.55 17.16 20.19 21.69 19.15 19.17 18.16 18.67
Worldwide Market Crack Spread ($/BBL)* 12.44 15.94 14.85 10.45 13.42 15.26 18.94 17.10 * Weighted average based on Phillips 66 crude capacity.
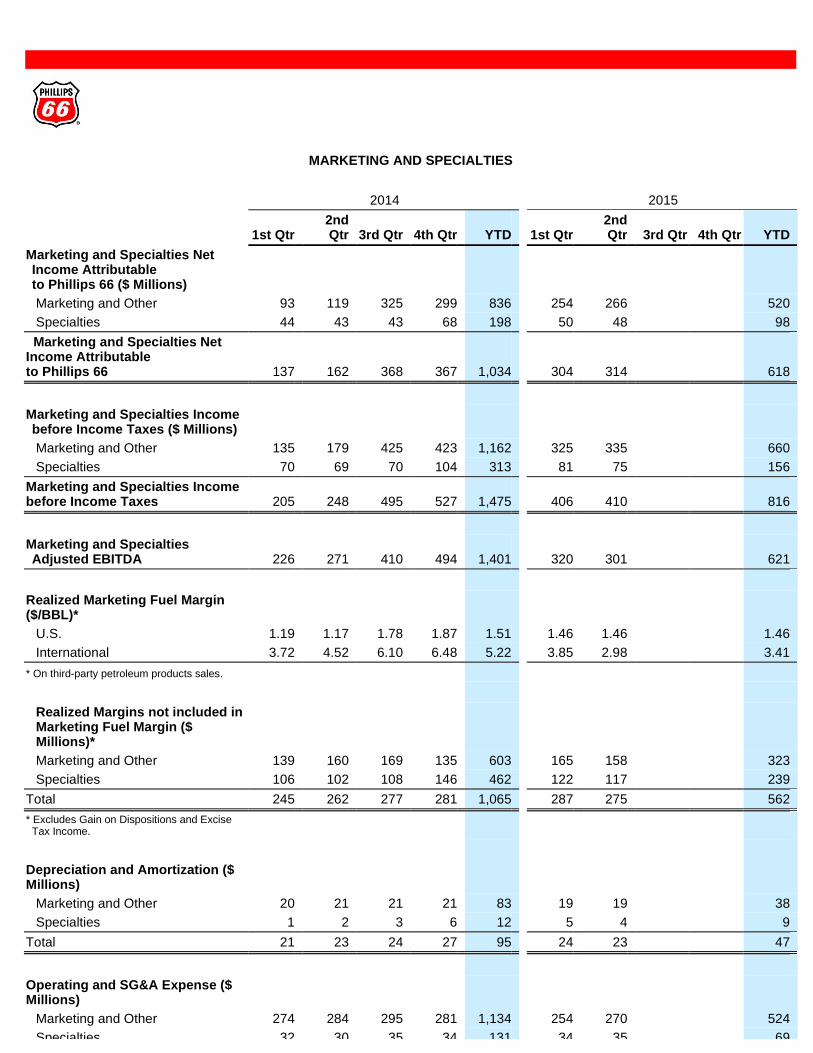
MARKETING AND SPECIALTIES
2014 2015
1st Qtr 2nd Qtr 3rd Qtr 4th Qtr YTD 1st Qtr
2nd Qtr 3rd Qtr 4th Qtr YTD
Marketing and Specialties Net Income Attributable to Phillips 66 ($ Millions)
Marketing and Other 93 119 325 299 836 254 266 520 Specialties 44 43 43 68 198 50 48 98
Marketing and Specialties Net Income Attributable to Phillips 66 137 162 368 367 1,034 304 314 618
Marketing and Specialties Income before Income Taxes ($ Millions)
Marketing and Other 135 179 425 423 1,162 325 335 660 Specialties 70 69 70 104 313 81 75 156
Marketing and Specialties Income before Income Taxes 205 248 495 527 1,475 406 410 816
Marketing and Specialties Adjusted EBITDA 226 271 410 494 1,401 320 301 621
Realized Marketing Fuel Margin ($/BBL)*
U.S. 1.19 1.17 1.78 1.87 1.51 1.46 1.46 1.46 International 3.72 4.52 6.10 6.48 5.22 3.85 2.98 3.41
* On third-party petroleum products sales.
Realized Margins not included in Marketing Fuel Margin ($ Millions)*
Marketing and Other 139 160 169 135 603 165 158 323 Specialties 106 102 108 146 462 122 117 239
Total 245 262 277 281 1,065 287 275 562 * Excludes Gain on Dispositions and Excise
Tax Income.
Depreciation and Amortization ($ Millions)
Marketing and Other 20 21 21 21 83 19 19 38 Specialties 1 2 3 6 12 5 4 9
Total 21 23 24 27 95 24 23 47
Operating and SG&A Expense ($ Millions)
Marketing and Other 274 284 295 281 1,134 254 270 524 Specialties 32 30 35 34 131 34 35 69
Page 8
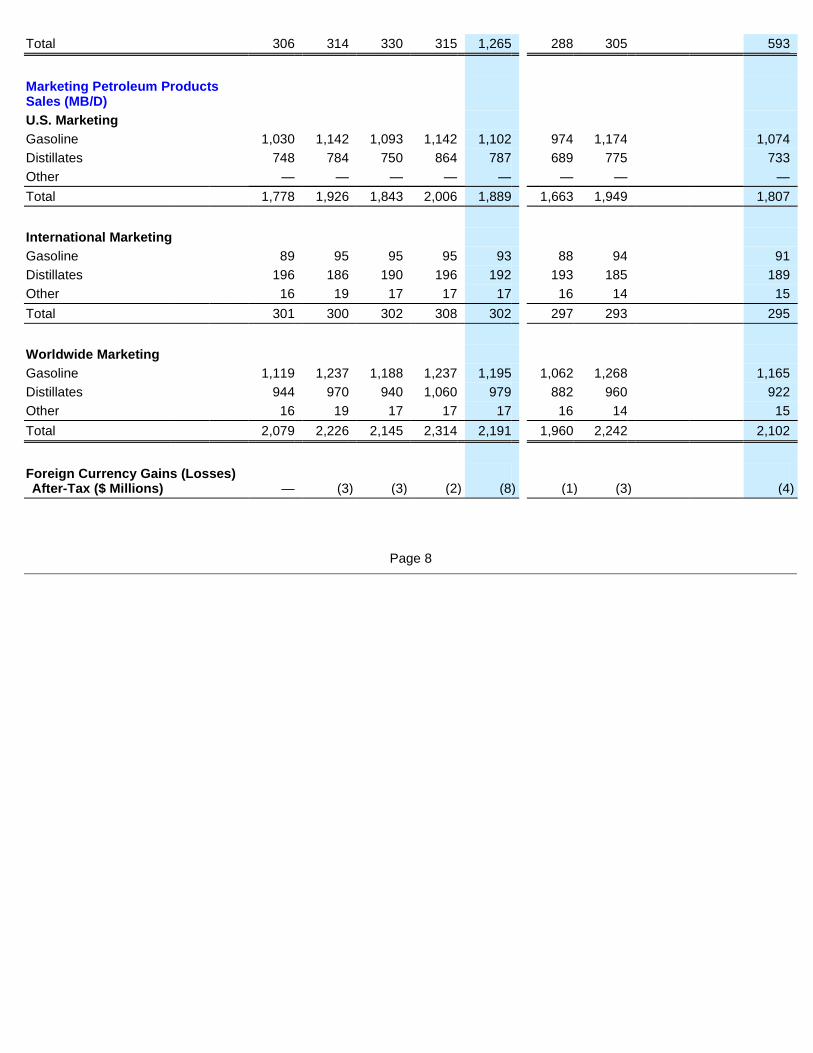
Total 306 314 330 315 1,265 288 305 593
Marketing Petroleum Products Sales (MB/D)
U.S. Marketing
Gasoline 1,030 1,142 1,093 1,142 1,102 974 1,174 1,074 Distillates 748 784 750 864 787 689 775 733 Other — — — — — — — — Total 1,778 1,926 1,843 2,006 1,889 1,663 1,949 1,807
International Marketing
Gasoline 89 95 95 95 93 88 94 91 Distillates 196 186 190 196 192 193 185 189 Other 16 19 17 17 17 16 14 15 Total 301 300 302 308 302 297 293 295
Worldwide Marketing
Gasoline 1,119 1,237 1,188 1,237 1,195 1,062 1,268 1,165 Distillates 944 970 940 1,060 979 882 960 922 Other 16 19 17 17 17 16 14 15 Total 2,079 2,226 2,145 2,314 2,191 1,960 2,242 2,102
Foreign Currency Gains (Losses) After-Tax ($ Millions) — (3 ) (3 ) (2 ) (8 ) (1 ) (3 ) (4 )
Page 9
CORPORATE AND OTHER
2014 2015
1st Qtr
2nd Qtr
3rd Qtr
4th Qtr YTD
1st Qtr
2nd Qtr 3rd Qtr 4th Qtr YTD
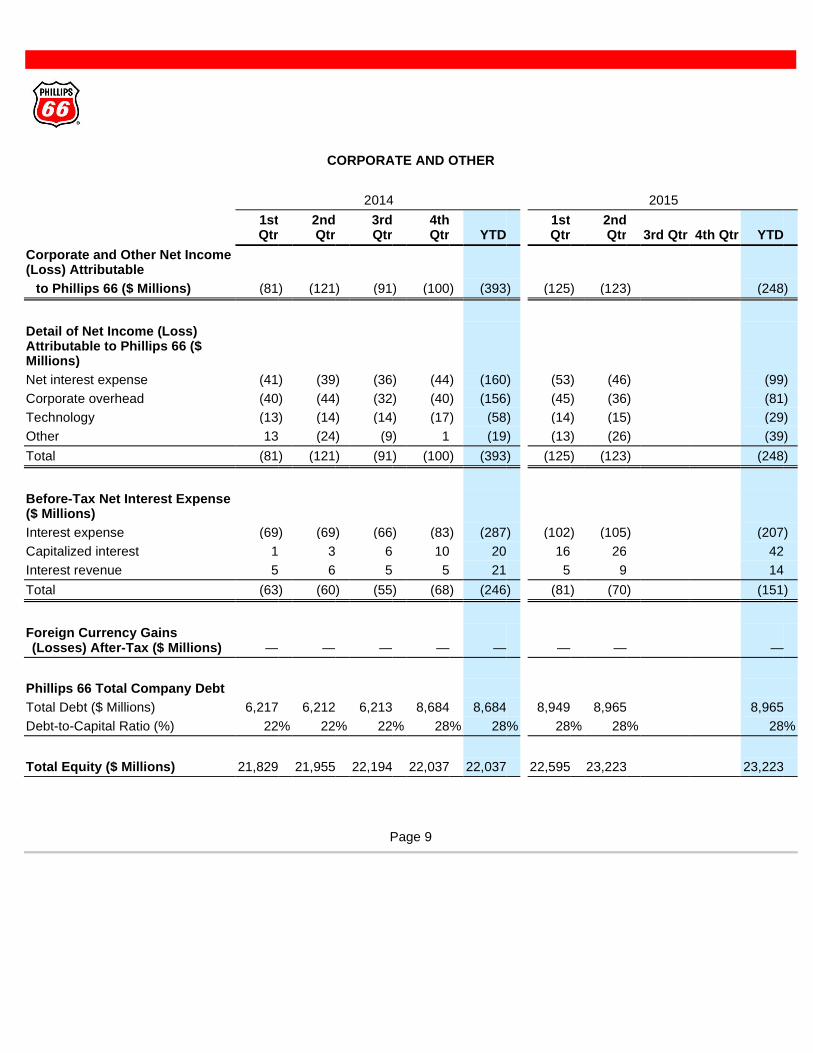
Corporate and Other Net Income (Loss) Attributable
to Phillips 66 ($ Millions) (81 ) (121 ) (91 ) (100 ) (393 ) (125 ) (123 ) (248 )
Detail of Net Income (Loss) Attributable to Phillips 66 ($ Millions)
Net interest expense (41 ) (39 ) (36 ) (44 ) (160 ) (53 ) (46 ) (99 ) Corporate overhead (40 ) (44 ) (32 ) (40 ) (156 ) (45 ) (36 ) (81 ) Technology (13 ) (14 ) (14 ) (17 ) (58 ) (14 ) (15 ) (29 ) Other 13 (24 ) (9 ) 1 (19 ) (13 ) (26 ) (39 )
Total (81 ) (121 ) (91 ) (100 ) (393 ) (125 ) (123 ) (248 )
Before-Tax Net Interest Expense ($ Millions)
Interest expense (69 ) (69 ) (66 ) (83 ) (287 ) (102 ) (105 ) (207 ) Capitalized interest 1 3 6 10 20 16 26 42 Interest revenue 5 6 5 5 21 5 9 14 Total (63 ) (60 ) (55 ) (68 ) (246 ) (81 ) (70 ) (151 )
Foreign Currency Gains (Losses) After-Tax ($ Millions) — — — — — — — —
Phillips 66 Total Company Debt
Total Debt ($ Millions) 6,217 6,212 6,213 8,684 8,684 8,949 8,965 8,965 Debt-to-Capital Ratio (%) 22 % 22 % 22 % 28 % 28 % 28 % 28 % 28 %
Total Equity ($ Millions) 21,829 21,955 22,194 22,037 22,037 22,595 23,223 23,223

NON-GAAP FINANCIAL MEASURES RECONCILIATION
Millions of Dollars
2014 2015
1st Qtr 2nd Qtr 3rd Qtr 4th Qtr YTD 1st Qtr
2nd Qtr 3rd Qtr 4th Qtr YTD
Reconciliation of Midstream Net Income to Adjusted EBITDA
Midstream net income 194 117 124 107 542 78 (62 ) 16 Plus:
Provision for income taxes 108 63 70 68 309 38 (37 ) 1 Depreciation and amortization 19 21 24 27 91 26 27 53
Midstream EBITDA 321 201 218 202 942 142 (72 ) 70
Adjustments (pretax):
EBITDA attributable to Phillips 66 noncontrolling interests (8 ) (12 ) (13 ) (12 ) (45 ) (16 ) (17 ) (33 )
Proportional share of selected equity affiliates income taxes 2 — 2 (1 ) 3 1 (2 ) (1 )
Proportional share of selected equity affiliates net interest 30 31 29 28 118 32 33 65
Proportional share of selected equity affiliates depreciation and amortization 39 36 37 38 150 40 41 81
Lower-of-cost-or-market inventory adjustments — — — 2 2 — — — Impairments by equity affiliates — — — — — — 194 194
Midstream Adjusted EBITDA* 384 256 273 257 1,170 199 177 376 * Proportional share of selected equity
affiliates is net of noncontrolling interests.
Reconciliation of Chemicals Net Income to Adjusted EBITDA
Chemicals net income 316 324 230 267 1,137 203 295 498 Plus:
Provision for income taxes 126 142 98 129 495 88 121 209 Chemicals EBITDA 442 466 328 396 1,632 291 416 707
Adjustments (pretax):
Proportional share of selected equity affiliates income taxes 27 28 35 21 111 22 25 47
Proportional share of selected equity affiliates net interest 3 1 2 3 9 2 1 3
Proportional share of selected equity affiliates depreciation and amortization 62 62 64 70 258 65 65 130
Impairments by equity affiliates — — 88 — 88 — — — Lower-of-cost-or-market inventory adjustments — — — 3 3 — — —
Chemicals Adjusted EBITDA 534 557 517 493 2,101 380 507 887
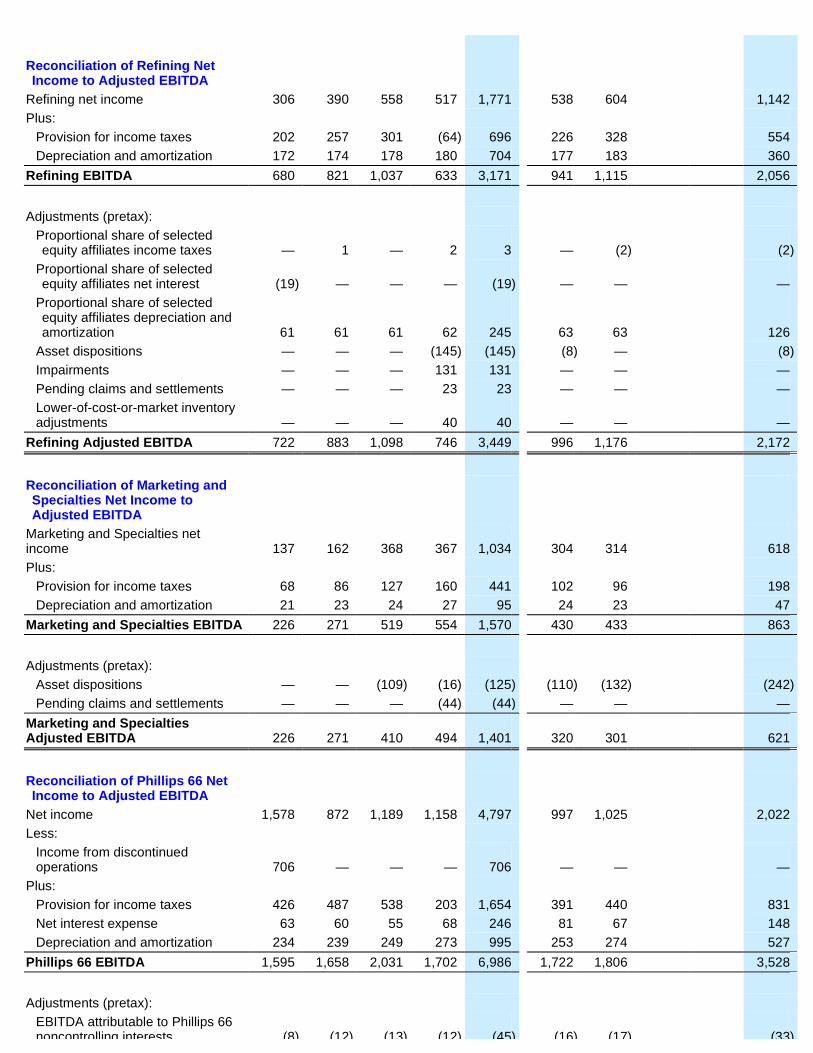
Reconciliation of Refining Net Income to Adjusted EBITDA
Refining net income 306 390 558 517 1,771 538 604 1,142 Plus:
Provision for income taxes 202 257 301 (64 ) 696 226 328 554 Depreciation and amortization 172 174 178 180 704 177 183 360
Refining EBITDA 680 821 1,037 633 3,171 941 1,115 2,056
Adjustments (pretax):
Proportional share of selected equity affiliates income taxes — 1 — 2 3 — (2 ) (2 )
Proportional share of selected equity affiliates net interest (19 ) — — — (19 ) — — —
Proportional share of selected equity affiliates depreciation and amortization 61 61 61 62 245 63 63 126
Asset dispositions — — — (145 ) (145 ) (8 ) — (8 ) Impairments — — — 131 131 — — — Pending claims and settlements — — — 23 23 — — — Lower-of-cost-or-market inventory adjustments — — — 40 40 — — —
Refining Adjusted EBITDA 722 883 1,098 746 3,449 996 1,176 2,172
Reconciliation of Marketing and Specialties Net Income to Adjusted EBITDA
Marketing and Specialties net income 137 162 368 367 1,034 304 314 618 Plus:
Provision for income taxes 68 86 127 160 441 102 96 198 Depreciation and amortization 21 23 24 27 95 24 23 47
Marketing and Specialties EBITDA 226 271 519 554 1,570 430 433 863
Adjustments (pretax):
Asset dispositions — — (109 ) (16 ) (125 ) (110 ) (132 ) (242 ) Pending claims and settlements — — — (44 ) (44 ) — — —
Marketing and Specialties Adjusted EBITDA 226 271 410 494 1,401 320 301 621
Reconciliation of Phillips 66 Net Income to Adjusted EBITDA
Net income 1,578 872 1,189 1,158 4,797 997 1,025 2,022 Less:
Income from discontinued operations 706 — — — 706 — — —
Plus:
Provision for income taxes 426 487 538 203 1,654 391 440 831 Net interest expense 63 60 55 68 246 81 67 148 Depreciation and amortization 234 239 249 273 995 253 274 527
Phillips 66 EBITDA 1,595 1,658 2,031 1,702 6,986 1,722 1,806 3,528
Adjustments (pretax):
EBITDA attributable to Phillips 66 noncontrolling interests (8 ) (12 ) (13 ) (12 ) (45 ) (16 ) (17 ) (33 )

Page 10
Proportional share of selected equity affiliates income taxes 29 29 37 22 117 23 21 44
Proportional share of selected equity affiliates net interest 14 32 31 31 108 34 34 68
Proportional share of selected equity affiliates depreciation and amortization 162 159 162 170 653 168 169 337
Asset dispositions — — (109 ) (161 ) (270 ) (118 ) (132 ) (250 ) Impairments — — — 131 131 — — — Impairments by equity affiliates — — 88 — 88 — 194 194 Pending claims and settlements — — — (21 ) (21 ) — (5 ) (5 ) Lower-of-cost-or-market inventory adjustments — — — 45 45 — — —
Phillips 66 Adjusted EBITDA 1,792 1,866 2,227 1,907 7,792 1,813 2,070 3,883
Use of Non-GAAP Financial Information —This earnings release supplemental data includes the terms EBITDA and adjusted EBITDA. These are non-GAAP financial measures. EBITDA and adjusted EBITDA are included to help facilitate comparisons of operating performance across periods, to help facilitate comparisons with other companies in our industry and to help facilitate determination of enterprise value. The GAAP measure most directly comparable to EBITDA and adjusted EBITDA is net income.


![[Bob Phillips] Phillips' Book of Great Thoughts (Book4You)](https://img.pdfslide.us/doc/110x75/563db77e550346aa9a8b927f/bob-phillips-phillips-book-of-great-thoughts-book4you.jpg)