Embed Size (px)
Citation preview
Summary and Signature Page 2
Specific Comments 3
Site Information 4
Equipment Information 4
Table Position Accuracy 4
Magnetic Field Homogeneity 4
Slice Thickness Accuracy 4
Slice Crosstalk 5
Soft Copy Displays 6
RF Coil Performance Evaluation
Coil Inventory List 7
Body & Spine - Extra Large 8
Body & Spine - Large 9
Body & Spine - Medium 10
Body & Spine - Small 11
Extremity 12
Head 13
Multi Purpose - Extra Small 14
Multi Purpose - Large 15
Multi Purpose - Medium 16
Multi Purpose - Small 17
Neck - Large 18
Shoulder 20
22
25
26
35
Philips Site
Appendix C: ACR Phantom Analysis
Appendix D: Explanation of RF Coil Test Format
16-Jan-08
Table of Contents
Appendix A: Magnet Homgeneity Map
Appendix B: Slice Thickness / Profiles / RF Crosstalk
Philips OpenviewYearly Performance Evaluation

Site Name: Philips Site MRAP #Address: Survey Date:
City, State, Zip Report Date:MRI Mfg: Model: Field:
MRI Scientist: Moriel NessAiver, Ph.D. Signature:
Pass
Fail
*
N/A
1. Magnetic field homogeneity:2. Slice position accuracy:3. Table positioning reproducibility:4. Slice thickness accuracy:5. RF coils' performance:
a. Volume QD Coilsb. Phase Array Coilsc. Surface Coils
6. Inter-slice RF interference (Crosstalk):7. Soft Copy Display
Pass
Fail
*
N/A
1. Set up and positioning accuracy: (daily)2. Center frequency: (daily)3. Transmitter attenuation or gain: (daily)4. Geometric accuracy measurments: (daily)5. Spatial resolution measurements: (daily)6. Low contrast detectability: (daily)7. Head Coil SNR (daily)8. Body Coil SNR (weekly)9. Fast Spin Echo (FSE/TSE) ghosting levels: (daily)
10. Film quality control: (weekly)11. Visual checklist: (weekly)
*See comments page for description of any failures.
MRI Equipment Evaluation Summary & Signature Page - Openview
1/16/08
1/22/08
0.23
Evaluation of Site's Technologist QC Program
Equipment Evaluation Tests
Philips Openview
Philips Site Openview 2

1.
2.
3.
4.
5.
6.
7.
8.
9.
10.
11.
12.
13.
14.
15.
16.
The Extremity coil is 50% better than the other site.
The Body&Spine XL coil has VERY poor SNR… I don't have any previous results to compare it to.
The Body&Spine L coil also has VERY poor SNR, only 1/8th the SNR of the other site.
The Body&Spine M has comparable SNR.
The Body&Spine S coil looks fine.
Specific Comments and Recommendations
Magnet homogeneity looks good.
Note: With the following comments, I shall be comparing the measured SNR values of all of your coils to similar
coils at a second Picker Outlook facility.
NOTE: Please be sure to read appendix D for an explanation of the new format of this document.
The positioning laser is miscalibrated by 8 mm.
Please begin daily QA and weekly film QA as per our discussion.
There is a severe problem with image ghosting - particularly with the ACR T2 sequence. See appendix C.
The Multi-Purpose Large coil is 30% lower than the other site.
The head coil is 30% lower than the other site. - See appendix C for full head coil & ACR phantom analysis.
The Multi-Purpose Medium coil is 20% lower than the other site.
The Multi-Purpose Small coil is almost identical to the Medium coil… it should have been noticeably better.
The Multi-Purpose Extra small coil looks OK - nothing to compare it to.
The Neck coil looks adequate - nothing to compare it to.
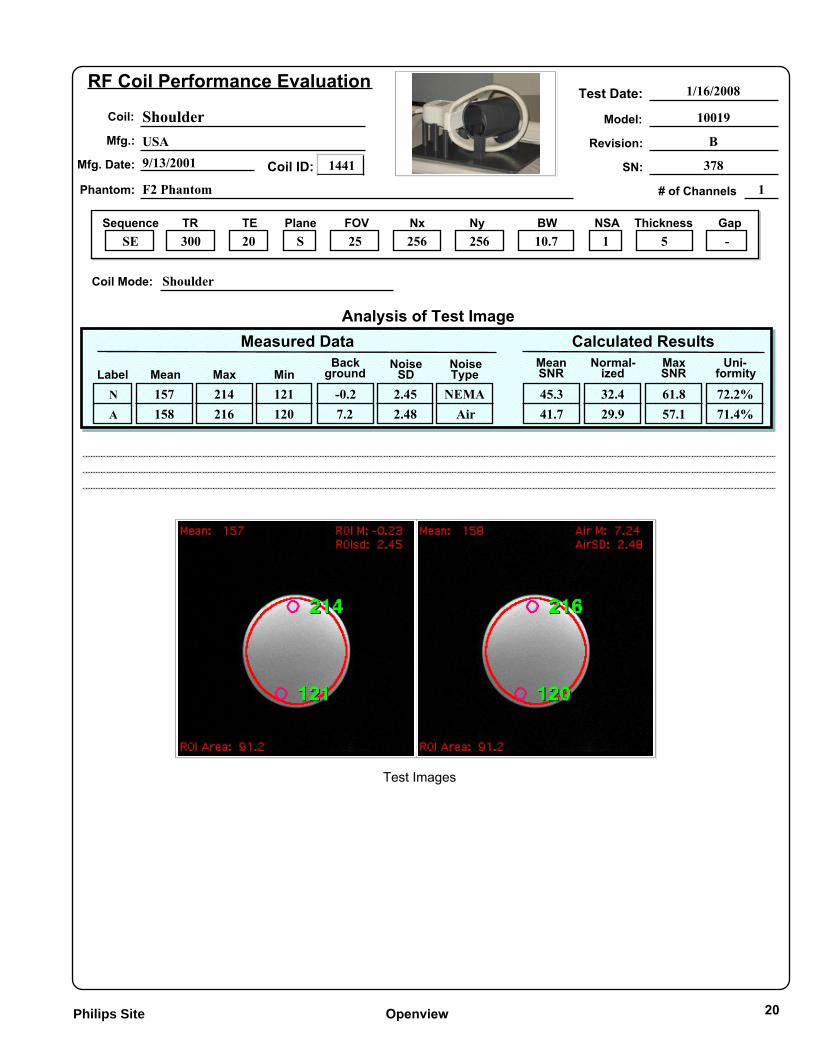
The Shoulder coil looks adequate - nothing to compare it to.
Philips Site Openview 3

Site Name: Philips Site
Equipment InformationMRI Manufacturer: Model: SN: Software:
Camera Manufacturer: Model: SN: Software:PACS Manufacturer: Model: SN: Software:
ACR Phantom Number used:
1. Table Positioning Reproducibility:Table motion out/in:
Measured Phantom Center
2. Magnetic Field Homogeneity See appendix A for field plots.
Last Year CF: This Year CF: CF Change:GRE TR: 500, TE: 10 & 15 Flip Angle: 45, FOV: 40
10 mm skip 10 mm, BW: 10.4KHz, 256x128, 2nex
Axial: Comments:
Coronal:Sagittal:
3. Slice Thickness AccuracyFOV: 250mm Matrix: 256x256 (Slice #1 from ACR Phantom) All values in mm
NSA
11128
Comments:
15 cm 20 cm 25 cm
Comment: Table reproducibility is not applicable with this magnet. However, the laser calibration is off by
512.4%
N/A
5.13.3 5.1 9.2
55
SE (20/80) 2000 20 90
Calc
80 90 5.27
TE Flip
5.62
SE (Site T1) 500 90
SE (ACR) 500 20 90
290
Sequence TR Target
3.6 5.1 8.6 This homogeneity is adequate for a low field open magnet.2.2 3.3
0.2%
Pass
% Error
roughly 8 mm.
NA
PASS
9200000
5.01
Contact
-8
Phone
IsoCenter Out/In
Philips Openvieww
TitleOwner
Out/In Out/In
5065
Agfa
- Openview
MRI Equipment Performance Evaluation Data Form
4022 Via 2.1.4
Chief Tech.
SE (20/80) 2000 80
FSE(8) 3000 5 5.4%
5.15-2.4%54.883.0%
Philips Site Openview 4

4. Slice Crosstalk (RF interference)
Sequence Type TR TE
FOV (cm2)
Matrix NSA Thickness # of slices Slice Measured
SE 500 20 25 256x256 2 5 11 6
Skip ACR T1
-1 3.921 4.842 4.853 4.935 4.9210 4.89
The following data were obtained using the ACR phantom slice thickness wedges to measure the slice profile of a
T1 weighted sequences when the slice gap varies from 200% down to -20% (overlapping) As the slices get closer
together it is expected that the edges of the slices will overlap causing a deterioration of the slice profile. The data shown
All of the slice profiles can be seen in Appendix B.
below shows little interaction down to a 20% gap. I acquired an image with 0% gap (contiguous) but it became
corrupted. The overlapping slice shows dramatic degredation of the slice profile (as expected.)
T1 Weighted Slice Thicknesses
3.75
4
4.25
4.5
4.75
5
-1 0 1 2 3 4 5 6 7 8 9 10Slice Gap (mm)
Thic
knes
s (m
m)
ACR T1
Philips Site Openview 5
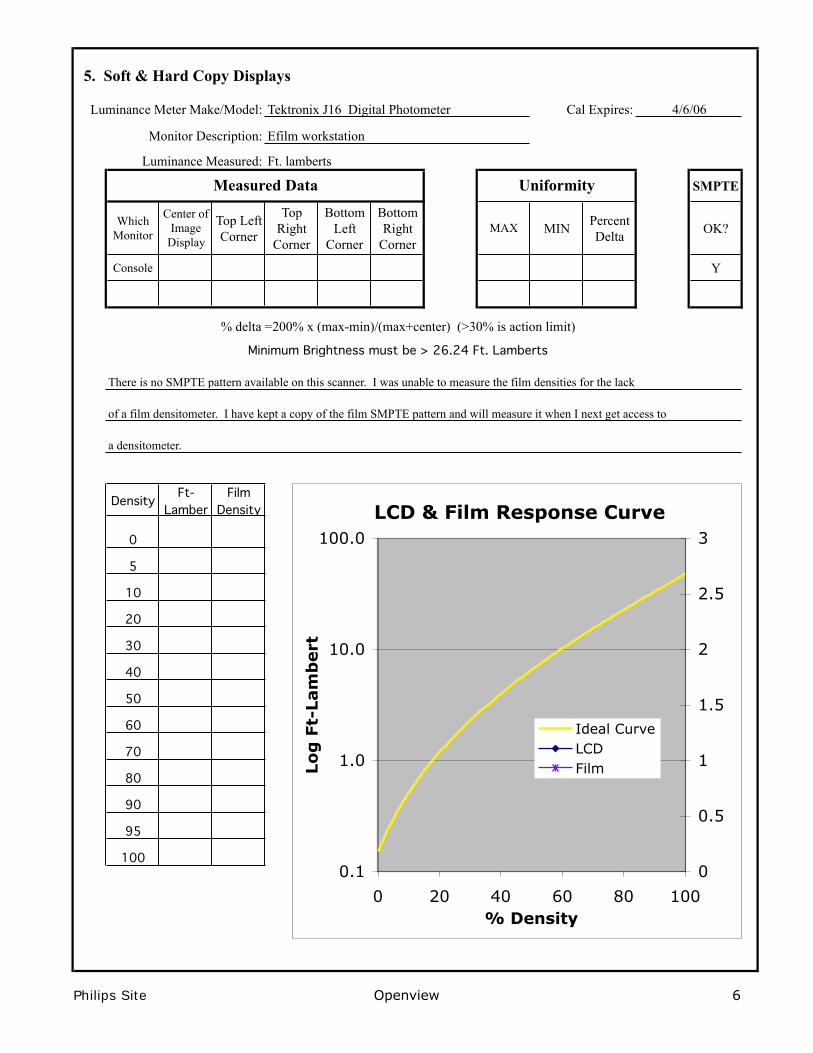
5. Soft & Hard Copy Displays
Luminance Meter Make/Model: Tektronix J16 Digital Photometer Cal Expires:
Monitor Description: Efilm workstation
Luminance Measured: Ft. lamberts
SMPTE
Which Monitor
Center of Image
Display
Top Left Corner
Top Right
Corner
Bottom Left
Corner
Bottom Right
CornerMAX MIN Percent
Delta OK?
Console Y
Density Ft-Lamber
Film Density
0
5
10
20
30
40
50
60
70
80
90
95
100
There is no SMPTE pattern available on this scanner. I was unable to measure the film densities for the lack
of a film densitometer. I have kept a copy of the film SMPTE pattern and will measure it when I next get access to
a densitometer.
Minimum Brightness must be > 26.24 Ft. Lamberts
Measured Data
4/6/06
% delta =200% x (max-min)/(max+center) (>30% is action limit)
Uniformity
LCD & Film Response Curve
0.1
1.0
10.0
100.0
0 20 40 60 80 100% Density
Lo
g F
t-Lam
bert
0
0.5
1
1.5
2
2.5
3
Ideal CurveLCDFilm
Philips Site Openview 6

Site Name
ACR Magnet #
Coil DescriptionActive Model Rev. Mfg. Date SN Channels
Philips Site
Nickname Openview
Coil and Other Hardware Inventory List
Manufacturer
Body & Spine - Extra Lge. Marconi 955971 D Aug, 2000 76 1
Body & Spine - Large Marconi 955969 E Jun, 2006 340 1
Body & Spine - Medium Marconi 955968 B May, 2002 285 1
Body & Spine - Small Marconi 955982 B Dec, 2000 31 1
Extremity Marconi 95966 B Jan, 2002 195 1
Head Marconi 955965 B Nov, 1999 119 1
Multi Purpose - Extra Small Marconi 953541 D Dec, 2000 51 1
Multi Purpose - Large Marconi 953544 D Jan, 2001 132 1
Multi Purpose - Medium Marconi 953543 D Dec, 2000 145 1
Multi Purpose - Small Marconi 953542 D Dec, 2000 111 1
Neck - Large MRI Tech. 100202 A Nov, 2003 377 1
Shoulder USA 10019 B Sep, 2001 378 1
11

Test Date: 1/16/2008RF Coil Performance Evaluation
Coil: Body & Spine - Extra Lge.Mfg.: Marconi
Mfg. Date: 8/1/2000
Model: 955971
Revision: D
SN: 76
Phantom: 32 cm sphere
SequenceSE
TR300
TE20
PlaneT
FOV60
Nx256
Ny256
NSA1
BW10.7
Thickness5
Gap-
Coil Mode: Body&Spine_XL
The SNR of this coil is VERY poor. I don’t have any basis for comparison with any other site.
Analysis of Test Image
Coil ID: 1451
Test Images
# of Channels 1
Mean150150
Max188187
Min133129
Background
0.537.5
NoiseSD
15.8215.07
Measured Data Calculated ResultsMeanSNR
6.76.5
MaxSNR
8.48.1
Normal-ized
0.80.8
Uni-formity
82.9%81.6%
NoiseType
NEMAAir
LabelN
A
Philips Site Openview 8

Test Date: 1/16/2008RF Coil Performance Evaluation
Coil: Body & Spine - LargeMfg.: Marconi
Mfg. Date: 6/1/2006
Model: 955969
Revision: E
SN: 340
Phantom: 32 cm sphere
SequenceSE
TR300
TE20
PlaneT
FOV60
Nx256
Ny256
NSA1
BW10.7
Thickness5
Gap-
Coil Mode: Body&Spine_L
The SNR of this coil is VERY poor. It is much worse than a similar that had the Large Flex coil - That site had a normalize SNRof 8.0.
Analysis of Test Image
Coil ID: 1449
Test Images
# of Channels 1
Mean120119
Max191190
Min9998
Background
0.527.3
NoiseSD
9.7210.05
Measured Data Calculated ResultsMeanSNR
8.77.8
MaxSNR
13.912.4
Normal-ized
1.11.0
Uni-formity
68.3%68.1%
NoiseType
NEMAAir
LabelN
A
Philips Site Openview 9
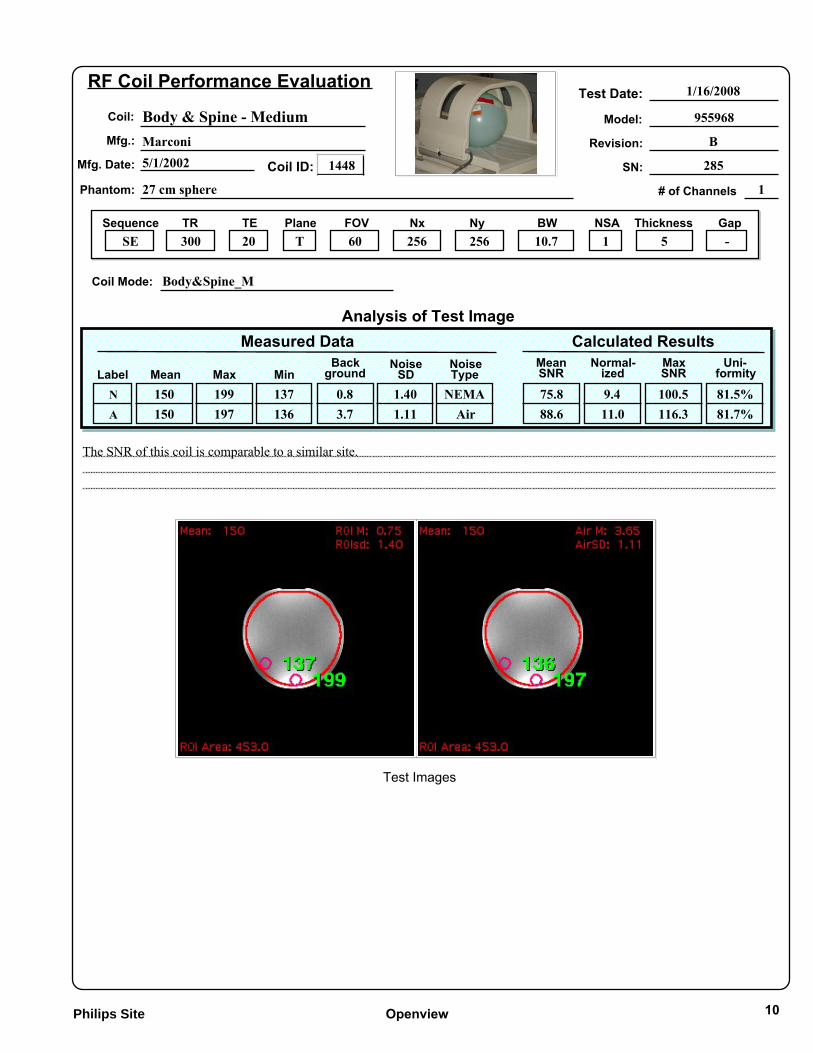
Test Date: 1/16/2008RF Coil Performance Evaluation
Coil: Body & Spine - MediumMfg.: Marconi
Mfg. Date: 5/1/2002
Model: 955968
Revision: B
SN: 285
Phantom: 27 cm sphere
SequenceSE
TR300
TE20
PlaneT
FOV60
Nx256
Ny256
NSA1
BW10.7
Thickness5
Gap-
Coil Mode: Body&Spine_M
The SNR of this coil is comparable to a similar site.
Analysis of Test Image
Coil ID: 1448
Test Images
# of Channels 1
Mean150150
Max199197
Min137136
Background
0.83.7
NoiseSD
1.401.11
Measured Data Calculated ResultsMeanSNR
75.888.6
MaxSNR
100.5116.3
Normal-ized
9.411.0
Uni-formity
81.5%81.7%
NoiseType
NEMAAir
LabelN
A
Philips Site Openview 10

Test Date: 1/16/2008RF Coil Performance Evaluation
Coil: Body & Spine - SmallMfg.: Marconi
Mfg. Date: 12/1/2000
Model: 955982
Revision: B
SN: 31
Phantom: F11 phantom
SequenceSE
TR300
TE20
PlaneT
FOV44
Nx256
Ny256
NSA1
BW10.7
Thickness5
Gap-
Coil Mode: Body&Spine_S
Looks ‘OK’
Analysis of Test Image
Coil ID: 1447
Test Images
# of Channels 1
Mean163161
Max176176
Min151149
Background
2.24.9
NoiseSD
2.041.67
Measured Data Calculated ResultsMeanSNR
56.563.2
MaxSNR
61.069.1
Normal-ized
13.114.6
Uni-formity
92.4%91.7%
NoiseType
NEMAAir
LabelN
A
Philips Site Openview 11

Test Date: 1/16/2008RF Coil Performance Evaluation
Coil: ExtremityMfg.: Marconi
Mfg. Date: 1/1/2002
Model: 95966
Revision: B
SN: 195
Phantom: F2 phantom
SequenceSE
TR300
TE20
PlaneT
FOV25
Nx256
Ny256
NSA1
BW10.7
Thickness5
Gap-
Coil Mode: Extremity
SNR is good. (50% better than comparable site.)
Analysis of Test Image
Coil ID: 1442
Test Images
# of Channels 1
Mean214213
Max227225
Min206205
Background
1.18.2
NoiseSD
3.112.84
Measured Data Calculated ResultsMeanSNR
48.749.1
MaxSNR
51.651.9
Normal-ized
34.835.2
Uni-formity
95.2%95.3%
NoiseType
NEMAAir
LabelN
A
Philips Site Openview 12

Test Date: 1/16/2008RF Coil Performance Evaluation
Coil: HeadMfg.: Marconi
Mfg. Date: 11/1/1999
Model: 955965
Revision: B
SN: 119
Phantom: ACR Phantom
SequenceSE
TR300
TE20
PlaneT
FOV40
Nx256
Ny256
NSA1
BW10.7
Thickness5
Gap-
Coil Mode: Head
Please look at Appendix C for complete ACR Phantom analysis.SNR of this coil is 30% lower than a similar site.
Analysis of Test Image
Coil ID: 1439
Test Images
# of Channels 1
Mean205205
Max228225
Min190190
Background
0.86.1
NoiseSD
2.071.97
Measured Data Calculated ResultsMeanSNR
70.068.2
MaxSNR
77.974.8
Normal-ized
19.619.1
Uni-formity
90.9%91.6%
NoiseType
NEMAAir
LabelN
A
Philips Site Openview 13
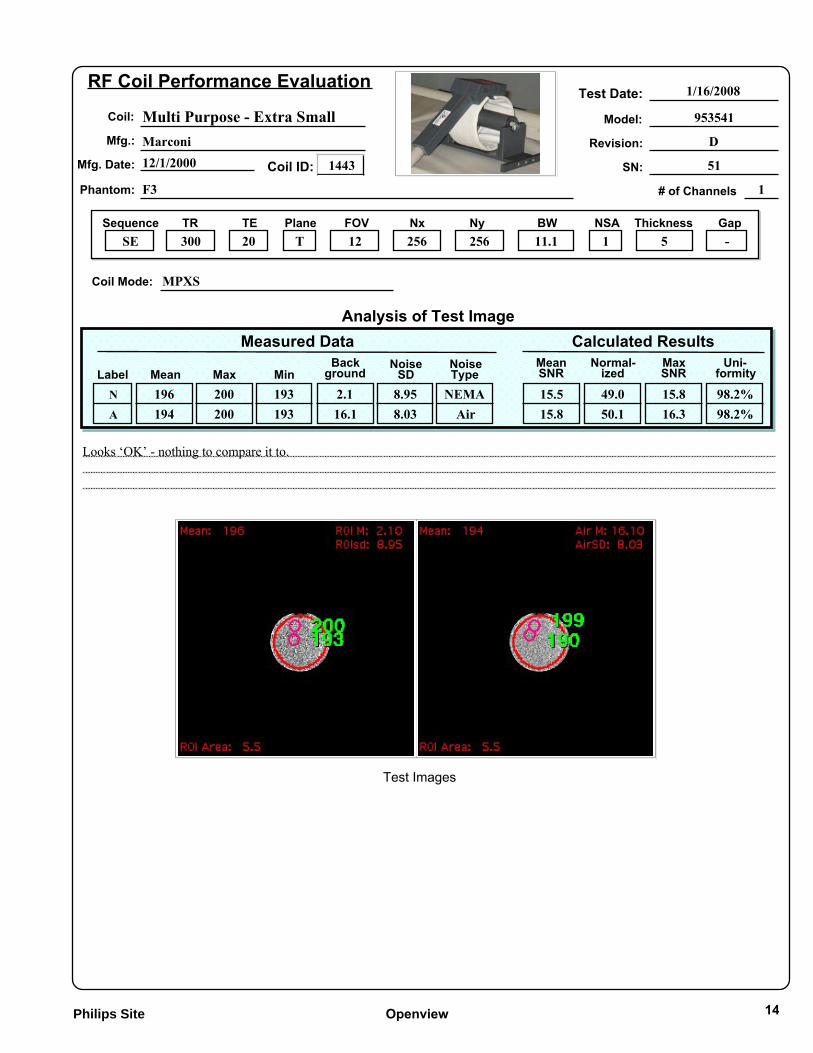
Test Date: 1/16/2008RF Coil Performance Evaluation
Coil: Multi Purpose - Extra SmallMfg.: Marconi
Mfg. Date: 12/1/2000
Model: 953541
Revision: D
SN: 51
Phantom: F3
SequenceSE
TR300
TE20
PlaneT
FOV12
Nx256
Ny256
NSA1
BW11.1
Thickness5
Gap-
Coil Mode: MPXS
Looks ‘OK’ - nothing to compare it to.
Analysis of Test Image
Coil ID: 1443
Test Images
# of Channels 1
Mean196194
Max200200
Min193193
Background
2.116.1
NoiseSD
8.958.03
Measured Data Calculated ResultsMeanSNR
15.515.8
MaxSNR
15.816.3
Normal-ized
49.050.1
Uni-formity
98.2%98.2%
NoiseType
NEMAAir
LabelN
A
Philips Site Openview 14

Test Date: 1/16/2008RF Coil Performance Evaluation
Coil: Multi Purpose - LargeMfg.: Marconi
Mfg. Date: 1/1/2001
Model: 953544
Revision: D
SN: 132
Phantom: F2
SequenceSE
TR300
TE20
PlaneT
FOV25
Nx256
Ny256
NSA1
BW10.7
Thickness5
Gap-
Coil Mode: MPL
SNR of this coil is 30% lower than a similar site.
Analysis of Test Image
Coil ID: 1446
Test Images
# of Channels 1
Mean172172
Max199198
Min155154
Background
0.66.9
NoiseSD
3.433.15
Measured Data Calculated ResultsMeanSNR
35.535.8
MaxSNR
41.041.2
Normal-ized
25.425.6
Uni-formity
87.6%87.5%
NoiseType
NEMAAir
LabelN
A
Philips Site Openview 15
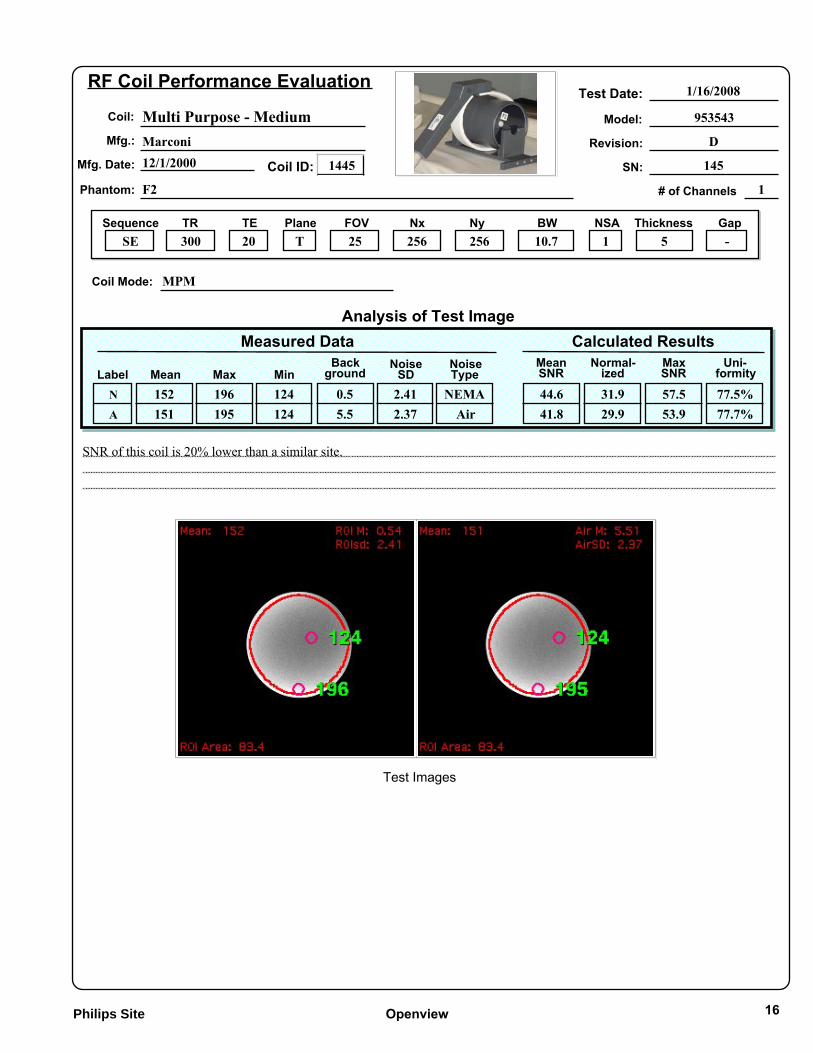
Test Date: 1/16/2008RF Coil Performance Evaluation
Coil: Multi Purpose - MediumMfg.: Marconi
Mfg. Date: 12/1/2000
Model: 953543
Revision: D
SN: 145
Phantom: F2
SequenceSE
TR300
TE20
PlaneT
FOV25
Nx256
Ny256
NSA1
BW10.7
Thickness5
Gap-
Coil Mode: MPM
SNR of this coil is 20% lower than a similar site.
Analysis of Test Image
Coil ID: 1445
Test Images
# of Channels 1
Mean152151
Max196195
Min124124
Background
0.55.5
NoiseSD
2.412.37
Measured Data Calculated ResultsMeanSNR
44.641.8
MaxSNR
57.553.9
Normal-ized
31.929.9
Uni-formity
77.5%77.7%
NoiseType
NEMAAir
LabelN
A
Philips Site Openview 16

Test Date: 1/16/2008RF Coil Performance Evaluation
Coil: Multi Purpose - SmallMfg.: Marconi
Mfg. Date: 12/1/2000
Model: 953542
Revision: D
SN: 111
Phantom: F2
SequenceSE
TR300
TE20
PlaneT
FOV25
Nx256
Ny256
NSA1
BW10.7
Thickness5
Gap-
Coil Mode: MPS
There is almost no difference between this coil’s NSR and the Multi-purpose Medium.... it should have had better SNR.
Analysis of Test Image
Coil ID: 1444
Test Images
# of Channels 1
Mean153153
Max192191
Min123122
Background
0.55.7
NoiseSD
2.022.35
Measured Data Calculated ResultsMeanSNR
53.642.7
MaxSNR
67.253.3
Normal-ized
38.330.5
Uni-formity
78.1%78.0%
NoiseType
NEMAAir
LabelN
A
Philips Site Openview 17

Test Date: 1/16/2008RF Coil Performance Evaluation
Coil: Neck - LargeMfg.: MRI Tech.
Mfg. Date: 11/25/2003
Model: 100202
Revision: A
SN: 377
Phantom: F2 Phantom
SequenceSE
TR300
TE20
PlaneT
FOV25
Nx256
Ny256
NSA1
BW10.7
Thickness5
Gap-
Coil Mode: Neck-L
Adequate - no comparison available.
Analysis of Test Image
Coil ID: 1440
Test Images
# of Channels 1
Mean172171
Max206210
Min151151
Background
0.36.9
NoiseSD
3.962.77
Measured Data Calculated ResultsMeanSNR
30.740.5
MaxSNR
36.849.7
Normal-ized
22.028.9
Uni-formity
84.6%83.7%
NoiseType
NEMAAir
LabelN
A
Philips Site Openview 18

Test Date: 1/16/2008RF Coil Performance Evaluation
Coil: Neck - LargeMfg.: MRI Tech.
Mfg. Date: 11/25/2003
Model: 100202
Revision: A
SN: 377
Phantom: F2 Phantom
SequenceSE
TR300
TE20
PlaneS
FOV25
Nx256
Ny256
NSA1
BW10.7
Thickness5
Gap-
Coil Mode: Neck-L
Analysis of Test Image
Coil ID: 1440
Test Images
# of Channels 1
Mean167167
Max223223
Min119118
Background
-0.18.2
NoiseSD
5.003.42
Measured Data Calculated ResultsMeanSNR
23.632.0
MaxSNR
31.542.7
Normal-ized
16.922.9
Uni-formity
69.6%69.2%
NoiseType
NEMAAir
LabelN
A
Philips Site Openview 19
Test Date: 1/16/2008RF Coil Performance Evaluation
Coil: ShoulderMfg.: USA
Mfg. Date: 9/13/2001
Model: 10019
Revision: B
SN: 378
Phantom: F2 Phantom
SequenceSE
TR300
TE20
PlaneS
FOV25
Nx256
Ny256
NSA1
BW10.7
Thickness5
Gap-
Coil Mode: Shoulder
Analysis of Test Image
Coil ID: 1441
Test Images
# of Channels 1
Mean157158
Max214216
Min121120
Background
-0.27.2
NoiseSD
2.452.48
Measured Data Calculated ResultsMeanSNR
45.341.7
MaxSNR
61.857.1
Normal-ized
32.429.9
Uni-formity
72.2%71.4%
NoiseType
NEMAAir
LabelN
A
Philips Site Openview 20

Test Date: 1/16/2008RF Coil Performance Evaluation
Coil: ShoulderMfg.: USA
Mfg. Date: 9/13/2001
Model: 10019
Revision: B
SN: 378
Phantom: F2 Phantom
SequenceSE
TR300
TE20
PlaneC
FOV36
Nx256
Ny256
NSA1
BW10.7
Thickness5
Gap-
Coil Mode: Shoulder
Analysis of Test Image
Coil ID: 1441
Test Images
# of Channels 1
Mean139139
Max198199
Min8585
Background
-0.24.1
NoiseSD
1.451.27
Measured Data Calculated ResultsMeanSNR
67.871.7
MaxSNR
96.6102.7
Normal-ized
23.424.7
Uni-formity
60.1%59.9%
NoiseType
NEMAAir
LabelN
A
Philips Site Openview 21

-200
0
0
0
20
20
20
40
-40
-40
-20
-20
0
0
0
20
2020
4040
60
-40
-20
-20
0
0
0
20
20
20
40
4040
40
60
6080
Superior
Inferior
Rig
ht
Left
Cor
onal
CoronalDIAMETER MIN MAX RANGE PPM MEAN STDEV
10 -34 -4 30 3.1 -19.4 5.415 -40 4 44 4.5 -20.0 8.920 -53 17 71 7.3 -20.4 13.625 -63 44 107 11.0 -19.6 20.328 -65 80 146 14.9 -17.3 25.5
Superior
Inferior
Ant
eriro
r
Pos
terio
r
Sag
ittal
SagittalDIAMETER MIN MAX RANGE PPM MEAN STDEV
10 -36 -18 18 1.9 -26.0 4.215 -43 -13 29 3.0 -26.4 6.620 -53 -5 47 4.8 -27.1 9.425 -65 6 72 7.4 -27.8 12.728 -74 18 93 9.6 -28.2 15.230 -84 27 111 11.4 -28.5 17.5
Anterior
Posterior
Rig
ht
LeftAxi
al
AxialDIAMETER MIN MAX RANGE PPM MEAN STDEV
10 -1 29 31 3.2 15.4 6.315 -9 40 50 5.1 15.7 10.220 -27 54 81 8.3 15.9 14.925 -59 71 130 13.3 16.0 20.628 -87 86 174 17.8 16.1 24.7
Appendix A: Magnet Homogeneity Field MapsMarconi Outlook Openview - 3 central planes
Measured January 16, 2008

Appendix A: Magnet Homogeneity Field MapsMarconi Outlook OpenviewMeasured January 16, 2008
Philips Site- Laurel - Axial Field Plot - 1/16/08
0.0
5.0
10.0
15.0
20.0
25.0
30.0
-8 -6 -4 -2 0 2 4 6 8
cm from Isocenter (S/I)
pp
m
10cm15cm
20cm25cm
28cm
FOV Diameter
Philips Site- Laurel - Coronal Field Plot - 1/16/08
0.0
5.0
10.0
15.0
20.0
25.0
30.0
-8 -6 -4 -2 0 2 4 6 8
cm from Isocenter (A/P)
pp
m
10cm
15cm
20cm
25cm
28cm
FOV Diameter
Philips Site - Laurel - Sagittal Field Plot - 1/16/08
0.0
5.0
10.0
15.0
20.0
25.0
30.0
-8 -6 -4 -2 0 2 4 6 8
cm from Isocenter (L/R)
pp
m
10cm
15cm
20cm
25cm
28cm
FOV Diameter

Axial Coronal Sagittal
IsoC
ente
r
80
40
-40
-80
H,A,L
F,P,R
-60-40
-20
0
020
20
40
40
40
60 80100
-60
-40
-20
-20
0
0
20
2040
40
60
60 80
-40
-20
-20
0
0
0
20
20
20
40
4040
40
60
6080
0
0
0
20
20
20
40
60
80
-200
0
0
20
20
20
40
4060 80
-60
-40
-40
-20
-20
0
0
0 2040
-100
-100
-80
-80
-60
-60
-60
-40
-40
-40
-40
-20
-20
-20
-20
0
0
0
-40
-40
-20
-20
0
0
0
20
20
20
40
40
60
-80
-80
-60
-60
-40
-40
-40
-20
-20-20
-20
0
0
0
0
-60
-40
-200
0
0
20
20
20
40
40
60
-40
-20
-20
0
0
20
20
40
60
-20
0
00
20
20
20
40
60
-200
0
0
0
20
20
20
40
-40-200
0
0
20
20
20
40
-40
-40-20
-20
-20
0
0
0
20
20
40
60

Appendix B: RF Slice Profiles and Crosstalk
0 50 100 1500
20
40
60
80
100
Upper=46.71 Lower=51.35
Slice Thickness=4.89
SE sk 10
0 50 100 1500
20
40
60
80
100
Upper=46.25 Lower=52.66
Slice Thickness=4.92
SE sk 5
0 50 100 1500
20
40
60
80
100
Upper=46.52 Lower=52.48
Slice Thickness=4.93
SE sk 3
0 50 100 1500
20
40
60
80
100
Upper=45.76 Lower=51.68
Slice Thickness=4.85
SE sk 2
0 50 100 1500
20
40
60
80
100
Upper=44.55 Lower=53.03
Slice Thickness=4.84
SE sk 1
0 50 100 1500
20
40
60
80
100
Upper=37.45 Lower=41.11
Slice Thickness=3.92
SE sk -1
Slice thickness as a function of slice gap
-1 0 2 4 6 8 10Slice Gap
3.75
4.00
4.25
4.50
4.75
5.00
Slic
eT
hick
ness
The data point at gap = 0 was invalid due to poor SNR.
Spin Echo - ACR T1TR/TE = 500/20BW = 11.1 KHznex = 1.5Scan time: 3:18

0.9 0.9 0.9 0.9 0.90.9 0.9 0.9 0.9 0.952.2 56.5 53.0 50.5 54.248.2 55.9 50.2 47.2 51.35.01 5.62 5.15 4.88 5.270.5 0.6 0.4 0.8 0.8
191.7 190.0 189.2 191.3 191.9188.0 188.5 188.8 189.4 188.5
191.0 189.7 188.4 190.9 191.6188.4 188.8 189.2 188.9 188.6190.7 189.4 188.3 190.2 191.1
23456789
190.8 189.5 188.4 191.2 191.4
133 142 137 143 134154 165 160 161 154121 126 127 125 120
88.0% 86.6% 88.5% 87.4% 87.6%
1.0% 2.5% 3.1% 0.0% 1.6%47 69 54 70 67
0 0 0 0 0
4 0 4 4 45 3 8 8 79 3 12 12 15
1.1 0.8 0.2 1.2 0.60.6 0.2 -0.2 0.4 -0.3
Sagittal Locator1 Length of phantom, end to end (mn 148± 2)
Slice Location #1(SE 500/20) (SE 2000/20) (SE 2000/80) (Site T1) (Site T2)
= calculated field
Resolution
Slice Thickness(fwhm in mm)
(1.10, 1.00, 0.90 mm)
TopBottom
Wedge (mm)
Diameter (mm) (190±2)
10111213
Slice Location #5
Diameter (mm) (190±2)
Slice Location #714151617181920212223
Signal(mean only)
Big ROIHighLow
Uniformity (>87.5%)
Background Noise Top Bottom
LeftRight
(mean ±std dev)
Ghosting Ratio (<2.5%) SNR (no spec)
2425262728
Slice Location #8
Slice Location #9Slice Location #10Slice Location #11
1.4%2.5%3.6%5.1%
Total # of Spokes (>=9)
Low Con Detectability
0 0 0 0 4
2930
Slice Location #11Wedge (mm)Slice Position Error
±±
±±
8.7 2.94 6.6 2.05 7.8 2.48 6.3 2.02 6.3 1.978.6 2.72 6.5 2.06 7.9 2.56 6.6 2.08 6.4 2.01
10.3 3.67 8.4 2.71 11.5 3.07 6.4 1.96 8.4 2.74
9.7 3.41 11.7 3.97 12.6 3.14 6.4 2.12 8.5 2.6
Test Date: 1/16/2008
146.5
ACR T1 ACR PD ACR T2 Site T1 Site T2
Philips Site OpenviewHead
There is excessive ghosting in many images, particularly the ACR PD/T2 images.
Coil Used:
= + = -= +
= + = -= +
±±
±±
±±
±±
±±
±±
±±
±±
Calculated value 5.0±0.7

TestID: 243Magnet ID: Coil ID: 1439
PulseSequence
(ETL)
SE
TR(ms)
500
TE(ms)
20
FOV(cm)
25
PhaseSampleRatio
1
Numberof
Slices
11
Thick-ness(mm)
5
SliceGap
5
NSA(Nex)
256
FreqMatrix
2561
BandWidth(kHz)
10.7
ScanTime
(min:sec)
2:09
PhaseMatrix
StudyDescrip
tion
ACR T1
256
256
256
Dual Echo SE
Dual Echo SE
SE
FSE(8)
2000
2000
500
2000
20
80
20
80
25
25
24
24
1
1
2
2
11
11
11
11
5
5
5
5
5
5
5
5 256
256
256
256
256
1
1
2
4
9.3
4.6
10.7
20.8
8:32
8:32
6:24
8:32
ACR PD
ACR T2
Site T1
Site T2
Sequence parameters Test Date: 1/16/2008
Test ID 243
Philips Site Openview
Head
188
Coil Used:

Appendix C: ACR Phantom Analysis ACR T1
0 50 100 150 2000
10
20
30
Upper=52.20Lower=48.21Slice Thickness=5.01
0 10 20 30 40 500
100
200
300
400
Diff.= 0.51
0 45 90 135 180184
186
188
190
192
194
196
188.0
191.2
191.7
189.6
191.3191.1
01/16/08 TR: 500 TE: 20.0
0 45 90 135 180184
186
188
190
192
194
196
188.4
190.7
191.2
190.1
190.7190.8
01/16/08 TR: 500 TE: 20.0
Max:154 Min:121 PIU: 88.2%
Mean:133
Mean 10.3S.D. 3.67
Mean 9.7S.D. 3.41
Mean 8.7S.D. 2.94
Mean 8.6S.D. 2.72
0 10 20 30 40 500
100
200
300
400
Diff.= -1.06
0 50 100 150 200 2500
50
100
150
200
250
146.5
Sagital Length High Contrast Resolution Slice Thickness Slice Position - Inferior
Axial Diameters - #1 Axial Diameters - #5 Uniformity & Ghosting - #7 Slice Position - Superior
Low Contrast - #8 Low Contrast - #9 Low Contrast - #10 Low Contrast - #11

Appendix C: ACR Phantom Analysis ACR PD
0 50 100 150 2000
5
10
15
20
25
30
Upper=56.47Lower=55.88Slice Thickness=5.62
0 10 20 30 40 500
100
200
300
400
Diff.= 0.62
0 45 90 135 180184
186
188
190
192
194
196
188.5
190.6
190.2
189.4
190.1189.9
01/16/08 TR:2000 TE: 20.0
0 45 90 135 180184
186
188
190
192
194
196
188.8
190.3
189.7
189.8
189.4189.5
01/16/08 TR:2000 TE: 20.0
Max:165 Min:126 PIU: 86.5%
Mean:142
Mean 8.4S.D. 2.71
Mean 11.7S.D. 3.97
Mean 6.6S.D. 2.05
Mean 6.5S.D. 2.06
0 10 20 30 40 500
100
200
300
400
Diff.= -0.82
High Contrast Resolution Slice Thickness Slice Position - Inferior
Axial Diameters - #1 Axial Diameters - #5 Uniformity & Ghosting - #7 Slice Position - Superior
Low Contrast - #8 Low Contrast - #9 Low Contrast - #10 Low Contrast - #11

Appendix C: ACR Phantom Analysis ACR T2
0 50 100 150 2000
10
20
30
40
Upper=52.97Lower=50.18Slice Thickness=5.15
0 10 20 30 40 500
100
200
300
400
Diff.= 0.35
0 45 90 135 180184
186
188
190
192
194
196
188.8
191.4
189.2
188.4
189.4188.8
01/16/08 TR:2000 TE: 80.0
0 45 90 135 180184
186
188
190
192
194
196
189.2
190.5
188.4
189.1
188.3188.4
01/16/08 TR:2000 TE: 80.0
Max:160 Min:127 PIU: 88.5%
Mean:137
Mean 11.5S.D. 3.07
Mean 12.6S.D. 3.14
Mean 7.8S.D. 2.48
Mean 7.9S.D. 2.56
0 10 20 30 40 500
100
200
300
400
Diff.= -0.19
High Contrast Resolution Slice Thickness Slice Position - Inferior
Axial Diameters - #1 Axial Diameters - #5 Uniformity & Ghosting - #7 Slice Position - Superior
Low Contrast - #8 Low Contrast - #9 Low Contrast - #10 Low Contrast - #11

Appendix C: ACR Phantom Analysis Site T1
0 50 100 150 2000
10
20
30
Upper=50.53Lower=47.20Slice Thickness=4.88
0 10 20 30 40 500
100
200
300
400
Diff.= 0.83
0 45 90 135 180184
186
188
190
192
194
196
189.4
190.5
191.3
191.8
190.7191.6
01/16/08 TR: 500 TE: 20.0
0 45 90 135 180184
186
188
190
192
194
196
188.9
190.0
190.9
191.7
190.2191.2
01/16/08 TR: 500 TE: 20.0
Max:161 Min:125 PIU: 87.7%
Mean:143
Mean 6.4S.D. 1.96
Mean 6.4S.D. 2.12
Mean 6.3S.D. 2.02
Mean 6.6S.D. 2.08
0 10 20 30 40 500
100
200
300
400
Diff.= -1.20
High Contrast Resolution Slice Thickness Slice Position - Inferior
Axial Diameters - #1 Axial Diameters - #5 Uniformity & Ghosting - #7 Slice Position - Superior
Low Contrast - #8 Low Contrast - #9 Low Contrast - #10 Low Contrast - #11
AP/PE

Appendix C: ACR Phantom Analysis Site T2
0 50 100 150 2000
10
20
30
Upper=54.15Lower=51.32Slice Thickness=5.27
0 10 20 30 40 500
100
200
300
400
Diff.= 0.80
0 45 90 135 180184
186
188
190
192
194
196
188.5
191.0
191.9
190.4
191.8191.7
01/16/08 TR:2000 TE: 80.0
0 45 90 135 180184
186
188
190
192
194
196
188.6
190.9
191.6
190.8
191.1191.4
01/16/08 TR:2000 TE: 80.0
Max:154 Min:120 PIU: 87.8%
Mean:134
Mean 8.4S.D. 2.74
Mean 8.5S.D. 2.60
Mean 6.3S.D. 1.97
Mean 6.4S.D. 2.01
0 10 20 30 40 500
100
200
300
400
Diff.= -0.55
High Contrast Resolution Slice Thickness Slice Position - Inferior
Axial Diameters - #1 Axial Diameters - #5 Uniformity & Ghosting - #7 Slice Position - Superior
Low Contrast - #8 Low Contrast - #9 Low Contrast - #10 Low Contrast - #11
LR/PE

Appendix C: ACR Phantom Analysis
0 50 100 150 2000
10
20
30
Upper=51.65Lower=48.81Slice Thickness=5.02
0 10 20 30 40 500
100
200
300
400
Diff.= 0.64
0 45 90 135 180184
186
188
190
192
194
196
187.9
190.9
191.5
189.7
191.6191.2
01/16/08 TR: 500 TE: 20.0
0 45 90 135 180184
186
188
190
192
194
196
188.2
190.8
191.0
190.3
190.8190.9
01/16/08 TR: 500 TE: 20.0
Max:158 Min:121 PIU: 86.6%
Mean:137
Mean 8.7S.D. 2.59
Mean 8.2S.D. 2.69
Mean 6.1S.D. 1.87
Mean 6.0S.D. 1.86
0 10 20 30 40 500
100
200
300
400
Diff.= -1.07
Site T1 LR/PEHigh Contrast Resolution Slice Thickness Slice Position - Inferior
Axial Diameters - #1 Axial Diameters - #5 Uniformity & Ghosting - #7 Slice Position - Superior
Low Contrast - #8 Low Contrast - #9 Low Contrast - #10 Low Contrast - #11

Appendix C: ACR Phantom Analysis
0 50 100 150 2000
10
20
30
Upper=54.68Lower=52.95Slice Thickness=5.38
0 10 20 30 40 500
100
200
300
400
Diff.= 0.89
0 45 90 135 180184
186
188
190
192
194
196
189.0
190.5
191.8
191.4
191.2191.8
01/16/08 TR:2000 TE: 80.0
0 45 90 135 180184
186
188
190
192
194
196
188.9
190.3
191.6
191.5
190.8191.6
01/16/08 TR:2000 TE: 80.0
Max:157 Min:109 PIU: 82.0%
Mean:136
Mean 6.3S.D. 1.94
Mean 6.7S.D. 2.01
Mean 8.4S.D. 2.78
Mean 7.5S.D. 2.30
0 10 20 30 40 500
100
200
300
400
Diff.= -0.83
Site T2 - AP/PEHigh Contrast Resolution Slice Thickness Slice Position - Inferior
Axial Diameters - #1 Axial Diameters - #5 Uniformity & Ghosting - #7 Slice Position - Superior
Low Contrast - #8 Low Contrast - #9 Low Contrast - #10 Low Contrast - #11

Appendix D:Explanation of RF Coil Testing Report
IntroductionThe primary goal of RF coil testing is to establish some sort of base line for tracking coil performance overtime. The most common measure is the Signal to Noise Ratio or SNR. In addition, we can look at overallsignal uniformity, ghosting level (or better - lack of ghosting) and in the case of phased array coils we lookat the SNR of each and every channel and at symmetry between channels. Unfortunately, there is no singlebest method for measuring SNR. Below I explain the different methods used and the rationale for each.
SNROne needs to measure the signal in the phantom (either mean or peak or both) and then divide that by thebackground noise. Measuring the signal is fairly straightforward, the noise can be more problematic. Thesimplest method is to measure the standard deviation (SD) in the background ‘air’. However, MRI imagesare the magnitude of complex data. The noise in the underlying complex data is Gaussian but it follows aRician distribution when the magnitude is used. The true noise can be estimated by multiplying the mea-sured SD by 1.526.
During the reconstruction process, most manufacturers perform various additional operations on the images,This could include geometric distortion correction, low pass filtering of the k-space data resulting in lowsignal at the edge of the images, RF coil intensity correction (PURE, CLEAR, SCIC, etc), and other pro-cessing during the combination of phased array data and parallel imaging techniques. All of these methodsdistort the background noise making it impossible to obtain an accurate (and reproducible) estimate of theimage noise in the air region. The alternative is to use a method which I shall refer to as the NEMA(National Electrical Manufacturers Association) method. The signal in the phantom area is a sum of theproton signal and noise. Once the signal to noise ratio exceeds 5:1, the noise in the magnitude image iseffectively Gaussian. To eliminate the proton signal, you acquire an image twice and subtract them. Themeasured SD in the phantom region should now be the true SD times the square root of 2. When determin-ing the SNR using the NEMA method, calculate the mean signal of the average of the two source imagesthen divide by .7071 x the SD measured in the same area as the mean signal.
Unfortunately, this doesn’t always work. It is absolutely imperative that the RF channel scalings, both trans-mit and receive, be identical with both scans. Any ghosting in the system is not likely to repeat exactly forboth scans and will cause a much higher SD. Finally, the phantom needs to be resting in place prior to thescan long enough for motion of the fluid to have died down. Depending on the size and shape of the phan-tom, this could take any where from 5 to 20 minutes.
One of the most common causes of ghosting is vibration from the helium cold-head. The best way to elimi-nate this artifact is to turn off the cold head, which will increase helium consumption. Because this vibra-tion is periodic, the ghosting is usually of an N over 2 (N/2) nature. The affect inside the signal region ofthe phantom can be minimized by using a FOV that is twice the diameter of the phantom (measured in thePE direction.) If the noise is to be measured in the air, then be sure to NOT make measurements to eitherside of the phantom in the PE direction.
Scan parameters also significantly affect measured SNR. For most of the testing performed in this documentI used a simple Spin Echo with a TR of 300, a TE of 20 and a slice thickness of 3mm and a receiver BW of28.1 KHz (a 1 pixel fat/water chemical shift). The FOV was varied depending on the size of the coil and thephantom used. All of the parameters used for each test can be found on each page immediately below thecoil description.

Report LayoutEach page of this report lists the data from a single test. The top third of the page describes the coil andphantom information, followed by the scan parameters used. The middle third contains the numbers mea-sured and calculated results. This section will contain one table if the coil being tested is a single channelcoil (i.e. quadrature or surface coils) and two tables if it is a multi-channel phased array coil. The entries inthe table will be described further below. The bottom section contains a few lines of comments (ifnecessary), a picture of the coil with the phantom as used for the testing and one or more of the images thatwere used for the measurements.
There is usually one image for each composite image measurement and one image for each separate channelmeasurement. Each image shows the ROI (red line) where the mean signal was measured and two smallerROIs (green lines) where the signal minimum and maximum was found. In the top left corner of each imageis the mean signal in the large ROI. The bottom left corner contains the large ROI’s area (in mm2). The topright corner contains two numbers a mean and a standard deviation. If the NEMA method was used, thenthe top right corner will list the mean and SD of the large ROI (labeled ROI M and ROIsd) applied to thesubtraction image. If the noise was measured in the background air the the numbers are labeled Air M andAirSD.
Data TablesThe meaning of most of the entries in the data table are should be self evident with a few exceptions. Thefirst column in each table is labeled “Label”. In the composite analysis, this field may be empty or containsome sort of abbreviation to identify some aspect of the testing. Some possibilities are the letter N forNEMA, A for Air, L for Left, R for Right, C for CLEAR, NoC for No CLEAR. In the Uncombined Imagetable, the label usually contains the channel number or similar descriptor. The column labeled “Noise Type”will be either Air or SubSig which stands for Subtracted Signal, i.e. the NEMA method. Both tables containa column for Mean SNR and Max SNR which are the Mean or Max signal divided by the SD of the noisescaled by either 1.526 (Air) or 0.7071 (NEMA).
Composite Image Table: The final two columns in this table are “Normalized” and “Uniformity”. It can berather difficult to compare the performance of different coils particularly if different scan parameters areused. (Of course, it’s even more difficult from one scanner to another.) I have standardized most of my test-ing to use a spin echo with a TR/TE of 300/20msec and a thickness of 3 mm. The FOV changes to depend-ing on the size of the phantom used although I try to use a FOV that is at least twice the diameter of thephantom as measured in the PE direction. For one reason or another, a change may be made in the scanparameters (either accidentally or intentionally such as turning on No Phase Wrap to eliminate aliasing, etc.).In order to make it easier to compare SNR values I calculate a “Normalized” SNR value. This value is theo-retically what the SNR would be if a FOV of 30cm, 256x256 matrix, 1 average, receiver BW of 15.6 KHzand slice thickness of 3mm had been used. Obviously, the final number is affected by the T1/T2 values ofthe phantoms used as well as details of the coil and magnet field strength but it can be useful in certain situa-tions.
The “Uniformity” value is defined by the ACR as 1 - (max-min)/(max+min). This is most important whenlooking at volume coils or for evaluating the effectiveness of surface coil intensity correction algorithms(such as PURE, CLEAR or SCIC).
Uncombined Image Table: This table has two columns labeled “% of Mean” and “% of Max”. When ana-lyzing multi-channel coils it is important to understand the relationship between the different channels, theinherent symmetry that usually exists between channels. In a 8 channel head or 4 channel torso phased arraycoil, all of the channels are usually have about the same SNR. These two columns list how the SNR (eitherMean or Max) of each channel compares to the SNR of the channel with the maximum value.