Embed Size (px)
Citation preview
Report No. 2192a-PH
Philippines Sector Study FilE CJOPYC rqrn Dri-'r4i .- ;- De-%1;,-w D1-,x A PGaJ CAII I IProdJuLL1U1I P olic-y RVIeview(in Two Volumes)
Volume II: AnnexesJanuary 22, 1979
Projects DepartmentEast Asia and Pacific Reg,ion
FOR OFFICIAL USE ONLY
D)ocument o6 the World Sauk
I r c J)CUrneni nas S fa sce disribuEtin and may be usea by recipientsonly in the performance of LIhW oVici*l dutesI 13 cortents may nototherwise be disclosed without Wofiisank authonzation.-
Pub
lic D
iscl
osur
e A
utho
rized
Pub
lic D
iscl
osur
e A
utho
rized
Pub
lic D
iscl
osur
e A
utho
rized
Pub
lic D
iscl
osur
e A
utho
rized
Pub
lic D
iscl
osur
e A
utho
rized
Pub
lic D
iscl
osur
e A
utho
rized
Pub
lic D
iscl
osur
e A
utho
rized
Pub
lic D
iscl
osur
e A
utho
rized
CURRENCY AND UNITS
Unit nf cturrency = Peso (P)
US$1.00 = P 7.4P 1=00 = US$0.1351 cavan = 50 kilograms
ADBBRVIATTTAIOTN AND GOTSASCADV11DJJIjj%_V £L4I.V £'.JI t,'LJ4U .IJUOAJ.%L%
BAEcon = Bureau of Agricultural EconomicsTAML - T%--, 44 MIAdew ResistantIJJLL% J~ ~l IflJ.- SA -C%-OLx C .L
FIES = Family Income Expenditure SurveysFNRC = Food andu L'4utrition, Re-search CenterFSDC = Farm Systems Development Corporationniv = 'n.LgLL YiL.LL.ng VCLLiety
IRRI International Rice Research InstitutehMTDDA = Natior,al "conomic and Developmer,t A.uthoity
NFAC National Food and Agriculture CouncilNGA = Ll- Nat'Lonal aGL 1raiLns Authority
NIA = National Irrigation AdministrationPalay U - unmilled riceUPLB University of the Philippines at Los Baffos
Crop Year = July to June
FOR OFFICIAL USE ONLY
PHILIPPINES
SECTOR STUDY
GRAIN PRODUCTION POLICY REVIEW
VOLUME II: ANNEXES
TABLE OF CONTENTS
Page No.
ANNEX A - Technology for Grain Production 1
ANNEX B - The Demand for Grains 23
ANNEX C - Rice: Prices and Market Margins 57
Statistical Annex 76
This document has a restricwd distibution and may be _e by fuciplents only in the performanceI th ; ,4,a,i*.& Iii r'Afttd.IIe g m.s may* not*oteMge he dWIe eItkni Wtrld Rank authnriymtinn(v VIw fl*v w~5bU __ w.w _l ,~* * . _ . _ _ . _ ._.. __ __.


AINNEXA A
-Il - Page 1
PHILIPPINES
GRAIN PRODUCTION POLICY REVIEW
TECHNOLOGY FOR GRAIN PRODUCTION
Part I: Technology Assessment
1. The technology for grain production in the Philippines varieswidely as between rice and the other cereals. On the one hand, by virtue ofthe location of the International Rice Research Institute (IRRI) at Los Baffos,the country has access to the considerable volume of information on riceproduction in the country's most important rice growing area generatedwithin the past two decades. On the other, because of inadequate attentionpaid to national research programs until very recently, improved technologyfor production of corn, the country's second cereal, is lacking./l At thepresent time most corn Earmers in the Philippines do not have access to atechnology package whicah has been proven to be technically or economicallyviable. Nor has there 'been much work of substance on sorghum, the thirdpotentially important cereal.
2. The general weakness of national research services has limitedthe extent to which improved technology for rice production developed atIRRI has been tested and fine tuned under conditions outside the Institute'ssponsored program of trials in the Philippines. In consequene,- whereastrials under simulated :1armers conditions indicate the feasibility of yieldlevels in excess of six tons unmilled rice (nalav) ner ha. farmers utilizingthe recommended package of inputs rarely obtain more than four tons, orsliRhtlv more ner ha. fin the dry senaon u_nder full irrigation, and 3I5 t/haunder rainfed conditions. Further, national yields of palay have increasedat a low rate in recrnt vearo rane-hint an averaaa of 2 9fl s-/kh 4i-rr4--ga anA
1.44 t/ha rainfed in the period 1974/77 which was characterized by generallyQisperinr grnwtang condfttton.s The followIng paragrap- InAicate in moredetail the problems and prospects for improving grain production technologysuitable for exten.sion l:o the fal populaLtor. -vCL LLC periUU LU 1990.
Technnolngy for Ri ce
34. A-alys4's of the componlents of r'ce produotion technology available01 ~ =X ~ li LI. f AUjIJILLOli L .L 1 uut LUL LLiili±~ dVd.±dD±
to Filipino farmers reveals that, whereas about half of the national lowlandrice crop, i.e., irrigat:ed -ar rainfed was plar,ted LU modet varieties \flV)
in 1969/70, this proportion had increased to over 86% of irrigated and 68% ofrailuedu areas uy 1917. .L'LLprjUVementLL couLU Ue mdaUt tU arrarigements tor mului-plication, seed quality control and distribution of improved varieties,currentl may domiLLId Di Jo3, out overall neither the availability nor thequality of planting material are major limiting factors to rice yields.Aualtiouanly, supplies of new varieties aesigned to nave resistance to newstrains of such serious pests and diseases as Brown Plant Hopper and Tungroappear likely to continue to be produced and released by IRKI for subsequentdissemination throughout the period ahead.
/i According to information obtained from government sources in November1978 there has been significant progress recently in selecting a DownyMildew resistant variety and also in developing seed treatments effectiveagainst that disease. This information has not been taken into account inthe evaluation presented in this annex, however.
A V I A.n.NEX a- 2 - Page 2
4. The use of fertilizers and pesticides generally is well belowrecomuienueu levels. A4 natLionafl survey of some 96u farmers w'no obtainedcredit and technical assistance under Phases VII and VIII of the Masaganaprogram indicated that 99% of tneir irrigated farms received fertilizer at arate averaging 4.7 bags (50 kg bag) per ha. Some 92% of their rainfed farmsreceived fertilizer at an average rate of 4 bags per ha. These levelscompare with a typical recommended package of 6 bags per ha, and are unques-tionably above rates applied by the majority of farmers who do not receiveMasagana loans. Survey results are supported by research conducted at anumber of sites in Central Luzon by workers at IRRI in the mid-1970s seekingto establish and isolate the factors constraining yields on farmers' plots.This work has demonstrated that a physical yield gap between average farmers'yields and average maximum attainable yields under farmers' conditionswith presently available technology ranges from one to two tons/ha in thewet season and around two tons/ha in the dry season. About half of thisyield gap is attributable to inadequate rates and inappropriate timing offertilizer application. Insect damage accounted for 30 to 50 percent of thegap, again because of low application rates. Farmers' weed control measuresgenerally are satisfactory.
5. Farmers do not follow the recommended application rates for avariety of reasons. In many cases, the returns do not justify the expenditureas shown in the subsequent part of this section of the report. Also, rela-tively few farmers growing rice do so under conditions which approach theideal water control conditions which tend to be assumed in current technicalpackages. Hence, fertilizer responses are suboptimal and farmers sensiblyreduce their rates of application.
6. Research on the impact of irrigation on the yield of modern varietiesof rice conducted by IRRI worker Mark Rosegrant /1 simulated a large numberof seasons of irrigation flows and rainfall and utilized a water balancemodel to estimate stress day numbers in each season. Because of the largevariation in seepage and percolation rates prevalling tinder field conditionsseparate analyses were made for median, low and high seepage and percolationrates as defined in Annex A. Table 1.
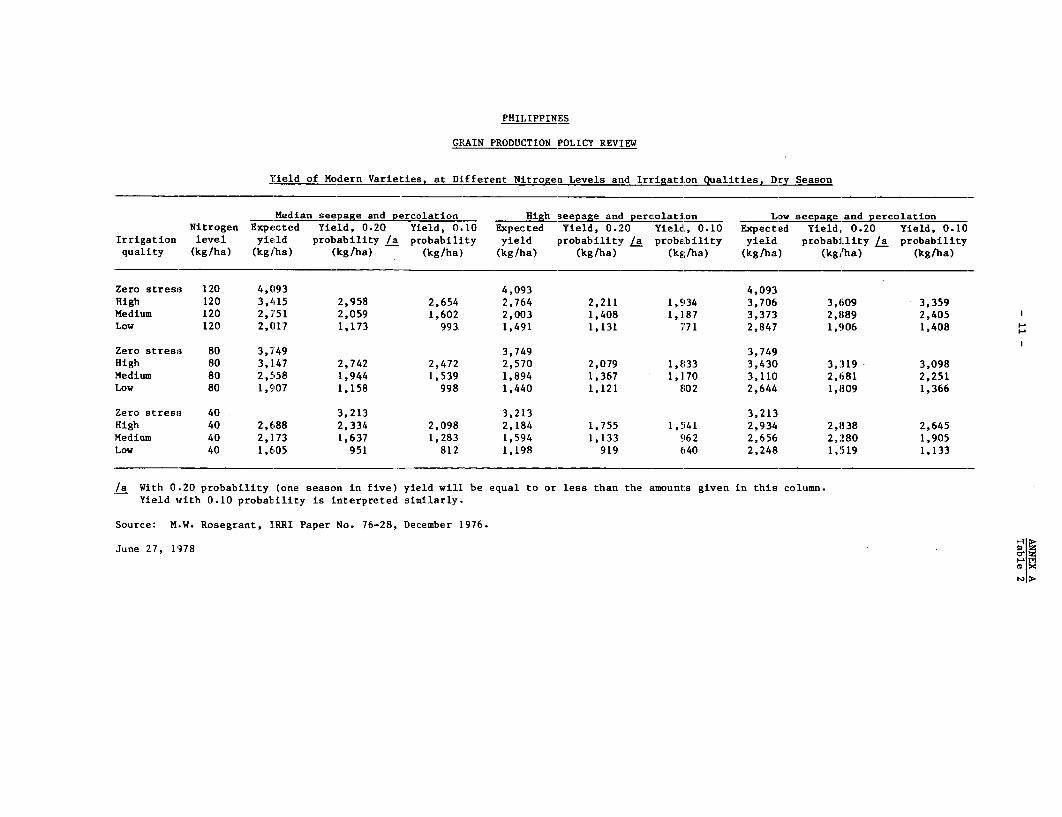
7. Yields of …alay were computed by substituting appropr4ate stresslevels into the seasonal response functions. Results obtained are indicativeof the large yield benefits possible in the dry season from improvements toexisting irrigation systems. Thus, a shift from low quality to mediumquality irrigation at median seepage and percolation cou'ld ue expected togive a yield benefit of 500 kg/ha of palay at an application rate of 40 kgN/ha (about 2 bags of urea). the yield benefit Increased to 750 kg palay/haat an application rate of 120 kg N/ha. A shift from medium to high qualityirrigation gitves similar results. Thus, at median seepage and percolationthe expected yield increment is 500 kg palay/ha at 40 kg N/ha, increasing tomore thLanl 650 kg palay/ha when 10U Kg N/ha is applied (Annex A, Table 2).
/I Rosegrant, M. W.: The Impact of Irrigation on the Yield of ModernVarieties, Paper No. 76-28, December 1976.
ANNEX A- 3 - Page 3
8. As could be anticipated, rice production under high quality irriga-tion is much less risky than under lower quality. At 0.10 probabilityof reduced yields, yields are 800 kg/ha higher at 40 kg N/ha and 1,000 kg/hahigher at 120 kg N/ha. 'Under ideal, zero stress, conditions expected yieldsare 500-600 kg/ha greater than would be obtained under high qualit:y irrigationregardless of the rate oE application of N. The latter assumes a mean of 4.9stress days in the dry season and 9.7 and 15.0 stress days assumed undermedium and low quality irrigation respectively. Under wet season conditions,numbers of stress days vary significantly less between the different qualitiesof irrigation. Numbers of stress days under rainfed conditions range from amean of 16.8 under high seepage and percolation to 5.1 under low seepage andpercolation compared withl 7.9 and 1.6 stress days resnpctively with mediumquality irrigation.
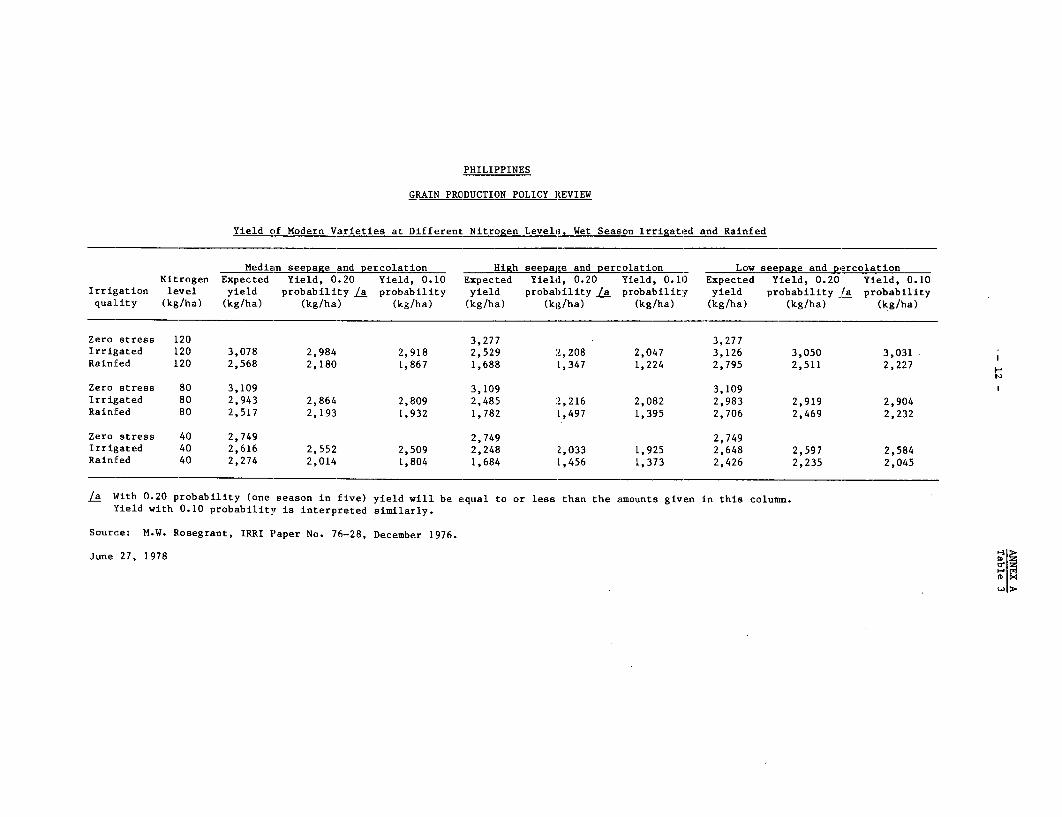
9. The yield beneEits of a shift from rainfed to irrigated farmingare considerable, ranging from about 350 kg palay/ha at 40 kg N/ha to some500 kg/ha at 120 kg N/ha under median seepage and percolation. Irrigation isnartirularly effertive il reducing wet season risk. At 0.10 probability ofreduced yields, yields under irrigation are 700 kg/ha higher than rainfedyields at 40 kg N/ha an1d !,000 kg/tha higher a-t 120 kg Nj/ha (Annex A, 'Ta'kle I)
…~~~~0 N'L. .I~. h. 1 nnna n% AnC
10. The ImplIcatIonls of the foregong for irrigation management areimportant since the analysis shows not only the anticipated high benefitobtair.able from the exte;:io 0f 4rrgtion lo new lar.d if -water 's available,0~ 0Jfl.~J1 J. . L . LIO.J.L L L. LLC .L U Li . L~ L L V ± d i
but also the very large ,iry season yield benefits which could be achieved byimprovement of existing Lrrigatior. systems. Field studies show that highquality irrigation sites are usually on the upstream sections of main canalswhile downLstream siLtes tend to be of lower quality. A basic weakness is lackof intermediate structures. In addition, management programs to prevent theloss of excess water froma high quality sites and to redistribute such waterdownstream would help upgrade these low quality sites and result in someyield benefits. Such programs would be primarily a matter of placement ofappropriately trained wailer management personnel within irrigation systemsand would therefore be much cheaper than infrastructure development. However,in many systems, their use would not be effective without structures neededfor water control. Current estimates for the physical works required for newirrigation construction Ln the Philippines approximate $2,500/ha, and forrehabilitation of physical works some $1,000/ha.
11. Both the National Irrigation Administration (NIA) and the FarmSystems Development Corporation (FSDC) have programs for improving theoperation of existing irrigation schemes through Water Management Technicians.These should be expanded and complement to the extent possible other technicalassistance services proviLded through the Department of Agriculture. It isimportant that both arms of the technical assistance services work togetherin view of the interrelationship between fertilizer response and irrigationquality, and the need to educate most rice farmers of its benefits.

ANNEX A
_ 4 _ Paie 4
12. Ln auuLtion, expanded progams of field trials at local levels
on fertilizer responses, and pest and weed control, are needed to provide the
l.ocation specific information for extension to farmers= Cou-led with nlanned
improvements in delivery systems for technical assistance and supervisedproduction credit the 'orego'ng should result in a substantially more efficientuse of available and developing technology for irrigated rice. Its impact isunlikely to be dramatic on a national scale but it appears not unreasonable topredict a progression from the 2.20 t/ha level of 1974/77 to around 2.55 t/ha
by 1982 and to a yield of some 3.30 thl'a by 1990.
13. Some potential exists for developing technology for nonirrigated
lowland rice in selected areas utilizing direct seeding of short maturing
varieties (102-105 days) planted in May followed by a second rice crop, and
possibly a third, such as mung beans or sorghum, utilizing residual water.
Problems identified in pilot projects to date include harvest and drying of
the first crop at the height of the rains, timely land preparation and
planting of the second and third crops. Experience with drought conditions
in 1977 underlines the importance of careful analysis of historical rainfall
data to identify suitable areas. Also, participants need efficiently organized
credit, input supply and marketing services for successful operation of the
system. It is likely that management systems along these lines will be
perfected and introduced on some scale in the years to come in rainfed
areas such as parts of Western Visayas. However, the overall picture for
rainfed lowland rice is one of declining area, as irrigation development
advances, and of yields increasing slowly at rates approximating recent
historical trends.
14. Upland rice, occupying some 11% of total area planted to the crop,
and grown for the most part in areas badly served by technical and related
delivery mechanisms is unlikely to benefit significantly from technology
advances. New varieties being developed by IRRI will find their way into
these areas and together with limited use of agricultural chemicals will
result in a slow upward trend in yield levels. However, it is unlikely that
the upland rice crop will undergo anything approaching a quantum jump in
productivity in the coming decade and the prospects for improving the level of
vivnfg for upland farm households depends largely on the introduction of
supplementary products into the cultivation pattern. These could well include
corn or sorahum when the technology is better formed.
15. It is impossible to put an accurate figure on the impact of efficient
extension activities on yields, particularly on a crop such as rice for which
the big breakthrough in technology, with the Introduction of modern varieties,
occurred over ten years ago. The key factors now are fine tuning of packages
to suit local conditions, improving the extension delivery to producers, and
monitoring the organization of input and related services so as to deal
effectively w-th farmers. Without services to perform these functions,
farmers' yields would be unlikely to rise over present levels and could well
decline as a result of such factors as pest and disease attack for which
farmers may be unprepared and ill-equipped to overcome.
ANNEX A-5- Page 5
Technology for Corn
16. Philippine farmers grow both white and yellow corn but have atraditional preference for white. Grown under rainfed conditions, generally
on small holdings without recourse to improved planting material or fertilizer
and pest control chemLcals, average yields are among the lowest in Asia.
17. The Philippines does not have a viable technical package for corn
despite its Masagana M4aisan and more recent Maisan 77 production programs.
Evidence to support this contention is provided by their results. Thus,
harvest area under the former dropped from 711,000 ha in Phase I to 254,000 ha
in Phase V with average yields of 1,500 kg/ha of white corn and 1,100 kg/ha of
yellow corn compared with a target of 2,000 kg/ha. The Maisan 77 programlaunched in carefully selected areas with close extension coverage and full
technical and credit support has been similarly disappointing. With 24% of
the program area harvested (27,000 ha) yields averaged 1.400 kg/ha for white
corn and 1,050 kg/ha for yellow (Maisan 77 Sustaining Area Monthly Status
Renort fernember 1977". The declared break-even yield for the technology
package recommended is 2,050 kg/ha.
18. Reasons for this state of affairs are several, however they aredoiminated by the ahserce of improved planting material with sustained toler-
ance to Downy Mildew, an endemic disease throughout all corn growing areas.
Disease impact is such that even mild attacks can halve yields. Additionally,
such improved planting material as is available, for example the DMR seriesproAuceA by the natior,al Tnstitute of Pi-lt Breeding (TIPB), has a yield
potential under good farm conditions including chemical fertilizer and pesti-cid'es ofp no more tha 2,500-3,000 kg-/I, ass- ing freedom From Downy Mildew
attack. Yield potential of this magnitude provides an inadequate return onin-cvestment Lin thLe chemicals and other inputL reedeAu for its realization.
In U _L L - L '~~~A 2.. ..- pr… o.uct-..-.. .-..-- .- Ie g n r
19. Ad-itionat constraLnts to ±LLcreased corrL pructiLViLLy aeth L glL ner
ally sketchy data on fertilizer response. As for rice, few location specificdata are ava4±aule. But until new planting material 1has been developed
it will be impossible to generate such information. Technical information onpest control is reasonably well established ho-wever. Fnaly, because most
corn is grown rainfed, often in scattered small plots, difficult: of access totecnnical assistance staff and input suppliers, it is -unfiLlkely that improvedtechnology when developed will make a rapid impact on producers.
20. The Institute of Plant Breeding plans to produce hybrid Downy Mildew
Resistant (D-M) corns with yielu potentials of aro-ud 7 t/ha by 1979 and istargeting 10 t/ha DMR hybrids by 1982. Work is also continuing on production
of DMK composites with 90-day maturity periods and yields in the 4-5 t/harange. Additionally, two commercial firms with strong technical links to
well known US corn breeding organizations plan to produce and market DIRR
white and yellow corn laybrids by the early 1980's.
21. The structure of corn production and current support services
are such that the case for a large program via hybrids in the near term is
ANNEX A- 6 - Page 6
weak. However, in terms of yield potential, disease resistance and other
desirable qualities such as fertilizer responsiveness and pest tolerance thehybrid route is probably preferable to synthetics. Experience in countries
such as Mexico and Kenya has demonstrated the speed at which small cornproducers have accepted hybrids into their farming systems. Essential
concomitants are intial selection of discrete development areas, adequatetechnical assistance in both number and competence, efficient input andcredit delivery systems and appropriate marketing services.
22. If the foregoing principles are accepted, corn production could beboosted significantly in traditional corn growing areas at a rate directlyrelated to provision of the staff and services required once the technology isin hand. Initial areas for testing techniques miRht be in the CaRavan Valley,
Western Visayas and accessible locations in Mindanao. Further, the use ofcorn as a second or third crop to utilize residual water after rainfed ricehas substantial possibilities in many areas.
23. However, it is unlikely that the Philippines will have viable cornnarkAoR hrforp 1982. Assuming that these are develoDed and subseauentlv
extended to smallholders, their impact on national production will begin tobecome aDparent towards the end of the 1980s. Commercial scale operators willobviously react much more rapidly, but their contribution to national cornnrAdlrctinn is rlat1vv1v qmall.
Technologv for Sorohlm
24. The Department nf Aariculture hns been looking at sorghum as a feed
grain for some years. Area harvested is small and varies widely. Yields andproduction have also seesa,-ed Tiolntl. T- I a new crop in the country;technology is still being developed and refined, and farmers themselves aresti'll fCamiliarizing themselves with 4ts characteristics. Nionetheless Jt has
L.L.A L 1 _Lamttt L A.L II LtIL U CL vC L_LL .L_O .. na L C LLtLO fL ICUIJ.OO .L. ka
many attractive features including drought and flood tolerance, absence ofma orn iUigenu-ub pests and diseuases,I exiLstence of large volUmeUs of hi
yielding germ plasm requiring comparatively minor adaptation trials and, byvirtue of being a new crop, no "fLarmer folk 'Lore" to co,fo-u.d productiLon
recommendations.
25. Its principal potential value is as a second or third crop utilizingresidual moisture and plant nutrients after rice or corn. Under such condi-tions and with minimal fertilizer, yields of over 2 t/ha can be expected fromexisting planting material. Development of high yieiding hybrids by commerciaiinterests, already underway in the south of Mindanao, is likely to result inwell adapted short maturing (70-80 days) material having a 2-3 t/ha yieldpotential under farm conditions and available for wide-scale distribution by1980. Its rate of spread in corn growing areas will be governed, assumingsuch factors as technical support, continued attractive pricing and adequatemarketing facilities for output, by the extent to which farmers can producerequired subsistence corn in their first and/or second crops.
26. As for hybrid corn, the appropriate approach would be to select discreteareas for promotion of the crop providing the full package of services needed to
ANNEX A- 7 - Page 7
develon acceDtance and Dopnularitv with growers. Logically these might initiallybe located in the south oE Mindanao, in areas chosen for development of directlyseeded rainfed rice. such as Darts of Western Visayas and in other locationswhere interest is displayed and production potential has been demonstrated.qiihSuequient upntanPAhl u:ake onnA a w1e scale will be conditionaI on attractiveprice relationships and ef-ficient output marketing arrangements. Given these
conditior.s a*olehear noprogrm rf Irlocal AdtantAtnin trlnals anti the initiaqtion
of cropping systems investigations, it is possible that area planted to sorghumcould increase to 20,000 hta by 1982 and to 75,000 ha by 1990 with avYerage yield
increasing from 2 t/ha in 1982 to 2.5 t/ha by 1990, and production approximating40,000 ton.s by 1982 an.d 1I0,00 tons hy !990=
tcLs I. .LXL. Ja.LLLLxO '.VJ0L0 L IA'.L^ L\C-UJLLA0 X.L V * SV&'.&%.LJ.JI
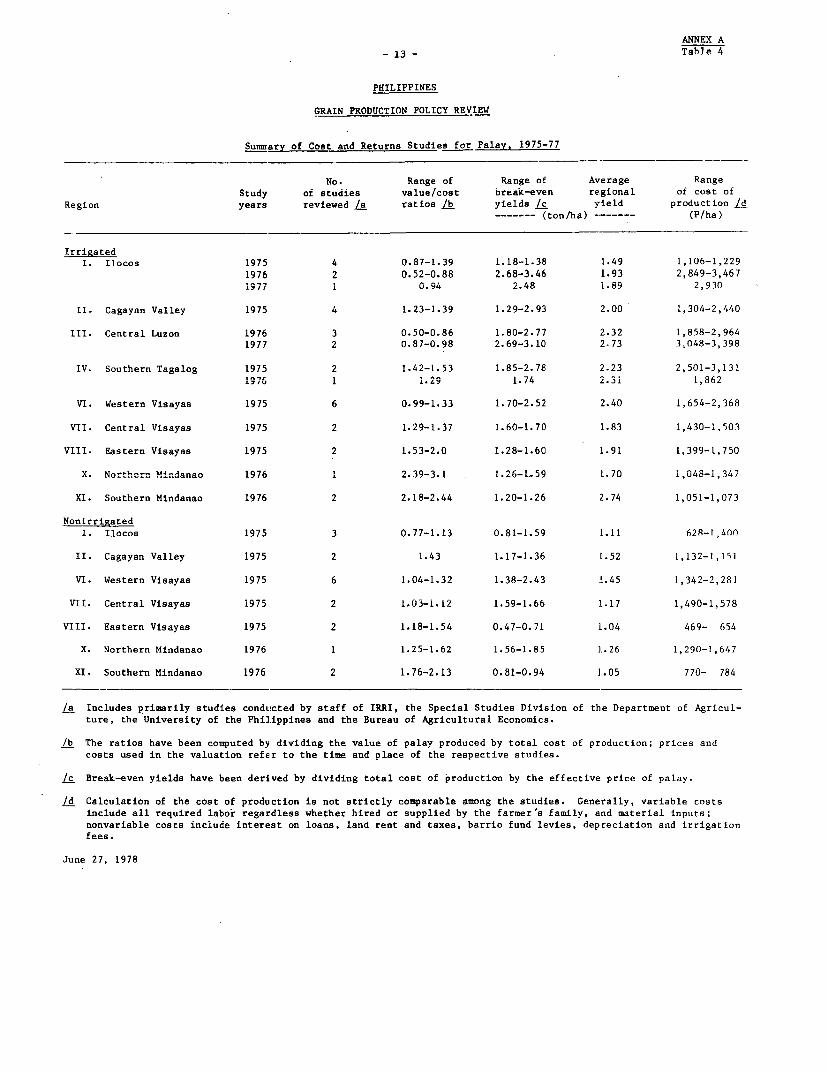
27. A.nexL~' l, abULe 4W -WLLAich su ariLzes costs an.d ret,urns stLudiUes fJor
palay for the years 1975-77 indicates that most farmers operate at low returns,thle notble exceptiLons be.r.g L.LU1eL Von LLLLg±aeLU areas LU &WL LLIL ind
Southern Mindanao. Further, in a number of regions, as in Ilocos, Central.,~~ ~ ~~~ ~ ~ ~ ., t. A -. ., . -_ I A - - - -_- J _ _ _ _ _ _ L J _ L _ -_ Visayas and Northern HindaHnao, nonilrrigaUtd riXe yiLeldbs ar e noUt [high1 U gLUhLl xto
pay back costs.
28. Studies for corri (Annex A, Table 5) show a similar situation, with onaverage only Southern Mindanao indicating adequate returns.
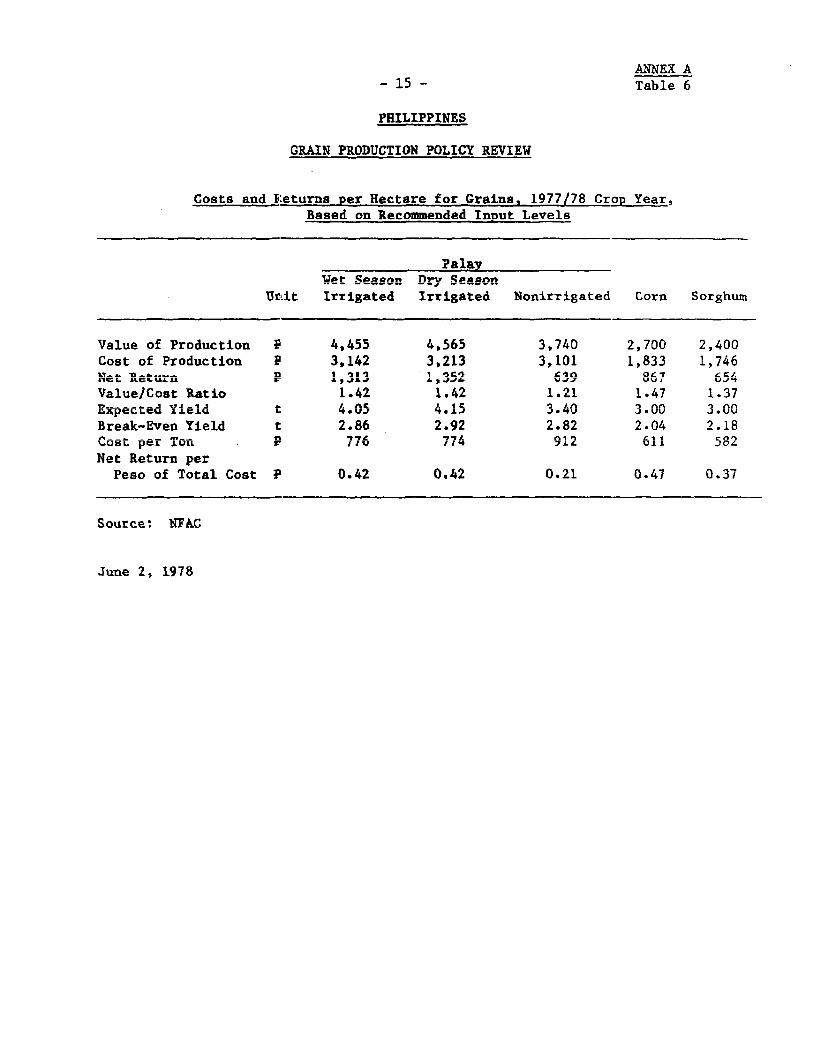
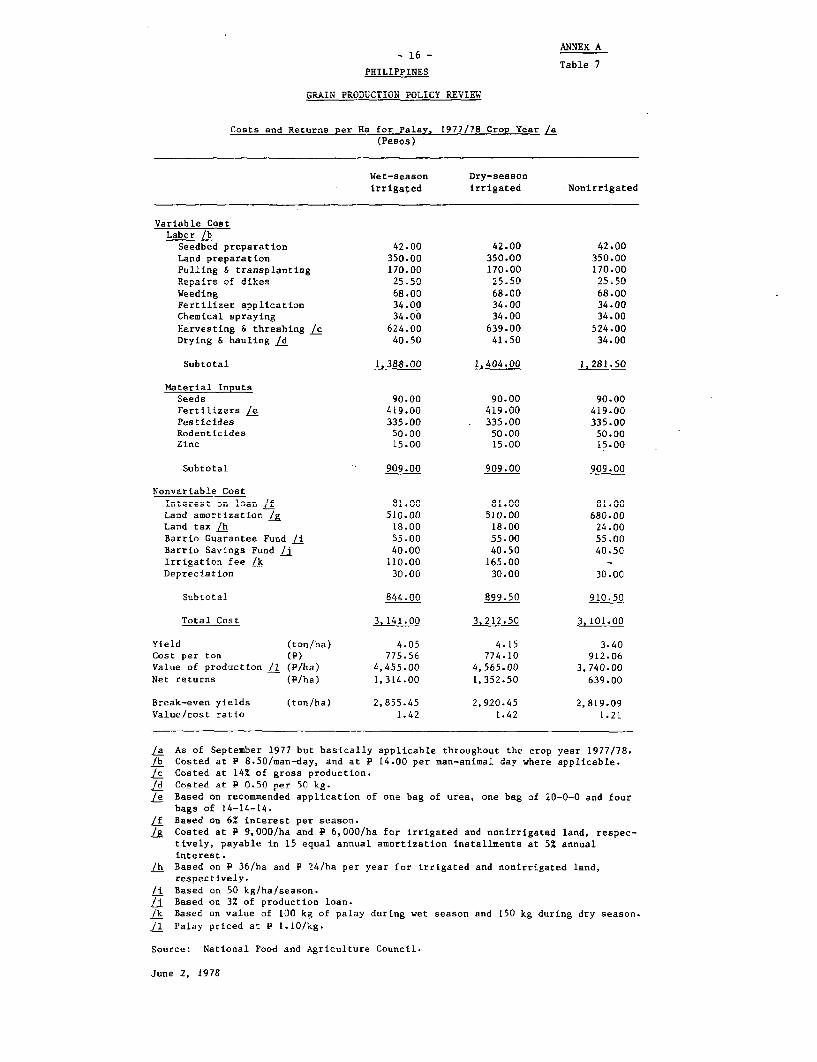
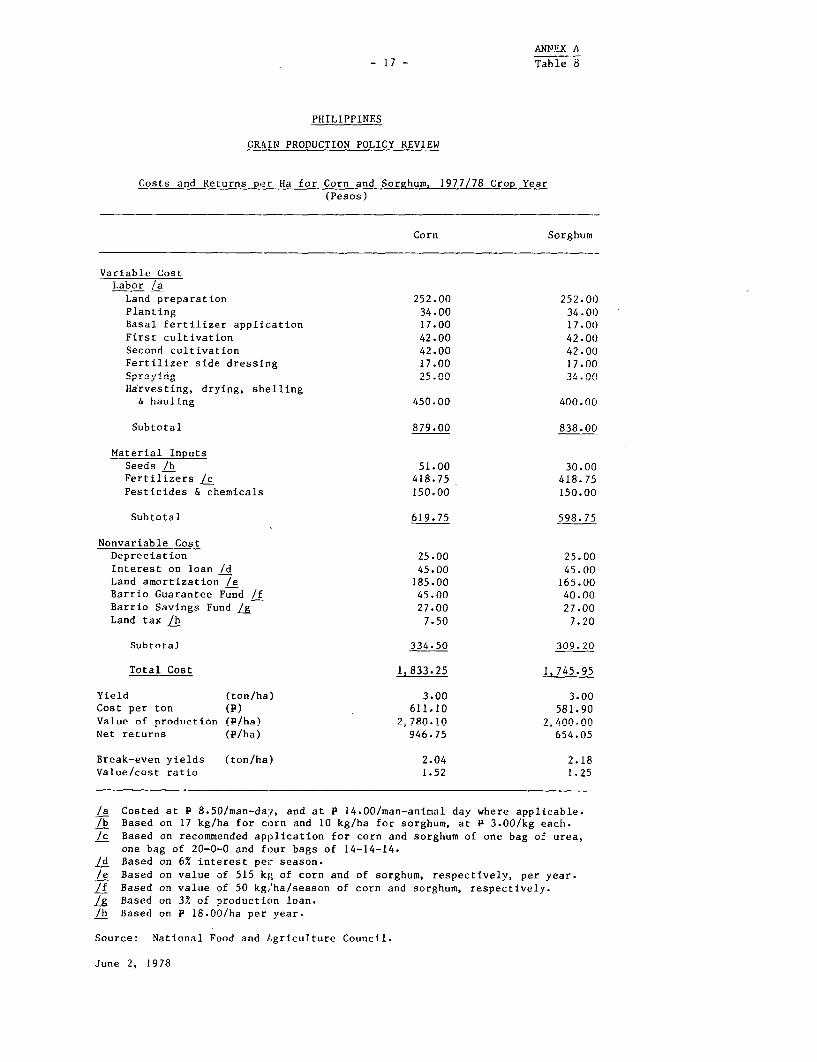
29. Little information is available on the statistical distribution ofpalay and corn farms by level of net income from the respective crops.Since the variation in yields and incomes is known to be large, even withinrelatively small and seemingly homogeneous areas, reported averages concealthe incidence both of failures and of high earners among palay and cornproducers. The National Eood and Agriculture Council (NFAC) has preparedindicative national crop budgets purported to reflect representative cost!return relationships. The budgets were arrived at by applying 1977 prices tothe government recommended package of production technology. A sumnary ofthese budgets appears in Annex A, Table 6.
30. The expected yield levels in these budgets, while achievable bysome farmers in certain areas, are far above present national averages forthese crops. Furthermore, costs and prices vary throughout the country whilethe budgets reflect the most favorable combination of these important factors.Since the physical response to the indicated input levels and husbandrypractices is insufficiently known throughout the country, and given thedegree of variability in yields and farm incomes in the sector, the reliabilityand usefulness of aggregate indicative crop budgets is limited. NFAC budgetsare presented in greater detail in Annex A, Table 7 for palay and Table 8 forcorn and sorghum.
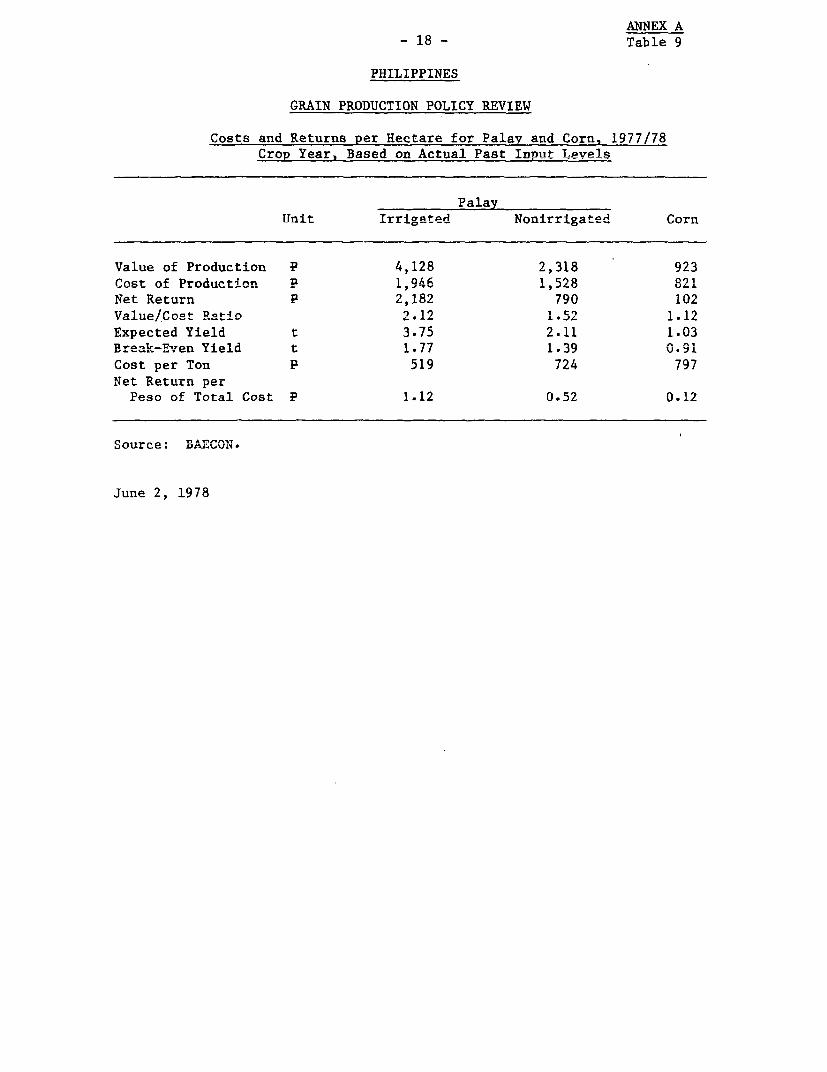
31. An alternative set of crop budgets was prepared by the Bureau ofAgricultural Economics usinag the results of the Bureau's 1974 survey ofphysical inputs costed at 1977 official prices (Annex A, Table 9). While thecost structure of these bulgets seems realistic when compared with survey

AMV.WY A
-8 - Page 8
data obtained from 1975-77, the assumed yield levels also far exceed theUat'LouaL averages, and-h uthe..derlying crop prices are higher t.han actual farmgate prices.
Production Response to Nitrogen and Farm Profitability
32. Because there are high risks of reduced yields and loss of outlaysfor fertilizer associated with grain production in the Phiiippines, incentivesto farmers to pursue advanced technology need to be quite high. In general,this suggests that as a rough rule of thumb, the expected value of incrementalproduction should be about 2.5 times the added costs of fertilizers.
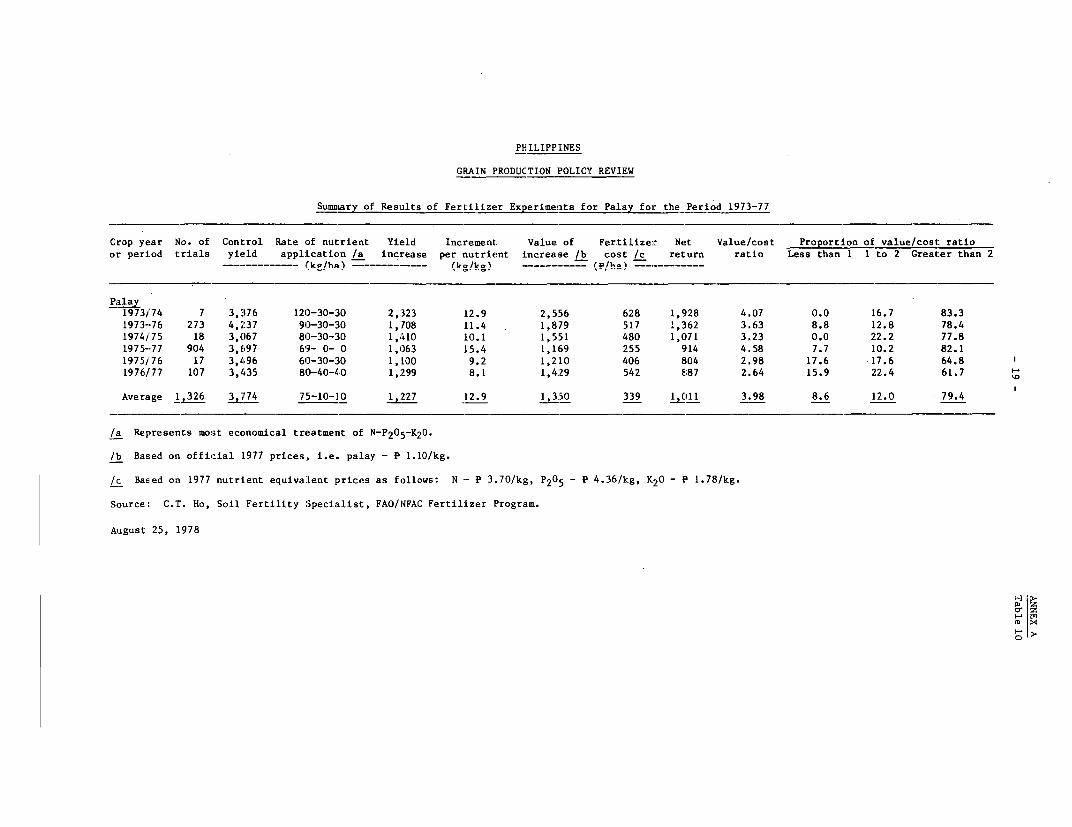
33. Production responses to fertilizer application are being investigatedunder the FAO/NFAC fertilizer program which became operational in 1972 withthe Bureau of Agricultural Extension as the executing agency. Under the program,field trials and demonstrations in farmers' fields had been carried out in morethan 3,000 sites by the end of 1977. The results of 1,326 rice trials aresummarized in Annex A, Table 10./1
34. For palay, on average for experiments in the crop years 1974-77,one kg of plant nutrient brought an increment of 12.9 kg of palay, althoughthe trend was downward, averaging 8.1 in the 1977 crop year. In the latteryear, the increase in value of palay over the cost of fertilizer was 2.64, butalmost 40% of the experiments showed a ratio of less than 2.0. It should benoted that the experimental yields shown are far higher than those obtained inactual farm practices.
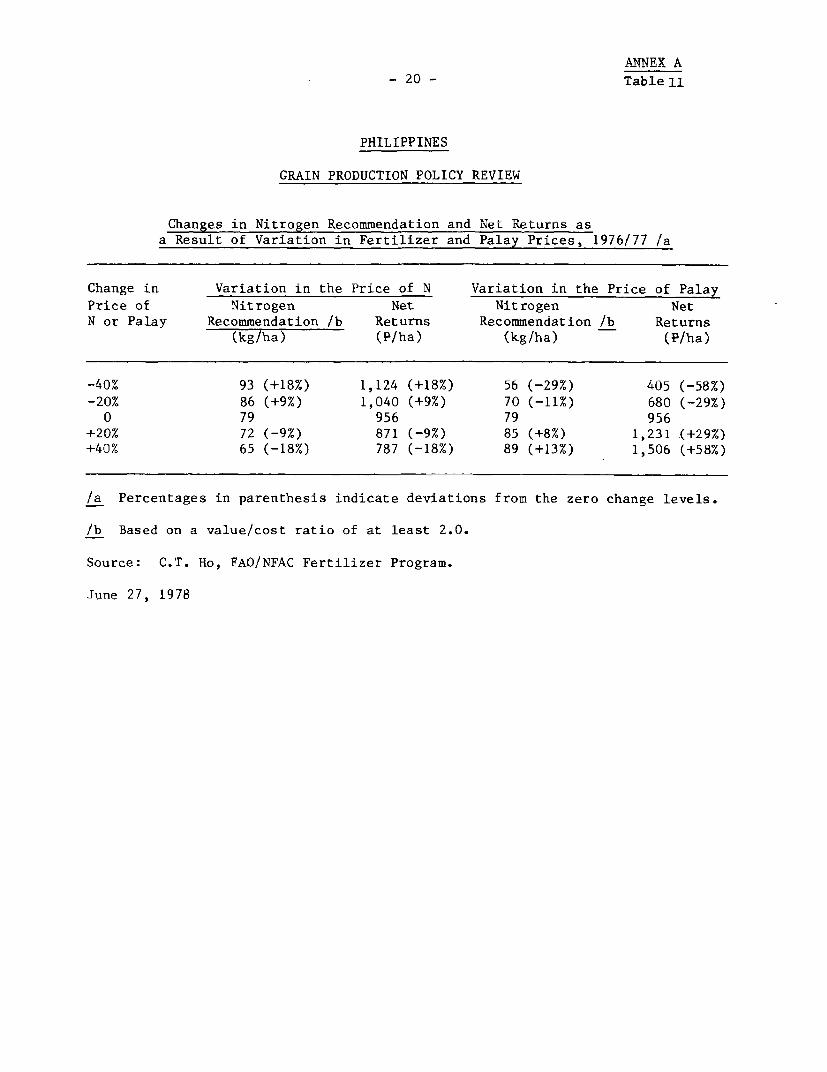
35. Actual profitability is less than indicated in these experimentaltrials since farmers generallv receive prices below the official supportprice. As would be expected, variations in the prices of palay induce greaterrhange8 nliiR or minus in npt rpturns than Asmilar ehanges in the nriePes offertilizers (Annex A, Table 11). This suggests that in improving the grain-fertilizer nrl rrla,tionnQhip, pnrpfprpnrp ho,ltid bp given tn raising grainprices.
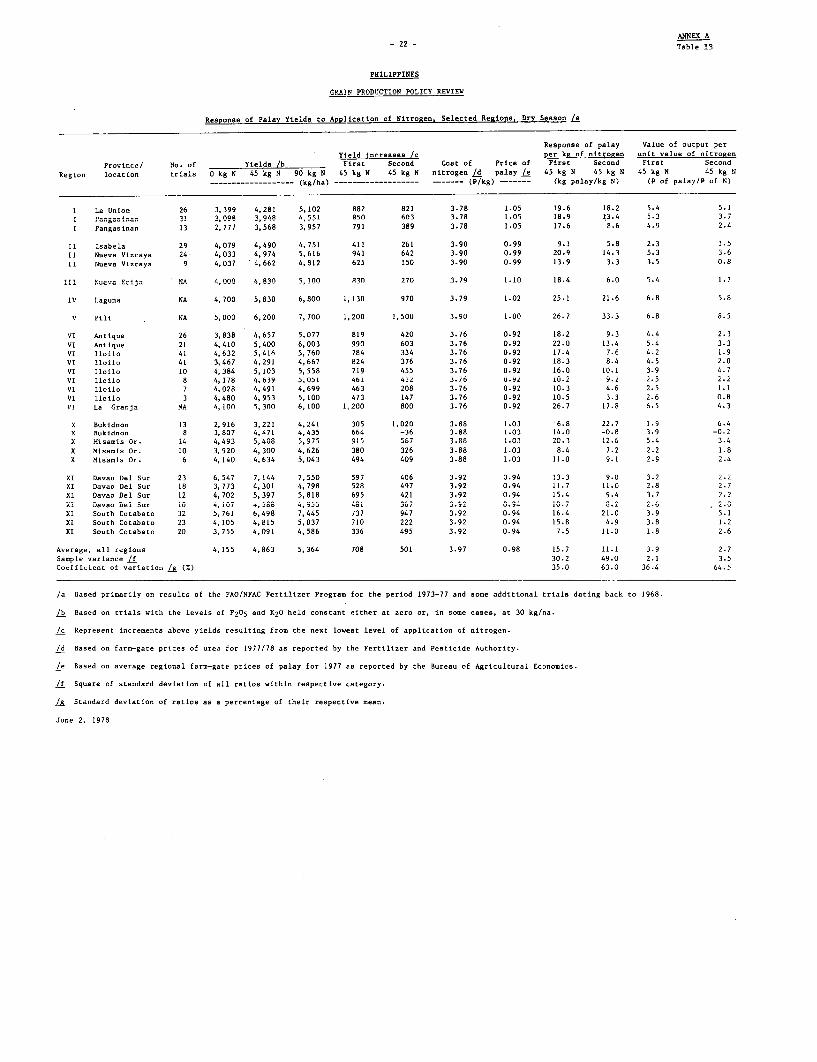
36. In considering the experimental findings above, it should be keptin mindLa t1hatal a.verag ee us L. of f S.,. pala is about 2) bags p er ha (4R kg
N). As shown in Annex A, Tables 12 and 13 for wet and dry season palay, the yieldresponse 'Lrom appLyi.g ar. adLLi.LrjL L. 2bags ol urea 'Ls significantly ess tLan
from the first 2 bags. At current fertilizer-palay price relationships, showniu T-ablie 7 Main Report, it ils uneconomcU tLU appyly aUUddlLtLoal f XL;XErtlizerL unless th eLUt
yield response is at least 9:1. A significant number of the trials listed showresponses below that level. Further, the incremental yields from increasinguse from 2 to 4 bags of fertilizer per ha as simulated by Rosegrant of IRRIfor dry season irrigated land are;
Lt This summary is trom C.T. Ho, economic Return Anailsis of Yieid Data underthe FAO/NFAC Fertilizer Program in the Philippines, Unpublished Paper, 1977.
ANNEX APage 9
kg of palay/kg of N
High quality irrigation 11.5Medium quality irrigation 8.2Low quality irrigation 7.6
and for wet season:
Irrigated 8.2Rainfed 6.1
37. In 1973, prices of nitrogen to the farmer were quite favorablerelative to farm prices of palay, averaging only a little more than 2:1 perkg. This was reflected in record consumption of fertilizer per ha of palay inthe 1973 crop year. With the sharp rise of fertilizer prices in 1974 increasingthe ratio to about 6:1, use of fertilizers per ha declined by about 13%from 1974 to 1976. As prices of fertilizers declined thereafter, use offertilizers on nalav increased but in the 1977 crop year was still about 5%below the peak use per ha in the 1974 crop year. The price ratios in 1977were still substntially h4gher than in 1973, ranging frnm ahniit- 3 in
Central Luzon to about 4:1 in Western Visayas, Southern and Western Mindanao,and the Cagayan Valley=
38. The relation cf fertilizer-palay prices is most favorable in CentralLuzon; farm prices for palay in 1976-77 were the highest among the regions,avreraging cs -- . 1r--n support lev e .4,4 in pr-4ice -4A for ferl-41z4 ers
were among the lowest. In the more remote regions - Cagayan Valley, Southernar.U Wes nLU ir.daLU.aoL, anLdUester LLL Visayas = LL. p e L palay ranLged 10-15%
below prices in Central Luzon, and prices of fertilizers were generallysLighlL.Ly uL ±guLer.
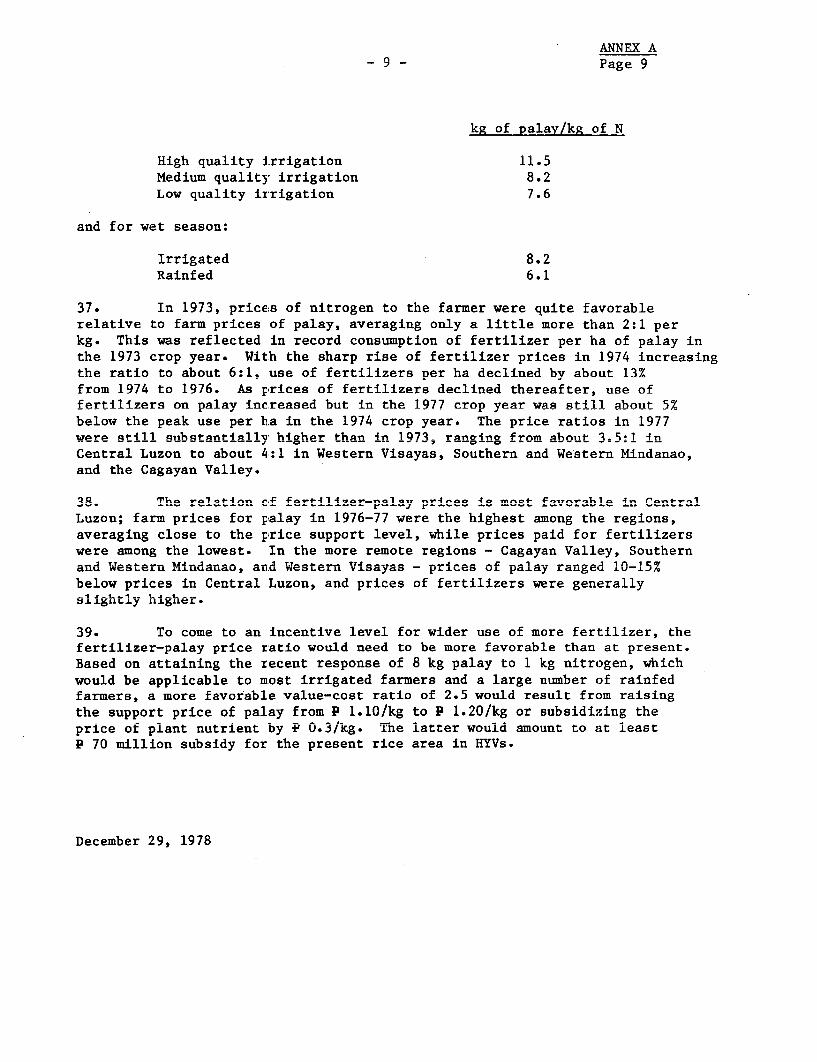
39. To come to an incentive level for wider use of more fertilizer, thefertilizer-palay price ratio would need to be more favorable than at present.Based on attaining the recent response of 8 kg palay to 1 kg nitrogen, wnichwould be applicable to most irrigated farmers and a large number of rainfedfarmers, a more favorable value-cost ratio of 2.5 would result from raisingthe support price of palay from P 1.10/kg to P 1.20/kg or subsidizing theprice of plant nutrient by e 0.3/kg. Tne iatter wouid amount to at ieastP 70 million subsidy for the present rice area in HYVs.
December 29, 1978

PHILIPPINES
GRAIN PRODUCTION POLICY REVIEW
Distribution of Stress Days Under Dififerent Qualities of Irrigation, 100 Simulated Seasons
Median seepage and percolation l lih seepage and percolation Low seepage ani percolationIrrigation MearL S,tress days, Stress days, MSean Stress days, Stress days, MeaLn Stress dayis, Stress dayEs,
Season qualLty streEss 0.20 0.10 stress 0.20 0.10 stress 0.20 O.]LOdays probability /a probability days probability /a. probability days probability /a probability
Dry lLigh 4.5' 8.2 10.4 9.6 13.6 15.6 2.6 3.5 5.3
Dry MSedium 9.7 14.7 18.0 15.1 19.4 21.0 5.2 8.7 12.2C)
Dry Low 15.0 21.1 22.4 18.8 21.4 24.0 9.0 15.8 19.4
Wet High 1.cl 2.5 3.1 4.7 7.3 9.1 1.5 2.3 2.4
Wet lSedium 2.1 3.1 3.8 7.9 11.3 13.0 1.6 2.4 2.6
Wet Low 2.2 3.4 4.3 9.9 13.7 15.4 1.8 2.5 3.2
Wet Rainfed 7.5 11.6 14.9 16.8 20.4 Z1.7 5.1 8.1 11.1
/a With 0.20 probability (one season in five) the number of streEss days will be equal to or greater than the number of stress daysgiven in this ccolumn. Stress days with 0.10 probabiLlity is interpreted similarly.
Source: M.W. Rosegrant, IRRI Paper No. 76-28, December 1976,.
June 27, L978
PHILIPPINES
GRAIN P'RODUCTION POLIC'Y REV'IEW
Yield of Modern Varieties, at Different Nitrogen Levels and Irrigation Qualities, Dry Season
Median seepage and percolation High seepag%e andI percolation Lw SeePae and iercolationNitrogen Expected Yield, 0.20 Yield, 0.10 Expected Yield, 0.20 Yield., 0.10 Expected Yield,, 0.20 Y'ield, 0.10
Irrigation level yield probability /a probability yield probability /a probaLbility yield probabi lity /aL probabilityquality (kg/ha) (kg/'ha) (kg/ha) (kg/ha) (kg/ha) (kg/ha) (kg/ha) (kg/ha) (kg/ha) (kg/ha)
Zero stress 120 4,093 4,093 4,093High 120 3,415 2,958 2,654 2,764 2,211 1,934 3,706 3,609 3,359Medium 120 2,751 2,059 1,602 2,003 1,408 1,187 3,373 2,889 2,405Low 120 2,017 1,173 993 1,491 1,131 771 2,847 1,906 1,408
Zero stress 80 3,749 3,749 3,749High 130 3,147 2,742 2,472 2,570 2,079 1,833 3,430 3,319 3,098Medium 80 2,558 1,944 13,539 1,894 1,367 1,170 3,110 2,681 2,251Low 130 1,5107 1,158 998 1,440 1,121 802 2,644 1,1309 1,366
Zero stress 40 3,213 3,213 3,213High 40 2,688 2,334 2,098 2,184 1,755 1,541 2,934 2,838 2,645IMedium 40 2,173 1,637 1,283 1,594 1,133 962 2,656 2,280 1,905Low 40 1,605 951 812 1,198 919 6 40 2,248 1,519 1,133
/a With 0.20 probability (one season in five) yield will be equal to or less than the amounts given in this column.Yield with 0.10 probability is interpreted similarly.
Source: M.W. Rosegrant, IRRI P'aper No. 76-28, December 1976.
June 27, 1978
a1 D
PHILIPPINE S
GRAIN PRCDUCTION POLICY REVIEW
Y:Leld of Modern Varieties at Difi.erent Nitrogen Levels, Wet: Season IrriRated and Rain,fed
Median seepage and percolation _High seepaite andl percolation _ Low seepaRge and percolationNitrogen Expected Yield, 0.20 Yie:Ld, 0.10 Expected Yield, 0.20 Yield, 0.10 Expected Yield, 0.20 YiLeld, 0.10
Irrigation level yield probability /a probabiliLty yield probability /a probability yield probability ,a probabilityquality (kg/ha) (kg/ha) (kg/ha) (kg/ha) (kg/ha) (kg/ha) (kg/ha) (kg/ha) (kg/ha) (kg/ha)
Zero stress 120 3,277 3,277Irrigated 120 3,ti78 2,984 :2,918 2,529 2,208 2,047 :3,126 3,050 3,031Rainfed 120 2,568 2,180 L,867 1,688 1,347 1,224 .2,795 2,511 2,227
Zero stress 80 3,109 3,109 :3,109Irrigated 80 2,'343 2,864 2,809 2,485 2,216 2,082 2,983 2,919 2,904RainfEed 80 2,517 2,193 L,932 1,782 L,497 1,395 2,706 2,469 2,232
Zero stresis 40 2,749 2,749 2,749Irrigated 40 2, 616 2,552 '2,509 2,248 :2,033 1,925 2,648 2,597 2,5834RainfEed 40 2,274 2,014 L,804 1,684 L,456 1,373 2,426 2,235 2,045
/a With 0.20 probability (one season in five) yield will be equal to or less than the amounts given in this column.Yield with 0.10 probability is interpreted similarly.
Source: M.W. Rosegrant, IRRI Paper No. 76-28, December :1976.
June 27, 1.978
(D X4u-. >1
ANNEX A
-13- Table 4
PHILIPPINES
GRAIN PRODUCTION POLICY REVIEW
Sumnary of Cost and Returns Studies for Palay, 1975-77
No. Range of Range of Average RangeStudy of studies value/cost break-even regional of cost of
Region years reviewed /a ratios /b yields /c yield production /d------- (ton/ha) ------- (P/ha)
IrrieatedI. Ilocos 1975 4 0.87-1.39 1.18-1.38 1.49 1,106-1,229
1976 2 0.52-0.88 2.68-3.46 1.93 2,849-3,4671977 i 0.94 2.48 1.89 2,930
II. Cagayan Valley 1975 4 1.23-1.39 1.29-2.93 2.00 1,304-2,440
III. Central Luzon 1976 3 0.50-0.86 1.80-2.77 2.32 1,858-2,9641977 2 0.87-0.98 2.69-3.10 2.73 3,048-3,398
IV. Southern Tagalog 1975 2 1.42-1.53 1.85-2.78 2.23 2,501-3,1311976 1 1.29 1.74 2.31 1,862
VI. Western Visayas 1975 6 0.99-1.33 1.70-2.52 2.40 1,654-2,368
VII. Central Visayas 1975 2 1.29-1.37 1.60-1.70 1.83 1,430-1,503
VIII. Eastern Visayas 1975 2 1.53-2.0 1.28-1.60 1.91 1,399-1,750
Xa Northern Mindanao 1976 1 2.39-3.1 1.26-1.59 .70 1,048-1,347
XI. Southern Mindanao 1976 2 2.18-2.44 1.20-1.26 2.74 1,051-1,073
NonirrigatedI. Ilocos 1975 3 0.77-1.13 0.81-1.59 1.11 628-1,400
II. Cagayan Valley 1975 2 1.43 1.17-1.36 [.52 1,132-1,151
VI. Western Visayas 1975 6 1.04-1.32 1.38-2.43 1.45 1,342-2,281
'vlI. Central Visayas 1975 2 1.03-1.12 1.59-1.66 1.17 1,490-1,578
VIII. Eastern Visayas 1975 2 1.18-1.54 0.47-0.71 1.04 469- 654
X. Northern Mindanao 1976 1 1.25-1.62 1.56-1.85 1.26 1,290-1,647
XI. Southern Mindanao 1976 2 1.76-2.13 0.81-0.94 ].05 770- 784
/a Includes primarily studies conducted by staff of IRRI, the Special Studies Division of the Department of Agricul-ture, the University of the Philippines and the Bureau of Agricultural Economics.
/b The ratios have been computed by dividing the value of palay produced by total cost of production; prices andcosts used in the valuation refer to the time and place of the respective studies.
/c Break-even yields have been derived by dividing total cost of production by the effective price of palay.
/d Calculation of the cost of production is not strictly comparable among the studies. Generally, variable costsinclude all required labor regardless whether hired or supplied by the farmer's family, and material inputs;nonvariable costs include interest on loans, land rent and taxes, barrio fund levies, depreciation and irrigationfees.
June 27, 1978

PHILIPPINES
GRAIN PRODUCT]ION POLICY RE'VIEW
Summary of Cost and Returns Studies for Corn, 1975-77
No. Range of Range of ALverage Range
Study of studies value/cost break-even regional of cost of
Region years reviewed /a ratios /b yields /C yield production /d(ton/ha) -------- (P/ha)
I. Ilocos 1975 2 1.1.3-1.43 0.47-0.81 0.50 :377- 628
1976 2 0.51-1.13 0.58-1.58 0.50 436-1,595
1977 1 0.88 0.99 0.'56 1,078
II. Cagayan Val:Ley 1975 3 0.33-1.25 0.78-0.94 0. 80 783- 940
III. Central Luzon 1976 1 0.90 1.06 0.64 877
1977 1 0.62 0.57 0.7i1 504
VI. Western Visayas 1975 4 0.47-1.39 0.62-1.42 0.64 489-1, 316
VII. Central Visayas 1975 2 1.06-2.65 0.37-0.72 0.5iO 362- 71CI
XI. Southern Mindanao 1976 3 1.91-2.08 0.59-0.70 1.33 447- 548
/a Includes primarily studlies conducted by staf f of IRRI, the Special Studies Division of the Department of Agricul-
tLure, the University of the Philipp-ines and the Bureau of- Agricultural Economics.
/b Tlhe ratios have been computed by dividing the value of palay produced by total. cost of production; prices and
costs used in the valuation refer to the tirrie and place of the respective studlies.
/c_ Break-even yields have been derived by dlividing total cost of production by the effective price of palay.
/d Calculation of the cost of production is not strictly comparable among the studies. Generally, variable costs
include all required labor regardless whether hired Dr supplied by thle farmer's family, andi material inputs; ra x
nonvariable costs include interest on loans, land rent and taxes, barrio fund levies, depreciation and irrigation n >
fees .
June 2, 1978
ANNEX A-15 - Table 6
PHILIPPINES
GRAIN PRODUCTION POLICY REVIEW
Costs and Returns per Hectare for Grains, 1977/78 Crop Year,Based on Recommended Innut Levels
T!JPt 5A,M 1n Pv Sna
Ur3it Irrigated Irrigated Nonirrigated Corn Sorghum
Valu e of Poductio n A, , 4 5R n 4,56 3 0 27
Cost of Production P 3,142 3,213 3,101 1,833 1,746£LII L%=4LU.L" J. UUf UJ"t
Value/Cost Ratio 1.42 1.42 1.21 1.47 1.37apected Yield : 4.0~ ~ ~~~~ ~ ~~~~5 4.' 34 30 30
Break-Even Yield t 2.86 2.92 2.82 2.04 2.18Cost per Ton I 776 774 912 611 582Net Return per
Peso of Total Cost P 0.42 0.42 0.21 0.47 0.37
Source: NFAC
June 2, 1978
ANNEX A-16 -
Table 7PHILIPPINES
GRAIN PRODUCTIOn POLICY REVIEw
Costs and Returns per Ha for Palay. 1977/78 Crop Year /a(Pesos)
Wet-season Dry-season
irrigated irrigated NonirrigLated
Variable CostLabor /b
Seedbed preparation 42.00 42.00 42.00Land preparation 350.00 350.00 350.00Pulling &, transplanting 170.00 170.00 170.00Repairs of dikes 25.50 25.50 25.50Weeding 68.00 68.00 68.00Fertilizer application 34.00 34.00 34.00Chemical spraying 34.00 34.00 34.00
Harvesting & threshing /C 624.00 639.00 524.00Drying & hauling /d 40.50 41.50 34.00
Subtotal 1,388.00 1,404.00 1,281.50
Material InputsSeeds 90.00 90.00 90-00Fertilizers /e 419.00 419.00 419.00Pesticides 335.00 335.00 335.00Rodenticides 50.00 50.00 50.00Zinc 15.00 15.00 15.00
Subtotal 909.00 909.00 909.00
Nonvariable Cost…----es or. la /f 8. 810 81
Land amortization /9 510.00 510.00 680.00Land tax /h 18.00 18.00 24.00Barrio Guarantee Fund /i 55.00 55.00 55.00Barrio Savings Fund Li 40.00 40.50 40.50Irrigation fee /k 110.00 165-00 -Depreciation 30.00 30-00 30.00
Subtotal 844.00 n899.50 910.50
Total Cost 3,141.00 3,212.50 3,101.00
Yield (ton/ha) 4.05 4.15 3.40Cost per ton (P) 775.56 774.10 912.06Value of production /1 (P/ha) 4,455.00 4,565.00 3,740.00
Net returns (P/ha) 1,314.00 1,352.50 639.00
Break-even yields (ton/ha) 2,855.45 2,920.45 2,819.09Value/cost ratio 1.42 1.42 1.21
/a As of September 1977 but basically applicable throughout the crop year 1977/78./b Costed at P 8.50/man-day, and at P 14.00 per man-animal day where applicable./c Costed at 14% of gross production.Id CoRted at P 0.50 ner Sn ka./e Based on recommended application of one bag of urea, one bag of 20-0-0 and four
bags of 14-14-14.Lf Based on 6% interest per season./g Costed at P 9,000/ba and P 6,000/ba for irrigated and nonirrigated land, respec-
tively, payable in 15 equal annual amortization installments at 51 annualinterest.
/h Based on P 36/ha and P 24/ha per year for irrigated and nonirrigated land,respectively.
fi Based on 50 kg/ha/season./j Based on 3% of production loan.ifk Based an value of 100 kg of palay during *zet season and 150 kg during dry season.
/1 Palay priced at P 1.10/kg.
Source: National Food and Agriculture Council.
June 2, 1978
ANNEX A
-17 - Tabie 8
PHILIPPINES
GRAIN PRODUCTION POLICY REVIEW
Costs and Returns per Ha for Corn and Sorghum, 1977/78 Crop Year(Pesos)
Corn Sorghum
Variable CostLabor /a
Land preparation 252.00 252.00Plantrin 34.00 34.00Basal fertilizer application 17.00 17.00First cultivation 42.00 42.00Second cultivation 42.00 42.00Fertilizer side dressing 17.00 17.00SprayinIg 250 nn 34. 0Harvesting, drying, shelling& hauling 450.00 400.00
Subtotal 879.00 838.00
Material InputsSeeds /b 51.00 30.00Fertilizers /c 418.75 418.75Pesticides & chemicals 150.00 150.00
Subtotal 619.75 598.75
Nonvariable CostDepreciation 25.00 25.00Interest on loan /d 45.00 45.00Land amortization /e 185.00 165.00Barrio Guarantee Fund /f 45.00 40.00Barrio Savings Fund /g 27.00 27.00Land tax /h 7.50 7.20
Subtotal 334.50 309.20
Total Cost 1,833.25 1,745.95
Yield (ton/ha) 3.00 3.00Cost per ton (P) 611.10 581.90Value nf nroduction (PIha) 2j7R0.10 2,400.00Net returns (P/ha) 946.75 654.05
Break-even yields (toniha) 2.04 2.18Value/cost ratio 1.52 1.25
/a Costed at P 8.50/man-day, and at P 14.00/man-animal day where applicable./b Based on 17 kg/ha for corn and 10 kg/ha for sorghum, at P 3.00/kg each./c Based on recommended application for corn and sorghum of one bag of urea,
one hba of 20n-0-0 an f--r hbag of !4-14-14.
/d Based on 6% interest per season./e Based on value of 515 kg of corn and of sorghum, respectively, per year.If Based on value of 50 kg,'ha/season of corn and sorghum, respectively./g Based on 3% of production loan./h Based on P 18.00/ha per year.
Source: National Food and Agriculture Council.
June 2, 1978
ANNEX A- 18 - Table 9
PHILIPPINES
GRAIN PRODUCTION POLICY REVIEW
Costs and Returns per Hectare for Palay and Corn, 1977/78Crop Year. Based on Actual Past Input Levels
PalayUnit Trrigated Nonirrigated Corn
Value of Production P 4,128 2,318 923Cost of Production P 1,946 1,528 821Net Return P 2,182 790 102Value/Cost Ratio 2.12 1.52 1.12Expected Yield t 3.75 2.11 1.03Break-Even Yield 177 1.39 0.91Cost per Ton P 519 724 797Net 'Returnl per
Peso of Total Cost P 1.12 0.52 0.12
- f A - - - -Source; DZIXI.UIX
June 2, 1978
PHILIPPINES
GRAIN PRODUCTION POLICY REVIEW
Summary of Results of Fertilizer Experiments for Palay for the Period 1973-77
Crop year No. of Control Rate of nutrient Yield Increment Value of Fertilizer Net Value/cost Proport:Lon of value/cost: ratioor period trials yield applLcation /a increase per nutrient increase /b cost /c return rat:io Less than 1 1 to 2 Greater than 2
_ ,_______ ikp/ha)!=-- (kgNg)° ---------- = rP!v =-------
Palay
1973/74 7 3,376 120-30-30 2,323 12.9 2,556 628 1,928 4.07 0.0 16.7 83.31973--76 273 4,237 90-30-30 1,'708 11.4 1,879 517 1,362 3.63 8.8 12.8 78.41974/'75 18 3,067 80-30-30 1,410 10.1 1,551 480 1,071 3.23 0.0 22.2 77.81975--77 904 3,697 6'3- 0- 0 1,063 15.4 1,1659 255 9I14 4.58 7.7 10.2 82.11975/76 17 3,496 60-30-30 1,LOO 9.2 1,210 406 E804 2.98 17.6 17.6 64.81976/77 107 3,435 80-40-40 1,299 8.1 1,429 542 E887 2.64 15.9 22.4 61.7
AveraLge 1,326 3,774
75-10-10 1,227 12.9 1,350 339 1,CIl1 3.98 8.6 12.0 79.4
/a Represents most economical treatment of N-P 2 0,5-K2 0.
/b Based on official 1977 prices, i.e. palay - P 1.10/kg.
/c Based on 1977 nutrient equivalent prices as follows: N -- P 3.70/kg, P2 0,5 - P 4.36/kg, K90 - P 1.78/kg.
Source: C.T. Ho, Soil Fertility Specialist, FAO/NFAC Fertilizer P'rogram.
Auigust 25, 1978
AWEX A
- 20 - Table ll
PHILIPPINES
GRAIN PRODUCTION POLICY REVIEW
Changes in Nitrogen Recommendation ana Net Returns asa Result of Variation in Fertilizer and Palay Prices, 1976177 /a
Change in Variation in the Price of N Variation in the Price of Paiay
Price of Nitrogen Net Nitrogen Net
N or Palay Recommendation /b Returns Recommendation lb Returns
(kg/ha) (P/ha) (kg/ha) (P/ha)
-40% 93 (+18%) 1,124 (+18%) 56 (-29%) 405 (-58%)
-20% 86 (+9%) 1,040 (+9%) 70 (-11%) 680 (-29%)
0 79 956 79 956
+20% 72 (-9%) 871 (-9%) 85 (+8%) 1,231 (+29%)
+40% 65 (-18%) 787 (-18%) 89 (+13%) 1,506 (+58%)
/a Percentages in parenthesis indicate deviations from the zero change levels.
/b Based on a value/cost ratio of at least 2.0.
Source: C.T. Ho. FAO/NFAC Fertilizer Program.
June 27. 1978

PHILIPPINE!
GRAIN PRODIUCTION POLLCY REVIEW
Response of Palay Yields to Application of Nitrogen, Selected Regions, Wet Season /a
Response of palay Value of output perYiLeld increases /c per kg of nitrogen unit value of nitroenPlrovince/ Nco. of Yields lb First Second Cost of Price of First Second First SecondRegion location trials 0 kg N 45 kg N CO kg N 45 kg NT 45 kg N nitrogen /d palaly /e 45 kg N 45 kg N 45 kg N 45 kg N__ _______________-(kg/ha) ------- ------- (P/kg) (kg palay/kg N) (PF of palay/P of N)
II IsEibels 20 3,789 4,361 4,570 572 209 3.90 0.99 12.7 4.6 3.2 1.2II Isabela 11 3,704 4,265 4,631 561 366 3.90 0.99 12.5 8.1 3.2 2.1II Isabela 11 4,300 4,754 4,809 454 55 3.90 0.99 10.1 1.2 2.6 0.3II Nueva Vizcaya 25 2,967 3,589 3,668 622 79 3.90 0.99 13.8 1.8 3-. 0-4II Nueva Vizcaya 26 3,115 3,941 4,382 826 441 3.90 0.99 18.4 9.8 4.6 2.5II Nueva Vizcaya 12 2,818 3,479 3,965 661 486 3.90 0.99 14.7 10.8 3.7 2.7
III Nueva Ecija NA 3,1300 4,850 5,100 1,050 250 3.79 1.10 23.3 5.5 6.8 1.6
IV Laguna NA 4,000 4,350 4,400 350 50 3.79 1.02 7.8 1.1 2.1 0.3
V Pili NA 3, 500 4,100 4,500 600 400 3.90 0.99 13.3 8.9 3.4 2.3 r
VI Iloilo 26 4,880 5,775 6,363 895 588 3.76 0.92 19.9 13.1 4.8 3.2VI Iloilo 3 4,037 4,945 5,330 908 385 3.76 0.92 20.2 8.6 4..9 2.1VI, Iloilo 39 4,2397 5,321 5,900 924 579 3.76 0.92 2D.5 12.9 5.0 3.1VI Iloilo 9 4,1526 5,203 5,799 577 596 3.76 0.92 12.8 13.2 3.1 3.2VI GuiLmaras Island 3 4,103 4,967 5,033 864 66 3.76 0.92 19.2 1.5 4.7 0.4VI Guiimaras Island 8 3,358 3,671 3,830 313 159 3.76 0.92 7.0 3.5 1.7 0.9VI Antique 13 5,253 6,279 7,270 1,026 991 3.76 0.92 22.8 22.0 5.6 5 4VI AntWique 28 3,928 4,706 5,420 778 714 3.76 0.92 17.3 15.9 4.2 3.9VI La Granja NA 3,800 5,100 6,100 1,300 1,000 3.76 0.92 28.8 22.2 7.0 5.4
X Misamis Oriental 7 5,026 5,645 6,153 619 508 3.88 1.03 13.8 11.3 3.7 3.0
XI Davao Del Sur 17 5,262 5,741 6,522 479 781 3.92 0,94 13.3 9.0 3.9 5.1XI Davao Del Sur 28 5, 204 5,852 6,232 648 380 3.92 0.94 14.4 8.4 3.5 2.0
Average, all regions 4,089 4,804 5,237 715 433 3.83 0.96 15.9 9.6 4.0 2.4Sample variLance /f 29.0 37.2 1.8 2.6Coefficient of variation /L (x) 33.6 66.2 33.4 65.8
/a Based primarily on results of the FAO/NFAC Fertilizer Prograim for the period 1973--77 and some additional trials dating back to 19618./b Based on trials with the levels oif P2 0g, and K20 held constant either at zero or, iDn some cases, at 30 kg/ha./c Represent increments above yields resulting from the next lowest :Level of application of nitrogen./d Based on farm-gate prices of urea for 1977/78 as reported by the Fertilizer and Pesticide Authority./e Based on average regional farm-gate prices of palsy for 1977 as reported by the Buireau of Agricult:ural Economics./f Square of standard deviation of all ratios within respective category./g Standard deviation of ratios as a percentage of their respective mean.
June 2, 1978
ANNEX A- 22 - Table 13
PHILIPPINES
GRA1Y pRODUCTlON POLTCY REYVIE
Response of Palay Yields to Application of Nitrogen, Selected Regions, Dry Season /a
Response of palay Value of output per
Yield incrennne ...oe kA of nitrosen. unit value of nitro.en
Province/ No. of Yields /b First Second Cost of Price of First Second First Second
Region location trials 0 kg N 45 kg N 90 kg N 45 kg N 45 kg N nitrogen /d palay /e 45 kg N 45 kg N 45 kg N 45 kg N------------------ (kg/ha) ------------------- - (P/kg) ------- (kg palay/kg N) (P of palsy/P of N)
I La Union 26 3,399 4,281 5,102 882 821 3.78 1.05 19.6 18.2 5.4 5.1I Par.gastr.an 3! 3,098 3,948 4,551 850 603 3.78 1.05 18.9 13.4 5.3 3.7
I Pangasinan 13 2,777 3,568 3,957 791 389 3.78 1.05 17.6 8.6 4.9 2.4
II Isabela 29 4,079 4,490 4,751 411 261 3.90 0.99 9.1 5.8 2.3 1.5
I1 Nueva Vizcaya 24- 4,033 4,974 5.616 941 642 3.90 0.99 20.9 i4.3 5.3 3.6
II Nueva Vitcaya 9 4.037 4.662 4,812 625 150 3.90 0.99 13.9 3.3 3.5 0.8
III Nue-:a Eci3a NA 4,000 4,8830 SjlO 830 270 3.79 1.10 18.4 6.0 5.4 1.7
IV Laguna NA 4,700 5,830 6,800 1,130 970 3.79 1.02 25.1 21.6 6.8 5.8
V Pili NA 5,000 6,200 7,700 1,200 1,500 3.90 1.00 26.7 33.3 6.8 8.5
VI Antique 26 3,838 4,657 5,077 819 420 3.76 0.92 18.2 9.3 4.4 2.3
Vi An tique 21 4,410 5,400 6i003 990 603 3.76 0.92 22.0 13.4 5.4 3.3
VI Iloilo 41 4,632 5,416 5,760 784 334 3.76 0.92 17.4 7.6 4.2 1.9
VI iloilo 41 3,467 4,291 4,667 824 376 3.76 0.92 18.3 8.4 4.5 2.0
VI Iloilo 10 4,384 5,103 5,558 719 455 3.76 0.92 16.0 10.1 3.9 4.7VI lIoilo 8 4,178 4,639 5,051 461 412 3.76 0.92 10.2 9.2 2.5 2.2
VI Iloilo 7 4,028 4,491 4,699 463 208 3.76 0.92 10.3 4.6 2.5 1.1
VI Iloilo 3 4,480 4,953 5,100 473 147 3.76 0.92 10.5 3.3 2.6 0.8VT La iranja NA 4l100 5,300 6 100 1,200 800 3.76 0.92 26.7 17.8 6.5 4.3
X Bukidnon 13 2,916 3,221 4,241 305 1,020 3.88 1.03 6.8 22.7 1.9 6.4X Bukidnon 8 3,807 4,471 4,435 664 -36 3.88 1.03 14.0 -0.8 3.9 -0.2
X Misaoin Or. .4 4,493 5,408 5,975 915 567 ;.88 1.03 20.3
X Misanis Or. 10 3,920 4,300 4,626 380 326 3.88 1.03 8.4 7.2 2.2 1.8
X Misamis Or. 6 4,140 4,634 5,043 494 409 3.88 1.03 11.0 9.1 2.9 2.4
Xi Davao Del Sur 23 6,547 7,144 7,550 597 406 3.92 0.94 13.3 9.0 3.2 2.2XI Davao Del Sur 18 3,773 4,301 4,798 528 497 3.92 0.94 11.7 11.0 2.8 2.7
XI Davao Del Sur 12 4,702 5,397 5,818 695 421 3.92 0.94 15.4 9.4 3.7 2.2
Xi Davao Del ur 10 4, 107 4,588 4,955 481 367 3.92 0.94 10.7 8.2 2.6 2.0
Xl South Cotabato 32 5,761 6,498 7,445 737 947 3.92 0.94 16.4 21.0 3.9 5.1
Xi South Cotabato 23 4,105 4,815 5,037 710 222 3.92 0.94 15.8 4.9 3.8 1.2
XI South Cotahato 20 3,755 4,091 4,586 336 495 3.92 0.94 7.5 11.0 1.8 2.6
Average, all regions 4,155 4,863 5,364 708 501 3.97 0.98 15.7 11.1 3.9 2.7
Sample variance /f 30.2 49.0 2.1 3.5
C-ffi,;<;ei-t of a o, -(7,) 35.0 63.0 36.4 64.5
/a Based primarily on results of the FAO/NFAC Fertili.er Program for the period 1973-77 and sone additional trials dating back to 1968.
/b Based on trials with the levels of P2 05and K2 0 held constant either at cer. or, in sose cases, at 30 kg/ha.
/L Represent increments above yIelds resulting from the next lowest levei of appl.cation of nitrogen.
/d Based on faro-gate prices of orea for 1977/78 as reported by the Fertilieer and Pesticide Authority.
/e Based on average regional farn-gate prices of palay for 1977 as reported by the Bureau of Agricultural Economics.
/f Square of standard deviation of all ratios within respective category.
/A Standard deviation of ratios as a percentage of their respective mean.
.June 2, 1978
ANNEX B
- 23 - Page 1
PHILIPPINES
GRAIN PRODUCTION POLICY REVIEW
The Demand for Grains
1. The maior foodgrains - rice, corn, and wheat - have always been
the primary source of energy and nutrients for the Philippine population.
In 1975, thev provided 64% of total calories and 43% of total grams of
protein consumed./l Both rice and corn are generally consumed in raw milled
form, whereas wheat is consumed mainly in the form of bakery goods. White
corn is preferred for human consumption, and yellow corn is preferred for
feed use (although both types are currently used for feed). In addition,
corn, sorghum and grain byproducts have become increasingly important in
recent years as bulk feedstuffs for -oultrv and hogs raised in both hackvard
and commercial units. Some corn and wheat is also processed into inter-
medi4ate r.on-foA goods 3uch as cornstarch and glue, but the total amounts
involved are relatively small.
2. Historically, imports of cereals have been necessary to supplement
domest'c production; ir, the early fifi the value of cereal imports was lO0
of total import value. Cereal imports have tended to cost the Government
roughly twice that of dairy product imports, the second major food import.In recent years, however, the share of cereals in total import value has
been reduced to less thnan five percent, due to tiLe increasing importance
of industrial imports a:; well as to increasing domestic production of rice
spurred by tne self-sufificiency programs of the Government. During the
seventies, rice imports which were as high as 569,000 tons in 1965, have been
gradually reduced and, in good years, even replaced by exports, e.g. over
90,000 tons in 1978. On the other hand, other cereal imports have shown no
consistent decreasing trend despite increased domestic production of corn anrd
increasing retail prices of wheat, a cereal not currently produced in the
Philippines./2 Although the Philippines has approached self-sufficiency
levels in rice and white corn in recent years, imports of wheat, yellow corn
and sorghum remain high (see Table i). Tnus, prospects for decreased foreign
exchange savings as well as higher farmer incomes will depend as much on
future trends in domestic grain consumption as on the potential for continued
increased production through irrigation, extension and development of new
technology.
3. Data on grain consumption in the Philippines are available from
several different sources, including census and survey data. Long-term
availability data, often used as a surrogate for consumption, is estimated
/1 See Food Balance Sheets, 1953-75, National Economic and Development
Authority (NEDA), Manila, Philippines.
/2 Research into the potential of wheat production in certain areas is
being conducted; however, the climate in the Philippines is not
generally suitable, and whatever wheat production may be possible
is not expected to reduce import requirements significantly.
ANNEX B2 24- Page 2
through disappearance methods and summarized in food balances by the Bureauof Agricultural Economics (BAEcon) and by the National Economics and Develop-ment Authority (NEDA). The Food and Agricultural Organization (FAO) hasalso compiled provisional food balances for the Philippines for the periods1960-1962 and 1972-1974. In addition, survey data on per capita consumptionis available from four different sources: National Food and AgricultureCouncil (NFAC) surveys of food consumption conducted in the seventies; calorieintake surveys of the Food and Nutrition Research Center (FNRC) conductedduring the fifties and sixties and late seventies; Family Income and ExpenditureSurveys (FIES) conducted by the National Census and Statistics Office (NCSO)for the years 1961, 1965, 1971, and 1975; and surveys of consumption of riceand corn conducted by the National Grains Authority in 1975 and 1976. Becauseof inconsistencies between disappearance data and survey data, the two datasources are used for different purposes in this report./1 The discussion ofaggregate trends in the first section of this annex relies on the disappearancedata, which are consistent with production and stocks data. The latter nartof the annex, however, which examines the structure of demand, relies primarilyon the survey data.
Past Trends in Grain ConsumDtion
4. The sixtieq and spuenties saw major improvements inr availailityof grain for food, feed and manufacture. While population and annual calorierq-uiirpmentQ Drew by an averao annniinl rate of 3% frnm 1QA0 to- 1070, d44
appearance of rice, corn, and wheat grew by 3.9%, 5.2% and 2.2% respectively./2The experience f rnm 1q7n 0t 1Q77 was less favorable, reflecting majr dr oAp_
r -~ ---- LVs |bX - -- -11, -- J-- - - L - U'Up
in consumption in 1972/73 which accompanied the production shortfall broughton by typhoon and floods. Du r ing L t'h is p-eri, Ltlt puulatUi growth r at
fell to less than 2.8%,/3 while disappearance of rice and corn grew by 2.9%and 7 7, - respectively. 'he. d4 Af what de e sl -au It.1/o tC~,tL VV.LV±.Y LIlM UibZDapWtaLLdiLt UlL WIitdL, Ut~LtVCU SUit!iy ILOLO
imports, grew at about the same rate during the seventies as during thesixties, refL±LectiLrg the ir.fluence of higher prices aintaLined by the National
Grains Authority in 1974-1976. (International prices of wheat actuallyuroppedu ir recent years). Importation and local production of sorghum began
for the first time in the seventies. Most of the increase in disappearance ofcorn and all of that of sorgnum derived from increased feed requirements forthe Philippine hog and poultry production industry, while food use accountedfor the boost in rice and wheat disappearance.
/1 The survey data indicate 30-40% higher consumption levels than the disap-pearance data; there is disagreement among the various agency officialsas to the reasons for this discrepancy, however.
/2 These annual growth rates were based on three year moving averages covering1960/61 to 1971/72 for rice and corn and on individual years from 1959/60to 1969/70 for wheat.
/3 This decrease was, however, counteracted by a continuing growth in calorierequirements of 3% (due to an increase in the proportion of populationaccounted for by adults.)
ANNEX B
-25- Page 3
5. Consistent with these trends, the share of foodgrains in the dietdecreased in the seventies,/l while the share of meat, chiefly pork, fish andbeef, increased (see Table 2). This probably reflects increases in income andincreased urbanization, and is also consistent with the trends in prices, ascereal prices led price increases in 1970-77, while meat and egg Dricesincreased at a slower than average rate. Among the foodgrains, the trendin per capita consumption of rice, still the main stanle in the F'hilinpinpneappears to have changed little during the seventies./2 Year-to-year variationaround the average rice consumntion of 74.1 kg per canita is within 15% inall years, even including the shortage period in 1972 to 1974.
6. Data on per capita availability of corn shows an average increasener -ear of almost 5% in ons,imption during the seventies, w4it the largesr s1 kVLL Lf'.1a~
increase occurring in 1974/75. An increasing trend is hard to explain,however, since corn is consumed by humans only in certain parts of' the countryand it is often considered an inferior substitute for rice because it ischeaper and consumeu mo;e uy poorer groups./3 jJL* e iLncrease shlown Ln the datais probably due to a combination of factors: (a) a decrease in the retailprice of corn relative ;:o rice uring the seveftiLes; (b) lack of statisticalmeasurement of increased use of corn as feed by small commercial and backyardlivestock growers; and ;c) migration into corn-eating and corn-growing areasin Mindanao./4 Although there is some evidence that shows that the numbers ofthe absolute poor may have increased slightly in the seventies,/5 this factorcould have only accounted for a very small amount of the increase in corndisappearance.
/1 This represents a reversal of the trend in the sixties, when the dietshare of cereals increased.
/2 Disappearance data show a slight decrease while food consumption surveysshow a slight increase.
/3 Consumption surveys show a decreasing trend in per capita corn consump-tion as well as large negative income elasticities for corn products(-0.5 to -0.7).
/4 The population growth rate in Southern Mindanao, one of the majorcorn-eating areas, was the highest of all the regions for the period1960-1970, and secornd only to Metro Manila during the period 1970-75.
/5 See Mahar Mangahas et al, "A Critique of the NCS0 1975 Family Incomeand Expenditure Survey," University of the Philippines, September 1977.

ANNEX B- - Page 4
7. Total calorie consumption increased by an average of about 1.9%- peryear,in the seventies in response to increases in real GNP and personalconsumption per capita ot 3.5% and 1.5% per year, respectively./i -Tnus, in1975 for the first time, the average per capita daily consumption of caloriescame within 95% of the target of 2,187 calories recommended by the Food andNutrition Research Center of the Philippines. In general, yearly variationsin total-calorie consumption followed trends in prices and availability with alow in calorie consumption during 1973/74 accompanying the 37% rise in foodprices caused by shortages of cereal supplies (see Table 3).
8. Annual per capita consumption of rice and corn has tended to beclosely related to supply since these cereals comprise the main staples in thePhilippines. As can be seen in Tables 4 and 5, annual domestic productionsupplied 85-100% of total rice disappearance during the seventies, and an evenhigher proportion, 90-100%, of total corn disappearance, with the remaindermade up from carryover stocks and imports. Prices also vary primarily withdomestic supply although the influence of exchange rate variations and importprices may have occasionally been important as well.
9. The years 1970 and 1971 were exceptional years for agriculture, asboth foodgrain production and consumption reached historical peaks. Thefollowing two to three years saw decreases in consumption as production laggedand food prices soared, but levels of corn and rice consumption were stillhigher than in the sixties. As the inflation abated in 1975, and favorableweather spurred production, cereal consumption revived, helping to push totalcalorie consumption closer to the FNRC minimum daily requirements in 1976 and1977.
The Structure of Foodgrain Demand
10. The aggregate demand for foodgrains in the Philippines is a complexfuinctio%n whic-h depeands on income trendsj relative nrires and avAilabilitv of
different foodstuffs, regional preferences and social attitudes, populationgrowth a- d change in family ast ucture, and t-he dcgree of iirhbnizntion nAnd/or
development in the rural areas. The previous examination of aggregate trendsin nutritional adequacy, foodgrain consumption, s,pics, and income give some
indication of overall causal relationship between key variables. However,aggregate trendUs can mask A variations in cor.sumpti on patterns which are offten
important in making aggregate projections and in assessing the distributionalconsequences of these prUjecLions. II fUolLoJwiLL, analysisb Uo. VriaLtiLLUL iLr
consumption patterns relies primarily on the food consumption surveys whichprovide our only source of disaggregated consumption data.
/1 National Accounts of the Philippines, 1970-77, National Economicand Development Authority, Manila, Philippines.
ANNEX B-27 - Page 5
11. Variation in ConsumDtion Patterns bv Season. Evidence on seasonalvariation is scarce prior to the seventies; the only study conducted, whichwas in a surplus rice area with a high percentage of multicropning, showed asmall seasonal variation in conflict with results in other similar countries.In the early seventies contrasting evidence on seasonal variation in consump-tion is available from the consumption surveys conducted by the National Foodand Agriecuilfturp oniunril (see Tablhe 6). These surveys show a consistentpattern over several years of high rice consumption in May-June, when hardlabohr isi requlratd ir. lantd preannrst4or. Seasonal va-nr4atior. Aduring o thear par-ts
of the year is less consistent, but consumption is often low in September,4ust prior t- harvesti-ng Seasonral v-ristion ir. con.sumptiorn app...r to havedecreased in the later years when rice supplies were relatively abundant.
12. The seasonal pattern is opposite for corn, with June showing thelowest consumpt'on levels, and December and M.arch sometimes shownrg thehighest levels. Consumption of roots and tubers also shows a strikingseasonal variation with consumption in tne iarcn quarter often reachinglevels twice as high as during other quarters. As would be expected, wheatproduct consumption, being dependent on imported wneat, exhibits no discernibleseasonal variation. These individual seasonal patterns combine to produce arelatively stable year-round consumption of calories derived from cereals andstarchy vegetables.
13. Regional Variation in Consumption Patterns. Information on regionalvariation is also available from the NFAC surveys. Regional patterns inconsumption of foodgrains reflect regional preferences, relative incomelevels, and concentration of production in certain areas. Total calories ofcarbohydrate foods consumed are fairly consistent among the regions, withvariations explained by differences in urban population and income levels.The distribution of calorLc consumption among the various foodgrains showsconsiderable variation, however (see Table 7).
14. Regional preferences for rice vs. corngrits are most striking, withonly 9% of all families surveyed consuming both rice and corngrits. Luzonand the Western Visayas are the major rice-eating areas; within these regions,only in Metro Manila does the rice consumption per capita fall lower than 100kg. Only two regions of this group - Cayagan Valley and Western Visayas -contain a significant numlber of families who consume corngrits (17% and 9% ofthose surveyed, respectively).
15. The major corn consuming area is the Central Visayas region whereconsumption of corn is twice that of rice, and over 50% of all familiessurveyed consumed only cor'ngrits. In other regions in the Visayas and inMindanao. more rice than corn is consumed. and only about 20% of the familiesprefer corngrits only. Thus, the surveys indicate that 63.3% of the rice andonly 9% of the rnrnarits are annqiimet in TLunn and WPetern Visayas, whilp91.% of the corngrits and 36.7% of the rice are consumed in the remainingregions of the Philippines=
ANNEX B- 28 - Page 6
16. Consumption of pan de sal (a roll-like product) is relativelyuniform in areas outside Metro Manilasa and Soiitheprn Tagcralon. (Average onimn-tion in these two regions is twice as high as in other regions.) For othercarbohydrates, however, connumption patterns roughly follow the rice/cornpreference pattern, with Bicol, the Visayas and Mindanao showing less depen-dence on ricear.daricher varlety of energy sources. Luzon (excludingBicol),with 70.8% of the population in 1975, consumed only 15.3% of the nationallevel ofcns. ..~JLamUL ofl sweet potatos, 11.4T of the caooava roo, and 2.5%of bananas. Eastern Visayas, a region with a relatively low per capitaLucome, cousumued the highest amounts of swe-et potato ar.d cassava roots.
17. *lhe only othler source ol iLniormation On consumptLon by region comes
from food intake surveys conducted in different years for most regions by theFood and Nutrition Center (FNRC) during the fifties and sixties (see Table 8).These surveys show similar regional patterns in consumption of rice and corn.The FNRC figures for consumption of cassava roots and sweet potato are muchlower, however, possibly indicating an increase in consumption of these cerealsubstitutes in the seventies, particularly in the Visayas and Mindanao.
18. These regional consumption variations are explained partially byregional variations in production. Luzon and the Western Visayas accountedfor 74% of value added in palay production in 1974 and only 29% of valueadded in corn production. In contrast, the rest of the Visayas and Mindanaoaccounted for 70.7% of the value added in corn production in 1974. Despitethis seeming correlation between production and consumption by region,certain regions experience chronic deficits in rice and/or white corn andmust rely on interregional shipments of private traders and the NationalGrains Authority. For rice, the main deficit regions have been SouthernTagalog, Central and Eastern Visayas and Mindanao. The latter three areashave also been white corn deficit regions on occasion. Cagayan Valleyappears to be a major supplier of both rice and white corn to the deficitareas.
19. Consumption Patterns in Urban and Rural Areas. Comparative data onfood consumption of the urban and rural populations are scarce in the Philip-pines, which is unfortunate since surveys in other similar countries showstriking differences in diet. Data from the Family Income and ExpenditureSurveys (FIES) are limited to expenditure figures broken down into broadclasses of food items. Intake data from FNRC surveys are available byurban/rural breakdowns, but only for the period 1958-1969. The NFAC surveysprovide the most vrecnt data nan thp most dptniled in terms of food itpms,
but only Greater Manila is singled out. These three sources provide roughcross-sectIonal information on A-If rr-nroa an onsumptirn n:ttPrn. hptErtRn
urban and rural populations, but no information on the trend over time, whichwould be particularly useful since the uvrhbn piopiuntion 4n then Philippines
grew at rates of 4% and 4.5% in the 60's and 70's respectively.
20. The FIES surveys show that people living in urban areas in thePhilippiues bLIU se aUsmLaL.L=L pJrJoJpo.LtoLL of tLhei income -r.- f - - th---
in rural areas, even when data is subdivided into income classes. The percen-tage of total expenuditures tends to be an even smaller percentage for Metro
ANNEX B-29 - Page 7
Manila thlan for other urbuan areas. T.hle percer.tages chane litt Lrom 1961in4to 1970/71, but in the latest census in 1975, the percentage of food expendi-tures ofL a'l'l groups increL ased p YUU, probablyL- d mr to prce increases LtlaLl
quantity increases (see Table 9). In 1971, the urban population spent 47.1%of its Lncome on average on rood (Metro Manila spent 41.5%) wnhle cne ruralpopulation spent 59.3%. These averages reflect variation from 70.1% to 42.6%for the rural population (iowest to highnest income ciass) vs. 63.5% to 31.8%for the urban population (see Table 10). The percentage of total expendituresspent on cereals shows similar variations. In 1971 the urban population spentonly 13.9% on cereals whiereas the rural population spent 24.5%. In contrast,the urban population spent 7.5% on meat and eggs compared to 6.7% for therural population.
21. The FNRC surveys show that most of the difference in expenditurescan be explained by differences in intake (see Table 11). These surveysshowed the urban population consuming 4.2% more calories than the ruralpopulation. Consumption of cereals, starchy roots and tubers, and driedbeans, nuts and seeds were higher in the rural areas, whereas consumption ofall other items were higher in urban areas. Consumption of meat, poultry andfish was 40% higher in urban areas than in rural areas, and consumption ofeggs and dairy products was more than double in urban areas.
22. These broad trends are also reflected in the NFAC surveys which arebased on more recent data (1974-1976) and which provide detailed breakdownsby food item (see Table 12). The data show that, especially among low incomegroups, families in Metro Manila enjoy a more diversified diet and one whichcontains higher percentapes of processed foods as well (e.g., rice, noodles,loaf bread, processed meat).
23. While average per capita consumption of rice and corngrits is lowerin Manila than in the Phi.lippines as a whole, consumption of pan-de-sal andloaf bread is much higher. Because the low income groups in urban areas havemore access to certain goods, income elasticities of normal goods are lowerin Manila and even negative in some cases (pan-de sal, cabbage, tomatoes).Income elasticities of irnferior goods, particularly those which tend to behome grown (sweet potatoes, cassava). are even more negative in Manila than inthe Philippines as a whole. Among the meats, income elasticities are lowerfor nork and eggs and roughlv enual for beef/rarabeef and noiiltrv Theincome elasticity of rice in Manila is 0, reflecting the fact that allfamilies in Manila eat rice regardless of income group. Because of regionalpreferences regarding rice and corn, however, this should not be interpretedas tvniral of tho noverall uirhan pnnnOlat-oin
24. Variations i4n Cons-u2ption Patterns by Income Class q. fly two"sources of data provide information on food consumption by income class: theVFIE Expend,iture Surveys and thbe L*U A fSurveys. The LTLI curveys indicate thatas income increases, the percentage of expenditures on food and cereals bothLrop con .I 0E. aUera bly Wi Lt Li lo aWest L Ur X V U Ln both case ULsocur Ur L1 LLr L XI VI Li LManila. In 1971, the percentage expenditure on food dropped 25-30 percentage
ANNEX B-30 - Page 8
points from the lowest income group to the highest, and the percentage expendi-ture on cereals dronned 15-25 Doints (see Table 10). In contrast the nercenta2eof expenditures on meat and eggs rose. These variations respect Engel's law,aQnd fnllnw nptrPrns exnpect-e for stanles (rtersalR) and lulxuirv item.s (meats andeggs).
25. The series of NFAC surveys conducted from October 1970 to June 1976ic t-ho he-et eata sniirrc for nn1l uinc unariations inn mwnntif i-u nnaiim hr
income class, as opposed to expenditure. In each survey, the families weredivided int-n fnor income gronsn AdfineA in current prices (income for 19 months
prior to each survey date):
Low income - Less than P 400 per capitaVLed- ir.4ncome - n A0-700 per capi4ta
Medium-high income - P 799-1,499 per capita114g b-4. = ro 1 ,50 an' over per capita
26. * tsWbCompar'Uiks of theIU VdtL.LdLJLUL1 ueweeti CoisbULmpLtoU paLLernLs of LLth
four income classes over time is broadly valid, assuming price rises duringthe seventies a'iecteu all groups equally. nowever, caution must be exercisedin comparing trends over time since the average income of each group inconstant values decreased considerably over the period.
27. Tne highest income class consumed on average 15 to 20% more ricethan the lowest income class, and during the most severe shortage period inSeptember 1973, the hignest income class consumed 40% more rice than thelowest class. The difference in wheat product consumption, which is more ofa luxury item, is even more striking. Consumption increased considerablywith each new income class until the highest income class consumed from twoto three times as much of the wheat products as did the lowest class. Incontrast, the poorest class consumed more than three times the corn productsof the highest income class during most years.
28. There are also differences among the income classes in consumptionof raw milled grains vs. more highly processed products. Per capita consump-tion of rice noodles and rice cakes are still very low in the Philippines,but the surveys show a clear tendency for these products to be consumed moreby higher income classes. Similarly, consumption of wheat-based noodles andloaf bread recorded in the surveys were significantly higher in absoluteamounts among the upper income classes.
29. The data from the NFAC surveys were used to calculate cross-sectionalincome elasticities for cereal products and other foods and these elasticitiesare given in Table 13 to summarize the variations found in the surveys in

ANNEX B
- 31 - Page 9
food consumption by inccome classes. These elasticities should be interpretedwith some caution, however, since the real incomes of the income classeschanged considerably during the seventies. Since consumption of cerealsgenerally levels off and sometimes declines at high income levels, the elasti-cities may be biased uprards (in absolute value) for normal goods and downwardsfor inferior goods since the patterns of the highest income classes areincreasingly left out of the sample with each new consecutive survey. However,this bias is probably nct significant enough to cause errors in projections ofcereal demand since the upper income classes are a very small proportion ofthe population and they consume an even smaller proportion of the cereals.
30. Estimates of Elasticities of Cereal Products and Substitutes.Berause of the relative wealth of data on food consumntion natterns in thePhilippines, numerous studies have been conducted to estimate income, expendi-ture, and nrire elastirities which ran be used to nroiect demand for differentfood items. The studies vary considerably in their data sources, methodologi-canl naproachc nne cnmnlo hronkAnranc* A suymmnar of thp celidioc And the
elasticities estimated is presented in Table 14. Only two studies havenattmpteA to meaure nprice elatrinitiae; most studieics hnave boor nimed at
estimation of income or expenditure elasticities. The primary data sourcesare the NFAC surveys and the FIES surveys discussed earlier; however, otherstudies used micro-survey data and data from agricultural censuses.
31. Economic theory provides some guidelines on the relationshipsexpected betweenr the vt-rio,- el-asticities gv4 en 4 Ta1,1 3 FArst since
the sum of the price elasticity, the cross-price elasticities and the incomeelasticity for a.y product i6 zero, thle price ellasticity (aboteJJ valuc) can
be interpreted as an implied maximum for the income elasticity (this assumescross=elasticities are zero or positive) . SeIIU econoic- theoUy predits4
that broader categories of items should exhibit smaller elasticities thanmore specific items since fe-wer substitutes are available; thus elasticitiesfor "cereals" should be relatively small. Finally, since expendituresembody cnanges in price and quality as well as changes in quantity, expendi-ture elasticities will tend to be higher than income elasticities. All ofthe expenditure elasticities presented are cross-sectionai; therefore,problems of price inflation do not introduce distortions. However, the factthat different qualities of food (reflected in prices and thus expenditures)may be consumed by different income groups may bias elasticities upward. Forthis reason and also because expenditures are less than incomes for the vastmajority of the population estimated expenditure elasticities are generallyconsiderably higher than estimated income elasticities.
32. Estimates of income elasticities for rice seem to vary in sign, butall estimates have been relatively small, as would be expected of a staplefood. Inno cases do elasticity estimates rise above +0.5, which is equal tothe maximum price elasticity estimated for rice. Significantly, estimates ofincome elasticity for the Philippines as a whole are consistently very low,generally +0.2 to -0.3; Furthermore, available expenditure estimates are alsoquite low. However, some income elasticities for particular varietiesor for particular population groups have been of a larger (positive) scale.For example, the income elasticity for "wag-wag" rice, a luxury variety, is
ANNEX B- 32- Page 10
quite high at 0.34; however, this is offset by large negative elasticities forcertain other varieties, notably IR-8, one of the early new varieties whichwas widely considered in the rural areas to be inferior in taste. Similarly,while income elasticities of rice for high income groups in Metro Manila havebeen estimated in some cases as zero or negative, income elasticities forrice in Mindanao, a traditionally corn-eating area where rice supplies areexpanding, have been estimated at much higher levels. The tables also showthat the elasticities vary by urban/rural and rice-producer/nonrice-producerclassification; elasticities are generally higher in urban areas (other thanMetro Manila where income levels can introduce distortions).
33. The income elasticities for corn shown in Table 13 are invariablyzero or negative, but the variation is quite substantial. Because of regionalpreferences for corn vs. rice, aggregate elasticities may depend on migrationtrends or on changes in availability in certain areas. The largest negativeelasticities are in urban areas in the Visayas and Mindanao. In Metro Manilaand parts of Luzon, corn consumption is so low that elasticities cannot becomnuted. Although rrosR-nric-e elasticitieR for torn and rite have nevpr hbenestimated, corn and rice appear to be substitutes, at least for a fraction ofthe nopnilatinn. The NFAG consumption surveyv shnw ner capnita conn.Qmnti on ofcorn varying inversely with rice during the seventies and much of the varia-tion in corn consumption appears to be explainhable by variations in the ratioof corn prices to rice prices.
34. Fewer estimates of income elasticities of wheat and wheat productshave been produ,ced, but those oestrimates aes 41vail able consistentgl -how 1argepositive elasticities of as high as +1.1. Only in Metro Manila in the caseof pan-de-sal consumption, a relatively inferifor wbeat product, has a negativeelasticity for wheat products been observed.
The Structure of Feedgrain Demand
35. The demand for feedgrains is a complex derived demand functionwhich depends on the size and character of the livestock population, thedistribution between commercial and backyard producers, traditional preferencepatterns vis a vis home mix vs. prepared feeds, and the responsiveness ofmillers and producers to changes in the relative prices of feedstuffs.Ultimately, the demand for feedgrains depends on the demand for meat productsand the ability of producers to supply this demand at reasonable cost.
36. Because of the continuing dominance of backyard livestock andpoultry production in the Philippines, estimates ot the livestock populationand data on meat production and consumption are scarce. Furthermore, estimatesof feed consumption of the producers are practically non-existant, beinglimited to estimates based on production figures of the commercial feedmillers.Nonetheless, the data available provide some information on overall trendsand patterns of feedgrain consumption in the Philippines.
37. Consumption of Meat and Poultry Products. Traditionally, cereals,vegetables and fish have provided the bulk of the Philippine diet, particularlyin the rural areas where 75% of the population live. However, the last 15
ANNEX B- 33 - Page 11
years have seen some increase in consumption of meat, dairy and poultryproducts as a consequence of increased availability, urbanization, and incomegrowth. Although the 1:rend in the share of meats in the diet is variable, ingeneral, the growth in consumption of meat products and dairy products hasbeen faster than that of cereals but has not kept up with that of fish products.In the 1960s, meat consumption was relatively constant as cereal consumptionrose, while in the 1970s the opposite occurred in line with relative increasesin the consumer price index for meats and cereals. respectively (see Table 15).
38. Consumption cif meats in urban and rural areas varies considerably.Nutrition surveys conducted in the late 1950s and 1960s show urban areasconsuming 9% and 65% less cereals and tubers resnectivelv. 40% more meat,poultry and fish, and over three times as much milk and eggs as rural areas.The exnenditure survevc of the NGSO show- hnwever, an increase in the share ofexpenditures directed to meat and eggs from 1965-1971 in both urban and ruralnrens in the Philippines.
39. Since swine and poultry are the major consumers of feegraSins in
the Philippines, the following discussion will center on consumption ofpork and poultry products. Pork prov-des a significa n.t portion of thecalories and a major proportion of the protein in the Filipino diet. Nonethe-less, growt.i-1 i4r per capita avai-labl'ity and consumption bas lagged -h1i-A hat-
.LC O , 5LiS LLL Li J9L .. aJ. L. aV LC .LA.a LJ . %U' Ani xJL UijL Jt tiLCL LCra ,cU UtIIXII1U LLCil.
of other meats. Availability has shown considerable fluctuation in both thei7u9s and the 197710s, causiLng COLconmitant flLuctu[tiOnS in prices. DurL.ig the
1960s, availability varied from 23.7 gm/day in 1963-1965 to 30.1 gm/ day in19uU and 1966. During the 197is, when thle trend in availaDlity was lower,levels varied from 22 gm/day in 1971 to a high of over 25 gm/day in themid-1970s witn even higher levels in recent years. Per capita consumptiondata from the NFAC consumption surveys are inconsistent with availabilitydata, however, since they show lower levels of consumption and a decliningtrend in the seventies.
40. Poultry, beef and eggs are less important in the Filipino diet thanpork (the price per calorie of poultry products is much higher); but unlikepork, availability of poultry has shown an increasing trend since the 1950sdue to expanded commercial production. Variability in availability from yearto year has also been sLgnificant, however. After declining somewhat in theearly 1960s, availability increased sharply, reaching a peak in 1968 of9.5 gm/day. Availability dipped from 1968 to 1970, and then recovered toa stable level during the early 1970s. Per capita consumption of eggs hasshown broadly similar trends. The latest data available, however, show alarge drop in 1975 in both poultry meat and egg consumption of 66% and 30%respectively. Although the NFAC surveys show higher levels of per capitaconsumption of poultry and eggs than the availability data, the surveys showa similar declining trend during the late 1970s.
41. The NFAC surveys provide some insights on variation in consumptionof pork and poultry products by region and by income class. Surveys conductedbetween June 1974 and March 1976 indicate that a high proportion of Filipino
AiLlIM'd DA
- 34 - Page 12
families in all regions use pork and eggs (66% and 71% respectively), while asmaller proportion (39%) use poultry meat. Pork and beef/carabeef appear tobe substitutes to a small degree. Regional variation is not as striking as inthe case of rice and substitutes, and may reflect variation in incomes andurbanization as much as preferences./1 As expected, the highest consumptionlevel and the largest proportion of consumers eating pork, poultry and eggs isin Metro Manila, the area with the highest urban population and the highestaverage income. The lowest consumption level and smallest proportion of pork,poultry and egg consumers is in the Eastern Visayas where incomes are relativelylow.
42. The NFAC surveys collected data for four different income groups.As would be expected of meat, poultry and milk products, the proportion offamilies consuming these products invariably increased with each step to anew income class. Only the proportion of families consuming pork only (noconsumption of beef/carabeef recorded) declined from the third highest groupto the highest group, showing a tendency to substitute beef for pork at veryhigh incomes. Figures of per capita consumption of pork, poultry and eggsalso increased invariably with incomes. Thus, income elasticities calculatedfrom these data are high, reflecting the character of these products assemi-luxury items (see Table 13).
Livestock and Poultry Production
43. Data on chicken and hog numbers and production of pork, poultry andeggs are shown in Tables 16-18. Despite substantial growth of commerciallivestock operations in the Philippines (particularly poultry), the bulk ofthe swine and poultry population still comes from backyard producers. Of the6.5 million hogs recorded in January 1976. 5.9 million or 91% are produredby small farmers who raise 2-10 saws for home consumption or sale in localmarkets. A slightly lower percentage, about 82%, of the 46 mill-ion heads ofpoultry are raised in backyard production. The backyard poultry and swineare distributed fairly evenly with a majnritv raiiad in Luzon. The commercialproduction units are even more concentrated, being located near urban centerswhere cormercial feed is readily available.
LL. Pork production has fluctuated widely since the 1960's, bu-production has clearly increased in the seventies. There is a growing trendtowNvards large-scale s-pecali-zed hg product.ion. a uits c4ch are liked . Lt~~k-c - - F' J I1U 0hL WLI.L LLI a t .t.LILI.t W Iti
feed mills. Hog numbers have shown considerable fluctuation, but the live-stock. censuses suggest a constant trenid of around 6.5 mill'ion heads in thesixties, followed by increases of 5-10% which peaked in 1974 with 8.7 millionhLLead s £. I LnLe nexL few years n-Iuters sharpl'y ecreased uue to iow prices andhoof-and-mouth disease, resulting in swine population estimates in 1977 whichfell below the level in the sixties. The census shows the swine populationdeclining 11.6% from 1976 to 1977; while the commercial stock actuallyLLcreasefU, thLe back-yard population ueclined i6%. The 1978 survey is expectedto show increases and a return to trend, however.
/1 Surprisingly, consumption of pork in the Southern Mosiem regions is onlyslightly lower than in other regions of the Philippines.
ANNEX B
- 3a - Page 13
45. Poultry production also remains dominated by backyard production;most rural families keep a few native chicken for eggs and meat for homeconsumption, selling any surplus in local markets. However, commercial poultryoperations have increased in the last 15 years. Most of the expansion inpoultry population from 50 million in the early 1960's to the peak of 68 mil-lion in 1968 was due to growth of units with over 500 birds, many of which arelarge integrated operations with contractual links to feed mills. Bothcommercial broiler and layer production are centered around Manila and Cebu.It is estimated that commercial production accounts for 40% of the poultrymeat and over 85% of the eggs produced in the Philippines. Integrated farmswith 30,000-100,000 heads of poultry may account for as much as 10% of theeggs and broilers in the Philippines. A majority of the commerciaL units,including those not considered integrated, have some form of contract withfeed mills. The livestock censuses show a decline in the chicken populationin the seventies with a particularly sharp decline in 1976. It is not knownwhether the decline is from commercial or backyard farms, but it is generallyattributed to increased prices and shortages of raw feedstuffs in the 1970's.
46. Feedgrain Consumption. Because the bulk of the swine and poultrypopulation are still raised in backyard operations, little is known about thetotal amount of corn consumed as feed. Refined corn consumption data avail-able is limited to corn bought by commercial feed millers for use in produc-tion of feed. Only about 20% of the chicken stock and 3.3% of the hog stockare fed with commercial feeds, however, accordina to BAECON estimates. TheBureau of Animal Industry estimates that 52% of corn used for feed is consumedby poultry and 32% by swine, but actual con-smntoinn figui1res are not available.
47. Most backyard liuptonrk nnipltrv nnprations rely in part on theanimals scavenging for food. The bulk of the backyard swine population, forexample, are fed on a mixture of kitchen leftovers, grated coconut meat, andrice bran. Corn grain and pollards, where available, are reportedly beingsubsti tiituted for rice braninn swine feed, however, a rice bran becomes increas-ingly expensive.
48. Although production of commercial feeds has increased substantiallyinthe last ten -earss (chiefly poultry feed), most feeds cont i,-.ue to le rixedJ.aA. % LAL ; .a.t ~ a a a '..JLLLU C 1 uc LJtLAe
on the farm (except for starter rations for swine). Many commercial piggerieshave- hammer mll-s, allowing them tLo bUuy corn Udirectly fLroUI milUU"LemILen fLor
feed use. A typical mix by weight for a commercial pig operation would berice bran: 6 U0%, co /. 30% ar,d fsh real: 10/,, rltoug ratiLos can vary consider-
ably, with the proportion of corn use recommended varying from 20-75%. Incontrast, commercial poultry operations rely almost wholly on prepa-red feeds,resulting in a trend toward large, integrated feedmill-poultry operations. Amajority of the commercial poultry operations now have contracts with feedmilisfor assured feed supplies.
49. The feedmilling industry has grown considerably since the 60's withan acceleration during the i0s, becoming an important element in the demandfor corn. Consumption of domestically produced corn and sorghum by commercialfeed mills increased 2 1/2 times in the past 10 years, mostly for poultry
A MKTVV DAX hTbAVIJ
-36 - Page 14
feed (see Table 19). The installed milling capacity of 435,000 tons in 1967doubled tu 974,500 tons in 1973. Utilization of plant capacity has averaged55%, mainly because of shortages and high prices of raw materials, whichaccount for 89-92% of the cost of production of commercial feed. Mixed feedmanufacturers have grown in numbers from 27 in 1971 to 63 in 1975. Themajority are still located in Manila and Cebu, where the major livestockmarkets are located. Although most of the domestic corn used is produced inMindanao, the feed millers have located near major ports as a large proportionof corn and other major feedstuffs is still imported (67% of corn, 82% offish meal, and 96% of soybean meal in 1975). Only 51 of the 63 feedmillersare mixed feed producers and only 38 of these operate for commercial sale.(The rest produce for their own consumption only). Eleven of these commercialfeedmillers make up the Philippine Association of Feed Mill Industries(PAFMI) and account for 85% of the commercial feed produced.
50. Corn is the major bulk feedstuff used in mixed feeds, accountingfor over a third in weight. The feedmillers prefer yellow corn because ofits higher nutrient value (chiefly carotene), but white corn currently makesup a higher proportion (64%) because of local availability and slightlylower prices. Sorghum use by feedmillers has grown dramatically as local andimported supplies have become available at prices comparable to those of corn.Sorghum has 85-95% of the feeding value of corn (with more protein but lessfat and carotene) and 40/60% combinations of sorghum and corn have beenrecommended as a substitute for corn. The demand for corn for feed is expectedto continue to grow at a fast rate however, since the potential demand forsorghum as a substitute will be limited by supply for many years. Consequently,the percentage of corn used for feed is expected to increase relative to thepercentage used for human consumption in the coming 10-15 years.
. nuary, 19, 1979
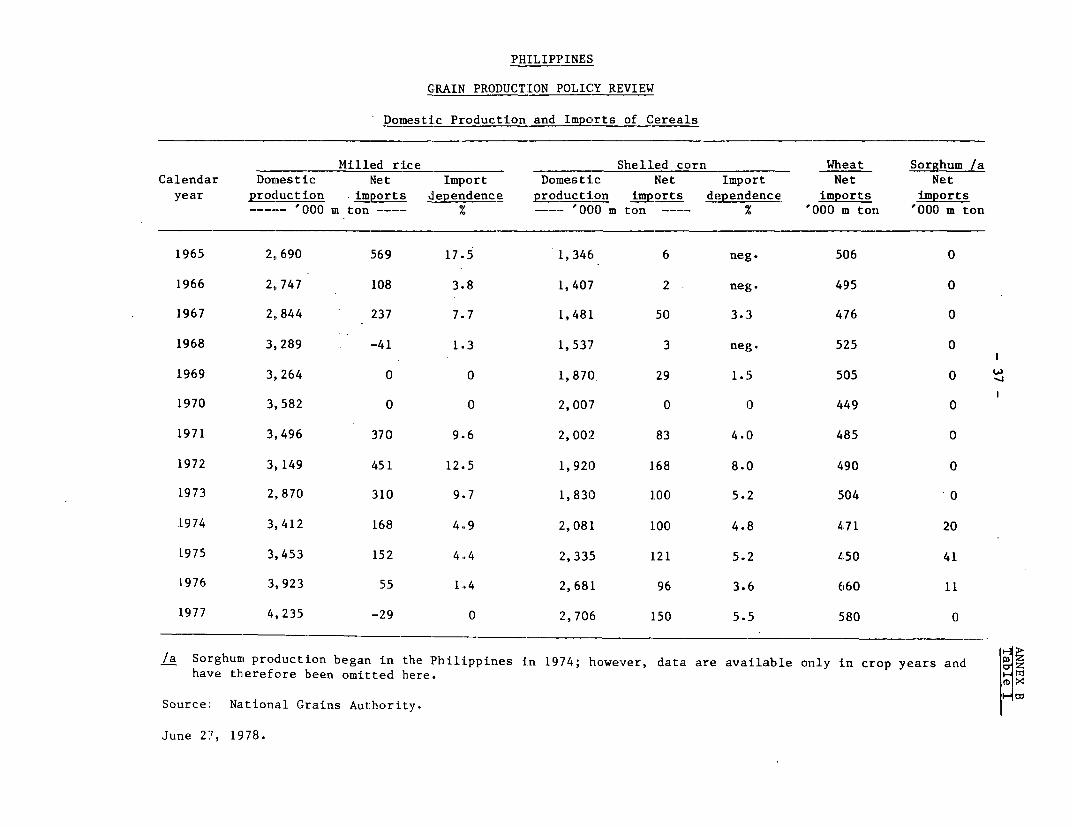
PHILIPP INES
GRAIN PRODUCT[ON POLICY REVIEW
Domestic Production and Imports of CereaLs
Milled rice Shelled corn Wheat Sorghum /aCalendar Domestic Net Import Domestic Net Import Net Net
year procluction imports dependence procduction ip.orts dependlence imports imports'CIOO m ton '000 m ton -% 000 In ton '000 m ton
1965 2,690 569 17.5 1,346 6 neg. 506 0
1966 2,747 108 3.8 1,407 2 neg. 495 0
1967 2,844 237 7.7 1,481 50 3.3 476 0
1968 3. 289 -41 1.3 1,537 3 neg. 525 0
1969 3,264 0 0 1,870( 29 1.5 505 0
1970 3,582 0 0 2,007 0 0) 449 0
1971 3,496 370 9.6 2,002 83 4.01 485 0
1L972 3,149 451 12.5 1,921) 168 8.13 490 0
L973 2,870 310 9.7 1,830 100 5.2 5.04 0
1974 3,412 168 4.9 2,081 100 4.B 471 20
1975 3,453 152 4.4 2,335 1L21 5.2 450 41
L976 3,923 55 1.4 2,681 96 3.6 660 11
1977 4,235 -29 0 2,706 L50 5.5 580 0
/a Sorghum production begarL in the Philippines in 1974; however, dataz are available only i.n crop years andhave thierefore been omitted here. X
Source National Grains Authority.
June 27, 1S978.
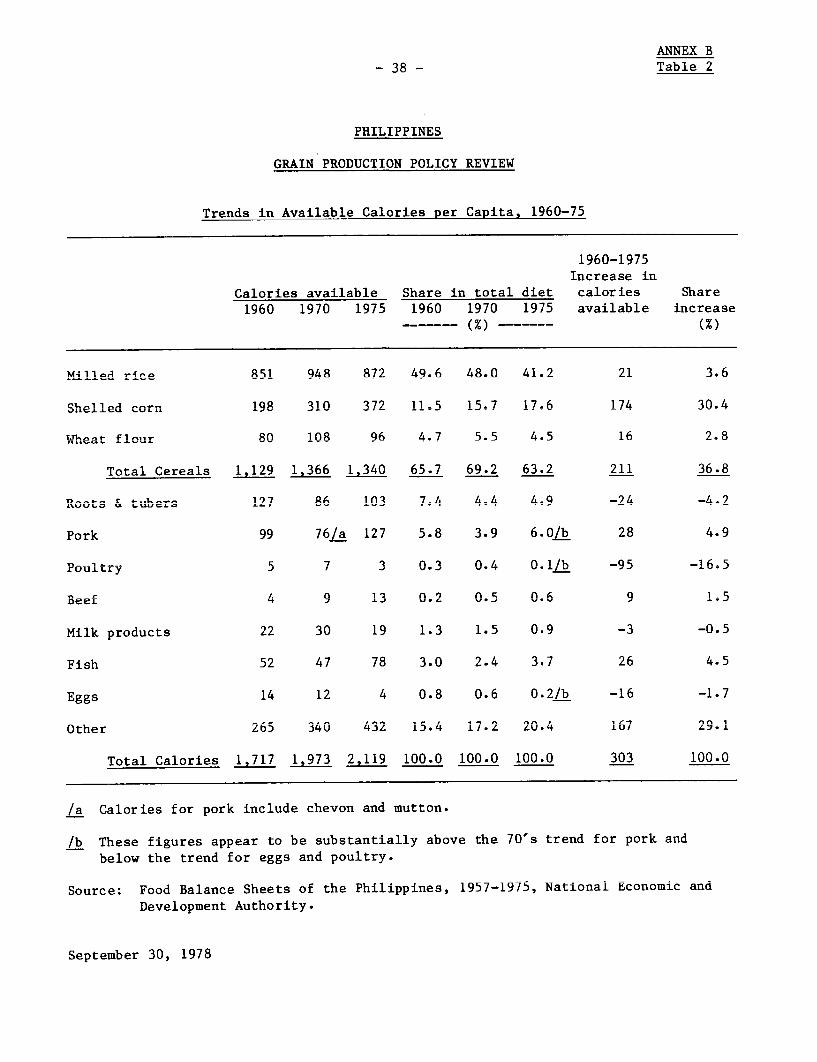
ANNEX B
- 38 - Table 2
PHILIPPINES
GRAIN PRODUCTION POLICY REVIEW
Trends in Available Calories per Capita, 1960-75
1960-1975Increase in
Calories available Share in total diet calories Share
1960 1970 1975 1960 1970 1975 available increase
___ __ ( %) ( %)
M411ied rice 81 948 872 49.6 48.0 41.2 21 3.6
Shelled corn 198 310 372 11.5 15.7 17.6 174 30.4
T.Theat flour 80 108 96 4.7 5.5 4.5 16 2.8
Total Cereals I 6 1.340 65=7 69.2 632. 911 36.8
Roots &- tub'ers 127 86 103 7=4 4.4 IL.9I -24 IL.2
Pork_ 9 76/a 127 q 3A Q 6i n/h 28 4L. q
Poultry 5 7 3 0.3 0.4 A .1Lh -95 -16.5
Beef 4 9 13 0.2 0.5 0.6 9 1.5
in i ~~~~~ ~ no aMilk products 19 L.3 L.5 0 = -0.
5
Fish 52 47 78 3.0 2.4 3.7 26 4.5
Eggs 14 12 4 0.8 0.6 0.2b -16 -1.7
Other 265 340 432 15.4 17.2 20.4 167 29.1
Total Calories 1i717 1,973 2,119 100.0 100.0 100.0 303 100.0
/a Calories for pork include chevon and mutton.
/b These figures appear to be substantially above the 70's trend for pork and
below the trend for eggs and poultry.
Source: Food Balance Sheets of the Philippines, 1957-1975, National Economic and
Development Authority.
September 30, 1978
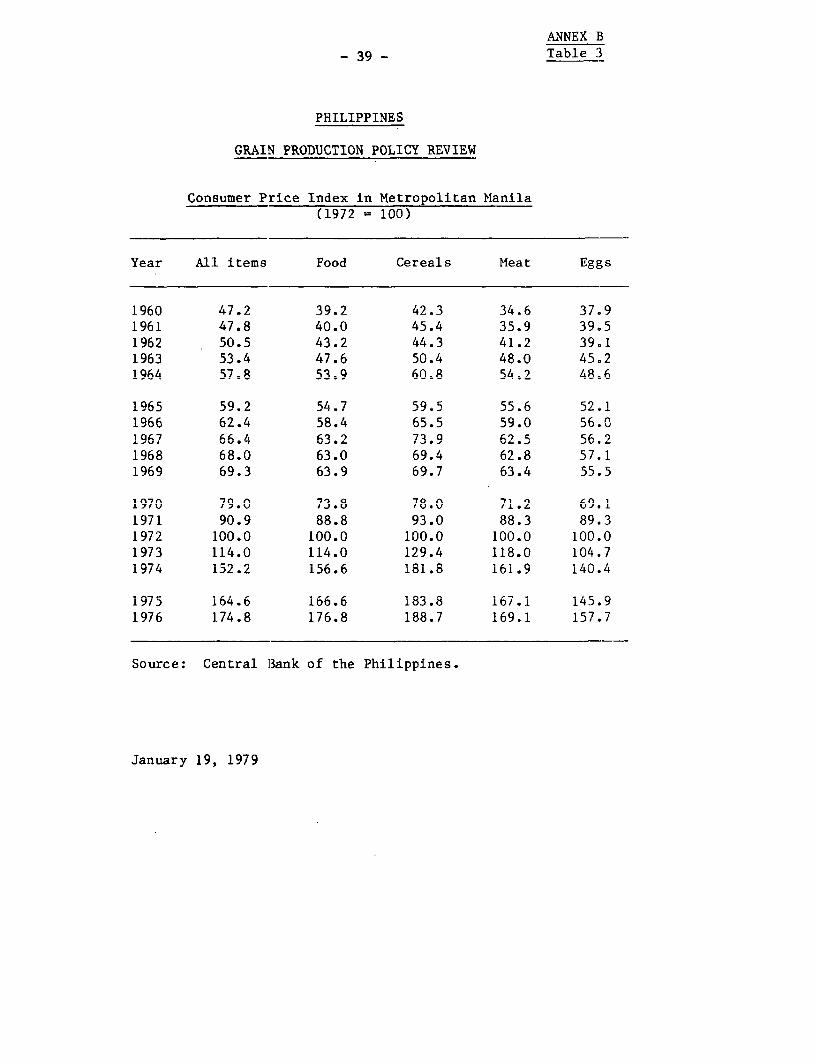
ANNEX B
- 39 - Table 3
PHILIPPINES
GRAIN PRODUCTION POLICY REVIEW
Consumer Price Index in Metropolitan Manila(1972 = 100)
Year All items Food Cereals Meat Eggs
1960 47.2 39.2 42.3 34.6 37.91961 47.8 40.0 45.4 35.9 39.51962 50.5 43-9 44.3 41.9 39-11963 53.4 47.6 50.4 48.0 45.21964 57=8 53=9 60=8 54.2 48=6
1965 59.2 54.7 59.5 55.6 52 11966 62.4 58.4 65.5 59.0 56.019O67 6.4A .2 9 73 ).9 C6 56.2
1968 68.0 63.0 69.4 62.8 57.11969 69. 639 A LA7 L 63.45.
.1 (U 7 n 7n .7 0.- 7 0.l 7 i -t fQ I
19l70 790 A73.80 780 71. '1 LA1I 7/U 1 7. V J.O 1 .' . LvII.L 0 7.I
1971 90.9 88.8 93.0 88.3 89.3l nf i In.^ Iin f I nn fi I n r i nf%.fI1 /- lUUVU iLUU.u lUU.U lUU.U lUU.U
1973 114.0 114.0 129.4 118.0 104.71974 152.2 ii6.6 181.8 161.9 140.4
1975 164.6 166.6 183.8 167.1 145.91976 174.8 176.8 188.7 169.1 157.7
Source: Centrai Bank or the Philippines.
January 19, 1979
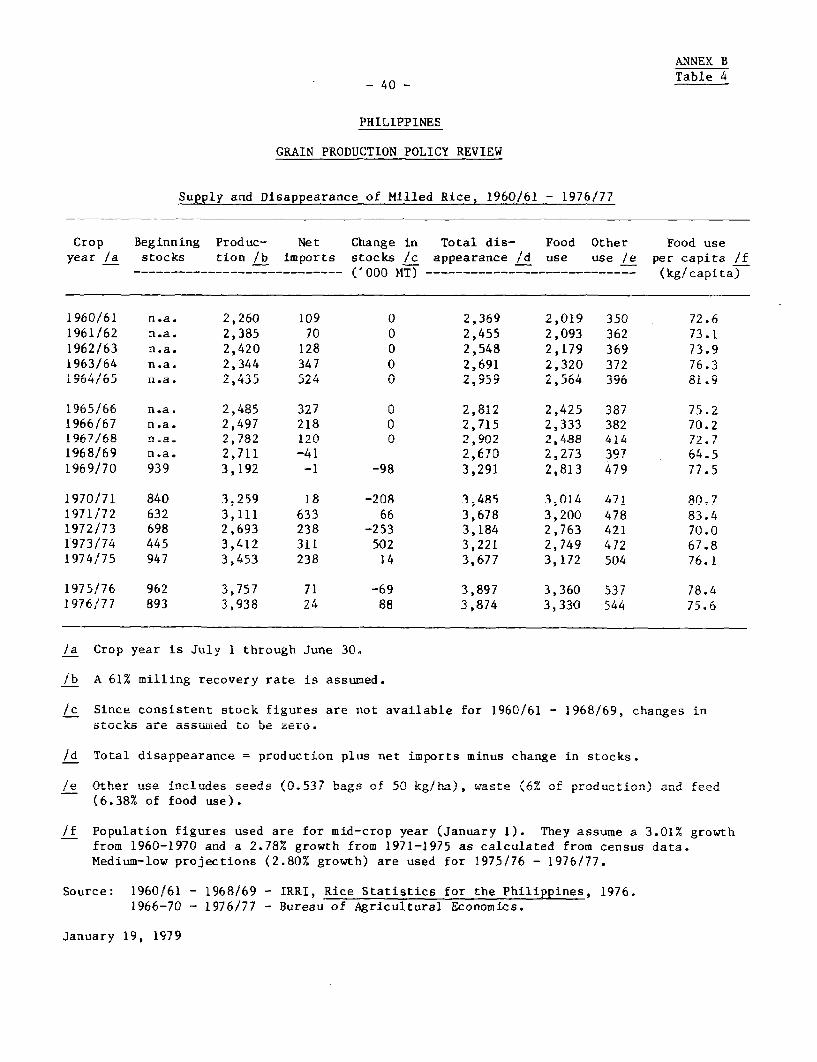
A-mNEXv B
-Table 4-40-
PHILTIPPINES
GRAIN PRODUCTION POLICY REVIEW
Supply and Disappearance of Milled Rice, 1960/61 - 1976/77
Crop Beginning Produc- Net Change in Total dis- Food Other Food useyear /a stocks tion /b imports stocks /c appearance /d use use /e per capita /f
---------------------------- ('000 MT) ---------------------------- (kg/capita)
1960/61 n.a. 2,260 109 0 2,369 2,019 350 72.61961/62 n.a. 2,385 70 0 2,455 2,093 362 73.11962/63 n.a. 2,420 128 0 2,548 2,i79 369 73.91963/64 n.a. 2,344 347 0 2,691 2,320 372 76.3j,oq1,o n.a. 2,435 52' 0 2,959 2,564 396 5.9
inctccf n.. 1 n .oc %" n .1 In n, --
1966/67 n.a. 2,497 218 0 2,715 2,333 382 70.21967/68 n.a. 2,782 120 0 2,902 2,488 414 72.71968/69 n.a. 2,711 -41 2,670 2,273 397 64.51969/70 939 A,199 -1 -98 3,291 2,813 479 77.5
1970/71 840 3.259 18 -208 3.485 3.014 471 80.71971/72 632 3,111 633 66 3,678 3,200 478 83.41972/73 698 2,693 238 -253 3,184 2,763 421 70.01973/74 445 3,412 311 502 3,221 2,749 472 67.81974/75 947 3,453 238 14 3,677 3,172 504 76.1
1975/76 962 3,757 71 -69 3,897 3,360 537 78.41976/77 893 3,938 24 88 3,874 3,330 544 75.6
/a Crop year is July 1 through June 30O
/b A 61% milling recovery rate is assumed.
Xc Since consistent stock figures are not available for 1960/61 - 1968/69, changes instockUs are assumedU to Lue zero.
/d Total A p4-----a-ranc---e = prodc4tln m..- - in stocks.
/e Otiher utse inclu,dAe seedA (fO.537 bags nf 50 Irt.hw,aste t6%1 of production) a..d feed
(6.38% of food use).
If Population figures used are for mid-crop year (January 1). They assume a 3.01% growthfrom 1960-1970 and a 2.78% growth from 1971-1975 as calculated from census data.Medium-low projections (2.80% growth) are used for 1975/76 - 1976/77.
Source: 1960/61 - 1968/69 - IRRI, Rice Statistics for the Philippines, 1976.1966-70 - 1976/77 - Bureau of Agricultural Economics.
January 19, 1979
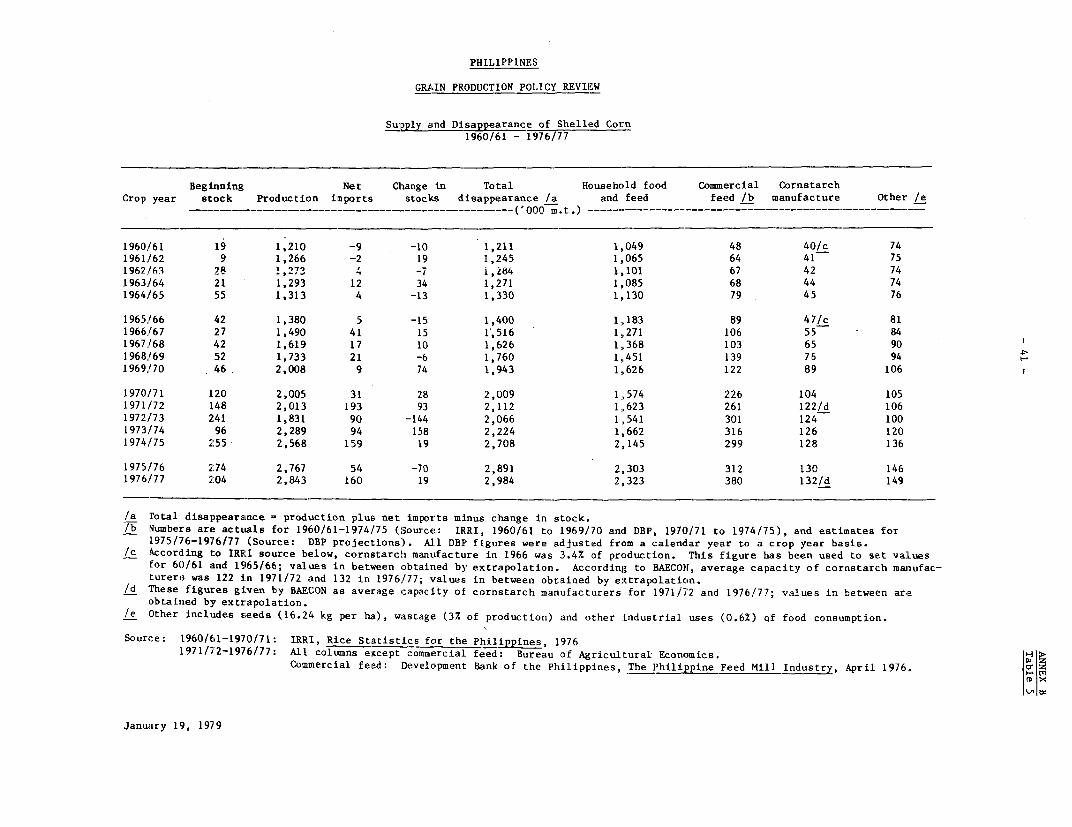
PHILIPPINES
GRLIN PRODUCTION POLICY REVI13W
Sulpply aLnd Disappearance of Shelled Corn1960/61 - 1976/77
BegiLnning; Net Clhange in Total Household food Commercial CornstarchCrop year stock Production imnports stocks disappearance /a and feed feed /b manufacture Other /e…----------------…------------('000 m.t.) ----------- …______________________-_-_
1960/61 19 1,210 -9 -10 1,211 1,049 48 40D/c 741961/62 9 1,266 -2 19 1,245 1,065 64 41 751962/63 28 1,273 4 -7 i,24 1,101 67 42 741963/64 21 1,293 12 34 1,271 1,085 68 44 741964/65 55 1,313 4 -13 1,330 1,130 79 45 76
1965,/66 42 1,380 5 -15 1,400 1,,183 89 47/c 811966,/67 27 1,490 41 15 1',516 1,271 106 55 841967,/68 42 1,619 17 10 1,626 1,368 103 65 901968/69 52 1,733 21 -6 1,760 1,,451 139 7,6 941969,/70 46 2,008 9 74 1,943 1,626 122 89 106
1970,171 120 2,005 31 28 2,009 1,574 226 104 1051971,/72 148 2,013 193 93 2,112 1,623 261 122/d 1061972/73 241 1,831 90 -144 2,066 1,541 301 124 1001973/74 96 2,289 94 158 2,224 1,662 316 126 1201974,/75 255 2,568 159 19 2,708 2,145 299 128 136
1975/76 274 2,767 54 -70 2,891 2,303 312 130 1461976/77 204 2,843 160 19 2,984 2,,323 380 132/d 149
/a Total disappearance = production plus net imports minus change in stock./b Numbers are actuals for 1960/61-1974/75 (Source: IRRI, 1960/61 to 1969/70 and DBP,, 1970/71 to 1974/75), and estimates for
1975/76-1976/77 (Source: DBP projections). All DBPi figures were adjusted from a calendar year to a crop year basis./c According to IRRI source below, cornstarch manufacture in 1966 was 3.4% of productiLon. This figure has been used to set valuesfor 60/61 and 19165/66; values in between obtained byt extrapolation. According to BAECON, average capacity of cornstarch manufac--turers was 122 in 1971/72 and 132 in 1976/77; values in between obtained by extrapolation.
/d These figures given by BAECON as average capacity of cornstarch manufacturers for 11971/72 and 1976/77; values in between areobtained by extr apolation.
/e Other incltudes seeds (16.24 kg per ha), wastage (3% of production) and other industrial uses (0.6%) of food consumption.
Source: L960/61-1970/71: IRRI, Rice Statistics for the! Philippines, 19761971/72-1976/77: All columns except commercial feed: Bureau of Agriculitural Econcmics.,
Commercial feed: Development Bank of the Philippines, The Philippine Feed Mill Industry, April 1976. a,1x
January 19, 1979
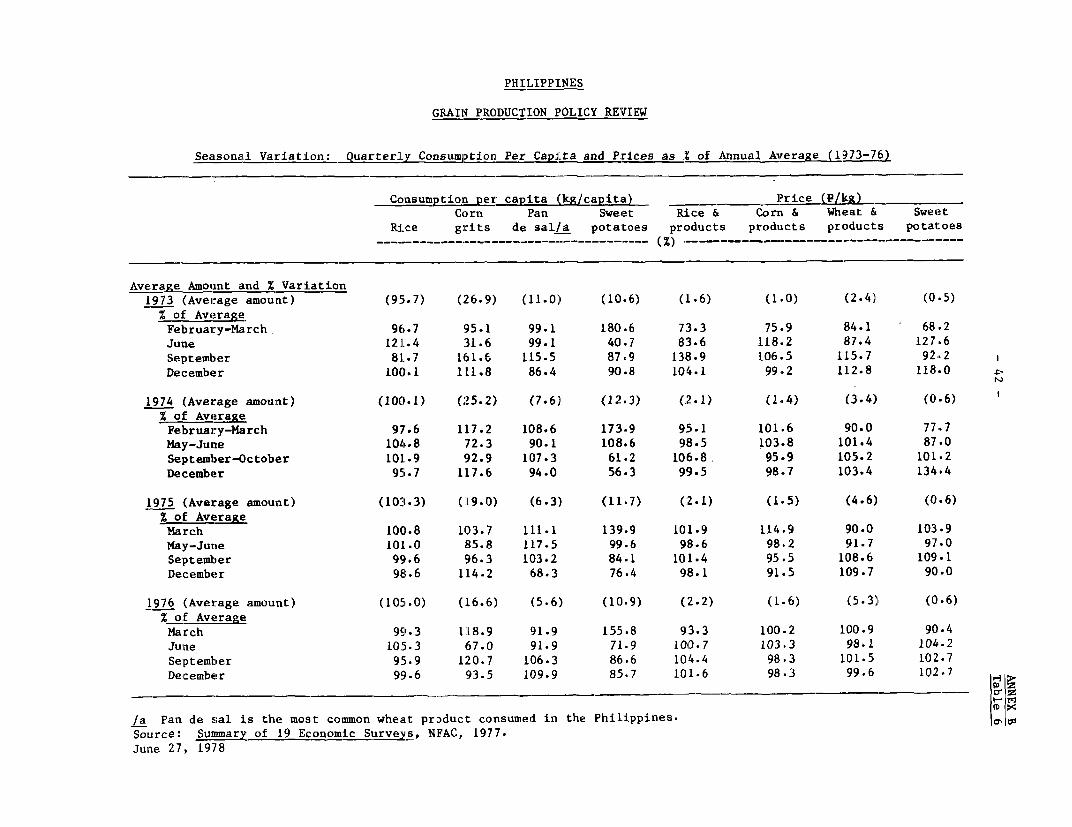
PHILIPPI]NES
GRAIN PRCODUCTION POLICY RE'VIEW
Seasonal Variation: Quarterly Consumption Per_CapLta and Prices as % of Annual Average (1973-76)
Consumptio per capita 'kcapita) __ _ rice(Corn Pan Sweet Rice Et Co n & Wheat St Sweet
Rice grits de sall'a potatoes products products products potatoes
.- ~( )---------
Avetrage Amount and % Variation1973 (Average amount) (95.7) (26.9) (11.0) (10.6) (1.6) (1.0) (2-4) (0-5)% of AverageFebruary-March. 96.7 95.1 99.1 180.6 73.3 75.9 84.1 68.2June 12]L.4 31.6 99.1 40.7 83.6 118.2 87.4 127,.6September 81.7 161.6 115.5 87.9 138,.9 106.5 115.7 92,.2 1December 100.1 111.8 86.4 90.8 104.1 99.2 112.8 118.0
1974 (Average amount) (100.1) (;25.2) (7.6), (12.3) (2-1) (1-4) (3.4) (0.6)X of AverageFebruary-March 97.6 117.2 108.6 173.9 9,5.1 101.6 90.0 77,.7May-Junie 104.8 72.3 90.1 108.6 9,B.5 103.8 101.4 87.0September-October 101-9 92.9 107.3 61.2 106.8 95.9 105.2 101.2December 95.7 1L7.6 94.0 56.3 99.5 98.7 103.4 134.4
1975 (Average amount) (103-3) (]L9.0) (6.3) (11.7) (:2.1) (1.5) (4.6) (0-6)o f AverageMarch 100.8 103.7 111.1 139.9 101.9 114.9 90.0 103.9May-Junie 101.0 135.8 117.5 99.6 98.6 98.2 91.7 97.0September 99.6 96.3 103.2 84.1 101.4 95,.5 108.6 109.1December 98.6 114.2 68.3 76.4 9,8.1 91.5 109.7 90.0
1976 (Average amount) (105.0) (]L6.6) (5-6) (10.9) (2.2) (1.6) (5-3), (0.6)Z of Average
March 99.3 1'18.9 91.9 155.8 93.3 100.2 100.9 90.4June 105.3 67.0 91.9 71.9 100.7 103.3 98.1 104.2Selptember 95 .9 120.7 106.3 86.6 104-4 98.3 101.5 102.7December 99 .6 93.5 109.9 85.7 101.6 98.3 99.6 102.7
/a Pan de sal is the most common wheat product: consumel in the PhiliLppines. oSource: SumMary of 19 Economic Surveys, NFAC, 1977.June 27, 1978
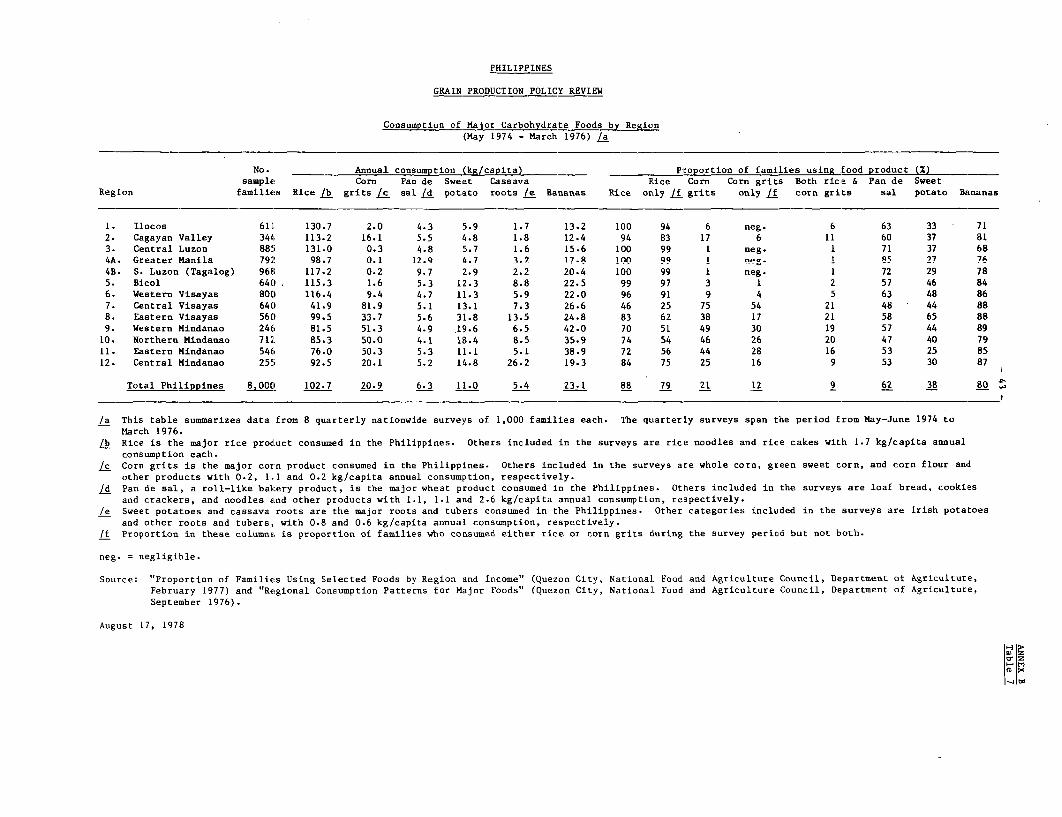
PHILIPP?INES
GRAIN PRODU[CTION POLICY REVIEW
Consumption of Major Carbohydrate Foods by Region(May 1974 - March 1976). /a
No. Anmnual consumption (kg/capita) Proportion of families uLsing food product (X)samplet Corn Pan de Sweet Cassava ELice Corn Corni grits Both rica & Pan de Sweet
Region families Rice /b grits /c sal Ld- potato roots Jie Bananas Rice or,ly /f grits onily /f corn grits sal potato Bananas
1. Ilocos 611, 130.7 2.0 4.3 5.9 1.7 13.2 100 94 6 neg. 6 63 33 712. Cagayan Valley 344 113.2 16.1 5. 5 4.8 1.13 12.4 94 83 17 6 11 60 37 813.- Cenitral Luzon 885i 131.0 03.3 4.8l 5.7 1.65 15.6 100 9 9 1 iieg. 1 7 1 37 684A. Greater Manilai 792 98.7 0.1 12.5 6..7 Li 17.R inn 99 1 n-o. 1 85 27 764B. S. Luzon (Tagallog) 968 117.2 0.2 9.7 2.9 2. 2 20.4 100 99 1 nieg. 1 72 29 785. Bic-ol 640 115.3 L.6 5. 3 12.3 8.83 22.5 99 97 3 1 2 57 46 846. Western Visayas 800 116.4 9.4 4.7 11.3 5.9 22.0 96 91 9 4 5 63 48 867. Central Visayas 640 41.9 81.9 5. 1 13.1 7. 3 26.6 46 25 75 54 21 48 44 888. Easitern Visaysts 560 99.5 331.7 5 .6E 31.8 13.5 24.8 83 62 38 17 21 58 65 889. Western Mindansao 246 81.5 5:1.3 4.9 19.6 6.5 42.0 70 51 49 30 19 57 44 89
L0. Northern Mindamao 712 85.3 50.0 4.1 1B.4 8.5 35.9 74 54 46 26 20 47 40 7911. Eastern Kindansao 546 76.0 50.3 5. 3 11.1 5.L 38.9 72 56 44 28 16 53 25, 8512. Cenitral Mindanao 255 92.5 20.1 5.2 14.8 26.2 19.3 84 75 25 16 9 53 30 87
Tota!l Philippines 8.00C! 102.7 20.9 6.-3 11.0 5.4$ 23.1 88 79 21 LZ 9 62 38, 80
/s This table summairizes data from 8B quarterly nationwide surveys of 1,000 families each. The quLarterly surveys sipan the period from May-June 1974 toMarch 1976.
/b Rice is the major rice product consumed in ithe Philippines. Others included in the surveys are rice noodlles and rice cakes with 1.7 kg/capita annualconstumption eachi.
/c Corn grits is the major corn product consumed in the Philippines. Others included in the surveys are whole corn, green sw,eet corn, and corn flour andother products with 0.2, 1.1 and 0.2 kg/capita annual consumption, respectively.
/d Pan cle sal, a roll-like bakLery product, is 'the major whieat product. consumed in the Philippines. Others included in the surveys are loaf bread, cookiesand crackers, and noodles and other products with 1.1, 1.1 and 2.6, kg/ciapita annual consumption, respectively.
/e Sweet: potatoes and cassava roots are the major roots arLd tubers consumed in the Ph:Llippines. Other categories included in the surveys are Irish potatoesand other roots and tubers, with 0.8 and 0.65 kg/capita annual consumption, respectiLvely.
/f Proportion in these columnEs is proportion of families rho consumed, either rice or corn grits dluring the survey period but not both.
neg. = negligible.
Source: "Proportioni of Families Usinag Selected Foods by Region and Inicome" (Quezon CitLy, National- Food and ALgriculture Council, Department of Agriculture,February 1977) and "Regional Consumption Patterns for Major Foods" (Quezon Cilty. NationaL Food and Agriculture Council, Department of Agriculture,September 1976).
August 1 7, 1978
|o) 10- ZI- 01
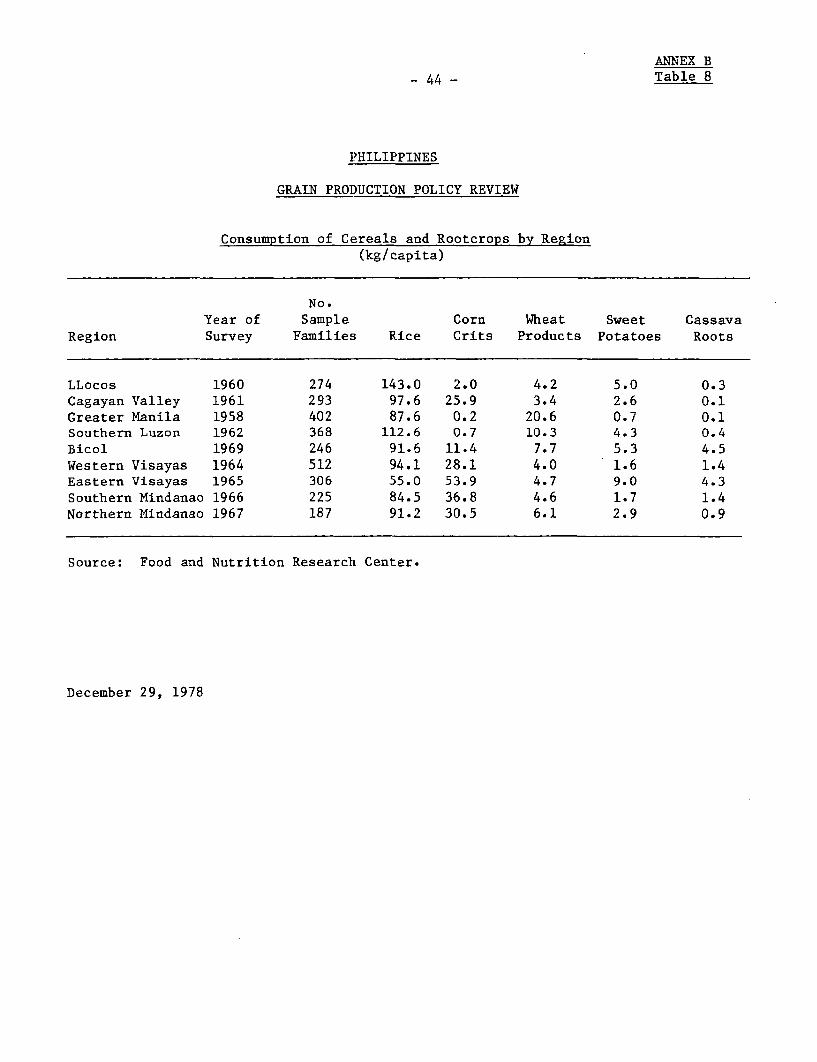
A .ThTVY 'a
44 Table 8
GRKAIN PROi)'UCTUION POLICY REVILW
Consumption of Cereals and Rootcrops by Region(kg/capita)
No.Year of Sample Corn Wheat Sweet Cassava
Region Survey Families Rice Crits Products Potatoes Roots
LLocos 1960 274 143.0 2.0 4.2 5.0 0.3Cagayan Valley 1961 293 97.6 25.9 3.4 2.6 0.1Greater Manila 1958 402 87.6 0.2 20.6 0.7 0.1Southern Luzon 1962 368 112.6 0.7 10.3 4.3 0.4Bicol 1969 246 91.6 11.4 7.7 5.3 4.5Western Visayas 1964 512 94.1 28.1 4.0 1.6 1.4Eastern Visayas 1965 306 55.0 53.9 4.7 9.0 4.3Southern Mindanao 1966 225 84.5 36.8 4.6 1.7 1.4Northern Mindanao 1967 187 91.2 30.5 6.1 2.9 0.9
Source: Food and Nutrition Research Center.
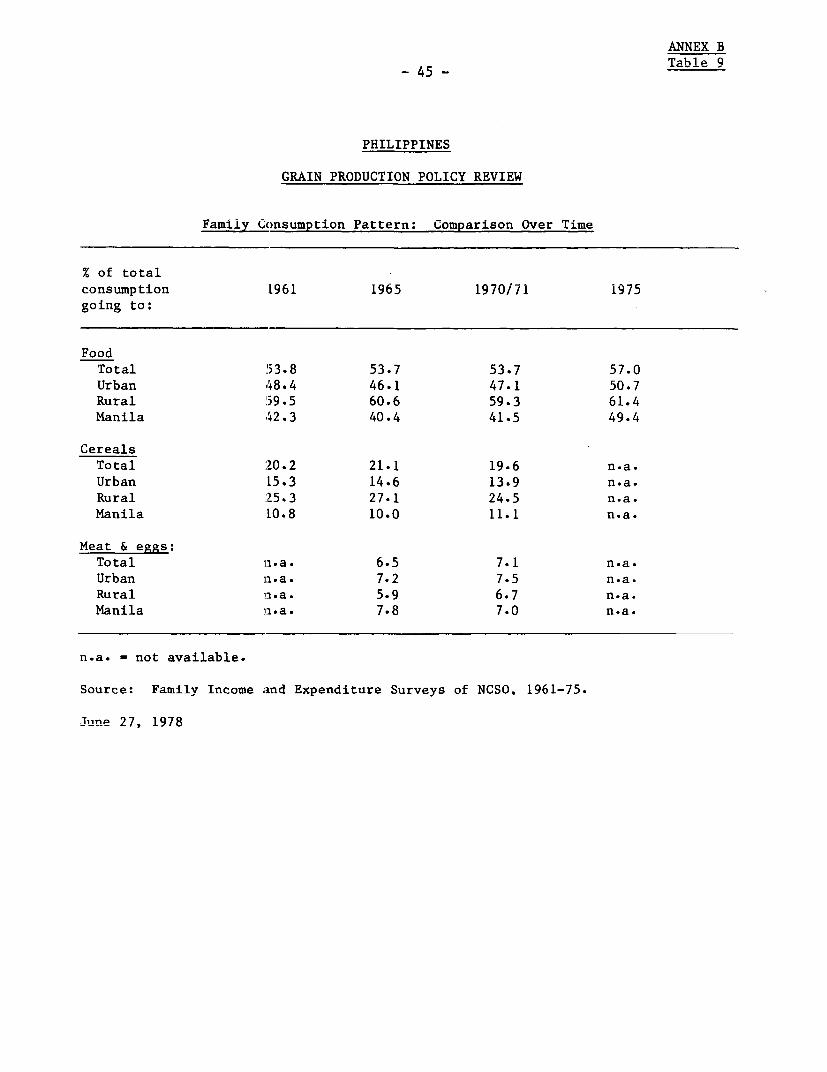
ANNEX BTable 9
-45-
PHILIPPINES
GRAIN PRODUCTION POLICY REVIEW
Family Consumption Pattern: Comparison Over Time
% of totalconsumption L961 1965 1970/71 1975
going to:
FoodTotal 53.8 53.7 53.7 57.0
Urban 48.4 46.1 47.1 50.7
Rural 59.5 60.6 59.3 61.4
Manila 42.3 40.4 41.5 49.4
CerealsTotal 20.2 21.1 19.6 n.a.
Urban L5.3 14.6 13.9 n.a.
Rural 25.3 27.1 24.5 n.a.
Manila L0.8 10.0 11.1 n.a.
Meat & eggs:Total n.a. 6.5 7.1 n.a.
Urban :a.a. 7.2 7.5 n.a.
Rural ni.a. 5.9 6.7 n.a.
Manila i.a. 7.8 7.0 n.a.
n.a. = not available.
Source: Family Income and Expenditure Surveys of NCSO, 1961-75.
June 27, 1978
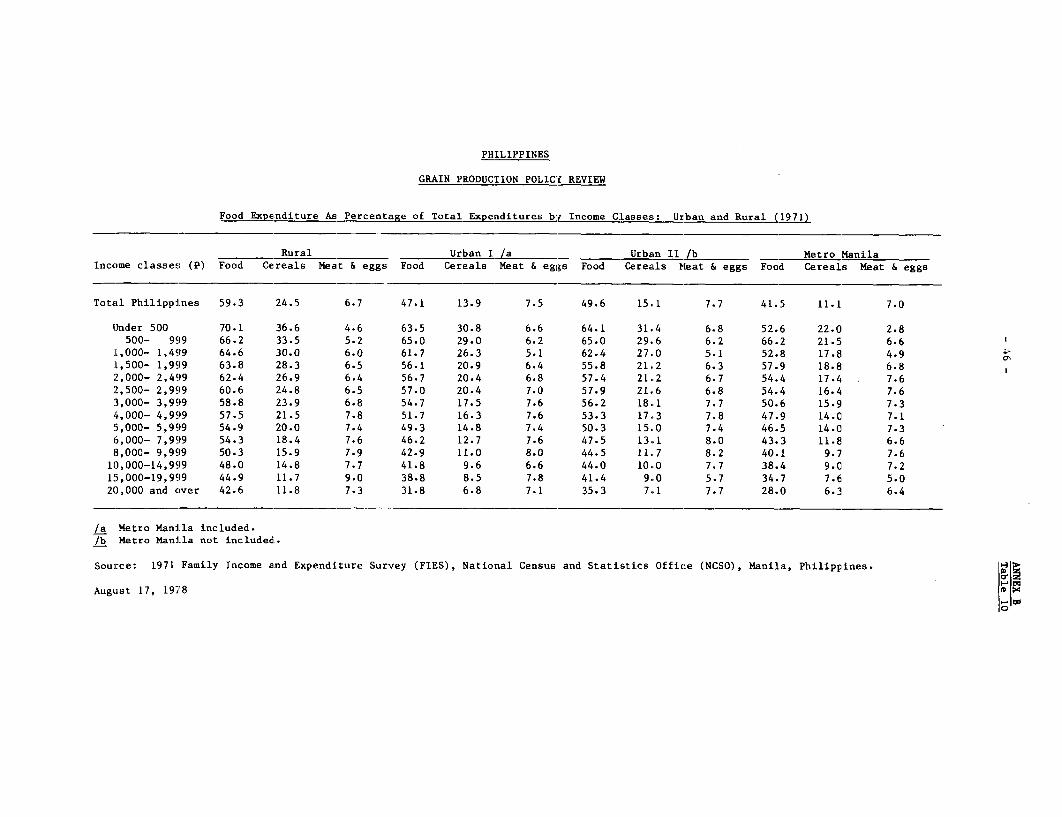
PHILIPPINES
GRAIN PRODUCTION POLIC'Y REVI[EW
Food Expenditure As Percentage of Total Expenditures by Income CLasseEs: Urban and Rural (1971)
Rural Urban I /a _ Urban II /b __ _ Metro ManilaIncome classes (P) FoodL Cereals Meat & eggs Food Cereals Meat & eggs Food Cereals Meat & eggs Food Cereals Meat & eggs
Total Philippines 59.3 24.5 6.7 47.1 13.9 7.5 49.6 15.1 7.7 41.5 11.1 7.0
tUnder 500 70.1 36.6 4.6 63.5 30.8 6.6 64.1 31.4 6.8 52.6 22.0 2.8500-- 999 66.2 33.5 5.2 65.0 29.0 6.2 65.0 29.6 6.2 66.2 21.5 6.6 1
]L,000-- 1,499 64.l6 30.0 6.0 61.7 26.3 5.1 62.4 27.0 5.1 52.8 17.8 4.9 >
IL,500- 1,999 63.8E 28.3 6.5 56.1 20.9 6.4 55.8 21.2 6.3 57.9 18.8 6.82,000-- 2,499 62.4 26.9 6.4 56.7 20.4 6.8 57.4 21,2 6.7 54.4 17.4 7.62,500-- 2,999 60.6E 24.8 6.5 57.0 20.4 7.0 57.9 21-.6 6.8 54.4 16.4 7.63,000-- 3,999 58.El 23.9 6.8 54.7 17.5 7.6 56.2 18.1 7.7 50.6 15.9 7.34i,000-- 4,999 57 .5 21.5 7.8 51.7 16.3 7.6 53.3 17.3 7.8 47.9 14.0 7.15,000-- 5,99S9 54.91 20.0 7.4 49.3 14.8 7.4 50.3 15.0 7.4 46.5 14.0 7.36,000-- 7,999 54.31 18.4 7.6 46.2 12.7 7.6 47.5 13,.1 8.0 43.3 11.8 6.68,000-- 9,9S99 50.3; 15.9 7.9 42.9 11.0 8.0 44 .5 11.7 8.2 40.1 9.7 7.6
10,000--14,99'9 48.0C 14.8 7.7 41.8 9.6 6.6 44.0 10.0 7.7 38.4 9.0 7.21 ;5,O0--19,9919 44.91 11.7 9.0 38.8 8.5 7.8 41.4 9,0 5..7 34.7 7.6, 5.020,000 and over 42.6 11.8 7.3 31.8 6.8 7.1 35.3 7.1 7.7 28.0 6.3 6.4
/a Metro Manila includetd./b Metro Manila not included.
Source: 1971 Family Income and Expenditure Survey (FIES), National Census and Statistics Office (NCSO), Manila, Philippines.
August 17, 1978 o- t0
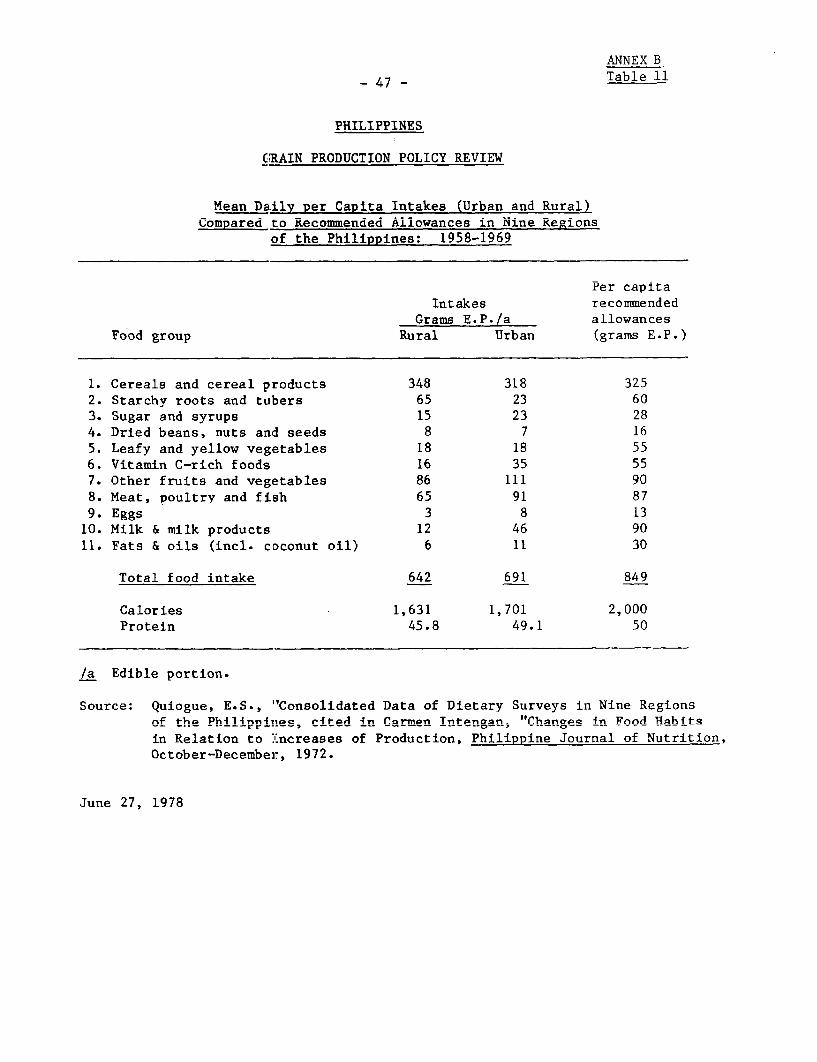
ANNEX B_ 47 - Table 11
G,ARIN PRODUCTiON POLICY REVIEW
Mean Daily per Capita Intakes (Urban and Rural)Compared to Recommended Allowances in Nine Regions
of the Philippines: 1958-1969
Per capitaIntakes recommended
Grams E.P./a allowancesFood group Rural Urban (grams E.P.)
1. Cereals and cereal products 348 318 3252. Starchy roots and tubers 65 23 603. Sugar and syrups 15 23 284. Dried beans, nuts and seeds 8 7 165. Leafy and yellow vegetables 18 18 556. Vitamin C-rich foods 16 35 557. Other fruits and vegetables 86 111 908. Meat, poultry and fish 65 91 879. Eggs 3 8 13
10. Milk & milk products 12 46 9011. Fats & oils (incl. coconut oil) 6 11 30
Total food intake 642 691 849
Calories 1,631 1,701 2,000Protein 45.8 49.1 50
/a Edible portion.
Source: Quiogue, E.S., "Consolidated Data of Dietary Surveys in Nine Regionsof the Philippines, cited in Carmen- Intengan, "Changes in Food Hahitsin Relation to Increases of Production, Philippine Journal of Nutrition,October-Decetaber, 1972.
June 27, 1978
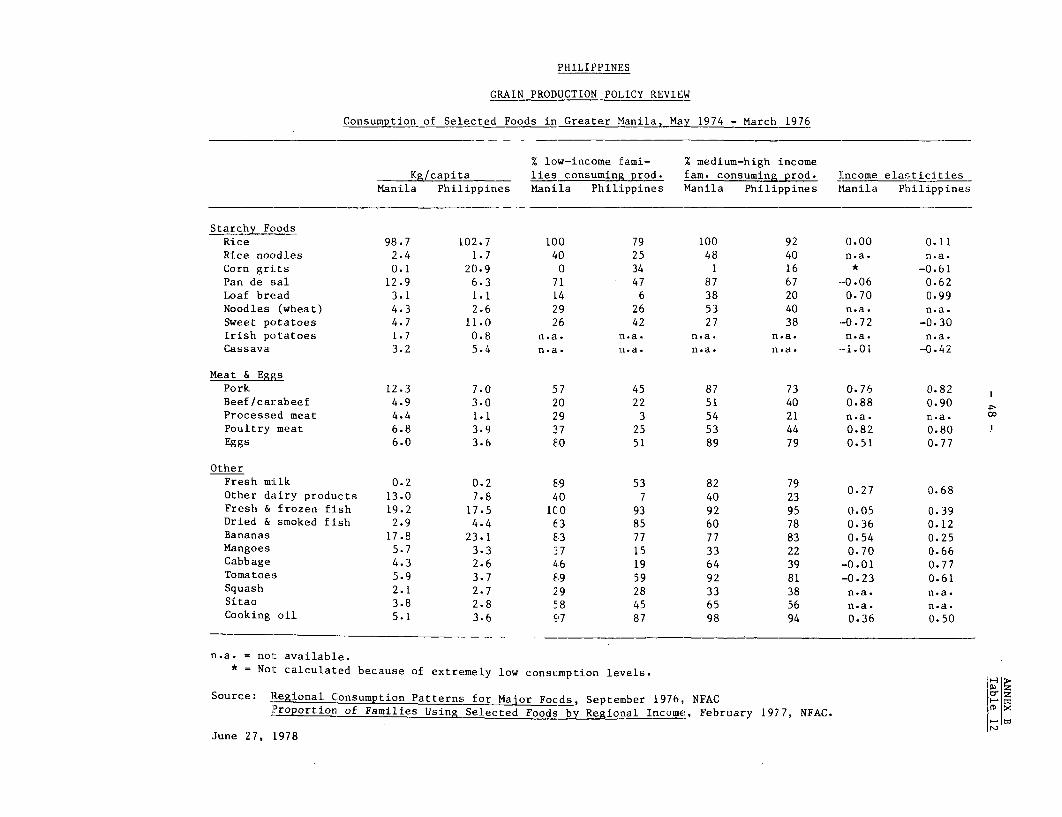
PHILIPPINES
GRAIN PRODUCTICIN POLICY REVIEW
Consumpt:Lon of Selectecl Foods in Greater Manila, May 1914 - March 1976
% low-income fEami- % medlium-high incomeKg/capita lies consuming prod. fam. consuming prod. Income elasticities
Manila Philippines Manila Philippines Manila Philippines Manila Philippines
Starchy F)odsRice 98.7 102.7 100 79 100 92 0.00 0.11Rice noodles 2.4 1.7 40 25 48 40 n.a. n.a.Corn grits 0.1 20.9 0 34 1 16 * -0.61Pan de sal 12.9 6.3 71 47 87 67 *-0.06 0.62Loaf bread 3.1 1.1 14 6 38 20 0.70 0.99Noodles (wheat) 4.3 2.6 29 26 53 40 n.a. n.a.Sweet potatoes 4.7 11.0 26 42 2,7 38 *-0.72 -0.30Irish potatoes 1.7 0.8 n.a. n.a. n.a. n.a. n.a. n.a.Cassava 3.2 5.4 n.a. n.a. n.a. n.a. -- 1.0i -0.42
Meat & EggsPork 12.3 7.0 57 45 87 73 0.76 0.82Beef/carabeef 4.9 3.0 20 22 51 40 0.88 0,.90 4Processed meat 4.4 1.1 29 3 54 21 n.a. n a. 00Poultry meat 6.8 3.9 37 25 53 44 0.82 0,,80Eggs 6.0 3.6 80 51 893 79 0.51 0.77
OtherFresh m:ilk 0.2 0.2 89 53 82 79 0.27 0.68Other dairy products 13.0 7.8 40 7 40 23Fresh & frozen fish 19.2 17.5 100 93 92 95 0.05 0.39Dried & smoked fish 2.9 4.4 63 85 60 78 0.36 0.12Bananas 17.8 23.1 83 77 77 83 0.54 0.25Mangoes 5.7 3.3 37 15 3:3 22 0.70 0.66Cabbage 4.3 2.6 46 19 64 39 -0.01 0.77Tomnatoes 5.9 3.7 89 59 92 81 -0.23 0.61Squash 2.1 2.7 29 28 3:3 38 n.a. n.a.Sitao 3.8 2.8 58 45 65 56 n.a. n.a.Cooking oil 5.1 3.6 97 87 98 94 0.36, 0.50
n.a. = not available.* = NotL calculated because of extremely low consumption levels.
Source: Regional Consumption Patterns for Major Foods, September 1976, NFACProportion of Families Using Selected Foods by egional Income, February 1977, NFAC. - r
June 27, 1978

ANNEX B49 - Table 13
PHILIPPINES
GRAIN PRODUCTION POLICY REVIEW
Income Elasticities of Selected Items
Lowest to Medium low to Medium high Lowest toItem medium low medium high to highest highest
income group income group income group income group
Rice & rice products (all) 0.09 0.13 0.03 0.11All rice 0.08 0.12 0.02 0.09Rice noodles 0.46 0.47 0.30 0.54Rice cakes 0.42 0.70 0.04 0.45
Corn & corn products (aii.) -0.49 -0.76 -0.i9 -0.58Corn grits -0.53 -0.84 -0.27 -0.53Whole corn =0.19 =0.58 -0.48 -0.40Green corn -0.11 0.00 0.35 0.17
Wheat products (all) 0.62 0.53 0.33 0.63Pan de sal 0.56 0.38 0.18 0.49Loaf bread 1.03 1.35 0.62 0.99Cookies, crackers 0.68 0.34 0.43 0.65Wheat noodles, other 0.60 0.61 0.42 0.68
Pork (all) 0.72 0.84 0.41 0.77
Beef, carabeef (all') 0.64 1.0;0.45 0.80
Processed meat (all) 1=39 1.37 0.73 1.07
Chicken meat (all) 0.45 0.93 0.23 0.72
Eggs (all) 0.71 0.73 0.36 0.72
Dairy products (all) 0.66 0.79 0.26 0.68
Fresh/frozen fish (all) 0.28 0.37 0.13 0.34
Dried/smoked fish (all) 0.10 0.21 0.04 0.15
Fresh fruit (all) 0.20 0.50 0.26 0.42Bananas 0.49 0.35 0.16 0.25
All vegetables 0.01 0.27 0.13 0.18
Roots, bulbs, tubers (all) -0.24 0.09 0.04 -0-07Sweet potatoes -0.30 -u.14 -0.08 -0.24Onions 0.44 0.58 0.26 0.54Irish potlatoes :.25c 1.1,70.7;2
Garlic 0.36 0.39 0.32 0.48
Cooking oil 0.50 0.54 0.28 0.56
Source: Summary of 17 Economic Surveys, NFAC, 1976.June 27, 1978
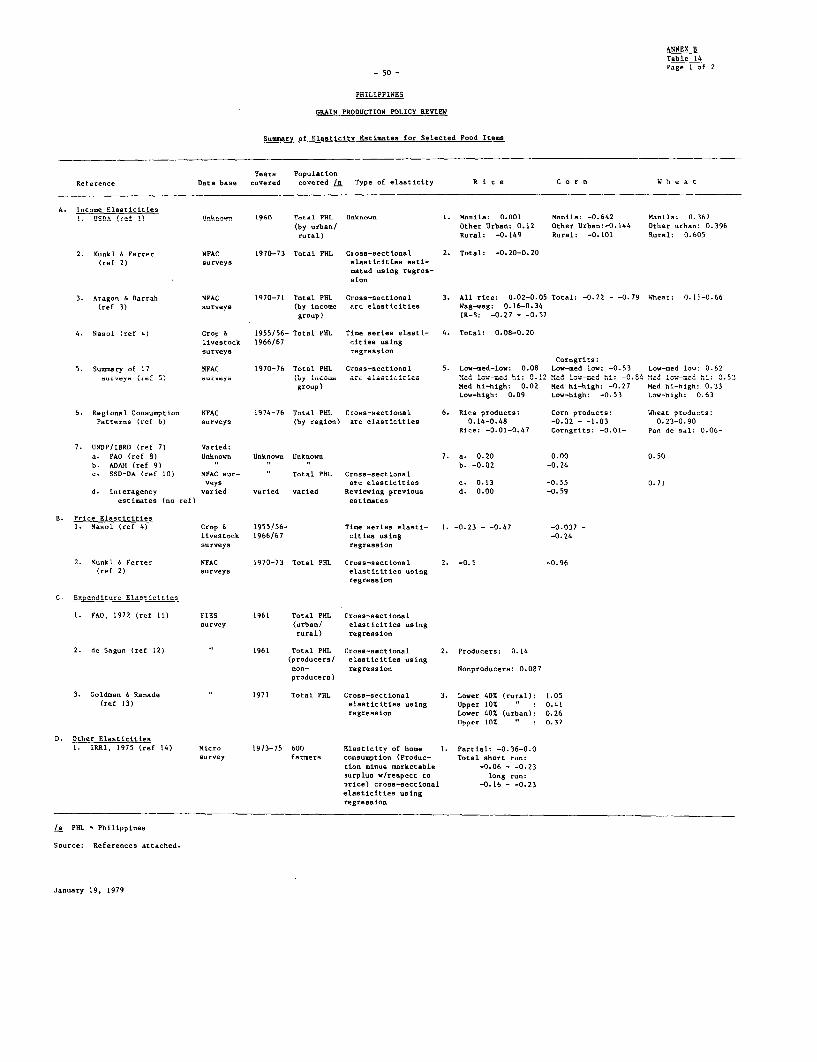
ANNEX B
Table 14
-50- Page I of 2
PHILIPPINES
GRAIN PRODUCTION POLICY REVIEW
Suemsary of Elasticity Eati=ates for Selected Food Items
Years PopulationReference Data base covered covered L. Type of elasticity R i c e C o r n W h e a t
A. Income Elasticities1. 0U5" (ref fl UI.kn.ow.n 1960 Total PHI nbrko-n 1. Mantil: 0.001 Manila: -0.642 Manila: 0.367
(by urban/ Other Urban: 0.12 Other Urban:-0.144 Other urban: 0.396rural) Rural: -0.149 Rural: -0.101 Rural: 0.605
2. KunkI A Ferrer NFAC 1970-73 Total PHL Cross-sectional 2. Total: -0.20-0.20(ref 2) surveys elasticities esti-
tated using regres-sion
3. Aragon & Darrah NFAC 1970-71 Total PHL Cross-sectional 3. All rice: 0.02-0.05 Total: -0.22 - -0.79 Wheat: 0.15-0.66(ref 3) surveys (by income arc elasticities Wag-wag: 0.16-0.34
group) tR-8: -0.27 - -O.57
4. Nasol (ref 4) Crop a 1955/56- Total PHL Tine aeries elastt- 4. Total: 0.08-0.20
livestock 1966/67 c:ities usingsurveys regression
Corngrits:5. Sunmary of 17 NFAC 1970-76 Total PHL Cross-sectional 5. Lov-med-low: 0.08 Low-med low: -0.53 Log-med low: 0.62
.. rveys reurveys(ty incom arc easmtticitie e lo~e hi: .12 Had low=m hi: -5.84Mdlo.. h:05
group) Med hi-high: 0.02 Med hi-high: -(.27 Med hi-high: 0.33Low-high: 0.09 Low-high: -0.53 Low-high: 0.63
6. Regional Consumption NFAC 1974-76 Total PHL Cross-sectional 6. Rice products: Corn products: Wheat products:Paeterns (ref 6) surveys (by region) arc elasticities 0.14-0.48 -0.02 - -1.03 0.23-0.90
Rice: -0.01-0.47 Cor-grits: -0.01- Pan de sal: 0.06-
7. UNDP/IBRD (ref 7) Varied:a. FAO (ref 8) Unknown Unknown Unknown 7. a. 0.20 0.00 0.50b. ADAII (ref 9) b. -0.02 -0.24c. Ssi-DA (ref 1U) NPAC sur- Total PfL Cross-sectional
veys arc elasticities c. 0.13 -0.55 0.71d. Interagency varied varied varied Reviewing previous d. 0.00 -0.59
estimates (no ref) estimates
B. Price Elasticities1. Nasol (ref 4) Crop A 1955/56- Tine series elasti- 1. -0.23 - -0.47 -0.037 -
ltvtetock ;9,6667 ctt;.s ueing -0.24surveys regression
2. Kunkl 4 Ferrer NFAC 1970-73 Total PHL Cross-sectional 2. -0.5 -0.96(ref 2) surveys elasticities using
regression
C- Expen.diture Elasticities
1. FAO. 1972 (ref 11) FIgS 1961 Total PHL Cross-sectionalsurvey (urban/ elasticities using
rural) regression
2. de Sagun (ref 12) 1961 Total PHL Cross-sectional 2. Producers: 0.14(Produrersl elustirtlles euntag
non- regression Nonproducers: 0.087producers)
3. Goldman 6 Ranade 1971 Total PHL Cross-sectional 3. Lower 40X (rural): 1.05
(ref 13) elasticities using Upper 102 : 0.41regression Lower 402 (urban): 0.26
Upper lOt : 0.37
D. Other Elasticities1. IRI, 1975 (ref 14) Micro 1973-75 600 ilasticity of hooe 1. Partial: -0.36-0.0
survey farmers consumption (Produc- Total short run:
Lion minus marketable -0.06 - -0.23surplus w/respect to long run:3rice) cross-sectional -0.16 - -0.23elasticities usingregression
/a PHL - Philippines
Source: References attached.
January 19, 1979
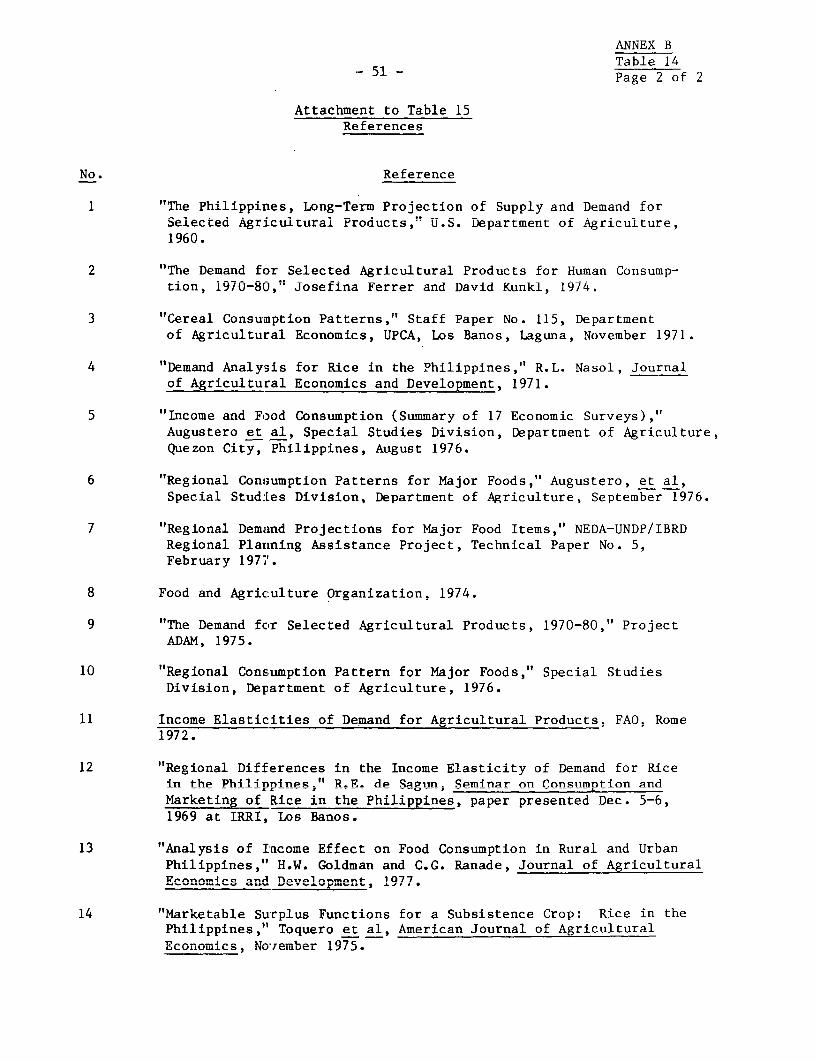
ANNEX BT a ble 1 4
-51 - Page 2 of 2
Attachment to Table 15Ref erences
No. Reference
1 "The Philippines, Long-Term Projection of Supply and Demand forSelected Agricultural Products," U.S. Department of Agriculture,1960.
2 "The Demand for Selected Agricultural Products for Human Consump-tion, 1970-80,:: Josefina Ferrer and David Kunkl, 1974.
3 "Cereal Consumption Patterns," Staff Paper No. 115, Departmentof Agricultural Economics, UPCA, Los Banos, Laguna, November 1971.
4 "Demand Analysis for Rice in the Philippines," R.L. Nasol, Journalof Agricultural Economics and Development, 1971.
5 "Income and Food Consumption (Summary of 17 Economic Surveys),"Augustero et al, Special Studies Division, Department of Agriculture,Quezon City, Philippines, August 1976.
6 "Regional Consumption Patterns for Major Foods," Augustero, et al,Special Stud:Les Division, Department of Agriculture, September 1976.
7 "Regional Demand Projections for Major Food Items," NEDA-UNDP/IBRDRegional Planning Assistance Project, Technical Paper No. 5,February 1977.
8 Food and Agriculture Organization, 1974.
9 "The Demand for Selected Agricultural Products, 1970-80," ProjectADAM, 1975.
10 "Regional Consumption Pattern for Major Foods," Special StudiesDivision, Department of Agriculture, 1976.
11 Income Elasticities of Demand for Agricultural Products, FAO, Rome1972.
12 "Regional Differences in the Income Elasticity of Demand for Ricein the Philippines;" R.E. de Sagtun. Seminar on Gonsumntion andMarketing of Rice in the Philippines, paper presented Dec. 5-6,1969 at TRRTj Tos Banos=
13 "Analysis of Income Effect on Food Consimntin in. Rural and Urban
Philippines," H.W. Goldman and C.G. Ranade, Journal of AgriculturalEconomics and Development, 1077.
14 "MaCr1ketaC-ble Surp-lu-s Funrctions for a- Sub-sist~ence Crop: R4 ce i-n thePhilippines," Toquero et al, American Journal of AgriculturalE Lconomics, 1U10vember 17/5.
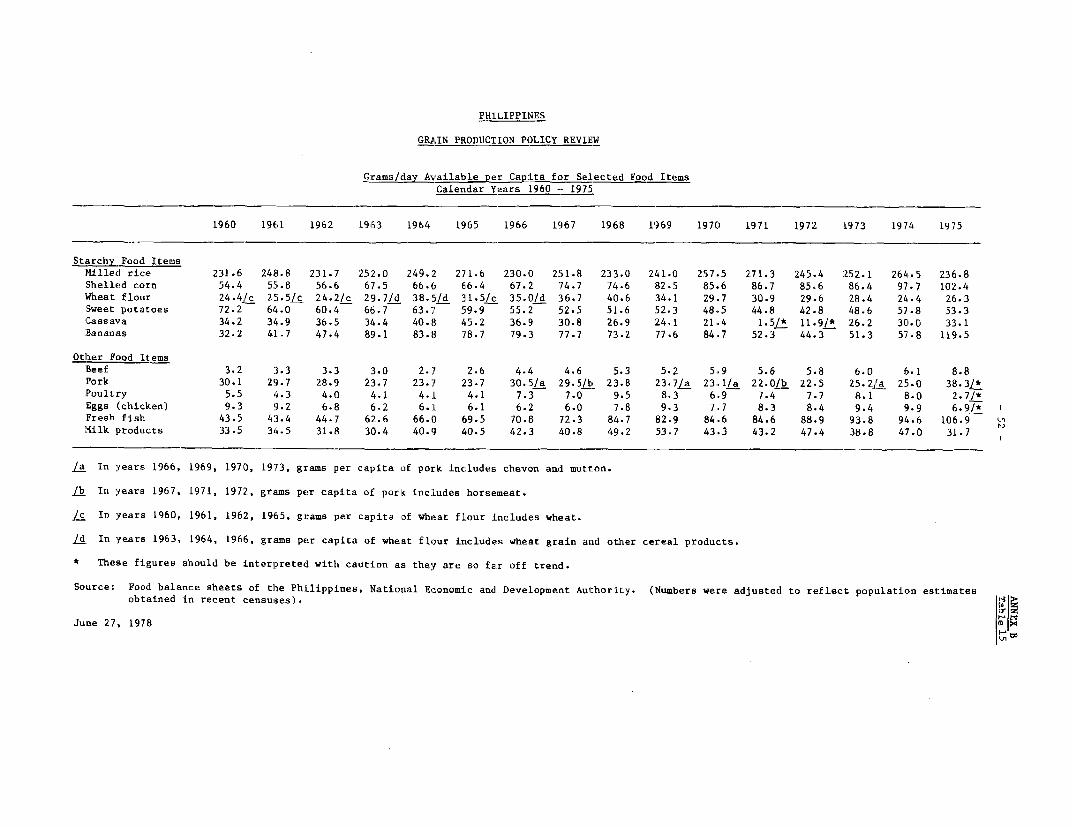
PHILIPPINES
GRAIN PRODUCTION POLICY REVIEW
Grams/day Available per Capita for Selected Food ItemsCalendar Years 1960 -- 1975
1960 196,1 1962 1963 1964 1965 1966 1967 1968 1969 1970 1971 1972 1973 1974 1975
Starchy Food ItemsMilled rice 231.6 248.8 231.7 252.0 249.2 271.6 230.D 251.8 233.0 241.0 257.5 271.3 245.4 252.1 264.5 236.8Shelled corn 54.4 55.8 56.6 67.5 66.6 66.4 67.2 74-7 74.6 82.5 85.6 86.7 85.6 86.4 97.7 102.4Wheat flour 24. 4 /c 2'i.5/ c 24.2/c 29.7/d 38.'d 31.5/c 35.0/d 36.7 40.6 34.1 29,7 30.9 29.6 28.4 24.4 26.3Sweet potatoes 72.2 64.0 60.4 66.7 63.7 59.9 55.2 '52.5 51.6 52.3 48.5 44.8 42.8 48.6 57-8 53.3Cassava 34.2 34.9 36.5 34.4 40.8 45.2 36.9 30.8 26.9 24.1 21,4 1.5/* 11.9/* 26.2 3C0.0 33.1Bananas 32.2 41-7 47.4 89.1 83.8 78-7 79.3 '77.7 73.2 77.6 84.,7 52.3 44.3 51.3 57.8 119.5
Other Food ItemsBeef 3.2 3.3 3.3 3.0 2.;7 2.6 4.4 4.6 5.3 5.2 5,,9 5.6 5.8 6.0 6.1 8.8Pork 30.1 29.7 28.9 23.7 23.7 23.7 30.54a '29.5/b 23.8 23.7La 23. I/a 22.0/b 22.5 25.2j(a 25'.0 38.3/!Poultry 5.5 4.3 4.0 4.1 4. 1 4.1 7.3 7.0 9.5 8.3 6.9 7.4 7.7 8.1 8.0 2.7/*Eggs (chicken) 9.3 9.2 6.8 6.2 6.'L 6.1 6.2 6.0 7.8 9.3 7.7 8.3 8.4 9.4 9.9 6.9/*Fresh fish 43.5 43.4 44.7 62.6 66.0 69.5 70.8 72.3 84.7 82.9 84.6 84.6 88.9 93.8 94.6 106.9 Ln
l!Silk products 33.5 34.5 31.8 30.4 40.9 40.5 42.3 40.8 49.2 53.7 43.3 43.2 47.4 38.8 4,7.0 31.7
/a In years 1966, 1969, 197D, 1973. grams per capita of pork includes chevon and mutton.
/b In years 1967, 1971, 1972, grams per capita of pork includes horsemeat.
/c In years 1960, 1961, 1962, 19655, grams per capita of wheat flour includes wheat.
/d In years 1963, 1964, 1966, grams per capita of wheat flour includes wheat grain and other cereal products.
* These figures should be interpreted with caution as they are so far off trend.
Source: Food balance sheets of the Philippines, National Economic and Development Authority. (Numbers were adjusted to reflect population est:imatesobtained in recent censuses).
June 27, 19718 x

ANNEX B- 53 - Table 16
PHILIPPINES
37RAIN PRODUCTION POLICY REVIEW
Chiclken and Hog Population of Backyardand Commerc:Lal Producers bv Region. January 1. 1976
Chicken ('000 heads) Hogs ('000 heads)Region RArkyv-rd rommercial Total fBckyard Commercial Total
LuzonIlocos 3,636.1 235.7 3,871.8 552.8 16.5 569.Cagayan Valley 3,061.9 10.6 3,072.5 705.9 12.7 718.5Centr,al Luzon A,A15 .7 1,882 .7 61 A . 4 QQ0 588.9 15. 73 .2
-- Ifl v - .FflvJ 9L u tI. 7 -j7
Southern Tagalog 4,466.9 4,296.9 8,763.8 584.1 190.9 775.0Bicol 3,9. 103.4A 3, iO. 1 495..3 '7.0 502.3
.J~ -7v vU LLIJt .j j VV L *t ya J I v Jv . .-
Total 18,780.' 6,529.3 25,309.u 2,927.0 '77.5 3,304.4
VisayasWestern Visayas 4,149.4 176.9 4,326.3 439.1 26.5 465.6Central Visayas 3,381.4 1,085.3 4,466.7 647.5 42.4 689.9Eastern Visayas 1,833.0 9.5 1,842.5 524.2 1.8 526.0
Total 9,408.8 1,271.7 10,635.5 1,610.8 70.7 1,681.5
MindanaoWestern Mindanao 2,060.3 8.9 2,069.3 287.9 3.0 290.9Northern Mindanao 3,545.5 116.7 3,662.2 664.5 30.2 694.7Southern Mindanao 3,600..8 393.4 3,994.2 424.8 93.0 517.7
Total 9,206.6 519.0 9,725.7 1,377.2 126.2 1,503.3
Philippines
Total 37,350.8 8,319.9 45,670.7 5,915.0 574.2 6,489.2
Source: BAECON.
October 2, 1978

ANNEX B- 54 ~ Table 17
PHILIPPINES
GRAIN PRODUCTION POLICY REVIEW
Growth of Meat Production and Livestock/Poultry Numbers, 1960-77
Animal population Meat productionYear Hogs Chickens Pork Poultry Eggs
---- ('000 head) ------------ ('OOO MT) -------------
1960 6.573 52,345 299.6 51.5 110.31961 6,191 49,984 365.7 44.6 131.01962 6.726 51,354 306.6 43.3 100.51963 6,234 48,624 258.9 45.2 89.41964 6,616 51.658 266.5 46.6 91.4
1965 6.939 56,929 274.4 48.1 92.61966 6,914 68,102 359.7 87.9 94.01967 5;497 66h489 361.0 86.8 92.11968 6,090 68,403 300.5 120.3 115.21969 6,3S0 62,528 305.1 108.3 139.9
1q7n 6 56,999 305.6 93.2 120.A
1971 7,050 56,512 301.0 101.9 133.11972 7,742 50,103 318 2 109=2 146.61973 8,627 49,965 357.8 117.1 180.91974 8,744 51,064 372.! 121.8 17!.
1975 6,602/a n.a. 570.0 42.5 155.11976 6,489 46,670 n.a. n.a. n.a.19 , -77 /, a .a n.a. n.a. n.a.
n.a. = not available.
/a Source: USDA Livestock Inventory.
Source: Livestock Numbers: BAECON (NEDA Statistical Yearbook)Meat Production: Food Balance Sheets of the Philippines, NEDA.
September 30, 1978
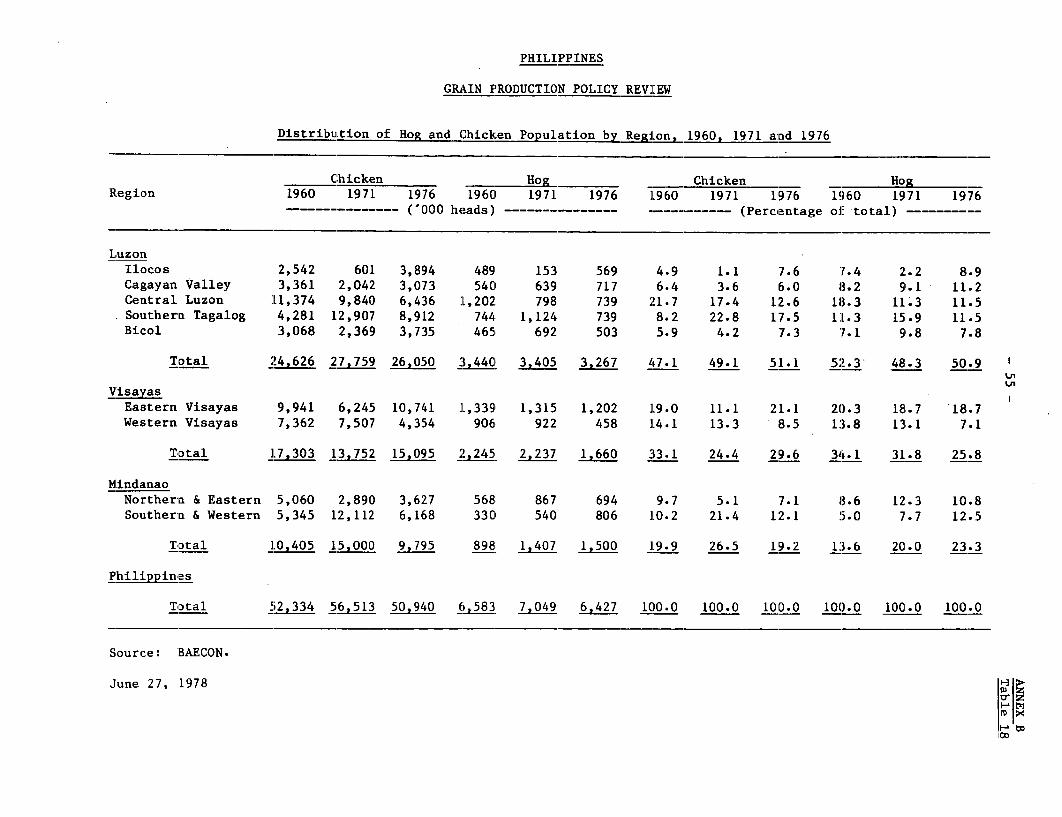
P'HILIPPINES
GRAIN P'RODUCTION POLICY REVI]EW
Dist:ribution of Hog and C'hicken Populatioin by RegJLon, 1960, 1971 and 1976
Chicken Hog Chicken Hog_ ____
Region 1960 1971 19715 19601 1971 1976 1960 1971 1976 1960 1971 1976_ _ ______-_- ('000 he!ads) -- … (Percentage of total) - --------
LuzonIlocos 2,542 601 3,894 489 153 569 4.9 1.1 7.6 7.4 2.2 8.9Cagayan Valley 3,361 2,042 3,07:3 54C1 639 717 6.4 3.6 6.0 8.2 9.1 11.2Central Luzon 1L1,374 9,840 6,436 ]L,202 798 739 21.7 17.4 12.6 18.3 11.3 11.5Southern Tagalog 4,281 12,907 8,912 744 1,124 739 8.2 22.8 17.5 11L.3 15.9 11.5Bicol 3,068 2,369 3,735 465, 692 503 5.9 4.2 7.3 7.1 9.8 7.8
Total 24,626 27,759 26.050 3,44C0 3,405 3,267 47.1 49.1 51.1 52.3 48.3 50.9
VisayasEastern Visayas 9,941 6,245 10,741L 1,339 1,315 1,202 1L9.0 11.1 21.1 20.3 18.7 18.7Western Visayas 7,362 7,507 4,354 906, 922 458 14.1 13.3 8.5 13.8 13.1 7.1
Total 17,303 13,752 15,095 2, 2451 2,237 1,660 33.1 24.4 29.6 34.1 31.8 25.8
MindanaoNorthern & Eastern 5,060 2,890 3,627 568 867 694 9.7 5.1 7.1 8.6 12.3 10.8Southern & Western 5,345 12,112 6,168 330 540 806 10.2 21.4 12.1 5.0 7.7 12.5
Total 10,4015 15,000 9,795i 898 1,407 1,500 19.9 26.5 19.2 13.6 20.0 23.3
Philippines
Total 52,334 56,513 5094(0 6,5831 7,049 6,427 100.0 100.0 100.0 100.0 100.0 100.0
Source: BAECON.
June 27, 1978a zm >4
cox

ANNEX B
- 56 - Table 19
PHILIPPINES
GRAIN PRODUCTION POLICY REVIEW
Consumption of Corn in Production of Feedby Commercial Reed Millers, 1964-1974
Feed Production Raw Material UsedTotal Poultry Swine Other Yellow Wlhite Totalfeed feed feed feed corn corn corn
________________------ -'000 T --------------- =-
1964 180 136 28 17 n.a. n.a. n.a.19o5 1633 11 " " "1966 261 192 53 16 "1967 262 194 49 18 it1968 315 244 52 19
1970 323 262 44 16 76 134 2101971 JIJ 256 4j 11 97 145 2L421972 436 329 88 18 106 174 2801973 4 425 36 54 15 135 186 3211974 450 374 59 17 105 205 310
n.a. = not available
Source: Philippine Feedmill Industry, Development Bank of the Philippines,April 1976.
ANNEX C- 57 - Page 1
GRAIN PRODUCTiON POLICY REvIE'W
Rice: Prices and Market Margins
introduction
1. The rice economy in the Philippines has been characterized byincreasing governmedit involvement, especially in the formation of prices.The primary objectives of the policy have been to provide sufficient suppliesof rice to consumers at the lowest possible cost and to provide adequateincome incentives to producers to induce them to increase domestic output.These two potentially conflicting goals have been given varying relativeemphasis over time, de;?ending on changes in the physical and economic environ-ment, and on political considerations. Consequently, the terms of trade withrespect to rice have shifted between consumers and producers, generallymoving in inverse direction for the two groups.
2. The means of implementing government policy have centered onmeasures to reduce faruers' costs of production through, for example, control-ling farm input prices and extending credit on favorable terms, and onmarket intervention by public agencies to reduce supply and demand imbalancesover time and among geographic locations. While there is no subsidy onfertilizers at present, rice producers are exempt from paying taxes andduties on fertilizers./l The exemption gives them a financial advantage ofup to 50% over producers of major commercial crops other than grains. Thegovernment support prices and prices actually received by farmers during theperiod 1965-77, presented below, indicate that market forces generallyoreavailed ower govPrnme t's efforts tn maintain floor prices at the fnrmlevel, i.e. average farm prices dropped below the official level in betterthan normal production years and rose above it in noorer years.
/1 There is no economic subsidy on fertilizers in the sense that prices paidby frmr are cnitetq w LA . ._uArent wol m JArke AA t price. A10ee ,U)' aL LUCJ. D d. c LAIL~ LD LCILL WJ. LIILL t II L lL WIJA LU IUGL SC- L- LLCO * IIJW=V CL
some of the fertilizers sold at present come from stocks held over fromtIhe hi.gh cost period of a coup'le of years ago anA go vernLment i9 incurr4nglosses by selling these for less than they were originally purchased.I.L aUddLLILLion , sonue high=costk ULoca'L fertilizer manufacturers may lue r-ceiLvingsome indirect governiment assistance.
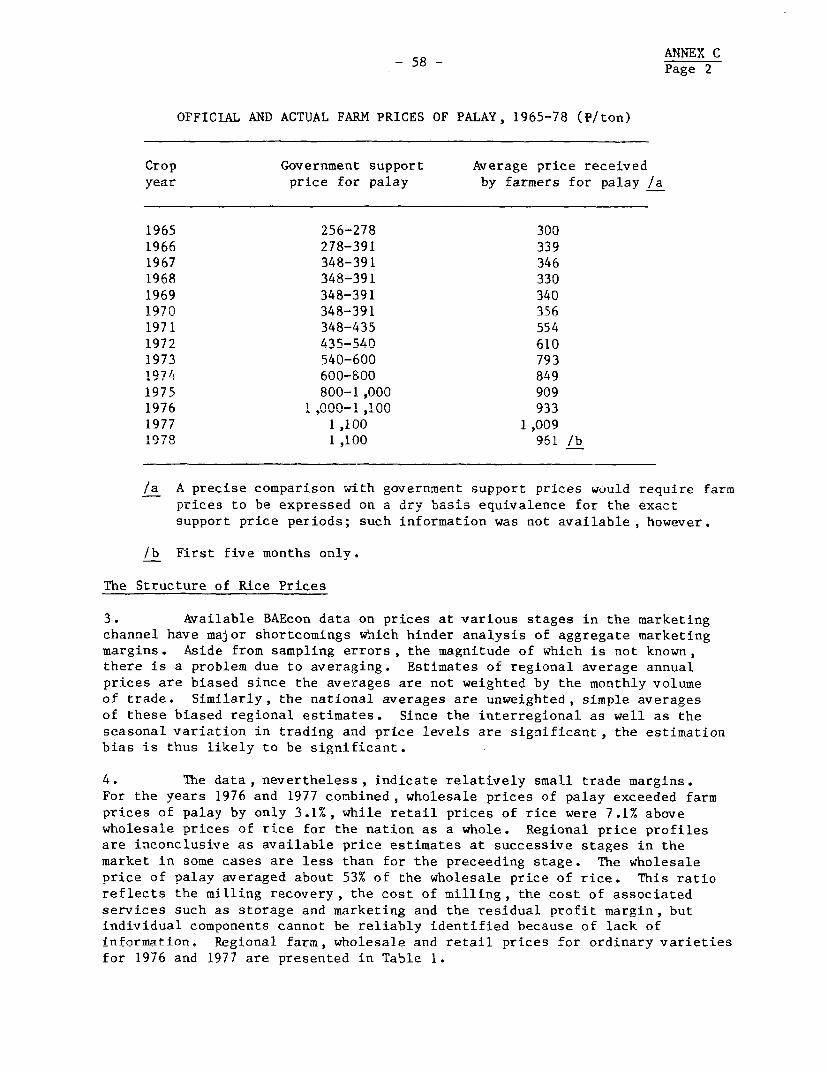
ANNEX CPage 2
OFFICIAL AND ACTUAL FARM PRICES OF PALAY, 1965-78 (P/ton)
Crop Government support Average price receivedyear price for palay by farmers for palay /a
1965 256-278 3001966 278-391 339
1967 348-391 3461968 348-391 330
1969 348-391 3401970 348-391 356
1971 348-435 554
1972 435-540 6101973 540-600 7931974 A00-ROO 849
1975 800-1,000 9091 0-79. i nno-i inon ' 1976 1,000-1,100 ~~~~~~9331977 1,100 1,0091fl7Q 1 flO 961 /1,
/a A precise comparison with government support prices would require farm
prices to be expresseu on a Ury basis equivalece tfor thLe exact
support price periods; such information was not available, however.
/b First five months only.
The Structure of Rice Prices
3. Available BAEcon data on prices at various stages in the marketingchannel have major shortcomings which hinder analysis of aggregate marketing
margins. Aside from sampling errors, the magnitude of which is not known,there is a problem due to averaging. Estimates ot regional average annual
prices are biased since the averages are not weighted by the monthly volume
of trade. Similarly, the national averages are unweighted, simple averages
of these biased regional estimates. Since the interregional as well as the
seasonal variation in trading and price levels are significant, the estimationbias is thus likely to be significant.
4. The data, nevertheless, indicate relatively small trade margins.
For the years 1976 and 1977 combined, wholesale prices of palay exceeded farm
prices of palay by only 3.1%, while retail prices of rice were 7.1% above
wholesale prices of rice for the nation as a whole. Regional price profilesare inconclusive as available price estimates at successive stages in the
market in some cases are less than for the preceeding stage. The wholesale
price of palay averaged about 53% of the wholesale price of rice. This ratio
reflects the milling recovery, the cost of milling, the cost of associated
services such as storage and marketing and the residual profit margin, butindividual components cannot be reliably identified because of lack of
information. Regional farm, wholesale and retail prices for ordinary varieties
for 1976 and 1977 are presented in Table 1.
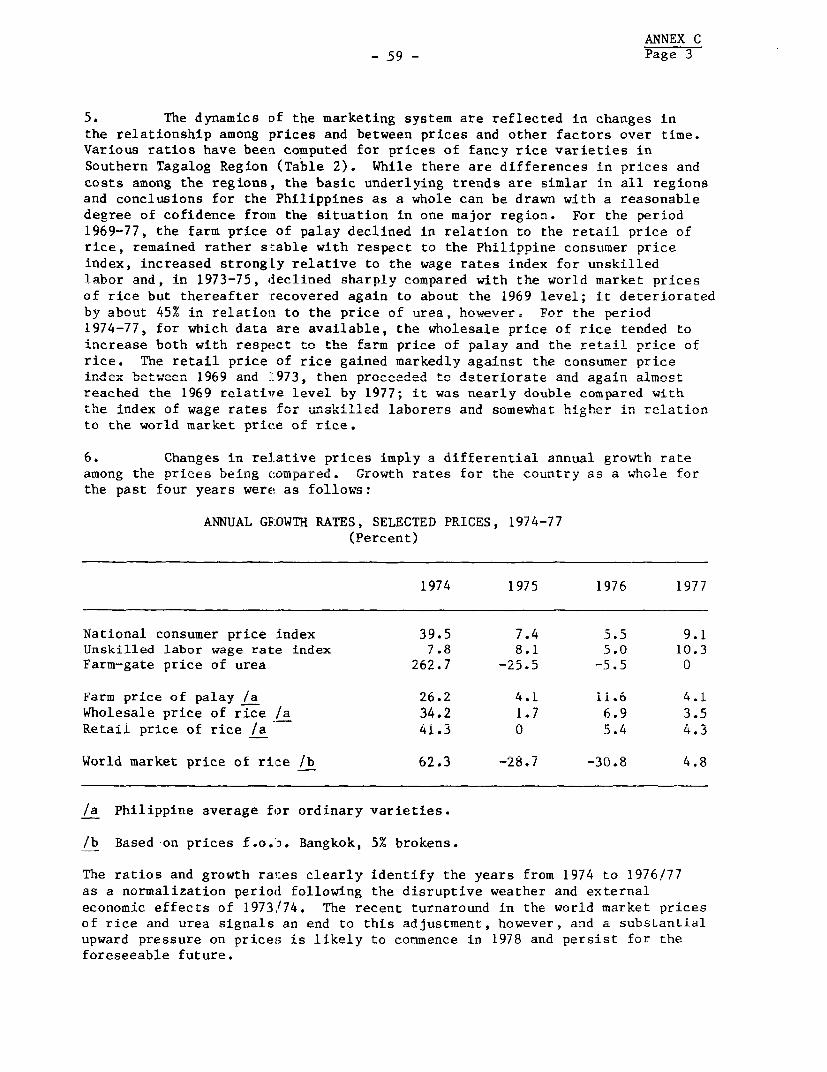
ANNEX C59 Page 3
5. The dynamics of the marketing system are reflected in changes inthe relationship among prices and between prices and other factors over time.Various ratios have been computed for prices of fancy rice varieties inSouthern Tagalog Region (Table 2). While there are differences in prices andcosts among the regions, the basic underlying trends are simlar in all regionsand conclusions for the Philippines as a whole can be drawn with a reasonabledegree of cofidence fromn the situation in one major region. For the period1969-77, the farm price of palay declined in relation to the retail price ofrice; remained rather stable with respect to the Philippine consumer priceindex, increased strongLy relative to the wage rates index for unskilledlabor and, in 1973-75- declined sharplv compared with the world market pricesof rice but thereafter recovered again to about the 1969 level; it deterioratedby about 45% in relatioln tn the nrirc nf irra, however. For the perind1974-77, for which data are available, the wholesale price of rice tended toincrease both with respect to the farm price of palay and the retail price ofrice. The retail price of rice gained markedly against the consumer priceindex between 1969 and 1973, then proceeded to deteriorate and againr almostreached the 1969 relatire level by 1977; it was nearly double compared withtLhe tinUex of wage ratLes Lfor unskiXXled laborers and someiawiat higher in relationto the world market price of rice.
6. Changes in relative prices imply a differential annual growth rateamong tle prices being compared. GrowUIL rates for the country as a whole forthe past four years were as follows:
ANNUAL GROWTH RATES, SELECTED PRICES, 1974-77(Percent)
1974 1975 1976 1977
National consumer price index 39.5 7.4 5.5 9.1Unskilled labor wage rate index 7.8 8.1 5.0 10.3Farm-gate price of urea 262.7 -25.5 -5.5 0
Farm price of palay Ia 26.2 4.i 11.6 4.iWholesale price of rice /a 34.2 1.7 6.9 3.5Retail price of rice /a 41.3 0 5.4 4.5
World market price of rice lb 62.3 -28.7 -30.8 4.8
/a Philippine average for ordinary varieties.
/b Based on prices f.o.b. Bangkok, 5% brokens.
The ratios and growth rai:es clearly identify the years from 1974 to 1976/77as a normalization period1 following the disruptive weather and externaleconomic effects of 1973/74. The recent turnaround in the world market pricesof rice and urea signals an end to this adjustment, however, and a substantialupward pressure on prices is likely to commence in 1978 and persist for theforeseeable future.
ANNEX C
- 60 - Page 4
The Variability of Rice Prices
7. Regional Variation. Although the government support price isuniform throughout the country, there is significant variation among regionsin the prices actually received by farmers. The difference between thehighest and lowest regional averages, as shown in Table 1, was F 0.14/kg in1976 and P 0.17/kg in 1977. Western Visayas region tended to have the lowestfarm prices in recent years and Central Luzon region the highest. Thenational averages as well as all regional averages for the years 1976 and1977 were lower than the government support price for those years. Theregional variation, as measured by the coefficient of variation, was slightlyless in 1977 (4.9%) compared with 1976 (5.1%).
8. The variation in wholesale prices of palay was higher than at anyother stage in the market; the difference between the highest and lowestregional averages increased from P 0.24/kg in 1976 to P 0.31/kg in 1977, andthe coefficient of variation increased from 6.6% to 8.2%, respectively. Bycomparison, the coefficient of variation among regions for the wholesale price
of rice rose from 3.0% to 3.5%, while it remained unchanged at 1.3% for theretail price of rice. Regulatory enforcement of ceiling prices at the retaillevel and active monitoring by the consuming public may have accounted for the
much lower variation in prices at the retail compared with the farm level.
9. Variation over time. The principal components of temporal variation
are trend/cycle movements, seasonal variation and irregular changes. Thetrend/cycle movements occur over a longer period of time, i.e. a number ofyears, while the seasonal variation reflects regular changes within a 12-monthperiod and irregular changes are of a random nature. All components ofvariation are clearly identifiable in the Philippine rice price series.Monthly national average prices for the neriod 1975-77 are presented in Table
3. Farm prices shown in this table are not strictly comparable to pricesshow.n in Tble ! as the former have been adi,isted for moisture content ofpalay sold by farmers.
10. Monthly farm and retail prices for ordinary rice varieties forSouthern Tagalog region have been selected for a more detailed study oftemporal variation. Although the analysis included data for the period1961-77, only the results for the decade 1968-77 are nresented= The originaldata series and the trend/cycle component are presented in Table 4 for farmprices and in Table 5 for retail prices. In terms of trend movements, pri_esat the farm and retail level behaved very similarly in Southern Tagalog.There was a relatively flat trend from late 1967 until about September 1970
when a cyclical movement commenced that peaked early in 1972 and bottomedout in late 1972 at tLe retail level and in early 1973 at the farm level.There was a sharp rise in the underlying price trend throughout 1973 followingthat years' disastrous typhoon damage. Tle trend eventually settled at anew, higher level in early 1974 and has since then followed the longest moststable pattern observed since 1961 (Graph World Bank = 19190).
11. Tne seasonal variation in farm prices iincreased gradually up toabout 1972 when the seasonal index fluctuated between 93.2 and 109.1 (Table 6).Thereafter, the seasonality declined each year and in 1977 stayed within the
ANNEX C-61 - Page 5
index range 95.8-105.2./i There was a shift in the seasonal low point fromJanuary to February andi in the seasonal peak from September to July between1968 and 1977 (Graph World Bank - 19191). At the retail level, price seasonalitywas more pronounced and consistent than at the farm level prior to about1974. Since 1974, it has also declined significantly; the index range hasnarrowed from 95.1-108.4 in 1973 to 95.4-107.0 in 1977. Between 1968 and1977 the low-month changed from March to January and the peak month fromOctober to August (Graph World Bank - 19192).
12. The residual., or irregular variation, shown also in Table 6,reflects unique, unusual occurrences such as temporary climatic and politicalevents or breakdowns irt the marketing system and as such reflects a riskfactor that cannot be anticipated in advance. This type of variation generallywas higher at the farm level than the retail level. However, with theexception of January 1977, for which the data possibly contain a reportingerror, the irregular variation of farm prices was extremely low for the period1975-77. Retail prices, in contrast, followed the historical pattern withrespect to this type of variation.
13. In summary, the trends in farm and retail prices of rice have beenalmost stationary since 1974 at the same time as the seasonal variationaround these trends has been gradually declining. The reasons for thisdevelopment cannot be ascertained precisely but the stable trend may belargely attributable to a firm government policy to decelerate price increasesin general, which benefitted from such imnortant factors as favornhle wentherconditions and declining world market prices of fertilizers and rice. It isnot clear to what extent the actrvitjic of the National GraIns Authority(NGA) have contributed to the ongoing decline in seasonal price variation,a1though these ine4 nlihrrily have bee. an important factor.
Marketing- Costs -and MargainI -t %JU ~ ~ ~ i,L 54.110 LL
14. Utvernment'sL poJ%±lcy is LU set Largets jut flUoor Urce of td paaUt.
the farm level and for ceiling prices of rice at the retail level. Thetargets are to be ach 4eaved through th. e .. arket infterve-on activ4ites of the NTJAFarmers' support prices are determined on the basis of production costs, andthe- target price to con,umers is derived largely through addngmakeincosts plus fair profit maargins for traders to the farm price. The calculationoU marketing costs is based essentially on costs pertaianitng to LradUe Uetweer.the major surplus and deficit regions.
15. Cost profiles for private traders are shown in Table 7. TheseprofLiles are indicative onUly as i't 'Ls assu,eU LLtaL pLrLce paidh LtU farimers
equal or exceed the government support price of P 1.10/kg of palay and that anotlon-a'l profit ut r u.u'r/kg aInU r U.iU/K u1 rice is uerivea Dy wnulesalers
and retailers, respectively. To the extent that farm prices, even on a drygrain basis, Lrequently fall below the official price and marketingcosts vary depending on locality and marketing efficiency but retail pricesare relatively inflexible, traders' margins vary accordingly.
/1 Without any seasonal variation the index would remain at a level of 100tnroughout the year.

-62- ANNEX C
16. Marketing O cost for NCA are presented ir. Table 8. The price shown.
to be paid to farmers of P 1.15/kg on a clean and dry basis is more accurate
than the assumption madue fLor the private LLtUr siL1c it i6 the polcyU L"fN
to pay the official support price of P 1.10/kg plus a small premium for
purity and a capitalization premium for the Samanang Nayons. Tne other
distinguishing features of NGA's costs are additional cost items that are not
explicitly recognized for the private trade such as finance charges related
to milling, and overhead charges allocated to procurement, milling anddispersal. These overhead charges average about P !7,/tten of rice. NGA doesnot claim the wholesale margin of P 40/ton allowed for private traders,however. The milling recovery is assumed to be 657% compared with 6i% ror theprivate commercial sector.
17. The gross margin for NGA of P 513/ton is more than double themargin of P 249/ton derived for the commercial sector (Table 9). If all
costs and margins were fully passed on to consumers, the retail price would
be P 2.09/kg for rice originating from the commercial sector and P 2.28/kgfor NGA rice. The most important cost component relates to farm procurement
which accounts for upwards of 40% of the total post-farmgate value added.The large difference in the milling margin between the commercial sector andNGA marks this stage in the marketing chain as one that is crucial and
complex, touching on efficiency as well as real market allocation functions.Further investigation is required to clarify the costs and functions of the
milling and warehousing segment of the market sufficiently to facilitate the
formulation of consistent government policy. It appears that NGA's primarypolicy objective of regulating prices may have overshadowed the effects that
NGA's activities associated with achieving this objective have had, particularly
on millers and other intermediaries with substantial capital investments.
18. The indicated margins of about 2% for wholesalers and 4.5-5.0% forretailers could be considered adequate with high levels of efficiency, i.e.low unit operating costs, low physical losses and a high volume turnover.
However, as these conditions are not likely to be met at certain times andlocalities. an unfavorable risk/profit relationship could be impeding market
performance. Traditionally, traders profited most from exploiting prices__ rnna1itv_ ie.. bv buving at 'Low Drices during harvest season and gradually
selling thereafter as prices rose up to the next harvest. With the declinein seasonnl variation in the price of palay in recent years (para. 11) the
potential profitability for traders also has been declining. Under suchcircumsces,a t-he adiecyofu an nnffirinl margin which is recognized and
promoted by government is assuming growing importance, thus requiring more
deta 4ed analysis by policy makers.
in. A-, aspect tat has been traditio---all4 y negyleted in t-he Philippintes'[7. nL a~c
t. C L1a Itt .- -A.- -A- -_L-JLAO.L.A.
rice price policy is quality standardization. At the farm level, a differen-
tiation exLs'iss between fancy, special. and ordin_ar _at whic.h.primarily
reflects consumers taste preferences rather than marketing quality. The
price diffr eL CILdi vUCe LtCwII inLaLy ani UoUrdLiar y vat riEties aounts to about 9S
ANXTQN Cv
-63 - Page 7
at the retail level and 2% at the farm level. A differential of 2% amongthree grades at the farm level is not sufficient to influence farmers'growing decisions. Because of the narrow price differential and the smallpercentage of fancy and special varieties produced, the impact of thismultigrade system is negligible. In fact, government has introduced a newtrade classification segregating only Masagana and non-Masagana rice. Theofficial price structure,, not taking into account quality differences bymilling standard, has had the effect of the marketed rice containing a veryhigh percentage of broken grains. Millers have no incentive to mill todifferential standards as on the one hand the palay entering the mill is notsegregated by quality grades, either physically or with respect to prices,and the sale price of milled rice does not reflect the brokens percentage onthe other. A number of mills are actually capable of producing high qualityrice but are not doing so for financial reasons. Broken rice reportedly isoften mixed back in with unbroken rice before bagging as this practicemaximizes millers' revenues. Standardization of milled rice and quality-basedpricing will be a prerequisite for export of rice should the country developsustained exportable surplusses, as is expected by the mid-1980s.
December 29, 1978
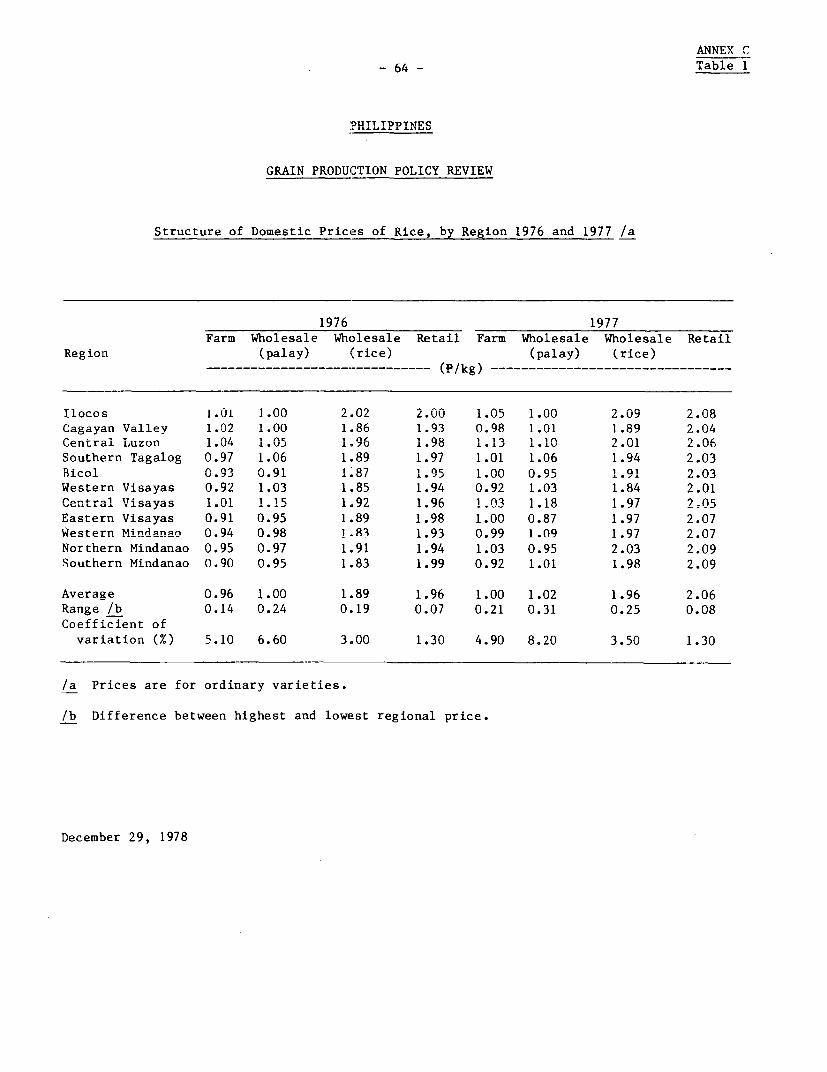
ANNEX C-- Tabl 1
- 64 - 1U± I
PHILIPPINES
GRAIN PRODUCTION POLICY REVIEW
Structure of Domestic Prices of Rice, by Region 1976 and 1977 /a
1976 1977Farm Wholesale Wholesale Retail Farm Wholesale Wholesale Retail
Region (palay) (rice) (palay) (rice)
…_________________------------ (P/kg) ----- …--------------------------
Ilocos 1.01 1.00 2.02 2.00 1.05 1.00 2.09 2.08
Cagayan Valley 1.02 1.00 1.86 1.93 0.98 1.01 1.89 2.04Central Luzon 1.04 1.05 1.96 1.98 1.13 1.10 2.01 2.06
Southern Tagalog 0.97 1.06 1.89 1.97 1.01 1.06 1.94 2.03Bicol 0.93 0.91 1 87 1 .95 1.00 0.95 1.91 2.03
Western Visayas 0.92 1.03 185 1.94 0.92 1.03 1.84 2.01
Central Visayas 1.01 1.!5 1.92 1.96 1.03 !1.8 1=97 2=05
Eastern Visayas 0.91 0.95 189 1.98 1.00 0.87 1.97 2.07Western Mindanao o0.94 0R8 1.93 1.93 0.99 1.09 1.97 2.07
Northern Mindanao 0.95 0.97 191 1.94 1.03 0.95 2.03 2.09Southern Mindanao 0.90 0.95 1.83 1.99 0.92 1.01 1.98 2.09
Average 0.96 1.00 1.89 1.96 1.00 1.02 1.96 2.06Range /b 0.14 0.24 0.19 0.07 0.21 0.31 0.25 0.08Coefficient of
variation (%) 5.10 6.60 3.00 1.30 4.90 8.20 3.50 1.30
/a Prices are for ordinary varieties.
/b Difference between highest and lowest regional price.
December 29, 1978
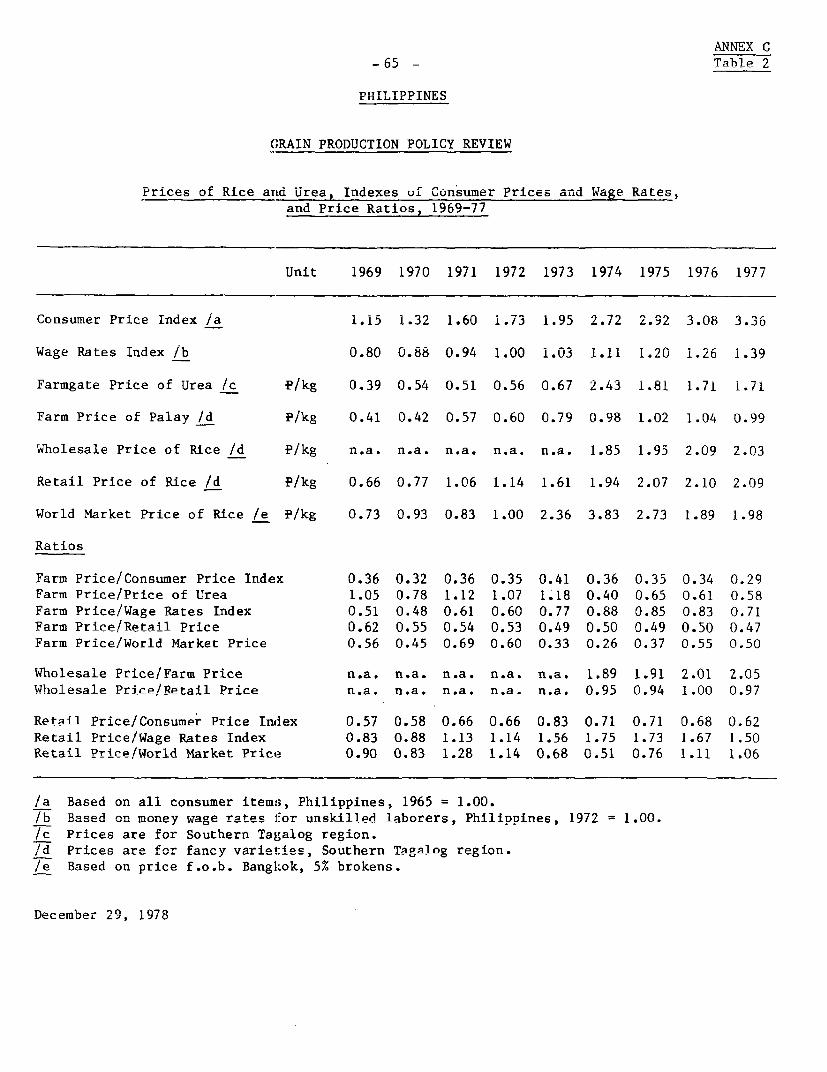
ANNEX C-_ = Table 2
Y)TTTT TODTX1VQ
GRAIN PRODUCTION POLICY REVIEW
Prices of Rice and Urea, Indexes of Cons-umer Prices arnd Wage Rates,
and Price Ratios, 1969-77
Unit 1969 1970 1971 1972 1973 1974 1975 1976 1977
Consumer Price Index /a 1.15 1.32 1.60 1.73 1.95 2.72 2.92 3.08 3.36
Wage Rates Index /b 0.80 0.88 0.94 1.00 1.03 1.11 1.20 1.26 1.39
Farmgate Price of Urea /c P/kg 0.39 0.54 0.51 0.56 0.67 2.43 1.81 1.71 1.71
Farm Price of Palay /d P/kg 0.41 0.42 0.57 0.60 0.79 0.98 1.02 1.04 0.99
Wholesale Price of Rice /d P/kg n.a. n.a. n.a. n.a. n.a. 1.85 1.95 2.09 2.03
Retail Price of Rice /d P/kg 0.66 0.77 1.06 1.14 1.61 1.94 2.07 2.10 2.09
World Market Price of Rice /e P/kg 0.73 0.93 0.83 1.00 2.36 3.83 2.73 1.89 1.98
Ratios
Farm Price/Consumer Price Index 0.36 0.32 0.36 0.35 0.41 0.36 0.35 0.34 0.29
Farm Price/Price of Urea 1.05 0.78 1.12 1.07 1.18 0.40 0.65 0.61 0.58
Farm Price/Wage Rates Index 0.51 0.48 0.61 0.60 0.77 0.88 0.85 0.83 0.71
Farm Price./Retail Price 0.62 0.55 0.54 0.53 0.49 0.50 0.49 0.50 0.47
Farm Price/World Market Price 0.56 0.45 0.69 0.60 0.33 0.26 0.37 0.55 0.50
Wholesale Price/Farm Price n.a. n.a. n.a. n.a. n.a. 1.89 1.91 2.01 2.05
Wholesale Price/Retail Price n.a. n.a. n.a. n.a. n.a. 0.95 0.94 1.00 0.97
Retail Price/Consumer Price Index 0.57 0.58 0.66 0.66 0.83 0.71 0.71 0.68 0.62
Retail Price/Wage Rates Index 0.83 0.88 1.13 1.14 1.56 1.75 1.73 1.67 1.50
Retai-- Price/World Market Price 0.90 0.83 1.28 1.14 0.68 0.51 0.76 1.11 1.06
/a Based on all consumer items, Philippines, 1965 = 1.00.
/b Based on money wage rates i-or unskilled laborers. Philippines. 1972 1.00.
/c Prices are for Southern Tagalog region.
/d Dri4ces ar-e for farcy varieties, Southern Tagalog region.
/e Based on price f.o.b. Bangkok, 5% brokens.
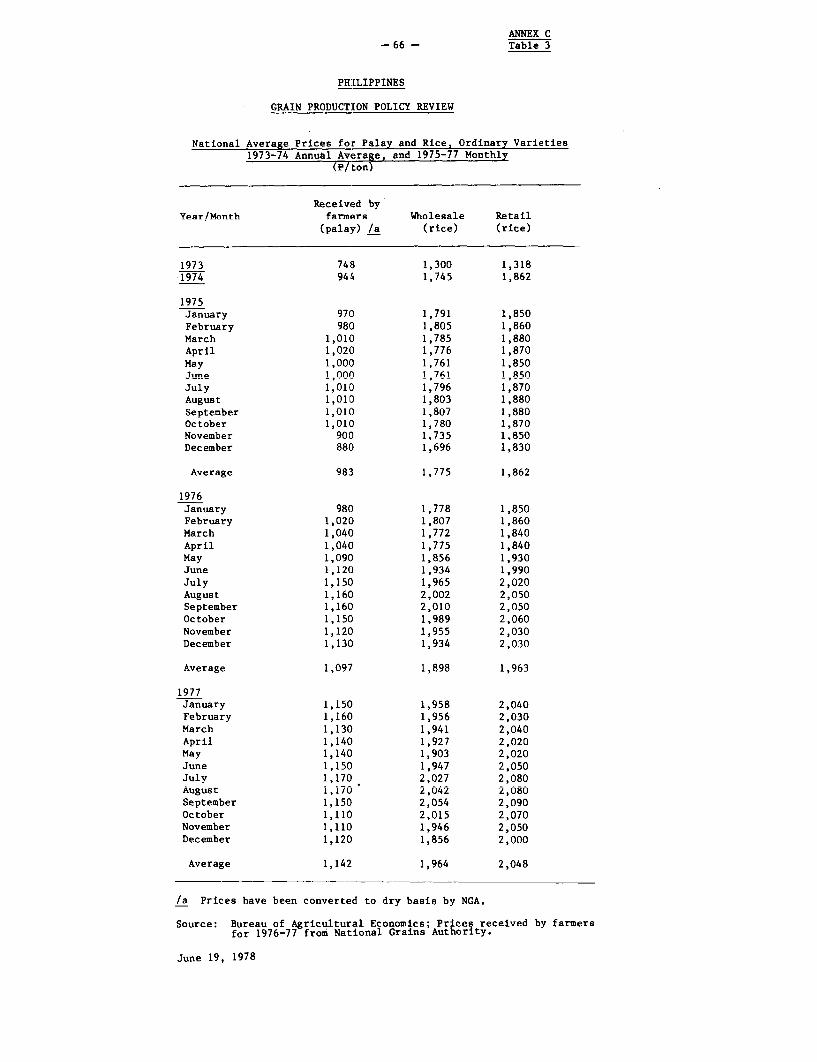
ANNEX C- 66- Table 3
PHILIPPINES
GRAIN PRODUCTION POLICY REVIEW
National Average Prices for Palay and Rice, Ordinary Varieties1973-74 Annual A ....... and !975-77 Monthly
(P/ton)
Received byYpar/Month farmers Wholesale Retail
(palay) /a (rice) (rice)
1973 748 1,300 1,3181974 944 1,745 1,862
1975J^anuary 970 1,February 980 1,805 1,860March 1,010 1,785 1,880April 1,020 1,776 1,870May 1,000 1,761 1,850June 1,000 1,761 1,850July 1,010 1,796 1,870August 1,010 1,803 1,880September 1,010 1,807 1,880October 1,010 1,780 1,870November 900 1,735 1,850December 880 1,696 1,830
1976January 980 1,778 1,850February 1,020 1,807 1,860March 1,040 1,772 1,840April 1,040 1,775 1,840May 1,090 1,856 1,930June 1,120 1,934 1,990July 1,150 1,965 2,020August 1,160 2,002 2,050September 1,160 2,010 2,050October 1,150 1,989 2,060November 1,120 1,955 2,030December 1,130 1,934 2,030
Average 1,097 1,898 1,963
1077
January 1,150 1,958 2,040February 1,160 1,956 2,030March 1,130 1,941 2,040April 1,140 1,927 2,020May 1-14n 1_,90 2-020
June 1,150 1,947 2,050July 1,170 2,027 2,080August 1,170 2,042 2,080September 1,150 2,054 2,090October 1,110 2,015 2,070November 1,110 1,946 2,050December 1,120 1,856 2,000
Average 1,142 1,964 2,048
/a Prices have been converted to dry basis by NGA.
Source: Bureau of Agricultural Economics; Prices received by farmersfor 1976-77 from National Grains Authority.
June 19, 1978
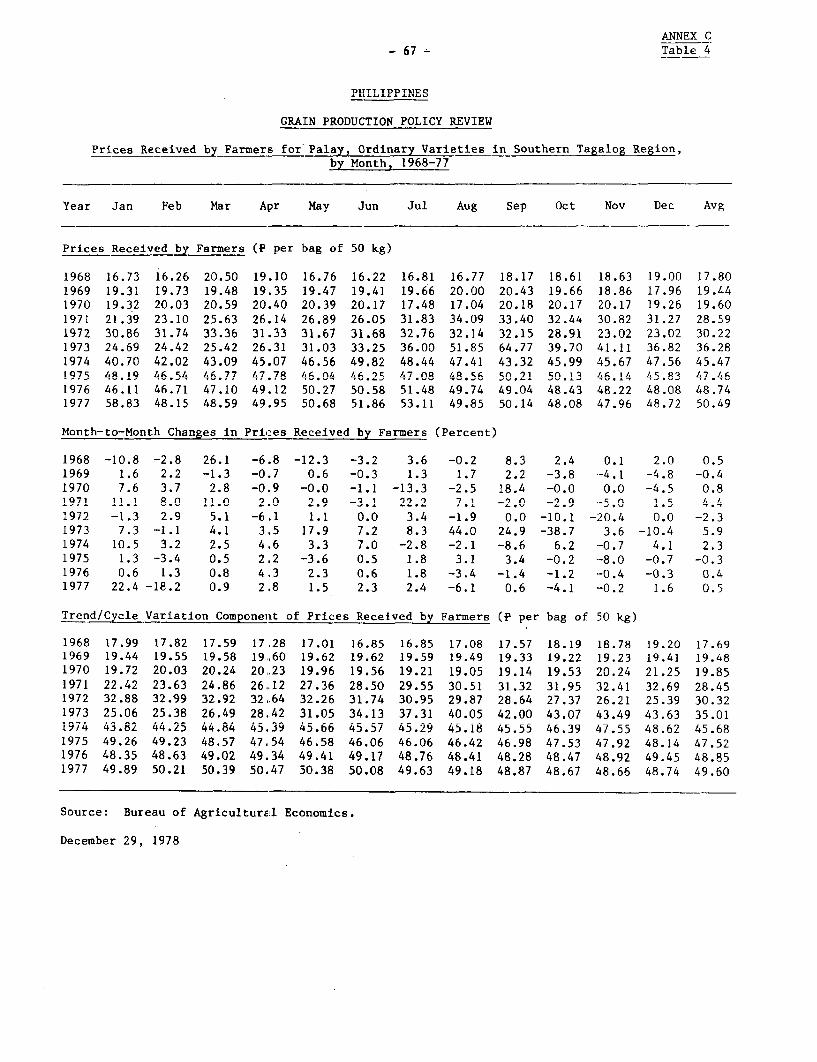
ANNEX C- 67- Table 4
P,ITT TIPPTINE
GRAIN PRODUCTION POLICY REVIEW
Prices Received by Farmers for'Palay, Ordinary Varieties in Southern Tagalog Region,by Month, 1968-77
Year Jan Feb Mar Apr May Jun Jul Aug Sep Oct Nov Dec Avg
Prices Recerved bv Farmers (P ner hap nf 90 kA)
1968 16.73 16.26 20.50 19.10 16.76 16.22 16.81 16.77 18.17 18.61 18.63 19.00 17.801969 19.31 19.73 19.48 19.35 19.47 19.41 19.66 20.00 20.43 19.66 18.86 17.96 19.441970 19.32 20.03 20.59 20.40 20.39 20.17 17.48 17.04 20.18 20.17 20.17 19.26 19.601971 21.39 23.10 25.63 26.14 26.89 26.05 31.83 34.09 33.40 32.44 30.82 31.27 28.591972 30.86 31.74 33.36 31.33 31.67 31.68 32.76 32.14 32.15 28.91 23.02 23.02 30.221973 24.69 24.42 25.42 26.31 3i.03 33.25 36.00 51.85 64.77 39.70 41.ii 36.82 36.281974 40.70 42.02 43.09 45.07 46.56 49.82 48.44 47.41 43.32 45.99 45.67 47.56 45.471975 48.19 46.54 46.77 47.78 46.04 46.25 47.08 48.56 50.21 50.13 46.14 45.83 47.461976 46.11 46.71 47.10 49.12 50.27 50.58 51.48 49.74 49.04 48.43 48.22 48.08 48.741977 58.83 48.15 48.59 49.95 50.68 51.86 53.11 49.85 50.14 48.08 47.96 48.72 50.49
Month-to-Month Changes in Prices Received by Farmers (Percent)
1968 -10.8 -2.8 26.1 -6.8 -12.3 -3.2 3.6 -0.2 8.3 2.4 0.1 2.0 0.51969 1.6 2.2 -1.3 -0.7 0.6 -0.3 1.3 1.7 2.2 -3.8 -4.i -4.8 -0.41970 7.6 3.7 2.8 -0.9 -0.0 -1.1 -13.3 -2.5 18.4 -0.0 0.0 -4.5 0.81971 11.1 8.0 11.0 2.0 2.9 -3.1 22.2 7.1 -2.0 -2.9 -5.0 1.5 4.41972 -1.3 2.9 5.1 -6.1 1.1 0.0 3.4 -1.9 0.0 -10.1 -20.4 0.0 -2.31973 7.3 -1.1 4.1 3.5 17.9 7.2 8.3 44.0 24.9 -38.7 3.6 -10.4 5.91974 10.5 3.2 2.5 4.6 3.3 7.0 -2.8 -2.1 -8.6 6.2 -0.7 4.1 2.31975 1.3 -3.4 0.5 2.2 -3.6 0.5 1.8 3.1 3.4 -0.2 --8.0 -0.7 -0.31976 0.6 1.3 0.8 4.3 2.3 0.6 1.8 -3.4 -1.4 -1.2 --0.4 -0.3 0.41977 22.4 -18.2 0.9 2.8 1.5 2.3 2.4 -6.1 0.6 -4.1 -0.2 1.6 0.5
Trend/Cycle Variation Componeit of Prices Received by Farmers (P per bag of 50 kg)
1968 17.99 17.82 17.59 17.28 17.01 16.85 16.85 17.08 17.57 18.19 18.78 19.20 17.691969 19.44 19.55 19.58 19.60 19.62 19.62 19.59 19.49 19.33 19.22 19.23 19.41 19.481970 19.72 20.03 20.24 20.23 19.96 19.56 19.21 19.05 19.14 19.53 20.24 21.25 19.851971 22.42 23.63 24.86 26.12 27.36 28.50 29.55 30.51 31.32 31.95 32.41 32.69 28.451972 32.88 32.99 32.92 32.64 32.26 31.74 30.95 29.87 28.64 27.37 26.21 25.39 30.321973 25.06 25.38 26.49 28,.42 31.05 34.13 37.31 40.05 42.00 43.07 43.49 43.63 35.011974 43.82 44.25 44.84 45.39 45.66 45.57 45.29 45.18 45.55 46.39 47.55 48.62 45.681975 49.26 49.23 48.57 47.54 46.58 46.06 46.06 46.42 46.98 47.53 47.92 48.14 47.521976 48.5 48.63 A4.02 49.4 A / . 4 1 4.n17 4.076 48.41 4 8 4 8. 47 4 2 A- A A. t I
11 - - w2 V& v7 *~ v *vJ7 " v " tSRavXs7 1i XU IV 40 -I v0 40 O+ 1+ 48*92 OF . 45 48.85qsL @vzl - V
1977 49.89 50.21 50.39 50.47 50.38 50.08 49.63 49.18 48.87 48.67 48.66 48.74 49.60
Source: Bureau of AgriculturEal Economics.
December 29, 1978
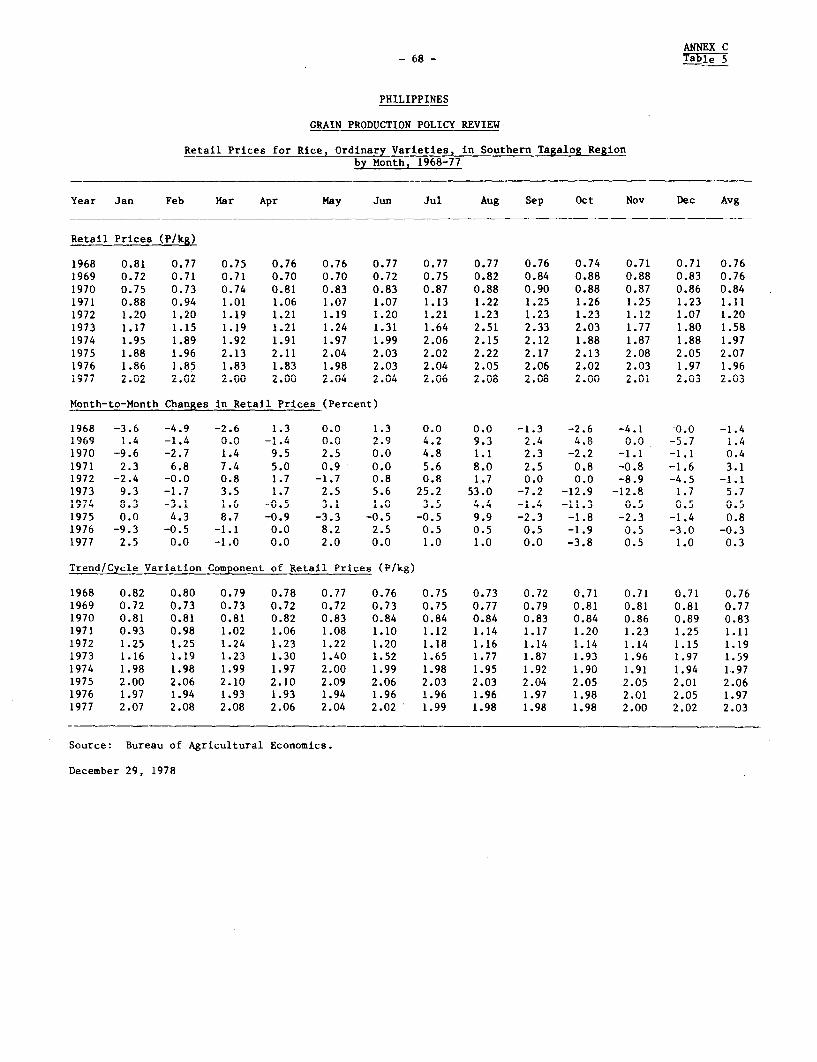
ANNEX C-6R - Tab51 T
PHILIPPINES
-RAIT PROUITIT ONn TI'V DVITTVTJ
Retail Prices for Rice,_da Vrt in Southern Tagalog Regionby Month, 1968-77
Year Jan Feb Mar Apr May Jun Jul Aug Sep Oct Nov Dec Avg
Retail Prices (P/kg)
1968 0.81 0.77 0.75 0.76 0.76 0.77 0.77 0.77 0.76 0.74 0.71 0.71 0.761969 0.72 0.71 0.71 0.70 0.70 0.72 0.75 0.82 0.84 0.88 0.88 0.83 0.761970 0.75 0.73 0.74 0.81 0.83 0.83 0.87 0.88 0.90 0.88 0.87 0.86 0.841971 0.88 0.94 1.01 1.06 1.07 1.07 1.13 1.22 1.25 1.26 1.25 1.23 1.11
1972 1.20 ~1.20 I.19 1.21 1.19 .0 1 I.21 1.2 I.2 1. .1 1.07 1.20
1973 1.17 1.15 1.19 1.21 1.24 1.31 1.64 2.51 2.33 2.03 1.77 1.80 1.581974 1.95 1.89 1.92 1.91 1.97 1.99 2.06 2.15 2.12 1.88 1.87 1.88 1.971975 1.88 1.96 2.13 2.11 2.04 2.03 2.02 2.22 2.17 2.13 2.08 2.05 2.071976 1.86 1.85 1.83 1.83 1.98 2.03 2.04 2.05 2.06 2.02 2.03 1.97 1.96;977 2.02 2.02 2.00 2.00 2.04 2.04 2.06 2.08 2.08 2.00 2.01 2.03 2.03
Month-to-Month Changes in Retail Prices (Percent)
1968 -3.6 -4.9 -2.6 1.3 0.0 1.3 0.0 0.0 -1.3 -2.6 -4.1 0.0 -1.41969 1.4 I-1.4 0.0 -1. 0. 2.9 4.2 9.3 2.4 4.80 0.0 -5.7 1.4
1970 -9.6 -2.7 1.4 9.5 2.5 0.0 4.8 1.1 2.3 -2.2 -1.1 -1.1 0.41971 2.3 6.8 7.4 5.0 0.9 0.0 5.6 8.0 2.5 0.8 -0.8 -1.6 3.11972 -2.4 -0.0 0.8 1.7 -1.7 0.8 0.8 1.7 0.0 0.0 -8.9 -4.5 -1.11973 9.3 -1.7 3.5 1.7 2.5 5.6 25.2 53.0 -7.2 -12.9 -12.8 1.7 5.7197'4 0.8 -. 1.0 -0., 3.1 1.0 3.5 4.4 -1.4 -1;.3 0.5 0. 0.5
1975 0.0 4.3 8.7 -0.9 -3.3 -0.5 -0.5 9.9 -2.3 -1.8 -2.3 -1.4 0.81976 -9.3 -0.5 -1.1 0.0 8.2 2.5 0.5 0.5 0.5 -1.9 0.5 -3.0 -0.31977 2.5 0.0 -1.0 0.0 2.0 0.0 1.0 1.0 0.0 -3.8 0.5 1.0 0.3
Trenld/Cycle Variation CoMponent of Retail Prices (P;kg)
1968 0.82 0.80 0.79 0.78 0.77 0.76 0.75 0.73 0.72 0.71 0.71 0.71 0.761969 0.72 0.73 0.73 0.72 0.72 0.73 0.75 0.77 0.79 0.81 0.81 0.81 0.771970 0.81 0.81 0.81 0.82 0.83 0.84 0.84 0.84 0.83 0.84 0.86 0.89 0.831971 0.93 0.98 1.02 1.06 1.08 1.10 1.12 1.14 1.17 1.20 1.23 1.25 i.ii1972 1.25 1.25 1.24 1.23 1.22 1.20 1.18 1.16 1.14 1.14 1.14 1.15 1.191973 1.16 1.19 1.23 1.30 1.40 1.52 1.65 1.77 1.87 1.93 1.96 1.97 1.591974 1.98 1.98 1.99 1.97 2.00 1.99 1.98 1.95 1.92 1.90 1.91 1.94 1.971975 2.00 2.06 2.10 2.10 2.09 2.06 2.03 2.03 2.04 2.05 2.05 2.01 2.061976 1.97 1.94 ;.93 1.93 1.94 i.96 1.96 1.96 1.97 1.98 2.01 2.05 1.971977 2.07 2.08 2.08 2.06 2.04 2.02 1.99 1.98 1.98 1.98 2.00 2.02 2.03
Source: Bureau of Agricultural Economics.
December 29, 1978
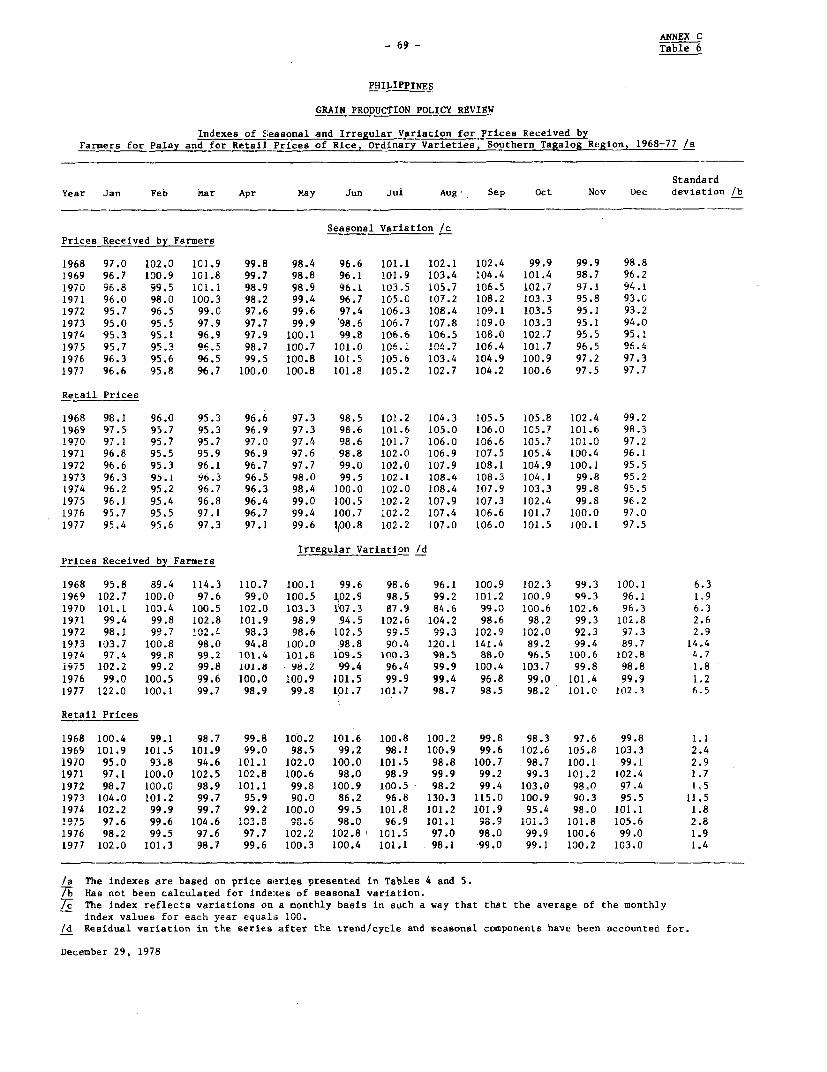
-69 - Table 6
PHILIPPINES
GRAIN PRODUCTION POLICY REVIEW
Indexes of Seasonal and Irregular Variation for Prices Received byFarmers for Palay and for Retail Prices of Rice, Ordinary Varieties, Southern Tagalog Region, 1968-77 /a
StandardYear Jan Feb Mar Apr May Jun Jul Aug,_ Sep Oct Nov Dec deviation /b
Seasonal Variation /cPrices Received by Farmers
1968 97.0 102.0 101.9 99.8 98.4 96.6 101.1 102.1 102.4 99.9 99.9 98.81969 96.7 100.9 101.8 99.7 98.8 96.1 101.9 103.4 104.4 101.4 98.7 96.2i970 96.8 99.5 101,1 98.9 98.9 96.1 103.5 105.7 106.5 102.7 97.1 94.11971 96.0 98.0 100.3 98.2 99.4 96.7 105.0 107.2 108.2 103.3 95.8 93.01972 95.7 96.5 99.0 97.6 99.6 97.4 106.3 108.4 109.1 103.5 95.1 93.21973 95.0 95.5 97.9 97.7 99.9 '98.6 106.7 107.8 109.0 103.3 95.1 94.01974 95.3 95.1 96.9 97.9 100.1 99.8 106.6 106.5 108.0 102.7 95.5 95.11975 95.7 95.3 96.5 98.7 100.7 101.0 106.1 104.7 106.4 101.7 96.5 96.41976 96.3 95.6 96.5 99.5 100.8 101.5 105.6 103.4 104.9 100.9 97.2 97.31977 96.6 95.8 96.7 100.0 100.8 101.8 105.2 102.7 104.2 100.6 97.5 97.7
Retail Prices
1968 98.1 96.0 95.3 96.6 97.3 98.5 101.2 104.3 105.5 105.8 102.4 99.21969 97.5 95.7 95.3 96.9 97.3 98.6 101.6 105.0 106.0 105.7 101.6 98.31970 97.1 95.7 95.7 97.0 97.4 98.6 101.7 106.0 106.6 105.7 101.0 97.21971 96.8 95.5 95.9 96.9 97.6 98.8 102.0 106.9 107.5 105.4 100.4 96.11972 96.6 95.3 96.1 96.7 97.7 99.0 102.0 107.9 108.1 104.9 100.1 95.51973 96.3 95.1 96.3 96.5 98.0 99.5 102.1 108.4 108.3 104.1 99.8 95.21974 96.2 95.2 96.7 96.3 98.4 100.0 102.0 108.4 107.9 103.3 99.8 95.51975 96.1 95.4 96.8 96.4 99.0 100.5 102.2 107.9 107.3 102.4 99.8 96.21976 95.7 95.5 97.1 96.7 99.4 100.7 102.2 107.4 106.6 101.7 100.0 97.01977 95.4 95.6 97.3 97.1 99.6 t00.8 102.2 107.0 106.0 101.5 100.1 97.5
Irregular Variation /dPrices Received by Farmers
1968 95.8 89.4 114.3 110.7 100.1 99.6 98.6 96.1 100.9 102.3 99.3 100.1 6.31969 102.7 100.0 97.6 99.0 100.5 102.9 98.5 99.2 101.2 100.9 99.3 96.1 1.91970 101.1 100.4 100.5 102.0 103.3 107.3 87.9 84.6 99.0 100.6 102.6 96.3 6.31971 99.4 99.8 102.8 101.9 98.9 .94.5 102.6 104.2 98.6 98.2 99.3 102.8 2.61972 98.1 99.7 '02.4 98.3 98.n6 102.5 99.5 99.3 102.9 102.0 92.3 97.3 2.91973 103.7 100.8 98.0 94.8 100.0 98.8 90.4 120.1 141.4 89.2 99.4 89.7 14.41974 97.4 99.8 99.2 101.4 101.8 109.5 100.3 98.5 88.0 96.5 100.6 102.8 4.71975 102.2 99.2 99.8 101.8 98.2 99.4 96.4 99.9 100.4 103.7 99.8 98.8 1.81976 99.0 100.5 99.6 100.0 100.9 101.5 99.9 99.4 96.8 99.0 101.4 99.9 1.21977 122.0 100.1 99.7 98.9 99.8 101.7 101.7 98.7 98.5 98.2 101.0 102.3 6.5
Retail Prices
1968 100.4 99.1 98.7 99.8 100.2 101.6 100.8 100.2 99.8 98.3 97.6 99.8 1.11969 101.9 101.5 101.9 99.0 98.5 99.2 98.1 100.9 99.6 102.6 105.8 103.3 2.41970 95.0 93.8 94.6 101.1 102.0 100.0 101.5 98.8 100.7 .98.7 100.1 99.1 2.91971 97.1 100.0 102.5 102.8 100.6 98.0 98.9 99.9 99.2 99.3 101.2 102.4 1.71972 98.7 100.0 98.9 101.1 99.8 100.9 100.5 98.2 99.4 103.0 98-0 97.4 1.51973 104.0 101.2 99.7 95.9 90.0 86.2 96.8 130.3 115.0 100.9 90.3 95.5 11.51974 102.2 99.9 99.7 99.2 100.0 99.5 101.8 101.2 101.9 95.4 98.0 101.1 1.81975 97.6 99.6 104.6 103.8 98.6 9n.0 96.9 .0;.1 98.9 ;0;.3 i0i.8 i05.6 2.81976 98.2 99.5 97.6 97.7 102.2 102.8 101.5 97.0 98.0 99.9 100.6 99.0 1.91977 102.0 101.3 98.7 99.6 100.3 100.4 101.1 98.1 99.0 99.1 100.2 103.0 1.4
/a The indexes are based on price series Dresented in Tables 4 and 5.Tb Has not been calculated for indexes of seasonal variation.Ic The index reflects variations on a monthly basis in such a way that that the average of the monthly
index values for each year equaJI 10U0./d Residual variation in the series after the trend/cycle and seasonal components have been accounted for.
December 29, 1978
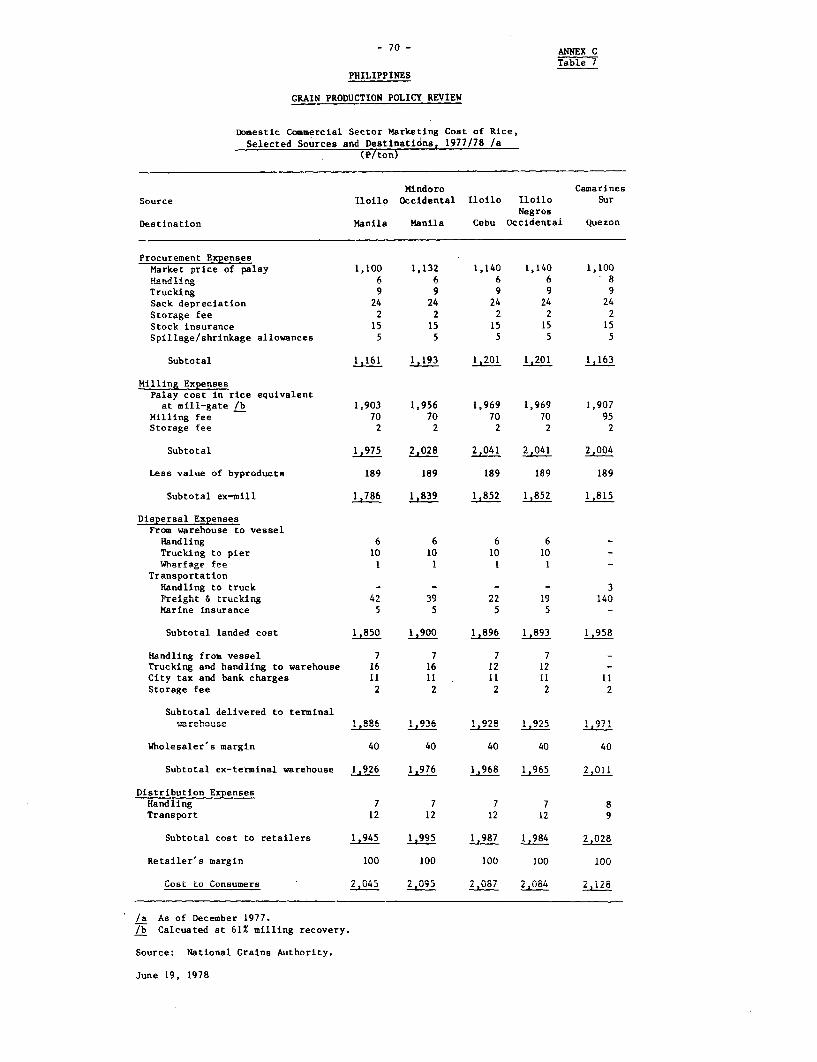
-70- ANNEX C
X dXt 7
PHILIPPINES
GRAIN PRODUCTION POLICY REVIEW
Domestic Commercial Sector Marketing Cost of Rice,Selected Sources and Destinations, 1977/78 /a
(a',
Miandoro CamarinesSource Iloilo Occidental Iloilo Iloilo Sur
NegrosDestination Manila Manila Cebu Occidental Quezon
Procurement ExpensesMarket price of palay 1,100 1,132 1,140 1,140 1,100Handling 6 6 6 6 8Trucking 9 9 9 9 9Sack depreciation 24 24 24 24 24Storage fee 2 2 2Stock insurance 15 15 15 15 15Spillage/shrinkage allowances 5 5 5 5 5
Subtotal 1,161 1,193 1,201 1,201 1,163
Milling ExpensesPalay cost in rice equivalent
at mill-gate lb 1.903 1,956 1,969 1,969 1,907Milling fee 70 70 70 70 95Storage fee 2 2 2 2 2
Subtotal 1,975 2,028 2,041 2,041 2,004
Less value of byproducts 189 109 io7 icy 189
Subtotal ex-mill 1,786 8 1,852 1,852 1,815
Dispersal ExpensesFrom warehouse to vessel
Handling 6 6 6 6 -
Trucking to pier 10 10 10 10 -Wharfage fee I 1 1 1
TransportationHandling to truck - 3 - - 3reight g r uck nA 2 37 2 :9 1 Marine insurance 5 5 5 5 -
Subtotal landed cost 1,850 i,900 1,896 1,893 1,958
Handling from vessel 7 7 7 7 -
Trucking and handling to warehouse 16 16 12 12 -
City tax and bank charges 11 11 11 11 11Storage fee 2 2 2 2 2
Subtotal delivered to terminalwarehouse 019 0I 1 886 1 6 1 o. 1
Wholesaler's margin 40 40 40 40 40
Subtotal ex-terminal warehouse 1,926 1,976 1,968 1,965 2,011
Distribution ExpensesHandling 7 7 7 7 8Transport 12 12 12 12 9
Subtotal cost to retailers 1,945 95 ,987 1,984 2,028
Retailer's margin 100 100 100 100 100
Cost to Consumers 2,045 2,095 2,087 2,084 2,128
/a As of December 1977.lb Calcuated at 61% milling recovery.
Source: National Grains Authority.
June 19, 1978
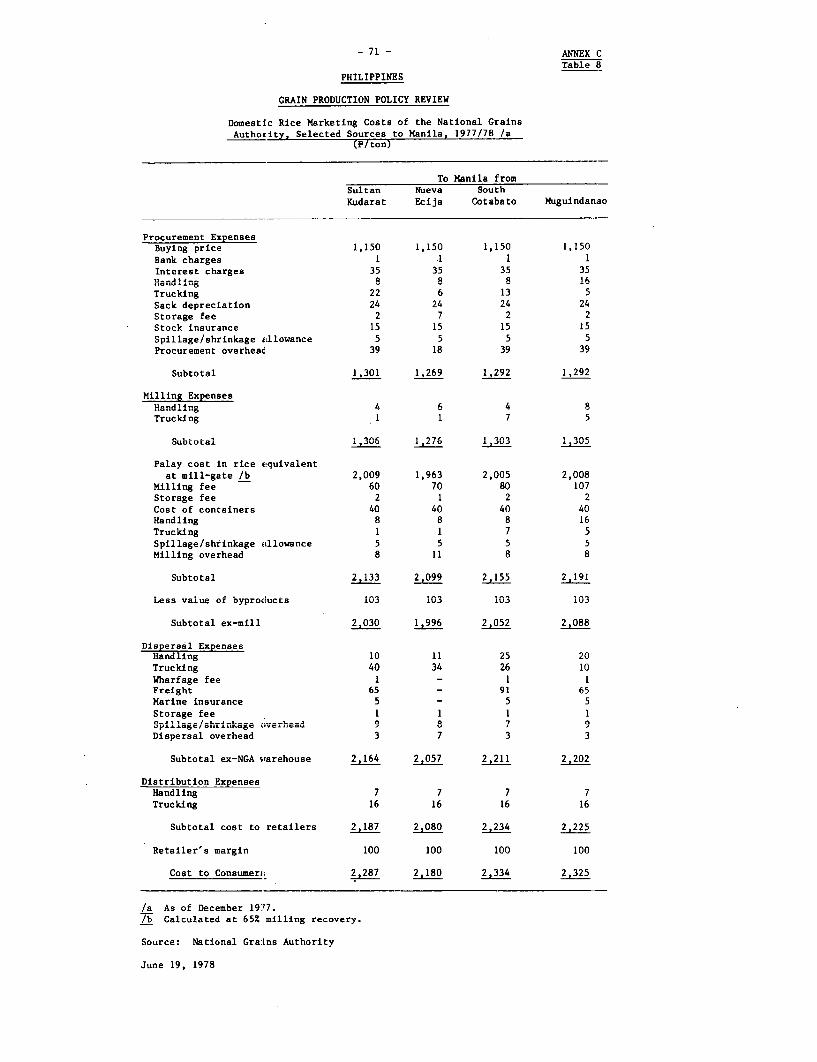
-71- ANNEX CTable 8
PHILIPPINES
GRAIN PRODUCTION POLICY REVIEW
Dnmestic Rice Narketinn Costs of the National GrainsAuthority, Selected Sources to Manila, 1977/78 /a
(P/ton)
To Manila fromSultan Nueva South
Kudarat Ecija Cotabato Muguindanao
Procurement ExpensesBuving price 1.150 1,150 1,150 1,150
Bank charges 1 .1 1 1Interest charges 35 35 35 35Handling 8 8 8 16Trucking 22 6 13 5
Sack depreciation 24 24 24 24Storage fee 2 7 2 2Stock insurance 15 15 15 15Spillage/shrinkage allowance 5 5 5 5Procurement overhead 39 18 39 39
Subtotal 1,301 1,269 1,292 1,292
Milling ExpensesHa.nrdling 4 6 4 8Trucking 1 1 7 5
Subotao l3
Palay cost in rice equivalentat mill-gate lb 2,009 1,963 2,005 2,008
Milling fee 60 70 80 107Storage fee 2 1 2 2Cost of containers 40 40 40 40Handling 8 8 8 16Trucking 1 1 7 5Spillage/shrinkage allowance 5 5 5 5Milling overhead 8 11 8 8
Subtotal 2,133 2,099 2,155 2 191
Less value of byproducts 103 103 103 103
Subtotal ex-mill 2,030 1,996 2,052 2,088
Dispersal ExpensesHndling 10 11 25 20Trucking 40 34 26 10Wharfage fee I - 1 1Freight 65 - 91 65Marine insurance 5 - 5 5
Storage fee 1 1 1 1Spillage.....inae (vereal.......... 8 7 9Dispersal overhead 3 7 3 3
Subtotal ex-NGA warehouse 2,164 2,057 2,2l 2,202
Distribution ExpensesHandling 7 7 7 7Trucking 16 16 16 16
Subtotal cost to retailers 2,187 2,080 2,234 2,225
---- in 100 100 100 100
Cost to Consumeris 2,287 2,180 2,334 2,325
/a As of December 19M7./b Calculated at 65% milling recovery.
Source: National Gra:Lns Authority
June 19, 1978
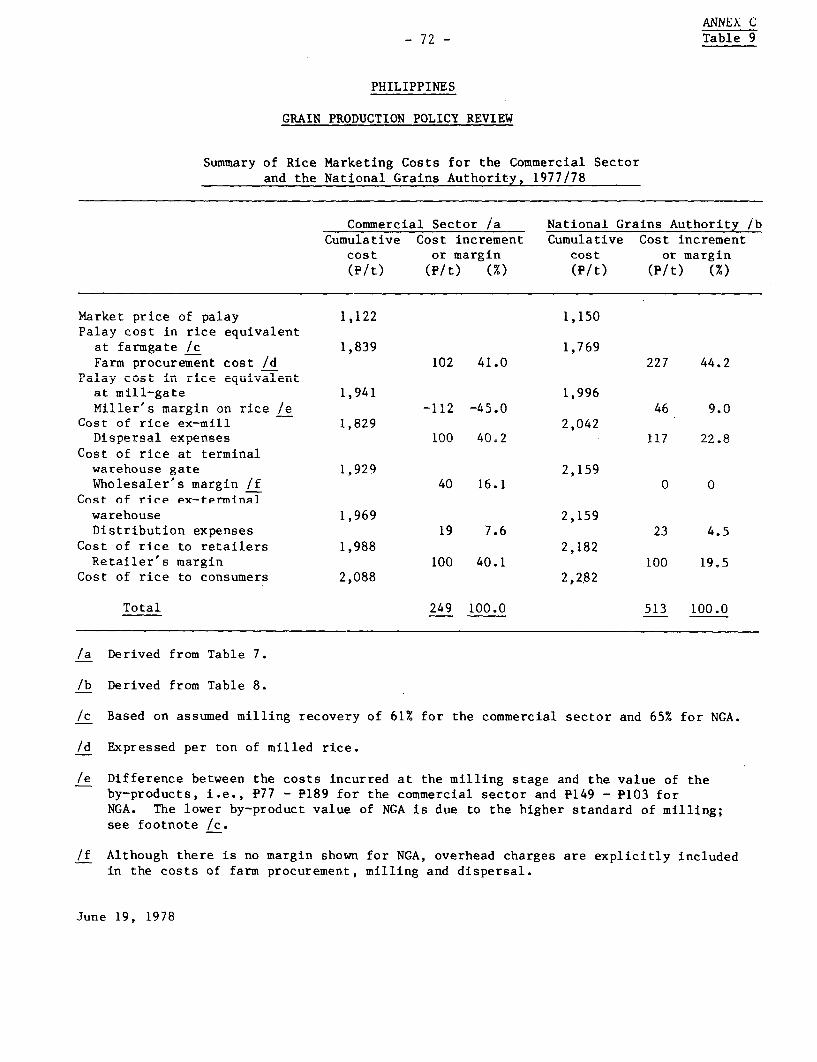
ANNEX C-72 - Table 9
PHILIPPINES
GRAIN PRODUCTION POLICY REVIEW
Summary of Rice Marketing Costs for the Commercial Sectorand the National Grains Authority, 1977/78
Commercial Sector /a National Grains Authority /bCumulative Cost increment Cumulative Cost increment
cost or margin cost or margin(P/t) (P/t) (%) (P/t) (P/t) (%)
Market price of palay 1,122 1,150Palay cost in rice equivalent
at farmgate /c 1,839 1,769Farm procurement cost /d 102 41.0 227 44.2
Palay cost in rice euvlnr~.Ly CUL LI LuLC~ 4U.LVdi.LIIL
at mill-gate 1,941 1,996V1 L c11er's .Lflfl li ,L.C ' c JLL .J *V U :7. e
Cost of rice ex-mill 1,829 2,042nispe.rsal expenses 100 L4,02 117 22.8
Cost of rice at terminalwarehouis gate 1 q9Q 2,159Wholesaler's margin /f 40 16.1 0 0
Cost of rice ex-terminalwarehouse 1,969 2,159Distribution expenses 19 7.6 23 4.5
Cost of rice to retailers 1,988 2,182Retailer's margin 100 40.1 100 19.5
Cost of rice to consumers 2,088 2,282
Total 249 100.0 513 100.0
/a Derived from Table 7.
/b Derived from Table 8.
/c Based on assumed milling recovery of 61% for the commercial sector and 65% for NGA.
/d Expressed per ton of milled rice.
/e Difference between the costs incurred at the milling stage and the value of theby-products, i.e., P77 - P189 for the commercial sector and P149 - P103 forNGA. The lower by-product value of NGA is due to the higher standard of milling;see footnote /c.
if Although there is no margin shown for NGA, overhead charges are explicitly includedin the costs of farm procurement, milling and dispersal.
June 19, 1978

10.00-PHILIPPINES
8.0oo. GRAIN PRODUCTION POLIC'Y REVIEW
TREND/CYCLE VARIATION COMPONENT OF PRIICES
RECEIVED BY FARMERS FOR PALA'Y AND OF RETAIL
60o. PRICES OF RICE, ORDINARY VARIETIES,
SOUTHERN TAGAILOG RElGION,.1967-77
4.00.
2.00-
Retail Prices
Price(P/kg) 1.0-_
.60- X Prices Received by Farmers
0.40-
0.2C.-
WOR LD BANK - 19190
.1 1) _ F77V7~7T7~7T7~7v-17 1 __71-75
W 7_7 17
tf7196fR a4 117 f 196 1969 1970 19t<71 1917 0B 0R1177
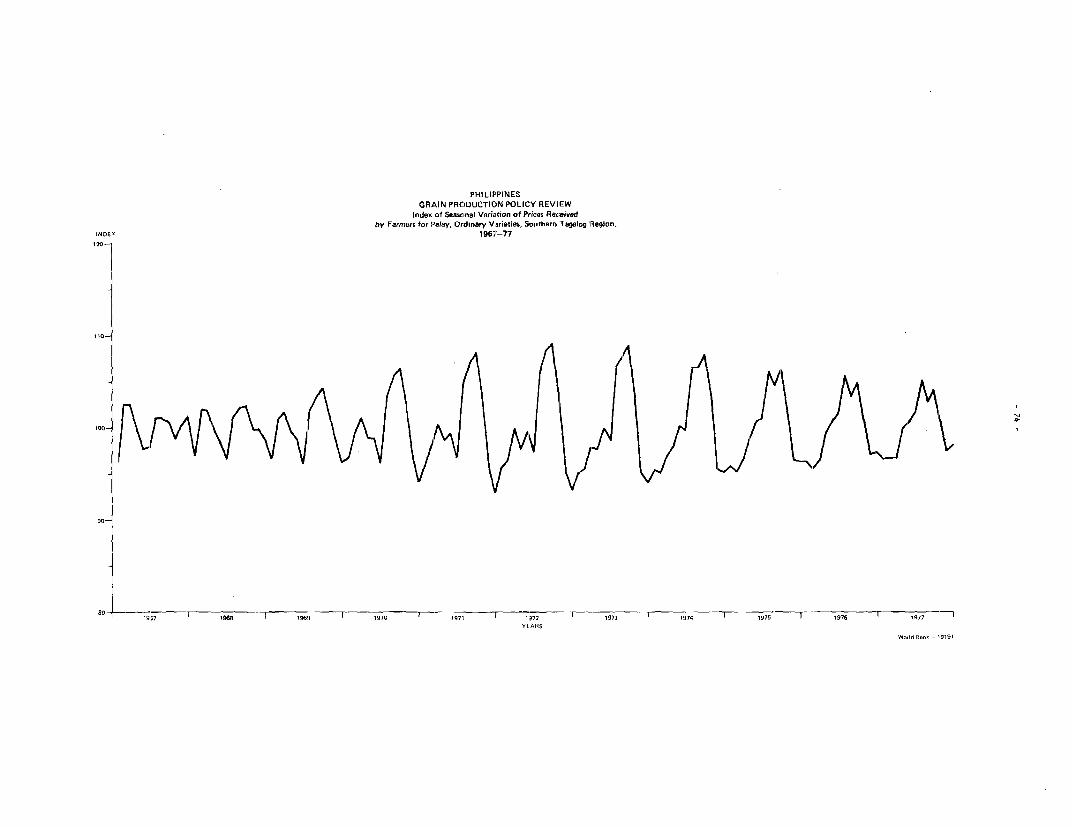
PHI LIF'PINESGRAIN PRODUCTION POLICY REVIEW
Index of Seasonal Varicition of F'rices Receivedby Farmners for 'alay, Ordinary Varieties, Southern Tagalog 1Region,
1967 77120-
110-
lXI- .__. . .~~A
O° 1ktWS4404'<t~'I
100 AIa
1905? ige8 gel I' 1 019 10 1971 1r72 1973 l974 1075 1 070 1977
W0O1d 8ank -10191
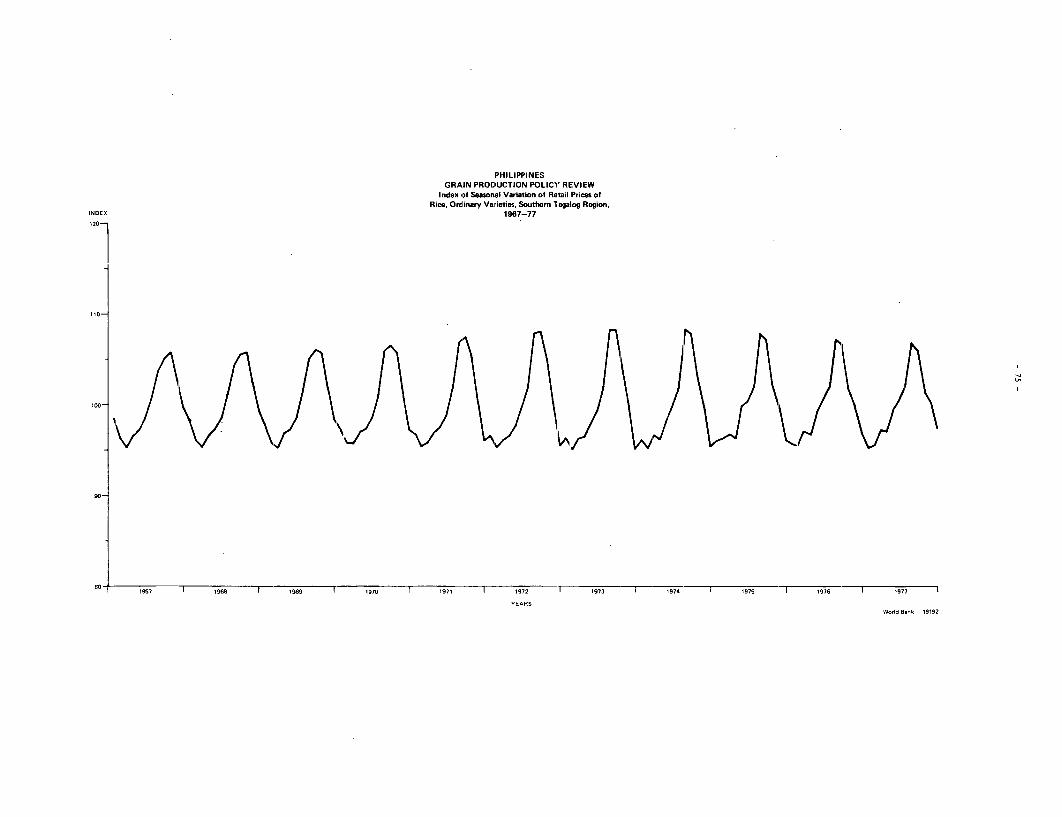
PHILIPPINESGRAIN PRODUCTION POLICY REVIEIN
Index of Seasonal Variation of Retail Prices ofIRice, Ordinary Vairieties, Southern Tagalog Region,
INDEX 1967-77
1lb
,.'t/o\tf
90-
1507 a s gi7 1 BB 1 1979 1 1970 197 1 197: s I 93 T 1974 107 I 1976 1977
YEAFRS
WorId Bank -19192

- 76 -
PHILIPPINES
GRAIN PRODUCTION POLICY REVIEW
STATISTICAL ANNEX
Table of Contents
Table
1 Area of Palay Harvested by Region, Cropyears, 1961-772 Palay Yields by Recion, CroIvpyrqs 19Q1-773 Production of Palay, by Region, Cropyears, 1961-774 Annual Average Prices Reene4ed by Farmers for Palay (Ordinary
Varieties), by Region, 1960-77
6 Monthly National Average Retail Prices of Ordinary Rice,1 O7q_71
7 World Market Commodity Prices and Price Projections in 1978Con.stan.t DolLars
8 Area of Corn Harvested, by Region, Cropyears, 1961-779' rorn vielAs, bky 'De g4or. Crpeas 1961-7'7.7 SjtJA. .L4CJ..UO LJ X
6ALLvJ.tj~C . ~ .. l -n
10 Production of Corn, by Region, Cropyears, 1961-7711 Monthly~ National.... A.. iq7i-C TJA.11. Mon thly Natir.l Average L--Farm PriLces ofL IVLIte Corn Grair.s, 1 .-77
12 Monthly National Average Retail Prices of White Corn Grits, 1973-771J G3overnment Support PrLces Lor Cereals
14 Regional Income Indicators, 1971-74;5 Regional Indicators of I-ncume Inequality16 Intercensal Population Estimates, 1960-7517 Population Enumerations of Post-independence Censuses
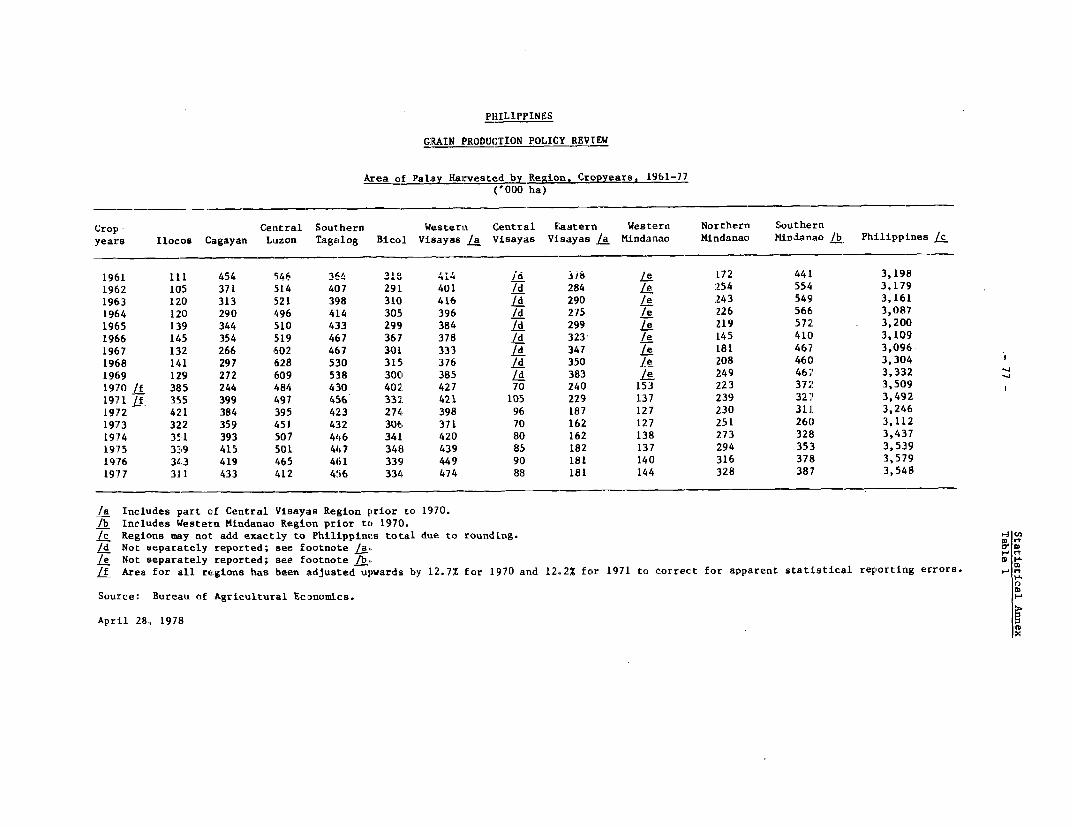
PHILIPPINES
G]RAIN PRODUCTION POLICY REVIEW
Area of PalyL Harvested by Repia Cropyears, 1961-7'7i('000 ha)
Crop- Central Southern Western Central Eastern Western Northern Southernyears Ilocos Cagayan Luzon Tagalog Bicol Visayas /a Visayas Visayas /a MiLndanao Mindanaco Lindanao /b Philippines fc
1961 111 454 546 36w I 414 /d 357 /e .172 441 3,1981962 105 371 .514 407 291 401 /d 284 /e 254 554 3,1791963 120 313 .521 3518 310 416 /d 290 e :243 549I 3,1611964 120 290 .496 414 305, 396 /d 275 /e 226 566 3,0871965 139 344 510 433 299 384 /d 299 /e 219 572 3,2001966 145 354 519 467 367' 378 /d 323 /e 145 410 3,1091967 132 266 602 467 301 333 /d 347 /e 181 467 3,0961968 141 297 628 530 315 376 1d 350 /e :208 460 3,3041969 129 272 609 518 30C0 385 /d 383 /e. 249 46i7 3,33219,70 /f 385 244 .484 430 402 427 70 240 153 :223 372 3,5091971 /f 35,5 399 497 456 332' 421 105 229 137 239 327 3,4921972 421 384 395 42 3 274 398 96 187 127 230 311 3,2461973 32'2 359 451 4312 306k 371 70 162 127 251 260 3,1121974 351 393 507 446 341 420 80 162 138 .273 328 3,4371975 339 415 501 447 348 439 85 182 137 294 353 3,5391976 343 419 465 461I 339 449 90 181 140 316 378 3,5791977 311 433 412 456 334 474 88 181 144 328 387 3,548
/a Includes part of Central Visayeas Region prior to 1970.Tb Incltudes Western Mindanao Region priLor to 1970./c Regions may not add exactly to Philippines total due to rounding./d Not separeltely reported; see footnote /a.,1e Not sieparattely reported; see footnote Lb.,/f Area for all regions has been adjusted upwards by 12.7% for 1970 and 12. 2% fcor 1971 to correct for apparent stat:Lstical reportin,g errors.
Source: Bureau of Agricultural Economics.
AprLl 28, 1978
x
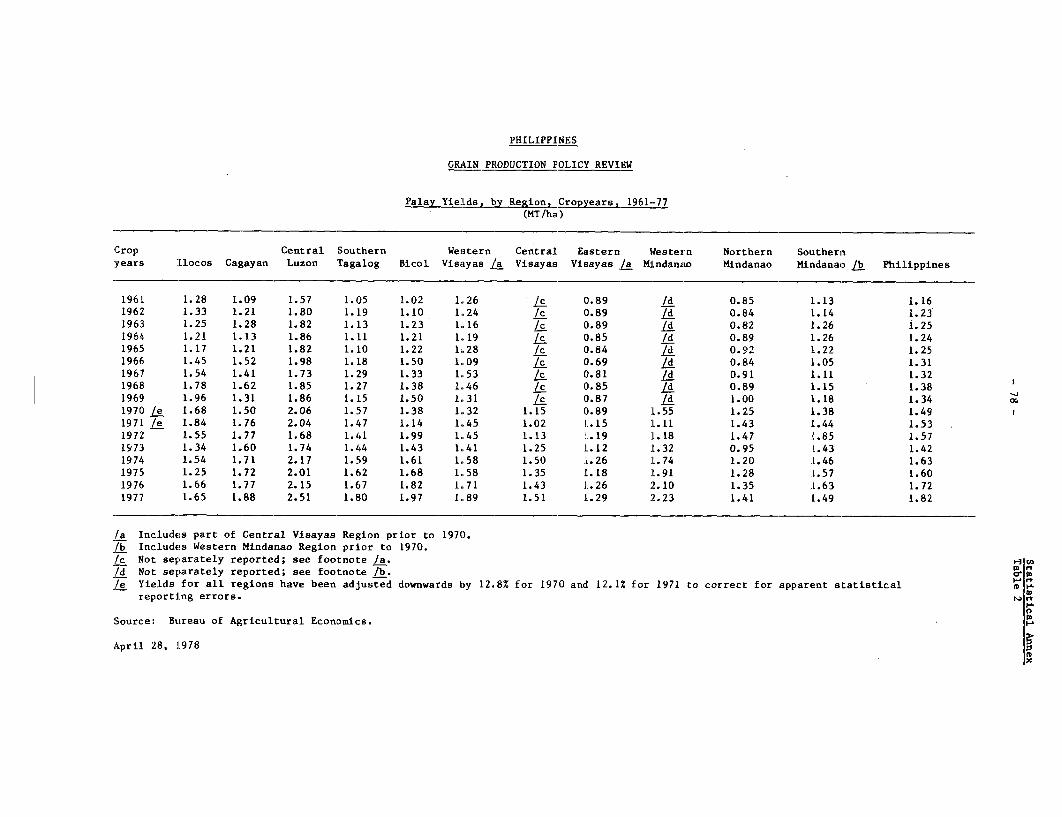
PHILIPPINES
GERAIN PRtODUCTION P'OLICY REVIEW
PalaLy YieLds, tn Resion, Cropyears. 1961--77(MT/ha)
Crop Central Southern Western Central Eastern Western Northern Southeniyears Ilocos Cagayan Luzon Tagalog Bicol Visayas 'a Visayas Visayas a MiLndanao Mindanao Mindanao /b Phi]Lippines
1961 1.28 1.09 1.57 1.05 1.02 1.26 '/c 0.89 /d 0.85 1.13 1.161962 1.33 1.21 1.80 1.19 1.10 1.24 /c 0.89 /1d 0.84 1.14 1.23'1963 1.25 1.28 1.82 1.13 1.23 1.16 /c 0.89 Id 0.E82 1.26 i.251964 1.21 1.13 1.86 1.11 1.21 1.19 /c 0.85 /d 0. 89 1.26 1.241965 1.17 1.21 1.82 1.10 1.22 1;28 /Ic 0.84 jd 0.92 1.22 1.251966 1.45 1.52 1.98 1.18 1.50 1.09 /c 0.69 /d 0. 84 1.05 1.311967 1.54 1.41 1.73 1.29 1.33 1.53 /c 0.81 /d 0.91 1.11 1.321968 1.78 1.62 1.85 1.27 1.38 1.,46 /c 0.85 /d 0. 89 1.15 1.381969 1.96 1.31 1.86 1.15 1.50 1.,31 /c 0.87 /d 1.00 1.18 1.34 cc1970 /e 1.68 1.50 2.06 1.57 1.38 1,.32 1.15 0.89 I1.55 1.25 1.38 1.491971 /e 1.84 1.76 2.04 1.47 1.14 1,45 1.02 1.15 1.11 1.43 1.44 1.531972 1.55 1.77 1.68 1.41 1.99 1.45 1.13 '. 19 1.18 1.47 L.85 1.571973 1.34 1.60 1.74 1.44 1.43 1.41 1.25 1.12 [.32 0.95 L.43 1.421974 1.54 1.71 2.17 1.59 1.61 1.,58 1.50 L.26 :L.74 1.20 L.46 1.631975 1.25 1.72 2.01 1.62 1.68 1.58 1.35 1.18 L.91 1.2,8 [.57 1.601976 1.66 1.77 2.15 1.67 1.82 1.,71 1.43 [.26 :2.10 1.35 [.63 1.721977 1.65 1.88 2.51 1.80 1.97 1.89 1.51 1.29 2.23 1.41 L.49 1.82
la Includes part of Central Visayas RegiDn prior to 1970._/b Includes Western Mindanao Region prior to 1970./c Not separately reported; see footnote /a.
Id Not separately reported; see footnote lb. PC/e Yields for all regions have been adjusted downwards by 12.8% for 1970 and 12.1% for 1971 to correct for apparent statisitical
reporting errors.
Source: Bureau of Agricultural Economics.
April 28, 1978
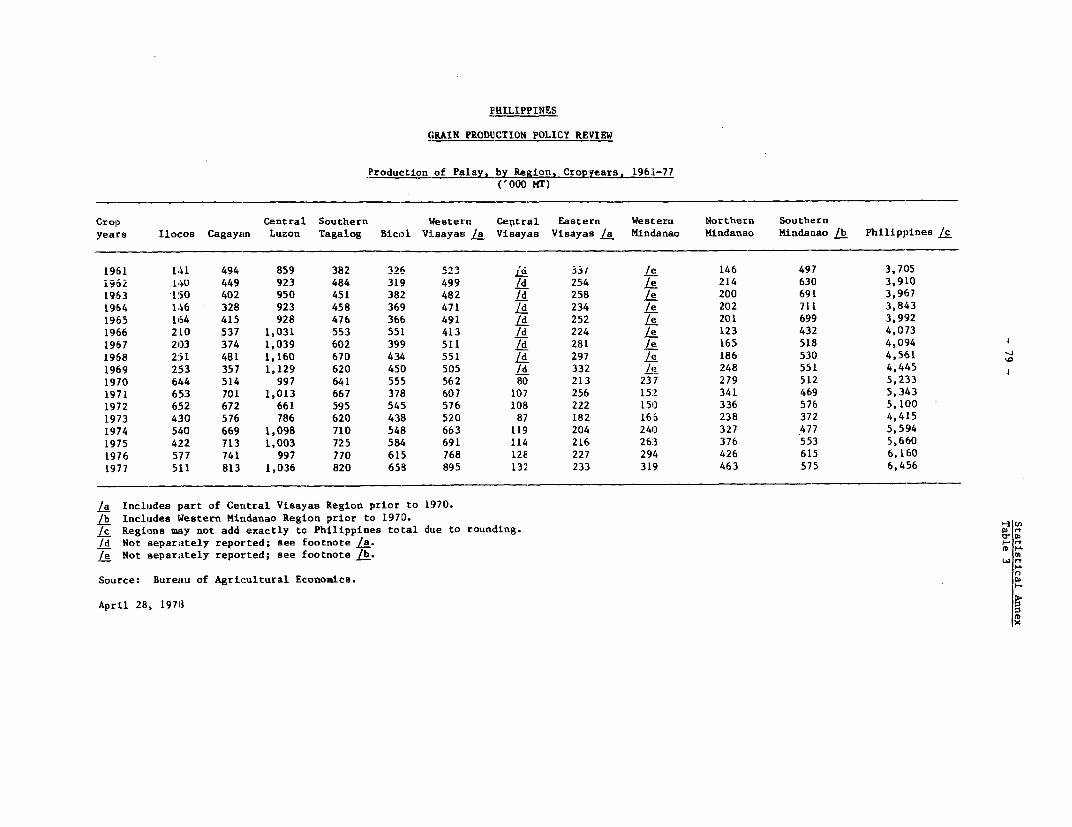
PHILIPPINES
GRAIN PRODUCTION POLICY RE'VIEW
Production of Palay, by Region. Cropyears, 196'L-77('000 MT)
Crolp Central Southern Western Central Eastern West:ern Northern Southernyears Ilocos Cagayan Luzon Tagalog Bicol ViLsayas /a Visayas Visayas /a Mindanao Mi.ndanao Mindanao Lb Philippines /c
19,61 141 494 859 382 _2_ 523 /'a 33/ /e 146 497 3,705i96'2 I4U 449 923 484 319 499 /d 254 T! 214 630 3,91019,63 1150 402 950 451 382 482 d 258 /e 200 691 3,915719,64 146 328 923 458 36,9 471 d 234 /e 202 711 3,8431965 1 64 415 928 476 3656 491 Ld 252 7e 201 699 3,9921966 2.10 537 1,031 553 551 413 Ld 224 Ic 123 432 4,07319,67 20)3 374 1,039 602 399 511 Ld 281 TIT 165 518 4,094 119168 251 481 1,160 670 434 551 Id 297 I. 186 530 4,565119,59 2153 357 1,129 620 450 505 Id 332 / 248 551 4,4451970 644 514 997 641 555 562 80 213 237 279 512 5,2:331971 6:53 701 1,013 667 3778 607 107 256 152 341 469 5,3431972 6152 672 661 595 545 576 108 222 151) 336 576 5,11901973 430 576 786 620 438 520 87 182 1616 238 372 4,4151974 540 669 1,098 710 54B 663 119 204 240) 327 477 5,5941975 422 713 1,003 725 584 691 114 216 26:3 376 553 5,6601976 577 741 997 770 615 768 128 227 29-4 426 615 6,1601977 51L1 813 1,036 820 658 895 132 233 319) 463 575 6,456
/a Includes part of Central Visayas Region prior to 1970./b Includes lWester n Mindanac, Region prior to 1970./c Regions uiy not add exactly to Philippines total due to rounding./d Not separaltely reported; see footnote /a. a, to/e Not separately reported; see footnote Lb.
Source: Bureau of Agricultural Economics. 0
April 28, 19713ax

PHILI'PPINES
GRAIN PRODUCTION POLICY REVIEW
Annual Average Prices Received by Farmers for Palay (Ordinary Varieties), by Region, 1960-77(Pesos per 50 kg sack)
Calendar Central Southern Western Central Eastern North/East South/Westyear Ilocos Cagayan Luzon Tagalog Bicol Visayas /a Visayas Visayas /a Mindanao /b Mindanao /c 'PhiliLppines
1960 10.33 8.83 10.66 10.07 9.51 9.55 /d 10.22 9.43 9.53 9.771961 12.07 11.36 12.64 12.13 10.56 11.86 /d 11.60 11].13 10.57 11.58.1962 11.11 10.00 11.88 11.55 10.40 11.22 7d 11.16 10.53 10.66 11.001963 1 .24 11.94 14.13 14.83 12.55 14.10 7d 13.82 13.24 12.77 13.361964 13.88 13.93 17.22 16.93 13.99 16.24 7d 1L4.86 14.76 13.92 15.441965 17.61 14.49 /e 15.86 13.40 15.82 7d 14.36 14.57 13.45 15.001966 17.65 16.15 21.16 16.32 16.39 16.92 7d 16.92 15.71 15.35 16.961967 21.09 16.71 21.46 16.32 16.53 15.48 1d ]8.18 15.43 16.10 17.281968 19S.15 15.10 19.59 17.80 14.85 15.50 1/7.32 15.11 15.38 16.50 cj1969 17.91 16.46 19.92 19.30 16.63 17.07 /d 17.66 15.50 13.84 16.991970 17.81 17.22 22.18 19.55 17.84 17.00 /'d 17.65 18.61 15.91 17.801971 27.39 31.55 30.35 22.90 24.89 27.47 /d 26.75 27.64 24.91 27.721972 30.80 28.64 32.55 30.22 26.96 30.33 /d 29.25, 29.72 25.58 30.481973 33.90 34.23 37.22 36.28 32.21 30.91 34.34 33.92 34.33 29.69 33.921974 47.33 44.45 49.09 45.47 41.03 43.34 43.23 43.22 46.46 43.14 44.511975 50.73 47.15 49.95 47.46 43.98 43.17 45.75 43.191 49.29 43.81 46.111976 50.60 50.76 52.11 48.74 46.59 46.15 50.32 45.54 47.42 45.78 413.231977 52.33 48.90 56.55 50.49 49.84 46.18 51.67 50.06, 49.26 47.79 50.01
/a Includes part of Central Visayas Region prior to 1973.lb From 1973 onwards represents Northern Mlindanao Region and in 1977 includes Central Mindanao Region./c From 1973 onwards calculated as an average, weighted by volurae of production, between ithe series reported separaltely
for Southern Mindanao Region and Western Mindanao Region./d Not separately reported; see footnote /a. . u/e Not available. " X
December 29, 1978
IN.
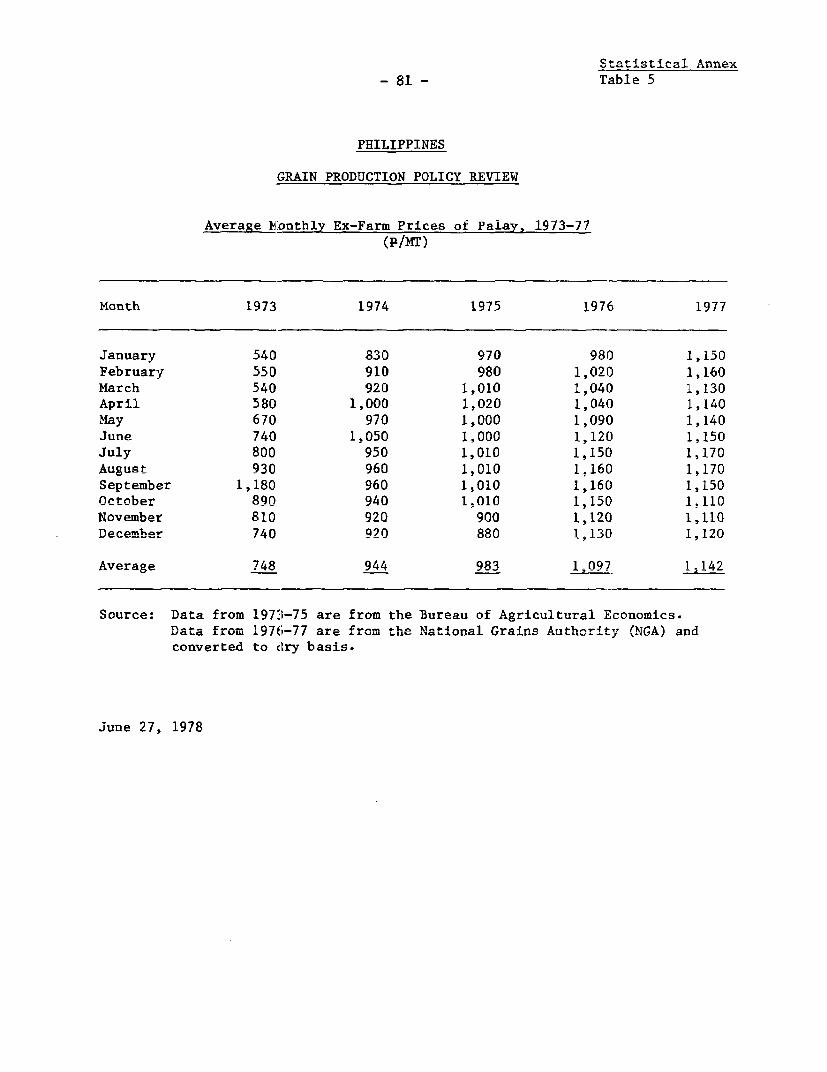
Statistical Annex
-81- Table 5
PHILIPPINES
GRAIN PRODUCTION POLICY REVIEW
Average M4onthly Ex-Farm Prices of Palay, 1973-77
Month 1973 1974 1975 1976 1977
January 540 830 970 980 1,150
February 550 910 980 1,020 1,160
March 540 920 1,010 1,040 1,130
April 580 1,000 1,020 1,040 1,140
May 670 970 1,000 1,090 1,140
June 740 1,050 1,000 1,120 1,150July 800 950 1,010 1,150 1,170August 930 960 1,010 1,160 1.170September 1,180 960 1,010 1,160 1,150
Ortober 890 940 1.010 1,150 1.110
November 810 920 900 1,120 1,110
December 740 92Q 880 1.130 1,120
Arave-e 748 944 983 15097 1.142
Source: Data from 19731-75 are from the Bureau of Agricultural Economics..Lata Lrom I ,17'7 are from LLLe National f-r.ais Authority (NGA) and
converted to dry basis.
june 27, i9i78
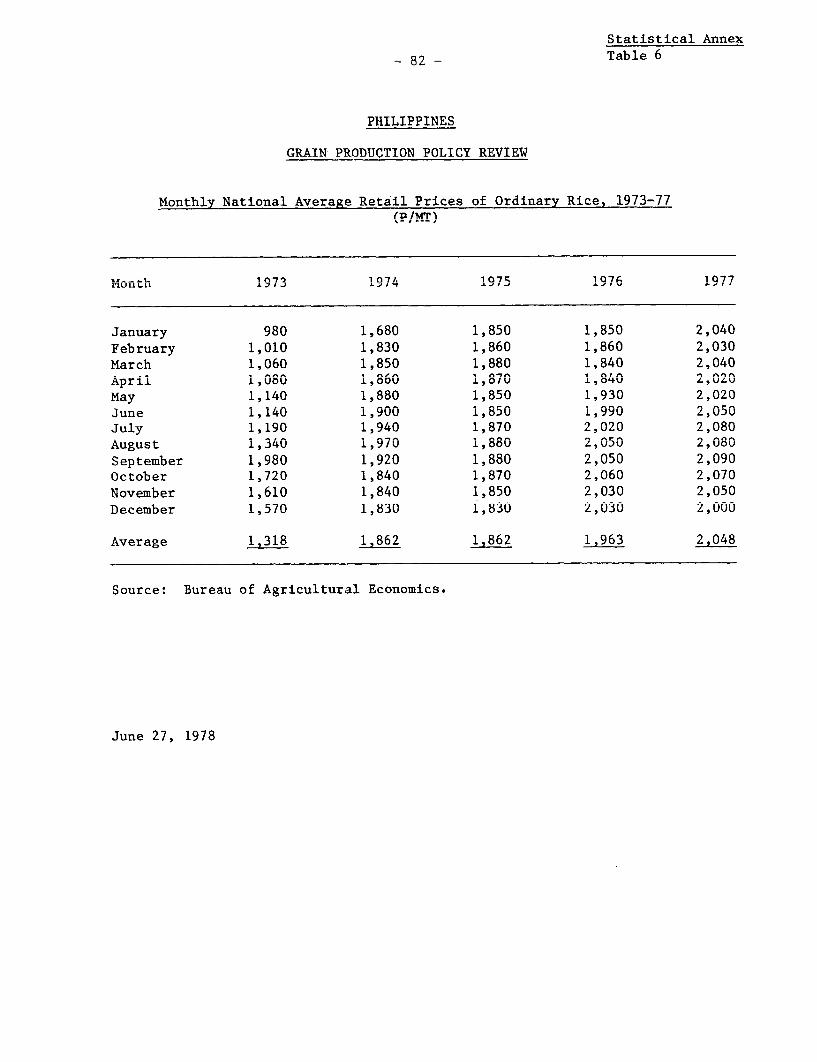
Statistical Annex
8- Table 6
PHILIPPINES
GRATN PRODIITTON POLICY REVIEW
Monthly National Average Retail Prices of Ordinary Rice, 1973-77(IN!Ti
Mor.th 1973 1974 1Q75 1976 1977
January 980 1,680 1,850 1,850 2,040February 1,010 1,830 1,860 1,860 2,030
March 1,060 1,850 1,880 1,840 2,040.~~~~~~~~~~' . ,A ^ ^ n0n X^n
April 1,080 1,o8u 1,8oU I,80o 2,0U2
May 1,140 1,880 1,850 1,930 2,020June 1,140 1,900 1,850 1,990 2,050July 1,190 1,940 1,870 2,020 2,080August 1,340 1,970 1,880 2,050 2,080
September 1,980 1,920 1,880 2,050 2,090October 1,720 1,840 1,870 2,060 2,070
November 1,610 1,840 1,850 2,030 2,050December 1,570 1,830 1,830 2,030 2,000
Average 1,318 1,862 1,862 1,963 2,048
Source: Bureau of Agricultural Economics.
June 27, 1978
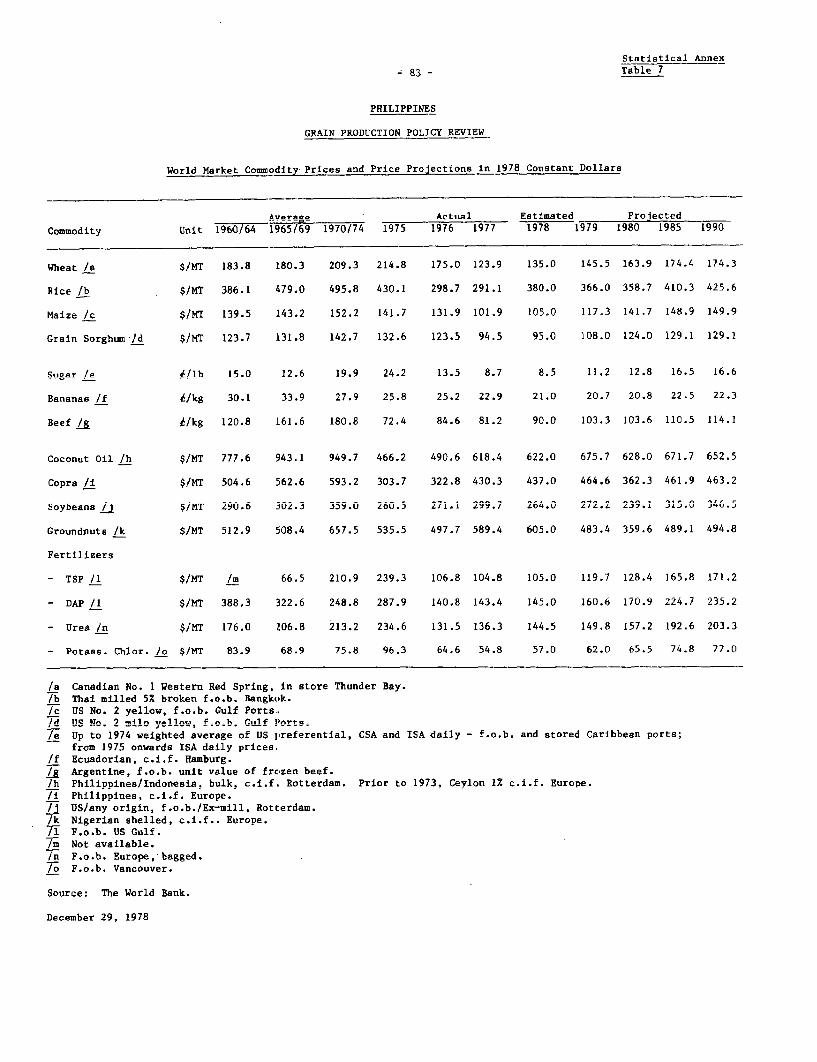
Statistical Annex
-83 - Table 7
PHILIPPINES
GRAIN PRODUCTION POLICY REVIEW
World Market Commodity Prices and Price Projections in 1978 Constant Dollars
Au..rAo Actual Estimated Proiected
Commodity Unit 1960/64 1965/69 1970174 1975 1976 1977 1978 1979 1980 1985 1990
Wheat /a $/MT 183.8 180.3 209.3 214.8 175.0 123.9 135.0 145.5 163.9 174.4 174.3
Rice lb $/MT 386.1 479.0 495.8 430.1 298.7 291.1 380.0 366.0 358.7 410.3 425.6
Maize /'c 5/- 139.5 143.2 1522141.7 131.9 101.9 105M0 117=3 141.7 148.9 149.9
Grain Sorghum |d $/MT 123.7 131.8 142.7 132.6 123.5 94.5 95.0 108.0 124.0 129.1 129.1
Sugar,/e I/lb 15.0 12.6 19.9 24.2 13.5 8.7 8.5 11.2 12.8 16.5 16.6
Bananas /f /kg 30.1 33.9 27.9 25.8 25.2 22.9 21.0 20.7 20.8 22.5 22.3
Beef /g& /kg 120.8 161.6 180.8 72.4 84.6 81.2 90.0 103.3 103.6 110.5 114.1
Coconut Oil /h $/MT 777.6 943.1 949.7 466.2 490.6 618.4 622.0 675.7 628.0 671.7 652.5
Copra /i $/MT 504.6 562.6 593.2 303.7 322.8 430.3 437.0 464.6 362.3 461.9 463.2
Soybeans /I $/MT 290.6 302.3 359.0 260.5 271.1 299.7 264.0 272.2 239.1 315.0 346.5
Groundnuts /k S/MT 512.9 508.4 657.5 535.5 497.7 589.4 605.0 483.4 359.6 489.1 494.8
Fertilizers
- TSP /1 $/MT /m 66.5 210.9 239.3 106.8 104.8 105.0 119.7 128.4 165.8 171.2
- DAP /1 $/MT 388.3 322.6 248.8 287.9 140.8 143.4 145.0 160.6 170.9 224.7 235.2
- Urer In $/MT 176O 206.8 213.2 234,6 131.5 136.3 144.5 149.8 157.2 192.6 203.3
- Potass. Chlor. /o $/MT 83.9 68.9 75.8 96.3 64.6 54.8 57.0 62.0 65.5 74.8 77.0
/a Canadian No. I Western Red Spring, in store Thunder Bay./b Thai milled 5% broken f.o.b. Bangkok.Tc US No. 2 yellow, f.o.b. Gulf Ports..Id US No. 2m yellow, faoab Gulf Ports./e Up to 1974 weighted average of US ireferential, CSA and ISA daily - f.o.b. and stored Caribbean ports;
from 1975 onwards ISA daily prices.if Ecuadorian, c.i.f. Hamburg./g Argentine, f.o.b. unit value of frozen beef.Ih Philippines/Indonesia, bulk, c.i.f. Rotterdam. Prior to 1973, Ceylon 1% c.i.f. Europe.Ti Philippines, c.i.f. Europe.LI US/any origin, f.o.b./Ex-mill, Rotterdam./k Nigerian shelled, c.i.f.. Europe.T F.o.b. US Gulf.Im Not available.In F.o.b. Europe, bagged.To F.o.b. Vancouver.
Source: The World Bank.
December 29, 1978

PHILIPPINES
GRAIN PRODUCTION POLICY REVIEW
Area of Corn Harvested. by Regio, Crop Years, 1961-77('000 ha)
Crop Cagayan Central Southern Western Central Eastern Western Northern SouthernYear Ilocos VaLley Luzon Tagalog Bicol Visayas /a Visayas Visayas /a Mindanao MLndanao MLndanao /b Philippines /c
1961 24.10 151.1 77.4 107.7 86.8 337.9 /d 345.0 /e 328.6 587.0 2,045.51962 20.6 133.7 71.5 105.2 77.5 272.2 Td 421.7 /e 283.5 630.4 2,016.31963 19.3 126.3 6:3.7 96.9 72.4 257.4 /d 393.6 /e 234.9 685.1 1,949.51964 16.5 118.1 57.1 94.9 68.9 272.2 Id 366.6 /e 215.6 687.5 1,897.61965 16.5 121.8 513.6 93,3 70.2 275.2 Td 367.6 /e 210.6 709.1 1,,922.81966 16.1 102.6 55.0 118,6 87.1] 251.0 /d 419.7 /e 223.7 832.2 2,106.11967 16.2 90.4 513.7 119,8 90.9 1 95.9 /d 423.6 ^C 265.0 897.5 2,,158.()1968 38.9 135.3 32.8 121.6 96.0) 140.3 425.1 105.0 155.8 253.3 743.13 2,247.9 001969 47.8 157.1 50.7 132.2 97. 2 L53.1 357.7 87.2 144.8 264.0 764.2 2,256.1 41970 43.6 202.9 54.7 169,3 101.5 1i63.3 363.2 103.0 191.7 260.7 765.83 2, 419.6I1971 47.5 2,40.3 54.6 172,,4 99. 4 166.9 354.8E 96.9 190.0 262.7 706.19 2,,392.21972 62.0 268.3 49.0 164,0 120.3 1,46.0 355.31 93.4 259.6 265.1 648.1 2,431.71973 49.5 279.5 46.9 193.6 134.2 152.2 354.7 104.1 190.8 243.2 576.8 2,325.41974 62.8 315.6 57.7 236.2 150.9 180.6 415.6 133.9 199.3 300.5 710.10 2,763.01975 63.1 346.0 54.0 246.5 155.6 204.7 447.6 140.3 202.0 334.0 868.7 3,062.51976 43.4 351.8 50.7 279,4 155.8 214.0 475.7 143.0 211.1 386.1 945.9 3,257.0)1977 45.9 349.7 50.1 295.0 156.3 232.5 484.6 149.9 209.9 406.2 940.6 3,320.6
/a Includes part of Central Visayas Region priLor t o 1968.
w/b Includes Western IMindaiiao Reagion prior- to 1968. r
/c Regions may not ald exactly to Philippines total due to rounding.
]d Not separately relportedi; see footcnote /a.
/e Not separately relportedi; see footnote lb.
Source: Bureau of Agricultural Economics.
June 2, 1978
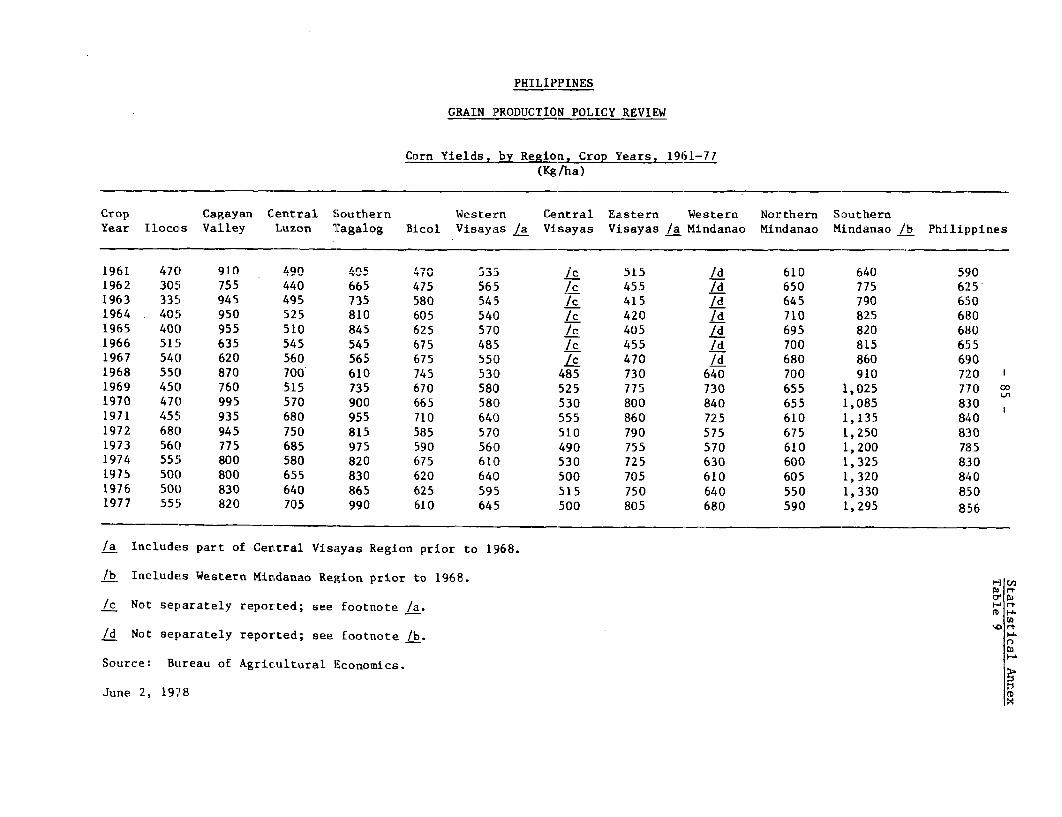
PHILIPPINES
GRAIN _PRODUCTION POLICY REVIEW
Corn Yields, by PIIon, Cirop Years, 1961-77(Kg/ha)
Crop Cagayan Central Southern Western Centra'L Eastern Western Northern SouthernYear I]locos Valley Luzon Tagalog Bicol Visayas /aL Visayas Visayas /a Mindanao Mindanao Mindanao /b Philippines
1961 470 910 49q 405 SC 53.5 /c 515 /d 610 640 5901962 305 755 440 665 475 56.5 /c 455 /d 650 775i 6251963 335 945 495 735 580 545 /c 415 /d 645 790 6501964 405i 950 525 810 605 541D Ic 420 /d 710 825 61301965 400 955 510 845 62 i 570 /c 405 /d 695 820 6801966 515 635 545 545 675 485 Tc 455 Id 700 815 6551967 540 620 560 565, 675 550 Ic 470 /d 680 860 6901968 550 870 700 610 745 530 485 730 640 700 910 72 01969 450 760 515 735 670 5810 525 775 730 655 1, 025 770 m1970 470 995 570 900 665 580 530 800 840 655 1,085 8301971 455 935 680 955 710 6413 555 860 725 610 1,1325 8401972 680 945 750 815, 585 570 510 790 575 675 1, 250) 8:301973 560 775 685 975 590) 560 490 755 570 610 1, 201) 78351974 555 800 580 820 675 610 530 725 630 600 1, 325 8:301975 500 800 655 83C' 620 640) 500 705 61.0 605 1, 321) 8401976 500 830 640 865, 625 595 515 750 64 0 550 1, 330 81501977 555 820 705 990 610 64.5 500 805 680 590 1, 29.5 8.56
/a Includes part oiE Cenrtral Visayas Region prior to 1968.
/b Includes Western Mindanao Region prior to 1968. H f
__ H ~~~~~~~~~~~~~~~~~~~~~~~~~~~~~~~~~~~~~~~~~~~~~~~~~~~~~~~~~rt/c Not separately reported; see footnote /a. v -
\D r,/d Not separately reported; see foot-note /b.
Source: Bureau of Agricultural Economics.
June 2, 1978 x

PHILIPPINES
GRAIN PRODUCTION POLICY REVIEW
Production of Corn, by Region, Crop Years, 1961-77('00CI mt)
Crop Cagayan Central Southern Western Central Eastern Western Northern Southern
Year llocos VaLley Luzon Tagalog Bicol Visayas /a Visayas Visayas /a Mindanao Mindanao Mindanao /b Philippines /c
1961 11.5 138.0 38.0 43.5 41.0 182.0C /d 178.0 /e 20:1.5 376.5 1,209.5
1962 6.5 101.0 31.5 70.0 37.0 155.0C /d 192.0 /e 184.5 489.0 1,266.5
1963 6.5 119.5 31.5 71.5 42.5 141.0C Id. 165.0) Ie 152.5 543.0 1,273.0
1964 7.0 112.5 30.0 77.0 42.0 147.0 /d 155.0 /TE 154.0 569.0 1,292.5
1965 6.5 116.5 30.0 79.0 44.0 157. 5 Idl 150.0 /e 147.0 582.0 1,312.5
1966 8.5 65.5 30.0 65.0 59.0 122.0 Id 191.5 Ie 156.5 682.0 1,38D.0
1967 9.0 56.0 33.0 68.0 61.5 108.0 I 199.5 Ic 181.0 774.0 1,490.0
1968 21.5 117.5 23.0 74.5 71.5 74.5 207.0 76.5 100.0 177.5 67 6.0 1,619.0 1
1969 21.5 119.5 26.0 97.0 65.5 89.C) 187.5 67. 5 105 5 172.5 781.5 1,733.0 Go
1970 20.5 201.5 31.0 152.0 67.5 95.( 193.5 82.5 161.5 170.5 832.5 2,008.0
1971 21.5 224.5 37.0 164.5 70.5 107.0 196.5 83.5 138,0 159.5 802.0 2,005.0
1971 42.5 253.0 37.0 134.0 70.5 83.5 181.0 74,0 150.0 179.5 808.5 2,012.5
19373 28.0I 216.5 32.0 189.0 79.5 85.5 174.5 78;5 108.5 148.0 691.0 1,831.0
19 74 35.13 252.5 33.5 194.0 101.5 110.( 219.5 97.0 126.0 179.5 939.5 2,288.5
19)75 31.5 277.0 35.5 204.0 96.5 131.5 223.5 99.0 123.0 203.0 1,144.5 2,568.5
1976 21.5 292.5 32.5 242.0 97.5 127. 5 244.0 107.0 135.0 211.5 1,256.0 2,767.0
1977 25.5 286.0 35.5 291.5 95.0 149.5 241.5 121.0 143.0 239.0 1,216.0 2,843.5
/a Includes part of Central Visayas Region prior t:o 1968.
/b Includes Western Mindanao Region prior to 1968. 3 u,
/Ic Regions may not add exactly to Philippines; total due to rounding. c
/d Not separately reported; see footncte /a. °
/I Not separately reported; see footnote /b.
x
Source: Bureau of Agricultural Economics.
June 2, 1978
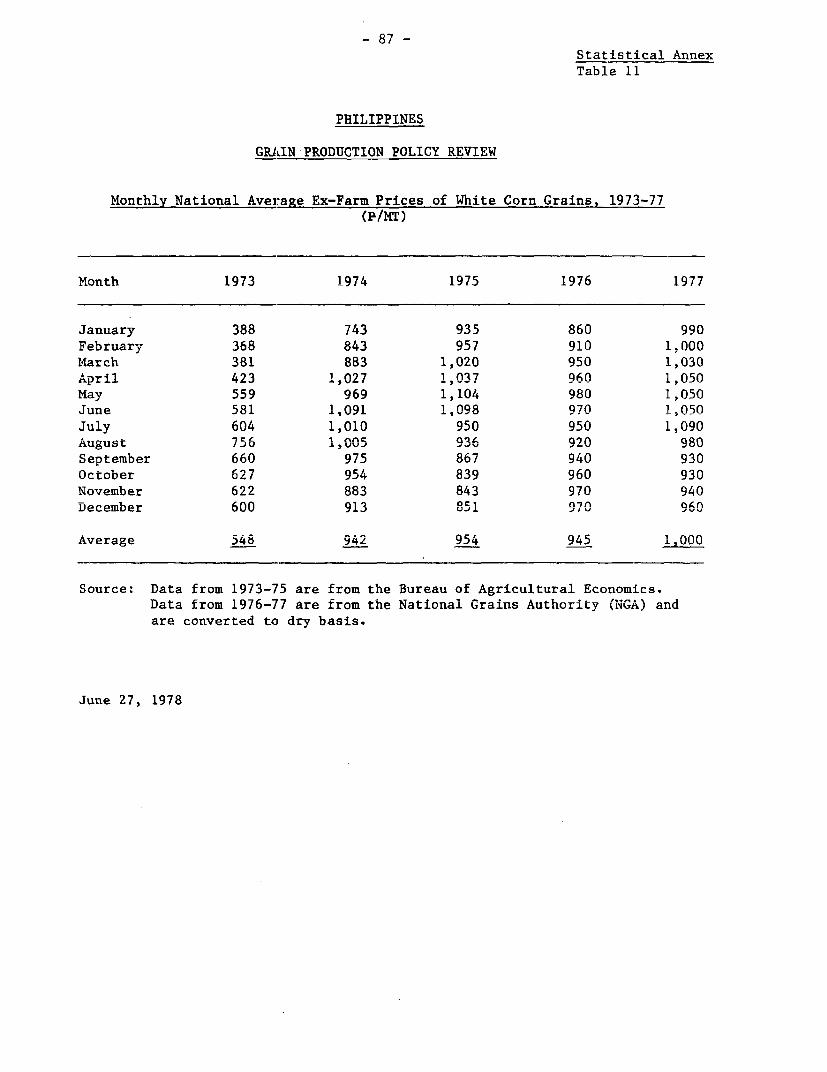
- 87 -Statistical AnnexTable 11
PHILIPPINES
GRhIN PRODUCTION POLICY REVIEW
Monthly National AveraRe Ex-Farm Prices of White Corn Grains, 1973-77(EP/N)
Mor.th 1973 1974 1975 1976 1977
January 388 743 935 860 990
February 368 843 957 910 1,000
March 381 883 1,020 950 1,030A .9 1 1 A971
ApriL.L 43 1,027 1,037 q6 1;Q50
May 559 969 1,104 980 1,050
Jurne 581 1,09 1,098 970 1,050
July 604 1,010 950 950 1,090
August 756 1,005 936 920 980
September 660 975 867 940 930
October 627 954 839 960 930
November 622 883 843 970 940
December 600 913 851 970 960
Average 548 942 954 945 1.00
Source: Data from 1973-75 are from the Bureau of Agricultural Economics.Data from 1976-77 are from the National Grains Authority (NGA) and
are converted to dry basis.
June 27, 1978
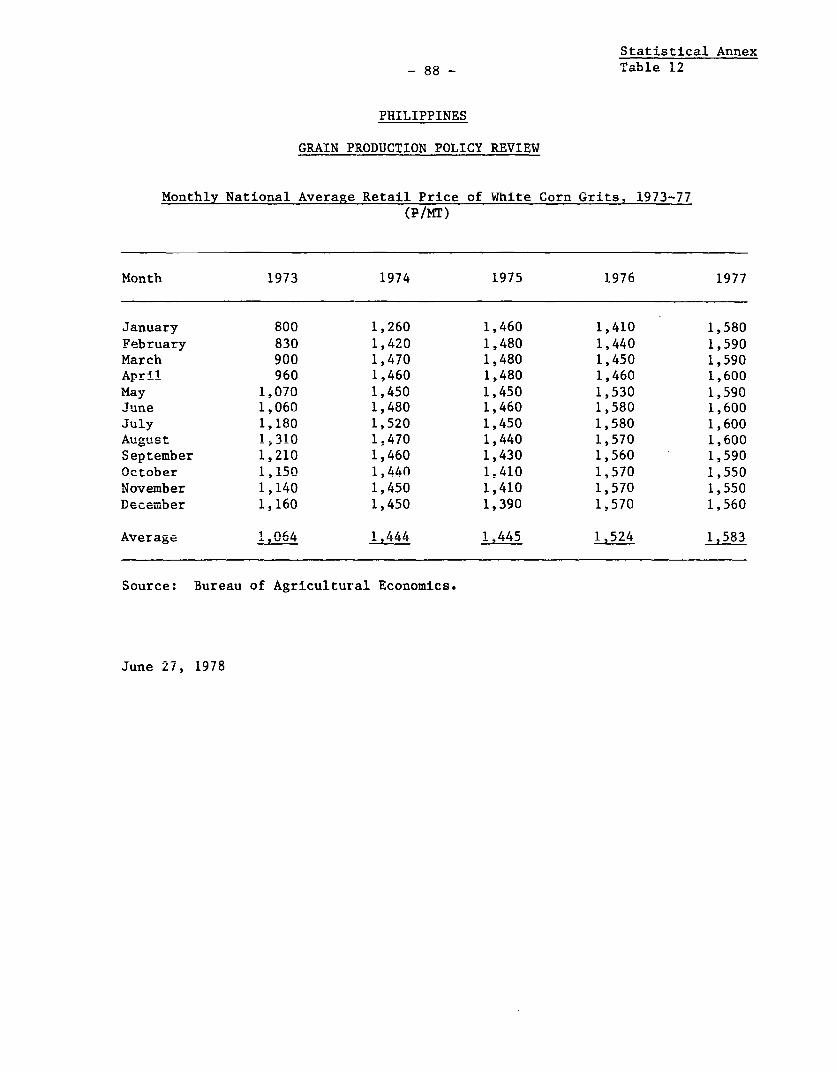
Statistical Annex
- 88 - Table 12
PHILIPPINES
GRAIN PRODUCTION POLICY REVIEW
Monthly National Average Retail Price of White Corn Grits, i973-77
(P/MT)
Month 1973 1974 1975 1976 1977
January 800 1,260 1,460 1,410 1,580
February 830 1,420 1,480 1,440 1,590
March 900 1,470 1,480 1,450 1,590
April 960 1,460 1,480 1,460 1,600
May 1,070 1,450 1,450 1,530 1,590
June 1;060 1,480 1,460 1,580 1,600
July 1,180 1,520 1,450 1,580 1,600
August 1Alt0 1,470 1,440 1,570 1,600
September 1,210 1,460 1,430 1,560 1,590
October 1,150 1;440 1,410 1,570 1,550
November 1,140 1,450 1,410 1,570 1,550
December 1,160 1,450 1,390 1,570 1,560
Average 1 ,064 1 ,444 1445 1,524 1.583
Source: Bureau of Agricultural Economics.
June 27, 1978
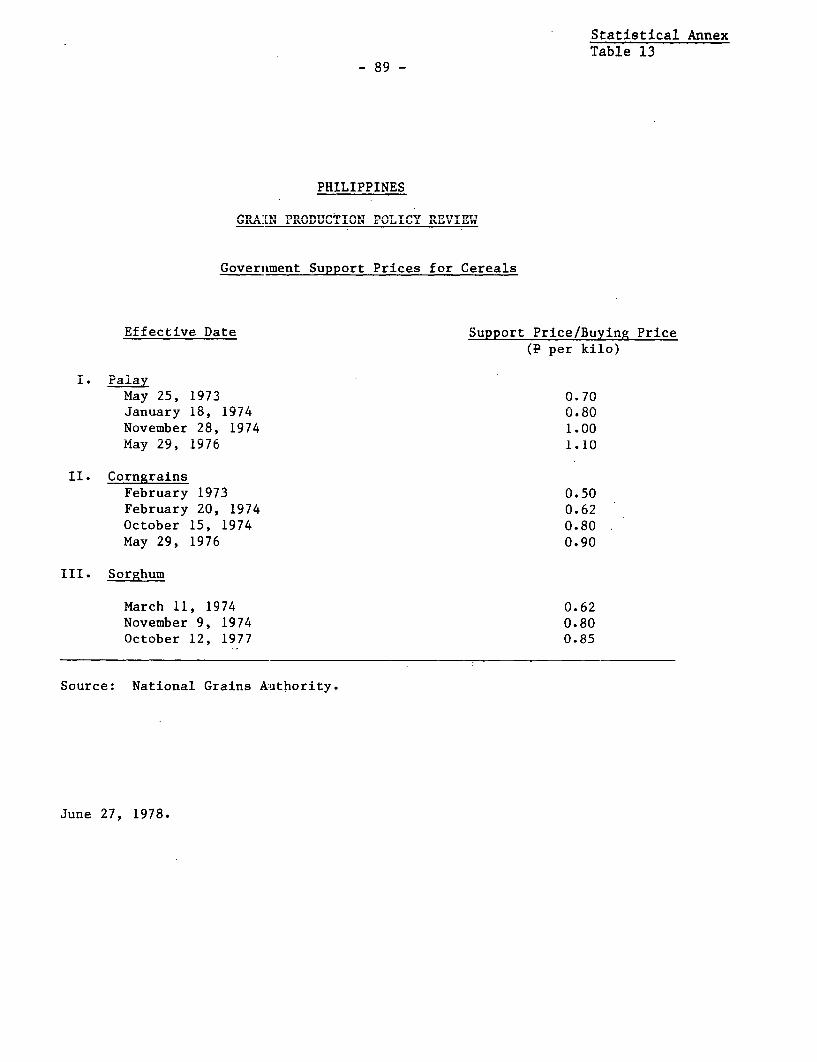
Statistical AnnexTable 13
- 89 -
DUTT TI)DT?UJLC
~fl A -r,.r nfl TI,m rTh lV rp7 fE7KTUL%IMLI U% PU%.LTnIPP '% I "U nLES'L
Government Support Prices for Cereals
Effective Date Support Price/Buying Price(P per kilo)
i. PalayMay 25, 1973 0.70January 18, 1974 0.80November 28, 1974 1.00May 29, 1976 1.10
II. CorngrainsFebruary 1973 0.50February 20, 1974 0.62October 15, 1974 0.80May 29, 1976 0.90
III. Sorghum
March 11, 1974 0.62November 9, 1974 0.80October 12, 1977 0.85
Source: National Grains Authority.
June 27, 1978.
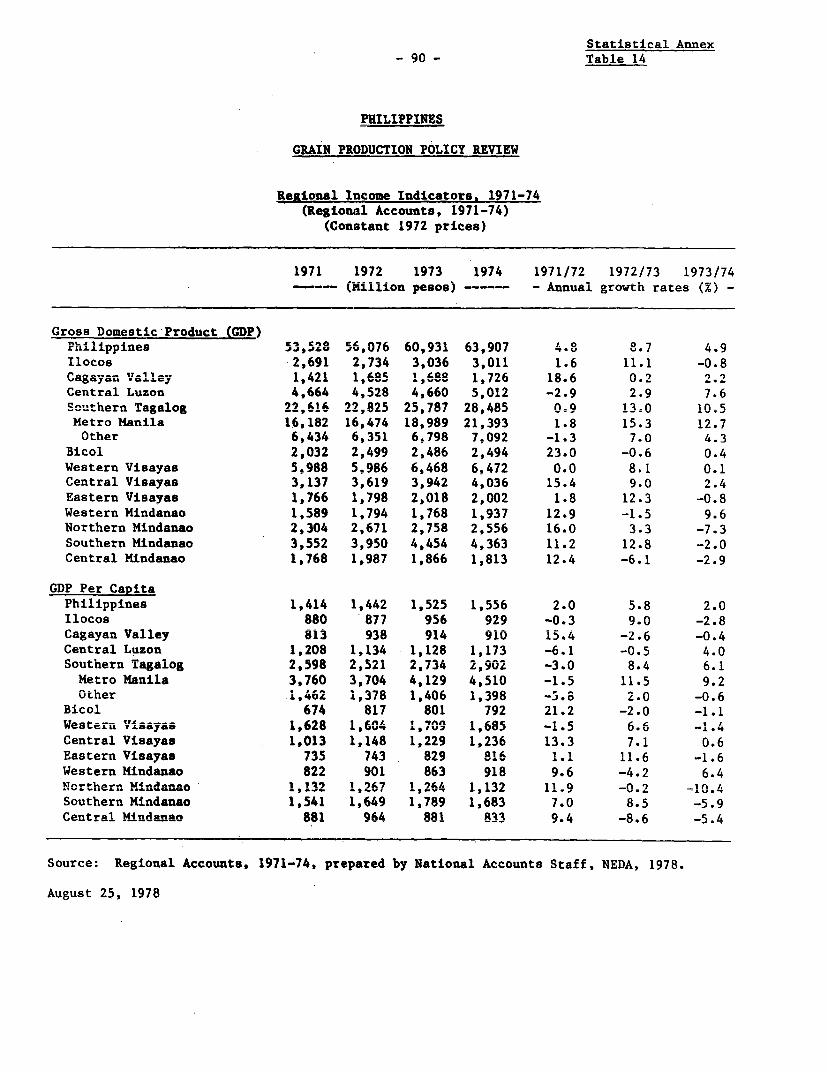
Statistical Annex- 90 - Table 14
PHILIPPINES
GRAIN PRODUCTION POLICY REVIEW
Regional Income Indicators. 1971-74(Regional Accounts, 1971-74)
(Constant 1972 prices)
1971 1972 1973 1974 1971/72 1972/73 1973/74-- (Million pesos) - Annual growth rates (%) -
Gross Domestic Product (GDP)P h-ilppi'ues 5, c28 56,076 67 0, 9 31:Ku3 6907 7 0 0 47.
Ilocos 2,691 2,734 3,036 3,011 1.6 11.1 -0.8Cagayan Valley 1, 4') 1 1 688 1, 726 18.6 0 2 2
.Ja5a;aL. ... cj .a . .,85 . -Central Luzon 4,664 4,528 4,660 5,012 -2.9 2.9 7.6Southern Ta-alog 22,6!6 22,825 25787 2-84-8 0=9 13=0 10.5Metro Manila 16,182 16,474 18,989 21,393 1.8 15.3 12.7Other 6,434 6,351 6,798 7,092 -1.3 7.0 4.3
Bicol 2,032 2,499 2,486 2,494 23.0 -0.6 0.4Western Visayas 5,988 5,986 6,468 6,472 0.0 8.1 0.1Central Visayas 3,137 3,619 3,942 4,036 15.4 9.0 2.4Eastern Visayas 1,766 1,798 2,018 2,002 1.8 12.3 -0.8Western Mindanao 1,589 1,794 1,768 1,937 12.9 -1.5 9.6Northern Mindanao 2,304 2,671 2,758 2,556 16.0 3.3 -7.3Southern Mindanao 3,552 3,950 4,454 4,363 11.2 12.8 -2.0Central Mindanao 1,768 1,987 1,866 1,813 12.4 -6.1 -2.9
GDP Per CapitaPhilippines 1,414 1,442 1,525 1,556 2.0 5.8 2.0Ilocos 880 877 956 929 -0.3 9.0 -2.8Cagayan Valley 813 938 914 910 15.4 -2.6 -0.4Central Luzon 1,208 1,134 1,128 1,173 -6.1 -0.5 4.0Southern Tagalog 2,598 2,521 2,734 2,902 -3.0 8.4 6.1Metro Manila 3,760 3,704 4,129 4,510 -1.5 11.5 9.2Other 1,462 1,378 1,406 1,398 -5.8 2.0 -0.6
Bicol 674 817 801 792 21.2 -2.0 -1.1"=steru V.'sayas £,628 1,604 :,709 1,685 -. ' 6.6Central Visayas 1,013 1,148 1,229 1,236 13.3 7.1 0.6Eastern Visayaa 7 3 5 74" 82 8! 1.! 1.6 -=1.6
Western Mindanao 822 901 863 918 9.6 -4.2 6.4Northern Mindana-o I,!3 1,267 1,264 1,132 11.9 -0.2 =10.4Southern Mindanao 1,541 1,649 1,789 1,683 7.0 8.5 -5.9Central Mindanao i881 964 881 833 9.4 -8=6 -5.4
Source: Regional Accounts, 1971-74, prepared by National Accounts Staff, NEDA, 1978.
August 25, 1978
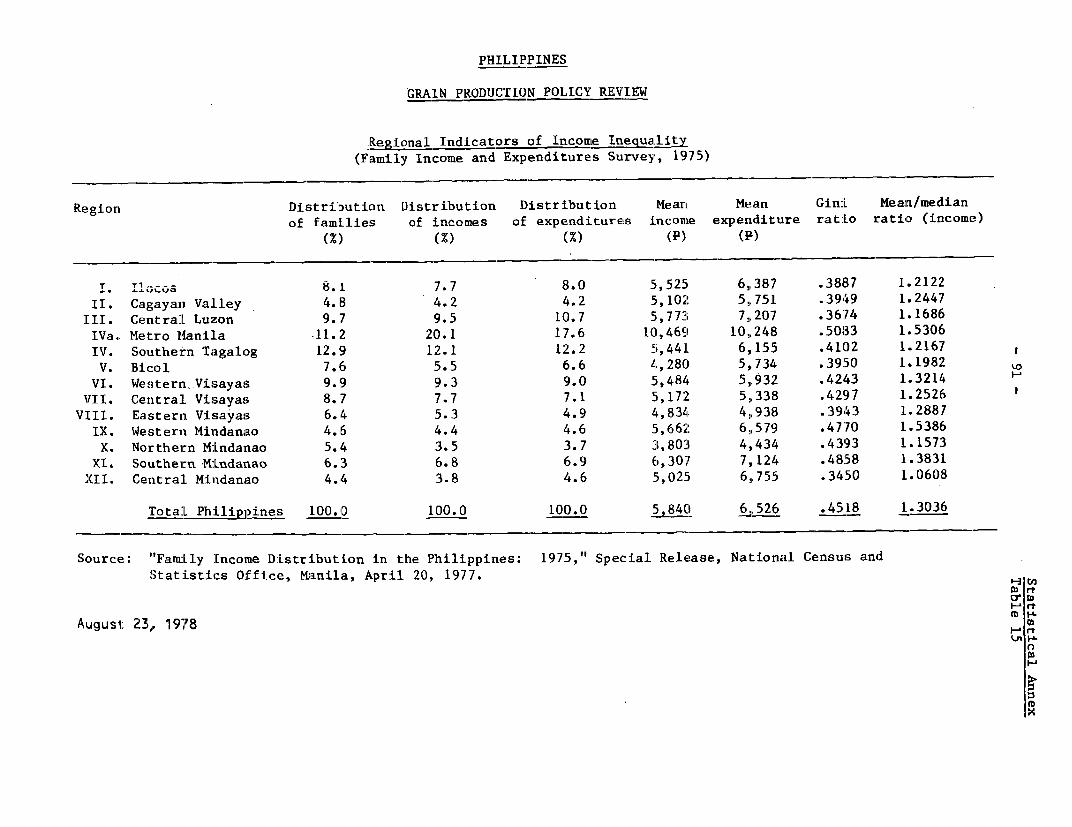
PHILIPPINES
GRAIN PRODUCTION POLICY REVIEW
Regional Indicators of Incone Inequallity(Family Income and Expenditures Survey, 19i75)
Region Distribution Distribution Distribution Mean Mean GiniL Mean/meidianof famnilies of incomes of expenditures income expenditure ratLo ratio (income)
(%) (Z) (M) (P) (il)
T, llOcris 8.1 7.7 8.0 5, 525 6,387 .38137 1.2122II. Cagayan Valley 4.8 4.2 4.2 i,102 5,751 .3949 1.2447
III. Centra:L Luzon 9.7 9.5 10.7 5,773 7,207 .3674 1.1686IVa. Metlro Manila .11.2 20.1 17.6 lCI,46S1 10,248 .5083 1.5306IV. Southern Tagalog 12.9 12.1 12.2 5,441 6,155 .4102 1.2167 1V. Bicol 7.6 5.5 6.6 4,280 5,734 .3950 1.1982 '
VI. Western, Visayas 9.9 9.3 9.0 5i,484 5,932 .4243 1.3214VII. Central Visayas 8.7 7.7 7.1 '5,172 5,338 .4297 1.2526
VIII. Eastern Visayas 6.4 5.3 4.9 4,834 4,938 .3943 1.2887IX. Western Mindanao 4.6 4.4 4.6 5,662 6,579 .4770 1.5386X. Northern MLndanao 5.4 3.5 3.7 3,803 4,434 .4393 1.1573
XI. Southern Mindanao 6.3 6.8 6.9 6,307 7,124 .4858 1.3831XII. Centra:L Mindanao 4.4 3.8 4.6 '5,025' 6,755 .3450 1.0608
jTotal Ph:Lli]1ines 100.0D 100.0 100.0 ,840 6,52 6 .4518 1.3036
Source: "Family :rncoine Distr:ibution in the Plhilippines: 1975," Special Release, National Census andStat:istics Office, Manila, April 20, 1977.
i-3 t.CDrtP rtm 6
August: 23, 1978
P
H
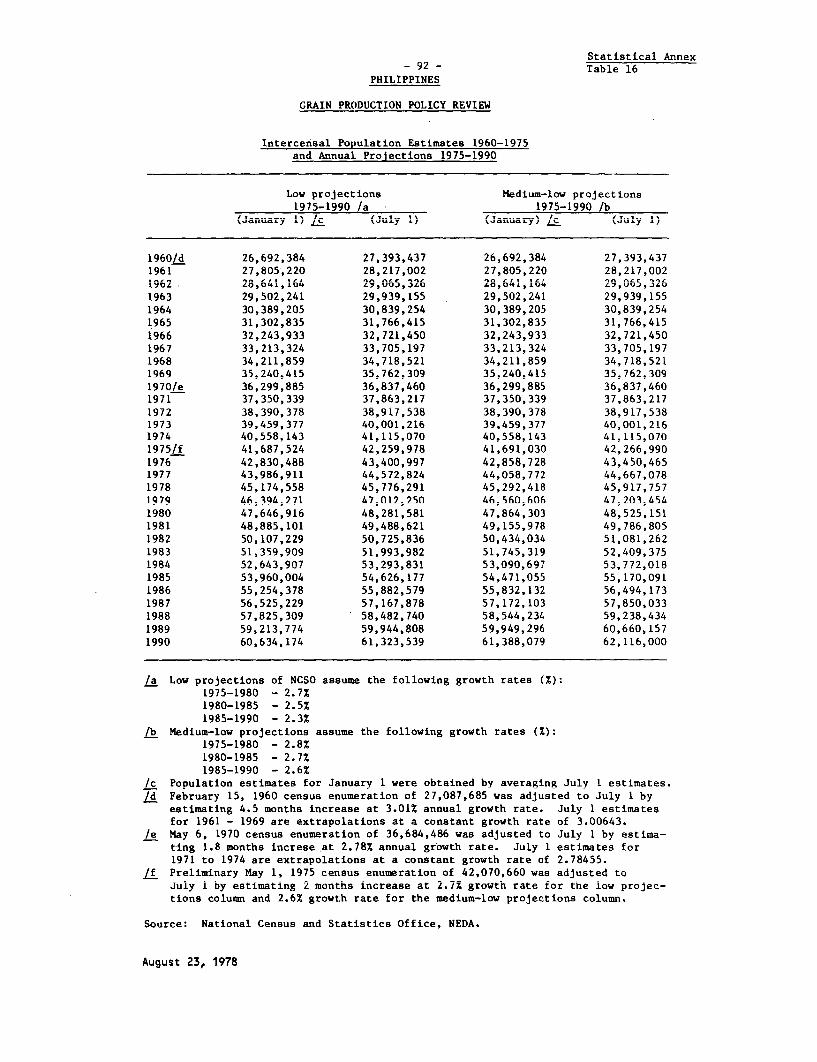
Statistical Annex- 92 - Table 16
PHILIPPINES
GRAIN PRODUCTION POLICY REVIEW
Intercensal Population Estimates 1960-1975and ^Anr.ual Proiectio..s !975=1990
Low projections Medium-low projections1975-1990 /a 1975-1990 /b
(Jr.ar 1) ̂ I..l 1) (Jnury I- (July 1)
1960/d 26,692,384 27,393,437 26,692,384 27,393,4371961 27,805,220 28,217,002 27,805,220 28,217,002;9o 28,64;,;64 29,065,326 2861:429,065321963 29,502,241 29,939,155 29,502,241 29,939,1551964 30.389.205 30.839,254 30,389.205 30,839,2541965 31,302,835 31,766,415 31,302,835 31,766,4151966 32,243,933 32,721,450 32,243,933 32,721,4501967 33,213,324 33,705,197 33,213,324 33,705,1971968 34,211,859 34,718,521 34,211,859 34,718,5211969 35,240,415 35,762,309 35,240,415 35,762,3091970/e 36,299,885 36,837,460 36,299,885 36,837,4601971 37,350,339 37,863,217 37,350,339 37,863,2171972 38,390,378 38,917,538 38,390,378 38,917,5381973 39,459,377 40,001,216 39,459,377 40,001,2161974 40.558.143 41.115.070 40.558.143 41.11510701975/f 41,687,524 42,259,978 41,691,030 42,266,9901976 42,830,488 43,400,997 42,858,728 43,450,465i977 43,986,911 44,572,824 44,058,772 44,667,0781978 45,174,558 45,776,291 45,292,418 45,917,7571979 46;3945271 471012;250 46:560;606 47;203;4541980 47,646,916 48,281,581 47,864,303 48,525,1511981 48,885,101 49,488,621 49,155,978 49,786,8051982 50,107,229 50,725,836 50,434,034 51,081,2621983 51,359,909 51,993,982 51,745,319 52,409,3751984 52,643,907 53,293,831 53,090,697 53,772,0181985 53,960,004 54,626,177 54,471,055 55,170,0911986 55,254,378 55,882,579 55,832,132 56,494,1731987 56,525,229 57,167,878 57,172,103 57,850,0331988 57,825,309 58,482,740 58,544,234 59,238,4341989 59,2!3,774 59,944,808 59,949,296 60,660,0571990 60,634,174 61,323,539 61,388,079 62,116,000
/a Low projections of NCSO assume the following growth rates (%)::97115-19780V = 2.7X%
1980-1985 - 2.5%
1985-1990 - 2.3%
/b Medium-low projections assume the following growth rates (X):1975-1980 - 2.8%
1980-1985 - 2.7%1985-1990 - 2.6%
/c Population estimates for January 1 were obtained by averaging July 1 estimates./d February 15, 1960 census enumeration of 27,087,685 was adjusted to July 1 by
estimating 4.5 months increase at 3.01% annual growth rate. July 1 estimatesfor 1961 - 1969 are extrapolations at a constant growth rate of 3.00643.
/e May 6, 1970 census enumeration of 36,684,486 was adjusted to July 1 by estima-ting 1.8 months increse at 2.78% annual growth rate. July 1 estimates for1971 to 1974 are extrapolations at a constant growth rate of 2.78455.
/f Preliminary May 1, 1975 census enumeration of 42,070,660 was adjusted toJuly 1 by estimating 2 months increase at 2.7% growth rate tor the low projec-tions column and 2.6% growth rate for the medium-low projections column.
Source: National Census and Statistics Office, NEDA.
August 23, 1978
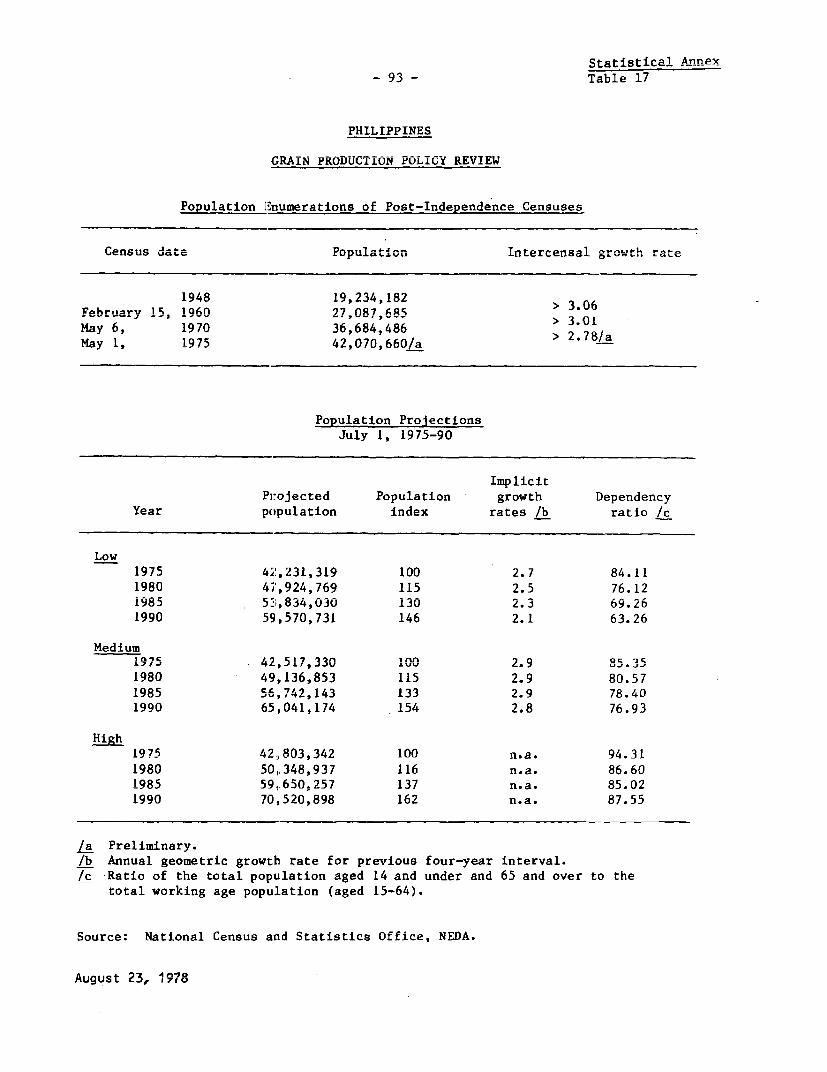
tif-4stical Annex
-93 - Table 17
PHILIPPINES
GRAIN PRODUCTION POLICY REVIEW
Population ]-numerations of Post-Independence Censuses
Cenusua date I PopL..LaL.u ul atio. I .nteren.sal growth rate
1948 19,234,182 > 3.06February 15, 1960 27,087,685May 6, 1970 36,684,486 > 3.01M:,v 1.. 1Q75 42;0fl70;660/a
Population ProjectionsJuly 1, 1975-90
Implicit
Projected Population growth Dependency
Year population index rates /b ratio /c
Low
1975 42,231,319 100 2.7 84.11
1980 47,924,769 115 2.5 76.12
1985 5$,834,030 130 2.3 69.26
1990 59,570,731 146 2.1 63.26
Medium1975 42,517,330J 100J 2. 53
1980 49,136,853 115 2.9 80.57
1985 56, 742,143 133 2.9 78.40
1990 65,041,174 154 2.8 76.93
High1975 42,.803,342 100 n.a. 94.31
1980 50,348,937 116 n.a. 86.60
1985 59.650.257 137 n.a. 85.02
1990 70,520,898 162 n.a. 87.55
/a Preliminary.lb Annual geometric growth rate for previous four-year interval.
/c Ratio of the total population aged 14 and under and 65 and over to the
total working age population (aged 15-64).
Source: National Census and Statistics Office, NEDA.
August 23, 1978