Embed Size (px)
Citation preview

July 22, 2013 A Weekly Snapshot of Southeast Asia Commodities News and Commentary
To contact the Southeast Asia Commodity Digest editors and analysts about the content of this publication
please email us at [email protected] or call 732-428-6318.
775 Ridge Lake Boulevard, Suite 400 ~ Memphis, Tennessee 38120-9403 ~ Telephone 901.202.4600 ~ Fax 901.766.4402
http://www.informaecon.com and http://www.informaecon.com/sacd.asp
PHILIPPINES MAY SEE RICE SHORTAGE AS INVENTORIES SHRINK 11 PERCENT ON MONTH By Rene Pastor
Rice stocks in the Philippines, one of the world’s top importers of rice, dropped 11.49 percent in
a month to reach 2.31 million metric tons as of June 1 and the amount of grain stored in state and
commercial warehouses also slipped, the government’s Bureau of Agricultural Statistics said.
Inventories of rice in state and private warehouses slipped to 40 days of consumption, from 42
days as of May 1, raising the prospect that more rice imports could be needed to shore up
supplies in the seasonally tight third quarter of the year. Daily consumption of 35,000 to 36,000
tons and an expanding population have stoked rice consumption in the country of nearly 100
million people, the second biggest in Southeast Asia.
The Philippines’ main rice harvest is in the last quarter of a calendar year and the government
has imported 350,000 tons to ensure supplies of Filipinos’ staple food does not run short. To
quell public anxiety, the government’s National Food Authority said it has approved the sale of
rice from its warehouses. It did not say how much rice was released.
The question now is whether a shortage will develop, given the prideful declarations of the
government that the Philippines will be self-sufficient in rice this year.
As things stand, rice inventories in official and commercial warehouses stand at less than 1-1/2
months of daily consumption. Government policy normally requires three months of rice stocks
especially going into the third quarter of the year.
The government imported the rice after inventories dropped to a six-month low at 1.94 million
tons as of March 1.
With rice stocks slipping, Manila may be in the market for rice at a time when Thailand is trying
to book sales of rice to move inventory in its warehouses.
Another reason for the Philippines to look at imports is due to the fact that production may take a
hit from high temperatures which have affected yields, analysts have said.
Thailand needs to unload rice it has purchased from its farmers as a result of a subsidy program
that is increasingly becoming unwieldy.

Southeast Asia Commodity Digest July 22, 2013 Page 2
Copyright © 2013 by Informa Economics, Inc.
If this transaction is a g-to-g deal (government to government), the haggling should be intense.
The only advantage the Philippines would have is that there are other sources of rice, such as
Vietnam and India.
The 5 percent broken rice sold in the international market is being priced by Thailand around
$450-$475 per metric ton for nearby shipment. Vietnam is selling the same grain around 15 to 20
percent lower than Thai rice.
The price of Thai rice does not include the cost of warehousing the grain it bought from farmers.
The price the government paid to farmers under is pledging plan ranges from $470 to $480. Then
you would need to add about $150 to $200 for warehouse costs.
For Thailand to come up with the possible sale, it would need to offer some kind of discount to
Manila.
The Thais are under pressure to clear the rice from their warehouses because the new harvest of
Thai rice is due to come in this October.
The supply situation in the Philippines will likely become tighter, especially if seasonal typhoons
hit its main rice-growing areas.
The U.S. agricultural attaché in Manila has estimated the Philippines would import 1.2 million
metric tons of rice in 2013/14 (May/April), down slightly from 1.5 million in 2012/13. The
report is not official data from the U.S. Agriculture Department, but is considered authoritative
by the commodities trade.
Thailand is one of the world’s top exporters of rice, but competition has come from Vietnam and
India, where production costs and shipping rates are lower than in Thailand.
SOUTHEAST ASIA CASH RICE: DEMAND WEAK AS MOST BUYING COMES FROM CHINA By Jack Scoville, The Price Futures Group
Asian cash rice prices showed some stability in the face of news that Thailand will start to offer
some of the massive supplies on hand into the world and internal market and that it would cut
prices paid to farmers for the coming crop as well.
The only buying o note has come from China, which has admitted that some of its rice had been
contaminated and that will keep ideas the Chinese will be active buyers in world markets alive.
Asian demand remains poor away from China. The Philippines is still aiming at producing more
rice and says it has 2 percent more than last year at this time. It says it has enough supplies on
hand to get through the next few months of down production.
Indonesia is saying it might need to import 600,000 tons of rice this year and would be a
candidate for some of the Thai sales.

Southeast Asia Commodity Digest July 22, 2013 Page 3
Copyright © 2013 by Informa Economics, Inc.
Vietnam is having trouble with rice sales beyond those to China. The prices there have been
stable, but with some down side pressure noted due to the weak export pace. Pakistan and India
crops should be in mostly good condition as the monsoon has been a little early and the rains
have been good.
As a result, prices in Asia should stay stable to weak.
THAI RICE PRICE QUOTES FROM THE THAI RICE EXPORTERS ASSOCIATION:
Item 19 Jun 13 26 Jun 13 3 Jul 13 17 Jul 13
Thai Hom Mali Rice Grade A (crop year 2011/12) $1169 $1154 $1158 $1162
Thai Hom Mali Rice Grade A (crop year 2012/13) $1195 $1170 $1174 $1178
Thai Pathumthani Fragrant Rice $946 $933 $936 $939
White Rice 100% Grade B $556 $538 $540 $542
White Rice 5% $539 $522 $524 $525
White Rice 25% $534 $517 $519 $521
White Broken Rice A.1 Super $522 $506 $507 $509
White Glutinous Rice 10% $958 $929 $932 $952
Parboiled Rice 100% $562 $548 $543 $548
Unit : USD per MT (Metric Tons)
BUYING AND SELLING PRICES OF RICE FROM THE PHILIPPINES’ OFFICIAL NATIONAL FOOD AUTHORITY
S E L L I N G P R I C E S
V A R I E T Y
Selling Price (per kg) Ex-Warehouse Including Container
ACCREDITED RETAILERS
GOVERNMENT AGENCIES
PRIVATE INSTITUTIONS/
OTHERS WholeSale Consumer Cash/Credit Cash
I. LOCAL RICE
A. Well-Milled Rice WMO 26.00 28.00 26.00/28.00 28.00 WM1 25.00 27.00 25.00/25.00 27.00 WM2 24.00 26.00 24.00/26.00 26.00 B. Strong Regular-Milled Rice SRO 26.00 28.00 26.00/28.00 28.00 SR1 25.00 27.00 25.00/25.00 27.00 SR2 24.00 26.00 24.00/26.00 26.00

Southeast Asia Commodity Digest July 22, 2013 Page 4
Copyright © 2013 by Informa Economics, Inc.
C. Regular-Milled Rice RMO 25.00 27.00 25.00/25.00 27.00 RM1 24.00 26.00 24.00/26.00 26.00
RM2 23.00 25.00 23.00/25.00 25.00
RM3 23.00 25.00 23.00/25.00 25.00
D. Iron Fortified Rice WM2 / SR2 / RM1 24.00 26.00 24.00/26.00 26.00 RM2 / RM3 23.00 25.00 23.00/25.00 25.00
E. Remilled Iron Fortified Rice WM2 / SR2 / RM1 24.00 26.00 24.00/26.00 26.00 RM2 / RM3 23.00 25.00 23.00/25.00 25.00 WM0 / SR0 26.00 28.00 63.00/28.00 28.00 WM1 / SR1 / RM0 25.00 27.00 25.00/27.00 27.00 II. IMPORTED RICE
25% Brokens / Iron Fortified Rice 25.00 27.00 25.00/27.00 27.00
B U Y I N G P R I C E S
Beneficiary/Commodity Basic Buying Price
I n c e n t i v e s Effective
Buying Price CDIF Delivery Fee
Drying Fee
FOs/FAs/FGs PALAY 17.00 0.30 0.20 0.20 17.70 WHITE CORN (WGN) 13.00 0.30 0.20 0.20 13.70 YELLOW CORN (YGN) 12.30 0.30 0.20 0.20 13.00 INDIVIDUAL FARMERS PALAY 17.00 - 0.20 0.20 17.40 WHITE CORN (WGN) 13.00 - 0.20 0.20 13.40 YELLOW CORN (YGN) 12.30 - 0.20 0.20 12.70
INDONESIA IN WHEAT BUYING SPREE, AS PHILIPPINES CANCELS SMALL AMOUNT OF WHEAT By Rene Pastor, SACD analyst, and Jack Scoville, The Price Futures Group
Indonesia bought a total of 68,300 metric tons, bringing its two-week total to 126,050 tons, as the
pace of buying from the biggest wheat importer in Southeast Asia picked up, U.S. government
data and trade sources showed.
The 68,300 tons may have been for prompt delivery as the grain was immediately put aboard a
ship to be transported to Jakarta. If the Indonesians bought hard red winter wheat for August
arrival, the price is ranging around $305 to $325 per ton FOB, depending on the protein content.
If it is soft white wheat, the price would be around $280 to $285 per ton FOB, trading sources
said.
Southeast Asia Commodity Digest July 22, 2013 Page 5
Copyright © 2013 by Informa Economics, Inc.
Freight rates from the U.S. Pacific Northwest for Indonesia, Malaysia and the Philippines have
increased, reflecting higher fuel costs. They were quoted at $40 per ton FOB for Handymax
vessels, from $39 per ton FOB last week and were quoted at $38 per ton FOB for Panamax ships,
from $37 per ton FOB last week, trading sources said.
There were no quotes seen for freight rates for Handy vessels, they said.
The Philippines cancelled a small purchase of 1,100 tons of wheat.
The U.S. continues to be the origin of choice for China. They have been buying a lot of soft red
winter wheat for use as feed and for noodles. There are other buyers for U.S. wheat who have
started to join the Chinese and get some buying on the books. Other Asian buyers are starting to
buy U.S. white wheat again after the recent GMO scare.
The lowest priced origin though is still the Black Sea. Their prices are a good 50 cents per
bushel less than those in the U.S. Even the EU is featuring some cheaper wheat than the U.S.
these days.
Futures have been hanging just above recent lows because of the recent increase in demand, but
have the potential to work lower. Many buyers will buy from the Black Sea due to price,
especially in the Middle East and Northern Africa where the biggest world buyers are.
So it seems logical that U.S. prices will need to work lower and eventually give Asian buyers
better prices. The recent news that Russian production might be about 5 percent less than
expected did little to rally prices at the Black Sea, so it seems likely that futures will need to
work lower over time and that new contract lows are likely. Asian buyers should stay hand-to-
mouth for now.
In other grains news, the Philippines and Thailand were big buyers of soybeans and soybean
meal and cake, which are used mainly in the animal feed industry of both countries. Thailand
bought 20,000 tons of soybeans and the Philippines purchased 14,800 tons of soybean cake and
meal, the U.S. government said.
A total of 58,500 tons of soybean meal and cake was shipped out to the Philippines, one of the
leading buyers of the grain product in Southeast Asia. About 10,400 tons of soybeans were
shipped to Vietnam and 6,100 tons of soybeans were shipped to Indonesia in the last week.
More developments: Singapore purchased 300 tons of rice from the U.S., Indonesia cancelled a
purchase of 600 tons of soybeans from the U.S,, and the Philippines bought 200 tons of barley
also from the United States.
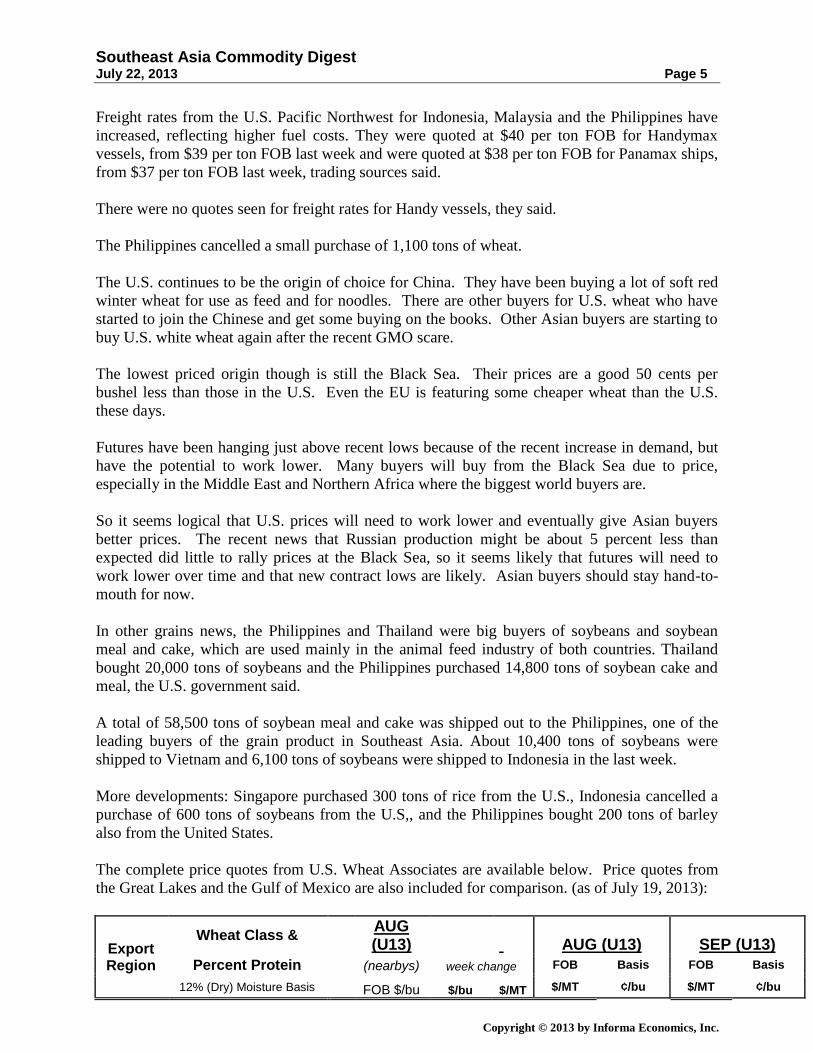
The complete price quotes from U.S. Wheat Associates are available below. Price quotes from
the Great Lakes and the Gulf of Mexico are also included for comparison. (as of July 19, 2013):
Export Region
Wheat Class &
AUG (U13) AUG (U13) SEP (U13)
Percent Protein
(nearbys) week change FOB Basis FOB Basis
12% (Dry) Moisture Basis FOB $/bu $/bu $/MT $/MT ¢/bu $/MT ¢/bu
Southeast Asia Commodity Digest July 22, 2013 Page 6
Copyright © 2013 by Informa Economics, Inc.
Great NS/DNS 13.0 (14.8) M 8.20 -0.61 -22 301 70 301 70
Lakes NS/DNS 13.5 (15.3) M 8.20 -0.61 -22 301 70 301 70
NS/DNS 14.0 (15.9) M 8.20 -0.61 -22 301 70 301 70
NS/DNS 13.0 (14.8) M 9.20 -0.61 -22 338 170 338 170
NS/DNS 13.5 (15.3) M 9.20 -0.61 -22 338 170 338 170
NS/DNS 14.0 (15.9) M 9.20 -0.61 -22 338 170 338 170
Gulf of HRW Ord K 8.50 -0.08 -3 312 145 312 145
Mexico HRW 11.0 (12.5) K 8.45 -0.07 -3 311 140 311 140
HRW 11.5 (13.1) K 8.50 -0.08 -3 312 145 312 145
HRW 12.0 (13.6) K 8.60 -0.07 -3 316 155 316 155
HRW 12.5 (14.2) K 8.75 -0.08 -3 322 170 322 170
SRW C 7.45 0.04 1 274 80 275 85
NS/DNS 13.0 (14.8) M 8.70 -0.56 -21 320 120 316 110
NS/DNS 13.5 (15.3) M 8.75 -0.56 -21 322 125 318 115
NS/DNS 14.0 (15.9) M 8.85 -0.46 -17 325 135 322 125
HRW Ord K 8.30 -0.38 -14 305 125 307 130
Pacific HRW 11.5 (13.1) K 8.35 -0.37 -14 307 130 309 135
N. West HRW 12.0 (13.6) K 8.45 -0.38 -14 311 140 312 145
HRW 13.0 (14.8) K 8.85 -0.37 -14 325 180 327 185
SW Unspecified $ 7.70 -0.10 -4 283 7.70 283 7.70
SW 10.5 (11.9) Max $ 7.70 -0.10 -4 283 7.70 283 7.70
SW 9.5 (10.8) Max $ 7.70 -0.10 -4 283 7.70 283 7.70
WW with 10% Club $ 7.75 -0.10 -4 285 7.75 285 7.75
WW with 20% Club $ 7.75 -0.10 -4 285 7.75 285 7.75
INDONESIA BUYS BEEF, TO IMPORT 3,000 HEAD OF CATTLE; MEAT TRADE WITH U.S. RAMPS UP By Rene Pastor
Indonesia has imported 3,000 tons of beef and will be importing 3,000 head of cattle soon to
alleviate a shortage as Jakarta rescinded a ban on meat imports from the United States to ensure
it will no longer face a shortfall in meat supplies.
Agriculture Minister Suswono told the Antara news agency that 3,000 metric tons of beef are to
arrive over the weekend, with traders saying they will come mostly from Australia.
Trade Minister Gita Wirjawan told the same agency “more than” 3,000 head of cattle will be
brought to boost livestock herds in the country of 200 million people.
All those steps are taking place within a month after Suswono signed a ministry order
eliminating the ban on meat imports from the United States imposed after the discovery of the
brain wasting mad cow disease in one of its cows.
World health authorities have certified the U.S. is now clear of any mad-cow contaminated
animal.
Indonesia’s meat supply is governed by a quota system administered by the government.

Southeast Asia Commodity Digest July 22, 2013 Page 7
Copyright © 2013 by Informa Economics, Inc.
Local analysts have blamed the escalating prices of beef in Indonesia to limited supplies of
frozen beef and feeder steer.
The United States is one of the biggest cattle exporters in the world. The others are Australia and
India.
PALM OIL STOCKS BURDENSOME, PRICES PINNED IN RANGE By Rene Pastor Palm oil stocks will remain at burdensome levels in 2013 although prices are seen near key
support levels and should trade in a sideways pattern for the rest of the year, industry analysts
said at a July 22 palm oil seminar. Yusof Barison, chief executive officer of the Malaysia Palm Oil Council, said in a paper that
surging output in No. 1 producer Indonesia will push up inventory levels for the country in 2013. He pegged palm oil production in Indonesia at 27.6 million metric tons, up 3 percent from 2012,
and ending stocks at 3.929 million tons, up from last year’s 3.9 million tons. Malaysia’s palm oil output in 2013 is forecast to rise to 19.04 million tons, from 18.785 million
last year, but ending stocks are seen easing to 1.978 million tons from 2.628 million. “Fundamentally, the seasonal bumper harvest in the third quarter of the year may put pressure on
… prices. The palm oil output is expected to be higher than the exports in the coming months
and this would then increase inventory levels again. Therefore, the technical analysis may be
supported by the fundamentals in the coming month,” Benny Lee, a long-time private trader and
technical analyst who writes for Palm Oil Fortune in the MPOC, said in a separate presentation.
Lee said prices of palm oil futures appear to “have bottomed out at 2,200 to 2,300” ringgit per
ton. “The cycle pattern analysis shows that (the) market is still due to trade sideways in the next
7-8 months with (a) trading range between 2,200 and 2,550 ringgit. Price(s) may climb towards
2,900 at the end of the year to early next year,” he said. For resistance, Lee said that based on Fibonacci analysis the major resistance for palm oil futures
going forward would be 2,900, 3,100 and then 3,300 ringgit per ton.
WEEKLY NATURAL RUBBER PRICES FALL ANEW TO YEAR LOW: REPORT By Rene Pastor
Natural rubber prices dropped to a year low as continued bumper supplies and soft offtake kept
prices weak.
The price of the benchmark STR 20 rubber from top rubber producer Thailand slid to its lowest
level for 2013 in the week ending July 13 at $2.1925/kg, data compiled by the Association of

Southeast Asia Commodity Digest July 22, 2013 Page 8
Copyright © 2013 by Informa Economics, Inc.
Natural Rubber Producing Countries showed. It hit a year peak of $3.1137/kg in the week ending
Jan. 19.
Thailand is the world’s biggest natural rubber producer, followed by Indonesia and Malaysia.
Natural rubber is used widely in the automobile industry and in other industrial applications. The
main competitor is synthetic rubber manufactured with the help of petroleum products.
Weekly natural rubber cash price quotes from the Association of Natural Rubber Producing
Countries are given below:
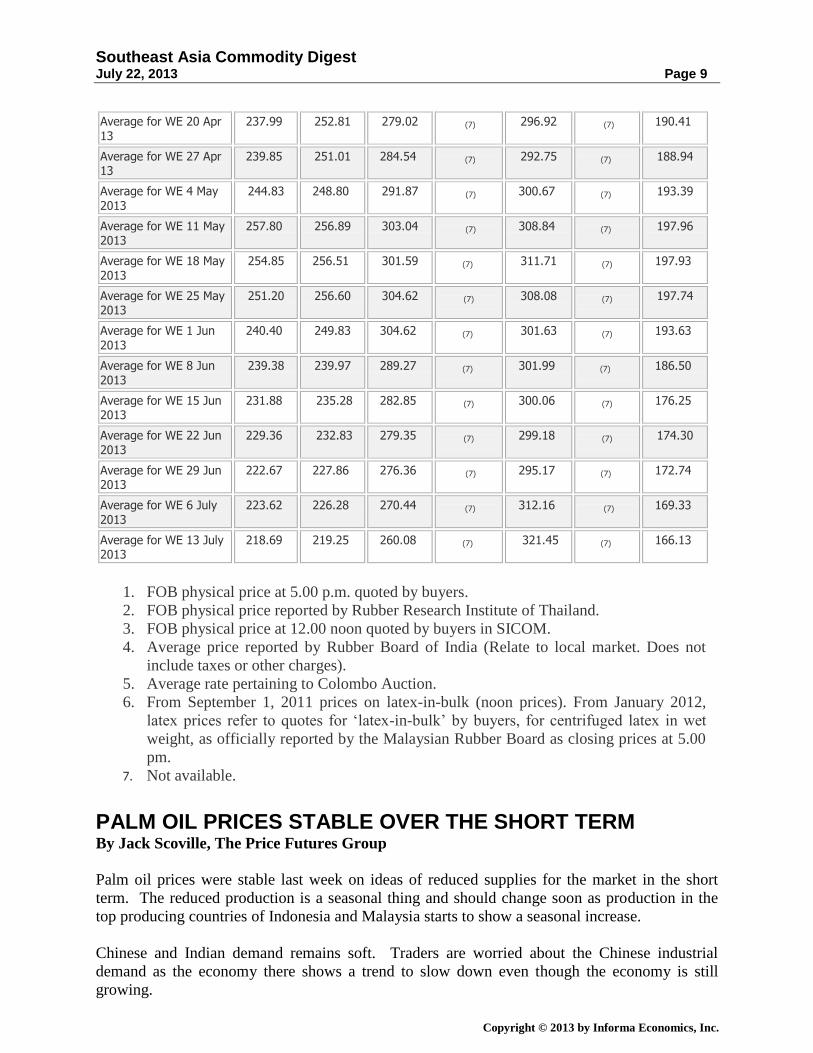
Weekly Average Prices of Natural Rubber (US dollar per 100 kg)
Day/Weekend (WE)
TSR RSS LATEX
Kuala Lumpur
SMR20 (1)
Bangkok STR20 (2)
Bangkok RSS3 (2)
Singapore RSS3 (3)
Kottayam (India)
RSS4 (4)
Colombo RSS1 (5)
Malaysia Latex 60%
(6)
Average for WE 5 Jan 13
302.81 306.66 332.24 (7) 297.74 (7) 201.76
Average for WE 12 Jan 13
304.50 309.75 336.73 (7) 297.01 (7) 206.17
Average for WE 19 Jan 13
303.03 311.37 336.87 (7) 296.83 (7)
208.10
Average for WE 26 Jan 13
303.31 308.53 331.24 (7) 297.47 (7)
205.21
Average for WE 2 Feb 13
305.82 302.48 325.76 (7) 294.39 (7)
201.37
Average for WE 9 Feb 13
310.71 309.97 332.84 (7) 295.24 (7)
241.91
Average for WE 16 Feb 13
309.75 307.50 328.79 (7) 291.06 (7)
211.44
Average for WE 23 Feb 13
298.96 302.72 316.62 (7) 289.23 (7)
201.27
Average for WE 2 Mar 13
290.62 293.72 299.60 (7) 290.34 (7)
200.02
Average for WE 9 Mar 13
287.12 289.71 300.73 (7) 291.27 (7)
200.31
Average for WE 16 Mar 13
278.17 284.38 299.16 (7) 299.03 (7)
200.70
Average for WE 23 Mar 13
273.70 278.09 293.62 (7) 302.92 (7)
198.58
Average for WE 30 Mar 13
274.55 276.71 295.34 (7) 309.16 (7)
200.09
Average for WE 6 Apr 13
261.29 266.71 285.10 (7)
303.58 (7) 196.43
Average for WE 13 Apr 13
257.50 266.83 285.68 (7) 302.37
(7) 195.89
Southeast Asia Commodity Digest July 22, 2013 Page 9
Copyright © 2013 by Informa Economics, Inc.
Average for WE 20 Apr 13
237.99 252.81 279.02 (7) 296.92
(7) 190.41
Average for WE 27 Apr 13
239.85 251.01 284.54 (7) 292.75 (7)
188.94
Average for WE 4 May 2013
244.83 248.80 291.87 (7)
300.67 (7) 193.39
Average for WE 11 May 2013
257.80 256.89 303.04 (7)
308.84 (7) 197.96
Average for WE 18 May 2013
254.85 256.51 301.59 (7) 311.71 (7)
197.93
Average for WE 25 May 2013
251.20 256.60 304.62 (7) 308.08 (7)
197.74
Average for WE 1 Jun
2013
240.40 249.83 304.62 (7) 301.63 (7)
193.63
Average for WE 8 Jun 2013
239.38 239.97 289.27 (7) 301.99 (7)
186.50
Average for WE 15 Jun 2013
231.88 235.28 282.85 (7) 300.06 (7)
176.25
Average for WE 22 Jun 2013
229.36 232.83 279.35 (7) 299.18 (7)
174.30
Average for WE 29 Jun 2013
222.67 227.86 276.36 (7)
295.17 (7) 172.74
Average for WE 6 July 2013
223.62 226.28 270.44 (7) 312.16
(7) 169.33
Average for WE 13 July 2013
218.69 219.25 260.08 (7) 321.45 (7)
166.13
1. FOB physical price at 5.00 p.m. quoted by buyers.
2. FOB physical price reported by Rubber Research Institute of Thailand.
3. FOB physical price at 12.00 noon quoted by buyers in SICOM.
4. Average price reported by Rubber Board of India (Relate to local market. Does not
include taxes or other charges).
5. Average rate pertaining to Colombo Auction.
6. From September 1, 2011 prices on latex-in-bulk (noon prices). From January 2012,
latex prices refer to quotes for ‘latex-in-bulk’ by buyers, for centrifuged latex in wet
weight, as officially reported by the Malaysian Rubber Board as closing prices at 5.00
pm.
7. Not available.
PALM OIL PRICES STABLE OVER THE SHORT TERM By Jack Scoville, The Price Futures Group
Palm oil prices were stable last week on ideas of reduced supplies for the market in the short
term. The reduced production is a seasonal thing and should change soon as production in the
top producing countries of Indonesia and Malaysia starts to show a seasonal increase.
Chinese and Indian demand remains soft. Traders are worried about the Chinese industrial
demand as the economy there shows a trend to slow down even though the economy is still
growing.
Southeast Asia Commodity Digest July 22, 2013 Page 10
Copyright © 2013 by Informa Economics, Inc.
India did a lot of buying a couple of months ago before the government increased import taxes.
Now, the rupee is sharply lower and that should hurt demand potential for the next few months.
Europe remains a question mark for palm oil given its shaky economy, and as the European
Parliament voted to ban the use of most row crops in biofuels due to market disruption and
elevated prices against questionable benefits to the environment.
We look for more downside to develop for palm oil prices over time and do not want to chase
rallies for buying. We would rather use the current price strength to ensure that sales levels are
good.
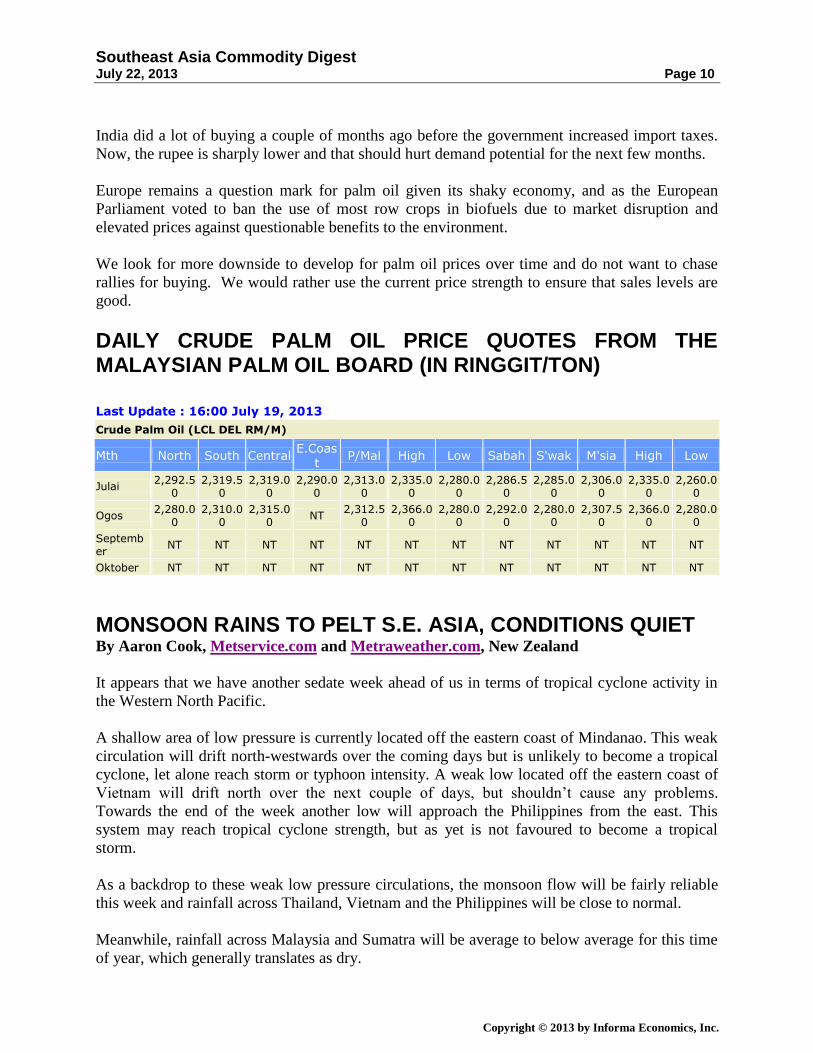
DAILY CRUDE PALM OIL PRICE QUOTES FROM THE MALAYSIAN PALM OIL BOARD (IN RINGGIT/TON) Last Update : 16:00 July 19, 2013
Crude Palm Oil (LCL DEL RM/M)
Mth North South Central E.Coas
t P/Mal High Low Sabah S'wak M'sia High Low
Julai 2,292.5
0 2,319.5
0 2,319.0
0 2,290.0
0 2,313.0
0 2,335.0
0 2,280.0
0 2,286.5
0 2,285.0
0 2,306.0
0 2,335.0
0 2,260.0
0
Ogos 2,280.0
0 2,310.0
0 2,315.0
0 NT
2,312.50
2,366.00
2,280.00
2,292.00
2,280.00
2,307.50
2,366.00
2,280.00
September
NT NT NT NT NT NT NT NT NT NT NT NT
Oktober NT NT NT NT NT NT NT NT NT NT NT NT
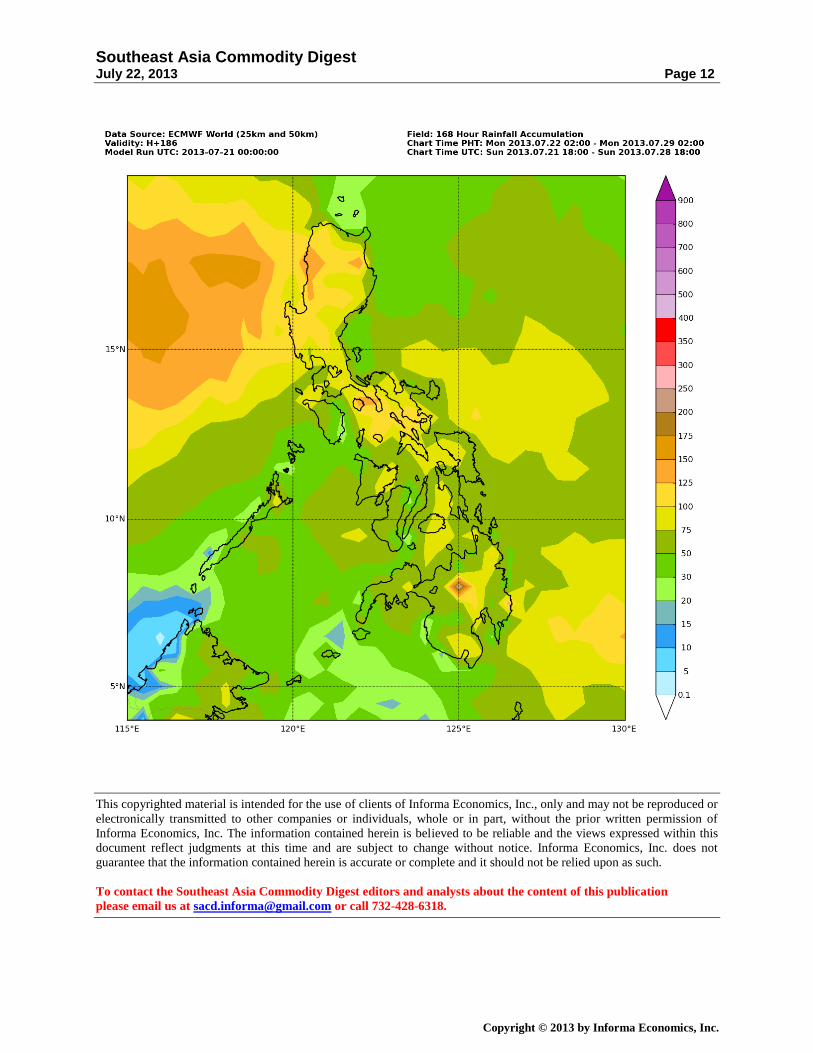
MONSOON RAINS TO PELT S.E. ASIA, CONDITIONS QUIET By Aaron Cook, Metservice.com and Metraweather.com, New Zealand
It appears that we have another sedate week ahead of us in terms of tropical cyclone activity in
the Western North Pacific.
A shallow area of low pressure is currently located off the eastern coast of Mindanao. This weak
circulation will drift north-westwards over the coming days but is unlikely to become a tropical
cyclone, let alone reach storm or typhoon intensity. A weak low located off the eastern coast of
Vietnam will drift north over the next couple of days, but shouldn’t cause any problems.
Towards the end of the week another low will approach the Philippines from the east. This
system may reach tropical cyclone strength, but as yet is not favoured to become a tropical
storm.
As a backdrop to these weak low pressure circulations, the monsoon flow will be fairly reliable
this week and rainfall across Thailand, Vietnam and the Philippines will be close to normal.
Meanwhile, rainfall across Malaysia and Sumatra will be average to below average for this time
of year, which generally translates as dry.
Southeast Asia Commodity Digest July 22, 2013 Page 11
Copyright © 2013 by Informa Economics, Inc.
This return to drier conditions is causing dozens of fires to flare up again about Riau on Sumatra.
Specialised satellite imagery is showing several large plumes of smoke drifting in an eastwards
direction towards the coast, with the haze then turning towards the north as it reaches the Strait
of Malacca.
The weekend just gone saw air quality readings decline along the west coast of western
Malaysia. They remain at unhealthy levels in parts of Malacca State and Selangor State. With
the prevailing wind direction predicted to remain a mix of southerly and south-easterly over the
much of the next week there is a good chance that the wider region, including Kuala Lumpur,
will continue to be affected, but it is possible Singapore will escape the worst effects for the time
being. More frequent showers on the weekend will hopefully help to dampen down the fires
again.
Southeast Asia Commodity Digest July 22, 2013 Page 12
Copyright © 2013 by Informa Economics, Inc.
This copyrighted material is intended for the use of clients of Informa Economics, Inc., only and may not be reproduced or
electronically transmitted to other companies or individuals, whole or in part, without the prior written permission of
Informa Economics, Inc. The information contained herein is believed to be reliable and the views expressed within this
document reflect judgments at this time and are subject to change without notice. Informa Economics, Inc. does not
guarantee that the information contained herein is accurate or complete and it should not be relied upon as such.
To contact the Southeast Asia Commodity Digest editors and analysts about the content of this publication
please email us at [email protected] or call 732-428-6318.