Embed Size (px)
Citation preview
“Alleged Collusion” Effects in Power Supply Shortage in the Philippines
Miah Maye M. Pormon1 University of the Philippines-Visayas Tacloban College
ABSTRACT
As the Philippines engage in industrialization, it also contracted construction of different power generators to have a reliable source of electricity to ensure competitiveness. With the increasing number of power generators, what will be the potential economic impact of a collusion among them in the country? This paper aims to provide a theoretical and numerical analysis of the alleged collusions that might cause electricity shortages and a fall in the consumer welfare. By using an undistorted market as the benchmark case, this research focuses on the welfare analysis of alleged collusion and its impact on power generation. The study investigates and focuses in November to December 2013. Results show that the occurrence of these alleged collusion caused an increase in the generation prices and made a big impact on the Philippine economy. This study recommends that the government implement effective policies and adjustment strategies to deal with problem of power shortages in the short run. Moreover, to imposed proper regulations and provide a competitive environment for generators in the power industry. Furthermore, Moreover, the government should also focus on improving the utilization rate of installed power plants and maintaining the operations of those aging ones. It is recommended that further studies be done on electricity pricing and other areas of the electricity industry. The study also provides a framework for future extensions.
JEL Codes Q41; Q48; D6
Keywords: Electricity Shortage, Electricity Generation, Collusion, Welfare
1 Assistant Professor in Economics, Division of Social Science , UP Visayas-Tacloban College. Email address: [email protected],
2
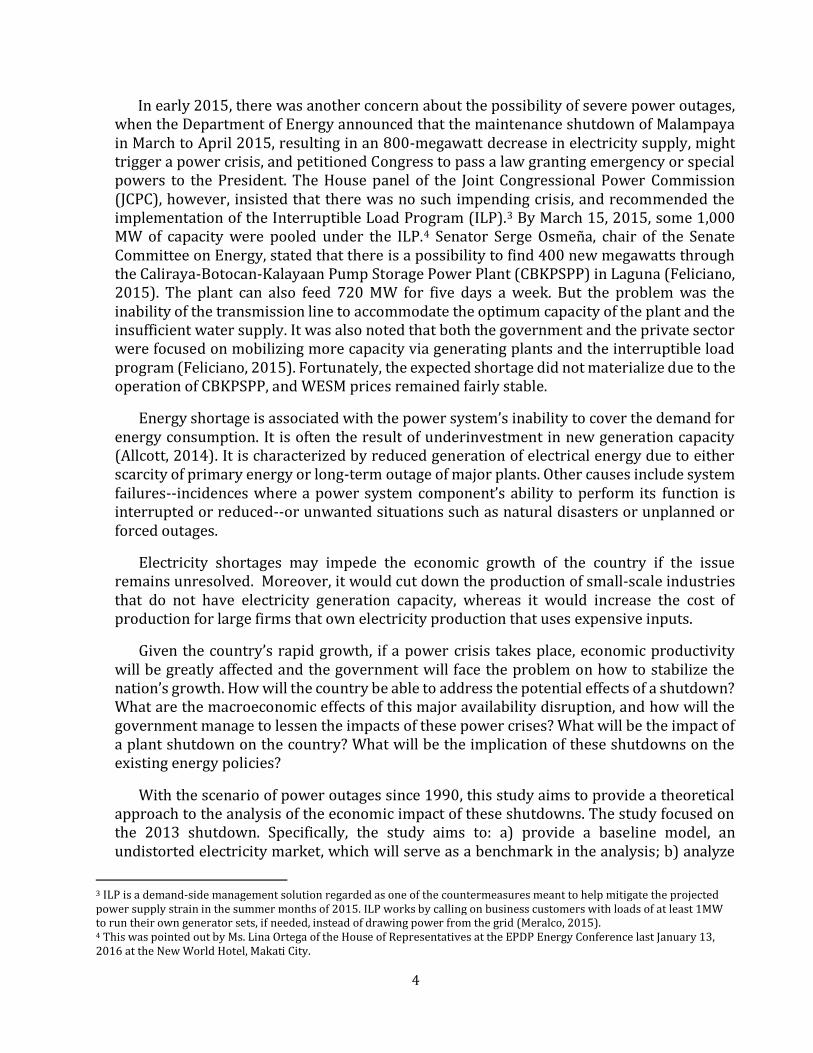
1. Introduction
A reliable source of electricity is needed to ensure competitiveness of economies, noting that energy security is major component of modern economies. However, achieving energy security is a challenge and poses a great opportunity for private sectors to gain from this situation.
In the 1960s, the Philippines was among the first in Southeast Asia to engage in industrialization. However, the economy experienced a decline in the early 1980s that accelerated during the regime of President Ferdinand Marcos, resulting in stagnation. The country was also a pioneer in the development of commercial nuclear power with the Westinghouse Electric Corporation-built Bataan Nuclear Power Plant (BNPP) ready for core loading as early as 1985. But controversies associated with its construction arose, and coupled with hostile anti-nuclear sentiment in the aftermath of the Chernobyl accident in 1986, the power plant never commenced operations (Zha, 2013).
Due to non-operation of BNPP, the government faced simultaneous problems: an energy shortage of catastrophic proportions and an insolvent Ministry of Energy that had spent billions of dollars. These simultaneous problems resulted in power system failures in the early 1990s that led to power outages. Such failures and outages were ¬also coupled by rapid growth in demand for electricity in the late 1980s and the lack of generating capacity of the country's power plants.
The Cory Aquino administration drew up a Medium-term Energy Plan (1988-92) that called for the production of additional power plants. It lead to the entry of private players into the power industry, stipulated in 1989, allowed independent power producers (IPPs) to supply energy at prices equal to or below the NAPOCOR rates (Austria, 1999; Fabella, 2002; and Aldaba, 2008). In 1990, the government passed Republic Act No. 6957 (RA 6957), or the Build-Operate-Transfer (BOT) Law, to set rules on the entry of private firms; the law reduced the scope of government intervention.
However, despite the Aquino administration’s policy reforms and privatization efforts, only one contract for three 70-MW gas turbine power plants was signed. Based on the Department of Energy list of existing plants, there were a total of ten power plants commissioned in Luzon area from years 1981 to 1993 . One of these power plant facilities, Hedcor--owned by the Hydro Electric Development Corporation--was under the contract Build-Operate-Own Electric Power Supply Agreement (EPSA) in 1993.
Thus, the generation capacity failed to satisfy the increasing electricity demands. This affected Manila and the surrounding provinces, hampering industrial production and decreasing investor confidence in the country (Woodhouse, 2005).
Over the period from 1989 to 1993, the nation experienced 8 to 12-hour blackouts and power was rationed (Alonzo, et al., 2016). The country’s power crisis heightened in 1993, causing 103 days of blackouts that severely crippled the economy--productivity fell and unemployment increased (World Bank, 2003, cited in Cham, 2007). The World Bank estimated that the Philippines lost US$600-800 million per year, equivalent to 1.5% of GDP

3
(Austria, 1999). The electricity shortage was estimated to amount to 3,077 gigawatt hours, of which 78% was attributed to the Luzon grid. There was a 6% drop in GDP from 1989 to 1991.
Early in the term of President Fidel Ramos, the Philippine Congress passed, in April 1993, Republic Act 7648: “An Act Prescribing Urgent Related Measures Necessary and Proper to Effectively Address the Electric Power Crisis and for Other Purposes.” The law resurrected the Department of Energy, which would be responsible for policy formulation, planning, and management of the energy sector (Alonzo, et al., 2016). RA 7648 was legislated to expedite independent power producers’ (IPP) contracts for construction, rehabilitation, improvement, and maintenance of power projects (Aldaba, 2008).
To accommodate the growing variants of build-operate-transfer schemes, the BOT law was amended in 1994, thereby creating generous incentives in the power purchase contracts. The increase in power purchase agreements (PPA) mediated power generation capacity effectively, and thus, the power crisis ended by 1995 (Fabella, 2002). Then, RA 9136 or the Electric Power Industry Reform Act (EPIRA) was passed in 2001. This wave of deregulation was a major policy reform which aimed to accelerate the total electrification of the country. This was followed by the passing of the Energy Reform Agenda by the Benigno Aquino III Government in 2010, with the following objectives: a) to ensure energy security through development of indigenous energy or renewable energy sources; b) to achieve optimal energy pricing in electricity and oil; and c) to develop a sustainable energy system through the formation and update of national plans and programs on energy development. Through EPIRA, privatization was allowed into the generation, distribution, and retail sectors.
However, even with this existing set of policy initiatives, the country still experiences threats of power outages due to unscheduled or forced power plant shutdowns or transmission line problems—consequently, greatly affecting the performance of the Philippine economy. In Mindanao, in fact, actual power outages occur in 2010 and 2012, leading some distribution utilities to implement rotational blackouts in their service areas.
In the Luzon-Visayas grid, a recent example of the continuing power supply insecurities was the so-called Malampaya shutdown in November to December 2013. The Malampaya natural gas facility provides fuel to three power plants in Batangas that have a combined dependable capacity2 of 2,800 MW. Its scheduled regular maintenance in 2013 was moved due to Typhoon Yolanda. Unfortunately, the shutdown coincided with the planned and forced outages of 10 other power plants in the same period. This caused the price in the wholesale electricity spot market (WESM) to shoot up from an average of P13.74/kwh in October to P33.22/kwh in November and P36.09/kwh in December 2013. In this latter case, the Energy Regulatory Commission (ERC) noted that “there was widespread withholding of capacity through the non-observance or breach of the ‘Must Offer Rule’ (MOR) under the WESM Rules,” and thus “ordered the imposition of regulated prices” in lieu of the WESM prices (Energy Regulatory Commission, 2014).
2 Dependable capacity is the load-carrying ability of a station or system under adverse conditions for a specified period of time (Energy Information Administration, 2016)
4
In early 2015, there was another concern about the possibility of severe power outages, when the Department of Energy announced that the maintenance shutdown of Malampaya in March to April 2015, resulting in an 800-megawatt decrease in electricity supply, might trigger a power crisis, and petitioned Congress to pass a law granting emergency or special powers to the President. The House panel of the Joint Congressional Power Commission (JCPC), however, insisted that there was no such impending crisis, and recommended the implementation of the Interruptible Load Program (ILP).3 By March 15, 2015, some 1,000 MW of capacity were pooled under the ILP.4 Senator Serge Osmeña, chair of the Senate Committee on Energy, stated that there is a possibility to find 400 new megawatts through the Caliraya-Botocan-Kalayaan Pump Storage Power Plant (CBKPSPP) in Laguna (Feliciano, 2015). The plant can also feed 720 MW for five days a week. But the problem was the inability of the transmission line to accommodate the optimum capacity of the plant and the insufficient water supply. It was also noted that both the government and the private sector were focused on mobilizing more capacity via generating plants and the interruptible load program (Feliciano, 2015). Fortunately, the expected shortage did not materialize due to the operation of CBKPSPP, and WESM prices remained fairly stable.
Energy shortage is associated with the power system’s inability to cover the demand for energy consumption. It is often the result of underinvestment in new generation capacity (Allcott, 2014). It is characterized by reduced generation of electrical energy due to either scarcity of primary energy or long-term outage of major plants. Other causes include system failures--incidences where a power system component’s ability to perform its function is interrupted or reduced--or unwanted situations such as natural disasters or unplanned or forced outages.
Electricity shortages may impede the economic growth of the country if the issue remains unresolved. Moreover, it would cut down the production of small-scale industries that do not have electricity generation capacity, whereas it would increase the cost of production for large firms that own electricity production that uses expensive inputs.
Given the country’s rapid growth, if a power crisis takes place, economic productivity will be greatly affected and the government will face the problem on how to stabilize the nation’s growth. How will the country be able to address the potential effects of a shutdown? What are the macroeconomic effects of this major availability disruption, and how will the government manage to lessen the impacts of these power crises? What will be the impact of a plant shutdown on the country? What will be the implication of these shutdowns on the existing energy policies?
With the scenario of power outages since 1990, this study aims to provide a theoretical approach to the analysis of the economic impact of these shutdowns. The study focused on the 2013 shutdown. Specifically, the study aims to: a) provide a baseline model, an undistorted electricity market, which will serve as a benchmark in the analysis; b) analyze
3 ILP is a demand-side management solution regarded as one of the countermeasures meant to help mitigate the projected power supply strain in the summer months of 2015. ILP works by calling on business customers with loads of at least 1MW to run their own generator sets, if needed, instead of drawing power from the grid (Meralco, 2015). 4 This was pointed out by Ms. Lina Ortega of the House of Representatives at the EPDP Energy Conference last January 13, 2016 at the New World Hotel, Makati City.
5
the welfare effects of plant shutdown on the economy; and c) analyze the implications of the occurrence of these shutdowns and revisions to be done on the existing policies in the Philippine Energy Sector.
2. Conceptual Framework
The theoretical model is meant to characterize the welfare consequences of the shortage in
electricity by estimating the total economic loss and providing theoretical predictions that could motivate the numerical analysis.
2.1. Base Case (Undistorted Market)
In a perfectly competitive market, supply and demand determine the price and quantity sold for goods and services. With the continuous interaction between suppliers and consumers, a unique equilibrium price for the commodity is established. Consumers and producers act competitively and by law of supply and demand, quantity demanded increases as price decreases and quantity supplied increases as price increases.
Assumptions in this model include the following:
(1) Electricity market equilibrium, where the sum of consumers’ and producers’ surplus is maximized, and;
(2) Based on relative prices, substitution could occur among alternative resources.
Let 𝑅 be the resources (e.g., coal, hydro, oil, geothermal, biomass, wind, and solar) available for use in the electricity sector. This would be denoted by 𝑟 = 1, . . . , 𝑅. Let 𝐽 be the energy demand sector, which for this study, will focus on the uses of electricity (e.g. for household use, industrial, commercial, etc.). This would be denoted by 𝑗 = 1, . . . , 𝐽.
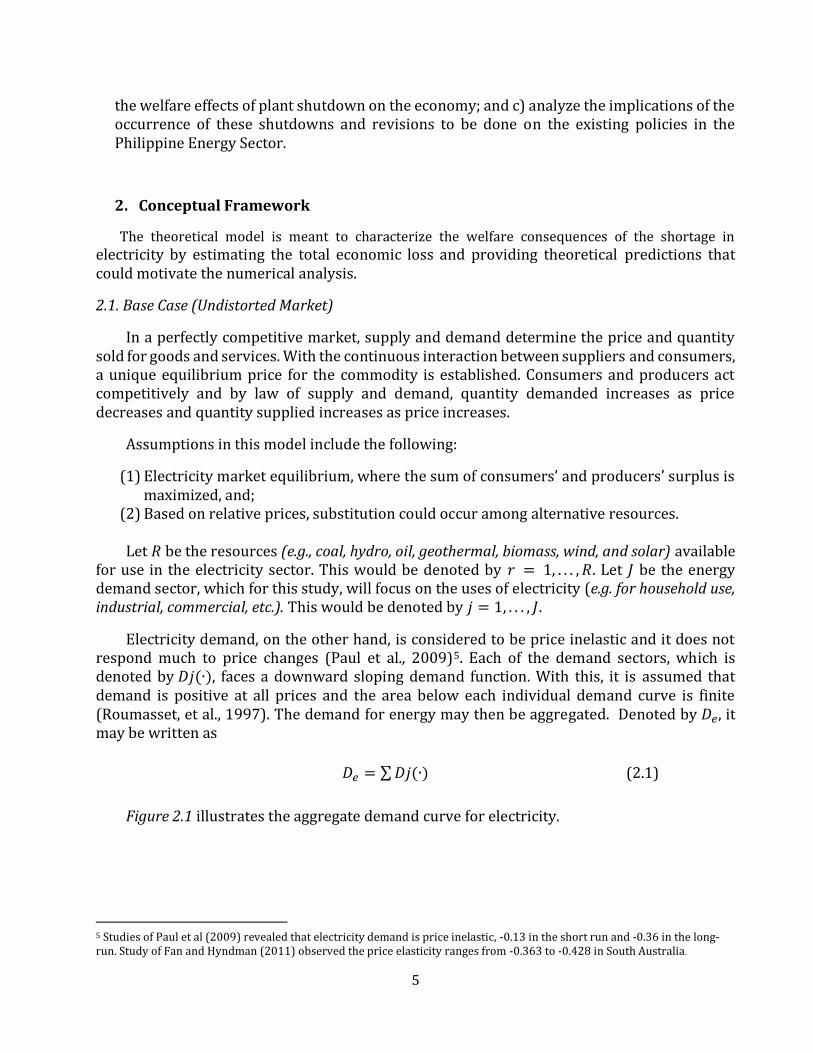
Electricity demand, on the other hand, is considered to be price inelastic and it does not respond much to price changes (Paul et al., 2009)5. Each of the demand sectors, which is denoted by 𝐷𝑗(∙), faces a downward sloping demand function. With this, it is assumed that demand is positive at all prices and the area below each individual demand curve is finite (Roumasset, et al., 1997). The demand for energy may then be aggregated. Denoted by 𝐷𝑒, it may be written as
𝐷𝑒 = ∑ 𝐷𝑗(∙) (2.1)
Figure 2.1 illustrates the aggregate demand curve for electricity.
5 Studies of Paul et al (2009) revealed that electricity demand is price inelastic, -0.13 in the short run and -0.36 in the long-run. Study of Fan and Hyndman (2011) observed the price elasticity ranges from -0.363 to -0.428 in South Australia.
6
Figure 2.1. Aggregate Demand Curve for Electricity
The supply schedule, on the other hand, shows the marginal cost of generating electricity from a variety of technologies. In a typical power system, these technologies may include generators fueled by various energy resources, R, (Griffin and Puller, 2009). One way to illustrate the supply curve is using the merit-order.
Merit-order is when all available sources of electrical generation are ranked by their short-
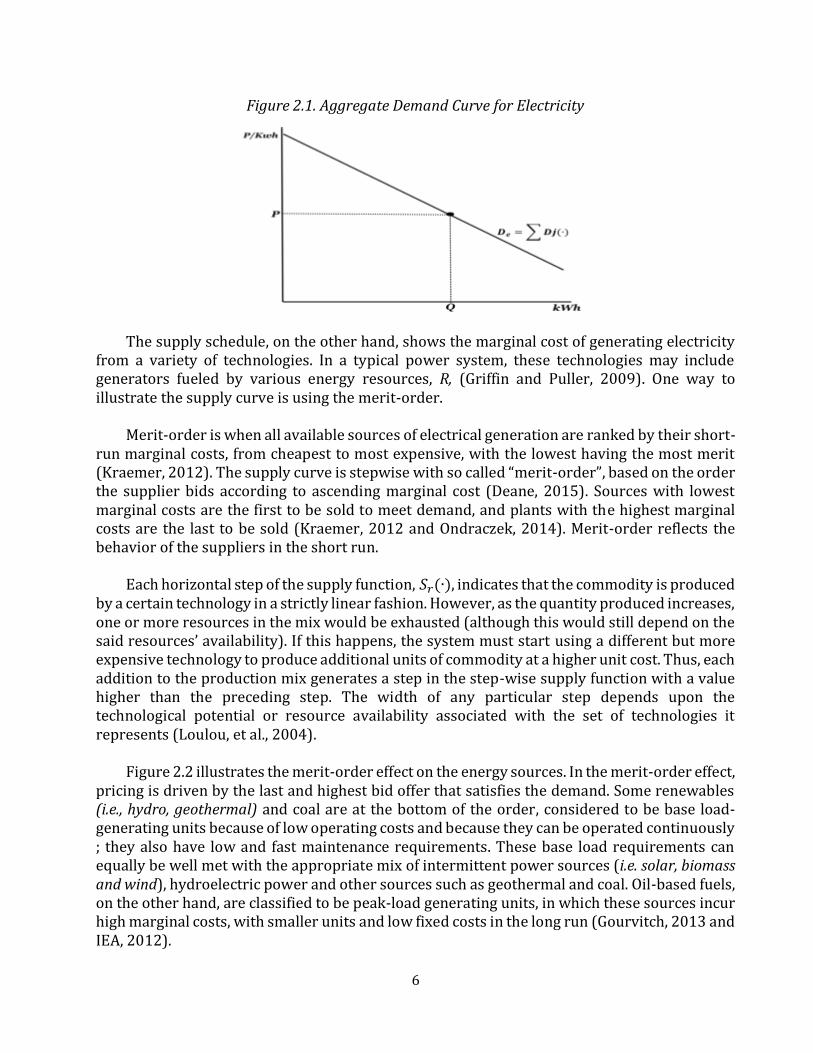
run marginal costs, from cheapest to most expensive, with the lowest having the most merit (Kraemer, 2012). The supply curve is stepwise with so called “merit-order”, based on the order the supplier bids according to ascending marginal cost (Deane, 2015). Sources with lowest marginal costs are the first to be sold to meet demand, and plants with the highest marginal costs are the last to be sold (Kraemer, 2012 and Ondraczek, 2014). Merit-order reflects the behavior of the suppliers in the short run.
Each horizontal step of the supply function, 𝑆𝑟(∙), indicates that the commodity is produced
by a certain technology in a strictly linear fashion. However, as the quantity produced increases, one or more resources in the mix would be exhausted (although this would still depend on the said resources’ availability). If this happens, the system must start using a different but more expensive technology to produce additional units of commodity at a higher unit cost. Thus, each addition to the production mix generates a step in the step-wise supply function with a value higher than the preceding step. The width of any particular step depends upon the technological potential or resource availability associated with the set of technologies it represents (Loulou, et al., 2004).
Figure 2.2 illustrates the merit-order effect on the energy sources. In the merit-order effect,
pricing is driven by the last and highest bid offer that satisfies the demand. Some renewables (i.e., hydro, geothermal) and coal are at the bottom of the order, considered to be base load-generating units because of low operating costs and because they can be operated continuously ; they also have low and fast maintenance requirements. These base load requirements can equally be well met with the appropriate mix of intermittent power sources (i.e. solar, biomass and wind), hydroelectric power and other sources such as geothermal and coal. Oil-based fuels, on the other hand, are classified to be peak-load generating units, in which these sources incur high marginal costs, with smaller units and low fixed costs in the long run (Gourvitch, 2013 and IEA, 2012).
7
Figure 2.2 shows the merit-order electricity market supply curve, denoted by the supply function 𝑆𝑟(∙).
Figure 2.2 Supply Curve for Electricity
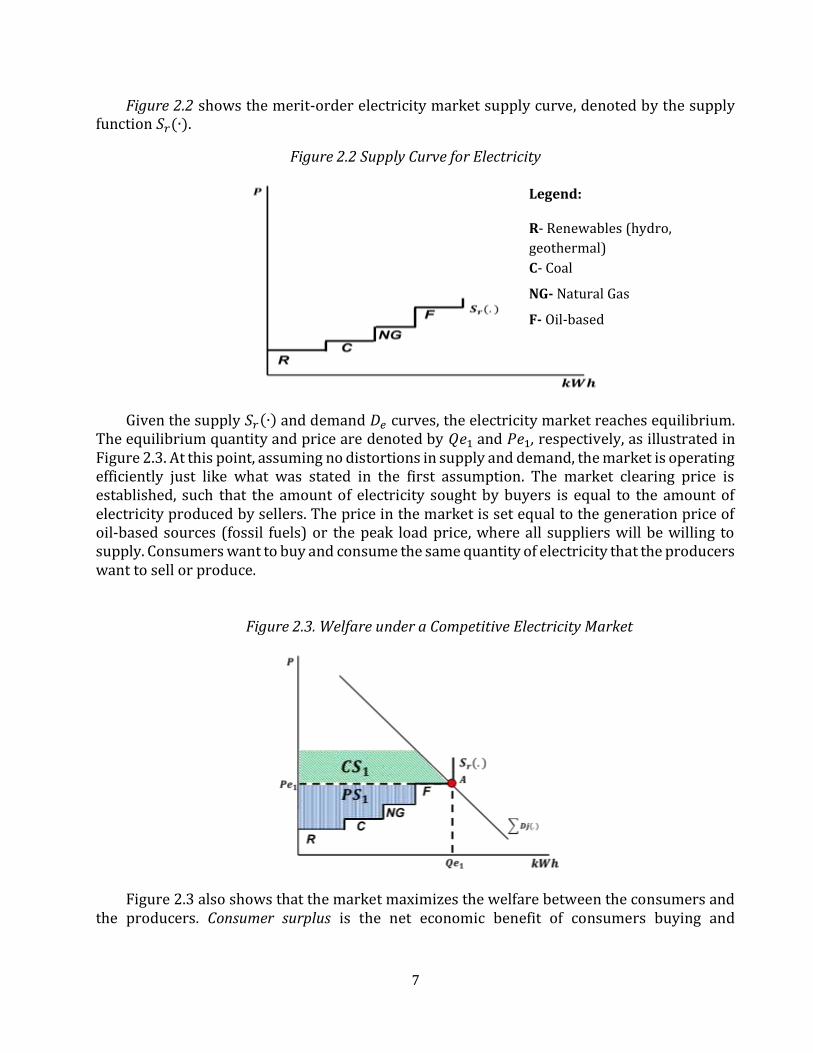
Given the supply 𝑆𝑟(∙) and demand 𝐷𝑒 curves, the electricity market reaches equilibrium. The equilibrium quantity and price are denoted by 𝑄𝑒1 and 𝑃𝑒1, respectively, as illustrated in Figure 2.3. At this point, assuming no distortions in supply and demand, the market is operating efficiently just like what was stated in the first assumption. The market clearing price is established, such that the amount of electricity sought by buyers is equal to the amount of electricity produced by sellers. The price in the market is set equal to the generation price of oil-based sources (fossil fuels) or the peak load price, where all suppliers will be willing to supply. Consumers want to buy and consume the same quantity of electricity that the producers want to sell or produce.
Figure 2.3. Welfare under a Competitive Electricity Market
Figure 2.3 also shows that the market maximizes the welfare between the consumers and the producers. Consumer surplus is the net economic benefit of consumers buying and
Legend: R- Renewables (hydro,
geothermal)
C- Coal
NG- Natural Gas
F- Oil-based
8
consuming the equilibrium quantity, 𝑄𝑒1 kWh of electricity. It is measured by the area under the demand curve and above the equilibrium price 𝑃𝑒1-- green shaded area labeled 𝐶𝑆1
Consumer and producer surplus were computed, as the green and blue shaded area, respectively. Consumer surplus is the net economic benefit of consumers buying and consuming the equilibrium quantity , 𝑄𝑒1 kWh of electricity. In the short run, producer surplus is the net economic benefit of producers selling and producing 𝑄𝑒1 kWh of electricity, which is also equal to Total Revenue minus Total Variable Costs.
Figure 2.3 also depicts a static case. It serves as the base case for comparing the presence of shortage.
2.2. Shortage
If the market is perfect, resources would be allocated optimally according to the collective tastes and preferences of consumers, the quantity of financial resources available to them, the prices of other goods and services, amount and existing alternative resources available, and the prices. A shortage may exist if the electricity generation is not sufficient to meet the electricity requirements of its consumers at a given price. The supply curve for electricity used in this study is adjustable to accommodate specific technologies.
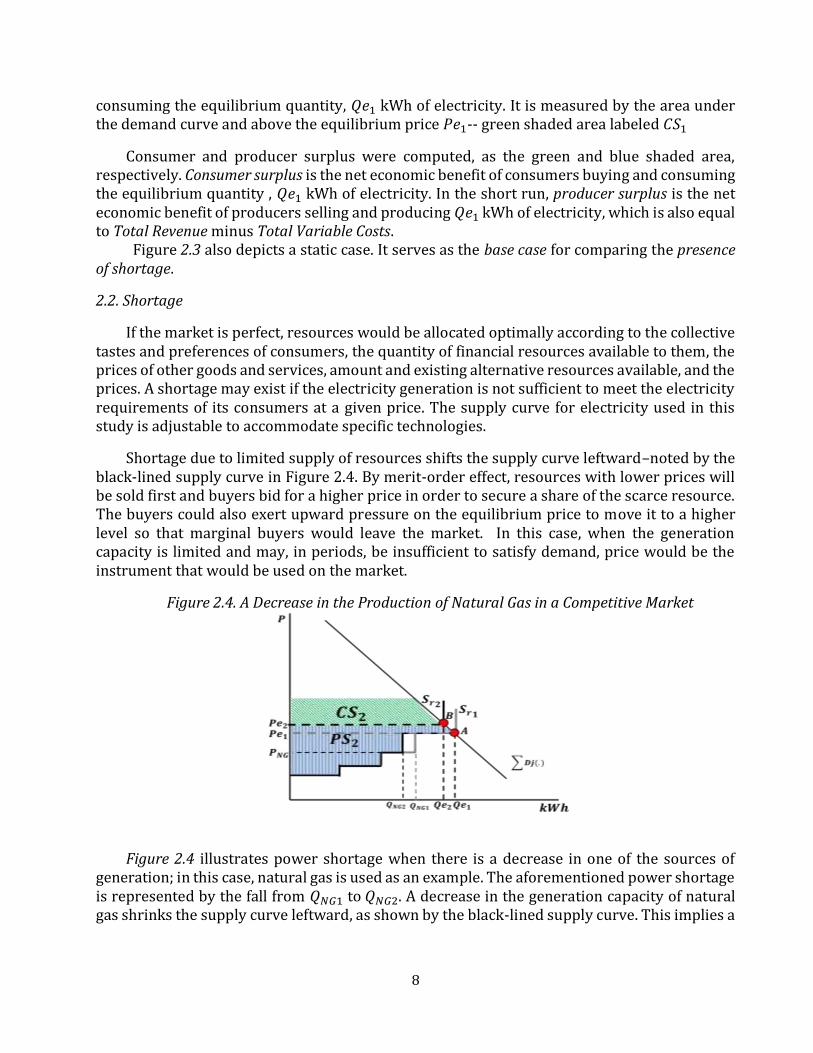
Shortage due to limited supply of resources shifts the supply curve leftward–noted by the black-lined supply curve in Figure 2.4. By merit-order effect, resources with lower prices will be sold first and buyers bid for a higher price in order to secure a share of the scarce resource. The buyers could also exert upward pressure on the equilibrium price to move it to a higher level so that marginal buyers would leave the market. In this case, when the generation capacity is limited and may, in periods, be insufficient to satisfy demand, price would be the instrument that would be used on the market.
Figure 2.4. A Decrease in the Production of Natural Gas in a Competitive Market
Figure 2.4 illustrates power shortage when there is a decrease in one of the sources of
generation; in this case, natural gas is used as an example. The aforementioned power shortage is represented by the fall from 𝑄𝑁𝐺1 to 𝑄𝑁𝐺2. A decrease in the generation capacity of natural gas shrinks the supply curve leftward, as shown by the black-lined supply curve. This implies a
9
fall in the production and increase in price to offset the costs of a shutdown and to retain equilibrium.
An unscheduled maintenance shutdown in the natural gas plant would cause a decline of generation capacity from the said technology, causing the shrinkage of the natural gas supply curve, increasing the electricity price (𝑃𝑒1 to 𝑃𝑒2) as supply curve of natural gas falls (from 𝑄𝑁𝐺1to 𝑄𝑁𝐺2). The fall in natural gas production causes the equilibrium price to rise to 𝑃𝑒2, while the supply of other resources remains constant.
Analyzing these cases, in this paper, two scenarios were drawn to examine the decrease in generation due to power plant shutdowns.
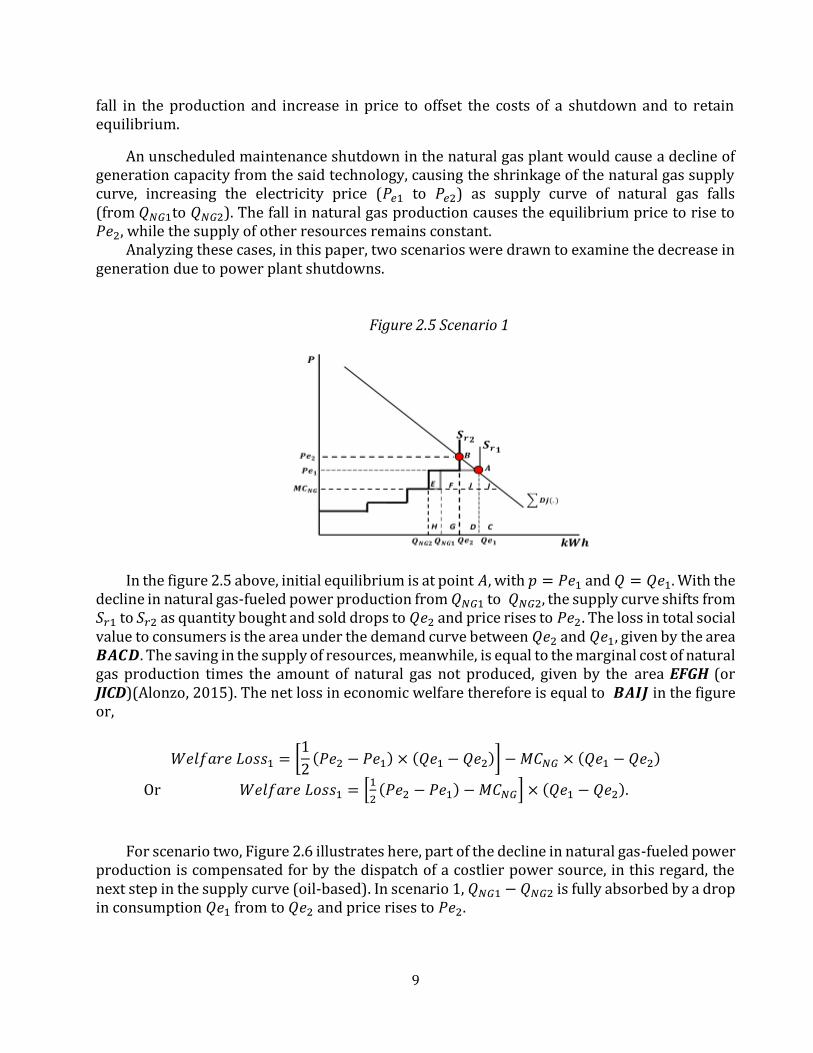
Figure 2.5 Scenario 1
In the figure 2.5 above, initial equilibrium is at point 𝐴, with 𝑝 = 𝑃𝑒1 and 𝑄 = 𝑄𝑒1. With the decline in natural gas-fueled power production from 𝑄𝑁𝐺1 to 𝑄𝑁𝐺2, the supply curve shifts from 𝑆𝑟1 to 𝑆𝑟2 as quantity bought and sold drops to 𝑄𝑒2 and price rises to 𝑃𝑒2. The loss in total social value to consumers is the area under the demand curve between 𝑄𝑒2 and 𝑄𝑒1, given by the area 𝑩𝑨𝑪𝑫. The saving in the supply of resources, meanwhile, is equal to the marginal cost of natural gas production times the amount of natural gas not produced, given by the area EFGH (or JICD)(Alonzo, 2015). The net loss in economic welfare therefore is equal to 𝑩𝑨𝑰𝑱 in the figure or,
𝑊𝑒𝑙𝑓𝑎𝑟𝑒 𝐿𝑜𝑠𝑠1 = [1
2(𝑃𝑒2 − 𝑃𝑒1) × (𝑄𝑒1 − 𝑄𝑒2)] − 𝑀𝐶𝑁𝐺 × (𝑄𝑒1 − 𝑄𝑒2)
Or 𝑊𝑒𝑙𝑓𝑎𝑟𝑒 𝐿𝑜𝑠𝑠1 = [1
2(𝑃𝑒2 − 𝑃𝑒1) − 𝑀𝐶𝑁𝐺] × (𝑄𝑒1 − 𝑄𝑒2).
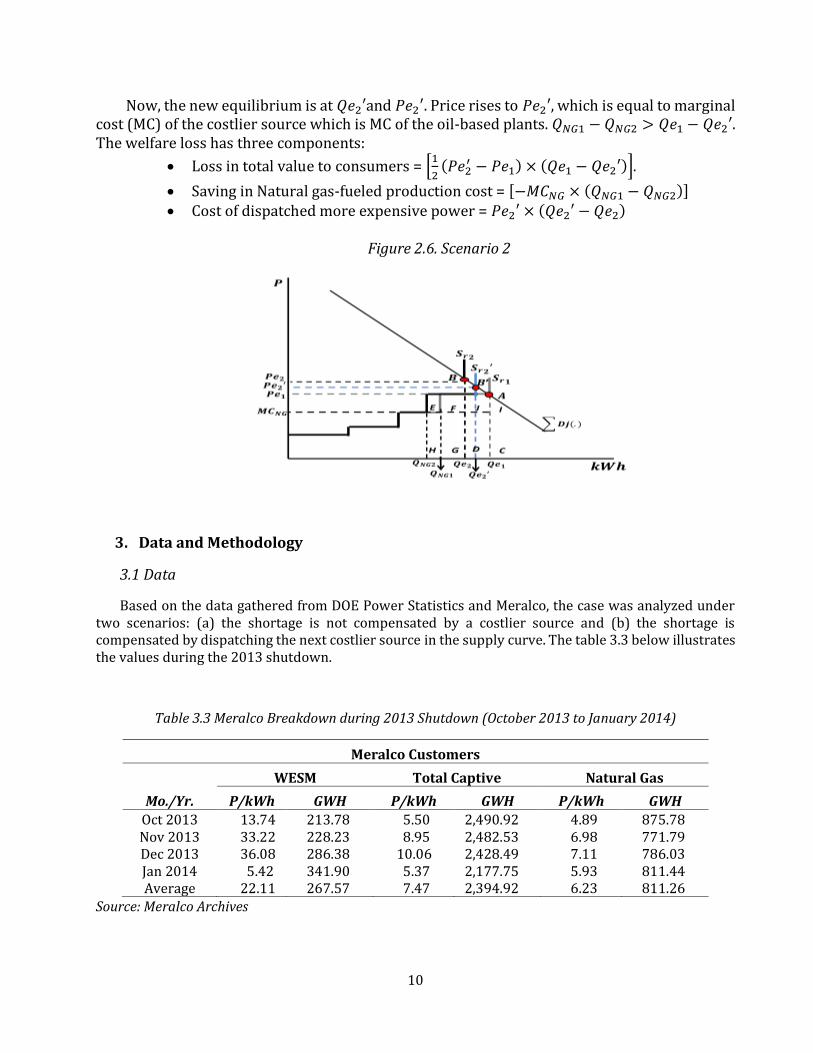
For scenario two, Figure 2.6 illustrates here, part of the decline in natural gas-fueled power production is compensated for by the dispatch of a costlier power source, in this regard, the next step in the supply curve (oil-based). In scenario 1, 𝑄𝑁𝐺1 − 𝑄𝑁𝐺2 is fully absorbed by a drop in consumption 𝑄𝑒1 from to 𝑄𝑒2 and price rises to 𝑃𝑒2.
10
Now, the new equilibrium is at 𝑄𝑒2′and 𝑃𝑒2′. Price rises to 𝑃𝑒2′, which is equal to marginal cost (MC) of the costlier source which is MC of the oil-based plants. 𝑄𝑁𝐺1 − 𝑄𝑁𝐺2 > 𝑄𝑒1 − 𝑄𝑒2′. The welfare loss has three components:
Loss in total value to consumers = [1
2(𝑃𝑒2
′ − 𝑃𝑒1) × (𝑄𝑒1 − 𝑄𝑒2′)].
Saving in Natural gas-fueled production cost = [−𝑀𝐶𝑁𝐺 × (𝑄𝑁𝐺1 − 𝑄𝑁𝐺2)] Cost of dispatched more expensive power = 𝑃𝑒2′ × (𝑄𝑒2′ − 𝑄𝑒2)
Figure 2.6. Scenario 2
3. Data and Methodology
3.1 Data
Based on the data gathered from DOE Power Statistics and Meralco, the case was analyzed under two scenarios: (a) the shortage is not compensated by a costlier source and (b) the shortage is compensated by dispatching the next costlier source in the supply curve. The table 3.3 below illustrates the values during the 2013 shutdown.
Table 3.3 Meralco Breakdown during 2013 Shutdown (October 2013 to January 2014)
Meralco Customers
WESM Total Captive Natural Gas
Mo./Yr. P/kWh GWH P/kWh GWH P/kWh GWH
Oct 2013 13.74 213.78 5.50 2,490.92 4.89 875.78 Nov 2013 33.22 228.23 8.95 2,482.53 6.98 771.79 Dec 2013 36.08 286.38 10.06 2,428.49 7.11 786.03 Jan 2014 5.42 341.90 5.37 2,177.75 5.93 811.44 Average 22.11 267.57 7.47 2,394.92 6.23 811.26
Source: Meralco Archives
11
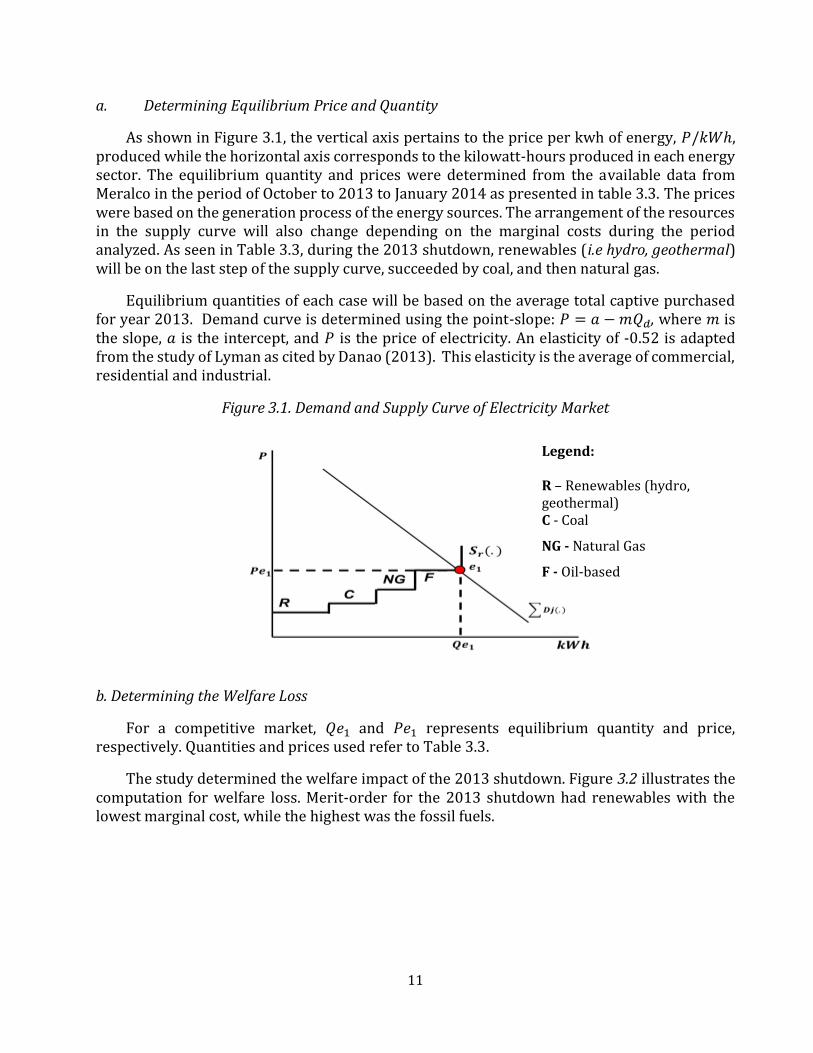
a. Determining Equilibrium Price and Quantity
As shown in Figure 3.1, the vertical axis pertains to the price per kwh of energy, 𝑃/𝑘𝑊ℎ, produced while the horizontal axis corresponds to the kilowatt-hours produced in each energy sector. The equilibrium quantity and prices were determined from the available data from Meralco in the period of October to 2013 to January 2014 as presented in table 3.3. The prices were based on the generation process of the energy sources. The arrangement of the resources in the supply curve will also change depending on the marginal costs during the period analyzed. As seen in Table 3.3, during the 2013 shutdown, renewables (i.e hydro, geothermal) will be on the last step of the supply curve, succeeded by coal, and then natural gas.
Equilibrium quantities of each case will be based on the average total captive purchased for year 2013. Demand curve is determined using the point-slope: 𝑃 = 𝑎 − 𝑚𝑄𝑑, where 𝑚 is the slope, 𝑎 is the intercept, and 𝑃 is the price of electricity. An elasticity of -0.52 is adapted from the study of Lyman as cited by Danao (2013). This elasticity is the average of commercial, residential and industrial.
Figure 3.1. Demand and Supply Curve of Electricity Market
b. Determining the Welfare Loss
For a competitive market, 𝑄𝑒1 and 𝑃𝑒1 represents equilibrium quantity and price, respectively. Quantities and prices used refer to Table 3.3.
The study determined the welfare impact of the 2013 shutdown. Figure 3.2 illustrates the computation for welfare loss. Merit-order for the 2013 shutdown had renewables with the lowest marginal cost, while the highest was the fossil fuels.
Legend: R – Renewables (hydro, geothermal) C - Coal
NG - Natural Gas
F - Oil-based
12
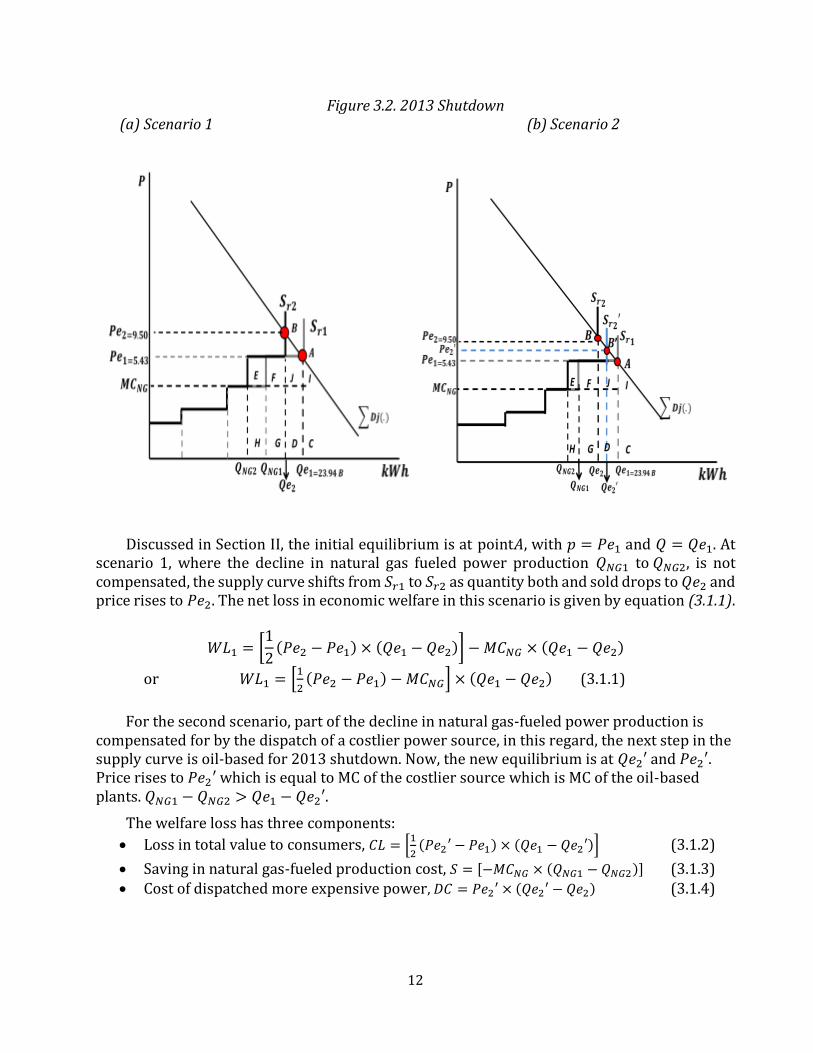
Figure 3.2. 2013 Shutdown (a) Scenario 1 (b) Scenario 2
Discussed in Section II, the initial equilibrium is at point𝐴, with 𝑝 = 𝑃𝑒1 and 𝑄 = 𝑄𝑒1. At
scenario 1, where the decline in natural gas fueled power production 𝑄𝑁𝐺1 to 𝑄𝑁𝐺2, is not compensated, the supply curve shifts from 𝑆𝑟1 to 𝑆𝑟2 as quantity both and sold drops to 𝑄𝑒2 and price rises to 𝑃𝑒2. The net loss in economic welfare in this scenario is given by equation (3.1.1).
𝑊𝐿1 = [1
2(𝑃𝑒2 − 𝑃𝑒1) × (𝑄𝑒1 − 𝑄𝑒2)] − 𝑀𝐶𝑁𝐺 × (𝑄𝑒1 − 𝑄𝑒2)
or 𝑊𝐿1 = [1
2(𝑃𝑒2 − 𝑃𝑒1) − 𝑀𝐶𝑁𝐺] × (𝑄𝑒1 − 𝑄𝑒2) (3.1.1)
For the second scenario, part of the decline in natural gas-fueled power production is
compensated for by the dispatch of a costlier power source, in this regard, the next step in the supply curve is oil-based for 2013 shutdown. Now, the new equilibrium is at 𝑄𝑒2′ and 𝑃𝑒2′. Price rises to 𝑃𝑒2′ which is equal to MC of the costlier source which is MC of the oil-based plants. 𝑄𝑁𝐺1 − 𝑄𝑁𝐺2 > 𝑄𝑒1 − 𝑄𝑒2′.
The welfare loss has three components:
Loss in total value to consumers, 𝐶𝐿 = [1
2(𝑃𝑒2′ − 𝑃𝑒1) × (𝑄𝑒1 − 𝑄𝑒2′)] (3.1.2)
Saving in natural gas-fueled production cost, 𝑆 = [−𝑀𝐶𝑁𝐺 × (𝑄𝑁𝐺1 − 𝑄𝑁𝐺2)] (3.1.3) Cost of dispatched more expensive power, 𝐷𝐶 = 𝑃𝑒2′ × (𝑄𝑒2′ − 𝑄𝑒2) (3.1.4)
13
Welfare Loss (𝑊𝐿2) for the second scenario is the sum of equations (3.1.2), (3.1.3), and (3.1.4).
4. Results of Numerical Illustrations: Case of the Philippines
The country experienced a notable confluence of plant shutdowns since 1990s. Coal, natural gas, oil-based and renewables which include hydro and geothermal were sources of electricity considered. These sources were described in Section II and III of the paper.
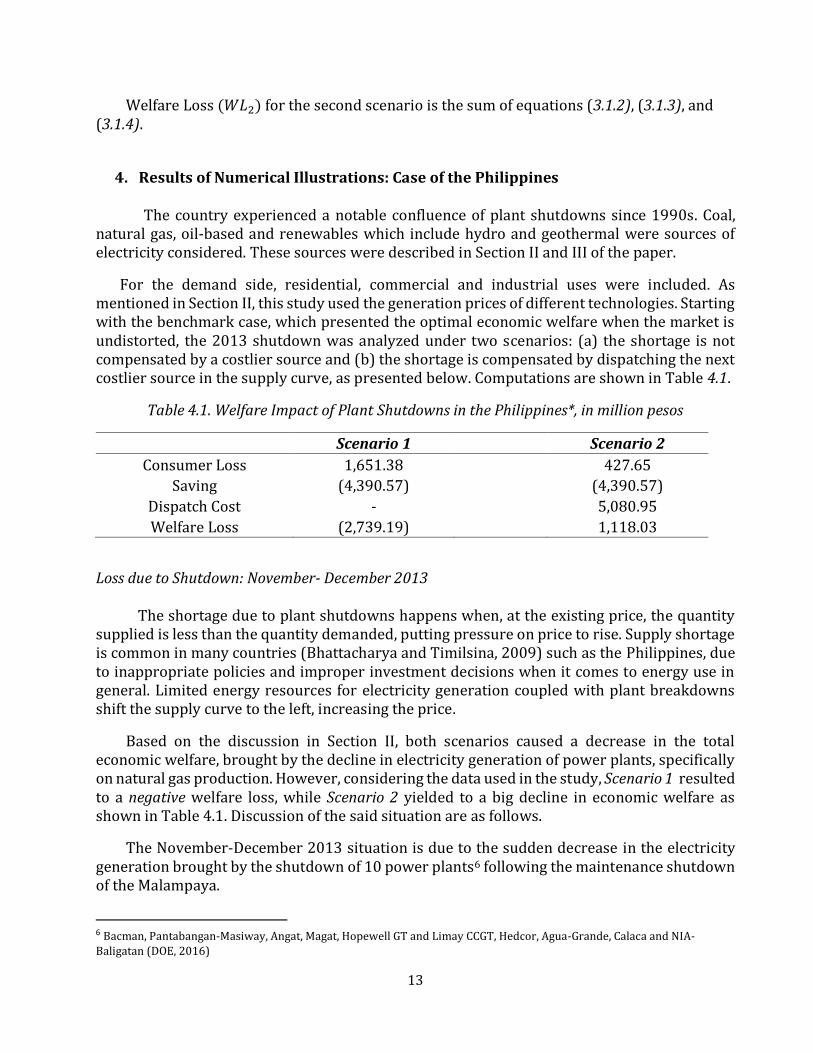
For the demand side, residential, commercial and industrial uses were included. As mentioned in Section II, this study used the generation prices of different technologies. Starting with the benchmark case, which presented the optimal economic welfare when the market is undistorted, the 2013 shutdown was analyzed under two scenarios: (a) the shortage is not compensated by a costlier source and (b) the shortage is compensated by dispatching the next costlier source in the supply curve, as presented below. Computations are shown in Table 4.1.
Table 4.1. Welfare Impact of Plant Shutdowns in the Philippines*, in million pesos
Scenario 1 Scenario 2
Consumer Loss 1,651.38 427.65
Saving (4,390.57) (4,390.57)
Dispatch Cost - 5,080.95
Welfare Loss (2,739.19) 1,118.03
Loss due to Shutdown: November- December 2013
The shortage due to plant shutdowns happens when, at the existing price, the quantity supplied is less than the quantity demanded, putting pressure on price to rise. Supply shortage is common in many countries (Bhattacharya and Timilsina, 2009) such as the Philippines, due to inappropriate policies and improper investment decisions when it comes to energy use in general. Limited energy resources for electricity generation coupled with plant breakdowns shift the supply curve to the left, increasing the price.
Based on the discussion in Section II, both scenarios caused a decrease in the total economic welfare, brought by the decline in electricity generation of power plants, specifically on natural gas production. However, considering the data used in the study, Scenario 1 resulted to a negative welfare loss, while Scenario 2 yielded to a big decline in economic welfare as shown in Table 4.1. Discussion of the said situation are as follows.
The November-December 2013 situation is due to the sudden decrease in the electricity generation brought by the shutdown of 10 power plants6 following the maintenance shutdown of the Malampaya.
6 Bacman, Pantabangan-Masiway, Angat, Magat, Hopewell GT and Limay CCGT, Hedcor, Agua-Grande, Calaca and NIA-Baligatan (DOE, 2016)
14
The scheduled operation maintenance shutdown of Malampaya from November 11 to December 10, 2013, led to a decline in supply of natural gas which affected Ilijan, Sta. Rita and San Lorenzo power plants. This coincided with planned maintenance schedules of some other coal-fired plants, while other power plants also experienced forced outages, such as Cala, GN Power, Masinloc Units and Sual Unit (ERC, 2013). These shutdowns caused a price spike in the electricity spot market at that time, so that other generators allegedly took advantage by not supplying at the “must-offer rule”7 of WESM.
The sudden and forced shutdown of the power plants resulted in a fall in electricity generation provided to distribution utilities. Other generators allegedly also took advantage of this to hold their supply in order to bid for a higher price.
As presented in Section III, the study used the data from Meralco and limited the generation plants who were suppliers of Meralco. Such quantities and prices presented were based from the reported data of Meralco.
During the months of October 2013 and January 2014, the average total captive generation cost at PHP 5.43. However, when the shutdown took place from November to December 2013, the average generation cost rose to PHP 9.50. The marginal cost of natural gas used in the computation is the average of October 2013 and January 2014, without the effect of Malampaya shutdown, and amounted to PHP 5.41. Furthermore, there is an average of 811.26 GWH natural gas fueled production.
As such, Table 4.1 illustrated the two scenarios. Scenario 1 shows that there is negative welfare loss of PHP 2,739.19 million per month. It is also presented in the table, that the total consumer loss, due to an increase in price is PHP1,651.38 million. Moreover, without dispatching the next costlier source for generation, a total of PHP 4,390 million of savings were incurred. However, even there is a loss due to an increase in price, the savings of not dispatching or generating the next costlier resource to cover up the loss of generation outweighs its negative impact in the total welfare. This indicates that there will be an amount of additional welfare or savings of PHP 2,739.19 million for one month. This, total savings amounted to PHP 5,478.37 million for two months.
Furthermore, for the second scenario, dispatch of a costlier energy source which is oil, as shown in Figure 3.2 (b), results in a large welfare loss of PHP 1,118.03 million per month. Consumer loss amounted to PHP 427.65 million per month, because of high price. The cost of dispatch for the more expensive power is PHP 5,080 million as shown in Table 4.1. The savings of not producing Natural gas still amounted to PHP 4,390 million.
As scenario 2 was discussed, this is evident on the report of Meralco from the month of November 2013 to January 2014. Due to the decrease in the supply of electricity from Malampaya and other natural gas plant facilities, they opted to increase their source of electricity generation from Therma Mobile8, which also started their commercial operations on
7Must-offer rule, which requires every generator to offer its maximum available capacity. Despite this rule, it is still possible to withhold capacity by economic withholding. This is done by offering a block of electricity at a price sufficiently high that it will not be dispatched. The
effect is, of course, the same as that of physical withholding (Danao, 2010). 8 Oil-fired power plants. Therma Mobile, Inc. (TMO) is ready to provide reliable peak power supply to the Luzon grid anytime through the four floating power barges in Navotas, Manila that it operates.
15
November 12, 2013 at a capacity of 100 MW. Based from the record, about 9 GWH was dispatched, from 14.82 GWH in November 2013, Meralco purchased an amount of 23.27 GWH in December 2013. However, after the maintenance shutdown of Malampaya and other natural gas plants, there is a large decline in the amount of electricity purchased, which is only 3.94 GWH.
Additionally, the Philippine Statistics Authority (2013) was able to record higher electricity rates, and increase of 1.3% and 2.4% in electricity index at the national level and NCR, respectively. Even though, the analysis of the study is limited to Meralco in the NCR area, we can still associate the price increase with the coordinated shutdowns of the power plants, when retail prices in the spot market shot up.
5. Conclusion and Policy Implication
The Philippines experienced electricity shortage in the 1980s that lasted until the 1990s. At present, a number of shutdowns have taken place and there is a possibility that a power crisis will take place if the government will be unable to implement solutions. This also concerns the presence of the private players in the market, specifically in the generation sector. Considering the rapid growth of the country, what will be the economic impact of power shortage in the country? How will the country be able to address the potential effects of a shutdown? This study provided a theoretical approach in analyzing the economic impact of these plant shutdowns. The focus of the analysis is the November to December 2013 shutdown. Numerical analysis was done by providing a baseline model, an undistorted electricity market to serve as a benchmark, and welfare effects of this shutdown were analyzed. The results of the study show that shutdowns from both cases brought big impacts on Philippine society due to the increase in the prices of electricity generation which in turned lowered the welfare of consumers and producers. Two scenarios were conducted to analyze the 2013 shutdown. These scenarios were: (a) the decline in the generation of one source is not compensated by the next costlier source, and (b) the decline in the generation is being compensated through dispatching the next costlier source in the supply curve. In the first scenario, the decrease in generation of the natural gas-fueled power plants shrank the supply curve and caused an increase in the equilibrium price. However, this scenario resulted to a negative welfare loss of PHP 2,739 million.
Furthermore, in the second scenario, there is a decrease in the welfare of PHP 1,118 million9. For this scenario, the decline in natural gas production is compensated through a dispatch to a costlier energy source. Fossil fuel’s generation compensated for the decrease in natural gas production during the 2013 Shutdown. The shutdown occurred during the last quarter of the year and there is evidence of price shooting up in the spot market, which add up to the decrease in the welfare. Moreover, these welfare losses account for about 0.1% of the GDP for the fourth quarter of 2013.
9 In current 2013 prices.
16
With the increasing demand for electricity at present, a shutdown of one of the power plants will expectedly bring losses both for the firms and the households. Power interruptions might also cause conflict with the existing and the future goals of the Philippine government’s economic policies.
Connected to these power outages are the series of power plant shutdowns that happened in the country throughout the past 20 years. With this in mind, future shutdowns of power plants could cause a chain of rotational brownouts if the government will be unable to perform immediate action and solutions that can further improve the current situation of the electricity sector.
The previous experience of shutdowns pushed the government to strengthen the strategies in providing reserve back-up plan. For future directions of the study, forecasting the demand for electricity is also an important input for the government, especially now that the Philippine population is booming and the economy is developing. Further research should be done in the field, especially on electricity pricing, in order to get a detailed and more accurate measure of welfare loss due to shortages. It is also best to explore other areas of electricity, such as transmission, distribution, and the supply sectors, to further explain and measure the cost of power shortages in the country. Furthermore, because the paper failed to explore the effects of collusion in the spot market, future research should be done to explain and investigate the scenario, usage of another market structure must also be utilized.
17
References
Addepalli, R. “Introductory Primer on the Monitoring and Surveillance of Electric Power Markets”. The Philippine Energy Regulatory Commission (2004). Retrieved from: http://pdf.usaid.gov/pdf_docs/PNADA638.pdf.
Aldaba, R. “Assessing Competition in Philippine Markets”. (Discussion Paper Series No. 2008-23, Philippine Institute for Development Studies, 2008). Retrieved from: http://dirp4.pids.gov.ph/ris/dps/pidsdps0823.pdf.
Allcott, H., Collard-Wexler, A, and O'Connell, SD. “How do Electricity Shortages Affect Productivity? Evidence from India”. (NBER Working Paper No. 19977, National Bureau of Economic Research, 2014), Cambridge MA.
Alonzo, R. ”Welfare Effects of Different Rationing Schemes: Implication for Project Analysis”. (Discussion Paper, Philippine Center for Economic Development, 1996, unpublished).
Alonzo, R. and Policy Component Staff. “An Assessment of the Philippine Power Sector Policy Landscape”. (Policy Paper, Energy Policy and Development Program, 2016, draft).
Austria, B.S. (1999). Development of the Energy Industry in the Philippines in Second Workshop on Economic Cooperation in Central Asia: Challenges and Opportunities in Energy, Asian Development Bank. Online. Retrieved at: www.adb.org/documents/conference/carec/energy/chap11.pdf.
Bhattacharyya, S. and Timilsina, G.R. “Energy demand models for policy formulation: a comparative study of energy demand models”, (World Bank Policy Research Working Paper No. 4866, World Bank, 2009), Washington, DC.
Buzoianu, M., Brockwell, A., and Seppi, D. “A Dynamic Supply-Demand Model for Electricity Prices”. (Technical Report no 817, Department of Statistics, Carnergie Mellon University, 2005). Retrieved from: http://www.stat.cmu.edu/tr/tr817/tr817.pdf.
Cabacungan, G. and Bordadora, N. “Collusion eyed in power rate hike”. The Philippine Daily Inquirer. 2013 December 11. Retrieved from: http://newsinfo.inquirer.net/544071/doe-probes-power-plant-operators-alleged-collusion-to-hike-prices.
Center for the Advancement of Trade Integration and Facilitation (CATIF), “Challenges in Pricing Electric Power Services in Selected ASEAN Countries”. Philippines Climate Change and Clean Energy Project (C Energy). 2013 April.
Chaudhry, A. “A panel data analysis of electricity demand in Pakistan”. The Lahore Journal of Economics special edition (September 2010, 15: 75-106).
Cham, M.R. “The Philippine Power Sector: issues and solutions”. Philippine Review of Economics (2007), 44(1): 33-63.
18
Corral, L. Why is Electricity so Expensive in the Philippines? [Powerpoint Slides, 2012] Retrieved from: http://isslerhall.org/drupal/sites/default/files/Why%20electricity%20is%20expensive_corral-sep2012.pptx.
Crismundo, M. ”Mindanao power Crisis worsens”. Manila Bulletin, 2015 July 24. Retrieved from: http://www.mb.com.ph/mindanao-power-crisis-worsens/.
Couch, G. “Coal Supply Prospects in the United States-An appraisal of Current Knowledge. Workshops on Energy Supply and Demand”. International Energy Agency (1978), OECD. 46-47.
Danao, R. “Market Power in the Philippine Power Market”. (Discussion Paper Series 2009-09, UP School of Economics, 2010, September). Retrieved from: http://www.econ.upd.edu.ph/dp/index.php/dp/article/viewFile/87/78.
Deane, P., Collins, S., Gallachoir, B., Eid, C., Hartel, R., Keles, D. and Fichtner, W “Quantifying the ‘merit-order’ effect in European electricity markets”. Rapid Response Energy Brief, 2015. INSIGHT_E, European Commission. Retrieved from: https://www.ifri.org/sites/default/files/atoms/files/insight_e_european_electricity_market.pdf.
Department of Energy. “Electric Power Supply-Demand Outlook for 2012-2030”. (2013) Retrieved from Department of Energy website: http://www2.doe.gov.ph/Presentations/Visayas%20Power%20Summit%20-%20April%2026.pdf.
DOE Power Situationer. “2010 Philippine Power Sector Situationer”. Department of Energy (2010). Retrieved from: http://www.doe.gov.ph/electric-power-statistics/217-energy-situationer/power-and-electrification/power-sector-situationer.
DOE Power Situationer 2014 (2014). DOE Website. Retrieved at: http://www.doe.gov.ph/doe_files/pdf/01_Energy_Situationer/2014_power_situationer.pdf.
Electricity Generating Authority of Thailand (EGAT). Electricity Prices. Retrieved from: http://www.egat.co.th/en/.
Energy Information Administration (EIA). “Supply shortages lead to rolling power outages in the Philippines” (2015). Retrieved from: http://www.eia.gov/todayinenergy/detail.cfm?id=20252.
Energy Information Administration (EIA). Glossary (2016). Retrieved from: https://www.eia.gov/tools/glossary/index.cfm?id=D
Energy Regulatory Commission (ERC). “ERC Voids Nov - Dec 2013 WESM Prices”. (2014) Retrieved from: http://www.erc.gov.ph/ContentPage/89.
19
Fabella, R. “The Regulatory Environment of the Energy Industry in the Philippines”. Centre on Regulation and Competition. Institute for Development Policy and Management (Paper No.48, University of Manchester, 2002, December).
Fan, S. and Hyndman, R. “The price elasticity of electricity demand in South Australia”. Energy Policy (2011, June), 39(6), 3709-3719.
Feliciano, C. “CBK plant to provide extra 400 MW – Osmeña”. Business World Online, 2015, March 5. Retrieved from: http://www.bworldonline.com/content.php?section=Economy&title=cbk-plant-to-provide-extra-400-mw----osme&241a&id=103872.
Fisher-Vanden, K., Mansur,E. and Wang, Q. “Electricity Shortages and Firm Productivity: Evidence from China’s Industrial Firms”. Journal of Development Economics (2015),114: 172–188.
Gourvitch, N. “The Merit Order Effect: A quantitative analysis for Italian PV Generation”. [Powerpoint Slides, 2013] IEA PVPS Task 1 and EPIA Workshop. Green Giraffe, Energy Bankers. Retrieved from: http://iea-pvps.org/fileadmin/dam/public/workshop/12-Nicolas_Gourvitch_-_Revenues_through_electricity_markets_Merit_order_effect.pdf.
Griffin, J. and Puller, S. (2005). A Primer on Electricity and the Economics of Deregulation. In J. Griffin and S. Puller (Eds.) Electricity Deregulation: Choices and Challenges. Chicago: University of Chicago Press.
Hackett, S., Scheidler, L. and Garcia, R. Jr. (Schatz Energy Research Center). “Humboldt County as a Renewable Energy Secure Community: Economic Analysis Report”. (California Energy Commission, 2013).
International Energy Agency. “Secure and Efficient Electricity Supply”. (2013) Retrieved from: http://www.iea.org/publications/freepublications/publication/SECUREANDEFFICIENTELECTRICITYSUPPLY.pdf.
International Energy Agency (IEA). “Methodology for the WEM wholesale electricity price module”. (2012) Retrieved from: http://www.worldenergyoutlook.org/media/weowebsite/energymodel/documentation/Methodology_wholesale_electricity_prices.pdf.
Kraemer, S. “How German Solar Has Made All German Electricity Cheaper”. Last Modified February 29, 2012. Retrieved from: http://cleantechnica.com/2012/02/29/how-german-solar-has-made-all-german-electricity-cheaper/.
Lectura, L. “Power Situation not grim despite Malampaya Shutdown- DOE”. Business Mirror, 2015, March 14. Retrieved from: http://www.businessmirror.com.ph/power-situation-not-grim-despite-malampaya-shutdown-d-o-e/.
Linares, P. and Rey, L. “The Costs of Electricity Interruptions in Spain. Are we sending the right signals?” Energy Policy (2013), 61(C): 751-760.
20
London Economics “Estimating the Value of Lost Load”. (2013). Retrieved from: http://www.ercot.com/content/gridinfo/resource/2015/mktanalysis/ERCOT_ValueofLostLoad_LiteratureReviewandMacroeconomic.pdf.
London Economics. “The Value of Lost Load (VoLL) for Electricity in Great Britain”. (2013). Retrieved from: https://www.gov.uk/government/uploads/system/uploads/attachment_data/file/224028/value_lost_load_electricty_gb.pdf.
Lodhi, R.N., Siddiqui, M.A, and Habiba, U. “Empirical investigation of the factors affecting foreign direct investment in Pakistan: ARDL approach”. World Applied Sciences Journal (2013), 22(9): 1318-1325.
Loulou, R, Goldstein, G. and Noble, K. “Documentation for the Markal Family of Models”. Energy Technology Systems Analysis Program, International Energy Agency, (2004, October). Retrieved from: http://www.iea-etsap.org/web/mrkldoc-i_stdmarkal.pdf.
Lucas, M. “Pricing Decisions and the Neoclassical theory of the Firm”. Academic Press: Management Accounting Research (2003): 14, 201-217.
Malaysia Energy Information Hub (MEIH). Electricity Prices. Retrieved from: http://meih.st.gov.my/.
Mendoza, M.F. “Competition in Electricity Markets: The Case of the Philippines”. (Working Paper Series, National College of Public Administration and Governance [NCPAG], 2008, August) Retrieved from: http://ncpag.upd.edu.ph/wp-content/uploads/2014/03/competitionelectricity.pdf.
Meralco. Generation Charge Computation Data Record. (2015). Retrieved from Meralco Website. http://www.meralco.com.ph
Meralco. Metro Manila Electricity Prices. (2014).
Meralco. “Interruptible Load Program” (2015). Retrieved from: http://corporatepartners.meralco.com.ph/tools/ILP_Protocol.
Metropolitan Electricity Authority of Thailand. Electricity Prices. Retrieved from: http://www.mea.or.th/home/index.php.
National Electrification Administration (NEA). About NEA. (2014). Retrieved from: http://www.nea.gov.ph/.
Ondraczek, J. “Are we there yet? Improving solar PV economics and power planning in developing countries: The case of Kenya”. Renewable and Sustainable Energy Reviews (2014),30: 604-615.
Oregon State. “Econ 201 Lecture 8”. [Class handout, 2015]. Oregon State University, USA.
21
Oseni, M. and Pollitt, M. (2013). “The Economic Costs of Unsupplied Electricity: Evidence from Backup Generation among African Firms”. (EPRG Working Paper 1326, University of Cambridge, 2013).
Paul, A., Myers, E. and Palmer, K. ”A Partial Adjustment Model of US Electricity Demand by Region, Season and Sector” (Discussion Paper No. 08-50, Resources of the Future, 2009, April) Resources for the Future. Retrieved from: http://www.rff.org/documents/rff-dp-08-50.pdf.
Pasimio, H. and Turingan, P.S. (2009). Powering the Future: Are We Ready for Nuclear Energy, Pasay, the Philippines: Senate Economic Policy Office: 1-12.
Penarroyo, F. “Philippines-Prolonged Generation and Opportunity”. Paper presented at the 38th annual meeting for Geothermal Resources Council, Portland, Oregon. 29 September 2014. Retrieved from: http://www.geothermal.org/Annual_Meeting/PDFs/Philippines.pdf.
Perusahaan Listrik Negra (PLN). Indonesia Electricity Prices. Retrieved from: http://www.pln.co.id/.
Posadas, D. and Maniego, P. “Coal vs. Renewable energy from a cost perspective” The Philippine Daily Inquirer, 2012, February. Retrieved from: Philippine Daily Inquirer Website: http://business.inquirer.net/44217/coal-vs-renewable-energy-from-a-cost-perspective.
Philippine Statistics Authority (PSA). Summary Inflation Report Consumer Price Index. 2013. Retrieved from: https://psa.gov.ph/content/summary-inflation-report-consumer-price-index-2006100-november-2013.
Qasim, M. and Kotani, K. “An Empirical Analysis of Energy Shortage in Pakistan”. Asia-Pacific Development Journal (2014), 21(1), 137-166.
Ramos, F.V. (2010). “Lessons from the Philippine Electricity Crisis”, Financial Express Online. Retrieved from: www.thefinancialexpress-bd.com/more.php?news_id=97574.
Ravago, M, et. al.” The Role of Power Prices in Structural Transformation: Evidence from the Philippines” (Working Paper, Energy Policy and Development Program, 2016).
Renewable Energy. “FIT now in the Philippines”. Last modified July 2012. Retrieved from: http://www.renewableenergy.ph/fit-now-in-the-philippines.html.
Roumasset, J., Chakravorty, U. and Tse, K. (1997). “Endogenous substitution among energy resources and global warming”. Journal of Political Economy 105: 1201–34.
Senate Press Release. “Joint Resolution No. 12.” Senate of the Philippines, (2015, February 6). Retrieved from: http://www.senate.gov.ph/press_release/2015/Feb-6-2015%2015020614390.pdf.
22
Schmalensee, R., and Joskow, P. Markets for Power. [Cambridge, Massachusetts: MIT Press, 1983]
Singapore Statistics (SingStat). Singapore Electricity Prices. Retrieved from: www.singstat.gov.sg.
Trollip, H., Butler, A., Burton, J., Caetano, T. and Godinho, C. “Energy Security in South Africa.” [MAPS, Cape Town, 2014]
Van der Welle, A., and van der Zwaan, B. “An Overview of Selected Studies on the Value of Lost Load (VOLL)”. (2007) Retrieved from: http://www.transust.org/workplan/papers/wp2_task_5_lost_load.pdf.
Wholesale Electricity Spot Market. Generator Prices Data Records. (2015)
Woodhouse, E. (2005a). Political Economy of International Infrastructure Contracting, Lessons from the IPP Experience. Working Paer No.52. Online. Retrieved from: http://iis-db.stanford.edu/pubs/20990/PESD_IPP_Study,_Global_Report.pdf.
World Bank. World Development Indicators: Electricity. (2014). Retrieved from: WB website: databank.worldbank.org/data/databases.aspx.
Zha, D. Managing Regional Energy Vulnerabilities in East Asia: Case Studies [Routledge, 2013].