Embed Size (px)
Citation preview

ISSN 2094-6198 Volume 10 No. 2 Quezon City, Philippines
PHILIPPINE STATISTICS AUTHORITY
Major Non-Food and Industrial Crops
Quarterly Bulletin
April-June 2016

Photos Illustration by: Quirino G. Santos, Jr. Knowledge Management and Communication Division (KMCD) Philippine Statistics Authority
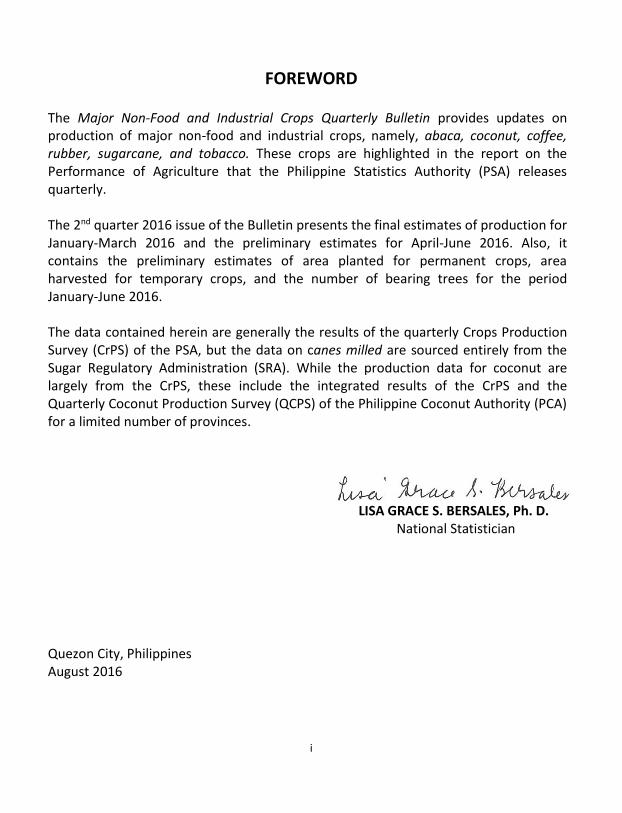
FOREWORD The Major Non-Food and Industrial Crops Quarterly Bulletin provides updates on production of major non-food and industrial crops, namely, abaca, coconut, coffee, rubber, sugarcane, and tobacco. These crops are highlighted in the report on the Performance of Agriculture that the Philippine Statistics Authority (PSA) releases quarterly. The 2nd quarter 2016 issue of the Bulletin presents the final estimates of production for January-March 2016 and the preliminary estimates for April-June 2016. Also, it contains the preliminary estimates of area planted for permanent crops, area harvested for temporary crops, and the number of bearing trees for the period January-June 2016. The data contained herein are generally the results of the quarterly Crops Production Survey (CrPS) of the PSA, but the data on canes milled are sourced entirely from the Sugar Regulatory Administration (SRA). While the production data for coconut are largely from the CrPS, these include the integrated results of the CrPS and the Quarterly Coconut Production Survey (QCPS) of the Philippine Coconut Authority (PCA) for a limited number of provinces.
LISA GRACE S. BERSALES, Ph. D. National Statistician
Quezon City, Philippines August 2016
i

TABLE OF CONTENTS
Foreword i
Table of Contents ii
Technical Notes iv
Abaca 2
Coconut 4
Coffee 6
Rubber 8
Sugarcane 10
Tobacco 12
List of Tables
Table 1. Non-Food and Industrial Crops: Production, Philippines, 14
January-March 2015-2016F and April-June 2015-2016P
Table 2. Non-Food and Industrial Crops: Area and number of bearing trees, 15
January-March 2015-2016F and April-June 2015-2016P
Table 3. Abaca: Volume of production by region, Philippines, 16
January-March 2015-2016F and April-June 2015-2016P
Table 4. Coconut: Volume of production by region, Philippines, 17
January-March 2015-2016F and April-June 2015-2016P
Table 5. Coffee: Volume of production by region, Philippines, 18
January-March 2015-2016F and April-June 2015-2016P
Table 6. Rubber: Volume of production by region, Philippines, 19
January-March 2015-2016F and April-June 2015-2016P
Table 7. Sugarcane: Volume of production by region, Philippines, 20
January-March 2015-2016F and April-June 2015-2016P
Table 8. Tobacco: Volume of production by region, Philippines, 21
January-March 2015-2016F and April-June 2015-2016P
ii
List of Figures
Figure 1. Abaca production by region, Philippines, April-June 2016 1
Figure 2. Abaca: Top Producing Regions, Philippines, April-June 2016 2
Figure 3. Coconut production by region, Philippines, April-June 2016 3
Figure 4. Coconut: Top Producing Regions, Philippines, April-June 2016 4
Figure 5. Coffee production by region, Philippines, April-June 2016 5
Figure 6. Coffee: Top Producing Regions, Philippines, April-June 2016 6
Figure 7. Coffee: Percent distribution of production by variety, Philippines, 6
April-June 2016
Figure 8. Rubber production by region, Philippines, April-June 2016 7
Figure 9. Rubber: Top Producing Regions, Philippines, April-June 2016 8Figure 10. Sugarcane production by region, Philippines, April-June 2016 9Figure 11. Sugarcane: Top Producing Regions, Philippines, April-June 2016 10
Figure 12. Tobacco production by region, Philippines, April-June 2016 11
Figure 13. Tobacco: Top Producing Regions, Philippines, April-June 2016 12
Figure 14. Tobacco: Percent distribution of production by variety, Philippines, 12
April-June 2016
iii

TECHNICAL NOTES
Production refers to the quantity produced and actually harvested for a particular crop during the reference period. For other crops, area planted refers to the actual physical area planted while area harvested refers to the actual area from which harvests are realized. Bearing trees/hills is the number of trees/hills where harvesting has been made in the past but may or may not have borne fruits or productive during the reference period due to cyclical production pattern of the crop. Estimates of production, area planted/harvested and number of bearing trees/hills are generated from the quarterly Crops Production Survey (CrPS) of which there are four survey rounds in a year, that is, February, May, August and November.
iv
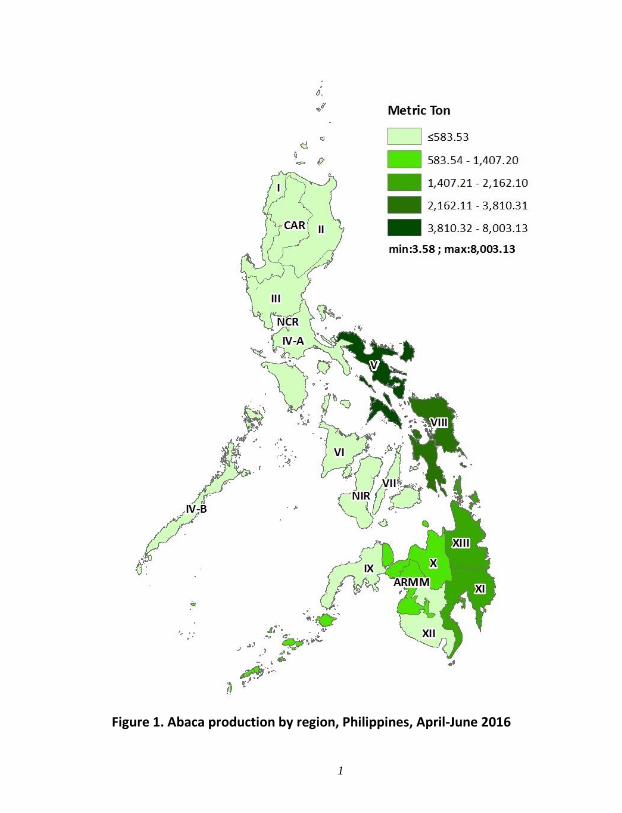
Figure 1. Abaca production by region, Philippines, April-June 2016
1

Bicol Region41.0%
Eastern Visayas19.5%
Caraga11.1%
Davao Region9.8%
Other regions18.5%
Abaca
Production of abaca fibers went up slightly by 0.7 percent in April-June 2016
from 19.36 thousand mt last year to 19.50 thousand mt (Table 3). This was
attributed to the following factors:
o more stripping activities due to good prices of fiber in Caraga (Agusan del
Sur and Surigao del Sur);
o increased demand from traders and local handicraft makers in Aklan; and
o more farmers harvested abaca due to favorable weather for harvesting and
drying of fibers, as well as good price for fiber in Bukidnon.
On the other hand, there was a noticeable decrease in the production of the top
two abaca-producing regions, namely, Bicol Region and Eastern Visayas, due to
the following:
o less stripping activities in Catanduanes as farmers engaged in different
election-related activities; and
o occurrence of abaca “bunchy top” and “mosaic” disease in Northern Samar.
The top abaca producer was Bicol Region with a share of 41.0 percent to the
country’s national abaca production. Eastern Visayas followed next with 19.5
percent, and Caraga and Davao Region with 11.1 and 9.8 percent contribution,
respectively (Figure 2).
2
Figure 2. Abaca: Top Producing Regions, Philippines, April-June 2016
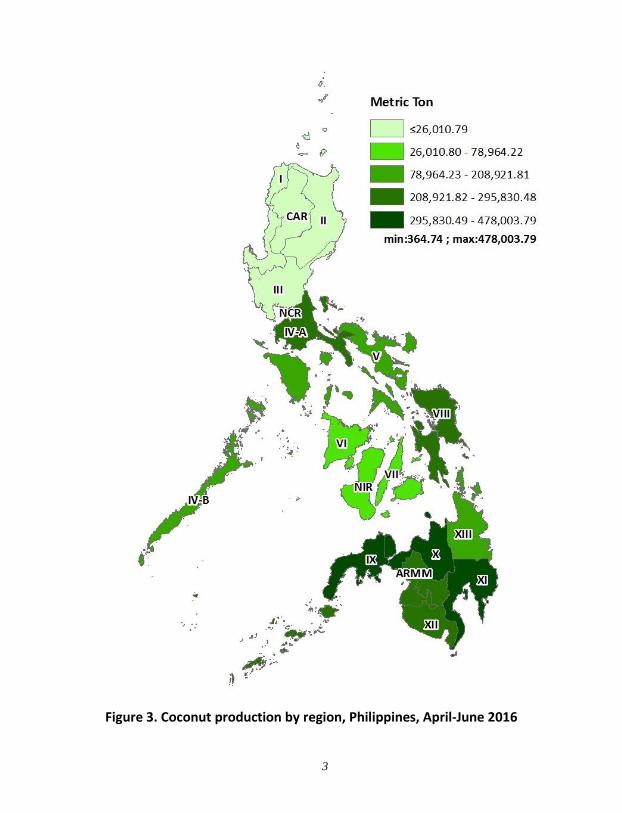
Figure 3. Coconut production by region, Philippines, April-June 2016
3
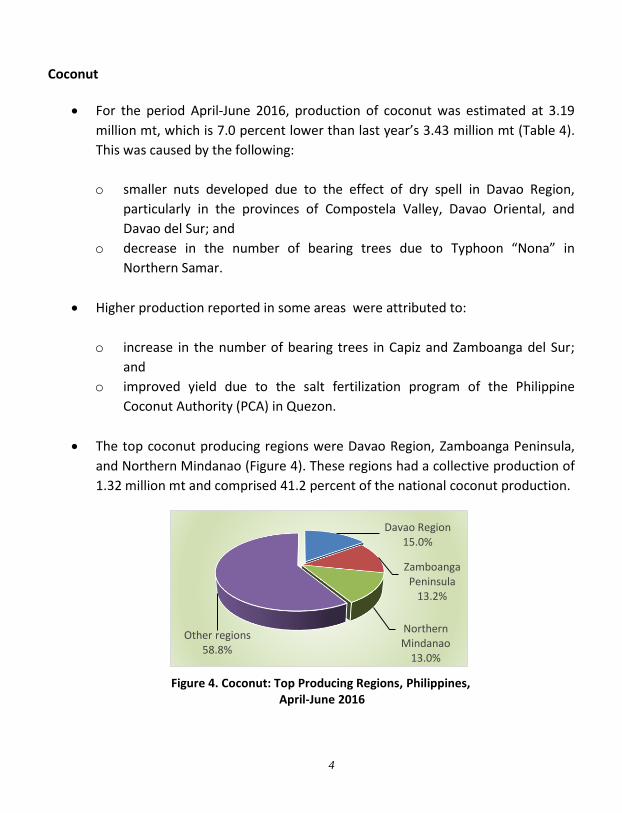
Davao Region15.0%
Zamboanga Peninsula
13.2%
Northern Mindanao
13.0%
Other regions58.8%
Coconut
For the period April-June 2016, production of coconut was estimated at 3.19
million mt, which is 7.0 percent lower than last year’s 3.43 million mt (Table 4).
This was caused by the following:
o smaller nuts developed due to the effect of dry spell in Davao Region,
particularly in the provinces of Compostela Valley, Davao Oriental, and
Davao del Sur; and
o decrease in the number of bearing trees due to Typhoon “Nona” in
Northern Samar.
Higher production reported in some areas were attributed to:
o increase in the number of bearing trees in Capiz and Zamboanga del Sur;
and
o improved yield due to the salt fertilization program of the Philippine
Coconut Authority (PCA) in Quezon.
The top coconut producing regions were Davao Region, Zamboanga Peninsula,
and Northern Mindanao (Figure 4). These regions had a collective production of
1.32 million mt and comprised 41.2 percent of the national coconut production.
4
Figure 4. Coconut: Top Producing Regions, Philippines, April-June 2016
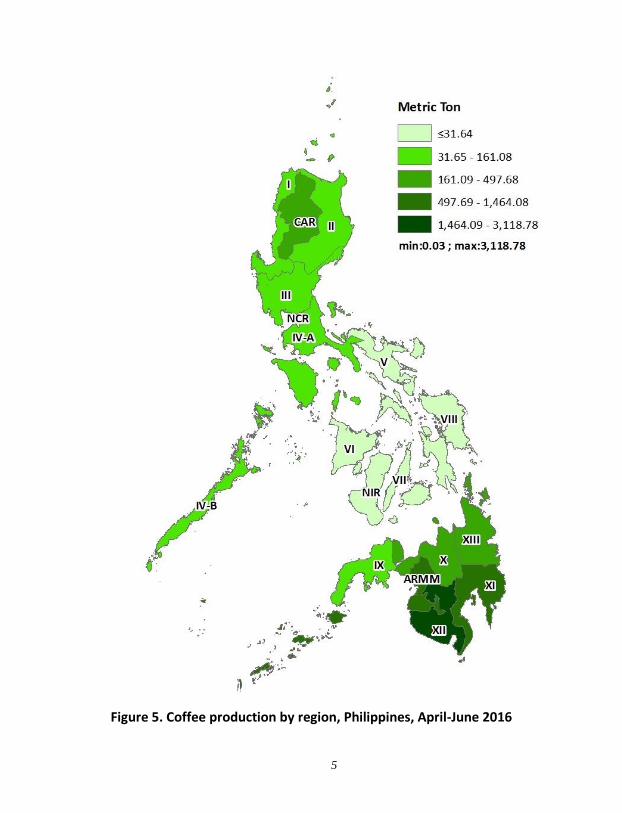
Figure 5. Coffee production by region, Philippines, April-June 2016
5
SOCCSKSARGEN40.5%
Davao Region19.0%
ARMM17.4%
Other regions23.0%
Arabica28.9%
Excelsa11.3%
Liberica0.6%
Robusta59.3%
Coffee
Production of dried coffee berries decreased by 13.9 percent in April-June 2016, from 8.93 thousand mt last year to 7.70 thousand mt (Table 5). This decline was caused by the following factors: o smaller and less berries harvested due to drought in North Cotabato and
Sultan Kudarat; and o reduced harvest as old and less productive trees were cut down in
Zamboanga del Norte and Ifugao.
On the other hand, production increase in some areas were attributed to the following: o increase in number of bearing trees in Pangasinan; and o more berries harvested from young bearing trees which resulted to the
extension of harvest from 1st quarter up to 2nd quarter in Nueva Vizcaya.
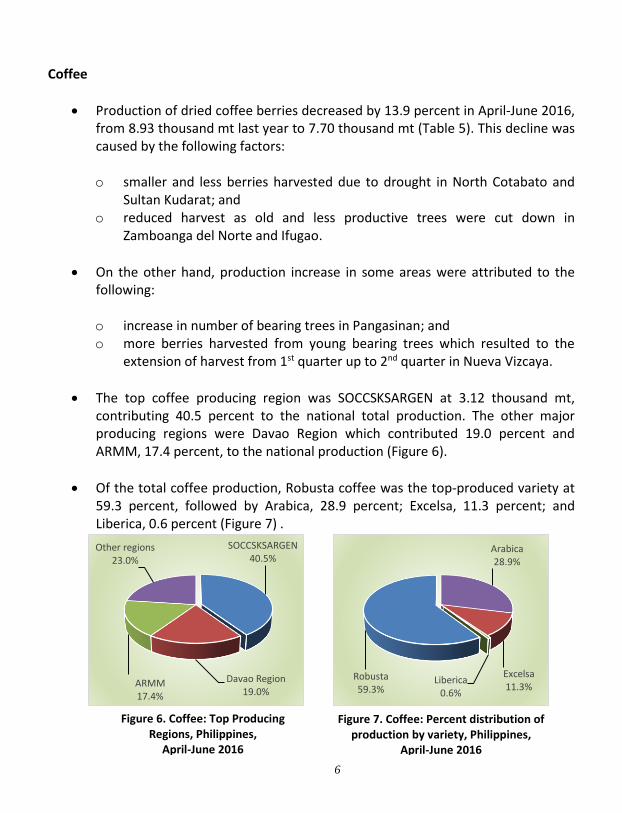
The top coffee producing region was SOCCSKSARGEN at 3.12 thousand mt, contributing 40.5 percent to the national total production. The other major producing regions were Davao Region which contributed 19.0 percent and ARMM, 17.4 percent, to the national production (Figure 6).
Of the total coffee production, Robusta coffee was the top-produced variety at 59.3 percent, followed by Arabica, 28.9 percent; Excelsa, 11.3 percent; and Liberica, 0.6 percent (Figure 7) .
Figure 6. Coffee: Top Producing Regions, Philippines,
April-June 2016
6
Figure 7. Coffee: Percent distribution of production by variety, Philippines,
April-June 2016
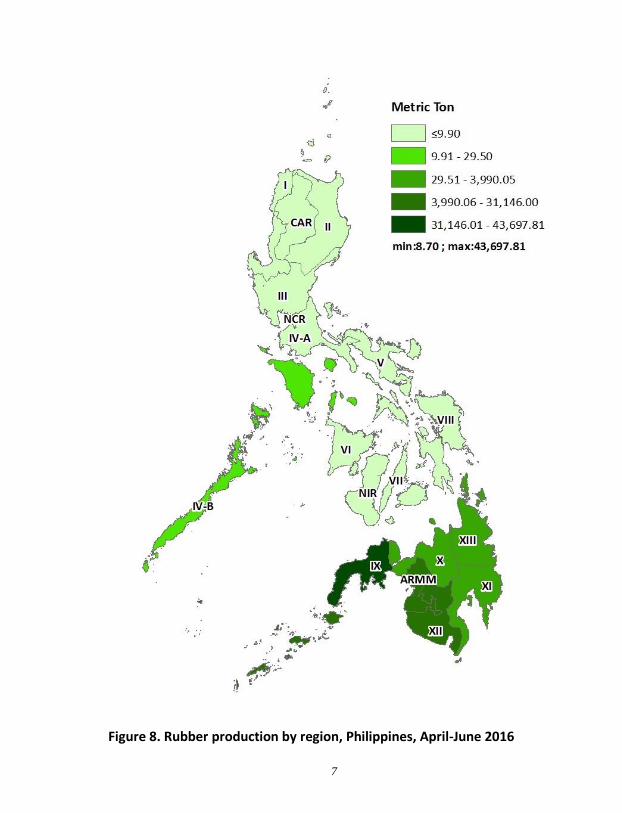
Figure 8. Rubber production by region, Philippines, April-June 2016
7
Zamboanga Peninsula
41.5%
ARMM29.6%
SOCCSKSARGEN19.9%
Other regions9.1%
Rubber
During the April-June 2016 period, the production of rubber dropped by 11.8 percent, from 119.54 thousand mt in 2015 to 105.38 thousand mt this year (Table 6). The decrease was due to the following: o drying up of some trees due to drought and less tapping activities due to
low buying price of cup lump North Cotabato; and o less latex were produced due to the falling of leaves of rubber trees
(wintering) caused by prolonged dry weather in Basilan.
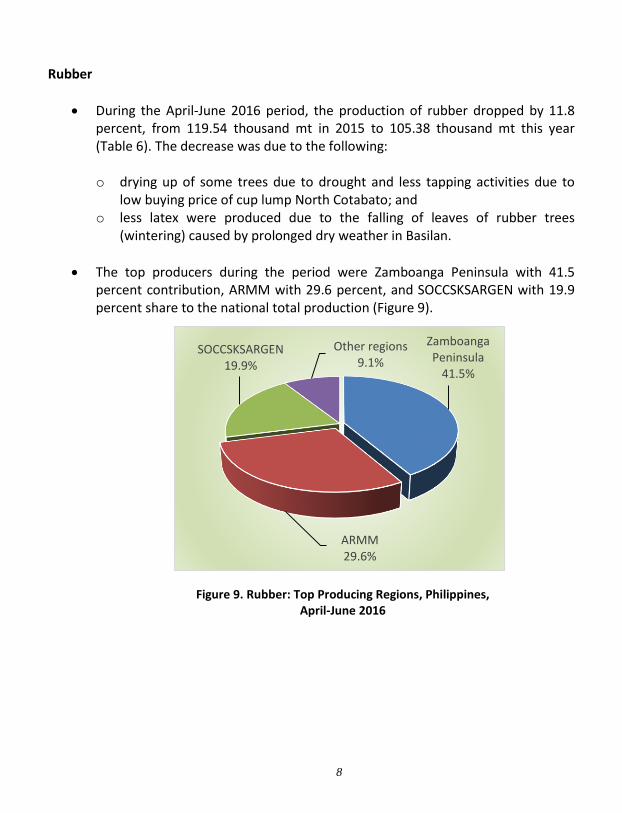
The top producers during the period were Zamboanga Peninsula with 41.5 percent contribution, ARMM with 29.6 percent, and SOCCSKSARGEN with 19.9 percent share to the national total production (Figure 9).
8
Figure 9. Rubber: Top Producing Regions, Philippines, April-June 2016

Figure 10. Sugarcane production by region, Philippines, April-June 2016
9
NIR46.8%
CALABARZON17.5%
Other regions35.7%
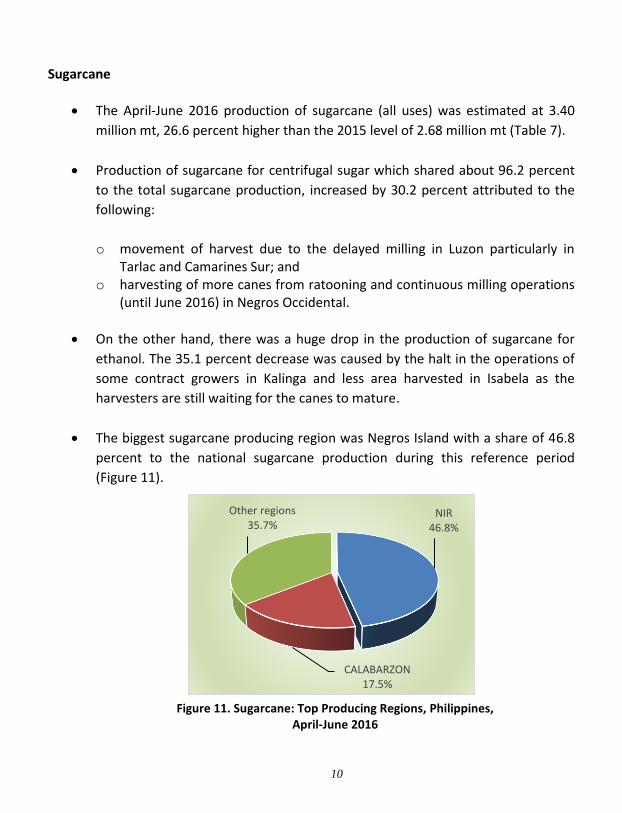
Sugarcane
The April-June 2016 production of sugarcane (all uses) was estimated at 3.40
million mt, 26.6 percent higher than the 2015 level of 2.68 million mt (Table 7).
Production of sugarcane for centrifugal sugar which shared about 96.2 percent
to the total sugarcane production, increased by 30.2 percent attributed to the
following:
o movement of harvest due to the delayed milling in Luzon particularly in Tarlac and Camarines Sur; and
o harvesting of more canes from ratooning and continuous milling operations (until June 2016) in Negros Occidental.
On the other hand, there was a huge drop in the production of sugarcane for
ethanol. The 35.1 percent decrease was caused by the halt in the operations of
some contract growers in Kalinga and less area harvested in Isabela as the
harvesters are still waiting for the canes to mature.
The biggest sugarcane producing region was Negros Island with a share of 46.8
percent to the national sugarcane production during this reference period
(Figure 11).
10
Figure 11. Sugarcane: Top Producing Regions, Philippines, April-June 2016

Figure 12.Tobacco production by region, Philippines, April-June 2016
11

Ilocos Region 64.4%
Cagayan Valley29.2%
Other regions6.4%
Native11.8%
Virginia43.1%
Other (Burley)45.2%
Tobacco
Total production of tobacco for the second quarter of 2016 was recorded at 41.81 thousand mt (Table 8). It went down slightly by 0.9 percent from last year’s level of 42.21 thousand mt due to the: o decline in Tobacco Virginia resulting from the shift to corn and eggplant,
and less area planted brought by the high cost of curing materials in Ilocos Region (Ilocos Sur and La Union).
While the situation in Ilocos Region caused a huge decrease in the total tobacco
production, there was a remarkable increase in Other (Burley) in the province of
Isabela which was attributed to the increase in area harvested due to the
financial support from Universal Leaf Philippines Incorporated (ULPI) and private
individuals. This compensated for the huge decrease in Native, resulting to a
minimal decrease in the over-all tobacco production.
Ilocos Region remained the major tobacco producer with a share of 64.4 percent to the national total (Figure 13).
Of the total tobacco production, Others (Burley) composed 45.2 percent,
followed by Virginia, which was 43.1 percent. Native variety comprised 11.8
percent (Figure 14).
12
Figure 14. Tobacco: Percent distribution of production by variety, Philippines,
April-June 2016
Figure 13. Tobacco: Top Producing Regions, Philippines,
April-June 2016
STATISTICAL TABLES
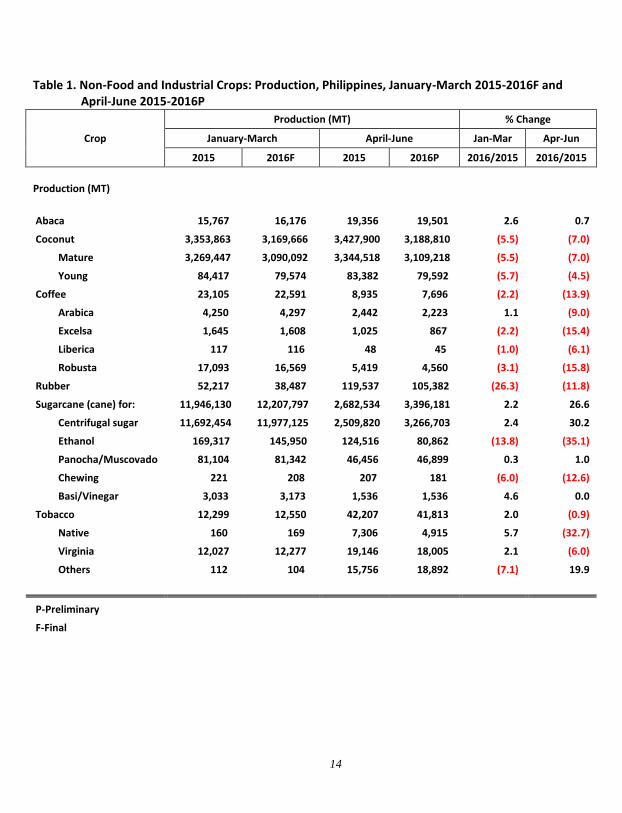
Table 1. Non-Food and Industrial Crops: Production, Philippines, January-March 2015-2016F and April-June 2015-2016P
Crop
Production (MT) % Change
January-March April-June Jan-Mar Apr-Jun
2015 2016F 2015 2016P 2016/2015 2016/2015
Production (MT)
Abaca 15,767 16,176 19,356 19,501 2.6 0.7
Coconut 3,353,863 3,169,666 3,427,900 3,188,810 (5.5) (7.0)
Mature 3,269,447 3,090,092 3,344,518 3,109,218 (5.5) (7.0)
Young 84,417 79,574 83,382 79,592 (5.7) (4.5)
Coffee 23,105 22,591 8,935 7,696 (2.2) (13.9)
Arabica 4,250 4,297 2,442 2,223 1.1 (9.0)
Excelsa 1,645 1,608 1,025 867 (2.2) (15.4)
Liberica 117 116 48 45 (1.0) (6.1)
Robusta 17,093 16,569 5,419 4,560 (3.1) (15.8)
Rubber 52,217 38,487 119,537 105,382 (26.3) (11.8)
Sugarcane (cane) for: 11,946,130 12,207,797 2,682,534 3,396,181 2.2 26.6
Centrifugal sugar 11,692,454 11,977,125 2,509,820 3,266,703 2.4 30.2
Ethanol 169,317 145,950 124,516 80,862 (13.8) (35.1)
Panocha/Muscovado 81,104 81,342 46,456 46,899 0.3 1.0
Chewing 221 208 207 181 (6.0) (12.6)
Basi/Vinegar 3,033 3,173 1,536 1,536 4.6 0.0
Tobacco 12,299 12,550 42,207 41,813 2.0 (0.9)
Native 160 169 7,306 4,915 5.7 (32.7)
Virginia 12,027 12,277 19,146 18,005 2.1 (6.0)
Others 112 104 15,756 18,892 (7.1) 19.9
P-Preliminary F-Final
14
15
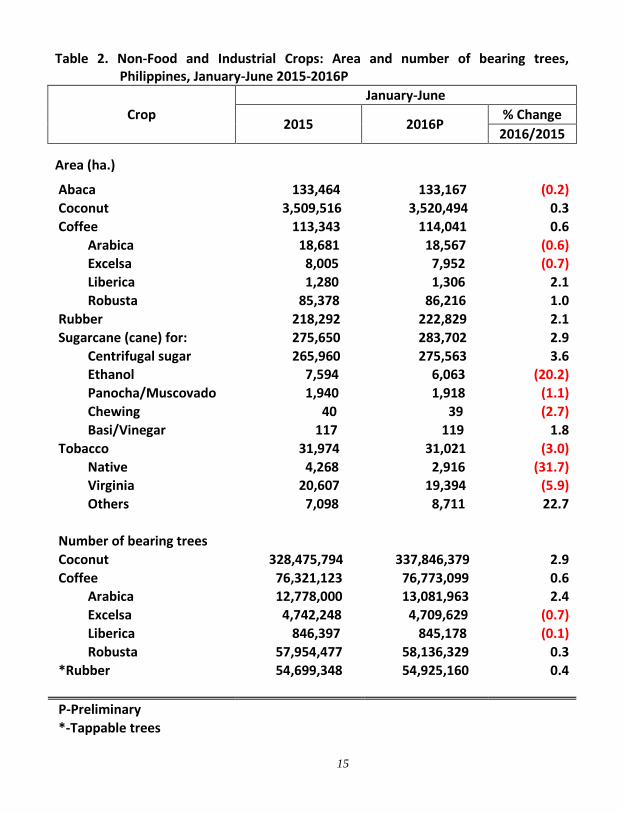
Table 2. Non-Food and Industrial Crops: Area and number of bearing trees, Philippines, January-June 2015-2016P
Crop
January-June
2015 2016P % Change
2016/2015
Area (ha.)
Abaca 133,464 133,167 (0.2)
Coconut 3,509,516 3,520,494 0.3
Coffee 113,343 114,041 0.6
Arabica 18,681 18,567 (0.6) Excelsa 8,005 7,952 (0.7)
Liberica 1,280 1,306 2.1
Robusta 85,378 86,216 1.0
Rubber 218,292 222,829 2.1
Sugarcane (cane) for: 275,650 283,702 2.9
Centrifugal sugar 265,960 275,563 3.6 Ethanol 7,594 6,063 (20.2)
Panocha/Muscovado 1,940 1,918 (1.1)
Chewing 40 39 (2.7)
Basi/Vinegar 117 119 1.8
Tobacco 31,974 31,021 (3.0)
Native 4,268 2,916 (31.7)
Virginia 20,607 19,394 (5.9)
Others 7,098 8,711 22.7
Number of bearing trees Coconut 328,475,794 337,846,379 2.9
Coffee 76,321,123 76,773,099 0.6 Arabica 12,778,000 13,081,963 2.4
Excelsa 4,742,248 4,709,629 (0.7)
Liberica 846,397 845,178 (0.1)
Robusta 57,954,477 58,136,329 0.3
*Rubber 54,699,348 54,925,160 0.4
P-Preliminary *-Tappable trees
16
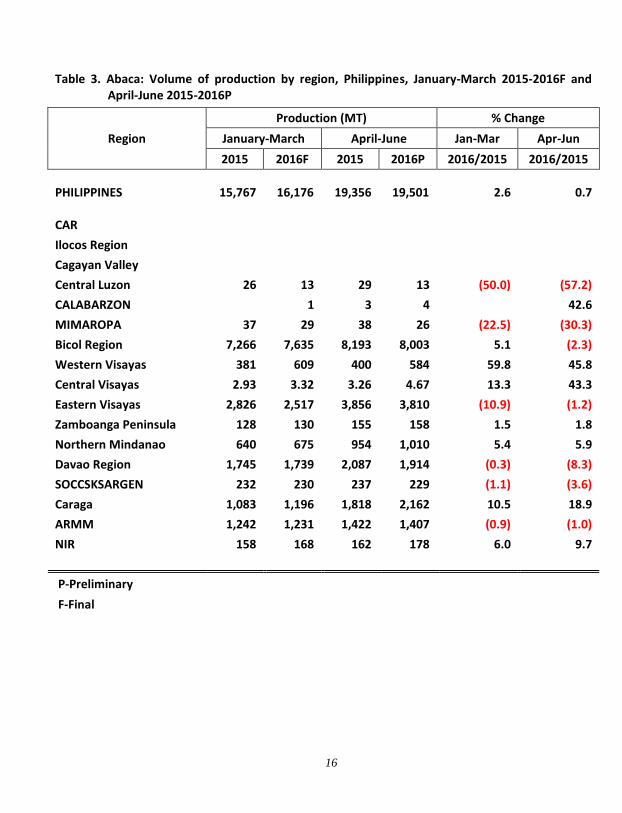
Table 3. Abaca: Volume of production by region, Philippines, January-March 2015-2016F and April-June 2015-2016P
Region
Production (MT) % Change
January-March April-June Jan-Mar Apr-Jun
2015 2016F 2015 2016P 2016/2015 2016/2015
PHILIPPINES 15,767 16,176 19,356 19,501 2.6 0.7
CAR
Ilocos Region
Cagayan Valley
Central Luzon 26 13 29 13 (50.0) (57.2)
CALABARZON
1 3 4
42.6
MIMAROPA 37 29 38 26 (22.5) (30.3)
Bicol Region 7,266 7,635 8,193 8,003 5.1 (2.3)
Western Visayas 381 609 400 584 59.8 45.8
Central Visayas 2.93 3.32 3.26 4.67 13.3 43.3
Eastern Visayas 2,826 2,517 3,856 3,810 (10.9) (1.2)
Zamboanga Peninsula 128 130 155 158 1.5 1.8
Northern Mindanao 640 675 954 1,010 5.4 5.9
Davao Region 1,745 1,739 2,087 1,914 (0.3) (8.3)
SOCCSKSARGEN 232 230 237 229 (1.1) (3.6)
Caraga 1,083 1,196 1,818 2,162 10.5 18.9
ARMM 1,242 1,231 1,422 1,407 (0.9) (1.0)
NIR 158 168 162 178 6.0 9.7
P-Preliminary
F-Final

Table 4. Coconut: Volume of production by region, Philippines, January-March 2015-2016F and
April-June 2015-2016P
Region
Production (MT) % Change
January-March April-June Jan-Mar Apr-Jun
2015 2016F 2015 2016P 2016/2015 2016/2015
PHILIPPINES 3,353,863 3,169,666 3,427,900 3,188,810 (5.5) (7.0)
CAR 237 241 364 365 1.5 0.3
Ilocos Region 10,219 10,169 6,903 7,183 (0.5) 4.0
Cagayan Valley 19,278 17,689 19,673 19,887 (8.2) 1.1
Central Luzon 37,391 13,675 60,043 26,011 (63.4) (56.7)
CALABARZON 243,977 253,574 249,396 291,708 3.9 17.0
MIMAROPA 113,242 101,064 170,758 153,837 (10.8) (9.9)
Bicol Region 259,257 240,030 221,495 208,922 (7.4) (5.7)
Western Visayas 68,072 75,479 70,309 74,140 10.9 5.4
Central Visayas 65,275 64,012 60,284 54,590 (1.9) (9.4)
Eastern Visayas 242,357 220,109 272,130 230,782 (9.2) (15.2)
Zamboanga Peninsula 421,772 411,206 418,180 422,079 (2.5) 0.9
Northern Mindanao 429,296 420,980 441,269 414,919 (1.9) (6.0)
Davao Region 596,539 489,589 573,247 478,004 (17.9) (16.6)
SOCCSKSARGEN 282,160 279,951 273,725 248,556 (0.8) (9.2)
Caraga 179,418 189,757 199,526 183,031 5.8 (8.3)
ARMM 335,766 333,183 308,373 295,830 (0.8) (4.1)
NIR 49,605 48,958 82,225 78,964 (1.3) (4.0)
P-Preliminary
F-Final
Note: The coconut production data in the following provinces are the integrated results of the CrPS and QCPS:
Capiz
Negros Occidental
Bukidnon
Camiguin
Lanao del Norte
Misamis Occidental
Misamis Oriental
Davao del Sur
North Cotabato
Surigao del Sur
17
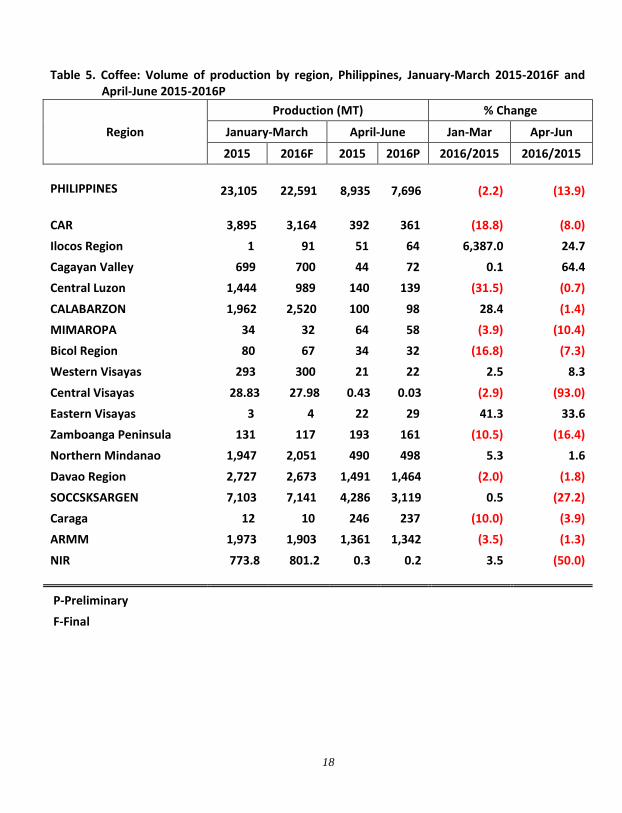
Table 5. Coffee: Volume of production by region, Philippines, January-March 2015-2016F and
April-June 2015-2016P
Region
Production (MT) % Change
January-March April-June Jan-Mar Apr-Jun
2015 2016F 2015 2016P 2016/2015 2016/2015
PHILIPPINES 23,105 22,591 8,935 7,696 (2.2) (13.9)
CAR 3,895 3,164 392 361 (18.8) (8.0)
Ilocos Region 1 91 51 64 6,387.0 24.7
Cagayan Valley 699 700 44 72 0.1 64.4
Central Luzon 1,444 989 140 139 (31.5) (0.7)
CALABARZON 1,962 2,520 100 98 28.4 (1.4)
MIMAROPA 34 32 64 58 (3.9) (10.4)
Bicol Region 80 67 34 32 (16.8) (7.3)
Western Visayas 293 300 21 22 2.5 8.3
Central Visayas 28.83 27.98 0.43 0.03 (2.9) (93.0)
Eastern Visayas 3 4 22 29 41.3 33.6
Zamboanga Peninsula 131 117 193 161 (10.5) (16.4)
Northern Mindanao 1,947 2,051 490 498 5.3 1.6
Davao Region 2,727 2,673 1,491 1,464 (2.0) (1.8)
SOCCSKSARGEN 7,103 7,141 4,286 3,119 0.5 (27.2)
Caraga 12 10 246 237 (10.0) (3.9)
ARMM 1,973 1,903 1,361 1,342 (3.5) (1.3)
NIR 773.8 801.2 0.3 0.2 3.5 (50.0)
P-Preliminary F-Final
18
19
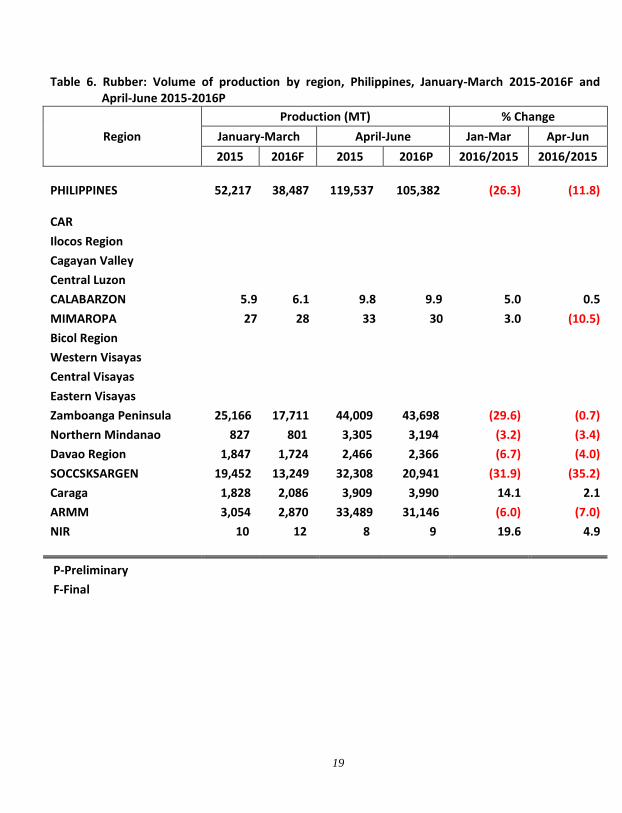
Table 6. Rubber: Volume of production by region, Philippines, January-March 2015-2016F and April-June 2015-2016P
Region
Production (MT) % Change
January-March April-June Jan-Mar Apr-Jun
2015 2016F 2015 2016P 2016/2015 2016/2015
PHILIPPINES 52,217 38,487 119,537 105,382 (26.3) (11.8)
CAR Ilocos Region Cagayan Valley Central Luzon CALABARZON 5.9 6.1 9.8 9.9 5.0 0.5
MIMAROPA 27 28 33 30 3.0 (10.5)
Bicol Region Western Visayas Central Visayas Eastern Visayas Zamboanga Peninsula 25,166 17,711 44,009 43,698 (29.6) (0.7)
Northern Mindanao 827 801 3,305 3,194 (3.2) (3.4)
Davao Region 1,847 1,724 2,466 2,366 (6.7) (4.0)
SOCCSKSARGEN 19,452 13,249 32,308 20,941 (31.9) (35.2)
Caraga 1,828 2,086 3,909 3,990 14.1 2.1
ARMM 3,054 2,870 33,489 31,146 (6.0) (7.0)
NIR 10 12 8 9 19.6 4.9
P-Preliminary F-Final
20
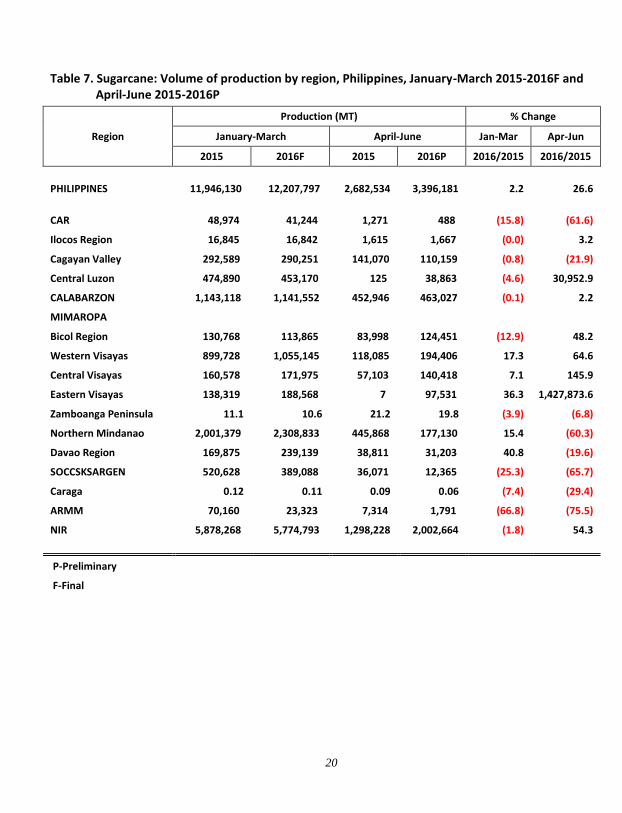
Table 7. Sugarcane: Volume of production by region, Philippines, January-March 2015-2016F and April-June 2015-2016P
Region
Production (MT) % Change
January-March April-June Jan-Mar Apr-Jun
2015 2016F 2015 2016P 2016/2015 2016/2015
PHILIPPINES 11,946,130 12,207,797 2,682,534 3,396,181 2.2 26.6
CAR 48,974 41,244 1,271 488 (15.8) (61.6)
Ilocos Region 16,845 16,842 1,615 1,667 (0.0) 3.2
Cagayan Valley 292,589 290,251 141,070 110,159 (0.8) (21.9)
Central Luzon 474,890 453,170 125 38,863 (4.6) 30,952.9
CALABARZON 1,143,118 1,141,552 452,946 463,027 (0.1) 2.2
MIMAROPA
Bicol Region 130,768 113,865 83,998 124,451 (12.9) 48.2
Western Visayas 899,728 1,055,145 118,085 194,406 17.3 64.6
Central Visayas 160,578 171,975 57,103 140,418 7.1 145.9
Eastern Visayas 138,319 188,568 7 97,531 36.3 1,427,873.6
Zamboanga Peninsula 11.1 10.6 21.2 19.8 (3.9) (6.8)
Northern Mindanao 2,001,379 2,308,833 445,868 177,130 15.4 (60.3)
Davao Region 169,875 239,139 38,811 31,203 40.8 (19.6)
SOCCSKSARGEN 520,628 389,088 36,071 12,365 (25.3) (65.7)
Caraga 0.12 0.11 0.09 0.06 (7.4) (29.4)
ARMM 70,160 23,323 7,314 1,791 (66.8) (75.5)
NIR 5,878,268 5,774,793 1,298,228 2,002,664 (1.8) 54.3
P-Preliminary
F-Final
21
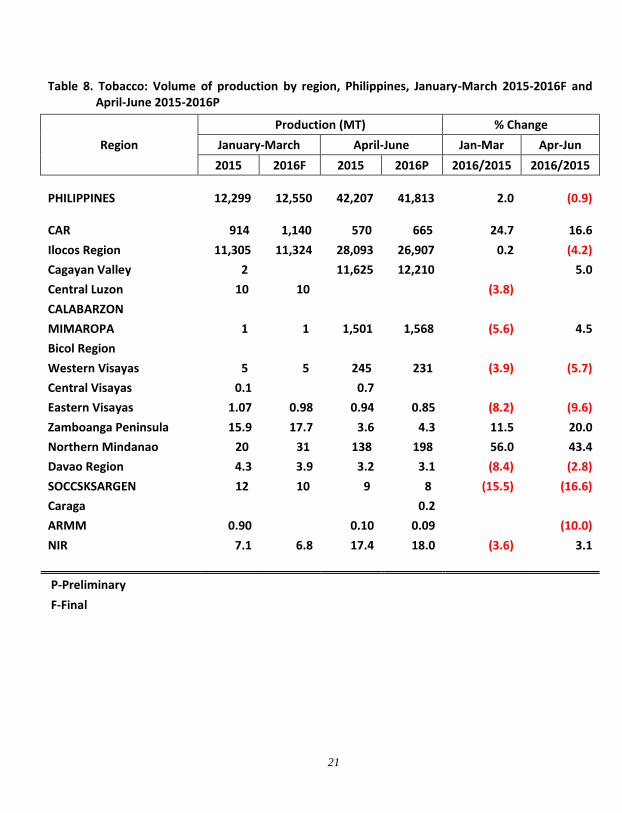
Table 8. Tobacco: Volume of production by region, Philippines, January-March 2015-2016F and April-June 2015-2016P
Region
Production (MT) % Change
January-March April-June Jan-Mar Apr-Jun
2015 2016F 2015 2016P 2016/2015 2016/2015
PHILIPPINES 12,299 12,550 42,207 41,813 2.0 (0.9)
CAR 914 1,140 570 665 24.7 16.6
Ilocos Region 11,305 11,324 28,093 26,907 0.2 (4.2)
Cagayan Valley 2
11,625 12,210
5.0
Central Luzon 10 10
(3.8)
CALABARZON
MIMAROPA 1 1 1,501 1,568 (5.6) 4.5
Bicol Region
Western Visayas 5 5 245 231 (3.9) (5.7)
Central Visayas 0.1
0.7
Eastern Visayas 1.07 0.98 0.94 0.85 (8.2) (9.6)
Zamboanga Peninsula 15.9 17.7 3.6 4.3 11.5 20.0
Northern Mindanao 20 31 138 198 56.0 43.4
Davao Region 4.3 3.9 3.2 3.1 (8.4) (2.8)
SOCCSKSARGEN 12 10 9 8 (15.5) (16.6)
Caraga
0.2
ARMM 0.90
0.10 0.09
(10.0)
NIR 7.1 6.8 17.4 18.0 (3.6) 3.1
P-Preliminary
F-Final

If you want to know more about these statistics write or call Crops Statistics Division
(02) 376-2022 PSA Website: http//www.psa.gov. ph