Embed Size (px)
Citation preview
1
Philanthropy, Inequality, and the Income Tax:
High-Income Giving in the United States 1917-2014
Nicolas J. Duquette
University of Southern California Sol Price School of Public Policy
650 Childs Way, Los Angeles 90089 [email protected]
February 19, 2017
PRELIMINARY DRAFT. PLEASE DO NOT CITE OR CIRCULATE WITHOUT CONTACTING THE AUTHOR FIRST.
Abstract
Standard historical narratives and the predictions of economic theory both hold that income inequality will increase the share of high-income households’ income given to charity. Yet from 1917 to 2014, the share of income given to charity by high-income households in the USA has generally moved inversely with income inequality. Giving data from tax return aggregates, cross-sectional micro data, and charities’ reported receipts all confirm that after conditioning on other explanatory variables, greater income inequality is strongly associated with lower generosity at the very top. Histories focused on the actions of the most generous or influential philanthropists do not capture dramatic shifts in the giving of high-income households as a group.
Keywords : Philanthropy, charity, inequality, taxation, American history
JEL Classification : D31; D64; H23; N32
Acknowledgements: This research was generously supported by the USC Center on Philanthropy and Public Policy. The author is grateful for helpful comments and suggestions from University of Victoria, the National Tax Association, the Michigan Tax Invitational, and USC, particularly Eric J. Allen, Suthirtha Bagchi, Jon Bakija, Estelle Dauchy, Jonathan Eyer, Christine L. Exley, Jim Ferris, Brian Galle, Alexandra Graddy-Reed, David Harris, Jim Hines, Jeff Hoopes, Edward Kleinbard, Ben Marx, Dan Mazmanian, Abigail Payne, Mark Phillips, Joel Slemrod, Caroline Weber, and Julie Zizzimopolous. Excellent research assistance was provided by Yusun Cho , Michael George and Rachel Huguet.
2
Traditional theories of philanthropy, both in economic theory and and in the writings of
figures like Andrew Carnegie, treat the giving of the rich as an egalitarian choice of the very rich
to bring down extreme inequality. In these tellings, philanthropy is simultaneously elite and
egalitarian — public goods paid for by the rich make consumption inequality lower than income
inequality, and when income inequality goes up, philanthropy dampens its impact by increasing
the giving of the rich as a share of their heightened incomes.
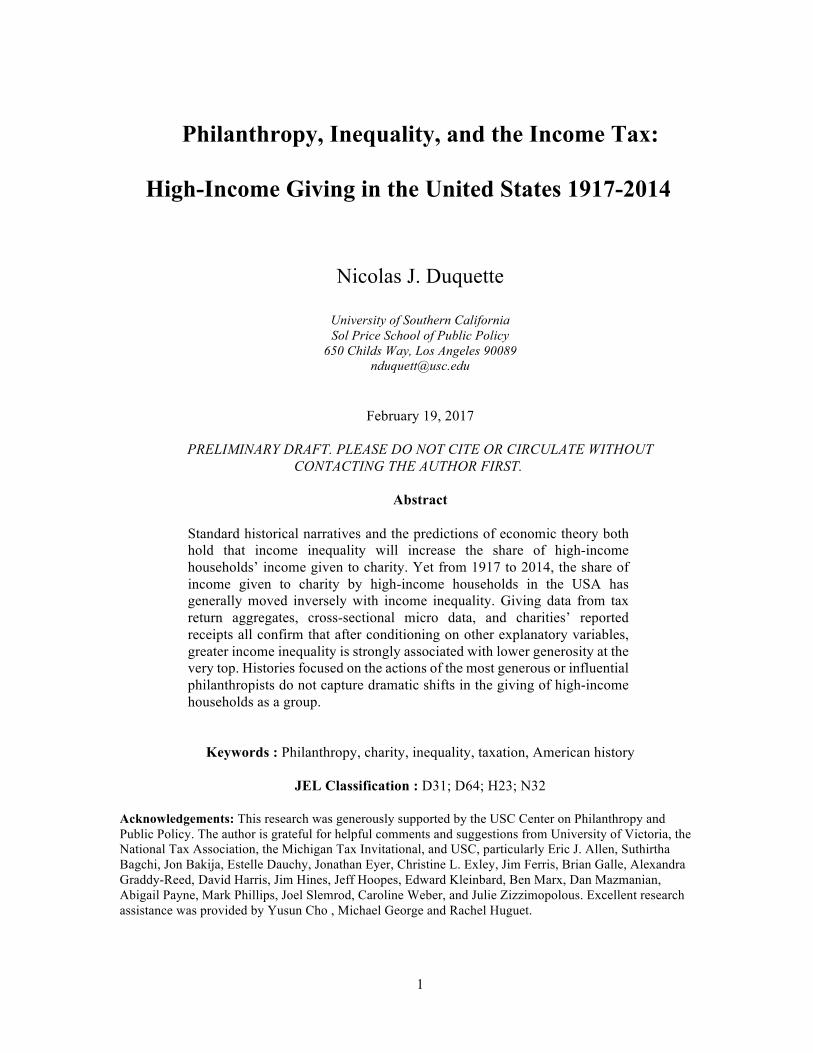
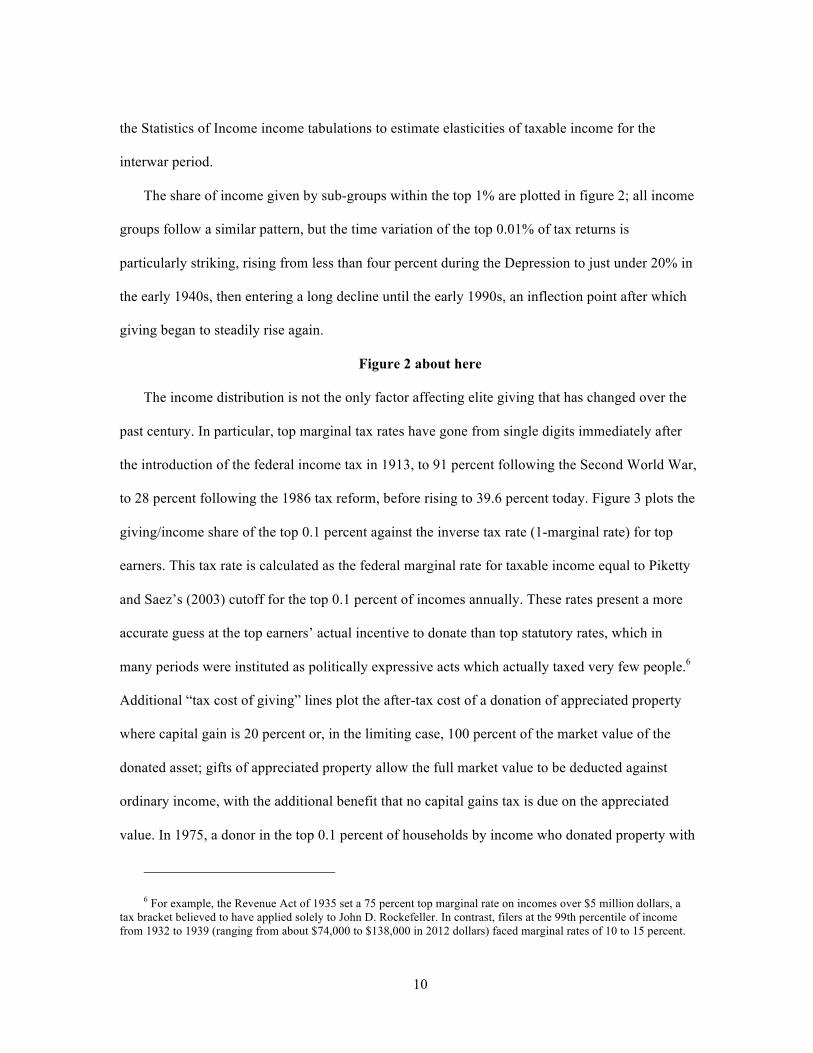
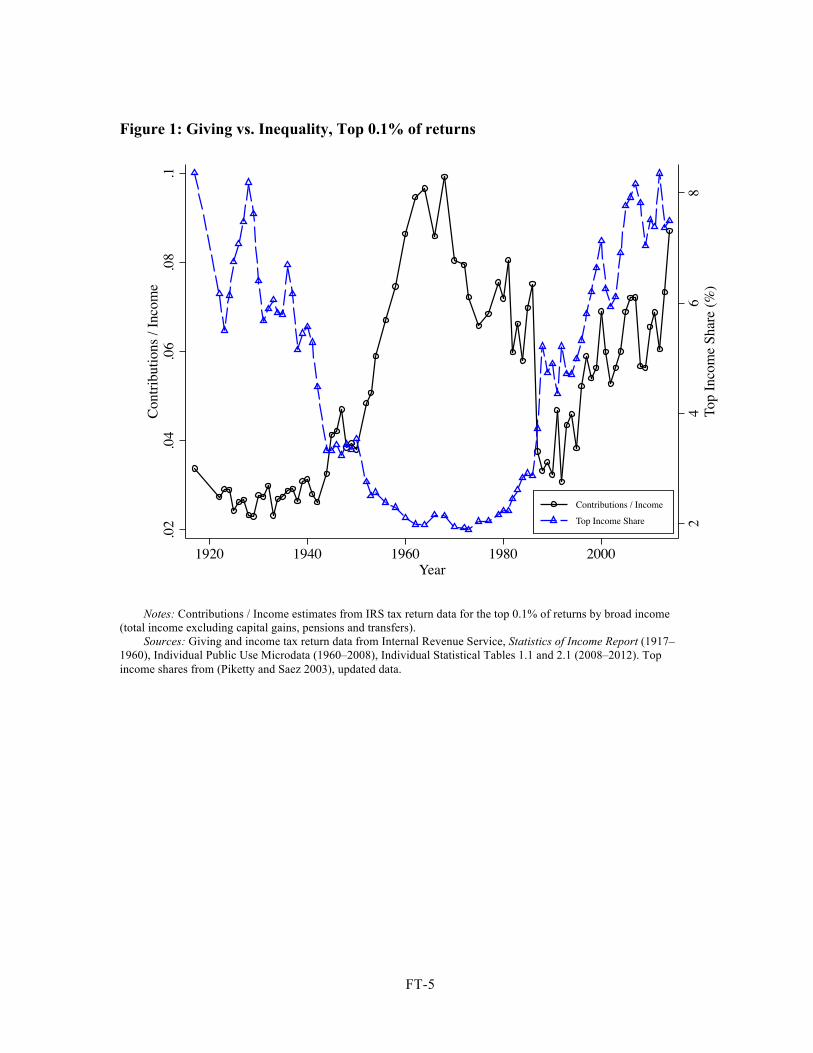
The data contradict this story. Higher income inequality is associated with reduced giving by
the rich. Figure 1 plots the share of income declared as charitable contributions by the top 0.1
percent of the income distribution from 1917 to 2014 against the total share of income flowing to
this group (Piketty and Saez 2003). When inequality is high, as in the interwar years and the last
two decades, giving as a share of income is low. On the other hand, when inequality was low in
the period following the Second World War, the rich gave a very high share of their incomes to
charity. This pattern of inverse movements is obvious until approximately 1995, when
contributions as a share of income begin to rise, though at a slower pace than rapidly surging top
income share.
Figure 1 about here
Income inequality is not the only area of social change since 1917. The rich gave to charity
under changing tax incentives and very different business cycle conditions over this period.
Nonetheless, even after controlling for tax policy and economic conditions, this paper presents an
assortment of empirical evidence finding a negative association between the charitable giving of
high-income households and income inequality. Though leading figures of philanthropy like
Andrew Carnegie and John Rockefeller are rightfully commended in the historical record for their
generous legacies, the data demonstrate that the very rich as a whole have given less when
inequality has been high than when it has been low.
3
This paper makes two contributions of general interest to economists and economic historians.
First, it calculates annual charitable giving data series at the national level for most years over a
98-year span, as well as state-level data for selected periods for the first time. Second, this paper
quantifies the association between inequality and elite philanthropy. These descriptive exercises
are incompatible with a positive causal effect of inequality on giving. To the extent that high-
income households have been less generous when inequality has been high, that means the
striking inequality plots of, for instance, Piketty and Saez (2013) actually understate the
fluctuations over time in the consumption and saving share of high-income households.
1 Existing Literature of Inequality and Philanthropy
Inequality and the giving of the rich have long been areas of interest in scholarly and popular
discourse, and these areas are only attracting more attention, as growing income disparities and
controversial giving choices of the very rich continue to expand. Despite the long and broad
history of economic literature on the subject, however, almost all commentators have either put
forth models of elite behavior that explicit rising income shares will be spent on philanthropy
A growing body of research quantifies the economic history of inequality of income (for the
United States, see Lindert and Williamson 1985, 2013, 2016, Lindert 2000, Piketty and Saez
2003, Piketty 2014, Stelzner 2015) and inequality of wealth (Saez and Zucman 2016). The details
of these estimates have been disputed, in particular whether the definitions of income chosen are
appropriate and consistent over time, and methodological choices in deducing wealth inequality
from flawed sources such as estate returns and income flows (need permission to cite). However,
everybody writing in this literature agrees qualitatively on the broad trends: economic inequality
in the United States was higher in the early 20th and 21st centuries than in the mid-20th century,
with a turning point sometime in the late 1970s or 1980s.
4
Explaining the underlying causes of these broad inequality trends has been given urgency by a
growing belief that, conditional on the same level of national income, inequality leads to greater
social dysfunction, lower social mobility, and degrated political institutions. One explanation
holds that high-income households naturally accrue power because of gaps between capital
returns and economic growth (Piketty 2014), while others have argued that inequality is wholly
driven by changes in returns to housing (Rognlie 2015).
A separate literature asks whether and how much income inequality actually matters for
inequality of quality of life. It is a well-known styilized fact that the savings rate is increasing in
income, and therefore consumption inequality is lower than income inequality (See Kruger and
Perri 2006, fig.1). Similarly, the philanthropy and charitable giving of the rich should reduce
effective inequality. When rich households give money away, they those resources neither
increase consumption at the top (as if they had used the funds on themselves), nor wealth
inequality (as if they had just banked it). To the extent that philanthropy pays for public goods,
like medical research, that raise the quality of life for all, inequality is further reduced. And so if
one presumes that philanthropy, being a luxury good, increases in income, then the giving of the
rich should reduce effective inequality.
That philanthropy works against income inequality is an old and venerable notion in
philanthropic thought. Andrew Carnegie, in his “Gospel of Wealth,” argued that the philanthropy
of the very rich was “the true antidote for the temporary unequal distribution of wealth,” and that
it was not only better for the rich to spend their wealth on public amenities than to make cash
grants to the poor, but also that
… Even the poorest can be made to see this, and to agree that great sums gathered by some of their fellow-citizens and spent for public purposes, from which the masses reap the principal benefit, are more valuable to them than if scattered among them through the course of many years in trifling amounts (Carnegie 1901, pp. 12–13).
5
A dynamic version of this argument was made more recently by Acs, who summarizes
Carnegie and several other philanthropists, old and modern, who saw their philanthropic activity
as far more useful than writing checks to the poor or to poverty relief organizations (Acs 2013, ch.
4). Acs argues that the philanthropy of the elite not only reduced inequality of consumption
directly — by giving money away — but also dynamically fostered economic growth and mass
prosperity through the activity of endowed educational and research institutions.1
Formal economic theory agrees with Acs. Canonical economic models describe charitable
giving as a voluntary gift to a nonrival, nonexcludable good. The headline result of these models
has been the insensitivity of total public good provision to the distribution of income (Samuelson
1954; Warr 1983), with one important exception: redistribution from poor households (who do not
contribute to the nonrival good) to rich households (who do) can increase total giving (Bergstrom
et al. 1986). But these theories also imply that when inequality is higher, giving by the very rich
should increase; Bergstrom et al. (1986) show that a transfer from (poor) non-contributors to
(rich) contributors will increase voluntary giving, because the non-contributor cannot give less
than zero, and so is forced to reduce consumption instead, while the donor class gives some of
their additional resources. 2 Less restrictive models, such as James Andreoni’s (1990) theory of
“warm glow” utility for making a gift, do not change the prediction that less equal distributions of
resources lead to weakly greater total giving, particularly at the high end.
There is also a historical counternarrative that argues against the value of the philanthropy of
the rich, but its criticism is focused on the causes philanthropists choose to give to, or their
1 To be fair to the philanthropic sector, the more paternalistic slant to Carnegie’s thought is now rejected by some large foundations’ articulation of their values. For example, in a recent speech Darren Walker, president of the Ford Foundation, explicitly acknowledged that the poor might have had a better idea of their own needs and opportunities than Carnegie did. See Walker, Oct 1 2015, “Toward a New Gospel of Wealth.”
2 Strictly speaking, Bergstrom et al. show that an equalizing redistribution from (wealthier) contributors to (poorer) non-contributors decreases public good provision, but the contrapositive follows.
6
ulterior motives for doing so. In general, critics of elite philathropy implicitly accept the premise
that this giving does actually happen. Peter Dobkin Hall documents that this tradition harks back
to the populist anti-institutionalism of early America; early New England nonprofits were viewed
as extensions of the state and blended elements of public agencies, private voluntary associations,
and for-profit firms; in the South, incorporated entities generally were viewed with deep suspicion
by the small, well-connected planter class — post-revolutionary Virginia actually repealed the
Statute of Charitable Uses it inherited from English law and dissolved the Anglican church and
seized its assets. For these reasons, the legal and institutional basis of the modern private and
philanthropic foundation did not take shape until the 1890s, when the holders of vast Gilded Age
fortunes needed instruments to carefully distribute their vast wealth to charitable causes. Critics of
Carnegie and Rockefeller accused them of using philathropy to whitewash fearful reputations
acquired through aggressive market power consolidation and brutal labor practices.3 In the 1950s
and 1960s, criticism took the form of widespread skepticism of the uses and intentions of gifts to
large foundations, eventually culminating in a set of regulatory and disclosure mandates and
excise taxes levied only on foundations by the 1969 tax reform. In The Power Elite (1957), to take
one example, C. Wright Mills claimed that foundations largely existed to hold company stock in a
single vehicle after the founder’s death, keeping company control in the hands of the rich heirs
(1956, pp. 154-5), a charge that eventually led to Congressional hearings and new regulations on
foundation’s governance and payout requirements in 1969.4 Modern usages such as “nonprofit
sector” or “third sector” that link family foundations, large endowed nonprofits, and tiny
voluntary associations and churches into a sector conceptually distinct from business and
3 In hindsight, this attack on their motives appears largely false — whatever the ethics of these men’s acquisition of staggering wealth, internal documents seem to suggest their desire to give it away were sincere.
4 On the other hand, this attack on foundations-as-family-corporate-trusts seems to have been true in many instances.
7
government are neologisms coined in the late 1970s following 25 years of heated legal and
legislative battles over whether such groups could truly serve the public good independent of their
benefactors’ interests (Hall 1992, 2006; Zunz 2012). Today, it remains common for well-known
journalists, academics, and writers to assail the philanthropic programs of the rich: for example, in
August 2016 essayist Malcolm Gladwell called giving to elite universities “a moral crime”
(Business Insider 2016, Chronicle of Philanthropy 2017). Yet while it is easy to find critics who
argue in surprisingly blunt language that the very rich give their money away unwisely or to serve
their own interests, surprisingly few question the premise that the rich do in fact give away large
shares of their income.
Very little scholarly literature asks this question either. Robert Putnam (2000) and Gabrielle
Fack and Camille Landais (2010) compute high-income giving/income ratios similar to those
presented in figure 1 in their studies of social cohesion and tax evasion, respectively, but only in
passing before turning to their main topics of interest.5 The only paper to deliberately test for links
between inequality and giving in naturally occurring data is Payne and Smith (2015), who find
that that increases in neighborhood-level inequality from 1991 to 2006 are positively associated
5 Putnam’s and Fack and Landais’s estimates of high-earner giving ratios differ from each other and from the those presented in this paper in important ways — most notably, this paper finds that high-income giving/income rose steadily after a postwar minimum in 1992, while Fack and Landais and Putnam both find giving/income ratios to be relatively flat in later years. However, all three sets of estimates depict the same pattern of giving rising rapidly after the Second World War, peaking in the 1960s, and then declining substantially.
The differences between the estimates presented in this paper and those calculated by Fack and Landais (2010) appear to be driven by the way the IRS data handle giving reported but not deductible giving in the same year. The IRS binned income data report totals for itemized contributions, but for privacy reasons, the Public Use Files cross-sectional data censor giving variables at the deductible maximum beginning in 1993, which means that to the extent very high income households have to carry over their contribution deduction to future tax years, aggregates calculated from micro data systematically underestimate total giving. This paper uses the IRS binned data to adjust the micro data for this censored giving; Fack and Landais appear to calculate giving/income without this adjustment in the post-1993 period; doing so gives a contributions/income path post-1993 that looks much closer to their findings. To put it another way, the divergence between the results in this paper and those in Fack and Landais (2010) reflect the growing importance of contributions by very high income households giving over the AGI limits. See the methodology reported in the data appendix.
Putnam (2000, ch.7, figure 31) presents estimates of giving as a share of income from 1930 to 1998 compiled from a variety of sources, including both tax data and survey data. His broad findings are consistent with those presented here.
8
with total charitable giving in Canada, although with important nonlinearities and interactions.
Most papers to address inequality and giving directly have done so in laboratory experiments
where players participate in a public goods game with unequal resources. These experiments have
found that greater inequality decreases total contributions, contrary to the predictions of the
Bergstrom et al. model (Chan et al. 1996; Buckley and Croson 2006). This effect is driven by
behavioral interactions between income and inequality; when endowments are randomized, the
players randomly awarded more funds give lower shares of income to the public goods (Anderson
et al. 2008; Chan et al. 2008).
The relative distribution of income is, of course, not the only influence on the giving of the
rich. Absolute income is important. Tax rates are also important because, in the American income
tax system, they determine the “price” of giving to charity. Itemizing taxpayers (including almost
all high-income households) can make contributions with pre-tax income, and higher marginal tax
rates imply lower foregone after-tax consumption for a given pre-tax donation. The consensus of
this literature is that the tax price elasticity of charitable contributions is about -1, though
estimates do vary (see discussion and references in Peloza and Steel 2005, Bakija and Heim 2011,
and Duquette 2016).
Another vein of literature has examined the political economy connecting crises and the size
of the state (which both increases marginal income tax rates and provision of social services
which may crowd out private philanthropy). Income inequality, and its associations with taxation
and the welfare state, has been well documented (Higgs 1985; Londoño-Vélez 2014; Scheve and
Stasavage 2016). First, if tax policy changes in policy are path-dependent, then philanthropic
expectations about long-run government spending and taxation will shift with policy (Higgs
1985). Second, the income tax has gradually become the principal revenue instrument of
American government over this period, displacing the local property tax, with the charitable
9
deduction form taxable income available with only minor changes since 1917 (Wallis 2000).
Third, changes in inequality and taxation affect the level and scope of public services. For
example, public expenditures on public services is negatively associated with inequality (Lindert
2004, Boustan et al. 2012). Though the causes eligible for tax-deductible contributions has
scarcely changed since 1917, social needs for contributions to those causes, and the incentives for
giving, have changed substantially over the past century.
2 Empirical associations between inequality and philanthropy
This section will look for observed relationships between philanthropy and inequality in
individual tax return data. Even after controlling for tax incentives, absolute incomes, and other
covariates, the association between income inequality and charitable giving is robustly negative.
2.1 Data and Basic Findings
Before proceeding to regression analysis, I present basic findings on the relationship between
inequality and giving. Historical charitable giving of high-income households is estimated using
the Statistics of Income annual statistical reports (Internal Revenue Service 1917–1953, 1954–
1960). These reports tabulate the itemized contributions reported by income class starting in 1917,
the first tax year with a charitable giving deduction, continuing annually with some gaps. These
income-group tallies are converted to giving totals by income fractiles using standard fitting
techniques and careful adjustments. The details of this data construction are covered in the
appendix. However, the broad strokes of this approach should be clear to those who have been
following the recent literature on inequality, as it’s quite similar to the methods used by Piketty
and Saez (2003) to recover top income shares from these same data. Romer and Romer (2014) use
10
the Statistics of Income income tabulations to estimate elasticities of taxable income for the
interwar period.
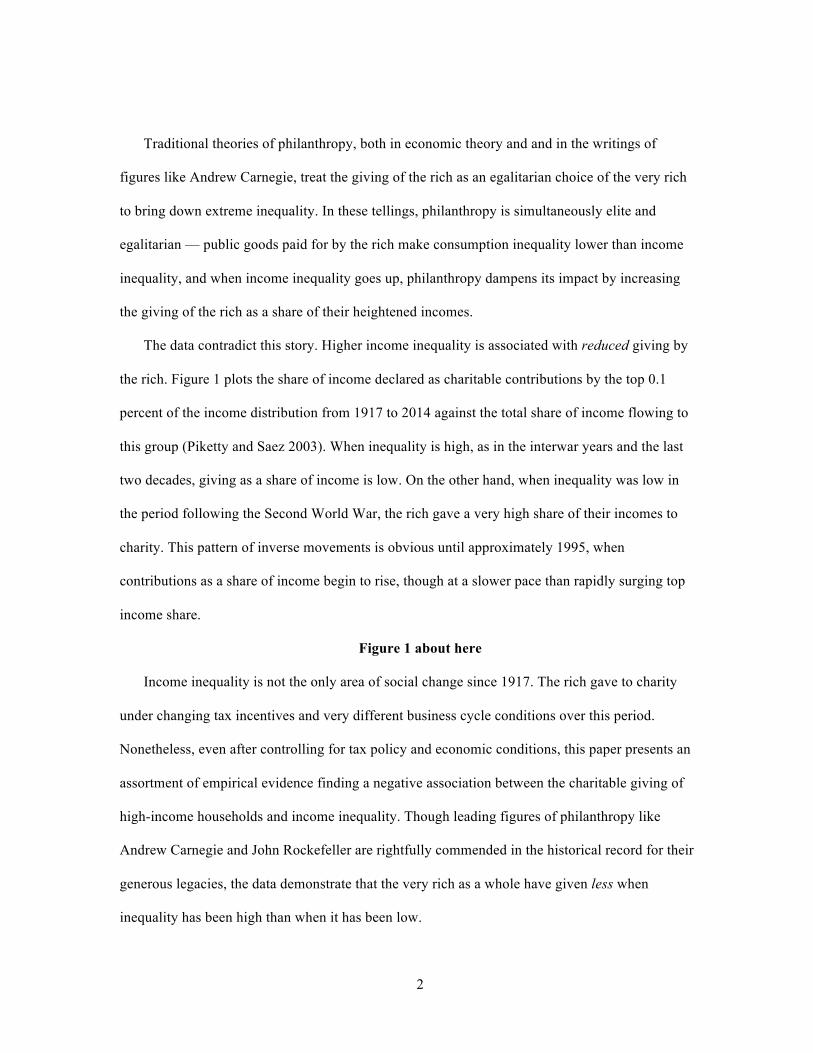
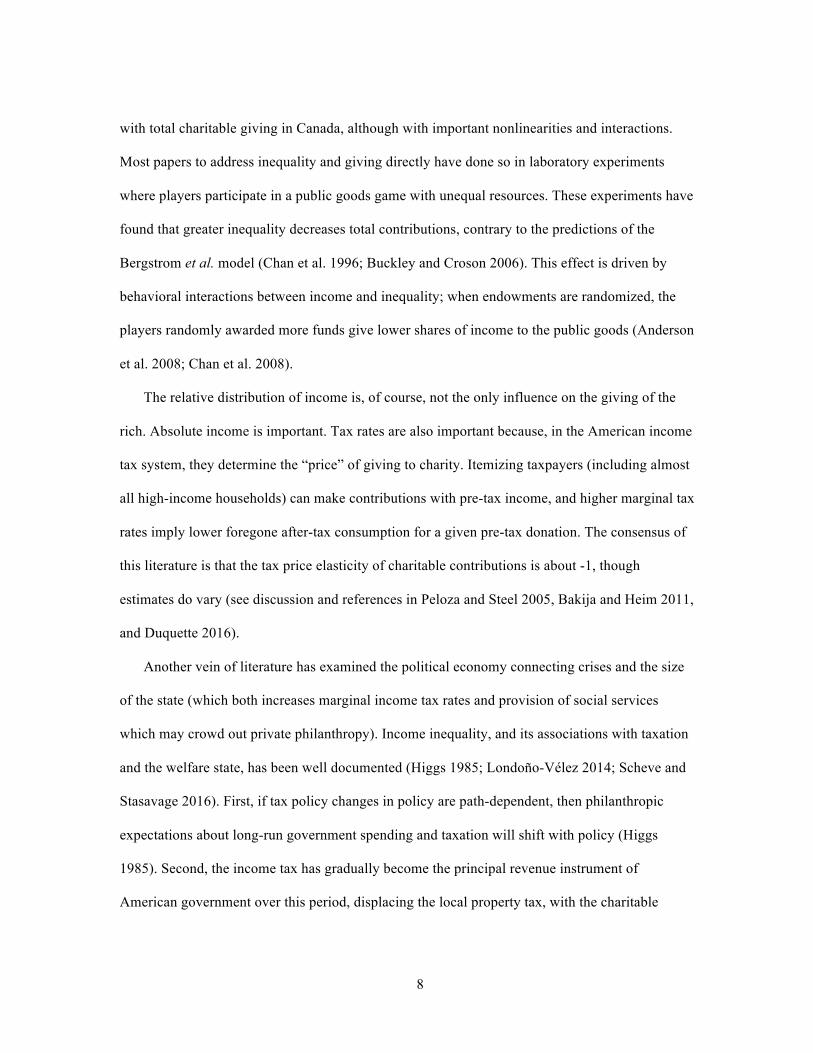
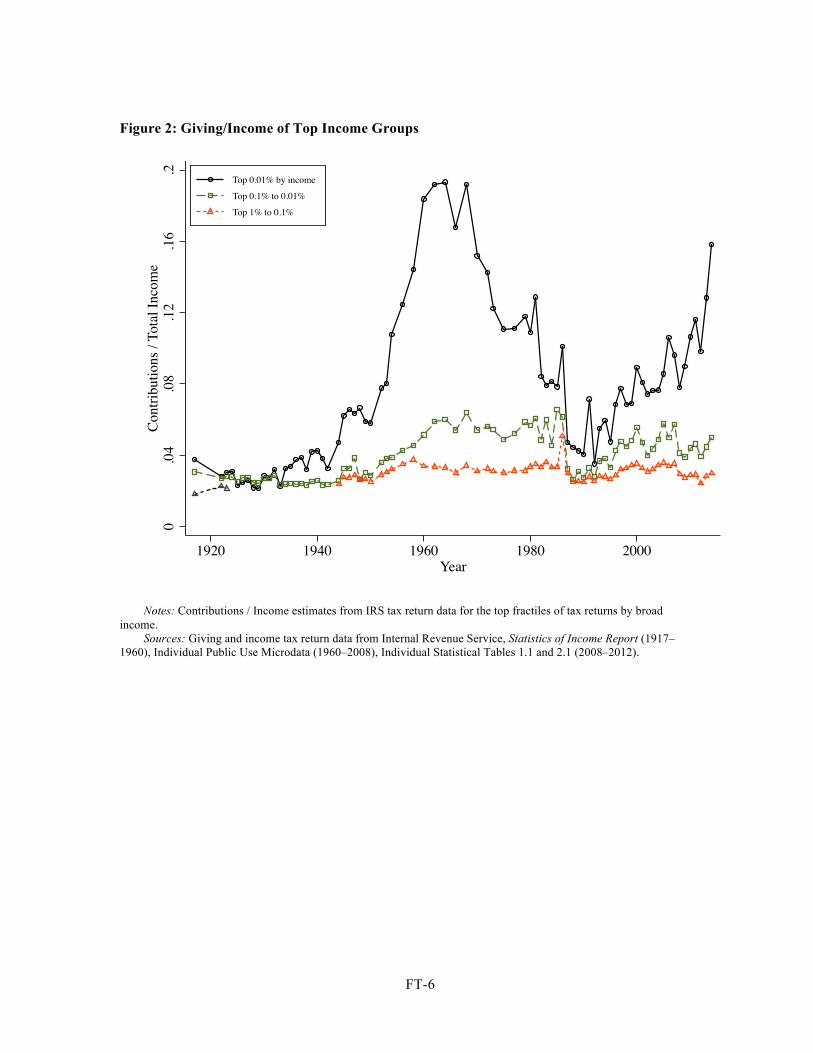
The share of income given by sub-groups within the top 1% are plotted in figure 2; all income
groups follow a similar pattern, but the time variation of the top 0.01% of tax returns is
particularly striking, rising from less than four percent during the Depression to just under 20% in
the early 1940s, then entering a long decline until the early 1990s, an inflection point after which
giving began to steadily rise again.
Figure 2 about here
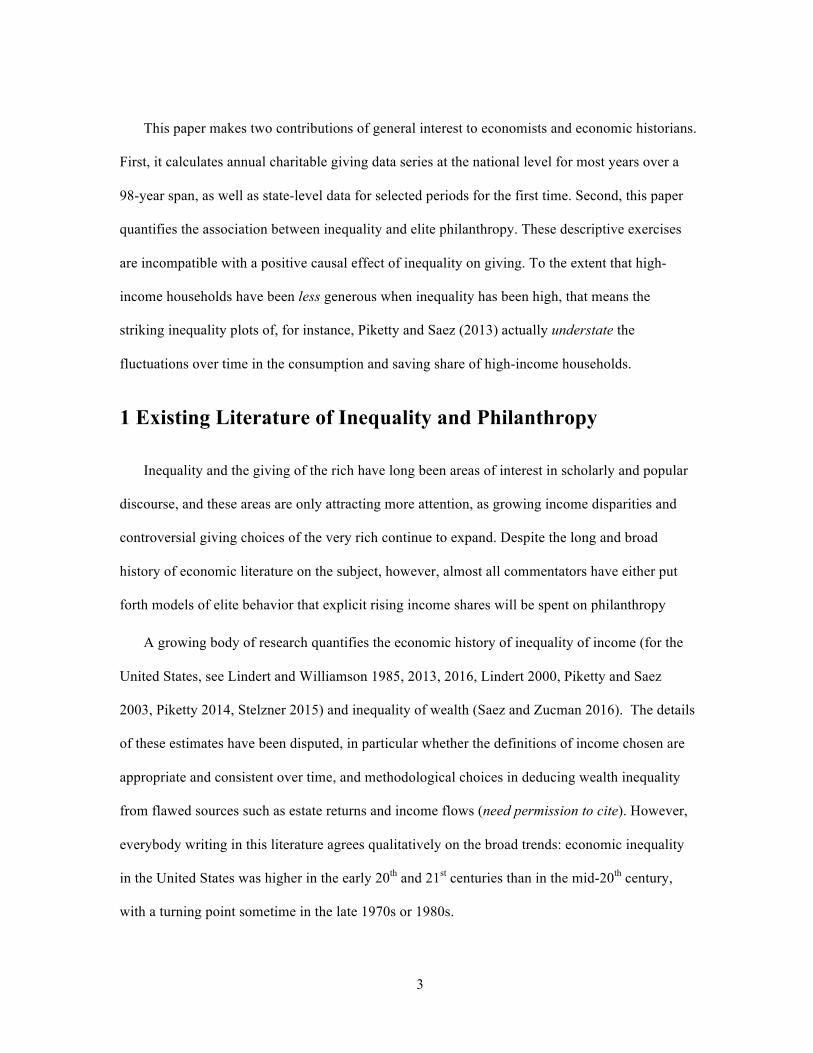
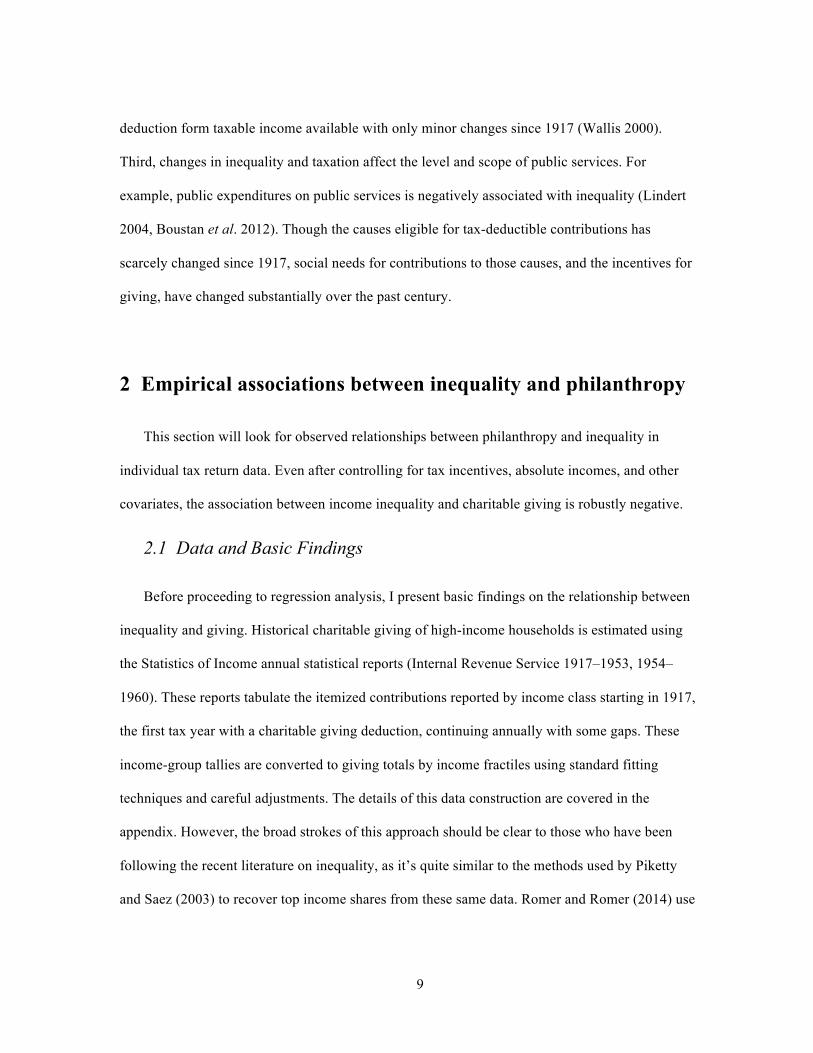
The income distribution is not the only factor affecting elite giving that has changed over the
past century. In particular, top marginal tax rates have gone from single digits immediately after
the introduction of the federal income tax in 1913, to 91 percent following the Second World War,
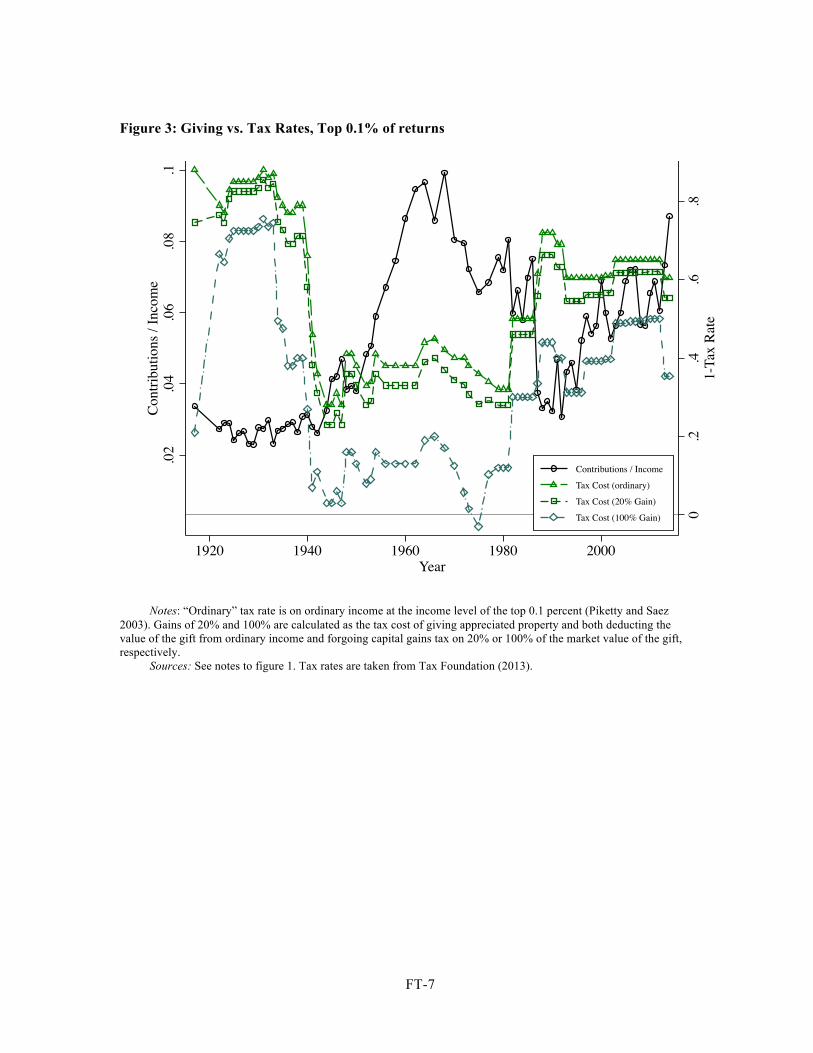
to 28 percent following the 1986 tax reform, before rising to 39.6 percent today. Figure 3 plots the
giving/income share of the top 0.1 percent against the inverse tax rate (1-marginal rate) for top
earners. This tax rate is calculated as the federal marginal rate for taxable income equal to Piketty
and Saez’s (2003) cutoff for the top 0.1 percent of incomes annually. These rates present a more
accurate guess at the top earners’ actual incentive to donate than top statutory rates, which in
many periods were instituted as politically expressive acts which actually taxed very few people.6
Additional “tax cost of giving” lines plot the after-tax cost of a donation of appreciated property
where capital gain is 20 percent or, in the limiting case, 100 percent of the market value of the
donated asset; gifts of appreciated property allow the full market value to be deducted against
ordinary income, with the additional benefit that no capital gains tax is due on the appreciated
value. In 1975, a donor in the top 0.1 percent of households by income who donated property with
6 For example, the Revenue Act of 1935 set a 75 percent top marginal rate on incomes over $5 million dollars, a tax bracket believed to have applied solely to John D. Rockefeller. In contrast, filers at the 99th percentile of income from 1932 to 1939 (ranging from about $74,000 to $138,000 in 2012 dollars) faced marginal rates of 10 to 15 percent.
11
a cost basis of $0 would actually receive more money from the total value of the tax savings than
from the after-tax proceeds of a sale, and the 100% gain tax cost of giving is therefore less than
zero; however, this situation is likely to have applied to very few people.
Figure 3 about here
The links between giving and taxation are clear. During the interwar period, when marginal
rates were generally low, high-income households gave relatively little of their income. When tax
rates rose during the war, they were followed by steadily increasing giving over the 1950s,
leading to a plateau of very high generosity (and relatively high marginal rates) over the period
1960–1985. This situation changed abruptly when the Tax Reform Act of 1986 greatly reduced
marginal rates as part of a deep tax code reform. Giving shot up in 1986 (the last year to take a
deduction against high tax rates), plunged in the following years, and then began to rise gradually
again in the late 1990s, with an acceleration in 2014. The Pearson correlation coefficient between
ordinary tax price of giving and giving/income is -0.58.
But the relationship with top income shares is nearly as strong as the one with tax price. The
interwar period and the post-1986 period are marked by higher inequality than the immediate
postwar era, and similarly notable for low giving. On the other hand, giving is high in the postwar
period, when inequality is low. The postwar rise in giving ratios is not attributable to changes in
tax rates, which were largely stable for twenty years after the war, but is associated with
increasing equality of the postwar middle-class boom. The correlation coefficient between the
giving/income and top income share time series is -0.41.7
7 Major tax reforms also changed the composition of the tax base in important ways through both regulatory changes and incentives to reclassify income. In particular, 1986 moved income that had previously been taxed as corporate onto household returns. Future drafts of this paper will consider to what extent this is important.
12
Because these three variables change in clear phases, and all three are interrelated, it’s
difficult to visually disentangle the mutual correlations.8 Next, I will use multivariate regression to
explore changes in giving behavior relative to correlates simultaneously.
2.2 Regression Results Using High-Income Fractiles
I estimate associations between charitable giving, tax rates, and inequality from IRS historical
income tax aggregates. The IRS Statistics of Income division has published tabulations of total
itemized contributions by income class in its annual statistical reports since the deduction was first
created in 1917, with some gaps.9 Because the income tax focused on the top earners prior to the
Second World War, the information available is of the best quality for the highest earners. From
these tabulations, I estimate the total dollar contributions made by top ten-thousandths of tax units
within the top thousandth (that is, the top 0.01%, the top 0.02-0.01%, …, top 0.10-0.09%) and
then by thousandths within the rest of the top one percent (so the top 0.2-0.1%, …, top 1% to
0.9%). The details of this estimation are reported in the appendix; because the standard deduction
was not introduced until 1944, and because after that almost all high-income tax returns still
itemized their contributions, estimation of giving from historical high-income aggregates is
straightforward and accurate.
The baseline regression is
!"#"$%&' = )& + +' + ,-./0"#-2$345-&'67 + ,-/.2$345-&'68 + 9:;< = + >&'
where !"#"$%&' is the log of average real contributions per tax unit for tax returns in fractile j
within the top one percent of returns; ,-/.2$345-&' is the log of average income of households
8 The correlation between inequality and tax price is 0.78. All three of these correlation coefficients are highly statistically significant (p<0.0005).
9 These reports are available with charitable contributions data for 1917, 1922–1950, even-numbered years 1952–1972, and annually since 1972.
13
in group j excluding capital gains; fractile fixed effects denoted )& capture time-invariant
properties of income groups within the elite, and year effects +' capture unobserved time-varying
effects on giving, including economic policy, economic growth, cultural shifts, and asset market
returns. Residual >&' is likely to be serially correlated, and so standard errors are clustered by
fractile.
One or more measures of the tax cost of giving for group j are added, denoted by vector 9:;< .
The primary measure of interest is 1 − A/B&', the marginal tax price of giving, calculated as one
minus the marginal federal tax rate on ordinary income of ,-/.2$345-&' in year t. It’s both well-
established in the literature and common sense that high-income households shift some of their
giving in response to anticipated changes in tax rates (Randolph 1995; Auten et al. 2000, 2002;
Bakija and Heim 2011). Therefore the difference between this years’ marginal tax rate and tax
rate under next year’s law (holding income constant) are also included as controls in some
specifications. Lastly, because high-income households give a disporportionate share of their
contributions in the form of appreciated assets, the most common of which is stock, a final control
captures the tax cost of giving a broad portfolio of stock held for one year,
A/BC4D0E043F&' = 1 − G&'H − I'G'J
where G&'H is the ordinary tax rate on labor income in that tax bracket, G'J is the top capital gains tax
rate in year t, and I' is the share of market value composed of taxable capital gain, measured as
the nominal price appreciation a broad stock portfolio over the prior year (Shiller 2015).10,11
10 That is, I' ≡ (5/MF-0#/.N- − O/D"D)/(5/MF-0#/.N-). 11 Note that it is possible for the tax cost of giving appreciated stock to be zero or negative, making the log
transformation undefined, if the deduction against labor income is worth more than the after-tax value of the liquidated assets. Though there are instances where the limiting case of I' = 1 crosses this threshold, it is never observed for values of I' corresponding to observed nominal stock market increases over the medium run.
14
Lastly, variable ,-./0"#-2$345-&' captures perceived inequality relative to fractile j’s
position in the income distribution, defined as the share of all income that goes to income groups
equal to or below group j
,-./0"#-2$345-&' ≡ 1 −2$345-RST
7R &
2$345-RST7U
where f(j) is the fractile point in the income distribution. This is a refinement of Piketty and Saez’s
top income shares that is specific to finer points of the distribution, and rephrased in terms of
shares below rather than above a particular point; for the income fractile that describes the top 1 to
0.9 percent, Relative Income is equal to the share of the bottom 99 percent income distribution; for
the top 0.1 to 0.09 percent, Relative Income is the bottom 99.9 percent; for the top 0.8 to 0.7
percent it is the share of income flowing to the top 99.3 percent, and so on. Because the effects of
tax incentives and pure increases in income are already captured in the model, we can think of 67
as capturing changes in giving driven by shifts in the amount of income controlled by higher-tier
households.
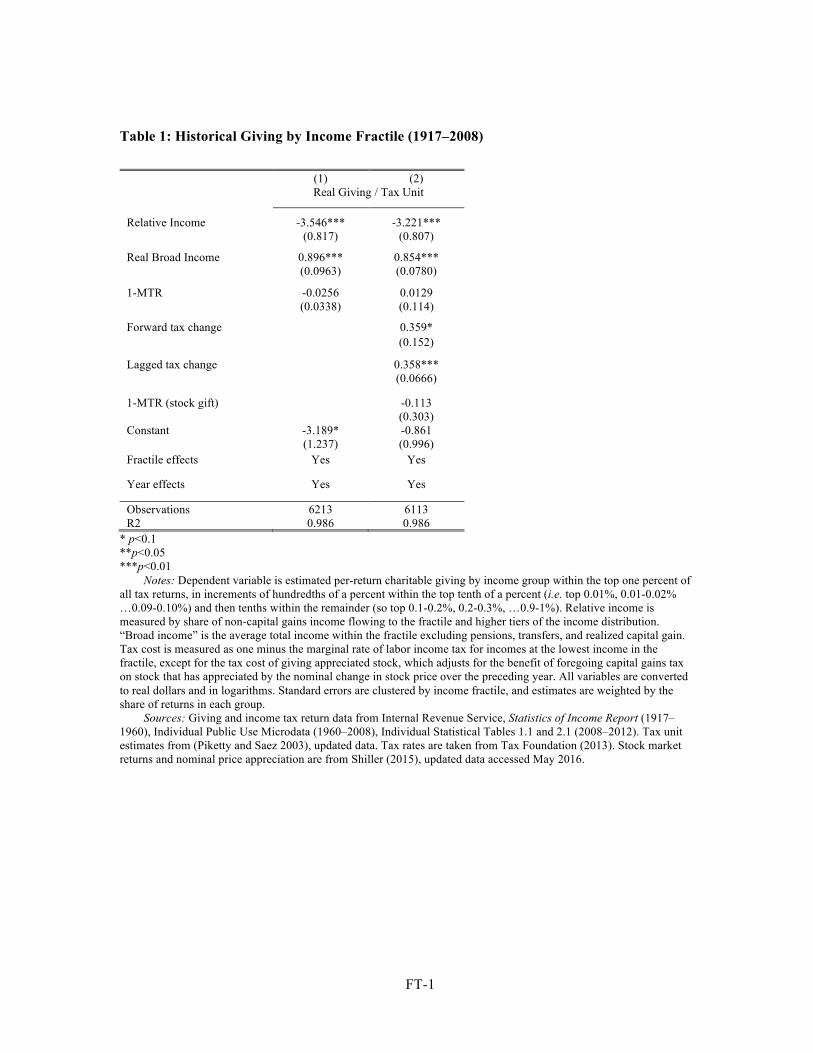
The results of this regression are reported in table 1. Results are weighted by the share of tax
returns in each fractile, and standard errors are clustered by fractile to account for serial
correlation. The coefficient on relative income is negative and statistically significant at the 1
percent level, evidence that more unequal income distributions lead to greater voluntary
contributions. For a 1 percent increase in the share of income going to a given top income group,
giving falls by a little over 3 percent. To put this in perspective, the change in the magnitude of
the increase top one percent’s income share from its lowest point in 1976 (8.33 percent of income
to the top one percent of households) to its peak in 2007 (21.51 percent of income) translates to an
change in relative income of about 0.061 log-points (Piketty and Saez 2003), and is associated
with a counterfactual difference in giving per top-earning household of about -0.2 log-points; the
15
top one percent of households would have given an average of about $60,000 per tax unit in 2007,
instead of the $48,127 observed that year.12
Table 1 about here
2.3 Regression Results With Individual Income Tax Microdata
Next, I examine associations between inequality and giving in cross-sectional individual tax
return data (Internal Revenue Service 2011). Unfortunately, the publicly available data only span
the period 1960 to 2009, when major changes in tax rates were almost all marginal rate
reductions. The rise in tax rates and decline in inequality in the preceding decades are unobserved.
On the other hand, these data have the advantage of sampling nearly 100 percent of high earners
(subject to statistical blurring and other procedures to preserve anonymity), allowing us an
excellent picture of individuals’ giving behavior in inequality, income, and tax incentives.
Consistent with the historical aggregate data, the evidence suggests that inequality reduces
charitable giving.
The baseline regression is
!"#"$%V' = ) + +' + ,-./0"#-2$345-V'67 + ,-/.2$345-V'68 + 9W;< = + >V'
where !"#"$%V' is the total contributions itemized on household i’s tax return; ,-./0"#-2$345-V'
is the share of income flowing to households of equal or greater income than household i ;
,-/.2$345-V' is household i’s total (gross) tax return income; +' is a year effect, ) is a constant,
and >V' is a residual.
12 $48,127 is nominal, current-dollar itemized charitable contributions in the 2007 SOI individual tax return data for returns in the top one percent by gross income. The distribution of itemized gifts within this population is skewed, raising the mean; the median gift in this group is $5,323. However, the correction to the 2007 micro data for very large gifts from those earning over $10 million that is described in the Data Appendix suggests that the average gift for this income group was actually substantially higher, implying that the counterfactual difference sketched here is actually understated.
16
As before, 9W; denotes a vector of tax prices. To control for the endogeneity of the tax rate
(because a large enough deduction for giving can move the taxpayer into a lower rate bracket),
variable 1 − A/BV' is instrumented using the marginal tax rate on the first dollar of cash
contributions using TAXSIM (Feenberg and Coutts 1993).13 The difference between this years’
marginal tax rate and tax rate under next year’s law and last year’s are also included as controls.
Forward- and backward-looking tax differentials are calculated with respect to the current year’s
tax return and a first-dollar cash contribution marginal rate. The cost of giving appreciated stock is
calculated using the taxpayer’s actual capital gains rate and assumes a one-year holding period for
calculating price appreciation.14 Heteroskedasticity-robust standard errors are calculated.
We are interested primarily in the donation behavior of the rich, and so the sample is
restricted to returns with gross incomes in excess of Piketty and Saez’s cutoff for the top one
percent of taxpayers (excluding capital gains). The sample is further restricted to returns which
not only itemize, but which have at least $3,000 in non-charitable itemized deductions, to reduce
any bias from returns where the extent of giving changes whether itemized deductions are
observed. Because we are focusing on high-income households, which tend to have mortgages
and pay substantial state and local taxes, this restriction omits less than four percent of returns.
Lastly, only returns spanning 1977 to 2009 are included, because 1977 is the first year TAXSIM
can calculate state tax liability, which along with mortgage interest and charitable giving is one of
the largest itemized deductions.
13 Since this IV strategy is a common one, the first stage results are omitted for brevity from the main text. They are presented in the appendix. The R-squareds are about 0.7 and all specifications easily reject the null of an F test (F>30,000).
14 Except for the cost of giving appreciated property, which can take negative values, variables are logged and coefficients can be interpreted as elasticities. For a small share of tax returns with extreme estimated marginal rates, those rates are censored below at 0 and above at 95%, so log of 1−Tax is observed for all returns.
17
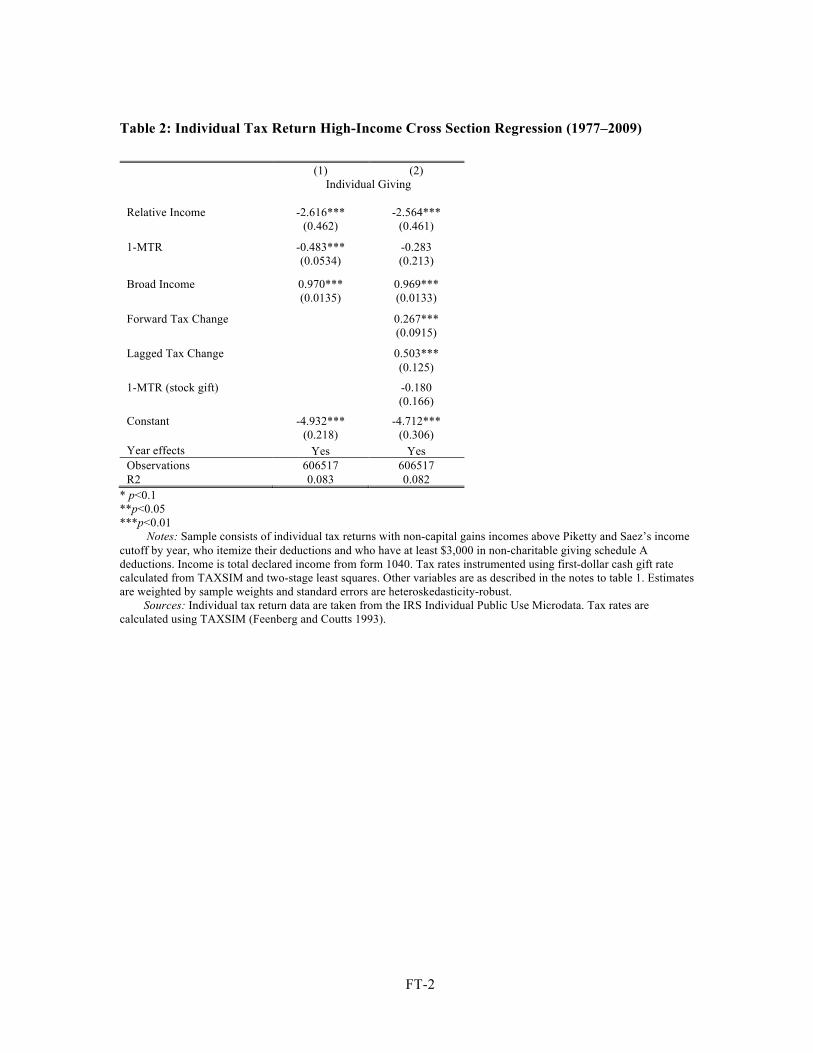
The results of this regression are reported in table 2. Consistent with the results from synthetic
panel data, relative income is strongly and negatively associated with giving, rejecting the
overwhelming wealth effect story of canonical public good models. For a one percent increase in
relatie income, elite giving falls by about 2.6 percent. The elasticity of individual tax cost of is
about -0.5, at the lower end of the distribution of estimates from the prior literature (Peloza and
Steel 2005), and the income elasticity is consistently about 0.9 regardless of the other controls
used.15
3 Inequality and Giving across US States
Though the time series association between inequality and the giving of the rich is robust, it is
primarily driven in the available data by time-varying changes in the income distribution. Before
speculation that this associational evidence has any deeper meaning, I will present limited
evidence that a similar pattern is described at the state level. Across the span of 100 years, income
inequality and the philanthropy of the rich varied greatly across the US states; this section will
explore whether changes in income inequality, controlling for other factors are associated with
changes in giving behavior, are still linked to lower rich giving at the state level.
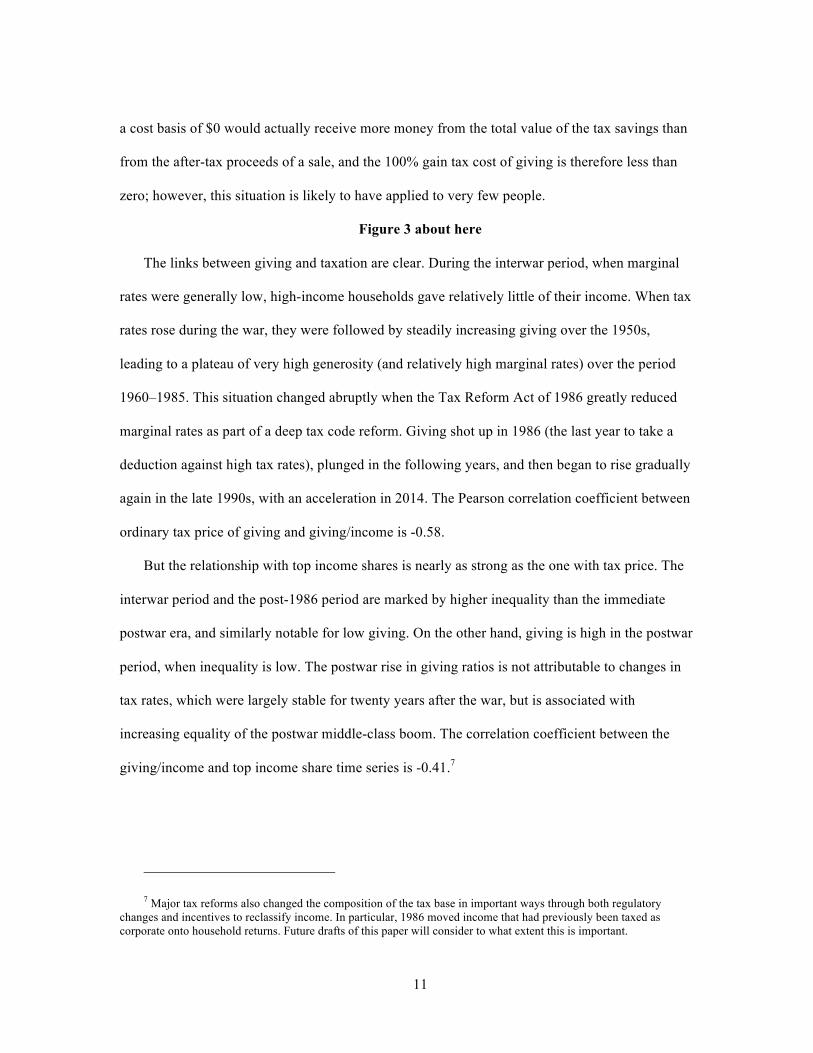
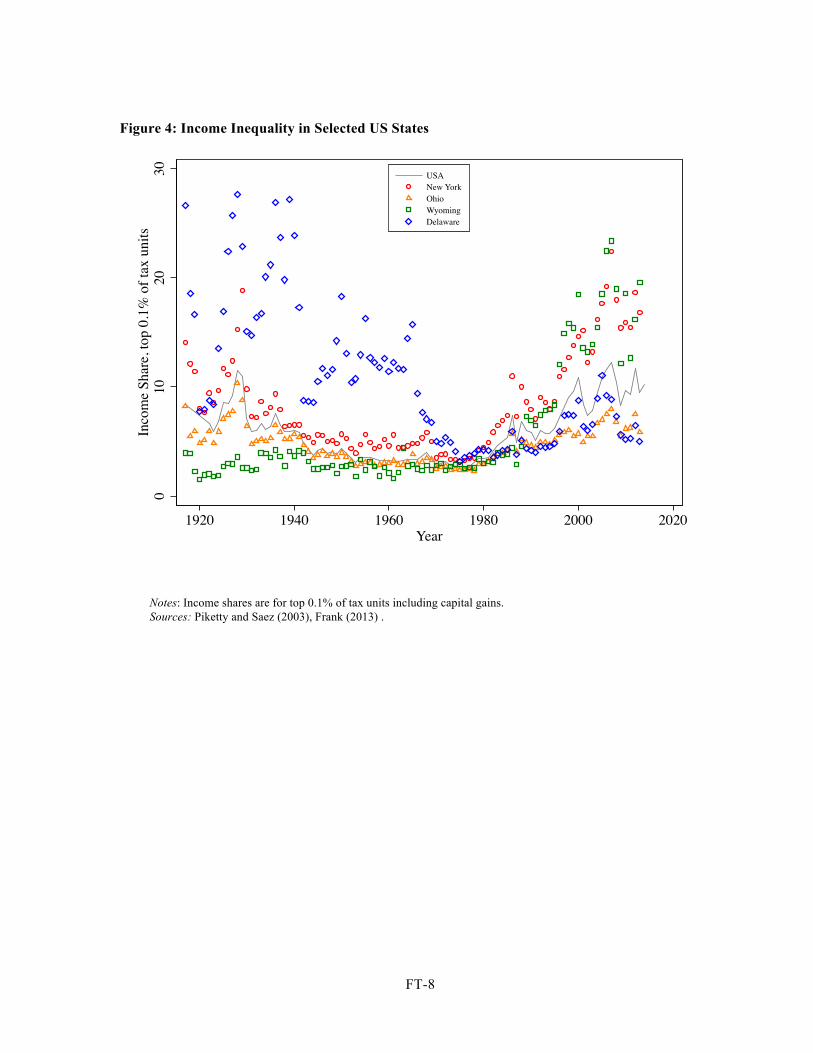
American income inequality has varied substantially across US states, and the nature of that
variation has changed greatly over time. Figure 4 plots top 0.1 percent income shares calculated
by Mark W. Frank (2009; 2014) against the national top income share. In some cases, states’ top
income shares follow the same U-shape as the national distribution, but with more dramatic
swings; for example, New York consistently has a higher top income share than the USA as a
15 Since these results come from cross-sections, not panel data, I am unable to control for household-level effects. Absent this information, we cannot disentangle income and tax effects as causal parameters, let alone the additional effects of inequality. See the discussion of estimation challenges in Bakija and Heim (2011) and Andreoni and Payne (2013) for the details of this problem. Nevertheless, these results show that the associations demonstrated above using synthetic panel data are not driven by aggregation bias in the tax return data.
18
whole, and the gap between it and the country is largest in times of high inequality. Ohio, on the
other hand, is consistently more equal than the USA, especially during the periods when the
country is less equal. However, states do not just reflect the national trends to greater and lesser
degrees; Delaware is by far the most unequal state at the start of the 20th century, with 20-30
percent of income often going to the top 0.1 percent, but in recent years it has been below the
national average; on the other hand, Wyoming began the 20th century below the national average,
but in 2013 was the most unequal of all the states.16
Figure 4 about here
Direct calculation of the giving of rich households by state requires tabulation of giving
behavior by income class within state. Unfortunately, in most years very few variables are broken
out by state and income class, and so calculating the giving of top income groups within each state
is not feasible for a usable sample of years.17 More often, the IRS tabulates a small number of
variables (such as total income), by state and income, and then a larger number of variables (such
as itemized charitable contributions) by state across all income groups. with large gaps from
1942-1959 and 1980-1995.18 Fortunately, most of the variation within (observed) years in the
giving of the top one percent is explained by total itemized giving per capita, which makes the
state aggregates a reasonable proxy measure for elite giving in the right specification. This section
will therefore use total itemized giving per capita as its dependent variable.19
16 I conjecture that these patterns happen because Delaware and Wyoming have small populations (so the top 0.1 percent is a relatively low number of people); top income shares in Delaware would likely have been driven by the Dupont family, and Wyoming by the migration of very high income households to Jackson, although the data do not allow me to be sure.
17 High-quality tabulations for giving by state-income group-year are only published for 1917, 1997–2001, and 2010–2013; additionally, in 1960 a special report published giving by state for three coarse income tiers.
18 Specifically, the tables necessary for this process are published in 1917, 1922-42, 1960, 1966, 1970, 1972-79, and 1996-2013.
19 Specifically, a regression of top-one percent income per capita in years 1917, 1960, 1997–2001, and 2010–2013 on total itemized contributions per capita and year effects,
A4X1%!"#"$%Z' = ) + [' + 6 ∗ A40/.20-5"]-S!"#"$%Z' + >Z' has R2=0.93. I conjecture that this is because itemized contributions are generally concentrated in the top of the income
19
These data permit examination of subnational geographies in a regression specification; we
can compare associations with inequality across place as well as across time and income tier. The
estimation equation is
!"#"$%Z' = ) + [Z + +' + ,-./0"#-2$345-Z'67
+,-/.2$345-Z'68 + A/B^M"3-Z'6_ + `a;< b + >Z'
where !"#"$%&Z' is the log of per-capita total itemized charitable giving reported in state-year
aggregates in 2014 dollars. The regression includes state fixed-effects ([Z) and year effects (+').
Relative income is defined for the top one percent of the state’s population relative to the national
income distribution. Real income is log of the income cutoff for the top 0.1 percent within each
state in 2014 dollars.
To capture the role of tax incentives for giving, A/B^M"3-Z' is log of one minus a tax rate that
depends on state income tax policy. Where states do not have income tax systems, or do not have
a state income tax deduction for charitable contributions, A/B^M"3-Z' is the federal marginal rate
on ordinary income equal to the state-level top 0.1 percent income cutoff. Where states do have
income tax systems with a charitable deduction, then the top state marginal tax rate is added to
this federal rate, and then their product is subtracted (to capture the deductibility of state income
taxation). Top state tax rates from 1966 to 2014 are from Seegert (2015). The presence of state
income tax charitable giving deductions since 1977 is taken from TAXSIM.20 State-level tax rates
and deduction policy prior to these years is hand-collected from a variety of secondary sources;
see the data appendix.
distribution, and that donors in the middle of the distribution are primarily effected by national trends (such as economic conditions and tax policy) that are captured by the [' terms. (Without year effects, R2=0.73.)
20 See the output at http://users.nber.org/~taxsim/charity-state/.
20
`a;< is a vector of time-varying state-level macroeconomic controls, including logs of
unemployment rate, state population, and state per capita income. Important national-level
determinants of giving change over time, such as anticipated federal tax rate changes, shifts in the
breadth of the tax base (particularly, from high-income people only to most households following
the Second World War), changes in the genrosity of the standard deduction, stock market returns,
interest rates, and other factors are captured in year effects (+') in all regressions. The estimation
is performed both with and without state fixed effects to capture unobserved, time-invariant
aspects of state giving culture ([Z), and are estimated both unweighted and weighted by state
shares of national population within years. Standard errors are clustered by state to account for
heterosketasticity and serial correlation.
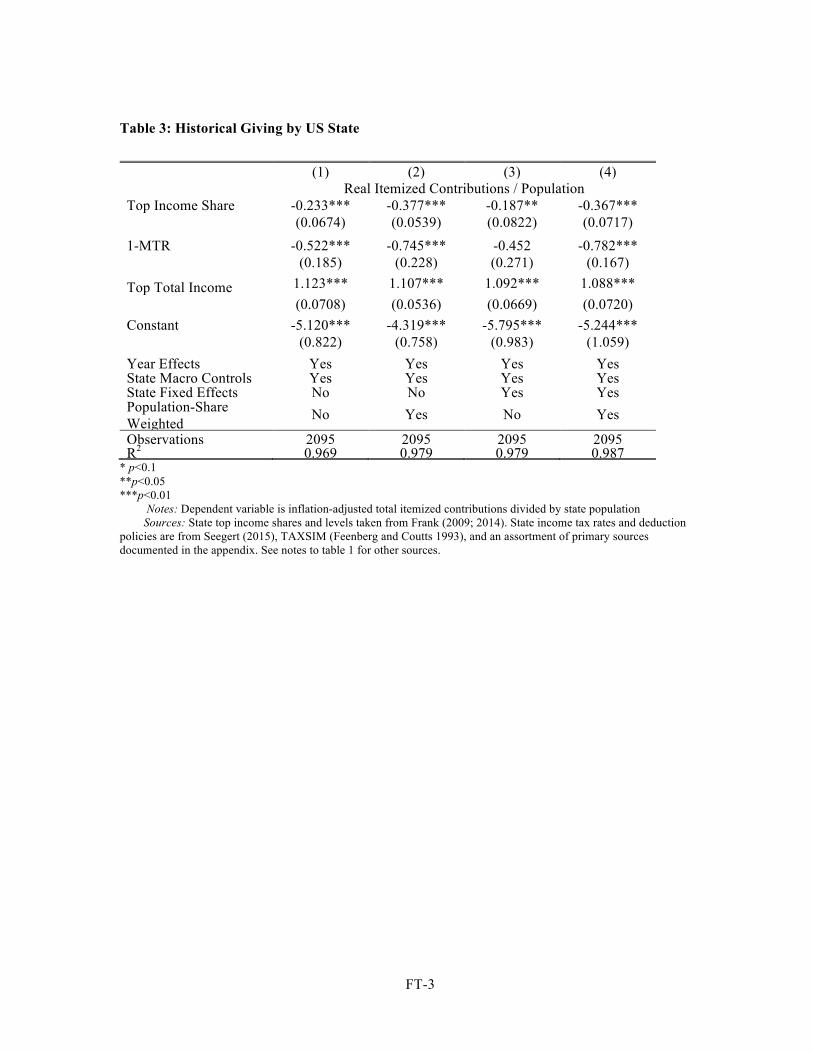
The results are presented in table 3. With or without state effects, higher top income shares
are associated with lower itemized contributions. The estimated coefficients are, respectively,
-0.366 without state fixed effects and -0.412 with state effects. These magnitudes are smaller than
those estimated in tables 1 and 2, possibly reflecting the lower salience of inequality within states
as opposed to at the national level, or the influence of endogenous state selection by high-income
households who either migrate to or establish primary residency in low-tax states while
maintaining social connections and philanthropic activity in high-tax states. All specifications are
statistically different from zero at the one percent level.
Table 3 about here
These results should be interpreted with some caution, especially before concluding that the
reveal a causal effect of inequality on giving. Analysis of state-level changes has the advantage of
allowing us to rule out coincidental correlations over time as an explanation for the preceding
results. However, state of filing is not endogenous, especially for the very rich, who have both the
greatest incentive and greatest means to move their filing state for tax purposes (either by truly
21
moving, or by adjusting time spent among multiple homes to file from the lowest-tax state).
Nevertheless, these results suggest that findings driven by national inequality measures are not
flukes of temporal correlation only.
4 Charities’ Receipts
We may be concerned that tax rates affect charitable giving of elites more through its
incentive effects on evasion rather than on giving. Itemizers overstate their contributions to evade
taxation (Slemrod 1989), particularly taxpayers near the top of the income distribution (Fack and
Landais 2010), a problem of particular concern in the prewar era when charities did not file
information returns and the federal government generally had fewer information sources to check
tax return honesty.
Therefore I present an alternate time series regression for the effects of tax rates and
inequality on elite charitable giving to one very salient and elite charity. Instead of itemized
contributions from tax returns, for a dependent variable I use real charitable gifts received by
Harvard University, an institution of higher education located in Cambridge, Massachusetts.
Higher education is consistently one of the primary recipients of donations by the very rich
(Ostrower 1995, p. 40). And, to a degree rivaled by few universities, Harvard has served for
centuries as one of the main sites for the socialization and grooming of America’s young and
wealthy elite, and is well-known for receiving charitable gifts from the well-to-do. Charitable gifts
data are obtained from Harvard’s annual treasurer’s reports (Harvard University 1916–2014).
These data are more limited than individual tax return data in that they describe giving to just one
institution, and donors’ tax rates are not observed directly. But these data lack tax filers’ incentive
to evade taxes through contribution overstatement; they are also available for every year from the
22
establishment of the federal income tax in 1916 to 2014 without gaps, unlike the Statistics of
Income Reports.
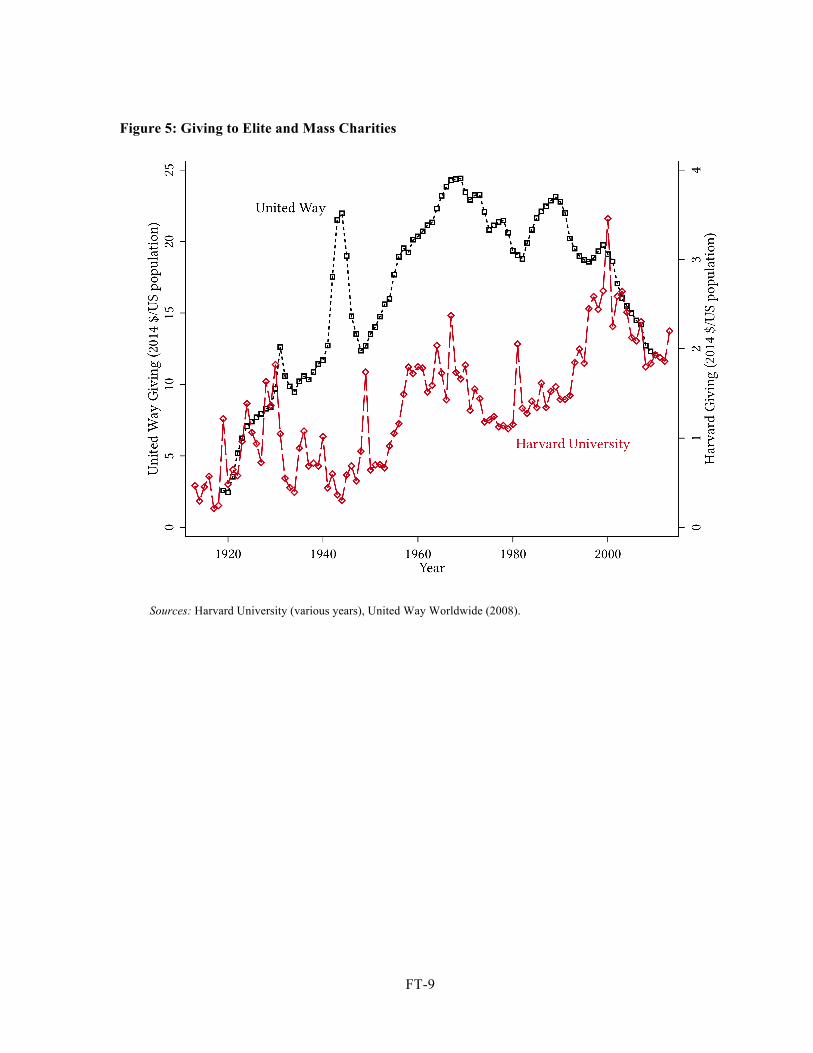
Giving to Harvard is presented graphically in figure 5. Harvard’s contribution receipts vary
significantly from year to year because of major gifts and large bequests, but the broader trend
shows rising real gifts prior to the Great Depression, followed by a long trough that ends in the
early 1950s. Giving then rises quickly to a mid-century plateau, followed by another surge in
giving that starts in the 1990s and peaks with the dot-com boom before settling at a permanently
higher level. In contrast, real per-capita gifts to the United Way — an charity that came to
prominence by pooling paycheck deductions of middle-income households and the quintessential
cause of mass prosperity — continue a steady rise from 1920 to 1960, with a brief spike during
the Second World War. Giving to United Way then stagnates over the following 20 years before
beginning a decline in the mid-1980s at the same time income inequality was beginning to
accelerate and gifts to Harvard began to go up.
Figure 5 about here.
These data are combined with time series measures of inequality and tax incentives to
estimate multivariate regression
!"#"$%' = ) + 2$-cN/."0d'67 + 2$345-'68 + 9;<= + e;<f + >'
where !"#"$%' is log of contributions per US resident to Harvard in real (2014) dollars; 1 − A/B'
is the log of the tax price of charitable giving for households at the top one percent income cutoff;
2$345-' is the real income at that cutoff; 2$-cN/."0d' is share of broad income going to the top
one percents measured by Piketty and Saez (2003). Macroeconomic controls and additional tax
cost of giving measures are included in M and T, respectively. Residual >' is assumed to be
serially correlated, and Newey-West coefficients are reported assuming an AR(1) process.
23
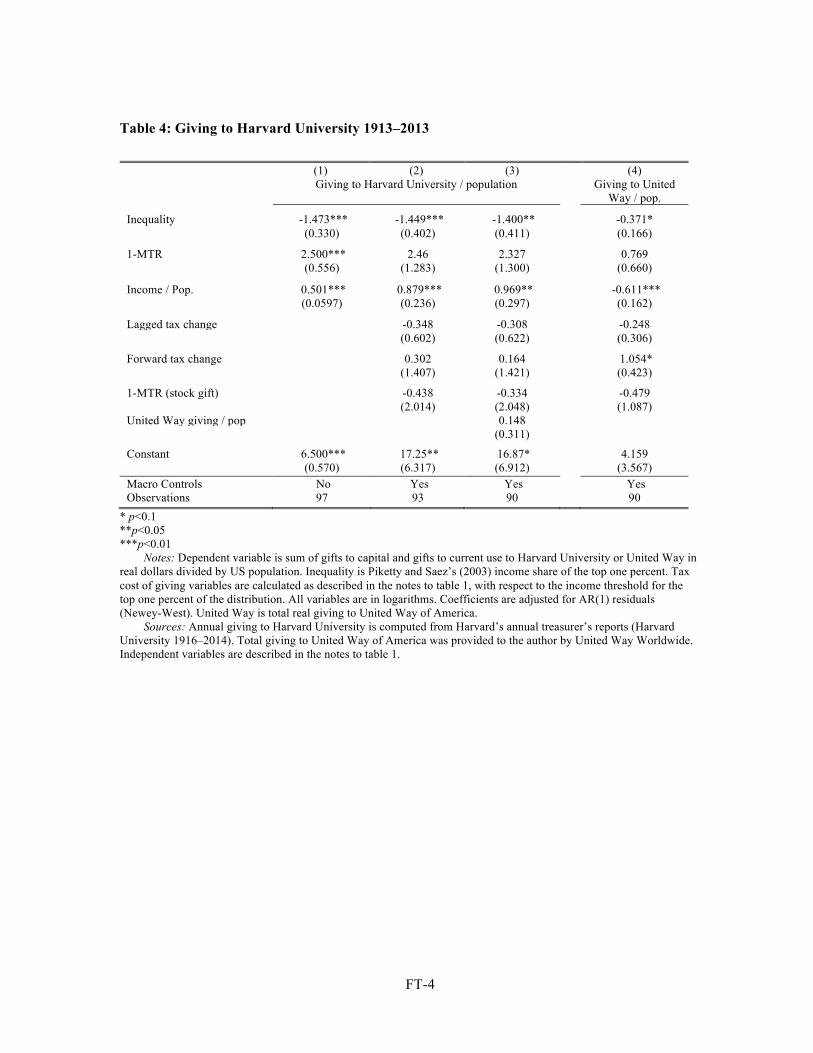
The results are presented in table 4. Consistent with the findings from individual returns, the
negative relationship between inequality and Harvard’s received gifts is economically and
statistically significant. A one percent increase in top income shares is correlated with a -1.4
percent decline in Harvard’s charitable receipts. The absolute level of top incomes is strongly and
positively associated with Harvard giving. Donors also shift their giving aggressively in response
to tax changes, but there is not a negative association with tax price itself, which has a small,
positive coefficient. This suggests that Harvard donors engage in intertemporal shifting to take
advantage of better tax subsidies, but that the long-run level of the tax subsidy for charitable gifts
is not important for their contributions.
Table 4 about here
Column 3 adds an additional variable for the log of real contributions to United Way; this
proxies for changes in the broader donative environment, since United Way is the quintessential
clearing house for middle-income donors’ giving to broadly targeted charities.21 There is little
difference in the point estimates of interest when this control is included, suggesting that Harvard
giving is already accurately characterized as elite in nature. As an additional test, United Way
giving per capita is used as a dependent variable in column 4, replicating the specification in
column 2 but with gifts to an elite charity in the dependent variable. Consistent with expectations,
the coefficient on inequality for gifts to the United Way is much closer to zero than for giving to
Harvard, and statistical equality to the Harvard point estimate of -1.4 can be rejected at the one
percent confidence level.
21 Data provided directly by United Way Worldwide, “United Way Worldwide Total Contributions 1919–2008,” provided September 16 2011.
24
4 Discussion
This paper has documented a robust negative association between the charitable giving of
high-income households and income inequality. Whether looking at rich national time series data,
or more limited cross-sectional micro data, state-level data, or charity time series, giving at the top
is lower when inequality is higher. This is visible in the raw data, and the association only gets
stronger when controlling for absolute income, tax incentives, and other confounding factors.
These robust results should, however, be interpreted with caution and supported by further
work. As strong as the reported associations are, they do not demonstrate a causal relationship. It
may be that some other, unobserved force generates a negative association between inequality and
giving. Future research will hopefully develop experimental tests of inequality responses to real-
world giving behavior, and the creation of better historical information on donors and donees.
Nevertheless, these preliminary results also suggest that much of the conventional wisdom
about the links between income inequality and giving is wrong, or at least overlooking important
complexity. Though the idea that the richest voluntarily respond to rising inequality through
greater investment in philanthropy is venerable, and an apt description of the motivation of the
most famous philanthropists, it fails as a positive description of the giving behavior of elites as a
group. Over the past century, the highest-income Americans have given the most to charity when
the income distribution has been the most egalitarian; it is only in the most recently available year
of data, 2014, that we have observed inequality comparable to the Gilded Age and generosity
comparable to the middle of the Twentieth Century at the same time. How income inequality and
philanthropy have actually combined over time to improve social conditions and build public
institutions is worth examining further with these historical findings in mind.
25
References
Acs, Zoltan, Why Philanthropy Matters: How the Wealthy Give, and What It Means for Our Economic Well-Being, Princeton: Princeton University Press, 2013.
Anderson, Lisa R., Jennifer M. Mellor, and Jeffrey Milyo, “Inequality and public good provision: An experimental analysis,” The Journal of Socio-Economics, 2008, 37 (3), 1010–1028.
Andreoni, James, “Impure Altruism and Donations to Public Goods: A Theory of Warm-Glow Giving,” The Economic Journal, June 1990, 100 (401), 464–477.
Auten, Gerald E., Charles T. Clotfelter, and Richard L. Schmalbeck, “Taxes and Philanthropy among the Wealthy,” in Joel Slemrod, ed., Does Atlas Shrug: The Economic Consequences of Taxing the Rich, Cambridge, Massachusetts: Harvard University Press, 2000, pp. 392–424.
_____, Holger Sieg, and Charles T. Clotfelter, “Charitable Giving, Income, and Taxes: An Analysis of Panel Data,” American Economic Review, March 2002, 92 (1), 371–382.
Bakija, Jon and Bradley Heim, “How Does Charitable Giving Respond to Incentives and Income? New Estimates from Panel Data,” National Tax Journal, 2011, 64 (2), 615–650.
Bergstrom, Theodore, Lawrence Blume, and Hal Varian, “On the Private Provision of Public Goods,” Journal of Public Economics, 1986, 29 (1), 25–49.��
Boustan, Leah, Fernando Ferreira, Hernan Winkler, and Eric M. Zolt, “The Effect of Rising Income Inequality on Taxation and Public Expenditures: Evidence from U.S. Municipalities and School Districts, 1970–2000,” Review of Economics and Statistics, November 2012, 95 (4), 1291–1302.
Buckley, Edward and Rachel Croson, “Income and wealth heterogeneity in the voluntary provision of linear public goods,” Journal of Public Economics, 2006, 90 (4), 935–955.
Business Insider. “Malcolm Gladwell says billionaires 'sound like idiots' when they explain why they donate to large universities.” Aug. 17, 2016. [http://www.businessinsider.com/malcolm-gladwell-billionaires-shouldnt-donate-to-large-universities-2016-8].
Carnegie, Andrew, “The Gospel of Wealth,” in The Gospel of Wealth and Other Timely Essays, New York: The Century Co., 1901, chapter 1, pp. 1–45.
Carter, Susan B., Scott Sigmund Gartner, Michael R. Haines, Alan L. Olmstead, Richard Sutch, and Gavin Wright, eds, Historical Statistics of the United States Millennial Edition Online, New York: Cambridge University Press, 2006.
Chan, Kenneth S., Stuart Mestelman, and R. Andrew Muller, “Voluntary Provision of Public Goods,” in Charles R. Plott and Vernon L. Smith, eds., Handbook of Experimental Economics Results, Vol. 1, Elsevier, 2008, Chapter 88, pp. 831 – 835.
_____, _____, Rob Moir, and R. Andrew Muller, “The voluntary provision of public goods under varying income distributions,” Canadian Journal of Economics, 1996, pp. 54–69.
Chronicle of Philanthropy. “Beware the Bearer of Big Gifts.” February 2017, pp. 22–25.
Clotfelter, Charles T., Federal Tax Policy and Charitable Giving, Chicago: The University of Chicago Press, 1985.
26
Duquette, Nicolas J. “Do Tax Incentives Affect Charitable Contributions? Evidence from Public Charities’ Reported Revenues,” Journal of Public Economics, 137: 51-69, May 2016.
Fack, Gabrielle and Camille Landais, “Charitable giving and tax policy in the presence of tax cheating: Theory and evidence from the U.S. and France,” January 2010. Mimeo.
Federal Reserve Bank of St. Louis, “Federal Reserve Economic Data (FRED).”
Feenberg, Daniel and Elisabeth Coutts, “An Introduction to the TAXSIM Model,” Journal of Policy Analysis and Management, Winter 1993, 12 (1), 189–194.��
Frank, Mark W. 2009 "Inequality and Growth in the United States: Evidence from a New State-Level Panel of Income Inequality Measure" Economic Inquiry, Volume 47, Issue 1, Pages 55-68.
_____. 2014 "A New State-Level Panel of Annual Inequality Measures over the Period 1916 - 2005" Journal of Business Strategies, vol. 31, no. 1, pages 241-263.
Hall, Peter Dobkin. 1992. Inventing the Nonprofit Sector and Other Essays on Philanthropy, Voluntarism, and Nonprofit Organizations. Johns Hopkins University Press, Baltimore, 1992.
Hall 2002.
Harvard University, “Treasurer’s Statement,” http://pds.lib.harvard.edu/pds/view/2580922 [accessed summer 2015] 1916–1948.
_____, “Financial Report,” http://pds.lib.harvard.edu/pds/view/2574298 [accessed summer 2015] 1949–1979.
_____, “Financial report for To the Board of Overseers of Harvard College (Abridged ed.),” http://pds.lib.harvard.edu/pds/view/2820469 [accessed summer 2015] 1980–1993.
_____, “Annual Report,” http://finance.harvard.edu/annual-report [accessed summer 2015] 2004–2014.
Higgs, Robert. 1985. “Crisis, Bigger Government, and Ideological Change: Two Hypotheses on the Ratchet Phenomenon.” Explorations in Economic History 22(1):1–28.
Internal Revenue Service, “Statistics of Income Report,” Government Printing Office, Washington, D.C. 1917–1953.
_____, “Statistics of Income: Individual Income Tax Returns,” Government Printing Office, Washington, D.C. 1954–1960.
_____, “Statistics of Income Division Exempt Organizations Sample (Public Charities 1982-3, 1985-2007),” National Center for Charitable Statistics [Accessed July 2011]. Washington 2011.
_____, “Individual Public Use Tax File,” Statistics of Income Division, Data File. Years 1960– 2008. National Bureau of Economic Research. 2012.
Kreuger, Dirk and Fabrizio Perri. 2006. “Does Income Inequality Lead to Consumption Inequality? Evidence and Theory.” Review of Economic Studies 73:163–193.
Lindert, Peter H. 2004. Growing Public. Cambridge University Press, Cambridge, 2004.
Lindert, Peter H. and Jeffrey G. Williamson, Unequal Gains: American Growth and Inequality since 1774, Princeton University Press, 2016.
27
Londoño-Vélez, Juliana. "War and Progressive Income Taxation in the 20th Century", BEHL Working Paper 2014-3, September 2014.
Mills, C. Wright. The Power Elite. 1956. Galaxy Books, New York, and Oxford University Press, Oxford, 1959 edition.
Ostrower, Francie. 1995. Why the Wealthy Give. Princeton University Press, Princeton.
Payne, A. Abigail and Justin Smith, “Does Income Inequality Increase Charitable Giving?,” Canadian Journal of Economics, May 2015, 48 (2), 793–818.
Peloza, J. and P. Steel, “The price elasticities of charitable contributions: a meta-analysis,” Journal of Public Policy & Marketing, Fall 2005, 24 (2), 260–272.
Piketty, Thomas, Capital in the Twenty-First Century, Cambridge, Mass.: Belknap Press of Harvard University Press Press, 2014.
_____ and Emmanuel Saez, “Income inequality in the United States, 1913–1998,” Quarterly Journal of Economics, 2003, 118 (1), 1–41.
Putnam, Robert D., Bowling Alone: The Collapse and Revival of American Community, New York: Simon & Schuster, 2000.
Randolph, William C., “Dynamic Income, Progressive Taxes, and the Timing of Charitable Contributions,” Journal of Political Economy, August 1995, 103 (4), 709–738.
Ribar, David C. and Mark Ottoni Wilhelm, “Altruistic and Joy of Giving Motivations in Charitable Behavior,” Journal of Political Economy, April 2002, 110 (2), 425–457.
Rognlie, Matthew. “Deciphering the Fall and Rise in the Net Capital Share: Accumulation or Scarcity?” Brookings Papers on Economic Activity 46 (1), pp. 1-69, Spring 2015.
Romer, Christina D. and David H. Romer, “The Incentive Effects of Marginal Tax Rates: Evidence from the Interwar Era,” American Economic Journal: Economic Policy, 2014, 6 (3), 242–81.
Samuelson, Paul A., “The Pure Theory of Public Expenditure,” Review of Economics and Statistics, 1954, 36 (4), 387–389.
Scheve, Kenneth and David Stasavage. Taxing the Rich: A History of Fiscal Fairness in the United States and Europe. Russel Sage Foundation and Princeton University Press, Princeton, 2016.
Seegert, Nathan. 2015. “The Performance of State Tax Portfolios During and After the Great Recession.” National Tax Journal, December 2015, 68(4), 901-918.
Shiller, Robert J, Irrational Exuberance, third ed., Princeton University Press, 2015.
Slemrod, Joel, “Are Estimated Tax Elasticities Really Just Tax Evasion Elasticities? The Case of Charitable Contributions,” Review of Economics and Statistics, August 1989, 71 (3), 517–522.
Stelzner, Mark, “Income Inequality in the United States in the Late 1860s,” The Journal of Economic History, 9 2015, 75, 889–900.
Tax Foundation, “Federal Individual Income Tax Rates History,” Mimeo 2013.��
Wallis, John J. 2000. “American Government Finance in the Long Run: 1790 to 1990,” Journal of

28
Economic Perspectives. 14:1 pp. 61-82.
Zunz, Olivier. 2012. Philanthropy In America. Princeton University Press, Princeton, 2012.
FT-1
Table 1: Historical Giving by Income Fractile (1917–2008)
(1) (2) Real Giving / Tax Unit
Relative Income -3.546*** -3.221*** (0.817) (0.807)
Real Broad Income 0.896*** 0.854*** (0.0963) (0.0780)
1-MTR -0.0256 0.0129 (0.0338) (0.114)
Forward tax change 0.359*
(0.152)
Lagged tax change 0.358*** (0.0666)
1-MTR (stock gift) -0.113 (0.303) Constant -3.189* -0.861 (1.237) (0.996) Fractile effects Yes Yes
Year effects Yes Yes
Observations 6213 6113 R2 0.986 0.986
* p<0.1 **p<0.05 ***p<0.01
Notes: Dependent variable is estimated per-return charitable giving by income group within the top one percent of all tax returns, in increments of hundredths of a percent within the top tenth of a percent (i.e. top 0.01%, 0.01-0.02% …0.09-0.10%) and then tenths within the remainder (so top 0.1-0.2%, 0.2-0.3%, …0.9-1%). Relative income is measured by share of non-capital gains income flowing to the fractile and higher tiers of the income distribution. “Broad income” is the average total income within the fractile excluding pensions, transfers, and realized capital gain. Tax cost is measured as one minus the marginal rate of labor income tax for incomes at the lowest income in the fractile, except for the tax cost of giving appreciated stock, which adjusts for the benefit of foregoing capital gains tax on stock that has appreciated by the nominal change in stock price over the preceding year. All variables are converted to real dollars and in logarithms. Standard errors are clustered by income fractile, and estimates are weighted by the share of returns in each group.
Sources: Giving and income tax return data from Internal Revenue Service, Statistics of Income Report (1917–1960), Individual Public Use Microdata (1960–2008), Individual Statistical Tables 1.1 and 2.1 (2008–2012). Tax unit estimates from (Piketty and Saez 2003), updated data. Tax rates are taken from Tax Foundation (2013). Stock market returns and nominal price appreciation are from Shiller (2015), updated data accessed May 2016.
FT-2
Table 2: Individual Tax Return High-Income Cross Section Regression (1977–2009)
(1) (2)
Individual Giving
Relative Income -2.616*** -2.564***
(0.462) (0.461)
1-MTR -0.483*** -0.283 (0.0534) (0.213)
Broad Income 0.970*** 0.969***
(0.0135) (0.0133)
Forward Tax Change 0.267***
(0.0915)
Lagged Tax Change 0.503***
(0.125)
1-MTR (stock gift) -0.180
(0.166)
Constant -4.932*** -4.712*** (0.218) (0.306) Year effects Yes Yes Observations 606517 606517 R2 0.083 0.082
* p<0.1 **p<0.05 ***p<0.01
Notes: Sample consists of individual tax returns with non-capital gains incomes above Piketty and Saez’s income cutoff by year, who itemize their deductions and who have at least $3,000 in non-charitable giving schedule A deductions. Income is total declared income from form 1040. Tax rates instrumented using first-dollar cash gift rate calculated from TAXSIM and two-stage least squares. Other variables are as described in the notes to table 1. Estimates are weighted by sample weights and standard errors are heteroskedasticity-robust.
Sources: Individual tax return data are taken from the IRS Individual Public Use Microdata. Tax rates are calculated using TAXSIM (Feenberg and Coutts 1993).
FT-3
Table 3: Historical Giving by US State
(1) (2) (3) (4) Real Itemized Contributions / Population Top Income Share -0.233*** -0.377*** -0.187** -0.367*** (0.0674) (0.0539) (0.0822) (0.0717) 1-MTR -0.522*** -0.745*** -0.452 -0.782*** (0.185) (0.228) (0.271) (0.167)
Top Total Income 1.123*** 1.107*** 1.092*** 1.088***
(0.0708) (0.0536) (0.0669) (0.0720) Constant -5.120*** -4.319*** -5.795*** -5.244*** (0.822) (0.758) (0.983) (1.059) Year Effects Yes Yes Yes Yes State Macro Controls Yes Yes Yes Yes State Fixed Effects No No Yes Yes Population-Share Weighted No Yes No Yes
Observations 2095 2095 2095 2095 R2 0.969 0.979 0.979 0.987
* p<0.1 **p<0.05 ***p<0.01
Notes: Dependent variable is inflation-adjusted total itemized contributions divided by state population Sources: State top income shares and levels taken from Frank (2009; 2014). State income tax rates and deduction
policies are from Seegert (2015), TAXSIM (Feenberg and Coutts 1993), and an assortment of primary sources documented in the appendix. See notes to table 1 for other sources.
FT-4
Table 4: Giving to Harvard University 1913–2013
(1) (2) (3) (4) Giving to Harvard University / population Giving to United
Way / pop.
Inequality -1.473*** -1.449*** -1.400** -0.371* (0.330) (0.402) (0.411) (0.166)
1-MTR 2.500*** 2.46 2.327 0.769 (0.556) (1.283) (1.300) (0.660)
Income / Pop. 0.501*** 0.879*** 0.969** -0.611*** (0.0597) (0.236) (0.297) (0.162)
Lagged tax change -0.348 -0.308 -0.248
(0.602) (0.622) (0.306)
Forward tax change 0.302 0.164 1.054* (1.407) (1.421) (0.423)
1-MTR (stock gift) -0.438 -0.334 -0.479 (2.014) (2.048) (1.087) United Way giving / pop 0.148 (0.311) Constant 6.500*** 17.25** 16.87* 4.159 (0.570) (6.317) (6.912) (3.567) Macro Controls No Yes Yes Yes Observations 97 93 90 90
* p<0.1 **p<0.05 ***p<0.01
Notes: Dependent variable is sum of gifts to capital and gifts to current use to Harvard University or United Way in real dollars divided by US population. Inequality is Piketty and Saez’s (2003) income share of the top one percent. Tax cost of giving variables are calculated as described in the notes to table 1, with respect to the income threshold for the top one percent of the distribution. All variables are in logarithms. Coefficients are adjusted for AR(1) residuals (Newey-West). United Way is total real giving to United Way of America.
Sources: Annual giving to Harvard University is computed from Harvard’s annual treasurer’s reports (Harvard University 1916–2014). Total giving to United Way of America was provided to the author by United Way Worldwide. Independent variables are described in the notes to table 1.
FT-5
Figure 1: Giving vs. Inequality, Top 0.1% of returns
Notes: Contributions / Income estimates from IRS tax return data for the top 0.1% of returns by broad income (total income excluding capital gains, pensions and transfers).
Sources: Giving and income tax return data from Internal Revenue Service, Statistics of Income Report (1917–1960), Individual Public Use Microdata (1960–2008), Individual Statistical Tables 1.1 and 2.1 (2008–2012). Top income shares from (Piketty and Saez 2003), updated data.
2
46
8To
p In
com
e Sh
are
(%)
.02
.04
.06
.08
.1C
ontri
butio
ns /
Inco
me
1920 1940 1960 1980 2000Year
Contributions / Income
Top Income Share
FT-6
Figure 2: Giving/Income of Top Income Groups
Notes: Contributions / Income estimates from IRS tax return data for the top fractiles of tax returns by broad income.
Sources: Giving and income tax return data from Internal Revenue Service, Statistics of Income Report (1917–1960), Individual Public Use Microdata (1960–2008), Individual Statistical Tables 1.1 and 2.1 (2008–2012).
0.0
4.0
8.1
2.1
6.2
Con
tribu
tions
/ To
tal I
ncom
e
1920 1940 1960 1980 2000Year
Top 0.01% by income
Top 0.1% to 0.01%
Top 1% to 0.1%
FT-7
Figure 3: Giving vs. Tax Rates, Top 0.1% of returns
Notes: “Ordinary” tax rate is on ordinary income at the income level of the top 0.1 percent (Piketty and Saez 2003). Gains of 20% and 100% are calculated as the tax cost of giving appreciated property and both deducting the value of the gift from ordinary income and forgoing capital gains tax on 20% or 100% of the market value of the gift, respectively.
Sources: See notes to figure 1. Tax rates are taken from Tax Foundation (2013).
0.2
.4.6
.81-
Tax
Rat
e
.02
.04
.06
.08
.1C
ontri
butio
ns /
Inco
me
1920 1940 1960 1980 2000Year
Contributions / Income
Tax Cost (ordinary)
Tax Cost (20% Gain)
Tax Cost (100% Gain)
FT-8
Figure 4: Income Inequality in Selected US States
Notes: Income shares are for top 0.1% of tax units including capital gains. Sources: Piketty and Saez (2003), Frank (2013) .
010
2030
Inco
me
Shar
e, to
p 0.
1% o
f tax
uni
ts
1920 1940 1960 1980 2000 2020Year
USANew YorkOhioWyomingDelaware
FT-9
Figure 5: Giving to Elite and Mass Charities
Sources: Harvard University (various years), United Way Worldwide (2008).