Embed Size (px)
Citation preview
Find more research and scholarship conducted by the Erik Jonsson School of Engineering and Computer Science here. This document has been made available for free and open access by the Eugene McDermott Library. Contact [email protected] for further information.
Erik Jonsson School of Engineering and Computer Science 2014-04
Phase Stability of Li-Mn-O Oxides as Cathode Materials for Li-ion Batteries: Insights from ab initio Calculations
UTD AUTHOR(S): R. C. Longo, F. T. Kong, Santosh KC abd Kyeongjae Cho
©2014 The Owner Societies
11218 | Phys. Chem. Chem. Phys., 2014, 16, 11218--11227 This journal is© the Owner Societies 2014
Cite this:Phys.Chem.Chem.Phys.,
2014, 16, 11218
Phase stability of Li–Mn–O oxides as cathodematerials for Li-ion batteries: insights fromab initio calculations†
R. C. Longo,a F. T. Kong,a Santosh KC,a M. S. Park,b J. Yoon,b D.-H. Yeon,b
J.-H. Park,b S.-G. Doo*b and K. Cho*a
In this work, we present a density-functional theory (DFT) investigation of the phase stability,
electrochemical stability and phase transformation mechanisms of the layered and over-lithiated Mn
oxides. This study includes the thermodynamic stability of Li and oxygen vacancies, to examine the
electrochemical activation mechanisms of these cathode materials. The DFT calculations provide phase
diagrams of the Li–Mn–O system in both physical and chemical potential spaces, including the crystals
containing vacancies as independent phases. The results show the ranges of electrochemical activity for
both layered LiMnO2 and over-lithiated Li2MnO3. By using a thermodynamic model analysis, we found
that the required temperature for oxygen evolution and Li vacancy formation is too high to be compatible
with any practical synthesis temperature. Using solid-state transition calculations, we have identified the
key steps in the phase transition mechanism of the layered LiMnO2 into the spinel phase. The calculated
effects of pH on the Li–Mn–O phase stability elucidated the mechanism of Mn2+ formation from the
spinel phase under acidic conditions.
1 Introduction
The wide usage of rechargeable Li-ion batteries in portableelectronic devices and electric vehicles requires high energydensity, fast charge–discharge rate and long cycling lifetimes.1–5
Cathode materials play the most important role in determiningthe performance of the battery, because they constitute themajor bottleneck to improve it. Currently, layered LiCoO2 oxidesare the most common cathode materials in the market.6–11
Typically, the maximum theoretical capacity of LiCoO2 is about274 mA h g�1,12 and the practical capacity remains higher than130 mA h g�1 even after more than forty cycles of charge anddischarge.13 However, LiCoO2 has many important drawbacks,including a non-negligible instability at the end of the chargingprocess and decomposition at high temperatures.14–18 More-over, Co is becoming more expensive due to its relatively lowabundance in the earth’s crust. To overcome these difficulties,both LiNiO2 and LiMnO2 have been widely explored as alter-natives to the Co oxides.19–26 Both of them suffer from their
own disadvantages for practical purposes. For example, themain problem of LiMnO2 is the structural transformation to thespinel phase during electrochemical cycling, which hinderssubsequent Li insertion and/or removal.27,28
One of the most promising alternatives from a practicalpoint of view is the over-lithiated-oxide (OLO) cathode material,Li2MnO3, and its composite with Li(Ni, Co, or Mn)O2.29 Afterlosing most of the Li ions during the charging process, the OLOgradually undergoes a phase transition into a layered oxide,LiMnO2.29–31 Consequently, the cathode material used in prac-tical applications is a composite structure, i.e., a compound ofthe form, xLi2MnO3(1 � x)LiMnO2, where the ideal x ratio issomething to be determined experimentally.29–36 The OLOphase of the composite material has the same layered structureas LiMnO2, but with a ‘‘mixed’’ Li–Mn layer, instead of pure Mnand Li stacking layers. The additional amount of Li from theOLO phase increases the capacity and the energy density,provided that the stability issues of the layered Mn oxide aresolved.27,28
There has been numerous experimental studies on theelectrochemical performance of the OLO composite Mn layeredoxides.29–33 The problems arise because, despite its high capa-city, Li2MnO3 presents several hurdles to practical applications:Mn ions are in the Mn4+ oxidation state in Li2MnO3, even whenLi ions are not extracted from the crystal (contrary to the Co3+
in LiCoO2). Thus, it is difficult to extract Li ions from the
a Department of Materials Science & Engineering, The University of Texas at Dallas,
800 West Campbell Road, Richardson, TX 75080, USA.
E-mail: [email protected]; Tel: +1 972 883 2845b Energy Lab., Samsung Advanced Institute of Technology, Samsung Electronics,
Yongin 446-712, Republic of Korea. E-mail: [email protected]
† Electronic supplementary information (ESI) available: Vacancy formation energiesand phase diagrams at different temperatures. See DOI: 10.1039/c4cp00937a
Received 4th March 2014,Accepted 4th April 2014
DOI: 10.1039/c4cp00937a
www.rsc.org/pccp
PCCP
PAPER View Article OnlineView Journal | View Issue
This journal is© the Owner Societies 2014 Phys. Chem. Chem. Phys., 2014, 16, 11218--11227 | 11219
stoichiometric Li2MnO3 at the usual operating voltage of Li ionbatteries (4.1 V vs. Li/Li+).37 Therefore, as Mn4+ has beenconsidered to be inert in electrochemical reactions, it requiresa specific mechanism for activating the material to use itas a cathode. The most common activation process consistsof the introduction of oxygen vacancies by elevating thepotential to 4.5 V or even higher.38–40 However, Li2MnO3 treatedby such an activation procedure still needs improvementespecially in cyclability for practical purposes.37 Pasero et al.reported the oxygen deficiency in Li2MnO3, leading to theformation of Mn3+, but the low amount of oxygen vacancieswas not enough to explain the high rechargeable capacity.41
Lu and Dahn suggested that both Li and O atoms were removedduring the first charging, except in a compound with Niimpurities, which can act as electrochemically active species(oxidation of Ni2+ to Ni4+).29 Kim et al. suggested that theremoval of Li atoms was subsequently accompanied by oxygenloss due to the removal of electrons from the O 2p band.42
Finally, another mechanism, proposed by Robertson andBruce, is that the charging occurred by the oxidation of thenonaqueous electrolyte and that those generated protons wereexchanged for Li ions in Li2MnO3.36
Parallel to the experimental studies, ab initio calculationsbased on density functional theory (DFT) are powerful toolsto unveil, at the atomic scale, the mechanisms underlying theelectrochemical properties of these layered oxide cathodematerials.43–46 Most of the theoretical efforts have been focusedon LiCoO2, from the fundamental and electronic properties47–50
to the phase diagrams or Li diffusion behavior.48,50–54 Althoughless frequent, there are also several studies devoted to theunderstanding of the properties of both LiMnO2 and the OLOcomposite material, Li2MnO3. For instance, Wang et al. studiedthe thermal stability of the layered oxides,55 Shin et al. reportedthe solubility of the Mn cations from xLi2MnO3(1 � x)LiMO2
(M = Mn, Ni, or Co) into the surface-treated layer, to prove thatthe small solubility might account for the improved electro-chemical cycling stability and rate capability observed in theirown experiments.56 On the other hand, Okamoto showed thatthe introduction of O-vacancies activates the Mn sites as theredox centers for the Li extraction from Li2MnO3.37 Koyamaet al. identified a disordered stacking sequence of Mn–Li layersin Li2MnO3 to account for the wide potential plateau followingthe first Li extraction at high potential (4.6 V).57
However, as we stated previously, at these high potentials Liextraction is accompanied either by oxygen loss at the surfaceof the highly delithiated Li1�xMnO2 (0.5 o x o 1) componentwith a concomitant reduction of the Mn ions or by the removalof Li and O from the Li2MnO3 phase without any change to thetetravalent oxidation state of the Mn cations (i.e., with a net lossof Li2O).56 The other important drawback of the layered Mnoxides, the phase transformation into a spinel structure withthe removal of Li ions, still remains unsolved.27,28
In this work, we have used ab initio calculations based onDFT to perform a detailed analysis of the phase compositionand the thermodynamic stability of xLi2MnO3(1 � x)LiMnO2.We obtained the phase diagram as a function of temperature to
examine the effects of synthesis temperature and the partialpressure of oxygen on the formation of the different phases andthe evolution of their relative stabilities with temperature. Ourmain goal is to investigate the thermal stability of the Li and/orO vacancies as the activation mechanism for the electro-chemical redox activity of the OLO composite structures.Finally, by using a recently developed method to determinesolid-state transformations,58 we will examine the mechanismsthat lead to the transformation of the layered Mn oxide into thespinel phase, in an attempt to improve the cycling stability andthe rate capability of the Mn layered oxides as cathode materialsfor Li-ion batteries.
2 Methods2.1 Ab initio calculations
All the calculations performed in this work have been done usingthe DFT method as implemented in the Viena Ab initio SimulationPackage (VASP) code59,60 within the Projector-Augmented-Wave(PAW) approach.61 Given the different techniques and problemsaddressed in this study, we now describe in detail the differenttheoretical approaches used in our calculations.
2.2 Phase stability
The phase stability of the different compounds studied in ourwork was obtained by constructing the appropriate Li–Mn–Ocomputational phase diagram. We considered in our calcula-tions all the known binary and ternary compounds with Li, Mnand O, as included in the Inorganic Crystal Structure Database(see Table 1).62
The Gibbs free energies of all the compounds need to becompared to construct a phase diagram, because the diagramshows the most stable phases under certain conditions. For thedifferent phases of the Li–Mn–O system, the stability of eachphase (with and without defects) is determined by comparingthe normalized Gibbs free energies:
GðLixMnyOzÞ ¼GðT ;P;LixMnyOzÞ
xþ yþ z(1)
Table 1 Calculated formation energies of stable bulk compounds in theLi–Mn–O system. For each stoichiometry, only the most stable compoundis shown
Compound Structure Space group ef (eV per atom)
Mn fcc Fm%3m �6.0269Li bcc Im%3m �1.894812O2 Gas phase �4.9295LiMnO2 Layered O3 R%3m �1.9960Li2MnO3 Layered O3 C2/m �1.9293LiMn2O4 Spinel Fd%3m �1.8389Li2Mn3O7 Triclinic P%1 �1.7306MnO Rocksalt Fm%3m �2.1853Mn2O3 a Pbca �1.9137Mn3O4 Hausmannite I41/amd �2.0491Mn2O5 Mullite P4/mbm �0.8240Mn5O8 Monoclinic C2/m �1.8028MnO2 Trigonal R%3m �1.5107Li2O Fluorite Fm%3m �1.8646Li2O2 Hexagonal P63/mmc �1.4381
Paper PCCP
View Article Online
11220 | Phys. Chem. Chem. Phys., 2014, 16, 11218--11227 This journal is© the Owner Societies 2014
As the changes in pressure, volume and entropy have a negli-gible effect on solids (not for the oxygen molecule, as wewill discuss in the next paragraph),55,63,64 this equation canbe approximated as:
GðLixMnyOzÞ ¼GðT ;P;LixMnyOzÞ
xþ yþ z� E0ð0K;LixMnyOzÞ
xþ yþ z
(2)
There are only two independent variables in the compositionspace and, for each phase, the position on a ternary diagramand the normalized Gibbs free energy represent a unique pointin a 3-D space. The ternary phase diagram is then obtained bytaking the convex hull (the smallest convex set containing allthe Gibbs free energies) and projecting it onto a plane.63,65
In a similar way, we can construct the ternary phase diagramusing the pH as an independent variable. Indeed, assumingthat the surface of the cathode material is in equilibrium withbulk water with a specific pH value,66,67 the oxygen chemicalpotential of the ternary Li–Mn–O system
m(Li–Mn–O) = m(Li) + m(Mn) + m(O) (3)
is related to the water chemical potential:
m(H2O) = 2m(H) + m(O) (4)
The chemical potential of hydrogen is related to the chemicalpotentials of electrons and protons:
m(H) = m(H+) + m(e�), (5)
which in turn is related to the pH value by the followingrelation:
m(H+) = mo � pH � 0.05918 eV, (6)
where mo is the proton solvation enthalpy in water,66,67 and thechemical potential of the electrons is assumed to be fixed at theFermi level of a system of reference. In our work, we chosethe OLO, Li2MnO3, as a reference. Additional tests performedshowed that there are no practical changes in the obtainedresults if we substitute the OLO by any other Li–Mn–O cathodematerial studied in this work. Using the above equations, wecan express the chemical potential of oxygen as a function ofthe pH and, thus, study the ternary phase diagram as a functionof the acidic or basic characteristics of the media.
The total energy calculations were performed using thePerdew–Burke–Ernzerhof (PBE) generalized-gradient approxi-mation (GGA) functional,68 and the plane-wave cut off usedwas 500 eV in all cases. For all the compounds, a k-point meshwithin the Monkhorst–Pack scheme69 was used to ensure aconvergence of 1 meV per unit cell. Structural relaxations wereperformed without including any constraint to a tolerance of10�4 eV in the total energy and 0.01 eV Å�1 in the forces onevery atom. The initial structures for each compound weretaken from the materials project database.70 All calculationswere spin-polarized and both ferromagnetic (FM) and anti-ferromagnetic (AFM) configurations were considered. Thetotal energies used to construct the phase diagram correspond
to the lower energy magnetic configuration found for eachcompound.
Although PAW potentials have been extensively used in thestudy of positive electrode materials for Li-ion batteries, theGGA is known to show large errors in the calculation ofthe electrochemical properties of these materials. The reasonsare the different chemical environments during the redox pro-cesses: from metallic Li to a transition metal (TM) in a oxyaniongroup; and also the well-known tendency of the GGA to over-estimate the delocalization of the d-redox electrons of the TMand their hybridization with the O p states, which to a largeextent determines the electrochemical properties of the cathodematerial.71,72 By explicitly including an onsite coulomb, U, andexchange, J, terms in the Hamiltonian (GGA + U approach), wecan partially correct the electron over-delocalization (and theself-interaction errors) and accurately calculate the electro-chemical properties.73 It is then crucial to precisely determinethe value of the U parameter to perform GGA + U DFT calcula-tions. Although different values have been reported for the Uparameter, and they might depend on the crystal structure andthe oxidation state of the Mn cation involved, we need to set up acommon value throughout all the calculations in order to avoidthe strong dependence of the total energy on the U parameterwhen comparing the formation energies of the different com-pounds and building the phase diagram. The U parameter hasbeen obtained by means of a linear response method,72,73 and itwas set to 5.2 eV for all the compounds considered in this work.The J value was set to 0 eV in all cases, as only the U � Jdifference is relevant for the calculations.
To analyze the thermochemistry of an oxide system, it is alsoimportant to accurately determine the energy changes occurringduring the oxidation reaction. As stated previously, the U para-meter accounts for the over-delocalization of the d-electrons ofMn, but other sources of error come from the overestimation ofthe oxygen dimer binding energy and a possible contributionassociated with the addition of two electrons to the oxygenp-orbitals to form O2� from O2.64,73,74 Thus, by properly deter-mining the chemical potentials of O2, we can compensateDFT errors and improve the accuracy of the obtained phasediagrams. A correction term for the oxygen molecule is thenincluded in the calculation of the formation energies(the room-temperature enthalpy of O2 was determined to be�8.95 eV per formula unit).64,73,74 This term has been obtainedby calculating the formation enthalpies of several oxides andcomparing them with the experimental values, in order toobtain the best agreement possible for the enthalpy of theoxygen gas molecule.64 To calculate the phase diagrams atdifferent temperatures, we obtained the dependence of thechemical potential of O2 with temperature and pressure usingthe data in the JANAF thermochemical tables.75
2.3 Electrochemical stability
To assess the electrochemical stability of a Li–Mn–O systemunder real experimental conditions, i.e., open to Li or Oenvironments, we build the Li–Mn–O phase diagram in thechemical potential space. To find meaningful limits for the
PCCP Paper
View Article Online
This journal is© the Owner Societies 2014 Phys. Chem. Chem. Phys., 2014, 16, 11218--11227 | 11221
chemical potentials, we follow the methodology proposed inref. 74. The chemical potentials are not independent, they haveto be summed as the free energy of the bulk compound for astoichiometric system:
gb =P
ximi (7)
where xi is the number of atoms per formula unit of species i.Assuming that the entropic and volumetric contributions arenegligible,55,63,64 the free energy can be approximated by theenergy obtained directly from DFT calculations (eb). The upperlimits for the chemical potentials are established by the pureelements, which are then defined as reference chemical potentials,mI* = E0
i , where E0i is the energy per atom of the pure element.
Metallic Li and the O2 gas phase are the reference states. The lowerlimits can be defined from the relation between the chemicalpotentials and the DFT energy of the corresponding bulk com-pound (eqn (3)). The valid range of the chemical potential wouldthen be given by, ef/xi o (mi � mI*) o 0, with the formation energy,ef, defined as, ef = eb �
PximI*. This equation reflects the
stability of every compound with respect to the reference states(in our calculations, we used the fcc phase of Mn as a referencestate for the TM). There are similar conditions for the equili-brium of the different compounds in a ternary system. Bycombining all of them, the phase diagram in the chemicalpotential space can then be plotted.
2.4 Solid state transformations
The climbing image-nudged elastic band method (CI-NEB) allowsus to obtain the minimum energy path (MEP) between a set of twodifferent states.76–78 Usually, the initial and final states correspondto different configurations of the same system. The challenge offinding reaction paths for solid–solid transformations comes fromtaking into account that there are two different types of variables,i.e., those describing the atomic motion and those describing thegeometry of the periodic cell. In the standard CI-NEB method,77,78
the atomic coordinates are moved according to the forces on theatoms. The analogy for the cell vectors is the stress acting on thematerial. A relationship between stress, strain and the change incell vectors is then needed. The last step consists of coupling thecell and atomic variables (they have different units and scalingrelations) and combining them in a single vector. The method isdescribed in detail in ref. 58. In our calculations, the initial state isa layered Mn oxide with half of the Li atoms removed (to match thestoichiometry of the spinel structure), and the final state is thespinel phase.
3 Results3.1 Li–Mn–O phase diagram in the chemical potential space
We obtained the formation energies of a series of Li–Mn–Ocompounds, taking into account the correction for the bindingenergy of the aforementioned O2 molecule. The results areshown in Table 1 (for each stoichiometry, only the most stablecompound is shown). All of them correspond to a U value of5.2 eV. Although the total energy is obviously affected by the
specific value of the U parameter, the general trends in theformation energies are invariant to small deviations from theadopted value.
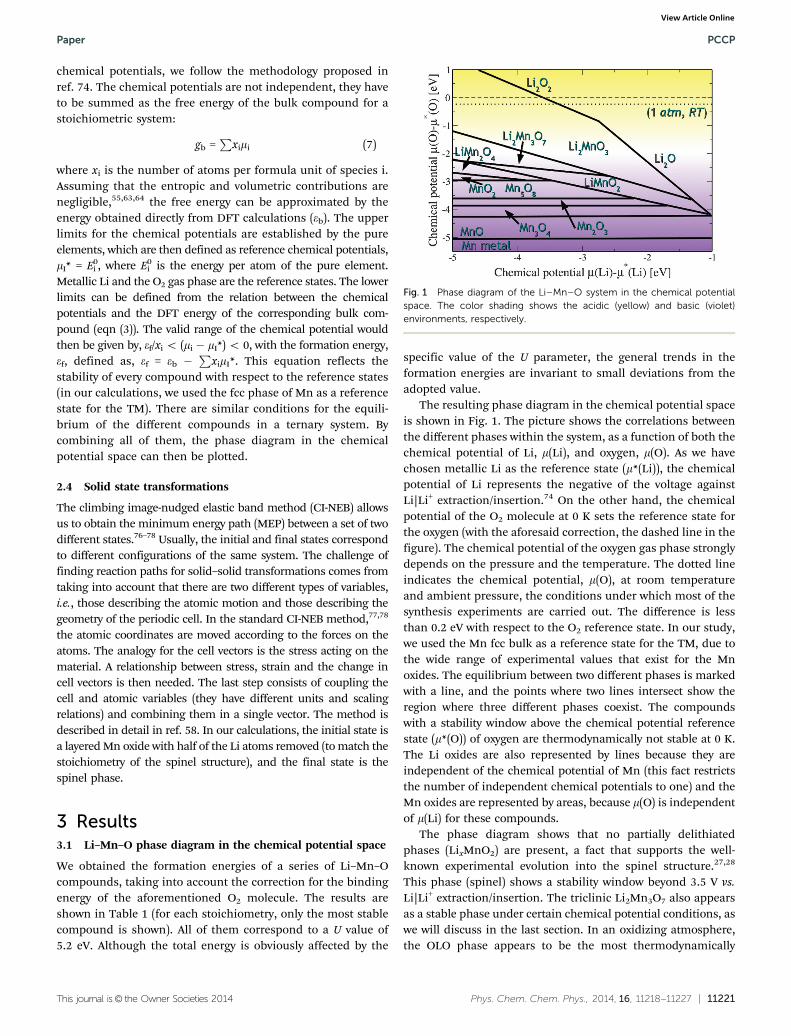
The resulting phase diagram in the chemical potential spaceis shown in Fig. 1. The picture shows the correlations betweenthe different phases within the system, as a function of both thechemical potential of Li, m(Li), and oxygen, m(O). As we havechosen metallic Li as the reference state (m*(Li)), the chemicalpotential of Li represents the negative of the voltage againstLi|Li+ extraction/insertion.74 On the other hand, the chemicalpotential of the O2 molecule at 0 K sets the reference state forthe oxygen (with the aforesaid correction, the dashed line in thefigure). The chemical potential of the oxygen gas phase stronglydepends on the pressure and the temperature. The dotted lineindicates the chemical potential, m(O), at room temperatureand ambient pressure, the conditions under which most of thesynthesis experiments are carried out. The difference is lessthan 0.2 eV with respect to the O2 reference state. In our study,we used the Mn fcc bulk as a reference state for the TM, due tothe wide range of experimental values that exist for the Mnoxides. The equilibrium between two different phases is markedwith a line, and the points where two lines intersect show theregion where three different phases coexist. The compoundswith a stability window above the chemical potential referencestate (m*(O)) of oxygen are thermodynamically not stable at 0 K.The Li oxides are also represented by lines because they areindependent of the chemical potential of Mn (this fact restrictsthe number of independent chemical potentials to one) and theMn oxides are represented by areas, because m(O) is independentof m(Li) for these compounds.
The phase diagram shows that no partially delithiatedphases (LixMnO2) are present, a fact that supports the well-known experimental evolution into the spinel structure.27,28
This phase (spinel) shows a stability window beyond 3.5 V vs.Li|Li+ extraction/insertion. The triclinic Li2Mn3O7 also appearsas a stable phase under certain chemical potential conditions, aswe will discuss in the last section. In an oxidizing atmosphere,the OLO phase appears to be the most thermodynamically
Fig. 1 Phase diagram of the Li–Mn–O system in the chemical potentialspace. The color shading shows the acidic (yellow) and basic (violet)environments, respectively.
Paper PCCP
View Article Online
11222 | Phys. Chem. Chem. Phys., 2014, 16, 11218--11227 This journal is© the Owner Societies 2014
stable but, upon reduction (i.e., oxygen evolution), it transformsinto the standard layered oxide, LiMnO2. While the over-lithiation leads to the formation of Li2O (under reduction)and Li2O2 (under oxidizing conditions), the delithiation (underenough reducing conditions) leads to the formation of thedifferent Mn oxides. Both Li2O and Li2O2 are the main reactionproducts of the activation mechanisms (Li and/or O vacancies)of the redox activity of the OLO composite structure.38–40 Thelowest region corresponds to the Mn fcc bulk, which is taken asthe reference state in the calculation of the formation energies.
3.2 Phase stability of Li vacancy and O evolution activationmechanisms
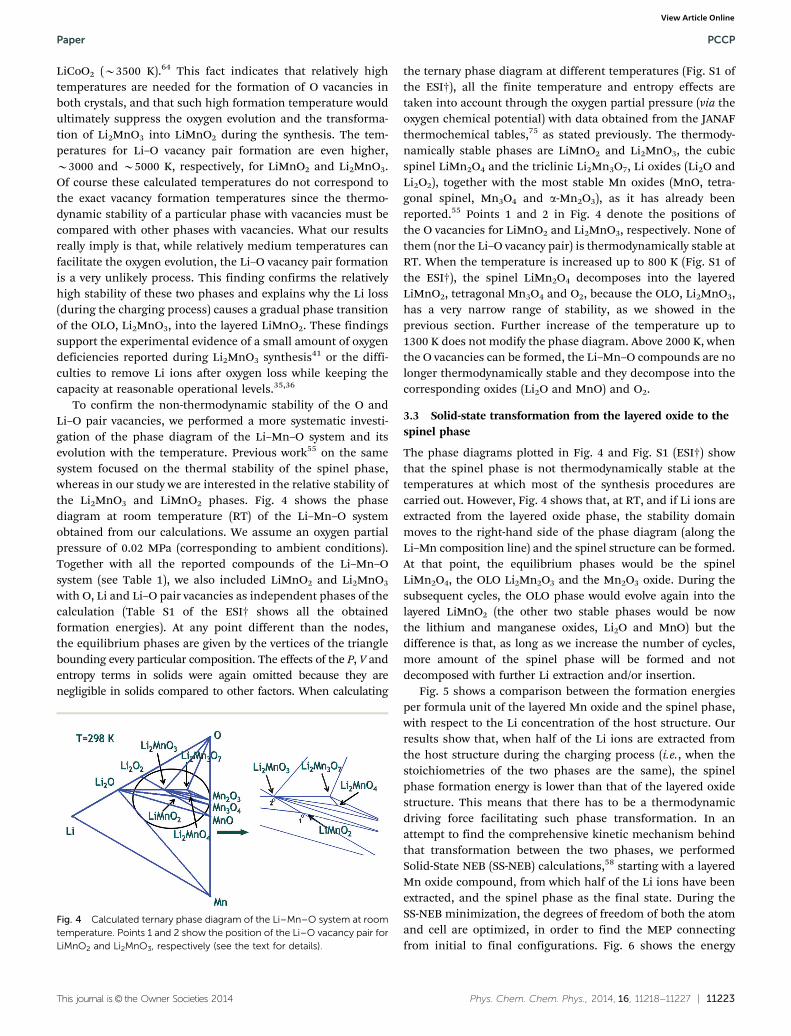
We calculated the formation energies of O and Li vacancies inboth LiMnO2 and Li2MnO3 crystals, in order to verify if thetemperatures of formation and the thermodynamic stability ofthe resulting structures can account for the activation mecha-nisms experimentally proposed.38–40 Taking the most stable Ovacancy site obtained, the formation energies of the Li–Ovacancy pairs have also been calculated, since the coexistenceof both vacancies may be favourable in order to maintainthe charge neutrality of the crystal. There is one inequivalentoxygen site for LiMnO2, as shown in Fig. 2. For the Li2MnO3
crystal and, due to the presence of mixed Li–Mn layers, thereare in principle three inequivalent O sites (marked from 1 to3 in Fig. 2), but the symmetry of the crystal and the similarity ofthe distance between O and Li ions when Li is in a pure Li or ina mixed Li–Mn layer (2.12 and 2.08 Å, respectively) reduce theinequivlaent positions to two different formation energies. Thedifference between them is 0.025 eV per f.u., with the position 1as the most stable site for O vacancy formation. The effectivecharges of the Mn ions closer to the O vacancies are 5.53 and5.16e� for LiMnO2 and Li2MnO3 crystals, respectively, reflecting asmall charge transfer from the O2� vacancy site to the neighboringMn3+ (in LiMnO2) or Mn4+ (in Li2MnO3) ions.
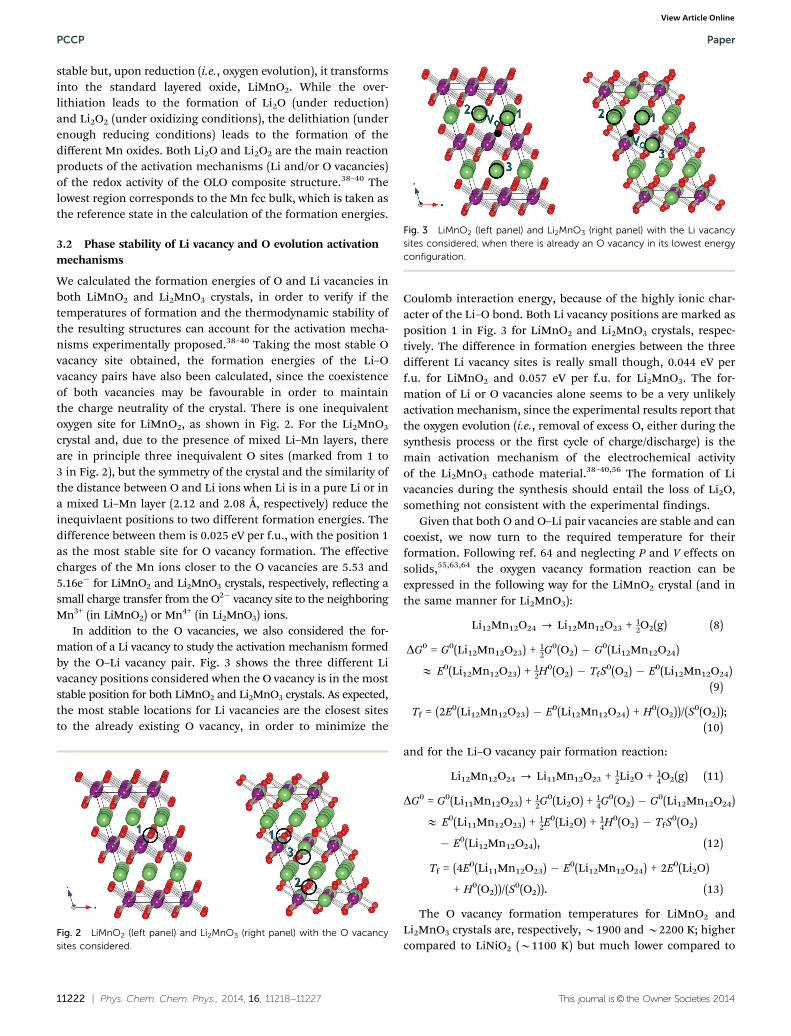
In addition to the O vacancies, we also considered the for-mation of a Li vacancy to study the activation mechanism formedby the O–Li vacancy pair. Fig. 3 shows the three different Livacancy positions considered when the O vacancy is in the moststable position for both LiMnO2 and Li2MnO3 crystals. As expected,the most stable locations for Li vacancies are the closest sitesto the already existing O vacancy, in order to minimize the
Coulomb interaction energy, because of the highly ionic char-acter of the Li–O bond. Both Li vacancy positions are marked asposition 1 in Fig. 3 for LiMnO2 and Li2MnO3 crystals, respec-tively. The difference in formation energies between the threedifferent Li vacancy sites is really small though, 0.044 eV perf.u. for LiMnO2 and 0.057 eV per f.u. for Li2MnO3. The for-mation of Li or O vacancies alone seems to be a very unlikelyactivation mechanism, since the experimental results report thatthe oxygen evolution (i.e., removal of excess O, either during thesynthesis process or the first cycle of charge/discharge) is themain activation mechanism of the electrochemical activityof the Li2MnO3 cathode material.38–40,56 The formation of Livacancies during the synthesis should entail the loss of Li2O,something not consistent with the experimental findings.
Given that both O and O–Li pair vacancies are stable and cancoexist, we now turn to the required temperature for theirformation. Following ref. 64 and neglecting P and V effects onsolids,55,63,64 the oxygen vacancy formation reaction can beexpressed in the following way for the LiMnO2 crystal (and inthe same manner for Li2MnO3):
Li12Mn12O24 - Li12Mn12O23 + 12O2(g) (8)
DG0 = G0(Li12Mn12O23) + 12G0(O2) � G0(Li12Mn12O24)
E E0(Li12Mn12O23) + 12H0(O2) � TfS0(O2) � E0(Li12Mn12O24)
(9)
Tf = (2E0(Li12Mn12O23) � E0(Li12Mn12O24) + H0(O2))/(S0(O2));(10)
and for the Li–O vacancy pair formation reaction:
Li12Mn12O24 - Li11Mn12O23 + 12Li2O + 1
4O2(g) (11)
DG0 = G0(Li11Mn12O23) + 12G0(Li2O) + 1
4G0(O2) � G0(Li12Mn12O24)
E E0(Li11Mn12O23) + 12E0(Li2O) + 1
4H0(O2) � TfS0(O2)
� E0(Li12Mn12O24), (12)
Tf = (4E0(Li11Mn12O23) � E0(Li12Mn12O24) + 2E0(Li2O)
+ H0(O2))/(S0(O2)). (13)
The O vacancy formation temperatures for LiMnO2 andLi2MnO3 crystals are, respectively, B1900 and B2200 K; highercompared to LiNiO2 (B1100 K) but much lower compared to
Fig. 2 LiMnO2 (left panel) and Li2MnO3 (right panel) with the O vacancysites considered.
Fig. 3 LiMnO2 (left panel) and Li2MnO3 (right panel) with the Li vacancysites considered, when there is already an O vacancy in its lowest energyconfiguration.
PCCP Paper
View Article Online
This journal is© the Owner Societies 2014 Phys. Chem. Chem. Phys., 2014, 16, 11218--11227 | 11223
LiCoO2 (B3500 K).64 This fact indicates that relatively hightemperatures are needed for the formation of O vacancies inboth crystals, and that such high formation temperature wouldultimately suppress the oxygen evolution and the transforma-tion of Li2MnO3 into LiMnO2 during the synthesis. The tem-peratures for Li–O vacancy pair formation are even higher,B3000 and B5000 K, respectively, for LiMnO2 and Li2MnO3.Of course these calculated temperatures do not correspond tothe exact vacancy formation temperatures since the thermo-dynamic stability of a particular phase with vacancies must becompared with other phases with vacancies. What our resultsreally imply is that, while relatively medium temperatures canfacilitate the oxygen evolution, the Li–O vacancy pair formationis a very unlikely process. This finding confirms the relativelyhigh stability of these two phases and explains why the Li loss(during the charging process) causes a gradual phase transitionof the OLO, Li2MnO3, into the layered LiMnO2. These findingssupport the experimental evidence of a small amount of oxygendeficiencies reported during Li2MnO3 synthesis41 or the diffi-culties to remove Li ions after oxygen loss while keeping thecapacity at reasonable operational levels.35,36
To confirm the non-thermodynamic stability of the O andLi–O pair vacancies, we performed a more systematic investi-gation of the phase diagram of the Li–Mn–O system and itsevolution with the temperature. Previous work55 on the samesystem focused on the thermal stability of the spinel phase,whereas in our study we are interested in the relative stability ofthe Li2MnO3 and LiMnO2 phases. Fig. 4 shows the phasediagram at room temperature (RT) of the Li–Mn–O systemobtained from our calculations. We assume an oxygen partialpressure of 0.02 MPa (corresponding to ambient conditions).Together with all the reported compounds of the Li–Mn–Osystem (see Table 1), we also included LiMnO2 and Li2MnO3
with O, Li and Li–O pair vacancies as independent phases of thecalculation (Table S1 of the ESI† shows all the obtainedformation energies). At any point different than the nodes,the equilibrium phases are given by the vertices of the trianglebounding every particular composition. The effects of the P, V andentropy terms in solids were again omitted because they arenegligible in solids compared to other factors. When calculating
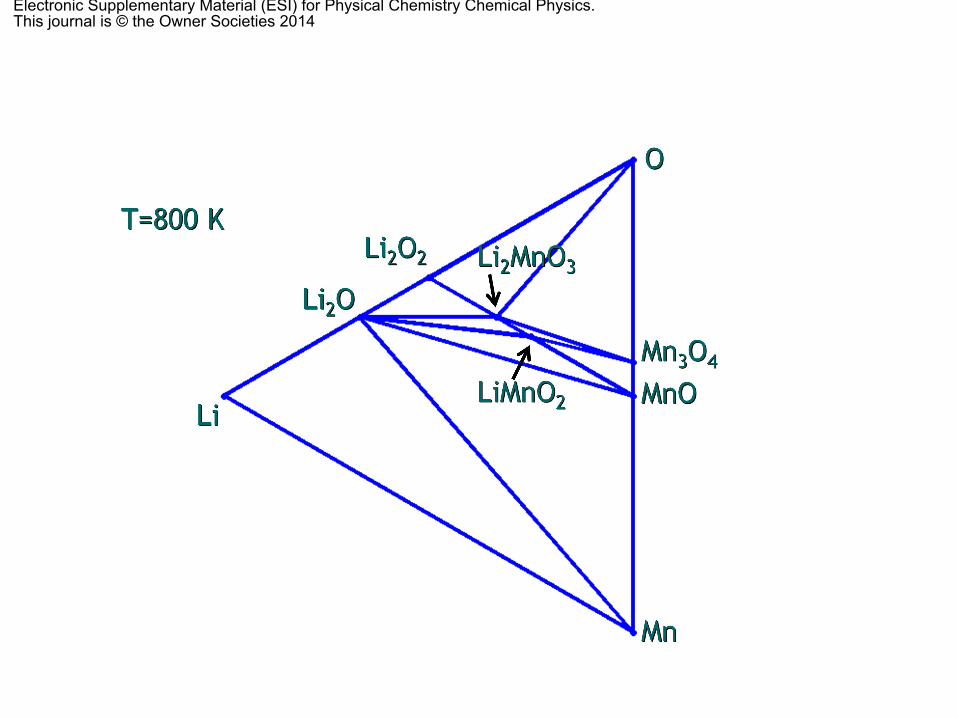
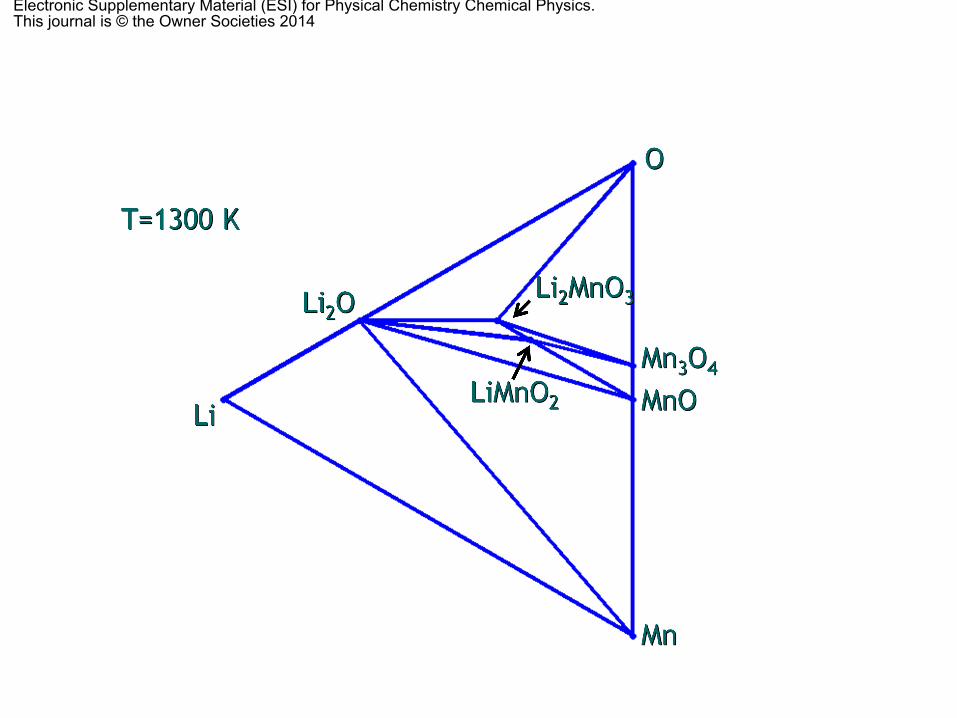
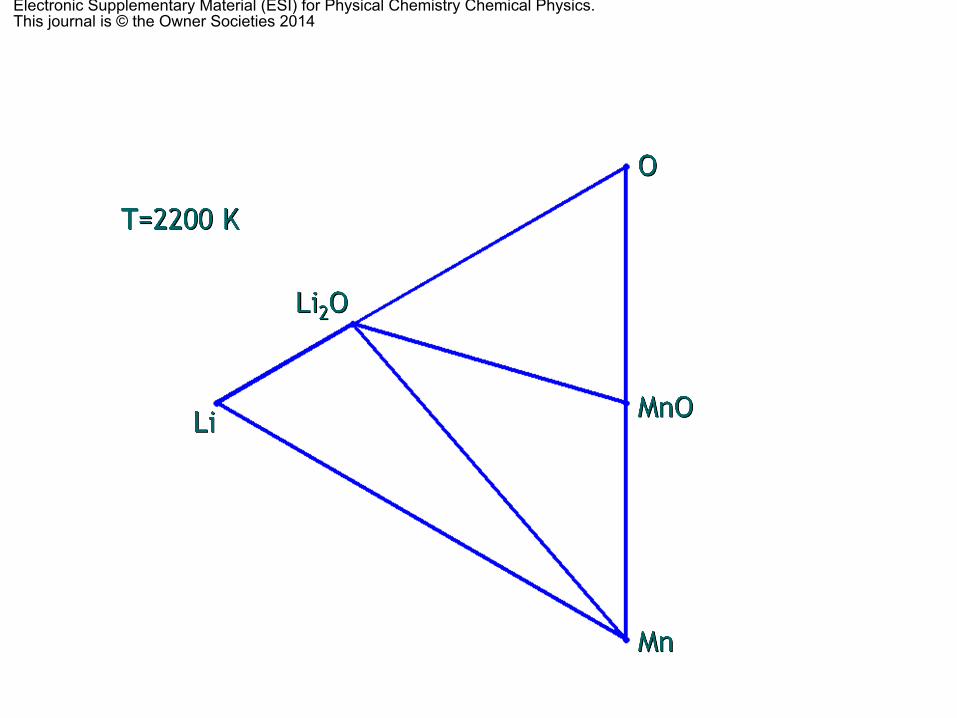
the ternary phase diagram at different temperatures (Fig. S1 ofthe ESI†), all the finite temperature and entropy effects aretaken into account through the oxygen partial pressure (via theoxygen chemical potential) with data obtained from the JANAFthermochemical tables,75 as stated previously. The thermody-namically stable phases are LiMnO2 and Li2MnO3, the cubicspinel LiMn2O4 and the triclinic Li2Mn3O7, Li oxides (Li2O andLi2O2), together with the most stable Mn oxides (MnO, tetra-gonal spinel, Mn3O4 and a-Mn2O3), as it has already beenreported.55 Points 1 and 2 in Fig. 4 denote the positions ofthe O vacancies for LiMnO2 and Li2MnO3, respectively. None ofthem (nor the Li–O vacancy pair) is thermodynamically stable atRT. When the temperature is increased up to 800 K (Fig. S1 ofthe ESI†), the spinel LiMn2O4 decomposes into the layeredLiMnO2, tetragonal Mn3O4 and O2, because the OLO, Li2MnO3,has a very narrow range of stability, as we showed in theprevious section. Further increase of the temperature up to1300 K does not modify the phase diagram. Above 2000 K, whenthe O vacancies can be formed, the Li–Mn–O compounds are nolonger thermodynamically stable and they decompose into thecorresponding oxides (Li2O and MnO) and O2.
3.3 Solid-state transformation from the layered oxide to thespinel phase
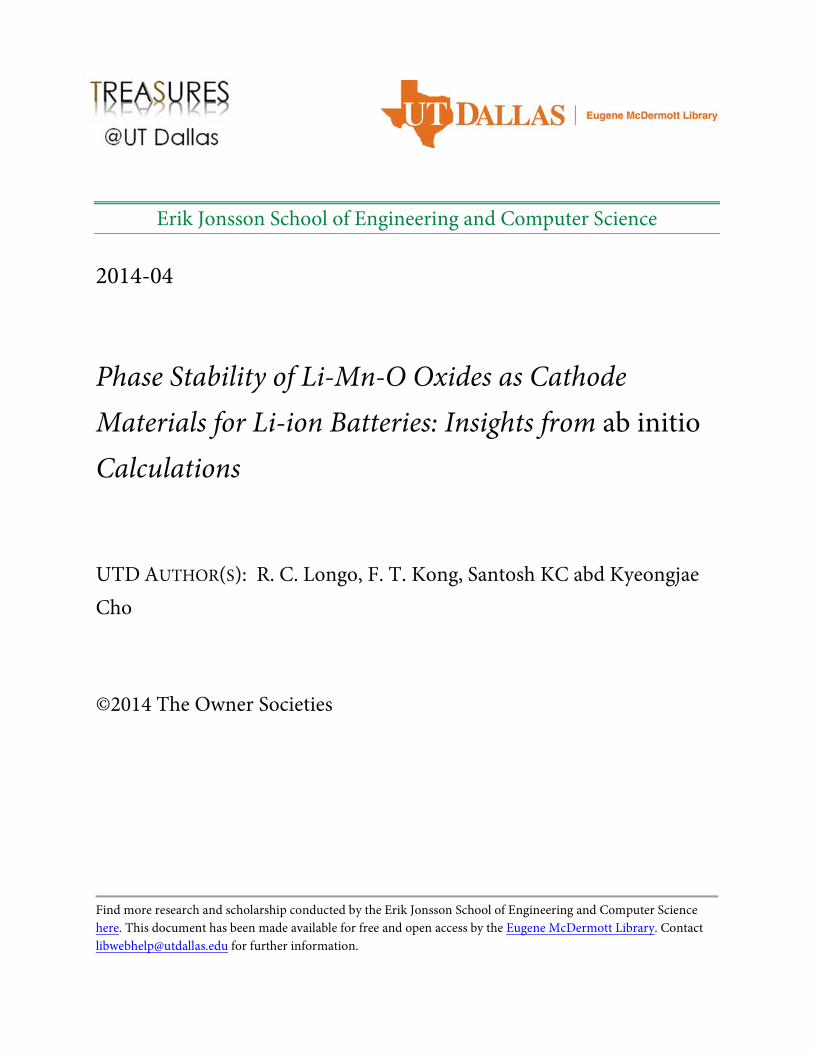
The phase diagrams plotted in Fig. 4 and Fig. S1 (ESI†) showthat the spinel phase is not thermodynamically stable at thetemperatures at which most of the synthesis procedures arecarried out. However, Fig. 4 shows that, at RT, and if Li ions areextracted from the layered oxide phase, the stability domainmoves to the right-hand side of the phase diagram (along theLi–Mn composition line) and the spinel structure can be formed.At that point, the equilibrium phases would be the spinelLiMn2O4, the OLO Li2Mn2O3 and the Mn2O3 oxide. During thesubsequent cycles, the OLO phase would evolve again into thelayered LiMnO2 (the other two stable phases would be nowthe lithium and manganese oxides, Li2O and MnO) but thedifference is that, as long as we increase the number of cycles,more amount of the spinel phase will be formed and notdecomposed with further Li extraction and/or insertion.
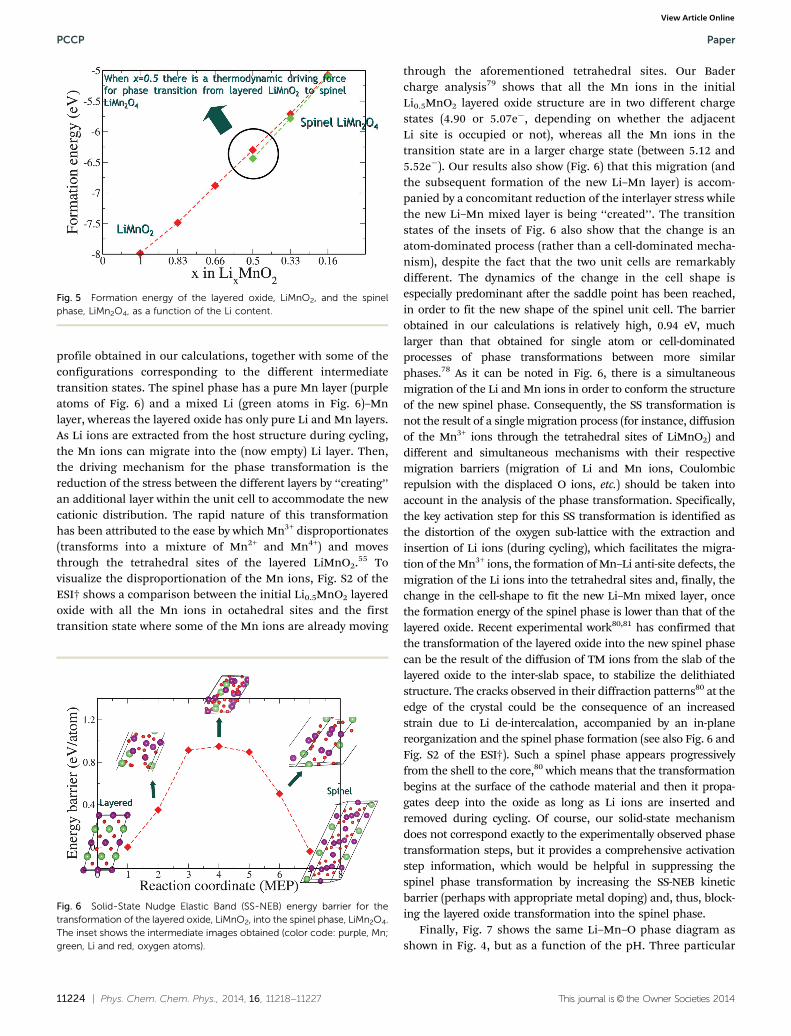
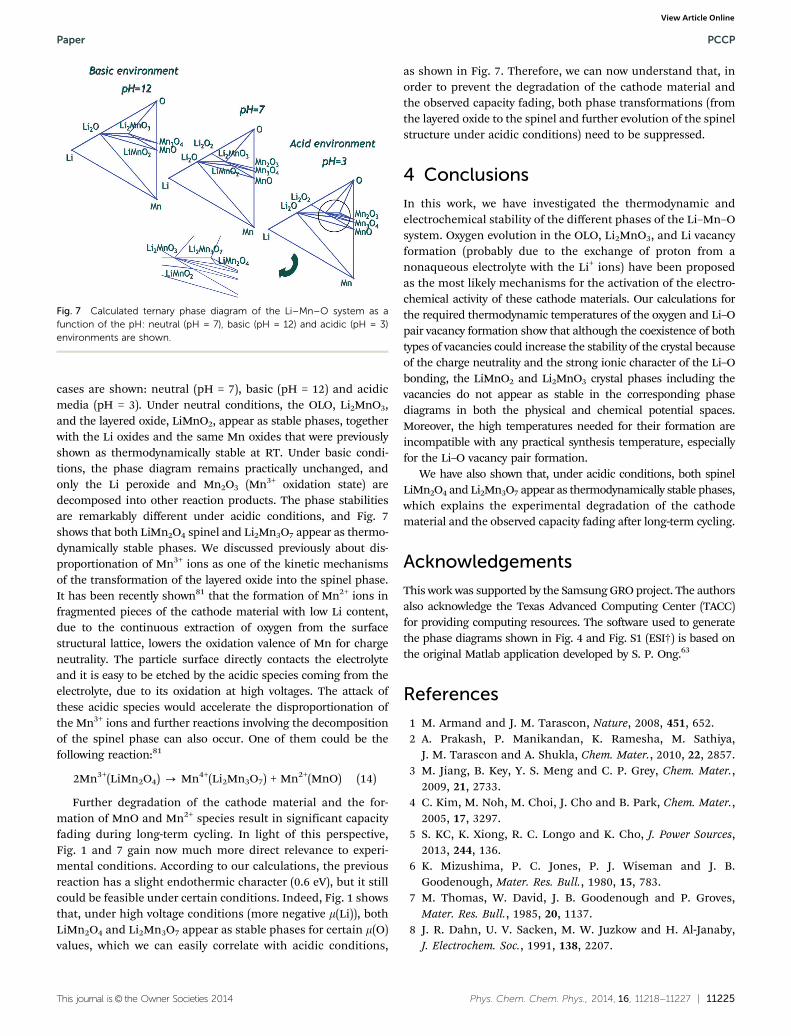
Fig. 5 shows a comparison between the formation energiesper formula unit of the layered Mn oxide and the spinel phase,with respect to the Li concentration of the host structure. Ourresults show that, when half of the Li ions are extracted fromthe host structure during the charging process (i.e., when thestoichiometries of the two phases are the same), the spinelphase formation energy is lower than that of the layered oxidestructure. This means that there has to be a thermodynamicdriving force facilitating such phase transformation. In anattempt to find the comprehensive kinetic mechanism behindthat transformation between the two phases, we performedSolid-State NEB (SS-NEB) calculations,58 starting with a layeredMn oxide compound, from which half of the Li ions have beenextracted, and the spinel phase as the final state. During theSS-NEB minimization, the degrees of freedom of both the atomand cell are optimized, in order to find the MEP connectingfrom initial to final configurations. Fig. 6 shows the energy
Fig. 4 Calculated ternary phase diagram of the Li–Mn–O system at roomtemperature. Points 1 and 2 show the position of the Li–O vacancy pair forLiMnO2 and Li2MnO3, respectively (see the text for details).
Paper PCCP
View Article Online
11224 | Phys. Chem. Chem. Phys., 2014, 16, 11218--11227 This journal is© the Owner Societies 2014
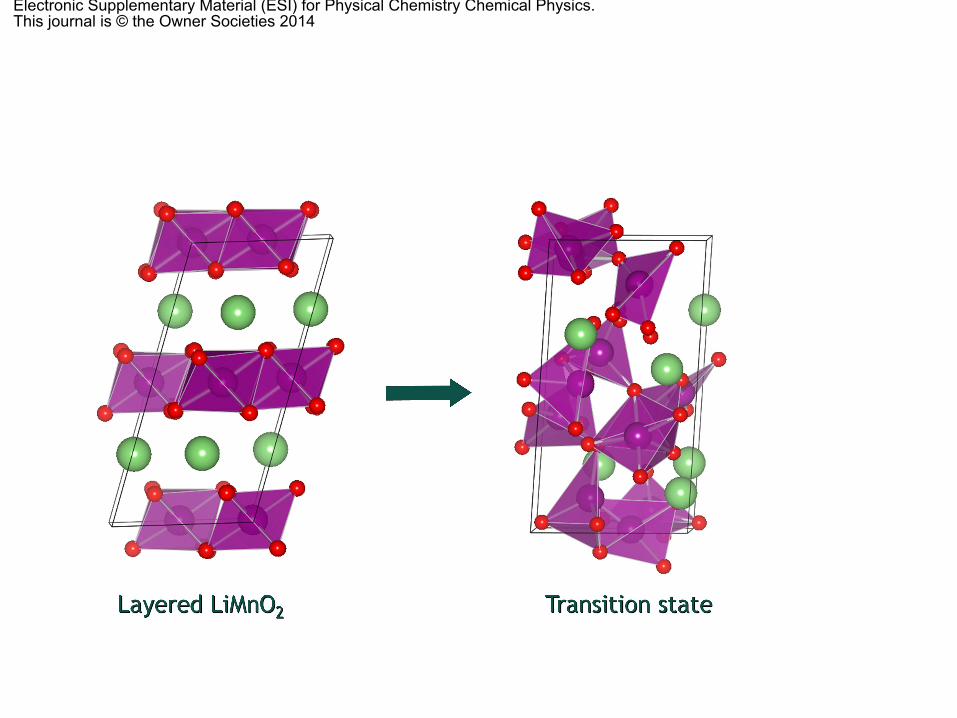
profile obtained in our calculations, together with some of theconfigurations corresponding to the different intermediatetransition states. The spinel phase has a pure Mn layer (purpleatoms of Fig. 6) and a mixed Li (green atoms in Fig. 6)–Mnlayer, whereas the layered oxide has only pure Li and Mn layers.As Li ions are extracted from the host structure during cycling,the Mn ions can migrate into the (now empty) Li layer. Then,the driving mechanism for the phase transformation is thereduction of the stress between the different layers by ‘‘creating’’an additional layer within the unit cell to accommodate the newcationic distribution. The rapid nature of this transformationhas been attributed to the ease by which Mn3+ disproportionates(transforms into a mixture of Mn2+ and Mn4+) and movesthrough the tetrahedral sites of the layered LiMnO2.55 Tovisualize the disproportionation of the Mn ions, Fig. S2 of theESI† shows a comparison between the initial Li0.5MnO2 layeredoxide with all the Mn ions in octahedral sites and the firsttransition state where some of the Mn ions are already moving
through the aforementioned tetrahedral sites. Our Badercharge analysis79 shows that all the Mn ions in the initialLi0.5MnO2 layered oxide structure are in two different chargestates (4.90 or 5.07e�, depending on whether the adjacentLi site is occupied or not), whereas all the Mn ions in thetransition state are in a larger charge state (between 5.12 and5.52e�). Our results also show (Fig. 6) that this migration (andthe subsequent formation of the new Li–Mn layer) is accom-panied by a concomitant reduction of the interlayer stress whilethe new Li–Mn mixed layer is being ‘‘created’’. The transitionstates of the insets of Fig. 6 also show that the change is anatom-dominated process (rather than a cell-dominated mecha-nism), despite the fact that the two unit cells are remarkablydifferent. The dynamics of the change in the cell shape isespecially predominant after the saddle point has been reached,in order to fit the new shape of the spinel unit cell. The barrierobtained in our calculations is relatively high, 0.94 eV, muchlarger than that obtained for single atom or cell-dominatedprocesses of phase transformations between more similarphases.78 As it can be noted in Fig. 6, there is a simultaneousmigration of the Li and Mn ions in order to conform the structureof the new spinel phase. Consequently, the SS transformation isnot the result of a single migration process (for instance, diffusionof the Mn3+ ions through the tetrahedral sites of LiMnO2) anddifferent and simultaneous mechanisms with their respectivemigration barriers (migration of Li and Mn ions, Coulombicrepulsion with the displaced O ions, etc.) should be taken intoaccount in the analysis of the phase transformation. Specifically,the key activation step for this SS transformation is identified asthe distortion of the oxygen sub-lattice with the extraction andinsertion of Li ions (during cycling), which facilitates the migra-tion of the Mn3+ ions, the formation of Mn–Li anti-site defects, themigration of the Li ions into the tetrahedral sites and, finally, thechange in the cell-shape to fit the new Li–Mn mixed layer, oncethe formation energy of the spinel phase is lower than that of thelayered oxide. Recent experimental work80,81 has confirmed thatthe transformation of the layered oxide into the new spinel phasecan be the result of the diffusion of TM ions from the slab of thelayered oxide to the inter-slab space, to stabilize the delithiatedstructure. The cracks observed in their diffraction patterns80 at theedge of the crystal could be the consequence of an increasedstrain due to Li de-intercalation, accompanied by an in-planereorganization and the spinel phase formation (see also Fig. 6 andFig. S2 of the ESI†). Such a spinel phase appears progressivelyfrom the shell to the core,80 which means that the transformationbegins at the surface of the cathode material and then it propa-gates deep into the oxide as long as Li ions are inserted andremoved during cycling. Of course, our solid-state mechanismdoes not correspond exactly to the experimentally observed phasetransformation steps, but it provides a comprehensive activationstep information, which would be helpful in suppressing thespinel phase transformation by increasing the SS-NEB kineticbarrier (perhaps with appropriate metal doping) and, thus, block-ing the layered oxide transformation into the spinel phase.
Finally, Fig. 7 shows the same Li–Mn–O phase diagram asshown in Fig. 4, but as a function of the pH. Three particular
Fig. 5 Formation energy of the layered oxide, LiMnO2, and the spinelphase, LiMn2O4, as a function of the Li content.
Fig. 6 Solid-State Nudge Elastic Band (SS-NEB) energy barrier for thetransformation of the layered oxide, LiMnO2, into the spinel phase, LiMn2O4.The inset shows the intermediate images obtained (color code: purple, Mn;green, Li and red, oxygen atoms).
PCCP Paper
View Article Online
This journal is© the Owner Societies 2014 Phys. Chem. Chem. Phys., 2014, 16, 11218--11227 | 11225
cases are shown: neutral (pH = 7), basic (pH = 12) and acidicmedia (pH = 3). Under neutral conditions, the OLO, Li2MnO3,and the layered oxide, LiMnO2, appear as stable phases, togetherwith the Li oxides and the same Mn oxides that were previouslyshown as thermodynamically stable at RT. Under basic condi-tions, the phase diagram remains practically unchanged, andonly the Li peroxide and Mn2O3 (Mn3+ oxidation state) aredecomposed into other reaction products. The phase stabilitiesare remarkably different under acidic conditions, and Fig. 7shows that both LiMn2O4 spinel and Li2Mn3O7 appear as thermo-dynamically stable phases. We discussed previously about dis-proportionation of Mn3+ ions as one of the kinetic mechanismsof the transformation of the layered oxide into the spinel phase.It has been recently shown81 that the formation of Mn2+ ions infragmented pieces of the cathode material with low Li content,due to the continuous extraction of oxygen from the surfacestructural lattice, lowers the oxidation valence of Mn for chargeneutrality. The particle surface directly contacts the electrolyteand it is easy to be etched by the acidic species coming from theelectrolyte, due to its oxidation at high voltages. The attack ofthese acidic species would accelerate the disproportionation ofthe Mn3+ ions and further reactions involving the decompositionof the spinel phase can also occur. One of them could be thefollowing reaction:81
2Mn3+(LiMn2O4) - Mn4+(Li2Mn3O7) + Mn2+(MnO) (14)
Further degradation of the cathode material and the for-mation of MnO and Mn2+ species result in significant capacityfading during long-term cycling. In light of this perspective,Fig. 1 and 7 gain now much more direct relevance to experi-mental conditions. According to our calculations, the previousreaction has a slight endothermic character (0.6 eV), but it stillcould be feasible under certain conditions. Indeed, Fig. 1 showsthat, under high voltage conditions (more negative m(Li)), bothLiMn2O4 and Li2Mn3O7 appear as stable phases for certain m(O)values, which we can easily correlate with acidic conditions,
as shown in Fig. 7. Therefore, we can now understand that, inorder to prevent the degradation of the cathode material andthe observed capacity fading, both phase transformations (fromthe layered oxide to the spinel and further evolution of the spinelstructure under acidic conditions) need to be suppressed.
4 Conclusions
In this work, we have investigated the thermodynamic andelectrochemical stability of the different phases of the Li–Mn–Osystem. Oxygen evolution in the OLO, Li2MnO3, and Li vacancyformation (probably due to the exchange of proton from anonaqueous electrolyte with the Li+ ions) have been proposedas the most likely mechanisms for the activation of the electro-chemical activity of these cathode materials. Our calculations forthe required thermodynamic temperatures of the oxygen and Li–Opair vacancy formation show that although the coexistence of bothtypes of vacancies could increase the stability of the crystal becauseof the charge neutrality and the strong ionic character of the Li–Obonding, the LiMnO2 and Li2MnO3 crystal phases including thevacancies do not appear as stable in the corresponding phasediagrams in both the physical and chemical potential spaces.Moreover, the high temperatures needed for their formation areincompatible with any practical synthesis temperature, especiallyfor the Li–O vacancy pair formation.
We have also shown that, under acidic conditions, both spinelLiMn2O4 and Li2Mn3O7 appear as thermodynamically stable phases,which explains the experimental degradation of the cathodematerial and the observed capacity fading after long-term cycling.
Acknowledgements
This work was supported by the Samsung GRO project. The authorsalso acknowledge the Texas Advanced Computing Center (TACC)for providing computing resources. The software used to generatethe phase diagrams shown in Fig. 4 and Fig. S1 (ESI†) is based onthe original Matlab application developed by S. P. Ong.63
References
1 M. Armand and J. M. Tarascon, Nature, 2008, 451, 652.2 A. Prakash, P. Manikandan, K. Ramesha, M. Sathiya,
J. M. Tarascon and A. Shukla, Chem. Mater., 2010, 22, 2857.3 M. Jiang, B. Key, Y. S. Meng and C. P. Grey, Chem. Mater.,
2009, 21, 2733.4 C. Kim, M. Noh, M. Choi, J. Cho and B. Park, Chem. Mater.,
2005, 17, 3297.5 S. KC, K. Xiong, R. C. Longo and K. Cho, J. Power Sources,
2013, 244, 136.6 K. Mizushima, P. C. Jones, P. J. Wiseman and J. B.
Goodenough, Mater. Res. Bull., 1980, 15, 783.7 M. Thomas, W. David, J. B. Goodenough and P. Groves,
Mater. Res. Bull., 1985, 20, 1137.8 J. R. Dahn, U. V. Sacken, M. W. Juzkow and H. Al-Janaby,
J. Electrochem. Soc., 1991, 138, 2207.
Fig. 7 Calculated ternary phase diagram of the Li–Mn–O system as afunction of the pH: neutral (pH = 7), basic (pH = 12) and acidic (pH = 3)environments are shown.
Paper PCCP
View Article Online
11226 | Phys. Chem. Chem. Phys., 2014, 16, 11218--11227 This journal is© the Owner Societies 2014
9 M. Broussely, F. Perton, J. Labat, R. J. Staniewicz andA. Romero, J. Power Sources, 1993, 43, 209.
10 T. Ohzuku and A. Ueda, Solid State Ionics, 1994, 69, 201.11 M. Winter, J. Besenhard, M. Spahr and P. Novak, Adv.
Mater., 1998, 10, 725.12 D. Huang, Adv. Battery Technol., 1998, 11, 23.13 H. Yan, X. Huang, L. Zhonghua, H. Huang, R. Xue and
L. Chen, J. Power Sources, 1997, 68, 530.14 Y. Zhou, C. Shen and H. Li, Solid State Ionics, 2002, 146, 81.15 X. Zhu, Z. Guo, G. Du, P. Zhang and H. Liu, Surf. Coat.
Technol., 2010, 204, 1710.16 J. Zhao, L. Wang, X. He, C. Wan and C. Jiang, Int.
J. Electrochem. Sci., 2010, 5, 478.17 H. Zhang, P. J. Baker and P. S. Grant, J. Am. Ceram. Soc.,
2010, 93, 1856.18 G. Ceder, Mater. Res. Bull., 2010, 35, 693.19 P. Kalyani and N. Kalaiselvi, Sci. Technol. Adv. Mater., 2005,
6, 689.20 C. Delmas and L. Croguennec, Mater. Res. Bull., 2002,
27, 608.21 M. E. Spahr, P. Novak, B. Schnyder, O. Haas and R. Nesper,
J. Electrochem. Soc., 1998, 145, 1113.22 B. J. Hwang, Y. W. Tsai, R. Santhanam, Y. W. Wu, S. G. Hu,
J. F. Lee and D. G. Liu, J. Power Sources, 2003, 123, 206.23 K. M. Shaju, G. V. S. Rao and B. V. R. Chowdari, Electrochim.
Acta, 2002, 48, 145.24 A. R. Armstrong, N. Dupre, A. J. Paterson, C. P. Grey and
P. G. Bruce, Chem. Mater., 2004, 16, 3106.25 Z. P. Guo, K. Konstantinov, G. X. Xang, H. K. Liu and
S. X. Dou, J. Power Sources, 2003, 119–121, 221.26 I. Tomeno, Y. Kasuya and Y. Tsunoda, Phys. Rev. B: Condens.
Matter Mater. Phys., 2001, 64, 094422.27 G. Vitins and K. West, J. Electrochem. Soc., 1997, 144, 2587.28 Y. I. Jang, B. Huang, Y. M. Chiang and D. R. Sadoway,
Electrochem. Solid-State Lett., 1998, 1, 13.29 Z. H. Lu and J. R. Dahn, J. Electrochem. Soc., 2002, 149, A815.30 M. M. Thackeray, S. H. Kang, C. S. Johnson, J. T. Vaughey,
R. Benedek and S. A. Hackney, J. Mater. Chem., 2007,17, 3112.
31 C. S. Johnson, N. C. Li, C. Lefief, J. T. Vaughey andM. M. Thackeray, Chem. Mater., 2008, 20, 6095.
32 Y. Wu, A. V. Murugan and A. Manthiram, J. Electrochem.Soc., 2008, 155, A635.
33 Z. H. Lu, L. Y. Beaulieu, R. A. Donaberger, C. L. Thomas andJ. R. Dahn, J. Electrochem. Soc., 2002, 149, A778.
34 M. Tabuchi, Y. Nabeshima, T. Takeuchi, K. Tatsumi,J. Imaizumi and Y. Nitta, J. Power Sources, 2013, 195, 834.
35 A. D. Robertson and P. G. Bruce, Chem. Commun., 2002, 2790.36 A. D. Robertson and P. G. Bruce, Chem. Mater., 2003,
15, 1984.37 Y. Okamoto, J. Electrochem. Soc., 2012, 159, A152.38 A. R. Armstrong, M. Holzapfel, P. Novak, C. S. Johnson,
S. H. Kang, M. M. Thackeray and P. G. Bruce, J. Am. Chem.Soc., 2006, 128, 8694.
39 A. Ito, D. Li, Y. Ohsawa and Y. Sato, J. Power Sources, 2008,183, 344.
40 A. van Bommel, L. J. Krause and J. R. Dahn, J. Electrochem.Soc., 2011, 158, A731.
41 D. Pasero, V. McLaren, S. de Souza and A. R. West, Chem.Mater., 2005, 17, 345.
42 J. S. Kim, C. S. Johnson, J. T. Vaughey, M. M. Thackeray,S. A. Hackney, W. S. Yoon and C. P. Grey, Chem. Mater.,2004, 16, 1996.
43 V. Meunier, J. Kephart, C. Roland and J. Bernholc, Phys. Rev.Lett., 2002, 88, 75506.
44 J. Reed and G. Ceder, Electrochem. Solid-State Lett., 2002,5, A145.
45 G. Ceder, M. K. Aydinol and A. F. Kohan, Comput. Mater.Sci., 1997, 8, 161.
46 G. Luo, J. Zhao, X. Ke, P. Zhang, H. Sun and B. Wang,J. Electrochem. Soc., 2012, 159, A1203.
47 C. Wolverton and A. Zunger, Phys. Rev. B: Condens. MatterMater. Phys., 1998, 57, 2242.
48 C. Wolverton and A. Zunger, Phys. Rev. Lett., 1998, 81, 606.49 Y. Koyama, N. Yabuuchi, I. Tanaka, H. Adachi and
T. Ohzuku, J. Electrochem. Soc., 2004, 151, A1545.50 K. Kang and G. Ceder, Phys. Rev. B: Condens. Matter Mater.
Phys., 2006, 74, 094105.51 T. Motohashi, T. Ono, Y. Sugimoto, Y. Masubuchi,
S. Kikkawa, R. Kanno and M. K. H. Yamauchi, Phys. Rev.B: Condens. Matter Mater. Phys., 2009, 80, 165114.
52 A. van der Ven and G. Ceder, J. Power Sources, 2001,97–98, 529.
53 K. Kang, Y. S. Meng, J. Breger, C. P. Grey and G. Ceder,Science, 2006, 311, 977.
54 A. van der Ven and G. Ceder, Electrochem. Solid-State Lett.,2000, 3, 302.
55 L. Wang, T. Maxisch and G. Ceder, Chem. Mater., 2007,19, 543.
56 D. Shin, C. Wolverton, J. R. Croy, M. Balasubramaniam,S. H. Kang, C. M. Lopez-Rivera and M. M. Thackeray,J. Electrochem. Soc., 2012, 159, A121.
57 Y. Koyama, I. Tanaka, M. Nagao and R. Kanno, J. PowerSources, 2009, 189, 798.
58 D. Sheppard, P. Xiao, W. Chemelewski, D. D. Johnson andG. Henkelman, J. Chem. Phys., 2012, 136, 074103.
59 G. Kresse and J. Furthmuller, Comput. Mater. Sci., 1996,6, 15.
60 G. Kresse and J. Hafner, Phys. Rev. B: Condens. Matter Mater.Phys., 1993, 48, 13115.
61 P. Blochl, Phys. Rev. B: Condens. Matter Mater. Phys., 1994,50, 17953.
62 http://www.fiz-karlsruhe.com/icsd.html.63 S. P. Ong, L. Wang, B. Kang and G. Ceder, Chem. Mater.,
2008, 20, 1798.64 Y. Kim, D. Kim and S. Kang, Chem. Mater., 2011, 23, 5388.65 C. Barber, D. Dobkin and H. Huhdanpaa, ACM Trans. Math.
Software, 1996, 22, 469.66 P. Thissen, V. Thissen, S. Wippermann, Y. J. Chabal,
G. Grundmeier and W. G. Schmidt, Surf. Sci., 2012, 606, 902.67 D. Himmel, S. K. Goll, I. Leito and I. Krossing, Angew.
Chem., Int. Ed., 2010, 49, 6885.
PCCP Paper
View Article Online
This journal is© the Owner Societies 2014 Phys. Chem. Chem. Phys., 2014, 16, 11218--11227 | 11227
68 J. P. Perdew, K. Burke and M. Ernzerhof, Phys. Rev. Lett.,1996, 77, 3865.
69 H. K. Monkhorst and J. D. Pack, Phys. Rev. B: Solid State,1976, 13, 5188.
70 A. Jain, S. P. Ong, G. Hautier, W. Chen, W. D. Richards,S. Dacek, S. Cholia, D. Gunter, D. Skinner, G. Ceder andK. A. Persson, Appl. Phys. Lett. Mater., 2013, 1, 011002.
71 F. Zhou, M. Cococcioni, C. Marianetti, D. Morgan andG. Ceder, Phys. Rev. B: Condens. Matter Mater. Phys., 2004,70, 235121.
72 F. Zhou, M. Cococcioni, K. Kang and G. Ceder, Electrochem.Commun., 2004, 6, 1144.
73 L. Wang, T. Maxisch and G. Ceder, Phys. Rev. B: Condens.Matter Mater. Phys., 2006, 73, 195107.
74 D. Kramer and G. Ceder, Chem. Mater., 2009, 21, 3799.
75 M. Chase, JANAF Thermochemical Tables, American ChemicalSociety, New York, 1996.
76 H. Jonsson, G. Mills and K. W. Jacobsen, Classical andQuantum Dynamics in Condensed Phase Simulations, WorldScientific, Singapore, 1998.
77 G. Henkelman, B. P. Uberuaga and H. Jonsson, J. Chem.Phys., 2000, 113, 9901.
78 G. Henkelman, A. Arnaldsson and H. Jonsson, J. Chem.Phys., 2006, 124, 044706.
79 W. Tang, E. Sanville and G. Henkelman, J. Phys.: Condens.Matter, 2009, 21, 084204.
80 A. Boulineau, L. Simonin, J. F. Colin, E. Canevet, L. Danieland S. Patoux, Chem. Mater., 2012, 24, 3558.
81 J. Zheng, M. Gu, J. Xiao, P. Zuo, C. Wang and J. G. Zhang,Nano Lett., 2013, 13, 3824.
Paper PCCP
View Article Online
Electronic Supplementary Material (ESI) for Physical Chemistry Chemical Physics.This journal is © the Owner Societies 2014
Electronic Supplementary Material (ESI) for Physical Chemistry Chemical Physics.This journal is © the Owner Societies 2014
Electronic Supplementary Material (ESI) for Physical Chemistry Chemical Physics.This journal is © the Owner Societies 2014
Electronic Supplementary Material (ESI) for Physical Chemistry Chemical Physics.This journal is © the Owner Societies 2014