Embed Size (px)
Citation preview

PHASE REACTIONS OF THE ALLOY TIMETAL 125 AND
ITS THERMOMECHANICAL TREATMENTS
Tapiwa David Mutava
A thesis submitted to the Faculty of Engineering, University of the Witwatersrand,
Johannesburg, in fulfilment of the requirements for the degree of Doctor of Philosophy
(Metallurgical Engineering)
2017

ii
DECLARATION
I declare that this thesis is my own unaided work. It is being submitted for the Degree of Doctor
of Philosophy at the University of the Witwatersrand, Johannesburg. It has not been submitted
before for any degree or examination at any other University. Acknowledgement was given to
each source of information by means of a complete reference.
………………………..
Tapiwa David Mutava
…………….. day of……………………….2017

iii
ACKNOWLEDGEMENTS
I would like to express my sincere gratitude to my supervisors Professor Lesley Cornish and
Professor Iakovos Sigalas for their invaluable support. The experimental design relied strongly
on professor Sigalas’ in-depth knowledge and expertise. Writing this thesis would not have
been possible without Professor Cornish’s immense contribution and knowledge of the subject
matter. To you, I am ever indebted. Thank you so much.
A big thank you goes to Mr Doug Alexander, who was my HOD at Anglo American Research
at the time I started this study. You are greatly thanked for nominating and supporting me. You
gave me time to study, in spite of our busy work schedule. Thank you very much. Due
acknowledgement is given to Anglo American for their financial support, thank you.
I would also like to thank Mr Solomon Dlamini of Anglo American Research for the
metallographical preparation of all the samples.
Finally, I would like to thank my family, Eunice, Epiphania, Nokutenda, Tariro and
Anotidaishe. Thanks are due to my parents and my siblings, Petronila, Desmond, Emmanuel,
Melody and Tafadzwa. Thank you my brother Brian Nyakanda for the additional financial
support.
Above all, thank you God.
iv
ABSTRACT
The alloy Ti-2.7Al-5.7Fe-6Mo-6V (wt%), commercially known as Timetal 125, is used as a
high strength fastener in aerostructure assemblies. Very little information is available on its
properties and processing, and this study investigated its consolidation from low cost elemental
powders, to achieve the minimum mechanical properties for use as a high strength fastener.
Reactions during alloying and its beta transus were investigated by differential thermal
analysis. The α+β phase region was established to lie between 590oC and 800oC by thermal
analysis, metallography and XRD. The alloy was consolidated to ~99% theoretical density by
semi-centrifugal casting, and spark plasma sintering of the blended powders. Various heat
treatments were undertaken, and the microstructures were evaluated by optical and scanning
electron microscopy. Tensile properties, hardness and density were measured after each heat
treatment, to establish the optimal combination of mechanical properties.
The experimental Timetal 125 style alloy was found to be a metastable beta titanium alloy,
which could be strengthened by ageing. It had a microstructure consisting of alpha grains with
fine beta precipitates in the as-cast condition, while the sintered samples had acicular
precipitates and larger grains, due to the unusually long period that was required to sinter the
samples. The ultimate tensile strength was >1500MPa, and elongation was ~3% in the as-cast
condition, thus failing to conform to the Airbus EN6116 standard’s specification for ultimate
tensile strength and elongation for a high strength fastener in the as-cast or sintered condition.
After annealing the castings at 900oC for 1 hour, the ultimate tensile strength decreased to
~760MPa, while elongation increased to ~15%, which still did not conform to the Airbus
standard, due to the low strength. The alloy was solution-annealed at 900oC, followed by water
quenching to retain a fully βTi microstructure. The minimum properties for the Airbus standard
were achieved after ageing between 500oC and 590oC for 1 hour, with an ultimate tensile
strength of ~1285MPa, and elongation of ~6.3%.
The strengthening depended on the amount and morphology of αTi precipitates from ageing.
The αTi/βTi ratio increased with increasing temperature and holding time (shown by XRD),
up to 590oC where the precipitates progressively transformed to βTi. Extending isothermal
holding time coarsened the precipitates, which was deleterious to strength. There was generally
a positive correlation between mean grain size and temperature or holding time, although
competing transformations suppressed grain growth, particularly after heat treatment close to
transformation temperatures. Although grain size had an effect on the strength of the Timetal

v
125 style alloy, the main mechanism was precipitation hardening by the secondary αTi.
Extended ageing resulted in the formation of allotriomorphic alpha titanium, and a
corresponding decrease in the ultimate tensile strength.
It was not possible to subject the sintered samples to tensile testing, due to their shape.
However, the sintered samples were less porous and had higher Vickers’ values than the
castings, suggesting they had similar, if not higher tensile strengths. The acicular precipitates
in the sintered samples were possibly martensite or omega titanium (ωTi, Pearson symbol hP3
and space group P6/mmm) although they were too fine to be detected by X-ray diffraction and
too fine analyse separately by energy dispersive X-ray spectrometry.

vi
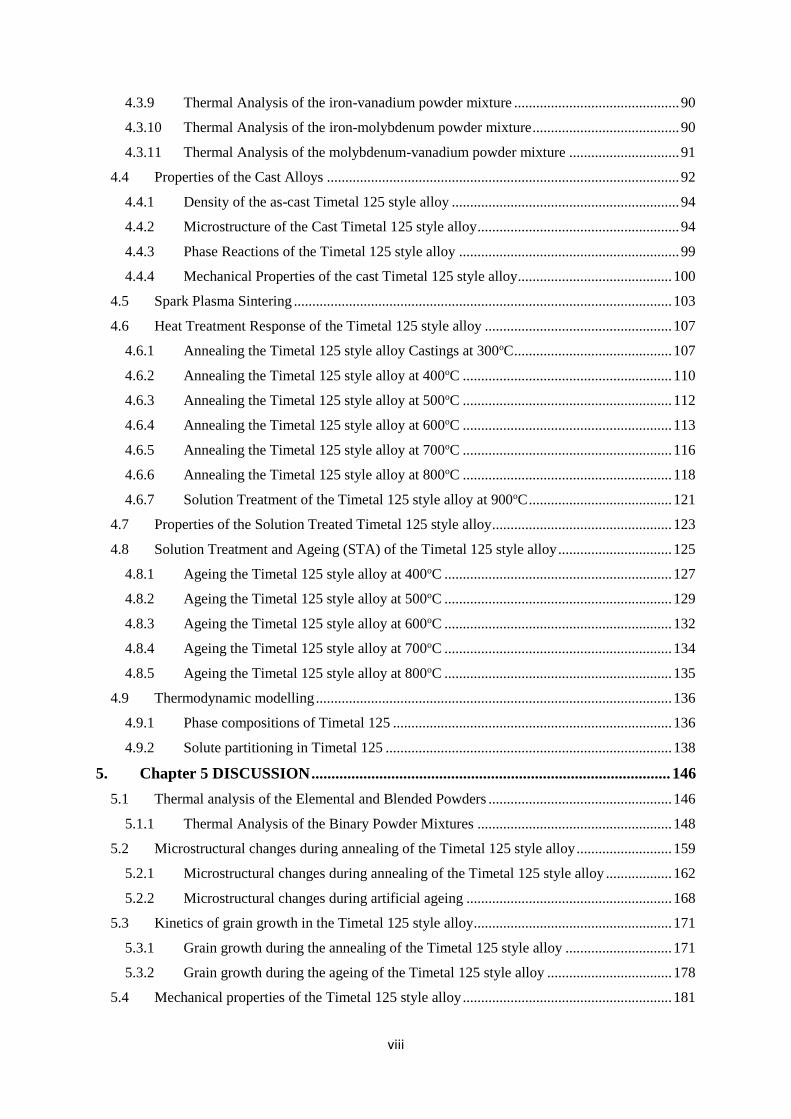
1.TABLE OF CONTENTS
TABLE OF CONTENTS ............................................................................................ vi
1. Chapter 1 INTRODUCTION ...................................................................................... 1
2. Chapter 2 LITERATURE REVIEW .......................................................................... 5
2.1 Titanium .................................................................................................................................. 5
2.2 Alpha Titanium Alloys............................................................................................................ 8
2.3 Alpha-Beta Titanium Alloys ................................................................................................. 11
2.4 Beta Titanium Alloys ............................................................................................................ 12
2.5 Diffusion of Alloying Elements in Titanium ........................................................................ 14
2.6 Processing of Titanium and Titanium Alloys ....................................................................... 15
2.7 Casting Technologies for Titanium and Titanium Alloys ..................................................... 16
2.7.1 Centrifugal Casting of Titanium and Titanium Alloys ................................................. 17
2.8 Sintering of Titanium and Titanium Alloys .......................................................................... 18
2.9 Spark Plasma Sintering of Titanium Alloys.......................................................................... 20
2.10 Machining of Titanium and Titanium Alloys ....................................................................... 22
2.11 Heat Treatment and Grain Growth in Titanium Alloys ........................................................ 25
2.12 Mechanical Properties of Titanium and Titanium Alloys ..................................................... 27
2.13 Fracture Toughness, Creep and Fatigue Resistance of Titanium and Titanium Alloys ........ 28
2.14 Alloying elements ................................................................................................................. 30
2.14.1 Thermodynamics, Phase Diagrams and Design of Titanium Alloys ............................ 32
2.14.2 Equilibrium Phases ....................................................................................................... 32
2.14.3 Non-Equilibrium Phases ............................................................................................... 33
2.14.4 Effect of Aluminium on Titanium................................................................................. 34
2.14.5 Effect of Vanadium on Titanium .................................................................................. 44
2.14.6 Effect of Molybdenum on Titanium ............................................................................. 46
2.14.7 Effect of Iron on Titanium ............................................................................................ 47
2.14.8 Oxygen, Carbon and Nitrogen ...................................................................................... 49
2.15 The Ti-Al-V ternary system .................................................................................................. 50
2.15.1 Isothermal Sections ....................................................................................................... 51
2.15.2 Invariant Equilibria ....................................................................................................... 56
2.15.3 Liquidus and Solidus Surfaces ...................................................................................... 57
2.16 Properties of Titanium Alloys for Aerospace Applications .................................................. 58
2.17 High Strength Fasteners on Aircraft Structures .................................................................... 59
2.18 Timetal 125 ........................................................................................................................... 60
3. Chapter 3 EXPERIMENTAL PROCEDURE ......................................................... 63
3.1 Overview of the experimental work ...................................................................................... 63

vii
3.1.1 Determination of Compositions of the Powders ........................................................... 64
3.1.2 Blending of Powders ..................................................................................................... 64
3.1.3 Determination of Particle Size Distributions ................................................................ 64
3.1.4 Determination of Oxygen, Nitrogen and Hydrogen ...................................................... 64
3.1.5 Determination of Phase Compositions .......................................................................... 65
3.1.6 Thermal Analyses of Powders ...................................................................................... 65
3.2 Compaction of Powder Blends ............................................................................................. 66
3.3 Centrifugal Casting of Samples ............................................................................................ 66
3.4 Spark Plasma Sintering (SPS) ............................................................................................... 67
3.5 Analyses of Cast and Sintered Samples ................................................................................ 68
3.5.1 Density Measurements .................................................................................................. 68
3.5.2 Thermal Analysis of Consolidated Samples ................................................................. 69
3.6 Heat Treatment of Cast and Sintered Alloys......................................................................... 69
3.6.1 Annealing tests .............................................................................................................. 70
3.7 Characterization of Heat Treated Samples ............................................................................ 70
3.7.1 Metallographical Preparation and Optical Microscopy ................................................ 71
3.7.2 Determination of Morphology and Composition of Heat Treated Cast Samples by SEM
and EDX 71
3.7.3 Hardness Measurements ............................................................................................... 72
3.7.4 Tensile Testing of Cast Samples ................................................................................... 72
3.7.5 Thermo-Calc ................................................................................................................. 73
4. Chapter 4 RESULTS .................................................................................................. 74
4.1 Characterization of source materials ..................................................................................... 74
4.2 Thermochemical reactions of the elements of Timetal 125 .................................................. 75
4.2.1 Thermal behaviour of titanium powder......................................................................... 76
4.2.2 Thermal behaviour of aluminium powder..................................................................... 76
4.2.3 Thermal behaviour of iron powder ............................................................................... 77
4.2.4 Thermal behaviour of vanadium powder ...................................................................... 78
4.3 Characterization of Blended Powders ................................................................................... 80
4.3.1 Thermal Analysis of Powder Mixtures ......................................................................... 82
4.3.2 Thermal Analysis of the titanium-aluminium powder mixture ..................................... 82
4.3.3 Thermal Analysis of the titanium-iron powder mixture................................................ 84
4.3.4 Thermal Analysis of the titanium-vanadium powder mixture ...................................... 85
4.3.5 Thermal Analysis of the titanium-molybdenum powder mixture ................................. 86
4.3.6 Thermal Analysis of aluminium-iron powder mixture ................................................. 87
4.3.7 Thermal Analysis of the aluminium-vanadium powder mixture .................................. 88
4.3.8 Thermal Analysis of the aluminium-molybdenum powder mixture ............................. 89
viii
4.3.9 Thermal Analysis of the iron-vanadium powder mixture ............................................. 90
4.3.10 Thermal Analysis of the iron-molybdenum powder mixture ........................................ 90
4.3.11 Thermal Analysis of the molybdenum-vanadium powder mixture .............................. 91
4.4 Properties of the Cast Alloys ................................................................................................ 92
4.4.1 Density of the as-cast Timetal 125 style alloy .............................................................. 94
4.4.2 Microstructure of the Cast Timetal 125 style alloy ....................................................... 94
4.4.3 Phase Reactions of the Timetal 125 style alloy ............................................................ 99
4.4.4 Mechanical Properties of the cast Timetal 125 style alloy.......................................... 100
4.5 Spark Plasma Sintering ....................................................................................................... 103
4.6 Heat Treatment Response of the Timetal 125 style alloy ................................................... 107
4.6.1 Annealing the Timetal 125 style alloy Castings at 300oC ........................................... 107
4.6.2 Annealing the Timetal 125 style alloy at 400oC ......................................................... 110
4.6.3 Annealing the Timetal 125 style alloy at 500oC ......................................................... 112
4.6.4 Annealing the Timetal 125 style alloy at 600oC ......................................................... 113
4.6.5 Annealing the Timetal 125 style alloy at 700oC ......................................................... 116
4.6.6 Annealing the Timetal 125 style alloy at 800oC ......................................................... 118
4.6.7 Solution Treatment of the Timetal 125 style alloy at 900oC ....................................... 121
4.7 Properties of the Solution Treated Timetal 125 style alloy ................................................. 123
4.8 Solution Treatment and Ageing (STA) of the Timetal 125 style alloy ............................... 125
4.8.1 Ageing the Timetal 125 style alloy at 400oC .............................................................. 127
4.8.2 Ageing the Timetal 125 style alloy at 500oC .............................................................. 129
4.8.3 Ageing the Timetal 125 style alloy at 600oC .............................................................. 132
4.8.4 Ageing the Timetal 125 style alloy at 700oC .............................................................. 134
4.8.5 Ageing the Timetal 125 style alloy at 800oC .............................................................. 135
4.9 Thermodynamic modelling ................................................................................................. 136
4.9.1 Phase compositions of Timetal 125 ............................................................................ 136
4.9.2 Solute partitioning in Timetal 125 .............................................................................. 138
5. Chapter 5 DISCUSSION .......................................................................................... 146
5.1 Thermal analysis of the Elemental and Blended Powders .................................................. 146
5.1.1 Thermal Analysis of the Binary Powder Mixtures ..................................................... 148
5.2 Microstructural changes during annealing of the Timetal 125 style alloy .......................... 159
5.2.1 Microstructural changes during annealing of the Timetal 125 style alloy .................. 162
5.2.2 Microstructural changes during artificial ageing ........................................................ 168
5.3 Kinetics of grain growth in the Timetal 125 style alloy ...................................................... 171
5.3.1 Grain growth during the annealing of the Timetal 125 style alloy ............................. 171
5.3.2 Grain growth during the ageing of the Timetal 125 style alloy .................................. 178
5.4 Mechanical properties of the Timetal 125 style alloy ......................................................... 181
ix
5.5.1 Mechanical properties of the annealed Timetal 125 style alloy .................................. 181
5.5.2 Mechanical properties of the solution-treated and aged Timetal 125 style alloy ........ 184
5.5.3 Effect of grain size on the mechanical properties of the Timetal 125 style alloy ....... 191
5.6 Proposed thermomechanical treatment of the Timetal 125 style alloy ............................... 192
5.7 Summary ............................................................................................................................. 193
6. Chapter 6 ................................................................................................................... 197
CONCLUSIONS AND RECOMMENDATIONS FOR FUTURE STUDY ........ 197
6.1 Conclusions ......................................................................................................................... 197
6.2 Recommendations for future study ..................................................................................... 198
7. Chapter 7 References ................................................................................................ 201
8. Chapter 8 APPENDICES ......................................................................................... 217
8.1 APPENDIX A: Ti-Al-Mo Ternary System ............................................................................... 217
8.2 APPENDIX B: Ti-Al-Fe Ternary System .......................................................................... 222
8.3 APPENDIX C: Ti-Fe-Mo Ternary System ......................................................................... 224
8.4 PUBLICATIONS ................................................................................................................ 226
8.4.1 Kinetics of grain growth in Ti-2.7Al-5.7Fe-6Mo-6V alloy, Journal of Mining and
Metallurgy, Section B (in review). .............................................................................................. 226
8.4.2 Semi-centrifugal casting and spark plasma sintering of Ti-2.7Al-5.7Fe-6Mo-6V: Effect
of processing variables on microstructure and mechanical properties, Journal of Materials and
Design (in review). ...................................................................................................................... 241

x
LIST OF FIGURES
Figure 2.1: (a) Widmanstätten microstructure typical of quenched alpha titanium alloys and (b)
microstructure of furnace-cooled Ti-5Al-2.5Sn, with an equiaxed α matrix grains and globular
inclusions due to 0.3 wt% Fe impurity ................................................................................................... 8
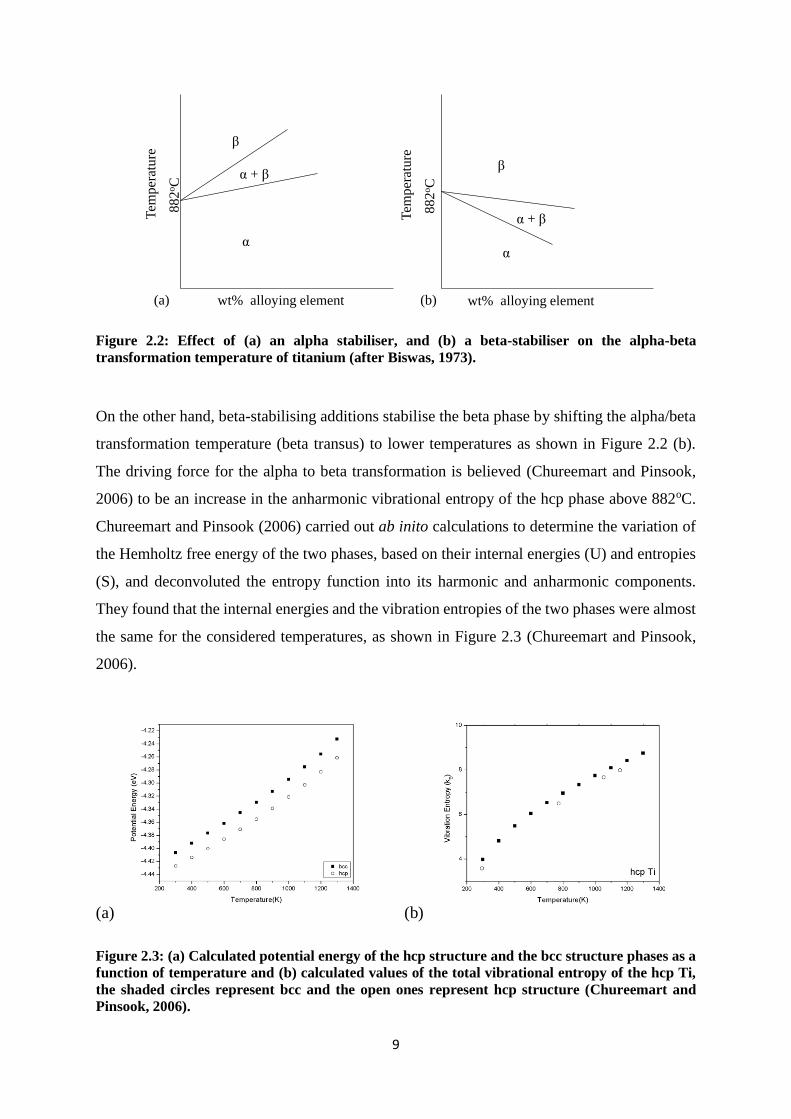
Figure 2.2: Effect of (a) an alpha stabiliser, and (b) a beta-stabiliser on the alpha-beta transformation
temperature of titanium ........................................................................................................................... 9
Figure 2.3: (a) Calculated potential energy of the hcp structure and the bcc structure phases as a
function of temperature and (b) calculated values of the total vibrational entropy of the hcp Ti, the
shaded circles represent bcc and the open ones represent hcp structure ................................................. 9
Figure 2.4: (a) Anharmonic contribution of the hcp and the bcc structures, and (b) the differences of
the components of F composed of the energy difference and the entropy difference, where the point of
intersection denotes the transition temperature ..................................................................................... 10
Figure 2.5: Typical microstructures of alpha-beta titanium alloys, (a) fully lamellar microstructure (b)
equiaxed microstructure, and (c) bimodal microstructure, showing lamellar αTi and equiaxed βTi ... 12
Figure 2.6: Microstructure of TNZT after (a) solution treatment, showing a single homogeneous beta
phase with all solutes in solution, and (b) solution treatment and ageing, showing intragranular alpha
precipitates in a beta matrix, and grain boundaries ............................................................................... 13
Figure 2.7: Conventional processing of titanium sponge to ingot ....................................................... 16
Figure 2.8: Cost comparison for a titanium alloy design machined from blocks, forgings and precision
investment casts. ................................................................................................................................... 17
Figure 2.9: Diagram of a 2D lattice showing lower coordination for surface atoms ........................... 19
Figure 2.10: Major stages of sintering showing reduction in free surfaces and contact formation .... 20
Figure 2.11: Basic Configuration of an SPS machine .......................................................................... 21
Figure 2.12: SEM micrographs of Ti-47Al after spark plasma sintering at 50MPa at a heating rate of
50oC.min-1 at (a) 400oC and (b) 900oC .................................................................................................. 22
Figure 2.13: Third wave AdvantEdge simulation of temperature at tool tip-work piece contact during
machining of Ti-6Al-4V at a feed rate 0.2mm.min-1 and cutting rate of 115m.min-1 using a WC/Co
cutting tool ............................................................................................................................................ 24
Figure 2.14: Superposed stress-strain curves of variants of the Ti-Nb-Zr alloy .................................. 30
Figure 2.15: Schematic diagram showing Ms and ωs loci for a binary Ti-X system, where X is a beta
stabilizing element, on rapid quenching from the beta phase filed, region I corresponds to α΄ formation,
II to α΄+ω, III to ω + β, and IV to metastable or stable β (after Collings, 1984). ................................. 34
Figure 2.16: Ti-Al phase diagram ........................................................................................................ 36
Figure 2.17: Ti-Al phase diagram ........................................................................................................ 37
Figure 2.18: Currently accepted low temperature Ti-rich end of the Ti-Al system ............................. 38
Figure 2.19: Ti-Al binary phase diagram ............................................................................................. 40

xi
Figure 2.20: Ti-Al phase diagram for the 40-70 wt% Al composition range ..................................... 41
Figure 2.21: Calculated Ti-Al binary phase diagram ........................................................................... 42
Figure 2.22: Ti-Al phase diagram ........................................................................................................ 43
Figure 2.23: Ti-V binary phase diagram .............................................................................................. 45
Figure 2.24: Ti-Mo phase diagram showing a monotectoid reaction .................................................. 46
Figure 2.25: Ti-Fe binary phase diagram ............................................................................................. 48
Figure 2.26: Effect of iron, aluminium and molybdenum on the density of sintered titanium alloys . 48
Figure 2.27: Hcp crystal structure showing the octahedral positions occupied by interstitial elements
.............................................................................................................................................................. 50
Figure 2.28: Isothermal section of the Ti-Al-V phase diagram at 1400oC .......................................... 52
Figure 2.29: Isothermal section of the Ti-Al-V phase diagram at 1300oC .......................................... 53
Figure 2.30: Isothermal section of the Ti-Al-V phase diagram at 1200oC .......................................... 54
Figure 2.31: Reaction scheme for the Ti-Al-V ternary system ............................................................ 55
Figure 2.32: Isothermal section of the Ti-Al-V phase diagram at 1100oC .......................................... 55
Figure 2.33: Isothermal section of the Ti-Al-V phase diagram at 1000oC .......................................... 56
Figure 2.34: Isothermal section of the Ti-Al-V phase diagram at 900oC ............................................ 56
Figure 2.35: Calculated liquidus projection of the Ti-Al-V system..................................................... 58
Figure 3.1: High level flow sheet for the experimental design. ........................................................... 63
Figure 3.2: Manfredi Centrifugal induction casting machine. ............................................................. 67
Figure 3.3: Cast sample profile showing where mounting specimens were sectioned ........................ 67
Figure 3.4: Density measurement set-up used for the samples. ........................................................... 69
Figure 4.1: Superposed particle size distributions of the elemental feed powders. ............................. 75
Figure 4.2: DTA scan for a blank run showing low temperature peaks due to a systematic error of the
instrument. ............................................................................................................................................ 75
Figure 4.3: TGA-DTA scan for the as-received titanium powder in argon. ....................................... 76
Figure 4.4: TGA-DTA scan for the as-received aluminium powder in argon. .................................... 77
Figure 4.5: TGA-DTA scan for the as-received iron powder in argon. ............................................... 78
Figure 4.6: TGA-DTA scan for the as received vanadium powder in argon. ...................................... 79
Figure 4.7: TGA-DTA scan for the as-received molybdenum powder in argon. ................................ 80
Figure 4.8: XRD pattern of the Timetal 125 powder blend before processing. ................................... 81
Figure 4.9: DTA scan for the powder blend with Timetal 125 elemental composition. ...................... 82
Figure 4.10: DTA scans of pure titanium and a 50-50 wt% of titanium-aluminium blend showing a
negative enthalpy of mixing. ................................................................................................................. 83
Figure 4.11: Superposed DTA scans for pure iron, pure titanium and a 50-50 wt% Ti-Fe binary alloy.
.............................................................................................................................................................. 84
Figure 4.12: Superposed DTA scans for pure vanadium, pure titanium and a 50-50 wt% Ti-V binary
alloy. ..................................................................................................................................................... 85

xii
Figure 4.13: Superposed DTA scans for pure molybdenum, pure titanium and a 50-50 wt% Ti-Mo
binary alloy. .......................................................................................................................................... 86
Figure 4.14: Superposed DTA scans for pure iron, pure aluminium and the Al-Fe powder mixture. . 87
Figure 4.15: Superposed DTA scans for pure aluminium, pure vanadium and a 50-50 wt% Al-V binary
alloy. ..................................................................................................................................................... 88
Figure 4.16: Superposed DTA scans for pure aluminium, pure molybdenum and a 50-50 wt% Al-Mo
binary alloy. .......................................................................................................................................... 89
Figure 4.17: Superposed DTA scans for pure iron, pure vanadium and a 50-50 wt% Fe-V binary alloy.
.............................................................................................................................................................. 90
Figure 4.18: Superposed DTA scans for pure iron, pure molybdenum and a 50-50 wt% Fe-Mo binary
alloy. ..................................................................................................................................................... 91
Figure 4.19: DTA scan pure molybdenum, pure vanadium and for a 50-50 wt% Mo-V binary alloy
showing an almost zero enthalpy for most sections of the curve. ......................................................... 92
Figure 4.20: XRD pattern of Timetal 125 in the as-cast condition. ..................................................... 93
Figure 4.21: Optical micrograph of Timetal 125 in the as-cast condition .......................................... 95
Figure 4.22: SEM-BSE image of Timetal 125 in the as-cast condition showing intragranular
precipitates and porosity. ...................................................................................................................... 96
Figure 4.23: Optical micrographs of a cast Timetal 125 sample after (a) 24h, (b) 48h, (c) 72h (d) 300h
at room temperature showing dissolution of precipitates ..................................................................... 97
Figure 4.24: SEM-BSE images of Timetal 125 after 24h at room temperature, showing acicular
precipitates: (a) is the micrograph from where the areal composition was measured and (b) is a
magnification of the precipitate-rich area marked 1 in (a) .................................................................... 98
Figure 4.25: TGA-DTA scan for cast Timetal 125, showing first αTi to βTi transfornation at 590oC and
the final α to β transformation at 800oC. ............................................................................................. 100
Figure 4.26: Photographs of tensile specimens after fracture (a) and (b) brittle fracture at the head-
gauge interface in the as-cast condition, and (c) and (d) ductile fracture after heat treatment for 60mins
at 900oC followed by water quenching ............................................................................................... 101
Figure 4.27: Stress-strain curve of the alloy in the as-cast condition showing high strength and
relatively low ductility. ....................................................................................................................... 103
Figure 4.28: Optical micrographs of Ti-2.7Al-5.7Fe-6Mo-6V (a) after sintering at 1100oC and 30MPa
for 5 minutes, and after sintering at 1200oC and 30MPa for (b) 5 minutes, (c) 10 minutes and (d) 15
minutes. ............................................................................................................................................... 104
Figure 4.29: SEM-BSE image of Timetal 125 after spark plasma sintering at 1200oC, 30MPa for 5
mins, showing porosity. ...................................................................................................................... 105
Figure 4.30: Optical micrographs of Timetal 125 heat treated at 300oC for (a) 20 mins, (b) 30 mins, (c)
40 mins, and (d) 60 mins. .................................................................................................................... 108
Figure 4.31: XRD pattern of Timetal 125 heat treated at 300oC for 60 mins. ................................... 109

xiii
Figure 4.32: Optical micrographs of Timetal 125 heat treated at 400oC for (a) 20 mins, and (b) 60 mins
............................................................................................................................................................ 110
Figure 4.33: SEM-BSE image of Timetal 125 after annealing at 400oC for 2 hours ......................... 112
Figure 4.34: Optical micrographs of Timetal 125 after annealing at 500oC for (a) 20 mins, and (b) 60
mins ..................................................................................................................................................... 113
Figure 4.35: Optical micrographs of Timetal 125 heat treated at 600oC for (a) 20 mins and (b) 60 mins.
............................................................................................................................................................ 114
Figure 4.36: SEM-SE image of Timetal 125 after annealing at 600oC for 2 hours ........................... 115
Figure 4.37: XRD pattern of Timetal 125 annealed at 600oC for 2 hours, followed by water-quenching.
............................................................................................................................................................ 116
Figure 4.38: Optical micrograph of Timetal 125 heat treated at 700oC for 60 mins. ........................ 117
Figure 4.39: SEM-SE image of Timetal 125 after annealing at 700oC for 2 hours. .......................... 118
Figure 4.40: Optical micrographs of Timetal 125 heat treated at 800oC for (a) 20 mins, and (b) 60 mins
............................................................................................................................................................ 119
Figure 4.41: XRD pattern of the alloy in the after heat treatment at 800oC for 2 hours showing (βTi).
............................................................................................................................................................ 120
Figure 4.42: Optical micrograph of Timetal 125 heat treated at 900oC for 2 hours. ......................... 121
Figure 4.43: SEM-SE micrograph of Timetal 125 after annealing at 900oC for 2 hours ................... 122
Figure 4.44: XRD pattern of Timetal after annealing at 900oC for 2 hours. ...................................... 123
Figure 4.45: Stress-strain curve of Timetal 125 after heat treatment at 900oC followed by water
quenching. ........................................................................................................................................... 124
Figure 4.46: Optical micrographs of the alloy after solution treatment at 900oC for 60 minutes followed
by natural ageing for (a) 5 hours and (b) 72 hours .............................................................................. 125
Figure 4.47: SEM-BSE image of Timetal 125 after solution-treatment, followed by natural ageing for
72 hours. .............................................................................................................................................. 126
Figure 4.48: Variation of the ultimate tensile strength of Timetal 125 with time at room temperature
after solution treatment at 900oC. ....................................................................................................... 127
Figure 4.49: Optical micrographs of Timetal 125 after solution treatment at 900oC, followed by
artificial ageing at 400oC for (a) 20 mins., and (b) 60 mins ................................................................ 128
Figure 4.50: Optical micrograph of Timetal 125 after Solution treatment at 900oC and artificial ageing
at 400oC for 2 hours. ........................................................................................................................... 129
Figure 4.51: Optical micrographs of Timetal 125 after solution treatment at 900oC for 60 minutes
followed by artificial ageing at 500oC for (a) 20 mins, and (b) 60 mins. ........................................... 130
Figure 4.52: Optical micrograph of Timetal 125 after solution treatment at 900oC for 60 minutes
followed by artificial ageing for at 500oC for 2 hours ........................................................................ 131
Figure 4.53: SEM-SE image of Timetal 125 after ageing at 500oC for 2 hours ................................ 132

xiv
Figure 4.54: Optical micrographs Timetal 125 after solution treatment at 900oC, followed by ageing at
600oC for 2 hours ................................................................................................................................ 133
Figure 4.55: Variation of ultimate tensile strength of Timetal 125 with ageing temperature after soaking
for 60 minutes. .................................................................................................................................... 134
Figure 4.56: Optical micrograph of Timetal 125 after solution treatment, followed by ageing at 700oC
for (a) 20 mins and (b) 60 mins........................................................................................................... 135
Figure 4.57: Optical micrographs of Timetal 125 after ageing at 800oC for (a) 20 minutes and (b) 60
minute ................................................................................................................................................. 136
Figure 4.58: Thermo-Calc temperature-phase proportion plot of the phase composition of Timetal 125
using the titanium alloy database V3 (TTTI3). ................................................................................... 137
Figure 4.59: Titanium in the liquid, βTi and αTi phase calculated by Themo-Calc using the titanium
alloy database V3 (TTTI3). ................................................................................................................. 138
Figure 4.60: Solute partitioning during equilibrium cooling of Timetal 125 calculated by Thermo-Calc
using the titanium alloy database V3 (TTTI3). ................................................................................... 139
Figure 4.61: Composition of hcp Ti as function of temperature, calculated by Thermo-Calc for the
Timetal 125 composition using the titanium alloy database V3 (TTTI3). .......................................... 140
Figure 4.62: Partitioning of aluminium during equilibrium cooling of Timetal 125 calculated by
Thermo-Calc using the titanium alloy database V3 (TTTI3). ............................................................. 141
Figure 4.63: Partitioning of iron during equilibrium cooling of Timetal 125 calculated by Thermo-Calc
using the titanium alloy database V3 (TTTI3). ................................................................................... 142
Figure 4.64: Partitioning of molybdenum during equilibrium cooling of Timetal 125 calculated by
Thermo-Calc using the titanium alloy database V3 (TTTI3). ............................................................. 143
Figure 4.65: Partitioning of vanadium during equilibrium cooling of Timetal 125 calculated by
Thermo-Calc using the titanium alloy database V3 (TTTI3). ............................................................. 144
Figure 5.1: Ti-Fe binary phase diagram (Murray, 1992). .................................................................. 151
Figure 5.2: Superposed DTA scans for Ti-Fe-Mo-V (no aluminium) and Al-Fe-V-Mo (no titanium)
powders. .............................................................................................................................................. 158
Figure 5.3: DTA Scan for Ti-Al-Mo-V powder (no iron). ................................................................ 159
Figure 5.4: Grain sizes of Timetal 125 during annealing. ................................................................ 173
Figure 5.5: ln(D-Do) vs. In(t) for annealing Timetal 125 at different temperatures. ......................... 176
Figure 5.6: ln (k) versus (-1/T) for Timetal 125 after annealing at different temperatures. .............. 178
Figure 5.7: Grain size after solution treating Timetal 125 and ageing at different temperatures. ..... 179
Figure 5.8: Precipitates (a) on the grain boundaries, not occupying the grain volume and (b) after
coarsening and occupying part of the grains’ volume (Adapted from Gladman, 1966). .................... 180
Figure 5.9: ln(D-Do) vs. ln(t) at the different ageing temperatures. ................................................... 181
Figure 5.10: Ultimate tensile strength and strain at fracture of Timetal 125 after annealing at various
temperatures. ....................................................................................................................................... 182

xv
Figure 5.11: Ultimate tensile strength and strain at fracture of Timetal 125 after solution-treatment and
ageing at various temperatures. ........................................................................................................... 185
Figure 5.12: Overall Vickers hardness of Timetal 125 after annealing and ageing at different
temperatures. ....................................................................................................................................... 187
Figure 5.13: Effect of holding time on the UTS of Timetal 125 at the different ageing temperatures.
............................................................................................................................................................ 187
Figure 5.14: Effect of holding time on the UTS of Timetal 125 at the different ageing temperatures.
............................................................................................................................................................ 188
Figure 5.15: Variation of R.A. with ageing temperature for different holding periods. .................... 189
Figure 5.16: Effect of holding time on the reduction in area at fracture after ageing at different
temperatures. ....................................................................................................................................... 190
Figure 5.17: Hall-Petch plot for Timetal 125. .................................................................................... 192

xvi
LIST OF TABLES
Table 2.1: Strength-to-weight ratios of common engineering materials. ............................................... 5
Table 2.2: Diffusivities of different elements in alpha and beta titanium ............................................ 15
Table 2.3: Thermal conductivity of selected metals at 25oC and atmospheric pressure ...................... 18
Table 2.4: Mechanical Properties of Common Titanium Alloys ......................................................... 27
Table 2.5: Transformations in the Ti-Al binary system ...................................................................... 43
Table 2.6: Equilibrium solid phases in the Ti-Al-V ternary system. ................................................... 51
Table 2.7: Invariant reactions in the Ti-Al-V system........................................................................... 57
Table 2.8: Nominal Composition of Timetal 125 ................................................................................ 61
Table 3.1: Test work matrix for spark plasma sintering of blended powders. ..................................... 68
Table 3.2: Test work matrix for heat treatment of cast samples. ......................................................... 70
Table 4.1: Compositions of the source powders by XRF and LECO (wt%). ...................................... 74
Table 4.2: Composition of randomly selected areas of the Timetal 125 powder by EDX (wt%). ....... 74
Table 4.3: Chemical compositions of fresh iron and iron powder from DTA (wt%). ......................... 78
Table 4.4: Elemental Compositions of the raw powder test samples (wt%). ....................................... 81
Table 4.5: Densities of Timetal 125 samples in the as-cast condition (g.cm-3). ................................... 94
Table 4.6: EDX analyses of the matrix and precipitates (wt%). .......................................................... 95
Table 4.7: Grain size as a function of time at room temperature. ........................................................ 97
Table 4.8: Areal and spot composition determined by EDX (wt%). ................................................... 99
Table 4.9: Density of Timetal 125 after extended time at room temperature (g.cm-3). ...................... 100
Table 4.10: Mechanical properties of Timetal 125 in the as-cast condition. ..................................... 102
Table 4.11: Composition of the phases in sintered Timetal 125 (wt%). ............................................ 104
Table 4.12: Densities of Timetal 125 sintered at 1200oC for 5 minutes at 30MPa (g.cm-3). ............. 105
Table 4.13: Hardnesses of sintered Timetal 125. .............................................................................. 106
Table 4.14: Grain size as a function of time during annealing at 300oC. ........................................... 108
Table 4.15: Grain size as a function of time during annealing at 400oC. ........................................... 111
Table 4.16: EDX analyses of the light and dark contrast phases after annealing Timetal 125 at 400oC
(wt%). ................................................................................................................................................. 111
Table 4.17: Grain size after annealing Timetal 125 at 500oC. ........................................................... 113
Table 4.18: EDX analyses of the matrix and precipitates after annealing Timetal 125 at 600oC (wt%).
............................................................................................................................................................ 114
Table 4.19: EDX analyses of the matrix and precipitates after annealing Timetal 125 at 700oC (wt%).
............................................................................................................................................................ 117
Table 4.20: Grain size of Timetal 125 upon annealing at 800oC. ...................................................... 121

xvii
Table 4.21: Variation of UTS, strain and hardness of Timetal 125 with annealing temperature. ...... 123
Table 4.22: EDX analysis of the phases in naturally aged Timetal 125 (wt%). ................................ 125
Table 4.23: Grain size of the (βTi) matrix during ageing Timetal 125 at 400oC. .............................. 128
Table 4.24: Grain size after solution treating at 900oC and ageing at 500oC. .................................... 130
Table 4.25: EDX analyses of the matrix and the allotriomorphic precipitates. ................................. 131
Table 4.26: Grain size of Timetal 125 after STA at 900oC and 600oC. ............................................. 133
Table 4.27: Phase composition of Timetal 125 calculated by Thermo Calc (wt%). .......................... 145
Table 5.1: Transformations of plain carbon hypoeutectoid steel (0.25 wt% Mn, 0.03 wt% C) ........ 147
Table 5.2: DTA peaks for the Ti-Al binary powder during the heating cycle. .................................. 148
Table 5.3: DTA peaks for the Ti-Fe binary powder during the heating cycle. .................................. 150
Table 5.4: DTA peaks for the Ti-V binary powder during the heating cycle. ................................... 152
Table 5.5: CALPHAD modelling of the invariant reactions in the Al-Fe binary system .................. 155
Table 5.6: Atomic radii and electronegativities (Pauling scale) of the constituents of Timetal 125 157
Table 5.7: Rate constants for grain growth at different annealing temperatures. .............................. 176

xviii
LIST OF ABBREVIATIONS AND SYMBOLS
BCC = Body centred cubic
DTA = Differential Thermal Analysis
EDXS = Energy Dispersive X-ray Spectrometer
h = Hour
FCC = Face centred cubic
HCP = Hexagonal Close Packed
Min = Minute
MPa = Mega Pascal
PSD = Particle Size Distribution
SEM = Scanning Electron microscope
s = Second
TGA = Thermogravimetric Analysis
XRD = X-ray Diffraction
µm = Micrometre
α = Alpha Titanium (hcp) or ferrite
γ = Austenite
ρ = Density
β = Beta titanium (bcc)
σ = Engineering stress
ϵ = Engineering strain

1
1.Chapter 1 INTRODUCTION
Titanium has the highest specific strength of all metals, and has replaced steel in many
applications where weight savings are critical (Matthew and Donachie, 1988). It has excellent
corrosion resistance, which makes it the material of choice in marine constructions (Litvin and
Smith, 1971; Mountford, 2002). Additionally, it is biocompatible and has been increasingly
used in biomedical engineering (Branemark, 1983). However, production and processing costs
are much higher than for the other common structural materials, like steel and aluminium
(Leyens and Peters, 2003). This has resulted in very limited usage, particularly for civilian
applications. Significant strides have been made in the past two decades to produce low cost
titanium stock, particularly powder (Gasbarre and MacGeehan, 2012). This has led to renewed
research, and wider spread usage of titanium and its alloys. Early research concentrated on
alpha titanium alloys, mainly because they are cheaper and technically simpler to produce
(Crossley, 1981).
However, focus shifted to alpha + beta (α+β) alloys in the 1950s, since their properties can be
greatly enhanced by heat treatment, unlike the alpha alloys. The research effort produced the
alloy Ti-6Al-4V (wt%), also known as ASTM Grade 5 titanium, which is still the most
produced and used titanium alloy to date (Emsley 2001; Sevan and Vardan, 2006). In the past
decade, attention has shifted from α+β alloys to structural components made of beta titanium
alloys, because these alloys achieve much higher strength than the other two classes.
Additionally, beta titanium alloys are easier to work than α or (α+β) Ti alloys, particularly in
the solution-treated state, which results in significant cost savings. Palpable effort has been put
toward understanding the thermomechanical treatments and chemical and mechanical
properties of this class of titanium alloys, and it has been established they can be significantly
strengthened by solution-treatment and ageing, without compromising ductility or fracture
toughness (Duerig and Williams, 1984).
Numerous beta titanium alloys have been developed and introduced to the market in the past
two decades (Leyens and Peters, 2003; Seong et al., 2009). Unfortunately, very little is reported
on their properties or methods of production, at least not in the public domain. Some of the
alloys are used on critical components of aerostructures, making a good understanding of their
properties necessary.

2
The novelty of the present work is in the production of an alloy similar to Timetal 125 by spark
plasma sintering and centrifugal casting of low-cost elemental powders. The use of elemental
powders is more economical than using a master alloy, since the process of making the master
alloy is avoided. This was demonstrated in a General Motor’s connection link, weighing 0.32
kg and costing less than US$3, which is far less than the cost of conventional feedstock for
melting and forging operations (Moxson, 2013). The feedstock for Timetal 125 fasteners is
currently about US$200/kg before the necessary machining operations, which is way higher
than the cost of elemental powders (Moxson, 2013).
In the present study, the titanium alloy Ti-2.7Al-5.7Fe-6Mo-6V (wt%) was investigated. It is
a beta titanium alloy commercially known as Timetal 125, and was developed and introduced
by Timetal Corporation (TIMET) in 1980 (Matthew and Donachie, 1988; Leyens and Peters,
2003). However, very little is available about the alloy in the public domain, and therefore,
there is a need to fill the gap through structured research. The only information in the literature
is that it is a beta titanium alloy used as a high strength fastener on airframes and other critical
aircraft components (Leyens and Peters, 2003). The purpose of this research was to establish
if Timetal 125 could be produced from low cost powders by semi-centrifugal casting or spark
plasma sintering. Additionally, the work sought to investigate thermochemical and
thermomechanical treatments necessary to achieve the minimum mechanical properties for its
use as a high strength fastener. An important aspect of the present work was to investigate if
these mechanical properties could be attained with the alloy consolidated from low cost
elemental powders, as these are significantly cheaper, due to their coarser sizes than the
feedstock currently used for the commercial Timetal 125 fasteners.
The present research succeeded in producing a Timetal 125 style alloy by both casting and
sintering low cost elemental powders. The castings were subsequently subjected to various
heat treatments and mechanical tests, leading to the establishment of an appropriate thermal
treatment to attain the minimum mechanical properties of high strength fasteners, stipulated in
the Airbus EN6116 standard (Campbell, 2006). The microstructure after each treatment was
investigated, and related to the mechanical properties. Due to the shape of the sintered samples
in the present work, it was not possible to subject them to mechanical testing. In spite of that
limitation, the results showed spark plasma sintering is a low cost technology that can produce
Timetal 125 with a similar microstructure and density to the castings. The chemical reactions
during the alloying of the powder blends were investigated by differential thermal analysis
(DTA). It was confirmed that thermal analysis can be successfully used to determine the
3
chemical and physical reactions that occur during the alloying of metallic powders, in addition
to the reaction temperatures. Such information is critical for alloy design.
The results from the present research indicate that after an appropriate double heat treatment,
the Timetal 125 style alloy is suitable for use as a high strength airframe fastener. The findings
show the Timetal 125 style alloy can be solution-treated between 850oC and 950oC, followed
by water quenching to retain a fully beta microstructure. Subsequently, it has to be aged
between 500oC and 600oC for a time proportionate to the size of the castings to achieve strength
of >1245 MPa and minimum ductility of 6%. The heat treatment is similar to most established
beta titanium alloys (Sluiter and Turchi, 1991). Finally, it was also established that grain growth
in the Timetal 125 style alloy did not conform to the common growth models during heat
treatment, and it was clear that the main strengthening mechanism in the alloy was the
secondary alpha phase. Strength and hardness had a strong correlation with the (αTi)/(βTi)
ratio, which in turn depended on thermal history. However, ductility and fracture toughness
decreased as the (αTi)/(βTi) ratio increased.
A better level of understanding of the thermochemical treatments and mechanical properties of
Timetal has been developed in the current research. The mechanical properties of the sintered
Timetal 125 style alloy still have to be established. More advanced techniques, such high
temperature X-ray diffraction (HT-XRD) and transmission electron microscopy (TEM) have
to be employed to gain even better understanding. The chemical reactions and phase
transformations were determined by relating the DTA scans to established phase diagrams.
HT-XRD allows direct observations of the phases, and its use in future work is recommended.
The use of TEM will resolve very small particles, and perhaps shed light on whether there was
also strengthening by fine precipitates.
This thesis has six chapters, including this introduction. Chapter 2 reviews the literature on
titanium and its alloys. It gives an overview of the history of titanium and its major alloys. It
also presents past and present research efforts on beta alloys, and concludes by reviewing the
specifications for high strength fasteners for aerostructures. Chapter 3 summarizes the
methodologies and materials used in the present work. The centrifugal casting and spark
plasma sintering of the powder blend targeting the Timetal 125 composition are described. The
chapter also describes the equipment and instruments used for the research. Chapter 4 presents
the results of the research. The first part gives the thermal analysis results for the elemental and
blended powders, as well as for the powder with the Timetal 125 target composition. The

4
second section presents the results after annealing the as-cast alloys between 300oC and 900oC,
focusing mainly on microstructure, grain size and mechanical properties at the different
annealing temperatures. Part of the chapter gives the microstructures and mechanical properties
obtained after solution-treatment and ageing. The chapter ends with calculating the equilibrium
phase compositions of Timetal 125 at different temperatures using Thermo-Calc. Chapter 5
discusses the results, and relates them to the literature. The first section discusses the DTA
scans in Chapter 4, and relates them to established binary phase diagrams. The second part
discusses the microstructures and mechanical properties after annealing, and attempts to relate
the two. The fourth part of Chapter 5 also discusses microstructures and mechanical properties,
but after solution-treatment and ageing. This part of the chapter compares the microstructures
in the as-cast condition and after solution-treatment, and seeks to use these different
microstructures to explain the differences observed after annealing and after ageing. The
chapter ends with a discussion on grain growth during annealing and ageing, and attempts to
explain the growth kinetics using established grain growth models. The effect of grain size on
strength is also discussed, and compared to the other operative strengthening mechanisms in
the Timetal 125 style alloy. The thesis ends with the major conclusions from the present work
and recommendations for future study in Chapter 6.

5
2.Chapter 2 LITERATURE REVIEW
2.1 Titanium
Titanium possesses mechanical and chemical properties superior to those of commonly used
structural materials, such as steel and aluminium (Greiner and Ellis, 1948). The only reason
why its use is not widespread is because the extraction costs from its ores are still very high
(Leyens and Peters, 2003). Titanium is the fourth most abundant structural metal in the earth’s
crust after aluminium, iron and magnesium (Duwez, 1949). It has the highest strength-to-
weight ratio of any pure metal, shown in Table 2.1 (Matthew and Donachie, 1988). Strength-
to-weight ratio, also known as specific strength, is the stress bearing capacity of a material at
fracture normalised against its density (Knott, 1973). It is a critical design factor, particularly
for applications where weight savings are necessary, such as in the aerospace and the naval
industries. When alloyed, titanium can significantly exceed its elemental specific strength
(Duwez, 1949). This high specific strength is one of the primary drivers for the use of titanium
and its alloys in the aerospace and naval industries, motor racing and biomedicine (Boyer et
al., 1994).
Table 2.1: Strength-to-weight ratios of common engineering materials (Matthew and Donachie,
1988).
Material Ultimate
Strength (MPa)
Density
(kg.m-3)
Specific Strength
(kN.m.kg-1)
Aluminium 600 2.80 214
Carbon fibre 4300 1.75 2457
Concrete 10 2.30 4
Copper 220 8.92 25
Nickel-based super alloy steels 2000 7.86 254
Titanium 1300 4.51 288
High strength low alloy (HSLA) steels were developed by the need to reduce the weight
associated with steel for demanding applications (Kim, 1983). While they have significantly
higher strength than titanium, their weight required to achieve the desired strength can exceed
that allowable for the intended application. High strength low alloy steels have seen an increase
in popularity in the past few decades, but they still do not come close to the strength of titanium
and its alloys when compared weight for weight.

6
Titanium and its alloys made their debut as critical engineering materials in the 1950s in
response to the growing aviation industry. They are widely used as artillery, due to their low
weight and high strength, as well as their ability to withstand moderately high temperatures,
i.e. 300-600oC (Arnold, 1959). From the 1970s, the cost of primary titanium, as well as its cost
of processing has been decreasing, resulting in wider applications. Titanium and its alloys are
now also used in the medical field as structural prosthetic materials due to their light weight,
excellent corrosion resistance, and low modulus of rigidity, biocompatibility and hypoallergic
properties (Branemark, 1983). The other industry that is becoming a major user of titanium is
the automotive sector. It is reported that titanium increases engine horsepower and torque,
while greatly reducing noise and vibrations (Froes and Faller, 2001). As a lighter material, it
improves the fuel economy of automobiles and aids the mitigation of greenhouse emissions. In
high end vehicles, titanium is used for engine valves, connecting rods and suspension springs.
For example, the 2013 Range Rover boasts a weight reduction of 13% compared to its
predecessor, partly because of the use of titanium on some of the major components
(Vijayaram, 2013).
The second main reason why titanium is finding increasing favour as the structural material of
choice is its excellent corrosion resistance (Chernova et al., 1961; Mountford, 2002). Unlike
ferrous materials, titanium forms a tenacious micro-oxide layer on its surface in oxidising
environments, thereby inhibiting further oxidation (Chernova et al., 1961). The oxide layer has
the advantage of forming without tarnishing the metal. Titanium, in its elemental form, resists
attack by all acids, except boiling hydrofluoric acid, and it is resistant to corrosion in saline
water (Litvin and Smith, 1971). It is for this reason that titanium is used in the oil industry as
a piping material and on the hulls of ships (Litvin and Smith, 1971). In 2010, the US Office of
Naval Research awarded a three year US$4.8m grant to the University of New Orleans to
advance research in titanium ship building. The focus of the group was on investigating the
manufacturability and welding properties of titanium with the aim of building a full mid-ship
section out of joined titanium (Skolnick and Wilson, 2012). In other aquatic uses, titanium is
used for housing of ocean surveillance devices for scientific and military purposes, and in
submarines (Huber and Goode, 1965).
In a critical review of the applications of titanium (Emsley, 2001), it was stated that about two
thirds of all titanium produced is used in aerospace engines and frames. The extensive use of
titanium in the aerospace industry was further corroborated by Sevan and Vardan (2006), with
approximately 59 metric tonnes used on the Boeing 777, and 45t in the Boeing 747, 12t in the

7
Airbus A330 and 32t in Airbus A340. The first use of titanium in an aircraft was in the
Lockheed SR-71 Blackbird spy plane in the 1960s, in which 85% of the structure was made
out of the metal (Merlin, 2009). Due to the exceptional corrosion resistance of titanium, the
longevity of the structures in which it is used and reduced operational downtime usually justify
its use, in spite of its high cost. In the long term, using the metal becomes more economic,
particularly for capital intensive constructions such as aircraft and ships (Boyer et al., 1994).
Titanium is a group 4, block d, transition metal with the electron configuration 1s22s22p63s23p6
3d24s2, and atomic weight of 47.867g.mol-1 (Greiner and Ellis, 1948). It has a density of 4.506
g.cm-3 which is about half that of stainless steel and about twice that of aluminium, yet the
metal is almost as strong as the common types of austenitic stainless steels, and about twice
as strong as aluminium (Duwez, 1949). Like iron, titanium exhibits polymorphism (McQuillan,
1949). Titanium crystallises from its melt at 1668oC in the body centred cubic (bcc) form
known as beta titanium. This crystal structure persists down to approximately 882oC, below
which the metal transforms into a hexagonal close-packed (hcp) crystal structure known as
alpha titanium (McQuillan, 1949). Therefore, alpha titanium is the lower temperature phase of
the metal, while beta is the more stable phase at higher temperatures. Some elements, such as
oxygen, nitrogen and hydrogen, are small enough to fit into the interstices of the hexagonal
close-packed structure of titanium to form interstitial alloys (Wells, 1962). When they do so,
they make the alpha structure stable and more difficult to transform to the higher temperature
beta phase. They thus stabilise the alpha phase to higher temperatures and for that reason, such
elements are known as alpha-stabilisers. There are also non-interstitial elements such as
aluminium, tin and zirconium with the same effect (Peart and Tomlin, 1962). On the other
hand, there are elements that interact with beta titanium to make it stable at lower temperatures.
Such elements are known as beta-stabilisers, and include molybdenum and vanadium (Elliot,
1962).
Except for applications where its high corrosion resistance is the required property, titanium is
rarely used as a pure metal. For most applications, it is alloyed with a number of other metals
and non-metals to achieve higher levels of strength and in some cases to achieve both extra
strength and higher corrosion resistance (Litvin and Smith, 1971). When the alloying additions
are alpha-stabilisers, the corresponding alloy is referred to as an alpha titanium alloy, while if
beta-stabilising, the alloy is termed a beta alloy. A further distinction is made on beta alloys
depending on the effectiveness of the beta-stabilising addition. A titanium alloy is beta if only
the beta phase is retained at room temperature after water-quenching (McQuillan, 1949).

8
In some cases, the amount of the beta-stabilisers is inadequate to fully retain the metal as beta
when cooled to room temperature (Elliot, 1962). When both and beta- and alpha-stabilizing
elements are present in the alloy to retain both alpha and beta at room temperature, it is termed
an alpha-beta alloy (Hansen et al., 1951; Elliot, 1962).
2.2 Alpha Titanium Alloys
Alpha titanium alloys are those in which titanium exists with a hexagonal close-packed (hcp)
crystal structure (McQuillan, 1949; Hansen et al., 1951). The microstructures of alpha titanium
alloys vary greatly depending on chemical composition and thermomechanical treatments. A
common microstructure for alpha alloys is the Widmanstätten microstructure, also known as a
“basket weave” microstructure, which is obtained when alpha titanium alloys are quenched
from the beta phase field, shown in Figure 2.1 (a). Figure 2.1(b) is the microstructure of an
alpha alloy Ti-5Al-2.5Sn, obtained after furnace cooling from the beta phase (Semiatin et al.,
2004).
Figure 2.1: (a) Widmanstätten microstructure typical of quenched alpha titanium alloys and (b)
microstructure of furnace-cooled Ti-5Al-2.5Sn, with an equiaxed α matrix grains and globular
inclusions due to 0.3 wt% Fe impurity (Semiatin et al., 2004).
Alpha titanium alloys are a result of alpha-stabilising alloying additions, such as aluminium
and oxygen. On heating, alpha-stabilising elements delay the transformation of hcp αTi to bcc
βTi. As a result, the hcp phase field is widened at the expense of the beta field. A schematic
binary phase diagram of titanium and an alpha-stabilising element is shown in Figure 2.2(a).
Equiaxed α Ti grains
Globular inclusions
αTi
(a) (b)
9
Figure 2.2: Effect of (a) an alpha stabiliser, and (b) a beta-stabiliser on the alpha-beta
transformation temperature of titanium (after Biswas, 1973).
On the other hand, beta-stabilising additions stabilise the beta phase by shifting the alpha/beta
transformation temperature (beta transus) to lower temperatures as shown in Figure 2.2 (b).
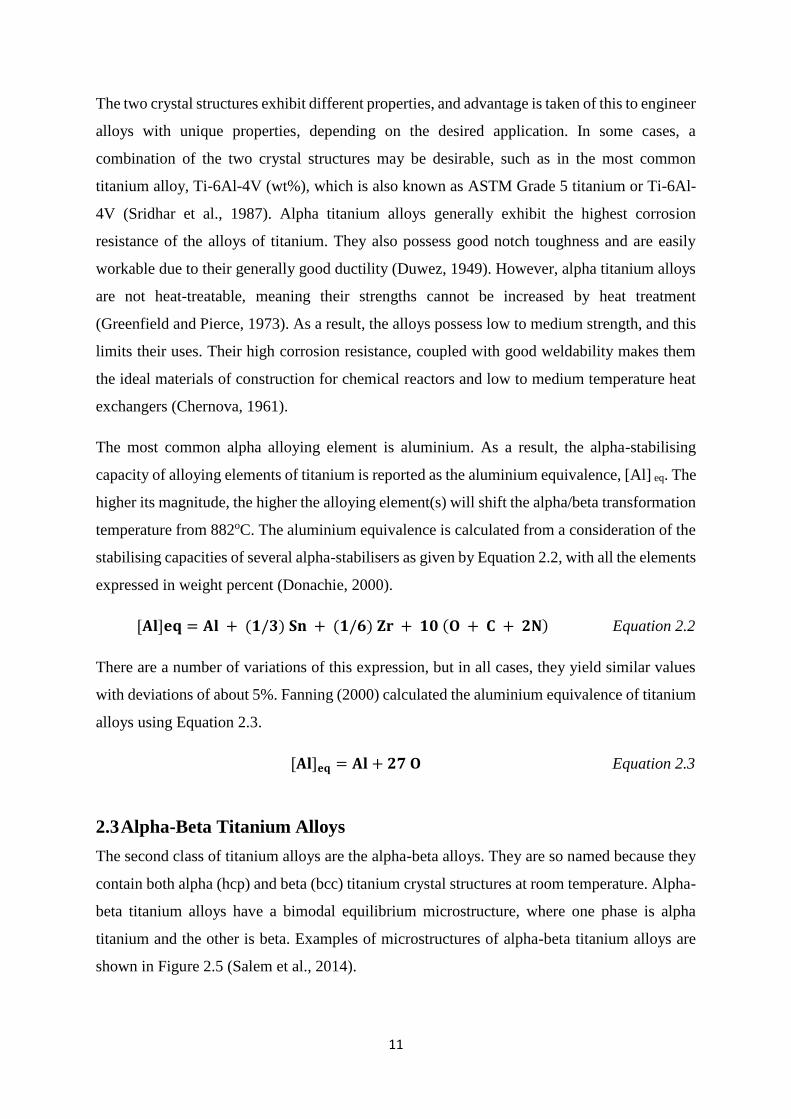
The driving force for the alpha to beta transformation is believed (Chureemart and Pinsook,
2006) to be an increase in the anharmonic vibrational entropy of the hcp phase above 882oC.
Chureemart and Pinsook (2006) carried out ab inito calculations to determine the variation of
the Hemholtz free energy of the two phases, based on their internal energies (U) and entropies
(S), and deconvoluted the entropy function into its harmonic and anharmonic components.
They found that the internal energies and the vibration entropies of the two phases were almost
the same for the considered temperatures, as shown in Figure 2.3 (Chureemart and Pinsook,
2006).
Figure 2.3: (a) Calculated potential energy of the hcp structure and the bcc structure phases as a
function of temperature and (b) calculated values of the total vibrational entropy of the hcp Ti,
the shaded circles represent bcc and the open ones represent hcp structure (Chureemart and
Pinsook, 2006).
Tem
per
atu
re
α + β
α + β
α α
β
β
wt% alloying element wt% alloying element
88
2oC
Tem
per
atu
re
88
2oC
(a) (b)
(a) (b)

10
The internal (potential) energy of the hcp phase was calculated to be lower than that of the bcc
structure for all temperatures, while the total vibrational entropy of the structures was
calculated to be almost equal (Chureemart and Pinsook, 2006). This would suggest that the hcp
structure is more stable at all temperatures, although experimental results show a transition at
882oC. Their molecular modelling work showed that by deconvoluting the vibrational entropy
into its harmonic and anharmonic components, the anharmonic entropy of the bcc phase
dramatically increased at about the same temperature as the beta transus. In comparing the
relative stability of the phases, the relative Helmholtz free energies (F) of the two structures
were considered, as shown in Equation 2.1 and modelled in Figure 2.4.
𝚫𝐅 = 𝐅𝐛𝐜𝐜 − 𝐅𝐡𝐜𝐩 = (𝐔𝐛𝐜𝐜 − 𝐔𝐡𝐜𝐩) − 𝐓(𝐒𝐛𝐜𝐜 − 𝐒𝐡𝐜𝐩) Equation 2.1
Figure 2.4: (a) Anharmonic contribution of the hcp and the bcc structures, and (b) the differences
of the components of F composed of the energy difference and the entropy difference, where the
point of intersection denotes the transition temperature (Chureemart and Pinsook, 2006).
Therefore, the anharmonic vibrational entropy appears to be the driving force for the phase
transition. Alpha- and beta-stabilizers are elements that alter this energy relationship. When
titanium or titanium alloys are melted, for example during casting, it is the higher temperature
beta phase that nucleates from the liquid first and persists down to the beta transus (McQuillan,
1949). Below this temperature, the first alpha starts to nucleate. Since the beta phase nucleates
from the melt, it requires some degree of undercooling, as there are very few nucleation sites
in the liquid. Therefore, the nucleation of the alpha phase is expected to have a lower activation
energy, since prior beta grains provide nucleation sites, making the process heterogeneous
(Hansen et al., 1951; Greenfield and Pierce, 1973).
(a) (b)
11
The two crystal structures exhibit different properties, and advantage is taken of this to engineer
alloys with unique properties, depending on the desired application. In some cases, a
combination of the two crystal structures may be desirable, such as in the most common
titanium alloy, Ti-6Al-4V (wt%), which is also known as ASTM Grade 5 titanium or Ti-6Al-
4V (Sridhar et al., 1987). Alpha titanium alloys generally exhibit the highest corrosion
resistance of the alloys of titanium. They also possess good notch toughness and are easily
workable due to their generally good ductility (Duwez, 1949). However, alpha titanium alloys
are not heat-treatable, meaning their strengths cannot be increased by heat treatment
(Greenfield and Pierce, 1973). As a result, the alloys possess low to medium strength, and this
limits their uses. Their high corrosion resistance, coupled with good weldability makes them
the ideal materials of construction for chemical reactors and low to medium temperature heat
exchangers (Chernova, 1961).
The most common alpha alloying element is aluminium. As a result, the alpha-stabilising
capacity of alloying elements of titanium is reported as the aluminium equivalence, [Al] eq. The
higher its magnitude, the higher the alloying element(s) will shift the alpha/beta transformation
temperature from 882oC. The aluminium equivalence is calculated from a consideration of the
stabilising capacities of several alpha-stabilisers as given by Equation 2.2, with all the elements
expressed in weight percent (Donachie, 2000).
[𝐀𝐥]𝐞𝐪 = 𝐀𝐥 + (𝟏/𝟑) 𝐒𝐧 + (𝟏/𝟔) 𝐙𝐫 + 𝟏𝟎 (𝐎 + 𝐂 + 𝟐𝐍) Equation 2.2
There are a number of variations of this expression, but in all cases, they yield similar values
with deviations of about 5%. Fanning (2000) calculated the aluminium equivalence of titanium
alloys using Equation 2.3.
[𝐀𝐥]𝐞𝐪 = 𝐀𝐥 + 𝟐𝟕 𝐎 Equation 2.3
2.3 Alpha-Beta Titanium Alloys
The second class of titanium alloys are the alpha-beta alloys. They are so named because they
contain both alpha (hcp) and beta (bcc) titanium crystal structures at room temperature. Alpha-
beta titanium alloys have a bimodal equilibrium microstructure, where one phase is alpha
titanium and the other is beta. Examples of microstructures of alpha-beta titanium alloys are
shown in Figure 2.5 (Salem et al., 2014).

12
Figure 2.5: Typical microstructures of alpha-beta titanium alloys, (a) fully lamellar
microstructure (b) equiaxed microstructure, and (c) bimodal microstructure, showing lamellar
αTi and equiaxed βTi (2) (Salem et al., 2014).
The properties of alpha-beta titanium alloys are a weighted average of those of pure alpha and
pure beta alloys, depending on the relative volume fractions of the two phases in the alloy
(Williams et al., 1963; Duerig and Williams, 1984). Alpha-beta alloys are usually produced by
adding both alpha- and beta-stabilising alloying elements to titanium. Grade 5 titanium is found
in this class, and it is a duplex alloy comprising aluminium-stabilised alpha titanium and
vanadium-stabilised beta. Ti-6Al-4V makes up about 50% of all titanium alloys produced
globally and 80% of all the titanium used in aerospace (Crossley, 1981). The advantage of this
group of titanium alloys is that they are heat treatable and, so their mechanical properties can
be altered significantly (Greenfield and Pierce, 1973). Thus, they possess medium to high
strength compared to the alpha alloys, and their applications are much wider than those of alpha
alloys. Alpha-beta titanium alloys are weldable and, although less ductile than their alpha
counterparts, they still possess good hot working properties (Fujii, 1998). The main weakness
of the alloys in this group relative to alpha titanium alloys is their much lower creep resistance
and higher weight due to the generally heavier beta alloy additions (McQuillan, 1949).
2.4 Beta Titanium Alloys
When enough beta-stabilisers are added to titanium to allow for retention of only the beta phase
upon water quenching from the beta phase field to room temperature, the alloy becomes known
as a beta titanium alloy (Hansen et al., 1951). In a similar way to the aluminium equivalence
for alpha alloys, molybdenum equivalence, [Mo] eq, is defined for the beta-stabilisation ability
of elements as shown in Equation 2.4 (Zwicker, 1980).
αTi
β Ti
β Ti
αTiβ Ti αTi

13
𝐌𝐨𝐞𝐪 = [𝐌𝐨] + 𝟏. 𝟐[𝐕] + 𝟎. 𝟕[𝐙𝐫] + 𝟏. 𝟑[𝐂𝐫] + 𝟏. 𝟔[𝐅𝐞] Equation 2.4
It is generally agreed that only titanium alloys with a [Mo]eq greater than 10 can be successfully
water-quenched from the beta phase to obtain a full beta structure at room temperature (Guo et
al., 2005). The reason for quenching beta titanium alloys from the beta phase field to room
temperature is to deny them the minimum time required to transform through diffusion. The
resultant non-equilibrium cooling then proceeds by other mechanisms, with very limited
diffusion. In extreme cases, the transformations will occur without diffusion at all, and will
form martensite (Hammond and Kelly, 1968). The resultant structure of the alloy normally
becomes strained because phases may contain solutes in excess of their solubility limits. The
supersaturated systems will thus have a driving force to eject such solutes, resulting in the
precipitation of secondary phases. The function of beta-stabilisers is to suppress the martensite
start temperature, Ms/Mf, so that on quenching, only the beta phase can be retained (Hammond
and Kelly, 1968).
The microstructures of beta titanium alloys vary greatly depending on chemical composition
and thermomechanical processing. The mechanical properties of the alloys also vary widely
depending on the alloys’ microstructures. Figure 2.6 shows the microstructures of a heavily
stabilised (probably more so than Timetal 125, so could behave differently) beta titanium alloy
Ti-35Nb-7Zr-5Ta, also known as TNZT, in the solution-treated condition and after solution-
treatment and ageing (Taddei et al., 2007).
Figure 2.6: Microstructure of TNZT after (a) solution treatment, showing a single homogeneous
beta phase with all solutes in solution, and (b) solution treatment and ageing, showing
intragranular alpha precipitates in a beta matrix, and grain boundaries (Taddei et al., 2007).
(a) (b)
Intragranular α Ti
Grain boundary
β Ti

14
Timetal 125, on the other hand, is not a heavily stabilized beta titanium alloy, so a fairer
comparison would be with metastable beta titanium alloys. Both beta and metastable beta
titanium alloys are alloys that can be water-quenched from the beta phase to retain a fully beta
microstructure at room temperature. Both βTi and metastable βTi alloys are water quenched
from the βTi phase to retain a fully βTi microstructure at room temperature. The beta alloys
have no to tendency to form αTi once quenched, whereas metastable beta alloys can form αTi
even at moderately low temperatures. Metastable beta titanium can significantly age-harden
compared the heavily stabilised βTi (Guo et al., 2009). A metastable beta titanium that is
currently a subject of intense research is Ti-10V-2Fe-3Al (Ti-10-2-3) (Bohanek, 1973; Messler,
2007). Its beta transus is 805oC and it is solution treated at temperatures 50-90oC above this
temperature. Terlinde et al. (1980) reported that after solution treatment, the alloy is fully beta
and comprises almost equiaxed grains. When the alloy is aged (at temperatures lower than the
beta transus) between 200oC and 500oC, primary alpha precipitates from the metastable beta
phase but this may be preceded by the formation of omega titanium at temperatures between
200oC and 450oC (Terlinde et al., 1980). The omega phase transformed to alpha precipitates
after long holding periods at these temperatures. It was also observed that the volume fraction
of the primary alpha precipitates decreased with increasing ageing temperature, reaching 0%
at the 805oC, the beta transus. The most used metastable beta titanium alloy is Ti-5Al-5Mo-
5V-3Cr (wt%), also known as the Ti-5-5-5-3 or Ti-5553 (Campanelli, 2016). As a similar alloy,
Timetal 125 is expected to exhibit similar properties and to have a similar microstructure and
heat treatment response.
2.5 Diffusion of Alloying Elements in Titanium
When an alloy is quenched, all equilibrium processes, such as diffusion, are retarded due to
kinetic limitations. Diffusion is the major mechanism for equilibrium transformations, and is
dependent on the diffusivities of the atoms in the host material and time, according to Fick’s
second law as shown in Equation 2.5.
𝛛𝐂
𝛛𝐭= 𝐃
𝛛
𝛛𝐱(
𝛛𝐂
𝛛𝐱) Equation 2.5
The diffusion coefficient depends strongly on temperature according to the Arrhenius equation
as in Equation 2.6 (Arrhenius, 1889).

15
𝐃𝐓 = 𝐃𝐨 𝐞−
𝐐
𝐑𝐓 Equation 2.6
The logarithmic form of Equation 2.6 is shown in Equation 2.7, and has been used extensively
to evaluate the diffusivities of alloying elements in titanium, as well as the diffusivities of self-
diffusion of titanium in alpha and beta titanium as a function of temperature.
𝐥𝐧𝐃𝐓 = 𝐥𝐧𝐃𝟎 −𝐐
𝐑.
𝟏
𝐓 Equation 2.7
Elliot (1962) determined the diffusivities of oxygen, aluminium, vanadium and molybdenum
in alpha and beta titanium using an electron microprobe. The results are shown in Table 2.2,
together with diffusivities for self-diffusion of titanium, determined with a titanium isotope
generated from the bombardment of scandium with protons. Invariably, diffusivities of both
interstitial and substitutional atoms were higher in beta titanium than in alpha titanium. This
was attributed to the more open bcc structure compared to the close-packed hcp structure in
alpha titanium (Elliot, 1962).
Table 2.2: Diffusivities of different elements in alpha and beta titanium (Elliot, 1962).
Diffusivity (cm2.s-1)
Element αTi βTi
Titanium lnDT = −21.08 − 5.700/RT lnDT = −8.40 − 28.600/RT
Vanadium lnDT = −31.39 − 3.100/RT lnDT = −4.40 − 41.400/RT
Molybdenum lnDT = −17.19 − 28.400/RT lnDT = −9.00 − 33.100/RT
Aluminium lnDT = −11.04 − 23.700/RT lnDT = −11.11 − 21.900/RT
Oxygen lnDT = −5.28 − 33.500/RT lnDT = 10.35 − 68.700/RT
2.6 Processing of Titanium and Titanium Alloys
The majority of titanium stock is produced as sponge from the Kroll process. The sponge is
normally compacted into small briquettes using hydraulic presses, as shown in Figure 2.7
(Kroll, 1940). Alloying additions in the form of metal powders or master alloys may be added
to the sponge at this stage. The briquettes are vacuum welded into electrodes for further
processing. The electrodes are melted more than once under vacuum to de-gas, as well as to
distillate any excess magnesium from the extraction process.
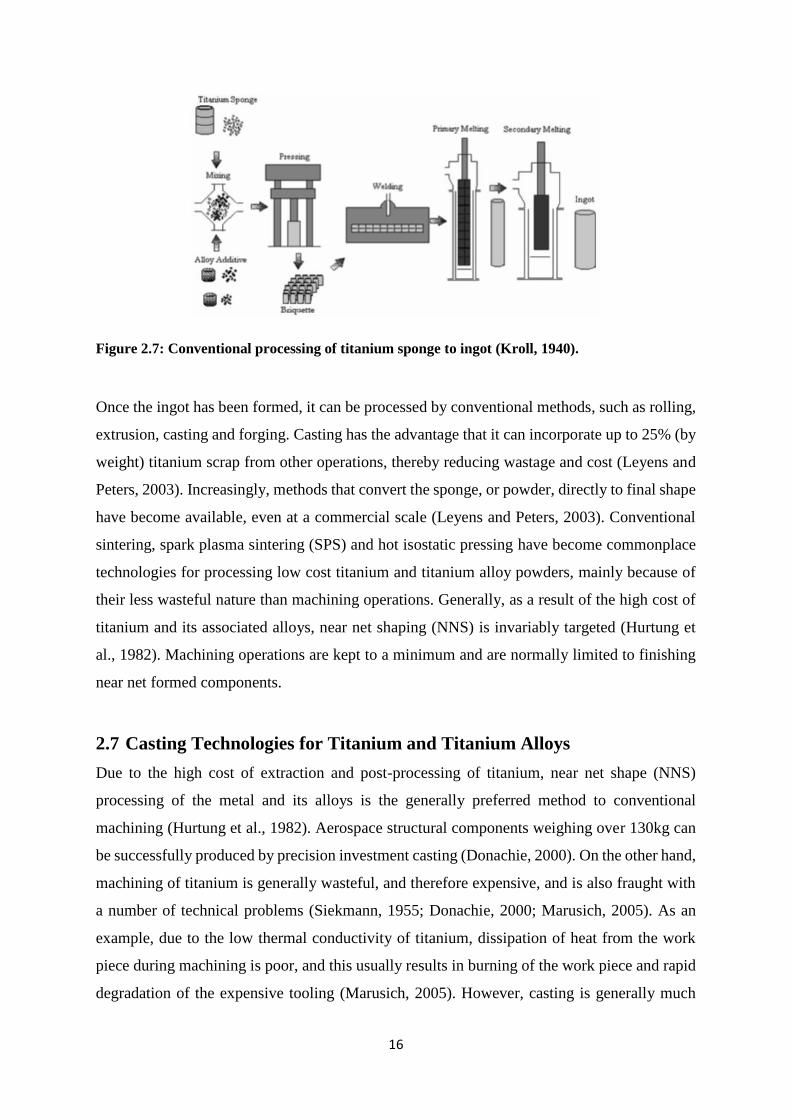
16
Figure 2.7: Conventional processing of titanium sponge to ingot (Kroll, 1940).
Once the ingot has been formed, it can be processed by conventional methods, such as rolling,
extrusion, casting and forging. Casting has the advantage that it can incorporate up to 25% (by
weight) titanium scrap from other operations, thereby reducing wastage and cost (Leyens and
Peters, 2003). Increasingly, methods that convert the sponge, or powder, directly to final shape
have become available, even at a commercial scale (Leyens and Peters, 2003). Conventional
sintering, spark plasma sintering (SPS) and hot isostatic pressing have become commonplace
technologies for processing low cost titanium and titanium alloy powders, mainly because of
their less wasteful nature than machining operations. Generally, as a result of the high cost of
titanium and its associated alloys, near net shaping (NNS) is invariably targeted (Hurtung et
al., 1982). Machining operations are kept to a minimum and are normally limited to finishing
near net formed components.
2.7 Casting Technologies for Titanium and Titanium Alloys
Due to the high cost of extraction and post-processing of titanium, near net shape (NNS)
processing of the metal and its alloys is the generally preferred method to conventional
machining (Hurtung et al., 1982). Aerospace structural components weighing over 130kg can
be successfully produced by precision investment casting (Donachie, 2000). On the other hand,
machining of titanium is generally wasteful, and therefore expensive, and is also fraught with
a number of technical problems (Siekmann, 1955; Donachie, 2000; Marusich, 2005). As an
example, due to the low thermal conductivity of titanium, dissipation of heat from the work
piece during machining is poor, and this usually results in burning of the work piece and rapid
degradation of the expensive tooling (Marusich, 2005). However, casting is generally much

17
cheaper and technically easier. Additionally, casting of titanium allows for the production of
intricate profiles and very large pieces, which are otherwise not practically possible with
machining.
On average, machining costs constitute approximately 60% of the total fabrication cost of a
modern aeroplane, while the use of precision casting reduces this cost to just about 5%, as
illustrated in Figure 2.8 (Donachie, 2000). The other major advantage of casting is its ability
to use scrap as part of the charge, as this further improves the economics of the process
compared wrought operations. Typically, 25% of mass of the charge during vacuum arc
remelting or the casting of the final titanium ingots is titanium scrap from other “wasteful”
operations, such as machining (Arnold, 1959; Leyens, 2003).
Figure 2.8: Cost comparison for a titanium alloy design machined from blocks, forgings and
precision investment casts (Donachie, 2000).
There are three commonly used casting technologies for titanium: conventional casting,
precision investment casting and vacuum die casting. Regardless of the casting method, an
inert atmosphere has to be provided, either by an inert gas or vacuum (Arnold, 1959).
2.7.1 Centrifugal Casting of Titanium and Titanium Alloys
Semi-centrifugal induction casting involves the induction heating of a material and then
centrifuging the molten metal into a mould. Induction heating is electromagnetic and generally
rapid. A major advantage of the process is that the molten bath is stirred by the electromagnetic
field, thereby promoting homogenization (Brown et al., 1947). In addition to the rapid even
0
200
400
600
800
1000
1200
1400
1600
1800
0 20 40 60 80 100 120
Blocks (profile milling) Forgings Precision investment castings
Production quantity
Ave
rage
un
it c
ost
(U
S$)

18
heating and bath stirring associated with induction heating, a very important aspect is that it is
a non-contact method. The heating is therefore clean and best suited for sensitive materials,
such as titanium and its alloys. In most laboratory castings of titanium, copper is used as the
mould. Copper does not react with molten titanium, and due to its very high thermal
conductivity, the melt cools quickly, minimizing impurity segregation in the final casting.
However, the quenching in the copper moulds causes brittleness in the as-cast condition.
Therefore, the castings generally require some heat treatments for stress relief, and in many
cases, they disintegrate on extruding from the moulds. The high thermal conductivity of the
copper moulds makes it difficult to control the solidification rate of the melt (Birmingham et
al., 2000). Thermal conductivities of common engineering materials are shown in Table 2.3.
Table 2.3: Thermal conductivity of selected metals at 25oC and atmospheric pressure
(Birmingham et al., 2000).
Metal Thermal Conductivity (W.m-1.K-1)
Aluminium 237.0
Copper 408.0
Titanium 21.9
Gold 317.0
Nickel 90.7
Birmingham et al. (2000) reported cooling rates in excess of 150oC.s-1 during the first 1-2
seconds of solidification for a number of titanium alloys, decreasing to about 30oC.s-1 during
the β/α transition. These fast cooling rates had a very strong effect on the as-cast
microstructures, and the microstructures were generally dendritic. This was attributed to
significant undercooling of the melts due to rapid conduction of heat from the melt by the
copper moulds (Kattamis and Flemings, 1966). As a result, dendritic beta titanium nucleated,
and thereafter various alpha morphologies nucleated on the prior-β grains.
2.8 Sintering of Titanium and Titanium Alloys
Sintering is a thermally activated process in which powders or porous materials transform to
compact structures, and become more thermodynamically stable through the minimization of
surface energy. Frenkel (1945) and Pines (1946) described sintering as a thermal treatment for
bonding of particles via mass transport that often occurs at an atomic scale, leading to improved
strength and a lower energy of the system.

19
Surfaces have high energy due to incomplete coordination, compared to atoms in the bulk of
the material. This is illustrated in the 2D lattice of atoms shown in Figure 2.9 (Adam and
Kensington, 1941), which shows a coordination of six for inner (bulk) atoms, and only three
or two for surface atoms. The lack of complete coordination for surface atoms results in them
failing to achieve equilibrium rest positions, because they are pulled more inward by the bulk
atoms. As a consequence, such atoms have excess energy and will tend to minimise it by
making the affected surface area a minimum (Adam and Kensington, 1941).
Figure 2.9: Diagram of a 2D lattice showing lower coordination for surface atoms (Adam and
Kensington, 1941).
With respect to titanium and its alloys (and many other materials), advantage is taken of the
excess energy of free surfaces to consolidate them during sintering. This is particularly
effective when the starting material is powder, sponge or is porous (Adam and Kensington,
1941). The driving force for sintering is therefore the minimization of surface energy through
the reduction of free surfaces and the formation of bulk structures with very limited surface
areas (Frenkel, 1945; Pines, 1946). The major process events that take place during sintering
of a powder or a porous material into a consolidated mass are shown in Figure 2.10 (German,
1996). Here, originally small particles, with large surface areas, and hence high surface energy,
coalesce into a larger mass by contact, resulting in a much lower surface energy per unit
volume.
Atom bonded to 6 neighbors
Atom bonded to 5 neighbors
Atom bonded to 4 neighbors
Atom bonded to 2 neighbors

20
Figure 2.10: Major stages of sintering showing reduction in free surfaces and contact formation
(German, 1996).
The major theories on sintering were developed by Frenkel in 1945 and Pines in 1946, and are
generally in agreement that four mass transport events are responsible for the densification of
materials during sintering: surface diffusion, grain boundary diffusion, lattice diffusion and
simple evaporation (Frenkel, 1945; Pines, 1946).
There are a number of technical problems associated with sintering powders, including titanium
and its alloys. For example, Gasik and co-researchers (2009) studied the sintering behaviour of
the alloy Ti-33Al-33V (wt%) using dilatometry and differential scanning calorimetry (DSC).
They showed that during sintering, often new phases formed, which resulted in volume
changes, stress and misfits. Some phases underwent thermal expansion, further complicating
the process. It was concluded that the success of sintering titanium alloy powders depended on
appropriate heating rates and final sintering temperature, and very minimally on green density
variations. They calculated the activation energy for sintering the alloy to be approximately
296 kJ.mol-1.
2.9 Spark Plasma Sintering of Titanium Alloys
Spark plasma sintering (SPS), also known as the fast assisted sintering technique (FAST) and
pulse electric current sintering (PECS), is a relatively new metal and ceramic forming
technique used in the powder metallurgy industry (Gasik et al., 2009; Gasbarre and
MacGeehan, 2012). It uses high intensity direct current pulses to raise the material’s
temperature by the Joule effect. Unlike conventional hot pressing, spark plasma sintering relies
on internal heating. Pulsed direct current (DC) is passed through a graphite crucible, or through
the powder compact if the material is conductive (Tokita, 2006). Internal generation of heat
produces rapid heating and cooling, which makes the process much faster than conventional
sintering. Due to the rapid nature of the process, grain coarsening is normally avoided during

21
sintering (Tokita, 2006; Munir and Tamburini, 2006). The technique is still based on the theory
of sintering developed by Frenkel and Pines, except that the method of heat generation is
different, and that the technique also incorporates the simultaneous application of pressure to
ensure maximum density of the sintered parts (Munir and Tamburini, 2006). As with all
sintering techniques, external pressure assists by providing stress on the material. Normally,
large pores resist sintering, and the application of pressure collapses them, resulting in the
material attaining full density at lower temperatures (German, 1996). A spark plasma sintering
machine is shown in Figure 2.11.
Figure 2.11: Basic Configuration of an SPS machine (Tokita, 2006).
Xiao et al. (2009) claimed that the technique compacted powders satisfactorily. They studied
the spark plasma sintering response of a Ti-47Al alloy, and reported an average theoretical
density of 99.9±0.1%. They also showed that the heating profile, pressure, soaking time, and
heating and cooling rates played crucial roles in developing the microstructure, and hence
mechanical properties of the sintered parts. When heating rates and pressure were kept
constant, the sintering temperature was critical for closure of pores and attainment of full
density, as shown in Figure 2.12 (Xiao et al., 2009).

22
(a) (b)
Figure 2.12: SEM micrographs of Ti-47Al after spark plasma sintering at 50MPa at a heating
rate of 50oC.min-1 at (a) 400oC and (b) 900oC (Xiao et al., 2009).
Weston et al. (2015) investigated the sinterability of commercial alpha and beta titanium by
spark plasma sintering. They concluded that the process was insensitive to feedstock size and
morphology, although very coarse particles were difficult to sinter. It was also demonstrated
that the maximum sintering temperature and pressure were the main parameters that
determined the densification and the sintered microstructure (Weston et al., 2015). Sintering of
beta titanium alloys requires relatively shorter periods than α or (α+β) Ti alloys, and this has
been attributed to more open bcc structure, which allows for better diffusion (Liu et al., 2006).
Young and Qian (2015) reported that spark plasma sintering of T-6Al-4V (wt%), an (αTi+βTi)
alloy, resulted in mechanical properties very close to those of the cast alloy. They found that
solute homogenisation was faster in the spark plasma sintered than hot isostatically pressed
alloys, and identified this as the main advantage of spark plasma sintering over hot isostatic
pressing, since achieving solute homogenisation in titanium alloys containing slow diffusers
is one of the process’s key requirements.
2.10 Machining of Titanium and Titanium Alloys
Titanium and its alloys can be machined into different shapes using conventional machining
methods. While machining is less favoured than near-net shaping operations such as casting
and sintering, it is almost inevitable, since even near-net components require some finishing
through machining. Compared to mild steels, machining of titanium is more difficult because
of the metal’s low thermal conductivity, which makes dissipation of heat from the work piece
problematic (Siekmann, 1955). The heat generated in the areas experiencing the cut causes

23
hardening of the surface, resulting in poor geometric accuracies and severe reduction in fatigue
strength (Siekmann, 1955). Thus, it is essential to be generous with coolants when machining
titanium or its alloys, if oxidation (“burning”) is to be avoided. Due to the reactivity and high
affinity of titanium for oxygen, nitrogen and hydrogen at high temperature, the choice of
coolant is critical. The RMI Titanium Company (2000) recommends the conditions required
to successfully machine the metal and its alloys. Apart from having sufficient coolant to cater
for the low thermal conductivity of the titanium alloy, sharp tooling should be used to avoid
heat build-up and galling (loss of material due to sticking of the surface of the work piece to
the cutting tool). Due the reactivity of titanium at high temperatures, not all coolants can be
used, and it is generally agreed that water-based coolants are best for its machining (Turkovish,
1982; Marusich, 2005). Chlorine and sodium ions have been associated with stress-corrosion
cracking of titanium, and so these two ions cannot form part of the coolant during machining
(Marusich, 2005).
The second problem associated with the machining of titanium and its alloys is that they have
a strong alloying tendency with the chemical components of most cutting tools at tool operating
temperatures (Turkovish, 1982). Consequently, the titanium work piece tends to periodically
weld to the tool, resulting in galling, smearing and rapid destruction of the tool. Additionally,
titanium has a relatively low Young’s modulus and hence suffers from pronounced spring-back
during machining (Lamaire and Backofen, 1971). Thin parts tend to deflect under tool pressure,
resulting in tolerance problems. When machining titanium, it is thus critical to ensure the
rigidity of the entire machining set-up and to make use of sharp tools.
As with many machining operations, the temperature at the tool tip during machining is directly
proportional to the cutting speed. The CIMCOOL report (2007) states that an increase in cutting
speed from 20 to 150 surface feet per minute (sfpm) increased the tool tip temperature from
425 to 925oC. Marusich (2005) simulated the temperature profile on a Ti-6Al-4V work piece
and a WC/Co cutting tool using AdvantEdge software and the results are shown in Figure 2.13.
The feed rate (fr) was 0.2mm.min-1 and the cutting speed (fc) was 115m.min-1. At such a high
cutting rate, it was demonstrated that the temperature at the tool tip and contact with the work
piece could easily reach 1100oC.

24
Figure 2.13: Third wave AdvantEdge simulation of temperature at tool tip-work piece contact
during machining of Ti-6Al-4V at a feed rate 0.2mm.min-1 and cutting rate of 115m.min-1 using a
WC/Co cutting tool (Marusich, 2005).
Therefore, it is important to employ low cutting speeds when machining titanium. Finally, it is
recommended to use high feed rates (Siekmann, 1955; Hurtung et al., 1982). Most titanium
machining operations employ high speed steel tools because of their lower cost and higher
flexibility than cemented carbides, although increasing operations are opting for cemented
carbides due to their lower cost per cut. The technology of high speed cutting tools continues
to develop, and the current inclination is towards using cubic boron nitride (CBN) and
polycrystalline diamond (PCD) cutting tools for machining titanium (Davim, 2008). Their
main advantages are extreme hardness, toughness and wear resistance, in addition to chemical
inertness at the high temperatures associated with machining titanium or its alloys (Siekmann,
1955; Machado and Wallbank, 1990; Ezugwu, 2005). Cubic boron nitride has a hardness in
excess of 4500 HV, which is only second to PCD (9000 HV), and this significantly exceeds
the hardness of molybdenum (M-series steels) or tungsten-based high speed cutting steels (T-
series) (Ezugwu, 2005). On the downside, extreme hardness has a deleterious effect on the
fracture toughness of the tool. Thus, extremely hard tools like CBN and PCD are very fragile,
making their use difficult and expensive (Whitney, 1994; Davim, 2008). However, as the
demands of the titanium machining industry increase, a corresponding effort on improving the
tooling capabilities through improvement of existing tools and introduction of new materials
is to be expected.

25
2.11 Heat Treatment and Grain Growth in Titanium Alloys
Normally, once shaped, the components are heat treated to obtain the best microstructure for
further forming operations or service. For beta titanium alloys, a solutionizing heat treatment
is normally preferred, as it produces a microstructure in which all solute components are
dissolved in the main phase (Hansen et al., 1951). Solution treatment is normally done about
50oC above the beta transus to ensure that the alloy is completely beta. With sufficient beta-
stabilisers, the beta phase can be retained upon water quenching. In the solution-treated state,
all solutes are dissolved in the matrix, and the beta phase will be saturated and metastable
(Hansen et al., 1951). In this state, the alloy is normally ductile and malleable, allowing for
relatively large reductions in area without significant strain hardening or fracture. This is
attributed to the bcc structure having more slip planes than hcp (Moskalenko et al., 1973). Thin
sheet and strip are therefore very common with beta titanium alloys. Thereafter, homogenizing,
stress relieving and subsequent strengthening and stabilising by ageing heat treatments may be
done on the final component (Greenfield and Pierce, 1973).
In all hot working processes with titanium and its alloys, an inert atmosphere is required to
shield the components from oxidation and nitridation by air. Normally, alpha-beta and beta
titanium have to be aged in order to stabilise their microstructures, and hence properties, before
use. This is because most of them are metastable as a result of the quenching that they undergo
in order to retain the beta phase (Greenfield and Pierce, 1973). Once cold, some beta normally
transforms into the more thermodynamically stable alpha phase through natural ageing. This
inevitably results in a change of the properties, and even dimensions, of the alloy over time. To
remedy this, alpha-beta and beta titanium alloys are artificially aged until they acquire their
equilibrium states by allowing the (βTi) to (αTi) transformation to occur at a temperature higher
than ambient temperature for faster kinetics. After artificial ageing, the alloys are generally
deemed to be stable. Most beta titanium alloys are used in the solution-treated and aged (STA)
condition, and the processing technology used is strongly determined by economic
considerations.
As mentioned previously, the majority of metals and alloys rarely achieve their desired
mechanical properties without undergoing an appropriate heat treatment. Generally, once the
final consolidated part has been shaped, the next step is to heat the component to produce a
microstructure which gives the desired mechanical properties. Heat treatment generally entails
both heating and cooling (Bain and Griffiths, 1927). The need for heating is to trigger thermally

26
activated processes, such as diffusion of solutes and grain growth. Diffusion tends to
homogenise the system, eliminate solute concentration gradients and therefore minimise
energy. On the other hand, grain growth minimises surface energy through the formation of
larger grains and hence fewer grain boundaries (Beck, 1956). The process of thermally
activating diffusion and grain growth is carefully controlled to result in a microstructure which
gives the desired mechanical properties. While in many cases, equilibrium microstructures can
be achieved at room temperature through natural ageing, elevated temperature aids in providing
for better process kinetics, giving shorter processing time. Diffusion and grain growth are
governed by temperature and time. Ideally, when grains grow without hindrance, the grain
diameter, d, can be calculated if the initial grain size, do, is known, according to Equations 2.8
and 2.9 (Beck, 1956).
𝐝𝟐 − 𝐝𝐨𝟐 = 𝐤𝐭 Equation 2.8
𝐤 = 𝐤𝐨 𝐞−𝐐𝐠
𝐑𝐓 Equation 2.9
For the ideal case, grain growth would obey these equations, but in real systems it is governed
by some boundary conditions, and the grains cannot grow indefinitely as suggested by Equation
2.8. When Equation 2.8 is differentiated with respect to time to establish its critical points, and
hence the maximum grain size, d, Equation 2.10 is produced. It is evident that such a maximum
would only exist at some infinitely large t, although this is not observed.
𝐝𝐝
𝐝𝐭=
𝐤
√𝐝𝐨𝟐+𝐤𝐭
𝟐 Equation 2.10
This is because the driving force for grain growth decreases with time, since the surface area
of the grain boundaries per unit volume decreases as the grains grow (Doherty, 2005). In
situations where a second phase is present, particularly rigid intermetallic compounds, grain
growth is hindered by grain boundary (Zener) pinning by the secondary phase (Zener, 1948),
and grain growth then ceases to obey Equation 2.8. Beck (1956) modelled grain growth in Ti-
6Al-4V and showed that grain size depended on the initial grain size of the alloy according to
Equation 2.11.
𝐝 − 𝐝𝐨 = 𝐤𝐭𝐧 Equation 2.11
where d = grain size at any time (t)
do = initial grain size

27
t = heat treatment time.
The constants, k and n, are dependent on the material, composition and heat treatment
temperature, but are independent of grain size. The parameter, n, is known as the growth order
of the material. For normal grain growth, where grains grow homogeneously, n is ~0.5, and
Equation 2.11 becomes the same as Equation 2.8 (Beck, 1956; Rodriguez et al., 1995). In
abnormal grain growth, where subsets of the grains tend to grow preferentially, n is normally
smaller. However, in all cases grain growth is a diffusion process, and is a thermally activated
event. Beck (1956) showed that the constant k was a rate constant which obeyed the Arrhenius
equation shown in Equation 2.12 (Arrhenius, 1889).
𝐤 = 𝐤𝐨 𝐞−𝐐𝐠
𝐑𝐓 Equation 2.12
where ko = pre-exponential factor for the system
Qg = the activation energy for grain growth
R = the universal gas constant
T= absolute temperature.
For titanium alloys, the heat treatment required depends strongly on the composition and the
desired properties. For (βTi) alloys, part of the heat treatment involves quenching the alloy
from the beta phase field to retain the (βTi) at room temperature (Silcock, 1955; Rodriguez et
al., 1995). The retained (βTi) will be unstable at room temperature, but the presence of
stabilizing elements, such as molybdenum and vanadium, assist in providing stability
(Williams et al., 1971).
2.12 Mechanical Properties of Titanium and Titanium Alloys
The most sought-after mechanical properties of titanium and its alloys are high strength, low
weight and good fatigue and corrosion resistance (Chernova, 1961). The mechanical properties
of titanium alloys vary greatly, depending on chemical composition and microstructure. Table
2.4 shows important mechanical properties of a number of titanium alloys which are
commercially available (Davis, 1997).
Table 2.4: Mechanical Properties of Common Titanium Alloys (Davis, 1997).
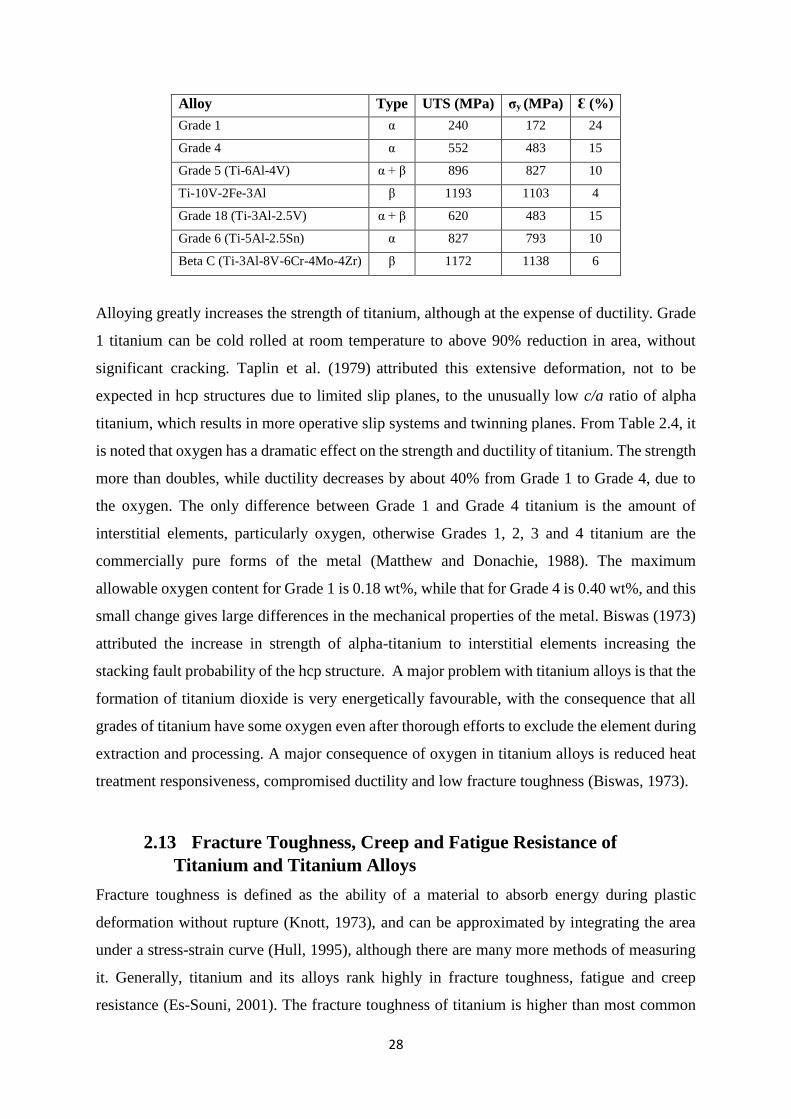
28
Alloy Type UTS (MPa) σy (MPa) Ɛ (%)
Grade 1 α 240 172 24
Grade 4 α 552 483 15
Grade 5 (Ti-6Al-4V) α + β 896 827 10
Ti-10V-2Fe-3Al
Grade unassigned
β 1193 1103 4
Grade 18 (Ti-3Al-2.5V) α + β 620 483 15
Grade 6 (Ti-5Al-2.5Sn) α 827 793 10
Beta C (Ti-3Al-8V-6Cr-4Mo-4Zr)
Grade 19
β 1172 1138 6
Alloying greatly increases the strength of titanium, although at the expense of ductility. Grade
1 titanium can be cold rolled at room temperature to above 90% reduction in area, without
significant cracking. Taplin et al. (1979) attributed this extensive deformation, not to be
expected in hcp structures due to limited slip planes, to the unusually low c/a ratio of alpha
titanium, which results in more operative slip systems and twinning planes. From Table 2.4, it
is noted that oxygen has a dramatic effect on the strength and ductility of titanium. The strength
more than doubles, while ductility decreases by about 40% from Grade 1 to Grade 4, due to
the oxygen. The only difference between Grade 1 and Grade 4 titanium is the amount of
interstitial elements, particularly oxygen, otherwise Grades 1, 2, 3 and 4 titanium are the
commercially pure forms of the metal (Matthew and Donachie, 1988). The maximum
allowable oxygen content for Grade 1 is 0.18 wt%, while that for Grade 4 is 0.40 wt%, and this
small change gives large differences in the mechanical properties of the metal. Biswas (1973)
attributed the increase in strength of alpha-titanium to interstitial elements increasing the
stacking fault probability of the hcp structure. A major problem with titanium alloys is that the
formation of titanium dioxide is very energetically favourable, with the consequence that all
grades of titanium have some oxygen even after thorough efforts to exclude the element during
extraction and processing. A major consequence of oxygen in titanium alloys is reduced heat
treatment responsiveness, compromised ductility and low fracture toughness (Biswas, 1973).
2.13 Fracture Toughness, Creep and Fatigue Resistance of
Titanium and Titanium Alloys
Fracture toughness is defined as the ability of a material to absorb energy during plastic
deformation without rupture (Knott, 1973), and can be approximated by integrating the area
under a stress-strain curve (Hull, 1995), although there are many more methods of measuring
it. Generally, titanium and its alloys rank highly in fracture toughness, fatigue and creep
resistance (Es-Souni, 2001). The fracture toughness of titanium is higher than most common
29
engineering metals and alloys, and all known engineering ceramics (Davidge, 1979). Walcher
et al. (1979) showed that the fracture toughness of titanium and its alloys was strongly affected
by chemical composition, microstructure, presence and quantity of interstitial elements, and
temperature. Goijaerts et al. (2001) reported that extra low interstitial (ELI) titanium alloys,
with maximum allowable tolerances of 0.13 wt% O, 0.05 wt% N and 0.08 wt% C, exhibited
the highest fatigue resistance. Horiya and Kishi (1994) demonstrated that in alpha and alpha-
beta titanium alloys, acicular microstructures had the highest fracture toughness, because a
threadlike structure resisted crack propagation. They showed that βTi alloys generally had
higher fracture toughness than alpha and alpha-beta alloys when their 0.2% proof stress was
around 1000MPa, but a lower toughness when their proof stress was above 1500MPa. The
reason for this could be that as the strength of the beta alloys increases, the decrease in ductility
is much more pronounced. With such high strength values, βTi alloys have low ductilities
which compromise their ability to absorb energy on impact. Almost invariably, the fracture
toughness of titanium alloys, regardless of their type, increases with temperature (Peart and
Tomlin, 1962). This is because materials lose strength but gain ductility with increasing
temperature, which can be explained at the atomic level using the atomic theory (Pauling, 1932;
Cottrell, 1958).
Srivastava et al. (2004) studied the tensile properties of Ti-Nb-Zr alloys. Figure 2.14 shows the
stress-strain curves of Ti-Nb-Zr alloys with varying amounts of the alloying elements, and
demonstrates the complexity of alloying content on the mechanical properties of titanium
alloys (Srivastava et al., 2004).
For the alloys with 13 wt% Zr, increasing the amount of niobium from 8 to 13 wt% increased
their tensile strength. However, the strength decreased when the amount of niobium was
increased to 18 wt%. There was a clear improvement in ductility with increasing niobium,
which was attributed to an increase in the volume fraction of the ductile βTi, since niobium is
a beta-stabiliser (Srivastava et al., 2004).

30
Figure 2.14: Superposed stress-strain curves of variants of the Ti-Nb-Zr alloy (Srivastava et al.,
2004).
The effect of zirconium was not clear, but it is known that zirconium reduces the volume
fraction, upper temperature limit of formation and the stability of the omega phase. The omega
phase is a metastable phase, which has been associated with brittleness in (βTi) alloys
(Williams et al., 1971). Zirconium appeared to have a smaller effect on the strength than
niobium. This could be attributed to Zr being alpha- and beta-isomorphous with titanium due
to the two metals’ similar structure, size and valence (Hume-Rothery et al., 1935), so zirconium
cannot markedly strengthen titanium by precipitation hardening, unlike niobium.
The very low strength for the alloy with 41.1 Nb and 7.1 Zr (wt%) could be attributed to the
alloy not being necessarily a titanium alloy since the alloying elements’ content was almost 50
wt%. In such a case, the properties of the alloy cannot be dominated by titanium, but should be
between the properties of the components, particularly Nb in this case.
2.14 Alloying elements
Of all titanium alloys, beta alloys exhibit the highest strength and lowest ductility, particularly
after ageing (Moskalenko et. al, 1970). Except for aluminium, all the other common non-
interstitial alloying elements are heavier than titanium. In particular, molybdenum is a much
heavier element than titanium, with a density of 10.28 g.cm-3 compared to 4.51 g.cm-3 for
titanium. Molybdenum additions generally increase specific strength (Hoch and Viswanathan,
1973). While the high density of molybdenum inevitably increases the densities of the titanium
alloys to which it is added, its beneficial effects, such as high corrosion resistance and extreme

31
stability at high temperature, offset the increase in density (Stephens and Witzke, 1972). Better
still, in most titanium alloys, molybdenum is used in very small quantities relative to the base
metal, 8 wt% being the highest Mo content in known commercial titanium alloys currently
available. The increase in the density of the alloy is therefore usually very small and, in many
cases, the density increase is strongly countered by the density decrease from the lighter
elements, such as aluminium, which are normally used in titanium alloys.
Alloying elements interact with titanium in various ways, depending on their crystal structure,
valence, electronegativity and size. Small atoms, such as oxygen, hydrogen, nitrogen and
carbon, fit into the interstices of the titanium lattice to form interstitial alloys, and are all alpha-
stabilisers (Ageev and Petrova, 1970). All the metals that are commonly used to alloy titanium
form substitutional alloys. Transition metals generally tend to be beta-stabilisers, while non-
transition metals stabilise the alpha phase. Ageev and Petrova (1970) postulated that the beta-
stabilization by transition elements could be justified in terms of the screening model. They
argued that the high conduction-electron concentration of transition metals, which enhances
screening of ion cores, may favour a symmetrical, and hence, cubic structure. They also showed
that the beta-stabilization action of transition metals was greater the further away the transition
element was from titanium on the periodic table. In general, transition metals lower the β-
transus temperature and cause stabilization of βTi at lower temperatures. These β-stabilizing
elements are mainly classified into isomorphous or eutectoid-forming systems. Ti-V and Ti-
Mo are beta-isomorphous systems and form solid solutions at most temperatures, while Fe, Cr
and Mn are eutectoid-forming elements, which result in the decomposition of βTi to αTi and
an intermetallic compound (Silcock et al., 1955; Collings, 1984).
The general behaviour of βTi has been studied in great detail for many years. Silcock et al.
(1955) showed that βTi alloys formed martensite or athermal omega (ω) titanium, instead of
the beta phase when quenched, depending on their composition. They found that the beta phase
lost stability, and could separate into β and βʹ phases, both with a bcc structure, upon slow
cooling. The β phase contained more solute elements than βʹ (Silcock et al., 1955). They also
reported that when many beta titanium alloys were re-heated to temperatures below 500° C,
they initially became hard and brittle. This was attributed to the precipitation of a metastable
nano-sized phase, omega titanium. The alloys subsequently soften when the omega phase
decomposes at higher temperatures, or after extended heat-treatment. The instability of the beta
phase was corroborated by Rhodes and Williams (1975), who studied the ageing behaviour of
metastable β(Ti, Mo) alloys. They showed that, in addition to athermal decomposition, the beta
32
phase could also decompose isothermally to give two types of alpha titanium. Type 1 alpha
obeyed the Burgers relationship (110)β//(0001)α, [111]β//[1120]α with respect to the parent beta
phase, while Type 2 did not (Rhodes and Williams, 1975). They showed that Type 1 alpha
formed during ageing between 450 and 600oC, but was replaced by Type 2 upon extended
ageing.
2.14.1 Thermodynamics, Phase Diagrams and Design of Titanium Alloys
Simple binary and ternary alloys can be described using phase (constitution) diagrams. These
are thermodynamic diagrams that show the most stable phases as a function of alloy
composition and temperature. The principle behind the diagrams is that phases with the lowest
Gibbs energy in a system are the most stable, and that all phases in equilibrium have the same
chemical potential (van Laar, 1908; Hildebrand, 1929).
Titanium alloys have been studied for many years, and many phase diagrams are available for
simple two- and three-component titanium systems. For multicomponent alloy systems with
more than three components, although representation on phase diagrams is possible, the
interpretation of these phase diagrams is more difficult. For such alloys, a different
representation is normally used, e.g. phase proportion diagrams.
2.14.2 Equilibrium Phases
Equilibrium phase transformations are reconstructive, and involve diffusion of atoms, atomic
jumps, breaking and re-establishment of chemical bonds. Therefore, they require time to occur,
as well as high enough temperature to surmount the energy barrier for diffusion (Bain and
Griffiths, 1927). The transformations continue until the components in all the phases reach the
same chemical potential.
In titanium alloys, only two equilibrium phases, α and β, are known to exist, in addition to
intermetallic compounds for eutectoid-forming elements (Duwez, 1949). Since no alloying
element can suppress the beta transus to below room temperature, it is not possible to retain
the beta phase by equilibrium cooling. To retain the beta phase at room temperature, it is
therefore necessary to quench, in order to deny equilibrium transformation the requisite time
to occur (Bain and Griffiths, 1927). Griener and Ellis (1948) found that αTialloys could not be
strengthened by heat treatment. It was later realised that it was not possible to retain (βTi) on
quenching the alloys (Williams et al., 1971). Quenching (αTi) alloys resulted in the formation
of martensite or the omega phase, which transformed to (αTi) or (βTi) respectively on heat
treatment (Roy, 1973).
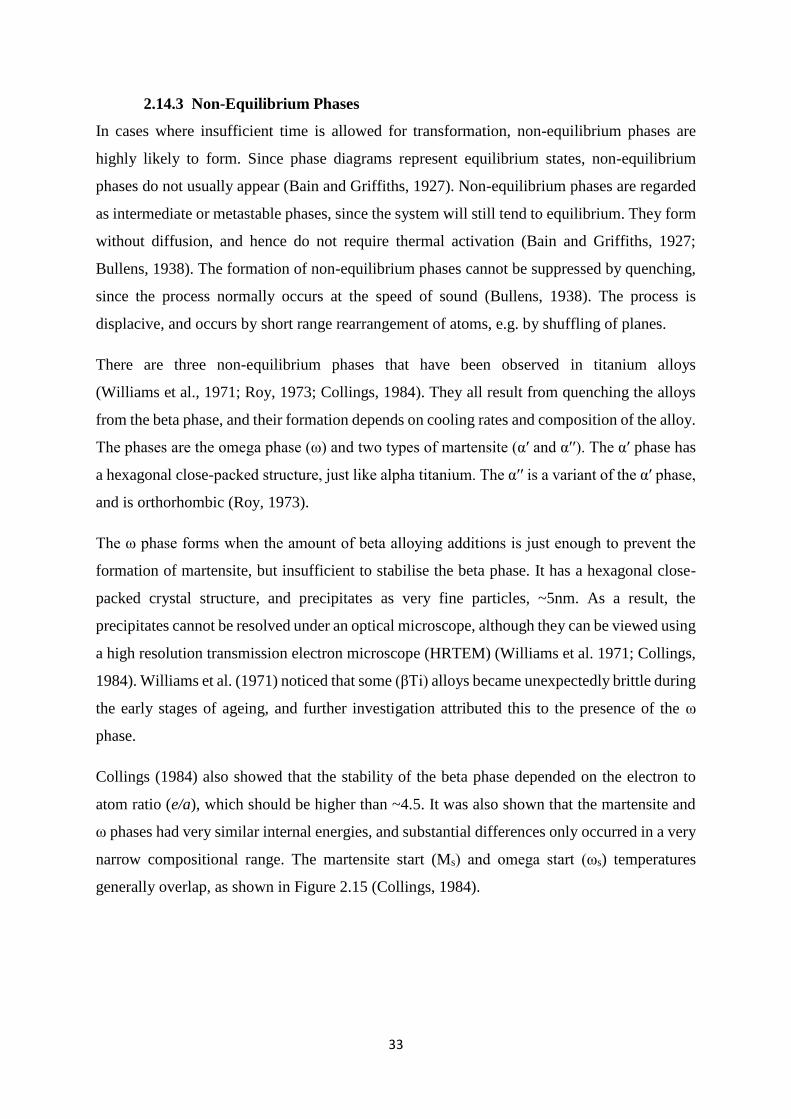
33
2.14.3 Non-Equilibrium Phases
In cases where insufficient time is allowed for transformation, non-equilibrium phases are
highly likely to form. Since phase diagrams represent equilibrium states, non-equilibrium
phases do not usually appear (Bain and Griffiths, 1927). Non-equilibrium phases are regarded
as intermediate or metastable phases, since the system will still tend to equilibrium. They form
without diffusion, and hence do not require thermal activation (Bain and Griffiths, 1927;
Bullens, 1938). The formation of non-equilibrium phases cannot be suppressed by quenching,
since the process normally occurs at the speed of sound (Bullens, 1938). The process is
displacive, and occurs by short range rearrangement of atoms, e.g. by shuffling of planes.
There are three non-equilibrium phases that have been observed in titanium alloys
(Williams et al., 1971; Roy, 1973; Collings, 1984). They all result from quenching the alloys
from the beta phase, and their formation depends on cooling rates and composition of the alloy.
The phases are the omega phase (ω) and two types of martensite (αʹ and αʹʹ). The αʹ phase has
a hexagonal close-packed structure, just like alpha titanium. The αʹʹ is a variant of the αʹ phase,
and is orthorhombic (Roy, 1973).
The ω phase forms when the amount of beta alloying additions is just enough to prevent the
formation of martensite, but insufficient to stabilise the beta phase. It has a hexagonal close-
packed crystal structure, and precipitates as very fine particles, ~5nm. As a result, the
precipitates cannot be resolved under an optical microscope, although they can be viewed using
a high resolution transmission electron microscope (HRTEM) (Williams et al. 1971; Collings,
1984). Williams et al. (1971) noticed that some (βTi) alloys became unexpectedly brittle during
the early stages of ageing, and further investigation attributed this to the presence of the ω
phase.
Collings (1984) also showed that the stability of the beta phase depended on the electron to
atom ratio (e/a), which should be higher than ~4.5. It was also shown that the martensite and
ω phases had very similar internal energies, and substantial differences only occurred in a very
narrow compositional range. The martensite start (Ms) and omega start (ωs) temperatures
generally overlap, as shown in Figure 2.15 (Collings, 1984).

34
Figure 2.15: Schematic diagram showing Ms and ωs loci for a binary Ti-X system, where X is a
beta stabilizing element, on rapid quenching from the beta phase filed, region I corresponds to α΄
formation, II to α΄+ω, III to ω + β, and IV to metastable or stable β (after Collings, 1984).
Williams et al. (1971) discovered that in the presence of beta-stabilisers, alpha-stabilisers (such
as aluminium and oxygen) tended to suppress ω formation, and favoured the formation of (βTi).
It is partly for this reason that many (βTi) alloys have some alpha-stabilisers, especially
aluminium (Collings, 1984).
2.14.4 Effect of Aluminium on Titanium
For two reasons, a discussion of titanium can never be complete without mention of the Ti-Al
phase diagram. First, aluminium is the most widely used alloying element of titanium, and
second, the history of the Ti-Al system from the 1950s to date has been controversial but
interesting.
Aluminium, as a non-transition metal, has no d-electrons and hence cannot increase the electron
density of titanium. Ageev and Petrova (1970) showed that this was the case with all non-
transition metals, because very few electrons appeared at the Fermi level, and most were in
states within the lower part of the band. Titanium d-electrons tend not to interact with such
atoms, which thus have the effect of diluting the titanium sub-lattice. The result is to emphasize
any pre-existing Ti-Ti bond directionality, and thus preserve the hcp structure. Ageev and
Petrova (1970) showed that continued addition of non-transition metals to titanium eventually
destabilised the alpha structure through the formation of intermetallic compounds, which were
also hexagonal.
Apart from aluminium acting as an alpha-stabiliser in titanium, more has been reported about
its effects on the metal. Batalu et al. (2006) claimed that aluminium is the most important
Ms
ωs
I II III IV
Tem
per
atu
re
Concentration of X

35
alloying element of titanium, as is carbon to steel. Attempts to derive the Ti-Al phase began as
early as 1907, through the work of Manchot and Richter (1907). During this time, the interest
was in aluminium alloys more than titanium. As such, studies of the Ti-Al phase diagram were
limited to the aluminium-rich end of the system (Chin and Biederman, 1992). Hansen et al.
(1936) also worked on the system, but they too were limited to the aluminium-rich end.
However, in the early 1950s, because a commercial method of producing titanium was now
available, focus shifted toward establishing the entire phase diagram. The earliest attempt to
derive the full phase diagram was by Duwez (1951), although Ogden (1951) was the first to
officially publish one. The system has been a subject of study since, and a number of variants
of the phase diagram are currently available (Chin and Biederman, 1992). The early work was
based on metallographical examination, as other techniques had not yet been developed.
However, the accuracy of the results later became questionable as more accurate analytical
techniques became available (Murray, 1988). Another problem encountered by the first
researchers the lack of high vacuum technologies at the time. In the 1950s, the vacuum system
was no better than 10-4 torr, and this was not enough to exclude oxygen from the alloys
(Murray, 1981; Chin and Biederman, 1992). Since oxygen stabilises the alpha phase, the results
by Duwez (1951) and Ogden (1951) were skewed toward a larger alpha phase field.
The diagram by Ogden (1951) was experimentally derived up to only 1100oC, beyond which
was extrapolation. The diagram, shown in Figure 2.11, was disputed because of lack of
experimental data above 1100oC and was totally dismissed after realising that it showed the
melting point of pure titanium to be 1690oC instead of the accepted value 1670oC (Mishurda
and Perepezko, 1991).
Bumps (1952) produced the full Ti-Al phase diagram by experimentation up to 1400oC. The
work relied on heat treating Ti-Al alloys, followed by quenching and analysis of the samples
by optical microscopy. The diagram, shown in Figure 2.17, showed that the alpha phase field
terminated at 1240oC. This dismissed the extrapolation of Ogden (1951) which showed a
peritectic reaction, shown in Equation 2.13, at 1480oC.
𝐋 + (𝛂𝐓𝐢) ↔ (𝛄𝐓𝐢) Equation 2.13
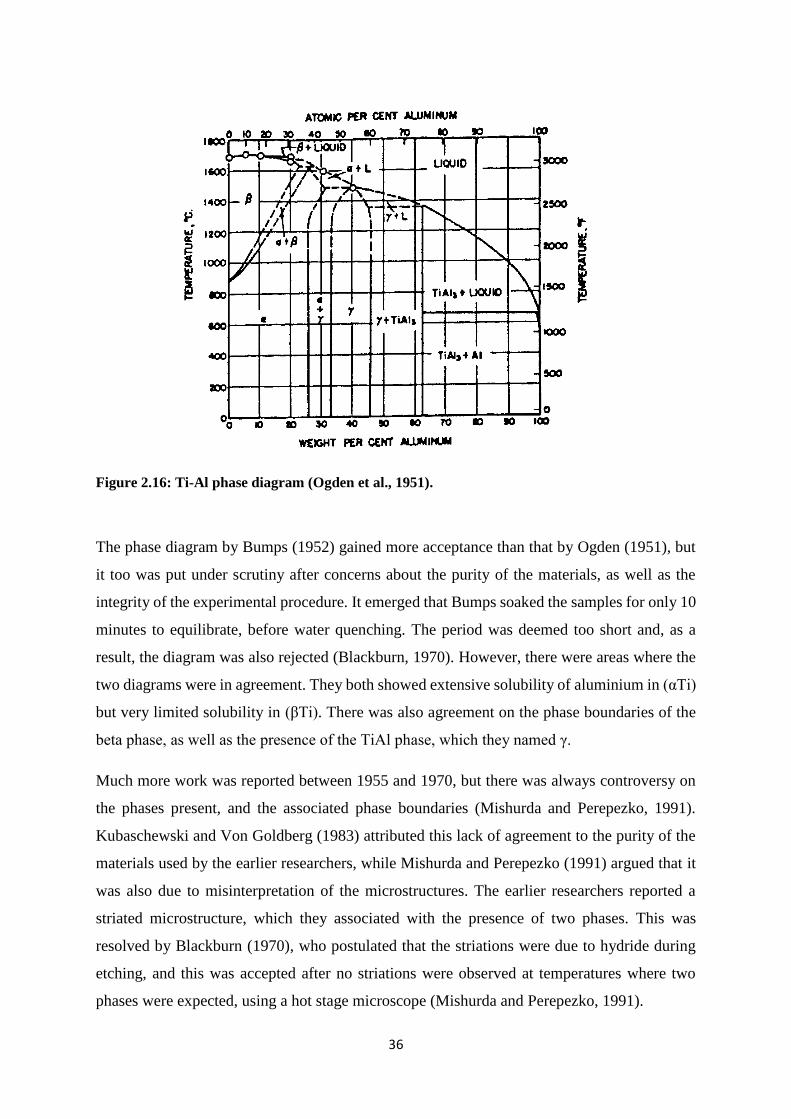
36
Figure 2.16: Ti-Al phase diagram (Ogden et al., 1951).
The phase diagram by Bumps (1952) gained more acceptance than that by Ogden (1951), but
it too was put under scrutiny after concerns about the purity of the materials, as well as the
integrity of the experimental procedure. It emerged that Bumps soaked the samples for only 10
minutes to equilibrate, before water quenching. The period was deemed too short and, as a
result, the diagram was also rejected (Blackburn, 1970). However, there were areas where the
two diagrams were in agreement. They both showed extensive solubility of aluminium in (αTi)
but very limited solubility in (βTi). There was also agreement on the phase boundaries of the
beta phase, as well as the presence of the TiAl phase, which they named γ.
Much more work was reported between 1955 and 1970, but there was always controversy on
the phases present, and the associated phase boundaries (Mishurda and Perepezko, 1991).
Kubaschewski and Von Goldberg (1983) attributed this lack of agreement to the purity of the
materials used by the earlier researchers, while Mishurda and Perepezko (1991) argued that it
was also due to misinterpretation of the microstructures. The earlier researchers reported a
striated microstructure, which they associated with the presence of two phases. This was
resolved by Blackburn (1970), who postulated that the striations were due to hydride during
etching, and this was accepted after no striations were observed at temperatures where two
phases were expected, using a hot stage microscope (Mishurda and Perepezko, 1991).

37
Figure 2.17: Ti-Al phase diagram (After Bumps et al., 1952).
Another problem identified by Kubaschewski and Von Goldberg (1983) was the exceedingly
long period required for annealing titanium alloys below 900oC (the Tammann temperature)
(Kubaschewski and Von Goldberg, 1983). This put all the data obtained metallographically for
temperatures lower than 900oC into question.
The advent of high temperature XRD and transmission electron microscopy has led to better
understanding of the Ti-Al system, as well as the discovery of new phases. From the very first
work (Ogden, 1951; Bumps, 1952; Blackburn, 1970) there has not been much controversy
about the beta phase and, as a result, attention has mainly been on the alpha and TiAl (gamma)
phases. Lately, work using very different techniques has mainly complemented each other, and
is in agreement that there is a high temperature phase field between the β and γ phase fields.
The techniques that have been employed to date range from traditional optical microscopy,
measurement of lattice parameters by XRD, TEM, in situ HTXRD, electrical resistivity, DTA,
hardness to ductility measurements. All the methods generally agreed with the early work of
Ogden (1951) and Bumps (1952) on parts of the diagram, including the very low solubility of

38
titanium in aluminium, but more importantly they have managed to refine the diagrams by
incorporating new phases and establishing the currently accepted phase boundaries.
Further refinements in the compositional range 0 to 30 wt% aluminium were made by Shull et
al. (1985), where they discovered a congruent point for the α to α2 reaction, which was later
confirmed by Sircar et al. (1986). The diagram by Shull et al. (1985) for the low temperature
Ti-rich end, shown in Figure 2.18, is the currently accepted version.
Figure 2.18: Currently accepted low temperature Ti-rich end of the Ti-Al system (after Shull et
al., 1985).
In the 1970s and early 1980s, some attention shifted to calculating the phase diagram, but many
extrapolations still relied on the earlier results of Duwez, Ogden and Bumps (Murray, 1988).
The first calculated Ti-Al phase diagram was presented by Kaufman (1978), based on the
available thermochemical data. The phase diagram showed a eutectic at 1525oC and peritectoid
at 1150oC, shown in Equations 2.13 and 2.14 (Kaufman, 1978).
𝐋 ↔ (𝛃𝐓𝐢) + 𝐓𝐢𝐀𝐥 Equation 2.14
𝛂𝟐 + (𝛃𝐓𝐢) ↔ (𝛂𝐓𝐢) Equation 2.15
The Ti3Al and TiAl phases, also known as α2 and γ respectively, had been first identified by
Sagel (1956), and confirmed experimentally by Ence and Margolin (1961). The α2 is an
ordered DO19 structure with the composition Ti3Al, while the γ phase is an L10 fcc structure
with homogeneity ranging from 32.4 to 54.5 wt% Al. The α2/(α2 + γ) and the (α2 + γ)/γ phase

39
boundaries were first reported from the magnetic susceptibility measurements by Collings
(1979). Murray (1988) assessed the experimental data available in the early 1980s, and
presented the Ti-Al phase diagram which became the most widely accepted throughout the
1990s. The phase diagram is shown in Figure 2.19, and it showed a peritectic at 1500oC, a
peritectoid at 1285oC and a eutectoid at 1125oC, as shown in Equations 2.16, 2.17 and 2.18
respectively. The diagram differed from that of Kaufman (1979), particularly on the presence
of the eutectic reaction.
𝐋 + (𝛃𝐓𝐢) ↔ 𝐓𝐢𝐀𝐥 Equation 2.16
(𝛃𝐓𝐢) + 𝐓𝐢𝐀𝐥 ↔ (𝛂𝐓𝐢) Equation 2.17
(𝛂𝐓𝐢) ↔ 𝐓𝐢𝟑𝐀𝐥 + 𝐓𝐢𝐀𝐥 Equation 2.18
The phase diagram had to be revised after studies by McCullough et al. (1988) and Oliver and
Kad (1991) showed that there was a stable (α + L) phase field, as well as a second peritectic
reaction, shown in Equation 2.19 (Chin and Biederman, 1992).
𝐋 + (𝛂𝐓𝐢) ↔ 𝐓𝐢𝐀𝐥 Equation 2.19
With more experimental data, Chang et al. (1991) recalculated the phase diagram, and
confirmed the presence of the second peritectic reaction in addition to that in Murray’s diagram
(Chin and Biederman, 1992). To date, both phase diagrams are used, although there is still
controversy on whether the Ti-Al system has one or two peritectic reactions. A review of the
two phase diagrams by Chin and Biederman (1992) concluded that Chang’s phase diagram
(1991) was more consistent with experimental data, and should supersede that by Murray
(1988).
Braun and Ellner (2001) reviewed the Ti-Al system in the composition range 40 to 70 wt% Al
using XRD, optical microscopy, SEM, DTA and electron probe microanalysis (EPMA), and
they produced the diagram shown in Figure 2.20. They reported the presence of a high
temperature phase TixAl1-x, which exists as a single phase at 1300oC in alloys of 47 to 50 wt%
Al, and eutectoidally decomposes at 1170oC, as shown in Equation 2.20.
𝐓𝐢𝐱𝐀𝐥𝟏−𝐱 ↔ 𝐓𝐢𝐀𝐥 + 𝐓𝐢𝐀𝐥𝟐 Equation 2.20

40
Figure 2.19: Ti-Al binary phase diagram (Murray, 1988).
They also included the phase Ti3Al5, and argued that it was a low temperature phase formed
peritectoidally from TiAl and TiAl2 at 810oC, as shown in Equation 2.21 (Braun and Ellner,
2001). The Ti3Al5 phase had been reported earlier by Loiseau and Vannuffel (1988), but does
not feature on any of the earlier phase diagrams, including that by Murray (1988). The diagram
by Braun and Ellner (2001) divided TiAl3 into high and low temperature phases (TiAl3(h) and
TiAl3(l)), a distinction not made in earlier diagrams. Both phases were reported to be body
centred tetragonal, but with different numbers of atoms per unit cell: 8 atoms per unit cell and
Pearson symbol tI8 for the high temperature phase, and for the low temperature phase: 32 atoms
per unit cell, and Pearson symbol tI32. The polymorphic phase transformation was said to occur
between 950 and 735oC, depending on the composition of the phases. Braun and Ellner (2001)
reported that the compositions of the two phases did not differ, and that no distinction could be
made using optical or scanning microscopy. They based their argument on DTA measurements.
Unlike the phase diagram by Murray (1988), the diagram by Braun and Ellner (2001) did not
show TiAl3 as a line compound
𝐓𝐢𝐀𝐥 + 𝐓𝐢𝐀𝐥𝟐 ↔ 𝐓𝐢𝟑𝐀𝐥𝟓 Equation 2.21

41
Figure 2.20: Ti-Al phase diagram for the 40-70 wt% Al composition range (Braun and Ellner,
2001).
Batalu et al. (2006) recently reviewed the two phase diagrams by Murray (1988) and Chang
(1991), and they concluded that the most controversial area was between 40 and 65 wt% Al,
and 900 to 1450oC. They performed thermodynamic and crystallographic analyses of Ti-Al
alloys, and evaluated the intermediate phases. Their calculated binary phase diagram is shown
in Figure 2.21, which has a number of differences from the diagram by Murray (1988). The
diagram was quite similar to the one proposed by Murray (1988) but some important
differences were notable.
The phase diagram by Batalu et al. (2006) had a high temperature phase field Ti5Al11, similar
to Braun and Ellner (2001), but did not make a distinction between the high and temperature
TiAl3 phases reported by Braun and Ellner (2001). Additionally, the TiAl3 intermetallic
compound was presented with a variable composition in the diagram Batalu et al. (2006),
compared to the diagram by Murray (1988).

42
Figure 2.21: Calculated Ti-Al binary phase diagram (Batalu et al., 2006).
In agreement with the observations of McCullough et al. (1988), Batalu et al. (2006) showed
an α + L field and a second peritectic. Batalu et al. (2006) concluded that their Ti-Al phase
diagram had the following characteristics:
total mutual solubility in the liquid state,
partial mutual solubility in the solid state,
three intermetallic compounds with incongruent melting, formed by peritectic
transformations (TiAl, Ti5Al11 and Ti Al3),
one intermetallic compound formed by peritectoid transformation (Ti Al2),
one transformation formed by order-disorder transformation,
Five peritectic reactions, shown in Table 2.5.

43
Table 2.5: Transformations in the Ti-Al binary system (after Batalu et al., 2006).
Reaction Type Temperature (oC) Al composition (wt%) L + (βTi) ↔ (αTi) peritectic 1503 32.40
L + (αTi) ↔ TiAl peritectic 1443 40.00
L + Ti5Al11 ↔ Ti Al3 peritectic 1395 69.75
(αTi) ↔ Ti3Al + TiAl
eutectoid 1111 27.60
TiAl+ Ti5Al11↔ Ti Al2 peritectoid 1175 54.15
Ti5Al11 ↔ Ti Al2 + Ti Al3 eutectoid 990 62.15
αTi ↔ βTi allotropic 882 0.00
L + TiAl ↔ Ti5Al11 peritectic 665 99.13
L + TiAl3 ↔ ( Al ) peritectic 665 99.53
Al ↔ L melting 660 100.00
The currently accepted Ti-Al binary phase diagram is by Witusiewiscz et al. (2007), shown in
Figure 2.22, which was developed by considering all the previous experimental data, and
modelling the Gibbs energies of all the components of the system. Like Braun and Ellner
(2001), there was a distinction between the high and low temperature TiAl3 phase, which they
named ε(h) and ε(l), respectively, (Witusiewiscz et al., 2007).
Figure 2.22: Ti-Al phase diagram (Witusiewiscz et al., 2007).
44
Additionally, the (βTi) phase field was split to include the ordered the bcc_A2 ordered beta
solid solution, βo. Similar to Murray (1988), the phase diagram had a peritectic reaction at
665oC, Equation 2.22 (Witusiewiscz et al., 2007).
𝐋 + 𝛆(𝐥) ↔ (𝛂𝐀𝐥) Equation 2.22
The phase diagram also agreed with Bumps et al. (1952), Braun and Ellner (2001) and Batalu
(2006) regarding the eutectoid reaction at 809oC, shown in Equation 2.23 (Witusiewiscz et al.,
2007).
(𝛂𝐓𝐢) ↔ 𝐓𝐢𝟑𝐀𝐥 + 𝐓𝐢𝐀𝐥 Equation 2.23
Clearly there is still need for consensus on the Ti-Al binary phase diagram, and this can only
be achieved by researchers continuing to investigate the system using different methods and
techniques until there is convergence. Since aluminium features in a great number of titanium
alloys, the lack of understanding of the Ti-Al system makes it difficult to accurately extend to
ternary and multicomponent systems.
However, there is general agreement on the chemical and mechanical properties of the known
phases of the system. For example, Cottrell (1958) and Elliot (1962) were in agreement with
respect to the general properties of titanium aluminides. They concurred that aluminides
showed high temperature stiffness retention and excellent creep resistance, which they
attributed to the strong Ti-Al chemical bonds and high activation energy for self-diffusion.
Cottrell (1958) showed that another advantage of titanium aluminides was the availability of
aluminium atoms at the surface, which ensured the formation of a protective aluminium oxide
scale in oxidizing environments at high temperature.
2.14.5 Effect of Vanadium on Titanium
Vanadium is beta-isomorphous with titanium and, as a transition metal, it stabilises the beta
phase by increasing the d-electron density (Ageev and Petrova, 1970). It has extensive solid
solubility in (βi), due to its similar crystal structure, size and valence (Hume-Rothery et al.,
1935; Chandrasekaran et al., 1972). Vanadium has been associated with titanium for over fifty
years, as a constituent of the most common titanium alloy, Ti-6Al-4V. It is added to retain (βi),
and hence to make titanium amenable to strengthening by heat treatment. The Ti-V binary
phase diagram has been studied in detail by a number of researchers for many years (Murray,
1981). Hansen et al. (1951) determined the liquidus and solidus for the system by heating and
quenching various compositions of Ti-V, followed by metallographic examination. They

45
showed that the two metals had unlimited mutual solubility at all temperatures above 882oC.
Their phase diagram showed a monotectoid reaction at 675oC, as shown in Equation 2.24
(Hansen et al., 1951).
(𝛃𝐓𝐢, 𝐕) ⇌ (𝛂𝐓𝐢) + (𝐕) Equation 2.24
The maximum solubility of vanadium in the (αTi) phase was determined to be ~2.8 wt%, with
a miscibility gap in (βTi, V) (Hansen et al., 1951), and this was corroborated by Silcock et al.
(1955) and Rhodes and Williams (1970). The monotectoid and miscibility gap were confirmed
by Murray (1981), using more advanced analytical techniques, such as electrical resistivity
measurements, differential thermal analysis, as well as thermodynamic modelling. However,
apart from improvements on the accuracy of transformation temperatures of Hansen et al.
(1951), the findings of Murray (1981) were not significantly different. The widely accepted
phase diagram is shown in Figure 2.23 (Murray, 1981).
The Ti-V binary phase diagram shows the strong effect of vanadium on the beta transus.
Vanadium suppresses the martensite start temperature (Ms), and above 4 wt%, the Ms is
suppressed to below room temperature (Hammond and Kelly, 1968). This makes it possible to
retain the (βTi) upon water-quenching, and these alloys can be significantly strengthened by
heat treatment. Donachie (2000) reported that titanium-vanadium alloys, in the solution-treated
and aged condition, had the highest specific strength of all then known alloys. Titanium-
vanadium alloys maintain high strength, good toughness and stability up to moderate
temperatures, ~400oC. This has made the alloys, for example Ti-8Al-1Mo-1V, to be used
extensively for critical applications, such as on aircraft structural and turbine engine
components (Boyer, 1994).
Figure 2.23: Ti-V binary phase diagram (Murray, 1981).

46
2.14.6 Effect of Molybdenum on Titanium
Molybdenum is a transition metal, and is quite far away from titanium on the periodic table,
and, as a result, it is a strong beta-stabiliser of titanium (Ageev and Petrova, 1970). The Ti-Mo
phase diagram has been a subject of study for many years, and there are conflicting results from
different authors (Murray, 1981). The first attempts to determine the Ti-Mo binary phase
diagram were again by Hansen et al. (1951), as well as by Duwez (1952). They agreed about
the monotectoid reaction at 675oC, shown in Equation 2.25 (Hansen et al., 1951; Duwez, 1952).
(𝛃𝐓𝐢, 𝐌𝐨) ⇌ (𝛂𝐓𝐢) + (𝐌𝐨) Equation 2.25
More recent measurements by differential thermal analysis have shown the temperature to be
higher than reported by Hansen et al. (1951) and Duwez (1952), about 695oC, as shown in
Figure 2.24 (Murray, 1981). Hoch and Viswanathan (1971) measured the activities of titanium
in Ti-Mo alloys containing between 15 and 90 wt% Mo, and agreed with the assessed binary
phase diagram in Figure 2.24. They showed that molybdenum refined the microstructure of
titanium appreciably, giving significant strengthening without compromising ductility. Of the
compositions they tested, Ti-3Mo (wt%) showed the highest elongation of 23%. They
attributed this high level of ductility to the stabilization of (βTi) (which is more ductile than
(αTi), since a cubic structure has many more slip planes than hcp). Similar work was conducted
by Rhodes and Williams (1973), where they investigated the behaviour of metastable alloys
Ti-6Al-14Mo and Ti-11.6Mo (wt%), and also found improvement in ductility with increasing
Mo content.
Figure 2.24: Ti-Mo phase diagram showing a monotectoid reaction (Murray, 1987).

47
2.14.7 Effect of Iron on Titanium
The Ti-Fe binary phase diagram in Figure 2.25 shows both eutectic and eutectoid reactions
near the Ti-rich part. Iron is an allotropic metal and undergoes two crystal structure changes
from ambient temperature up to its melting point. From room temperatures up to 912oC, pure
iron exists in a bcc structure (ferrite), while between 912 and 1394oC it exists in an fcc structure
(austenite). Above this temperature, and up to its melting point, it exists again in a bcc structure
(Bain and Griffiths, 1927; Bullens, 1938). Ferrite dissolves substantially in (βTi), but austenite
has very limited solubility. Chandrasekaran et al. (1972) showed that iron and titanium had a
negative enthalpy of mixing, and hence had the tendency to form intermetallic compounds.
Van Thyne et al. (1952), Polonis and Parr (1954) and Murakami et al. (1957), were the first to
attempt to derive the Ti-Fe binary phase diagram. Murray (1981) assessed the phase diagram,
shown in Figure 2.25, using results from more accurate analytical techniques, and agreed with
earlier researchers. The phase diagram shows a eutectic and eutectoid reactions at 1080 and
595oC respectively on the Ti-rich side, and intermetallic compounds, which is typical of
systems with a negative enthalpy of mixing (Hume-Rothery et al., 1935; Chandrasekaran et al.,
1972).
Liu et al. (2006) reported the eutectic reaction to be beneficial in sintering of titanium powders
containing iron, and showed the relative densities of sintered Ti, Ti-3 wt% Fe and Ti-5 wt% Fe
were 90, 92 and 95% respectively. They attributed the increase in density to the presence of
the eutectic, which allowed liquid phase sintering. They also showed that increasing iron
content refined the (αTi) which precipitated from (βTi) during ageing. However, iron decreased
the ductility of titanium, because of formation of the intermetallic TiFe phase in the eutectoid
reaction shown in Equation 2.26. An iron content of 2 wt% resulted in an elongation of about
2%, which decreased to about 1% at 5 wt% Fe, compared to an elongation of 23% for pure
titanium (Liu et al., 2006).
(𝛃𝐓𝐢) = (𝛂𝐓𝐢) + 𝐓𝐢𝐅𝐞 Equation 2.26
Iron is known to have the highest diffusion rate of all the metallic alloying elements in titanium,
and over twice the self-diffusion of titanium (Peart and Tomlin, 1962). Thus, iron has a marked
influence on the microstructure and sintering behaviour of titanium-iron alloys. The effect of
iron on the density of titanium after sintering is compared to the effect aluminium and
molybdenum in Figure 2.26 (after Liu et al., 2006).

48
Figure 2.25: Ti-Fe binary phase diagram (Murray, 1981).
The high diffusivity of iron in titanium also increases the machinability of titanium alloys.
Mukarami et al. (2011) tested the hot working properties the alloy KS EL-F (Ti-4.5Al-4Cr-
0.5Fe-0.15C, wt%). The KS ELF alloy had similar properties to Ti-6Al-4V at room
temperature, but superior hot working capabilities. This was attributed to a decrease in
deformation resistance due to the high diffusivity of iron in titanium (Mukarami et al., 2011).
Figure 2.26: Effect of iron, aluminium and molybdenum on the density of sintered titanium
alloys (after Liu et al., 2006).
In addition to improving the machinability of titanium, iron also improves the sinterability of
the titanium alloys (Liu et al., 2006). This has also been attributed to the high mobility of iron

49
atoms in titanium, which an order of magnitude higher than the self-diffusion in the beta phase
and five orders of magnitude higher in the alpha phase. (Savvakin et al. (2012) reported a
significant increase in the interdiffusion within powder compacts of the alloy Ti-1023, which
resulted in activated sintering and reduced porosity, due to a 1 wt% increase in iron. However,
iron causes grain coarsening in many titanium alloys, which negatively impacts on strength
(Liu et al., 2012).
Additionally, iron has been found to reduce the general corrosion resistance of titanium
(Covington and Schutz, 1981). In corrosion tests conducted by TIMET (1980), the general
corrosion resistance of titanium-iron alloys was shown to decrease almost linearly with
increasing iron content. An increase of iron from 0.012 to 0.169 wt% increased the corrosion
rate of the alloy in HCl at pH=1 from 22 to 35mm.y-1 (Covington and Schutz, 1981).
Conversely, there are also reports that iron improves the crevice corrosion resistance of
titanium, although there is no conclusive evidence (Powell and Scully, 1968; Cotton and Hines,
1970).
2.14.8 Oxygen, Carbon and Nitrogen
Oxygen, nitrogen, carbon and hydrogen are the only four interstitial elements that are known
to have substantial solubility in titanium (Ogden and Jaffee, 1955). They preferentially dissolve
in the alpha phase, with a deleterious effect on the ductility. However, they substantially
strengthen titanium and its alloys, although this effect is lost at elevated temperatures (Biswas,
1973). Oxygen and nitrogen have substantial solubility in αTi, and are the strongest alpha-
stabilisers to the extent that at high enough concentrations (8-10 wt% O), αTi nucleates directly
from the melt (Ogden and Jaffee, 1955). However, hydrogen is a beta stabiliser (Biswas, 1973).
It has been reported that the beta transus is raised by 50oC and 40oC per 0.1 wt% of N and O
respectively (Ogden and Jaffee, 1955). The strengthening and hardening effect is normally
quoted using the oxygen equivalence (Oe), calculated using Equation 2.27 (Ogden and Jaffee,
1955; Boyer, 1994).
𝐎𝐞 = %𝐎 + 𝟐(%𝐍) + 𝟎. 𝟔𝟕(%𝐂) Equation 2.27
Ogden and Jaffee (1955) reported that the hardness of titanium alloys, as measured by the
Vickers’ hardness number (HV), increased linearly with the square root of the oxygen
equivalence, as shown in Equation 2.28.

50
𝐇𝐕 = 𝟔𝟓 + 𝟑𝟏𝟎√𝐎𝐞 Equation 2.28
All interstitial elements increase the c/a ratio of the hcp structure when they fit into its
octahedral sites, as shown in Figure 2.27 (Kikuchi, 1951). The axial (c/a) ratio for pure titanium
is 1.587, which is much smaller than the ideal value for hcp structures, 1.633 (Kikuchi, 1951).
This small axial ratio has been attributed to the good ductility of αTi, a property not expected
for an ideal hcp structure (Kikuchi, 1951). Interstitials reduce the number of slip and twinning
planes for flow as the axial ratio approaches the ideal value of 1.633, causing embrittlement
and making machining difficult. A maximum allowable c/a limit of 1.595 was suggested to
allow for good machinability (Paton and Williams, 1973). The most detrimental effect of
interstitials is on toughness.
Figure 2.27: Hcp crystal structure showing the octahedral positions occupied by interstitial
elements (after Kikuchi, 1951).
The solubility of interstitials increases with temperature. Paton and Williams (1973) reported
that the solubilities of O, N, C and H in βTi were very low (less than 0.4 wt% O) at room
temperature. When αTi nucleates from βTi, it acts as strong interstitial getter, making βTi
relatively free of interstitial impurities. Ogden and Jaffee (1955) reported that interstitials
increase the rate of αTi formation from the beta phase, by nucleation and growth, and showed
that for Ti-11Mo (wt%), increasing oxygen content from 0.02 to 0.15 wt% greatly decreased
the time for initiation and completion of the βTi to αTi transformation.
2.15 The Ti-Al-V ternary system
Clearly, a review of Timetal 125 cannot be complete without mention of the various ternary
systems of titanium with the alloying elements. A detailed review of the Ti-Al-Fe system was
given by Zhumagaliev et al. (2010), while that of the Ti-Al-Mo system was given by
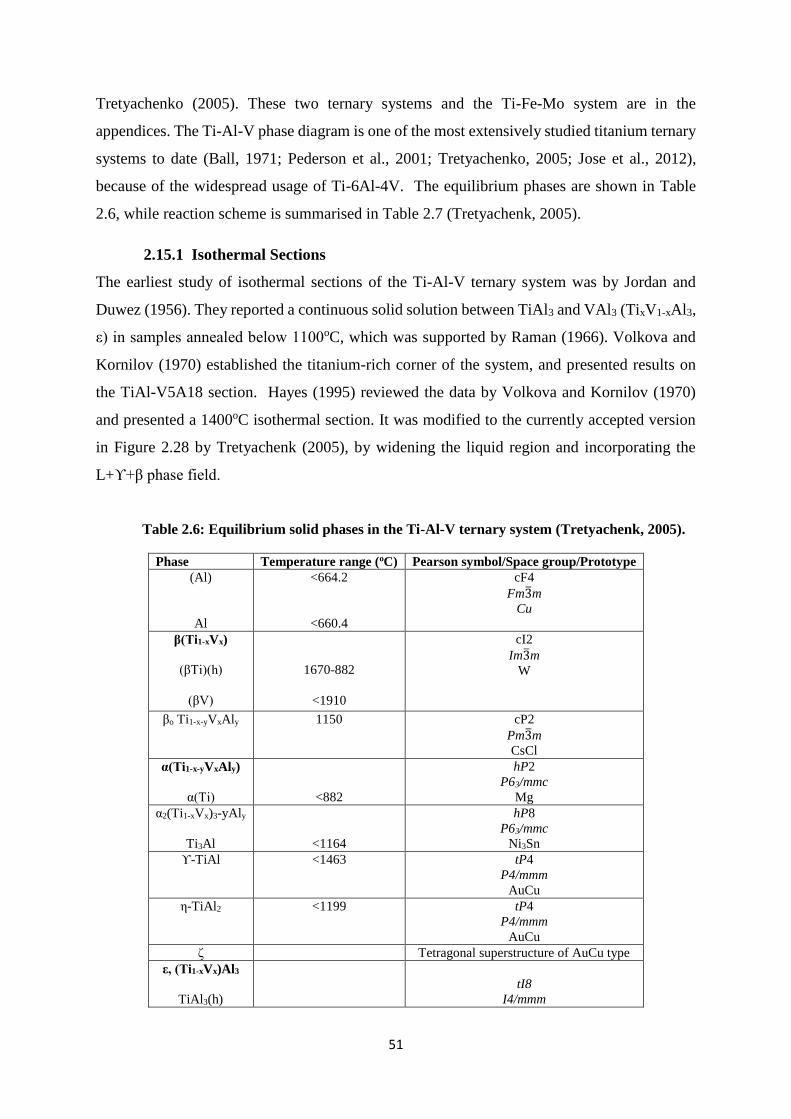
51
Tretyachenko (2005). These two ternary systems and the Ti-Fe-Mo system are in the
appendices. The Ti-Al-V phase diagram is one of the most extensively studied titanium ternary
systems to date (Ball, 1971; Pederson et al., 2001; Tretyachenko, 2005; Jose et al., 2012),
because of the widespread usage of Ti-6Al-4V. The equilibrium phases are shown in Table
2.6, while reaction scheme is summarised in Table 2.7 (Tretyachenk, 2005).
2.15.1 Isothermal Sections
The earliest study of isothermal sections of the Ti-Al-V ternary system was by Jordan and
Duwez (1956). They reported a continuous solid solution between TiAl3 and VAl3 (TixV1-xAl3,
ε) in samples annealed below 1100oC, which was supported by Raman (1966). Volkova and
Kornilov (1970) established the titanium-rich corner of the system, and presented results on
the TiAl-V5A18 section. Hayes (1995) reviewed the data by Volkova and Kornilov (1970)
and presented a 1400oC isothermal section. It was modified to the currently accepted version
in Figure 2.28 by Tretyachenk (2005), by widening the liquid region and incorporating the
L+ϒ+β phase field.
Table 2.6: Equilibrium solid phases in the Ti-Al-V ternary system (Tretyachenk, 2005).
Phase Temperature range (oC) Pearson symbol/Space group/Prototype
(Al)
Al
<664.2
<660.4
cF4
Fm3̅m
Cu
β(Ti1-xVx)
(βTi)(h)
(βV)
1670-882
<1910
cI2
Im3̅m
W
βo Ti1-x-yVxAly 1150 cP2
Pm3̅m
CsCl
α(Ti1-x-yVxAly)
α(Ti)
<882
hP2
P63/mmc
Mg
α2(Ti1-xVx)3-yAly
Ti3Al
<1164
hP8
P63/mmc
Ni3Sn
ϒ-TiAl <1463 tP4
P4/mmm
AuCu
η-TiAl2 <1199 tP4
P4/mmm
AuCu
ζ Tetragonal superstructure of AuCu type
ε, (Ti1-xVx)Al3
TiAl3(h)
tI8
I4/mmm

52
VAl3
TiAl3(l)
TiAl3(h)
tI32
I4mmm
TiAl3(l)
δ
V5Al8
V4Al23
<1408
<736
cI52
I4̅3m
Cu5Zn8
hP54
P63/mmc
V4Al23
Figure 2.28: Isothermal section of the Ti-Al-V phase diagram at 1400oC (Tretyachenk,
2005).

53
Figure 2.29: Isothermal section of the Ti-Al-V phase diagram at 1300oC (Tretyachenk,
2005).
The liquid region was widened after a critical review of DTA data by Paruchuri and Massalski
(1991). Kainuma et al. (2000) determined the α+β phase boundary at 1300oC, Figure 4.29.
Ahmed (1994) presented the first isothermal section at 1200oC, which was modified by Hayes
(1995) to include the CsCl (B2) type βo (Ti1-x-yVxAly) solid solutions, and two different
(Ti,V)Al3 phases which were termed ε1 and ε2. Tretyachenk (2005) rejected the existence of
these two phases at this temperature, and argued there was one phase, ε, with a D022 crystal
structure.

54
Figure 2.30: Isothermal section of the Ti-Al-V phase diagram at 1200oC (Kainuma et al.,
2000).
Figure 2.30 by Kainuma at al. (2000) is the currently accepted isothermal section at 1200oC.
There is no agreement with the isothermal section at 1100oC (Hashimoto et al., 1986), and the
isothermal section in Figure 2.32 is only tentative (Tretyachenk, 2005). Jordan and Duwez
(1956) studied the ternary system at 1000oC by metallography, while Tsujimoto (1969) studied
the titanium-rich corner at the same temperature. Eremenko (1962) reviewed the section, and
Hayes (1993) proposed the assessed isothermal section, Figure 2.33. The presence of the
continuous solid solutions between TiAl3 and VAl3 was in agreement with Jordan and Duwez
(1956), Hashimoto et al. (1986) and Umakoshi et al. (1988). The α2+ϒ/ϒ phase boundary on
the isothermal section assessed by Tretyachenk (2005) agrees well with Hashimoto et al.
(1988). In the ternary phase diagram by Tretyachenk (2005), the DTA data Paruchuri and
Massalski (1991) and electron probe microanalysis (EMPA) by Ahmed and Flower (1992), as
well as calculated data by Shao et al. (1995), were used for the proposed isothermal section at
900oC, Figure 2.34. The reaction scheme for the Ti-Al-V ternary system is summarised in
Figure 2.31 (Tretyachenk, 2005).

55
Figure 2.31: Reaction scheme for the Ti-Al-V ternary system (Tretyachenk, 2005).
Figure 2.32: Isothermal section of the Ti-Al-V phase diagram at 1100oC (Tretyachenk,
2005).

56
Figure 2.33: Isothermal section of the Ti-Al-V phase diagram at 1000oC (Hashimoto et
al., 1986).
Figure 2.34: Isothermal section of the Ti-Al-V phase diagram at 900oC (Tretyachenk,
2005).
2.15.2 Invariant Equilibria
The invariant equilibria for the Ti-Al-V ternary system are summarized in Table 2.7
(Tretyachenk, 2005). There is agreement on the invariant equilibrium L + (αTi, V) ↔
(βTi, V) + ϒ, although its temperature has only been estimated (Ahmed and Flowers, 1994;

57
Hayes, 1995). Ahmed and Flowers (1994) and Kainuma et al. (2000) reported that the α+β+ϒ
phase field was observed at 1200°C and 1300°C. Volkova and Kornilov (1970) calculated the
L+β↔δ+ϒ reaction at 1400oC, from the L+β+ϒ and L+ϒ+δ equilibria, and this was also
observed and accepted by Hayes (1995).
Table 2.7: Invariant reactions in the Ti-Al-V system (Tretyachenk, 2005).
Reaction Reported temperatures (oC)
L + α = β + ϒ 1460-1400
L + β = ϒ + δ 1400-1390
L + ζ = ϒ + ε 1395-1360
L + ϒ = δ + ε 1360-1300
L + ϒ = β + ε 1355-1300
L + β = δ + ε 1320-1215
ϒ + ζ = η + ε 1175-990
α=α2+β+ϒ 1118-1100
ϒ + δ =ε + β 1100-1000
Additionally, Ahmed and Flowers (1994) reported the coexistence of the β and δ phases in as-
cast alloys. Hayes (1995) proposed the invariant reaction L+ϒ↔δ+ε from analysis of his earlier
work (Hayes, 1993), and this was supported by Ahmed and Flower (1994), who observed the
same reaction in their experimental work. The β+ϒ+δ and ϒ+δ+ε phase fields were reported
to exist down to 1200oC. Below this temperature, β+ϒ+δ changed to β+ε+ϒ, while ϒ+δ+ε
transformed to β+ε+δ (Ahmed and Flower, 1994). Shao et al. (1995) showed the same
equilibria in their calculated phase diagram. A study of alloys annealed below 1100oC by
Jordan and Duwez (1956) and Raman (1966) showed a continuous solid solution between TiAl3
and VAl3 phases (D022), and this was also found by Frazer and Cook (1989) by XRD, and
through DTA by Paruchuri and Massalski (1991). Both aluminides are formed through the
peritectic reactions L+ζ↔ε in the Al-Ti system (Paruchuri and Massalski, 1991) and L+δ↔ε in
the Al-V binary system (Murray, 1989; Tretyachenk, 2005).
2.15.3 Liquidus and Solidus Surfaces
The liquidus surface projection of the system was first reported by Paruchuri and Massalski
(1991) from DTA experiments. Hayes (1995) assessed it, while Shao et al. (1995) presented a
calculated one. Ahmed and Flower (1994) presented similar results, using microstructures of

58
the as-cast alloys. Wang (2012) calculated the liquidus projection, Figure 2.35, which agreed
with Shao et al. (1995). The currently accepted scheme in Figure 2.31 is again by Tretyachenk
(2005), which has six invariant reactions involving liquid.
Figure 2.35: Calculated liquidus projection of the Ti-Al-V system (Wang, 2012).
2.16 Properties of Titanium Alloys for Aerospace Applications
Boyer (1994) reviewed the applications of titanium alloys in the aerospace industry, and argued
that although weight savings are crucial, titanium alloys are gaining acceptance because of their
advantageous costs and relative ease of processing. The most widely used titanium alloy, Ti-
6Al-4V, is gradually being replaced by newer titanium alloys, mainly because it is difficult,
and hence expensive, to process. Attention has shifted to (βTi) alloys because of their good
processing capabilities in the solution-treated state, where the alloy is purely beta. Moskalenko
et al. (1973) attributed the improved processing capabilities to more slip planes in the beta
phase than in the alpha.
The first titanium alloy used in an aircraft was Ti-13V-11Cr-3Al (wt%) in the SR-71 Blackbird,
and the alloy was the primary material for all the major components. However, the use of this
alloy has decreased because it is difficult to melt and fabricate. It is still used, but is now limited
to springs because of its lower modulus and density than steel, which enables weight savings

59
of up to 70% (Boyer, 1994). Although Ti-6Al-4V is easier to work than Ti-13V-11Cr-3Al, its
processing is still costly compared to (βTi) alloys. (βTi) alloys can be easily drawn into sheet,
and this makes them well suited where sheet is the product form. Ti-15V-3Cr-3Al-3Sn is an
example of a (βTi) alloy that has replaced Ti-6Al-4V on major structural and non-structural
sheet components. Apart from the ease of forming, (βTi) alloys have much higher tensile and
fatigue strengths than Ti-6Al-4V in the aged condition (Weiss et al., 1984). Boyer (1994)
argued that high strength (βTi) alloys for aerospace applications had to have a minimum
guaranteed strength of 1000MPa with minimum elongations of about 6%. Such a (βTi) alloy
in modern aircraft is Ti-10V-2Fe-3Al, which was used on the cargo doors of the McDonnell
Douglas. Boyer (1994) predicted that the Boeing 777 would be the biggest user of this alloy,
where plans are to make the entire landing gear out of it.
2.17 High Strength Fasteners on Aircraft Structures
Over 2.4 million fasteners are used on the Boeing 777, and they have various forms and shapes,
depending on their applications (Swanson et al., 1990). They can be simple bolts and nuts,
studs, screws, rivets, amongst many other forms. Generally, high tension fasteners for aircraft
assemblies need to have high shear and tensile strength, good fatigue and corrosion resistance.
In particular, the fasteners should not form galvanic cells with the aerostructures they fasten.
Steel fasteners have this as their main limitation, and they normally have to be coated with
cadmium, to protect the aircraft metal structures from corrosion, which significantly adds to
their cost (Swanson et al., 1990). Cadmium is highly toxic and its use is limited to low
temperature components and parts which do not experience direct contact with people.
Titanium fasteners are far superior in terms of corrosion resistance, and they normally do not
require any form of coating. Furthermore, some titanium alloys have high temperature stability,
which is a requirement for fasteners on engine support structures, where temperatures are
moderate to high (400-750oC) (Zeng et al., 2006). Most titanium fasteners are made of Ti-6Al-
4V and Ti-5Al-5Mo-5V-3Cr, although effort is being made to replace these with newer (βTi)
alloys on some structures (Boyer, 1994). Another advantage of titanium alloys is that their
coefficient of thermal expansion is close to that carbon fibre reinforced plastics (CFRP). For
this reason, titanium-alloy fasteners are used on CFRP components, e.g. in the fuselage of the
Boeing 787 (Mukarami et al., 2011).

60
Since many of the fastened assemblies have a tendency to slide, shear strength is probably the
most critical requirement for any high-tension fastener. The Airbus Specification EN6116
standard stipulates the requirements for high strength fasteners for aircraft structures as a shear
strength of 744MPa (108ksi), and a minimum strain of 6% (Zeng et al., 2006). The minimum
tensile strength is set at 1250MPa (180ksi). Haylock (2007) reported that Alcoa Fastening
Systems (Alcoa Inc.), USA, recently successfully developed high strength fasteners using the
alloy Timetal 555 (Ti-5Al-5M0-5V-3Cr-0.5Fe, wt%). The fasteners had a tensile strength of
1309±10MPa and shear strength of 779±15MPa in the solution treated and aged (STA)
condition, and the minimum elongation was 10%. Timetal 555 fasteners exceeded the
1250MPa tensile strength and 744MPa shear strength requirement for cadmium-coated steel
fasteners (Haylock, 2007).
Zeng et al. (2006) reported that the most used fastener is A286 (steel of composition 14 Cr, 2
Mn, 1.5 Mo, 0.08 C, wt%) because it has a minimum guaranteed shear strength of 850MPa,
and an elongation of 12%. For engine components, where temperature is high (~800-1000oC),
nickel- and cobalt-based alloys, such as Inconel 718, usually give the best strengths. The
increased usage of titanium as fasteners will depend on whether titanium can meet the
properties of these superalloy steels, particularly for high temperature assemblies (Boyer,
1994).
2.18 Timetal 125
Timetal 125 is a metastable βTi alloy, with the nominal composition in Table 2.8 (Leyens and
Peters, 2003). It was introduced as a commercial alloy in 1990 by the American company,
Titanium Metals Corporation (TIMET), for use as a high strength fastener on aerostructures
(Leyens and Peters, 2003).
The alloy has a molybdenum equivalence of 24, and it can be water-quenched to retain only
βTi at room temperature. However, it will partially transform to αTi over time, even at room
temperature (Leyens and Peters, 2003). Momeni et al. (2015) studied the yield point of Timetal
125 using compression tests at high temperature, and concluded that its yield point decreased
with decreasing temperature and increasing strain rate. From their work, it can be concluded
that Timetal 125 can maintain the properties required for its use as a high a strength
aerostructure fastener up to at least 300oC.

61
Table 2.8: Nominal Composition of Timetal 125 (Leyens and Peters, 2003).
Element Composition (wt%)
Titanium 79.600
Aluminium 2.680
Iron 5.700
Molybdenum 6.000
Vanadium 6.000
Oxygen 0.110
Nitrogen 0.015
An alloy with a composition probably closest to that of Timetal 125 is Ti-10V-2Fe-3Al. The
alloy was first commercially used in the 1990s in the Boeing 777 as a replacement of HSLA
steel and Ti-6Al-4V, due to weight and cost savings requirements. The alloy was used
extensively because of its excellent corrosion resistance and economic spin-offs, due to reduced
downtime (Lütjering and Williams, 2007). The alloy is readily forgeable, particularly in the
solution treated (ST) condition. When solutionized and aged, the alloy exhibits an excellent
combination of strength with a minimum guaranteed strength of up to 1195MPa, good ductility,
and high cycle fatigue strength and fracture toughness, resulting in its use in critical aerospace
components such as the landing gear (Boyer, 1994). Unlike Timetal 125, this alloy does not
contain molybdenum, and so its properties may be very different. However, understanding the
properties of Ti-10V-2Fe-3Al may be a good starting point in attempting to understand those
of Timetal 125. However, there is general agreement that a major role of molybdenum in
titanium alloys is to offer extra corrosion resistance and exceptional stability at elevated
temperatures (Chernova, 1961).
Ti-10V-2Fe-3Al (wt%) is a near-beta titanium alloy, commercially known as Ti-10-2-3. It has
a combination of tensile strength and toughness that is superior to any other commercially
known titanium alloy (Srinivasu and Rao, 2012). Its main application is in civilian and military
aircraft, mainly on the landing gear. When solution treated, it can be water-quenched to retain
the βTi phase at room temperature. However, it is unstable and does not exhibit its optimal
mechanical properties in the solution treated condition, and needs artificial ageing. It is more
difficult to machine than Ti-6Al-4V, but easier than all other βTi alloys (Srinivasu and Rao,
2012). Ti-5Al-5Mo-5V-3Cr (wt%), commercially known as Ti-5-5-5-3, is another near-beta
titanium alloy, that may have chemical and mechanical properties similar to Timetal 125, due

62
to its similar composition. It is much cheaper than Ti-10-2-3 and was originally used on less
critical aircraft components like the ducting to the de-icing system (Liberini et al., 2016).
However, in the newer aircraft, particularly the Boeing 787, it has been used on the landing
gear due to its high strength. The ultimate tensile strength of T-5-5-5-3 is about 4% higher than
that of Ti-10-2-3 and 27% higher than Ti-6Al-4V (Liberini et al., 2016). Additionally, it has
one of the best fatigue resistances of all titanium alloys (Liberini et al., 2016). However, its
elongation is about 14% lower than of Ti-6Al-4V and it is not as tough. The higher vanadium
and molybdenum content in Timetal 125 may mean it has a higher strength than Ti-5-5-5-3,
while the presence of iron in Timetal 125 may result in better sintering properties, since iron is
the fastest diffusing non-interstitial alloying element in titanium. Like all other near beta
titanium alloys, Ti-5-5-5-3 can be solution treated and subsequently strengthened by artificial
ageing (Liberini et al., 2016).

63
3.Chapter 3 EXPERIMENTAL PROCEDURE
3.1 Overview of the experimental work
Commercial titanium, aluminium, iron, molybdenum and vanadium powders were blended and
consolidated by centrifugal casting and spark plasma sintering. The target alloy composition
was Ti-2.7Al-5.7Fe-6-Mo-6V (wt%), although 50-50 (wt%) binary alloys of all the
permutations of these elements were also tried. The castings and sintered alloys were heat
treated, and had their microstructures and mechanical properties determined. The primary aim
of the work was to investigate the reactions during the casting and sintering of the powders,
and to determine the heat treatment response of the alloys. A high level flow sheet of the
experimental work is shown in Figure 3.1.
Figure 3.1: High level flow sheet for the experimental design.
The source powders were provided by Alfa Aeser, South Africa, and were all commercial grade
materials. They were characterised in the as-received condition to ascertain their compositions,
and then blended for casting and spark plasma sintering. Some of the castings and sintered
parts were analysed immediately, while the rest were heat treated first.
64
3.1.1 Determination of Compositions of the Powders
The source powders were analysed by X-ray fluorescence (XRF) to confirm the compositions
claimed by the supplier. Various mixtures of the powders were also analysed by the same
technique. The XRF method involved fusing the samples into beads using a Katanax fusion
fluxer. A flux, with a composition 99.5 wt% lithium tetraborate (LiB4O7) and 0.5 wt% lithium
boride (LiB), lowered the melting temperatures of the samples, and ensured that the samples
did not adhere to the crucibles. An oxidant comprising Na2CO3, LiNO3, NaNO3 and
NaBO3.4H2O was added to oxidise the fusion mixture. The fused beads were then analysed
using an S8 Bruker XRF instrument, which had an energy dispersive spectrometer (EDX).
3.1.2 Blending of Powders
The elemental powders were mixed in various proportions to obtain the compositions of the
targeted alloys. The elemental powders were individually weighed on a Calerite PS750/C1
balance, which had a sensitivity of 0.0001g. The powders were mixed and shaken on a
planetary mixer to achieve homogeneity. A 100g mass basis was used to make the calculations
simple.
3.1.3 Determination of Particle Size Distributions
Particle size distributions of the elemental and blended powders were determined using a laser
diffraction Malvern Master 3000 (MM3000) particle size analyzer. Powders were suspended
in water in a 200ml beaker, and stirred to form a suspension. A laser beam was passed through
the suspension, and was scattered to various degrees depending on the sizes of the particles.
The angular variations of the scattered beam were intrinsically measured using a focal plane
detector. The instrument could resolve very small diffraction angles, and had a measurement
range of 0.1µm to 3.5mm. All the measurements were done in triplicate to ensure
reproducibility.
3.1.4 Determination of Oxygen, Nitrogen and Hydrogen
The elemental and blended powders were analysed for oxygen, nitrogen and hydrogen using a
TCH600 series LECO analyzer. The instrument utilized the inert gas fusion technique for the
determination of the oxygen content of the samples. A graphite crucible was used to contain
the sample in the furnace section of the instrument. A constant stream of helium was passed
over the crucible to provide an inert atmosphere. The furnace was inductively heated to 3000oC
in order to fuse the sample, and to reduce the oxygen by reacting the sample with the graphite
crucible. An oxygen scrubber was fitted to the helium line to remove oxygen from the

65
protective gas, but it was not possible to remove oxygen intercalated to the graphite crucibles.
Since it was not possible to remove the oxygen in the graphite crucibles, all measurements
were done in triplicate.
The TCH 600 simultaneously analysed the samples for nitrogen and hydrogen. Unlike oxygen,
which was extracted as either CO or CO2, nitrogen and hydrogen were extracted in their pure
forms. Thermal conductivity detectors quantitatively analysed the nitrogen and hydrogen
contents using the specific heats of the gases. The detectors were not selective, and so the
nitrogen and hydrogen had to be separated before analysis. The CO and CO2 were analysed
first using a separate infrared detection system, before they were removed from the carrier gas
stream by adsorption in a decarburiser. The exit stream from the decarburiser contained N2, H2
and moisture. The moisture was removed from the gas stream by adsorption in a dehydrator.
The nitrogen and hydrogen gases were then split into two streams in a separation column, and
each gas stream was directed to a thermal conductivity detector. The hydrogen and nitrogen
analyses were also done in triplicate.
3.1.5 Determination of Phase Compositions
The source and blended powders were analyzed for their phases using a Bruker D8 Advance
Eco Powder X-ray Diffraction (PXRD) machine with an SSD 160 detector. The same
instrument was used to analyse the as-cast, sintered and heat treated samples. Diffrac plus Eva
software was used for pattern recognition and phase identification. A 1kW power source
generated X-rays on a copper anode, which were accelerated by a voltage of 40kV through the
sample. The goniometer was rotated from 0 to 90o with a step size of 0.02 2theta degrees, and
the JCPSD database was used for phase identification.
3.1.6 Thermal Analyses of Powders
Thermal analyses of the powders were done using a Setaram Sestys Evo 2000 differential
thermal analyser (DTA), with Setaram Calisto software. The maximum temperature that could
be attained was 1950oC, the heating rate ranged from 0.1oC.min-1 to 150oC.min-1, while the
maximum cooling rate was 100oC.min-1. The TGA-DTA was the bottom-loading and power
compensation type. It had a laser-controlled microbalance, which measured mass changes as a
function of temperature. A rod was attached to the microbalance at its top, and had positions
for two crucibles at the bottom. A thermocouple running through the rod was placed under each
of the crucibles. One of the crucibles was kept blank (reference crucible), while the other
contained the test sample (working crucible). The crucibles had the same dimensions (100µl)
66
and were both made out of alumina. Calibration tests were regularly conducted by running the
two crucibles empty (blank runs). In actual tests, the temperature difference between the
working and reference crucibles was intrinsically measured, and the power compensation
required to equilibrate the crucibles’ temperatures was converted to a heat flow signal. The
heat flow appeared as peaks, and the peak direction depended on whether heat was gained by
or lost from the test sample. Downward facing peaks represented endothermic reactions. With
proper calibration, the area under the heat flow peaks measured the enthalpy of the reaction.
All the DTA tests were conducted using a heating rate of 5oC.min-1, and where the tests
included cooling, the cooling rate was either 3oC.min-1 or 5oC.min-1.
3.2 Compaction of Powder Blends
Since both techniques required the starting materials to be conductive, to maximise electrical
conductivity, the powders were compacted using a Manfredi bench top hydraulic press. The
mixtures, weighing 40±2 g, were put into a steel die which had a lower and upper punch. The
die-punch assembly was placed onto the bench top hydraulic press, and compacted to a pressure
of 30MPa. After releasing pressure, the lower punch was removed and the upper punch was
pressed using the bench press to extrude the green compact. The cylindrical green compacts
were weighed on a Calerite PS750/C1 balance, and their thickness and height were measured
using a vernier calliper. The green compacts had a height of 45mm and a diameter of 23mm.
The measured dimensions were used to calculate the densities of the green compacts.
3.3 Centrifugal Casting of Samples
The green compacts were consolidated by casting in a Manfredi centrifugal induction casting
machine, shown in Figure 3.2. The induction was by a water-cooled copper coil, in the slow
heating mode. Instrument grade argon (supplied by Afrox South Africa) was used as the
protective gas, and oxygen and moisture traps were installed on the argon feed line to minimise
contamination. Yttria-lined crucibles were used for melting to ensure minimal contamination
of the castings. At the beginning of the casting cycle, the furnace was evacuated to -90KPa
using an attached Manfredi vacuum pump, and backfilled with argon to atmospheric pressure.
This evacuation and backfilling cycle was automatically done five times before the machine
was finally pressurised with argon for the melting operation. There was no direct control of the
casting temperature, so melting depended on visual observation using a peep glass on the
casting machine. The induction heating was allowed to continue until the compact collapsed.

67
Figure 3.2: Manfredi Centrifugal induction casting machine.
The compacts were placed vertically in the crucibles to make their collapse easily detectable.
After collapsing, heating was allowed to continue to ensure complete melting before
centrifuging the melt into a copper die. The copper die had a tensile dog bone profile, shown
to produce castings for tensile testing, shown in Figure 3.3. After the casting was completed,
all the samples were allowed to cool for 10 minutes under forced argon to avoid oxidation.
Excluding the samples that were cast in the initial trials while trying to optimise the casting
operation, a total of 139 samples were cast for this work.
Figure 3.3: Cast tensile test specimen (round bar) showing where mounting specimens were
sectioned (dimensions given in mm).
3.4 Spark Plasma Sintering (SPS)
Blended powders with the Timetal 125 composition were sintered using an FCT-HP D5 spark
plasma sintering machine. A graphite die was used, but was lined with a titanium foil to avoid
Water-cooled copper induction coil

68
contamination. The sintered samples were cylindrical discs, with a diameter of 35±1 mm and a
thickness of 5±1 mm. A total of 78 samples were sintered according to the temperature profiles
and times given in Table 3.1.
Table 3.1: Test work matrix for spark plasma sintering of blended powders.
Temperature
(oC)
Pressure
(MPa)
Heating rate
(oC.min-1)
Holding time
(minutes)
Cooling rate
(oC.min-1)
700 30 100 5, 10, 15, 20 100
800 30 100 5, 10, 15, 20 100
900 30 100 5, 10, 15, 20 100
1000 30 100 5, 10, 15, 20 100
1050 30 100 5, 10, 15, 20 100
1100 30 100 5, 10, 15, 20 100
1200 30 100 5, 10, 15, 20 100
3.5 Analyses of Cast and Sintered Samples
Samples were characterized immediately after casting and sintering to determine their
microstructures, mechanical properties, and their oxygen contents. The rest of the castings and
sintered samples were heat treated and then characterised. The techniques that were employed
to characterise the as-cast and as-sintered samples are described in detail below.
3.5.1 Density Measurements
Densities of castings and sintered samples were measured before and after heat treatment using
the Archimedes water immersion method, with a set-up shown in Figure 3.4. The samples were
first weighed in air using a sensitive (0.0001g) Calerite PS750/C1 balance to obtain their dry
weights (Md), and then weighed immersed in water to give the wet weight (Mw). The densities
were calculated using Equation 3.1.
𝛒 =𝐌𝐝
𝐌𝐝−𝐌𝐰. 𝛒𝐰𝐚𝐭𝐞𝐫 Equation 3.1
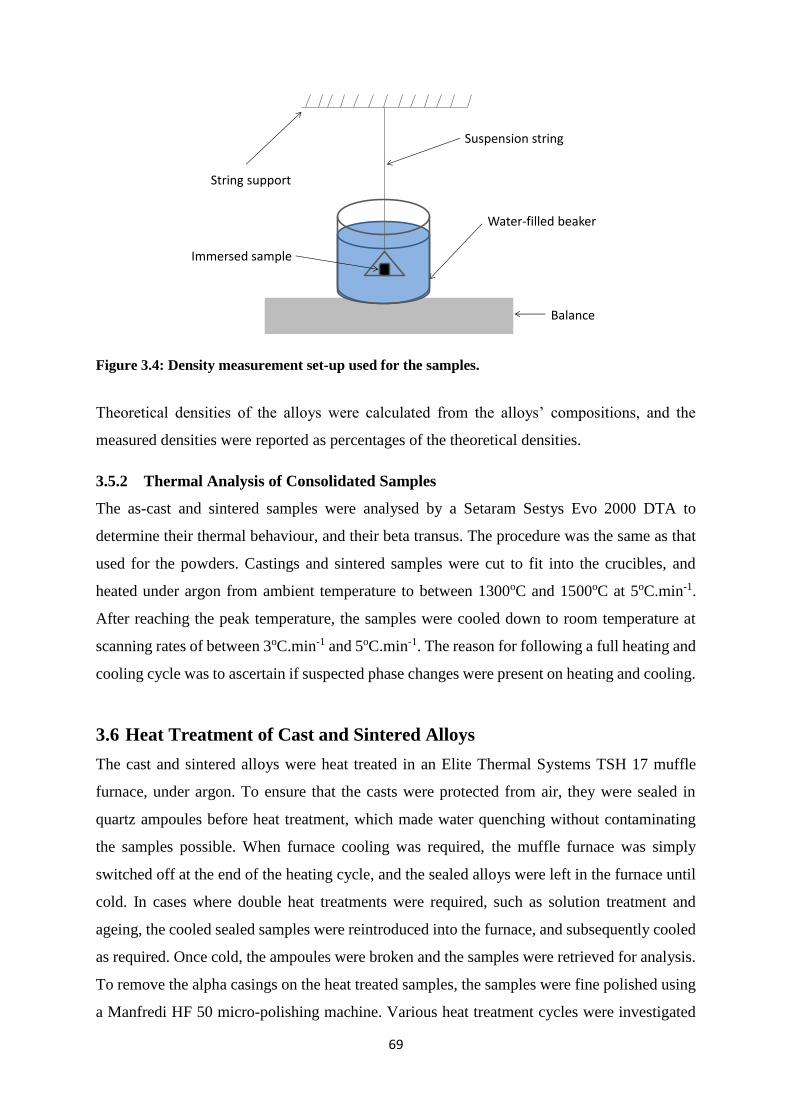
69
Figure 3.4: Density measurement set-up used for the samples.
Theoretical densities of the alloys were calculated from the alloys’ compositions, and the
measured densities were reported as percentages of the theoretical densities.
3.5.2 Thermal Analysis of Consolidated Samples
The as-cast and sintered samples were analysed by a Setaram Sestys Evo 2000 DTA to
determine their thermal behaviour, and their beta transus. The procedure was the same as that
used for the powders. Castings and sintered samples were cut to fit into the crucibles, and
heated under argon from ambient temperature to between 1300oC and 1500oC at 5oC.min-1.
After reaching the peak temperature, the samples were cooled down to room temperature at
scanning rates of between 3oC.min-1 and 5oC.min-1. The reason for following a full heating and
cooling cycle was to ascertain if suspected phase changes were present on heating and cooling.
3.6 Heat Treatment of Cast and Sintered Alloys
The cast and sintered alloys were heat treated in an Elite Thermal Systems TSH 17 muffle
furnace, under argon. To ensure that the casts were protected from air, they were sealed in
quartz ampoules before heat treatment, which made water quenching without contaminating
the samples possible. When furnace cooling was required, the muffle furnace was simply
switched off at the end of the heating cycle, and the sealed alloys were left in the furnace until
cold. In cases where double heat treatments were required, such as solution treatment and
ageing, the cooled sealed samples were reintroduced into the furnace, and subsequently cooled
as required. Once cold, the ampoules were broken and the samples were retrieved for analysis.
To remove the alpha casings on the heat treated samples, the samples were fine polished using
a Manfredi HF 50 micro-polishing machine. Various heat treatment cycles were investigated
Suspension string
String support
Water-filled beaker
Immersed sample
Balance

70
as shown in Table 3.2. The same samples were used for the different heat treatment conditions,
with five to three samples were heat treated under the same conditions in order to obtain
representative results.
Table 3.2: Test work matrix for heat treatment of cast samples.
Solution
Treatment
Temperature (oC)
Ageing
Temperature
(oC)
Time
(minutes)
Cooling mode
900 Not aged 10, 20, 30, 60, 120 Furnace cooling
900 Not aged 10, 20, 30, 60, 120 Water quenching
900 300 10, 20, 30, 60, 120 Water quenching
900 400 10, 20, 30, 60, 120 Water quenching
900 500 10, 20, 30, 60, 120 Water quenching
900 600 10, 20, 30, 60, 120 Water quenching
900 700 10, 20, 30, 60, 120 Water quenching
3.6.1 Annealing tests
The heat treatment experiments were in two sets. The first set involved the heating of the as-
cast alloy from 300oC to 900oC, in increments of 100oC, and holding at each of these
temperatures for between 5 minutes and 2 hours. These tests were referred to as annealing tests,
as they softened the alloy. Annealing at 900oC was also termed solution annealing. Samples
quenched with water from 900oC were deemed to be solution-treated.
3.6.2 Solution treatment and ageing
Heat treatment of the cast samples that had been solution-treated made up the second set of the
heat treatment tests. These tests were the ageing experiments in this work. The test work for
this set of experiments is shown in Table 3.2.
3.7 Characterization of Heat Treated Samples
The microstructures, tensile properties, hardness and densities of the heat treated samples were
determined using the relevant techniques. Sintered samples were not subjected to tensile testing
because their shape could not allow this.

71
3.7.1 Metallographical Preparation and Optical Microscopy
The as-cast, sintered, as well as heat treated samples were sectioned by a LECO MSX 205A
machine, with a 20S30 silicon carbide cutting blade. To avoid burning during cutting, generous
amounts of water-based coolant were used, together with a fast wheel speed (3500 rpm) and
slow feed rate (0.5 mm.s-1). The appropriately cut samples were mounted and
metallographically prepared for optical microscopy examination. Cast samples required
sectioning of thin discs from their heads, as shown in Figure 3.3.
The sectioned pieces were hot mounted using Polyfast phenolic resin on a Struers hot mounting
machine, while sintered samples were mounted without prior sectioning. The samples were
ground on silicon carbide paper, and finally polished to a mirror finish using a Struers
TegraForce-5 automatic polishing machine. The grinding and polishing of the samples were
problematic because the samples scratched very easily. The roughest grit was 200, and the grit
was increased in increments of 200 until 1200. The grinding and polishing were automatic,
with the force per sample maintained at 25N and a running time of 5 minutes per stage. For
both grinding and polishing, the wheel speed was maintained at 150 rpm, counter clockwise to
the movement of the sample. For polishing, a 1µm diamond suspension and colloidal silica
(OP-S) on an MD-Chem paper were used, with the same force and wheel speed.
After polishing, the samples were dried using compressed air, and chemically etched using
Kroll’s reagent (3ml HF, 6ml HNO3 and 100ml deionized water). The cast and sintered samples
were immersed into the etchant for 30 seconds, and immediately washed with deionised water
to avoid over-etching. The washed samples were dried using compressed air and stored in a
desiccator. Microstructures of the all the samples were analysed using an Olympus BIOX
B51M optical microscope, with a resolution of 20µm. The microscope was connected to an
Olympus Motion Stream image analyser, supported by MATLAB software, which was used to
determine grain size by the intercept method.
3.7.2 Determination of Morphology and Composition of Heat Treated Cast
Samples by SEM and EDX
The heat treated samples were analysed using a JEOL JSM 5400 Scanning Electron
Microscope (SEM), which was coupled to a JSM Energy Dispersive X-ray Spectrum Analyzer
(EDX). Data acquisition was through an integrated Vantage data acquisition instrument. The
incident electrons were accelerated at a voltage of 20 kV, and analysis of the samples was done
in either the back scattered electron (BSE) or the secondary electron (SE) mode. Image

72
magnification ranged from 5X to 15000X, and to authenticate the EDX analysis, a certified
99.99 wt% titanium reference was used to calibrate the instrument.
3.7.3 Hardness Measurements
Hardness measurements for both as-cast, sintered and heat treated cast samples were done
using a Future-Tech FM-700 Vickers hardness testing instrument, with a 300g force. After
unloading, the diagonals of the indentation were automatically measured and converted to a
Vickers hardness number, which was related to the indentation depth (d) (average length of the
diagonals of the indentation) and load (F) according to Equation 3.2. Each sample was
randomly indented on 10 different areas to give an average.
𝐇𝐕 =𝟏𝟖.𝟐𝐅
𝐝𝟐 Equation 3.2
3.7.4 Tensile Testing of Cast Samples
Tensile tests of the castings, in the as-cast condition and after heat treatment, were done using
an MTS Criterion Universal electromechanical uniaxial tensile testing machine. All the
castings were cast and no machining was necessary. The only additional operation on the
samples was grinding off the alpha casing using a Manfredi HF 50 micro-polishing machine.
The tensile specimens conformed to the ASTM-E8 standard, with dimensions, in mm, shown
in Figure 3.3. The tensile specimens were held using collar grips, and tensioned to failure. The
initial separation of the grips (Lo) and the diameter of the gauge were measured using a vernier
calliper, and the diameter of the gauge was used to calculate the cross-sectional area of the
specimens (Ao). Load cells on the instrument continuously recorded the force applied to the
sample throughout the tensioning, and the grip separation was continuously measured as a
function of the load. The load on the sample was normalized against the sample’s original
cross-sectional area to give the engineering stress. The elongation of the specimens was
normalized against the gauge length to give the engineering strain. In all tests, the strain rate
was fixed at 0.1mm.min-1 as required by the ASTM-E8 standard. Data analysis was done on
the instrument’s integrated data acquisition computer using TESTWORKS 4 software to allow
for the plotting of the stress-strain curve, elastic limit, yield strength, ultimate tensile strength.
Reduction in area was determined by measuring the area at the breakpoint of the specimens
and dividing it against the original cross-sectional area.

73
3.7.5 Thermo-Calc
The relative amounts and compositions of the equilibrium phases of the test alloy were
calculated using the titanium database V3 (TTTI3) in Thermo-Calc. The input was the nominal
composition of the test alloy and pressure was fixed at 1 atmosphere, while temperature was
specified as 1800oC to 25oC. Calculations were also performed per phase or crystal structure
to determine the phases’ individual variations in chemical composition with changing
temperature.

74
4.Chapter 4 RESULTS
4.1 Characterization of source materials
The source powders were all high purity materials, which was confirmed by their composition
analyses. XRF showed they were each at least 99.5 wt% pure, and this was corroborated by
XRD, which showed only the expected peaks. The amount of interstitials in the source powders
was relatively low, as shown in Table 4.1, and this made the Timetal 125 style powder mixture
have an interstitial content similar to Grade 2 titanium (Matthew and Donachie, 1988).
Table 4.1: Compositions of the source powders by XRF and LECO (wt%).
Powder Metal content O N H
Ti 99.90±0.06 0.08±0.02 0.021±0.003 0.009±0.001
Mo 99.50±0.03 0.13±0.02 0.020±0.003 0.010±0.001
V 99.75±0.04 0.15±0.01 0.021±0.002 0.009±0.001
Al 99.90±0.01 0.07±0.04 0.020±0.003 0.010±0.002
Fe 99.95±0.02 0.02±0.01 0.020±0.002 0.010±0.001
The particle size distributions of the source powders are shown in Figure 4.1. After sieving to
the +75-106µm size fraction, the powder mixtures did not show segregation. This was
confirmed by energy dispersive X-ray spectroscopy (EDX) analyses, which showed the
compositions of randomly selected areas to be the same as the overall composition, as shown
in Table 4.2.
Table 4.2: Composition of randomly selected areas of the Timetal 125 powder by EDX
(wt%).
Element Overall Spot 1 Spot 2 Spot 3 Spot 4 Spot 5 Average±sd
Ti 79.5 79.5 79.6 79.5 79.6 79.5 79.5±0.1
Al 2.7 2.7 2.6 2.7 2.7 2.7 2.7±0.1
Fe 5.7 5.7 5.8 5.6 5.7 5.7 5.6±0.1
Mo 6.1 6.0 6.1 6.2 6.0 6.1 6.1±0.1
V 6.0 6.1 5.9 6.0 6.0 6.0 6.0±0.1
.

75
Figure 4.1: Superposed particle size distributions of the elemental feed powders.
The blended powder had a d50 of 78 µm, which was adequate for the purpose of this work,
bearing in mind that the work sought to produce the alloy from low cost powders. In more
sophisticated powder metallurgy work, much finer powders with more uniform shape and
morphology are used. However, they are more costly that the powders that were used for the
present work.
4.2 Thermochemical reactions of the elements of Timetal 125
Repeated differential thermal analysis (DTA) results of blanks showed endothermic peaks at
~120oC and 235oC, shown in Figure 4.2. The peaks were attributed to a systematic error of the
instrument, and had to be subtracted from the scans of the samples. In tests where the heat flow
intensities were high, these systematic peaks were smoothed out.
Figure 4.2: DTA scan for a blank run showing low temperature peaks due to a systematic
error of the instrument.
0
2
4
6
8
10
12
0 100 200 300 400 500 600 700
Fe
V
Mo
Al
Ti
Vo
lum
e %
Particle size in microns
Sample Temperature (°C)1000950900850800750700650600550500450400350300250200150100500
He
atF
low
(V
/g)
0.06
0.04
0.02
0
-0.02
-0.04
-0.06
-0.08
Exo
Exo

76
4.2.1 Thermal behaviour of titanium powder
The thermal analysis results for the titanium powder showed a single endothermic peak at
873oC, which is the beta transus, and minor undulations at lower temperatures, as shown in
Figure 4.3. The shape of the peak at 873oC was somewhat unusual, but repeated tests showed
it was reproducible.
Figure 4.3: TGA-DTA scan for the as-received titanium powder in argon.
The slight increase in mass (~2%) was attributed to a drift of the balance, and not to an increase
in the actual mass of the sample because the chemical compositions of the titanium powder
before and after thermal analysis were the same. Similar drift was observed in a number of
other tests, but was not consistent. To rule out oxygen pick up, samples from the DTA were
analysed for interstitials by LECO whenever the drift was observed, and the results showed no
pick up of oxygen during thermal analyses.
4.2.2 Thermal behaviour of aluminium powder
The TG scan for the aluminium powder did not show a change in mass, while the DTA scan
had an endothermic peak at ~658oC on heating, and an exothermic one at ~642oC on cooling,
as shown in Figure 4.4. The melting point of aluminium is 660.452oC (Paruchuri and
Massalski, 1991), and this corresponded well with the peak positions on the scan. As a result,
Sample Temperature (°C)1400120010008006004002000
TG
|s (
%)
100
80
60
40
20
0
HeatF
low
(µ
V)
18
16
14
12
10
8
6
4
2
0
Exo
Heat : 34.228 (µV·s/mg)
T : 863.05 and 908.84 (°C)
Peak Maximum : 873.541 (°C)
Onset : 865.342 (°C)
Exo

77
the endothermic peak in Figure 4.4 was attributed to the melting of aluminium, while the
exothermic one was attributed to its solidification.
Figure 4.4: TGA-DTA scan for the as-received aluminium powder in argon.
The absence of any other DTA peaks was expected, since aluminium is not polymorphic
(Glover, 1969), and was an indication of the high purity of the powder. The DTA scan was
used as a reference when aluminium was mixed with the other powders, and made it possible
to determine if the emergence or disappearance of peaks was associated with its reactions with
the other powders.
4.2.3 Thermal behaviour of iron powder
Iron showed a mass drift similar to titanium, and its heat flow scan showed four endothermic
peaks on heating to 1400oC, as shown in Figure 4.5. Since iron is allotropic, the peaks were
attributed to its phase transformations, and because it only melts at 1535oC (Arajs and Colvin,
1964), none of the peaks were attributed to its melting. As was done with the scans of all the
source powders, the scan in Figure 4.5 was used as a reference to determine if iron chemically
interacted with the other metals. The low temperature peaks were not associated with any
reactions of the metal for reasons stated earlier.
Sample Temperature (°C)
750700650600550500450400350300250200150100
TG
|s (
%)
100
80
60
40
20
0
HeatF
low
(µ
V)
10
5
0
-5
-10
Exo
Heat : 43.229 (µV·s/mg)
T : 650.26 and 708.05 (°C)
Peak Maximum : 678.054 (°C)
Onset : 658.768 (°C)
Heat : -42.335 (µV·s/mg)
T : 650.73 and 591.82 (°C)
Peak Maximum : 629.304 (°C)
Onset : 642.681 (°C)
Exo
Heating curve
Cooling curve
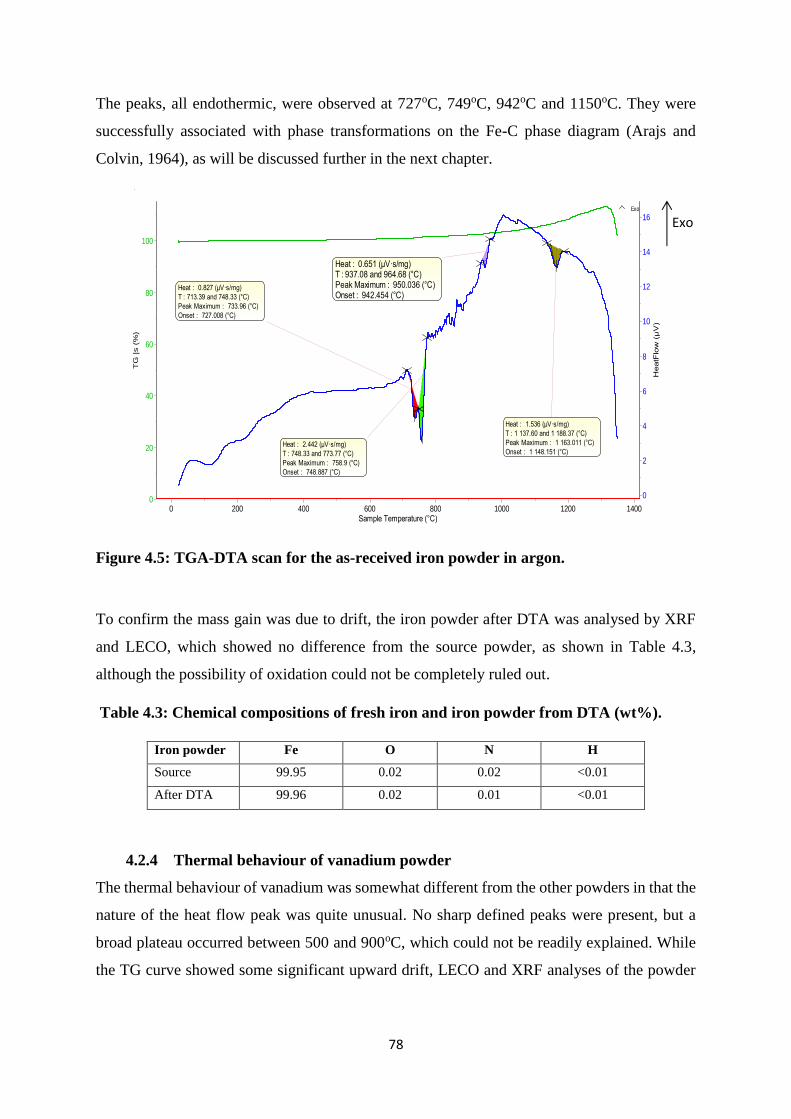
78
The peaks, all endothermic, were observed at 727oC, 749oC, 942oC and 1150oC. They were
successfully associated with phase transformations on the Fe-C phase diagram (Arajs and
Colvin, 1964), as will be discussed further in the next chapter.
Figure 4.5: TGA-DTA scan for the as-received iron powder in argon.
To confirm the mass gain was due to drift, the iron powder after DTA was analysed by XRF
and LECO, which showed no difference from the source powder, as shown in Table 4.3,
although the possibility of oxidation could not be completely ruled out.
Table 4.3: Chemical compositions of fresh iron and iron powder from DTA (wt%).
Iron powder Fe O N H
Source 99.95 0.02 0.02 <0.01
After DTA 99.96 0.02 0.01 <0.01
4.2.4 Thermal behaviour of vanadium powder
The thermal behaviour of vanadium was somewhat different from the other powders in that the
nature of the heat flow peak was quite unusual. No sharp defined peaks were present, but a
broad plateau occurred between 500 and 900oC, which could not be readily explained. While
the TG curve showed some significant upward drift, LECO and XRF analyses of the powder
Sample Temperature (°C)1400120010008006004002000
TG
|s (
%)
100
80
60
40
20
0
HeatF
low
(µ
V)
16
14
12
10
8
6
4
2
0
Exo
Heat : 0.827 (µV·s/mg)
T : 713.39 and 748.33 (°C)
Peak Maximum : 733.96 (°C)
Onset : 727.008 (°C)
Heat : 2.442 (µV·s/mg)
T : 748.33 and 773.77 (°C)
Peak Maximum : 758.9 (°C)
Onset : 748.887 (°C)
Heat : 1.536 (µV·s/mg)
T : 1 137.60 and 1 188.37 (°C)
Peak Maximum : 1 163.011 (°C)
Onset : 1 148.151 (°C)
Heat : 0.651 (µV·s/mg) T : 937.08 and 964.68 (°C) Peak Maximum : 950.036 (°C) Onset : 942.454 (°C)
Exo

79
obtained from the TG-DTA tests did not show any compositional differences from the source
vanadium powder.
Figure 4.6: TGA-DTA scan for the as received vanadium powder in argon.
The absence of heat flow peaks was attributed to vanadium not being allotropic (Henry, 1870).
Thus, no phase reactions were expected in the test temperature range. Repeated tests showed
the scan was reproducible, and Figure 4.6 was deemed to be representative of vanadium’s
thermal behaviour in argon. This broad plateau was also evident on some scans for powders
blended with vanadium. The increase on the TG curve, as shown by the changes in slope, is
likely to have been due to oxidation or interaction with the alumina crucibles.
4.2.5 Thermal behaviour of molybdenum powder
Molybdenum did not show major changes on heating to 1400oC, as shown on its TG-DTA scan
in Figure 4.7. The low temperature undulations were not associated with the metal, but because
there were no pronounced heat flow peaks from the sample, the undulations appeared much
larger than on the scans of the other powders.
Similar to vanadium, molybdenum is not allotropic and, so no phase transformations were
expected in the test temperature range. Molybdenum has one of the highest melting points of
any element, at 2623oC (Cuzon et al., 1971), and therefore its melting was not expected,
although it agglomerated upon heating to 1400oC.

80
There was no mass drift, and this inconsistency of the balance showed that the error was not
systematic. As a result, analyses of powders from the instrument were only carried out when
the drift was observed.
Figure 4.7: TGA-DTA scan for the as-received molybdenum powder in argon.
4.3 Characterization of Blended Powders
The various analytical techniques that were used for the blended powders generally
complemented one another. While XRF, XRD and LECO generally showed an average of the
properties of the individual powders, thermal analyses showed a complete change in behaviour
when the powders were mixed. Table 4.4 shows the target elemental compositions and the
LECO results for the various powder mixtures. The amount of interstitials in the blended
powders was an average of those of the elemental powders, which showed a negligible pick up
of interstitials during mixing. Therefore, the mixing of the powders was satisfactory, since the
spread in oxygen and particle sizes of the blended powders was very small.
Energy dispersive spectroscopy was used to determine the overall and spot compositions of the
powder mixtures, and showed the compositions of randomly selected spots were not different
from the overall compositions. This homogeneity was further support that the mixing was
Sample Temperature (°C)
140013501300125012001150110010501000950900850800750700650600550500450400350300250200150100500
TG
|s (
%)
100
80
60
40
20
0
HeatF
low
(µ
V)
16
14
12
10
8
6
4
2
0
Exo
Exo
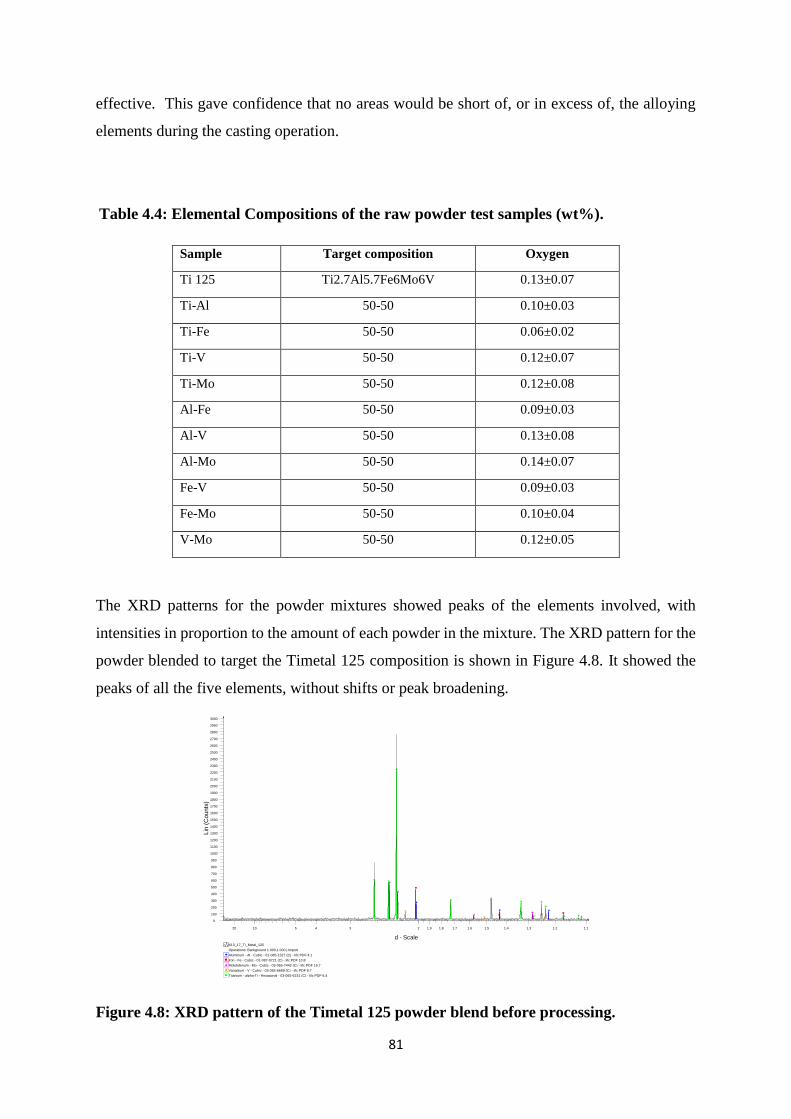
81
effective. This gave confidence that no areas would be short of, or in excess of, the alloying
elements during the casting operation.
Table 4.4: Elemental Compositions of the raw powder test samples (wt%).
Sample Target composition
Oxygen
Ti 125 Ti2.7Al5.7Fe6Mo6V 0.13±0.07
Ti-Al 50-50 0.10±0.03
Ti-Fe 50-50 0.06±0.02
Ti-V 50-50 0.12±0.07
Ti-Mo 50-50 0.12±0.08
Al-Fe 50-50 0.09±0.03
Al-V 50-50 0.13±0.08
Al-Mo 50-50 0.14±0.07
Fe-V 50-50 0.09±0.03
Fe-Mo 50-50 0.10±0.04
V-Mo 50-50 0.12±0.05
The XRD patterns for the powder mixtures showed peaks of the elements involved, with
intensities in proportion to the amount of each powder in the mixture. The XRD pattern for the
powder blended to target the Timetal 125 composition is shown in Figure 4.8. It showed the
peaks of all the five elements, without shifts or peak broadening.
Figure 4.8: XRD pattern of the Timetal 125 powder blend before processing.
Titanium - alpha-Ti - Hexagonal - 03-065-6231 (C) - I/Ic PDF 6.4
Vanadium - V - Cubic - 03-065-6689 (C) - I/Ic PDF 9.7
Molybdenum - Mo - Cubic - 03-065-7442 (C) - I/Ic PDF 19.7
Iron - Fe - Cubic - 01-087-0721 (C) - I/Ic PDF 10.8
Aluminum - Al - Cubic - 01-085-1327 (C) - I/Ic PDF 4.1
Operations: Background 1.000,1.000 | Import
X13_17_Ti_Metal_125
Lin
(C
ounts
)
0
100
200
300
400
500
600
700
800
900
1000
1100
1200
1300
1400
1500
1600
1700
1800
1900
2000
2100
2200
2300
2400
2500
2600
2700
2800
2900
3000
d - Scale
1.12 1.21.31.41.51.61.71.81.910 34520

82
4.3.1 Thermal Analysis of Powder Mixtures
Figure 4.9 shows the DTA scan for the powder mixture with the Timetal 125 target
composition. The scan was quite different from the scans of the elemental powders, and it was
not a summation of the scans of the constituent powders. Two endothermic and two exothermic
peaks were observed on heating the mixture in argon to 1600oC, while no clearly defined peaks
were recorded on cooling. The endothermic peak at 662°C was attributed to the melting of
aluminium, as supported by the scan in Figure 4.4. An exothermic peak was observed at
~668°C, while a second almost overlapping exothermic peak was observed at ~715°C, and a
third at ~1244°C.
An understanding of the peaks in Figure 4.9 was gained from the DTA scans of the binary
powders. In some cases, these showed peaks which were not present on the scans of the
elemental powders, and such peaks were attributed to the reactions of the powders.
Additionally, some of the peaks occurred at approximately the same temperatures as the peaks
in Figure 4.9.
Figure 4.9: DTA scan for the powder blend with Timetal 125 elemental composition.
4.3.2 Thermal Analysis of the titanium-aluminium powder mixture
When titanium was mixed with aluminium, the DTA scan on heating showed some significant
differences from those of the two individual metals. Figure 4.10 shows the DTA scan for the
Ti-Al powder mixture superposed with the DTA scans for pure titanium and pure aluminium,
Sample Temperature (°C)
16001400120010008006004002000
HeatF
low
(µ
V)
12
10
8
6
4
2
0
-2
Exo
Heat : -7.561 (µV·s/mg)
T : 1 209.89 and 1 310.30 (°C)
Peak Maximum : 1 243.282 (°C)
Onset : 1 217.784 (°C)
Heat : 18.476 (µV·s/mg)
T : 645.42 and 679.71 (°C)
Peak Maximum : 665.374 (°C)
Onset : 659.477 (°C)
Heat : -22.45 (µV·s/mg)
T : 668.87 and 700.39 (°C)
Peak Maximum : 683.292 (°C)
Onset : 668.872 (°C)
Heat : -5.805 (µV·s/mg)
T : 701.61 and 732.74 (°C)
Peak Maximum : 721.909 (°C)
Onset : 713.663 (°C)
Heat : -9.114 (µV·s/mg)
T : 1 196.30 and 1 315.12 (°C)
Peak Maximum : 1 243.282 (°C)
Onset : 1 216.052 (°C)
Heat : -0.4 (µV·s/mg)
T : 998.26 and 972.02 (°C)
Peak Maximum : 984.102 (°C)
Onset : 984.185 (°C)
Exo

83
for direct comparison. The scan showed three peaks at 662oC, 817oC and 1111oC, and only the
662oC peak was endothermic. The peak at 662oC was attributed to the melting of aluminium,
while the other two were attributed to the reaction of the two metals. The endothermic peak
observed on the scan for the elemental titanium powder at ~873oC was not present on the scan
of the titanium-aluminium mixture.
The presence of the peak at 662oC showed that elemental aluminium was still present in the
mixture at this temperature. Therefore, no notable reactions took place between the two metals
prior to the melting of aluminium. The absence of the endothermic peak at 873oC indicated that
elemental titanium was no longer present at this temperature, agreeing with the emergence of
the exothermic peak at ~817oC in Figure 4.10.
Figure 4.10: DTA scans (on heating) of pure titanium and a 50-50 wt% of titanium-
aluminium blend showing a negative enthalpy of mixing.
The second exothermic peak at 1111oC was unique to the mixture, and was attributed to an
interaction of the two metals. It was suspected to be a phase transformation, and not necessarily
a chemical reaction between the two elements, since no elemental titanium was expected after
the reaction at 817oC. Therefore, the sequence appeared to have been: aluminium melted at
662oC, probably wetting the titanium powder and perhaps dissolving some of it. This was
followed by an exothermic reaction of the two metals at 817oC, to form an intermetallic
compound. The formation of an intermetallic compound was plausible, since no elemental
Sample Temperature (°C)
1400120010008006004002000
HeatF
low
(µ
V)
50
40
30
20
10
0
-10
-20
-30
CP-Al
Heat : 76.103 (µV·s/mg)
T : 859.69 and 945.47 (°C)
Peak Maximum : 906.395 (°C)
Onset : 865.144 (°C)
Heat : 83.449 (µV·s/mg)
T : 641.66 and 696.93 (°C)
Peak Maximum : 664.541 (°C)
Onset : 652.189 (°C)
Heat : -193.711 (µV·s/mg)
T : 803.43 and 927.23 (°C)
Peak Maximum : 857.587 (°C)
Onset : 817.209 (°C)
CP-Titanium
Ti-Al
Heat : 60.33 (µV·s/mg)
T : 613.63 and 724.22 (°C)
Peak Maximum : 675 (°C)
Onset : 653.643 (°C)
Heat : -105.189 (µV·s/mg)
T : 1 095.11 and 1 200.82 (°C)
Peak Maximum : 1 174.356 (°C)
Onset : 1 111.415 (°C)
Exo

84
titanium was observed at 873oC. The intermetallic compound underwent a phase
transformation at 1111oC.
4.3.3 Thermal Analysis of the titanium-iron powder mixture
Up to approximately 800oC, the DTA scan for the titanium-iron mixture was essentially a
summation of the scans of the elemental powders, except for the endothermic peak at 598oC,
as shown in Figure 4.11. Beyond 800oC, the endothermic peak associated with pure titanium
was not present, while a small exothermic peak emerged at ~926oC. However, the scan showed
a broad downward dip around the same temperature associated with the endothermic peak on
the scan for the titanium powder. The shape of the dip was such that it was not identifiable as
an actual peak. A third endothermic peak was observed at 1296°C, while the endothermic peak
that had been associated with pure iron at 1160°C was no longer present.
Figure 4.11: Superposed DTA scans for pure iron, pure titanium and a 50-50 wt% Ti-
Fe binary alloy.
The endothermic peaks at 723oC and 746°C on the Ti-Fe DTA scan were also present on the
scan for elemental iron powder at 726oC and 748oC respectively. This suggested that there was
still elemental iron and titanium in the mixture, at least up to 748oC. The absence of the
endothermic peak associated with pure titanium at 873oC suggested that either no elemental
titanium was present at this temperature, or that iron had significantly shifted the beta transus.
Furnace Temperature (°C)1400120010008006004002000
HeatF
low
(µ
V)
18
16
14
12
10
8
6
4
2
0
TiFe
CP-Fe
CP-Ti
Heat : 0.486 (µV·s/mg)
T : 723.00 and 746.64 (°C)
Peak Maximum : 732.25 (°C)
Onset : 723.109 (°C)
Heat : 1.522 (µV·s/mg)
T : 745.48 and 776.51 (°C)
Peak Maximum : 756.714 (°C)
Onset : 746.851 (°C)
Heat : 0.883 (µV·s/mg)
T : 716.01 and 748.51 (°C)
Peak Maximum : 733.96 (°C)
Onset : 726.277 (°C)
Heat : 2.491 (µV·s/mg)
T : 748.33 and 774.06 (°C)
Peak Maximum : 758.9 (°C)
Onset : 748.141 (°C)
Heat : 1.663 (µV·s/mg)
T : 1 132.67 and 1 194.27 (°C)
Peak Maximum : 1 162.912 (°C)
Onset : 1 142.966 (°C)
Heat : 0.889 (µV·s/mg)
T : 1 293.18 and 1 321.90 (°C)
Peak Maximum : 1 306.824 (°C)
Onset : 1 296.733 (°C)
Heat : -0.521 (µV·s/mg)
T : 923.91 and 950.33 (°C)
Peak Maximum : 939.689 (°C)
Onset : 926.384 (°C)
598oC
Exo

85
4.3.4 Thermal Analysis of the titanium-vanadium powder mixture
The scan for the titanium-vanadium mixture showed an endothermic peak at 330oC and an
exothermic one at 545oC. These peaks were not on the scans of the elemental powders, and so
they were attributed to interactions of the two metals. The scan is shown in Figure 4.12,
superposed with the DTA scans for pure titanium and pure vanadium. The broad plateau that
was on the scan for vanadium was no longer present, while the endothermic peak associated
with elemental titanium was much smaller.
Therefore, the two peaks on the scan for the mixture were due to interactions of titanium and
vanadium. The absence of the broad plateau indicated vanadium had interacted with titanium
before reaching this temperature, and the absence of the high intensity titanium peak supported
this. The small endothermic peak at 869oC coincided with the titanium peak at 873oC. It was
concluded the two were the same peak because a 50 wt% (V) Ti-V mixture translated to 48.45
at.% V, which meant titanium was in excess. It was this excess titanium that gave rise to the
peak, and its slight depression was probably because of the presence of vanadium, which is a
beta-stabiliser.
Figure 4.12: Superposed DTA scans for pure vanadium, pure titanium and a 50-50 wt%
Ti-V binary alloy.
Sample Temperature (°C)
1400120010008006004002000
HeatF
low
(µ
V)
45
40
35
30
25
20
15
10
5
0
-5
-10
CP-Ti
Ti-V
CP-V
Beta transus
Heat : -5.315 (µV·s/mg)
T : 539.02 and 651.59 (°C)
Peak Maximum : 587.208 (°C)
Onset : 544.815 (°C)
Heat : 0.77 (µV·s/mg)
T : 849.20 and 928.30 (°C)
Peak Maximum : 890.508 (°C)
Onset : 869.982 (°C)
Heat : 80.137 (µV·s/mg)
T : 861.66 and 953.18 (°C)
Peak Maximum : 906.395 (°C)
Onset : 864.818 (°C)
Heat : 2.861 (µV·s/mg)
T : 326.50 and 416.88 (°C)
Peak Maximum : 371.675 (°C)
Onset : 330.283 (°C)
Exo

86
4.3.5 Thermal Analysis of the titanium-molybdenum powder mixture
Figure 4.13 shows the DTA scan for the titanium-molybdenum powder mixture, superposed
with the scans for pure titanium and pure molybdenum. The low temperature undulations on
the scan of the mixture had been observed on the DTA scans for the elemental molybdenum
and titanium powders. These peaks were attributed to the systematic error of the instrument,
and for that reason they are not discussed further.
However, the endothermic peak at 419°C, with an onset temperature of ~376°C, had not been
associated with the individual metals, and was attributed to the interaction of titanium with
molybdenum. The endothermic peak at 873oC associated with pure titanium was not as
pronounced on the scan of the titanium-molybdenum mixture, although its presence suggested
that there was still some elemental titanium at this temperature. The dip around 873oC was
attributed to excess titanium in the mixture, since a 50-50 wt% composition translated to 33.29
at.% (Mo). Therefore, the scan was not a true representation of the behaviour of a mixture
titanium and molybdenum where the two have the same number of atoms, as titanium was
clearly in excess.
Figure 4.13: Superposed DTA scans for pure molybdenum, pure titanium and a 50-50
wt% Ti-Mo binary alloy.
Sample Temperature (°C)
1400120010008006004002000
HeatF
low
(µ
V)
20
15
10
5
0
CP-Ti
CP-Mo
Ti-Mo
Heat : 13.401 (µV·s/mg)
T : 369.83 and 467.29 (°C)
Peak Maximum : 419.2 (°C)
Onset : 376.247 (°C)
Exo

87
4.3.6 Thermal Analysis of aluminium-iron powder mixture
The DTA scan for the aluminium-iron mixture was a summation of the scans for the two metals,
up to ~800oC, as shown in Figure 4.14. The peak that was associated with the melting of
aluminium at 662oC was still present, same as the endothermic peaks at 726oC and 748oC for
iron. This showed there was not much interaction between the two metals, at least up to 800oC.
However, the exothermic peak at 1152oC was unique to the mixture, and hence associated with
a reaction between aluminium and iron. Additionally, the endothermic peak at 926oC and the
exothermic one at 1146oC on the scan for pure iron were not present on the scan for the mixture.
Their absence could not be readily explained for two reasons. First, the scan showed not much
interaction of the two metals, at least up to the emergence of the new peak at 1162oC. Therefore,
elemental iron and aluminium were expected to be present for all temperatures below 1152oC.
Secondly, the two high temperature peaks on the scan for pure iron were both at a temperature
lower than 1152oC, and as a result were expected to be on the scan for the mixture. Their
absence indicated that iron was probably no longer present in elemental form at 926oC. The
1152oC peak was attributed to a reaction of aluminium with iron.
Figure 4.14: Superposed DTA scans for pure iron, pure aluminium and the Al-Fe powder
mixture.
Exo

88
4.3.7 Thermal Analysis of the aluminium-vanadium powder mixture
The scan for the mixture of aluminium and vanadium had an exothermic peak at ~733oC, as
well as at ~968oC. These peaks were not present on the scans of the unblended powders, so
they were attributed to the interaction of the two metals. Figure 4.15 shows the DTA scan,
superposed with the DTA scans for pure aluminium and pure vanadium. The peak associated
with the melting of aluminium was present, suggesting that the metals were in elemental form
at least up to 662oC. However, the intensity of the peak was not proportional to the amount of
aluminium in the mixture. The intensity was much lower than expected for a 65.37 at.% Al
composition. The heat loss during the melting of pure aluminium was 35µV.s.mg-1, and only
5µV.s.mg-1 for the mixture. If there had been no interaction between the two metals before the
melting of aluminium, the heat loss during melting would have been around ±17µV.s.mg-1.
The pronounced decrease of peak intensity suggested that a significant amount of the
aluminium was no longer in elemental form, although the presence of the peak showed that
some elemental aluminium was still present in the mixture at the melting temperature. This was
understandable, because aluminium was clearly in excess.
Figure 4.15: Superposed DTA scans for pure aluminium, pure vanadium and a 50-50
wt% Al-V binary alloy.
The broad plateau associated with pure vanadium was not present on the scan of the binary
powder. The onset of the plateau on the scan for pure vanadium was below 662oC, and the
Sample Temperature (°C)
1400120010008006004002000
HeatF
low
(µ
V)
45
40
35
30
25
20
15
10
5
0
-5
-10
-15
-20
-25
-30
-35
CP-V
Heat : -13.591 (µV·s/mg)
T : 720.67 and 883.79 (°C)
Peak Maximum : 794.394 (°C)
Onset : 733.019 (°C)
Heat : -1.759 (µV·s/mg)
T : 951.10 and 1 043.61 (°C)
Peak Maximum : 1 013.481 (°C)
Onset : 967.585 (°C)
CP-Al
Al-V
Exo

89
absence of the peak on the scan for the mixture indicated that the two metals had already
chemically interacted.
4.3.8 Thermal Analysis of the aluminium-molybdenum powder mixture
When aluminium was mixed with molybdenum, the heat flow scan became very different from
those of the elemental powders, as shown in Figure 4.16. However, the aluminium melting
peak was preserved, and its intensity was concomitant with the amount of aluminium in the
mixture. This showed that the two metals did not react, at least up to 662oC. An exothermic
peak was present at 733oC, which was attributed to the reaction of the two metals. An even
higher intensity exothermic peak was observed at 790oC, and its magnitude showed that it was
not a simple phase transformation, but a highly exothermic reaction between the two metals.
Three endothermic peaks were observed at 1006oC, 1170oC and 1256oC, and their intensities
were much lower than the peak at 790oC.
Figure 4.16: Superposed DTA scans for pure aluminium, pure molybdenum and a 50-50
wt% Al-Mo binary alloy.
At this stage, it was not clear whether the endothermic peaks were due to a chemical reaction
of the two elements, or a phase transformation occurred at a lower temperature. However, due
to the very limited amount of molybdenum in the mixture, these peaks were not due to its
Sample Temperature (°C)
1400120010008006004002000
HeatF
low
(µ
V)
50
45
40
35
30
25
20
15
10
5
0
-5
-10
-15
-20
-25
-30
-35
CP-Mo
CP-Al
Mo-Al
Heat : 0.849 (µV·s/mg)
T : 998.77 and 1 041.33 (°C)
Peak Maximum : 1 020.417 (°C)
Onset : 1 006.192 (°C)
Heat : 3.171 (µV·s/mg)
T : 1 160.17 and 1 212.37 (°C)
Peak Maximum : 1 185.469 (°C)
Onset : 1 170.026 (°C)
Heat : 1.636 (µV·s/mg)
T : 1 245.17 and 1 305.16 (°C)
Peak Maximum : 1 265.733 (°C)
Onset : 1 256.439 (°C)
Heat : -1.445 (µV·s/mg)
T : 715.15 and 765.50 (°C)
Peak Maximum : 748.64 (°C)
Onset : 733.348 (°C)
Heat : -35.291 (µV·s/mg)
T : 769.60 and 853.11 (°C)
Peak Maximum : 806.368 (°C)
Onset : 789.55 (°C)
Exo

90
reactions. They were either due to phase transformations of compounds formed at the lower
temperatures, or interactions of these compounds with the excess aluminium.
4.3.9 Thermal Analysis of the iron-vanadium powder mixture
The DTA scan for the iron-vanadium mixture showed no major differences from those of the
pure metals, except for the emergence of an endothermic peak at ~1300°C. The peak, shown
in Figure 4.17, was attributed to the interaction of the two metals. The broad plateau was still
evident, while the endothermic peaks associated with pure iron at 723°C and 746°C were also
still present. The attenuation of the broad plateau, as well as of the endothermic peaks was
proportional to the dilution of the powders. It was concluded that the two metals did not
chemically react, at least up to 1300oC, where the new endothermic peak emerged.
Figure 4.17: Superposed DTA scans for pure iron, pure vanadium and a 50-50 wt% Fe-
V binary alloy.
4.3.10 Thermal Analysis of the iron-molybdenum powder mixture
Except for the two low temperature endothermic peaks at about 100°C and 230°C, the DTA
scan for the iron-molybdenum mixture was essentially a summation of the scans of the
constituent metals, as shown in Figure 4.18. All the endothermic peaks associated with pure
iron were present on the scan for the mixture, suggesting there was minimal, or no, chemical
Exo

91
interactions between the two metals, even up to 1400oC. The endothermic peak at ~115oC,
although reproducible, was questionable considering that the instrument’s sensitivity was from
150oC, according to the DTA rod that was used (Setaram, 2008). The peak at ~250oC, although
reproducible, could not be easily differentiated from the systematic noise of the instrument.
Figure 4.18: Superposed DTA scans for pure iron, pure molybdenum and a 50-50 wt%
Fe-Mo binary alloy.
Above 250oC, the scans of the elemental powders were preserved. Since the scan for pure
molybdenum was essentially flat, it was concluded that it too was preserved. However, the lack
of chemical interaction did not preclude the possibility of physical interaction between the two
metals. Since physical interactions, such as phase transformations, are not normally associated
with intense heat flow peaks, it was possible that such peaks were masked by the pronounced
peaks of the transformations of iron. This had to be confirmed using other techniques.
4.3.11 Thermal Analysis of the molybdenum-vanadium powder mixture
Except for the emergence of a small endothermic peak at 380oC, and the disappearance of the
vanadium broad plateau, the DTA scan for molybdenum-vanadium mixture was essentially
flat. Figure 4.19 shows the scan for the molybdenum-vanadium powder mixture, superposed
with the scans for pure molybdenum and vanadium. The peak at ~380oC and the exothermic
Sample Temperature (°C)
1400120010008006004002000
HeatF
low
(µ
V)
25
20
15
10
5
0
-5
-10
CP-Mo
Heat : 10.44 (µV·s/mg)
T : 44.75 and 189.75 (°C)
Peak Maximum : 114.737 (°C)
Onset : 59.996 (°C)
Heat : 2.986 (µV·s/mg)
T : 194.52 and 313.30 (°C)
Peak Maximum : 250.316 (°C)
Onset : 207.14 (°C)
Heat : 1.85 (µV·s/mg)
T : 1 128.13 and 1 209.06 (°C)
Peak Maximum : 1 162.912 (°C)
Onset : 1 146.944 (°C)
Heat : 0.193 (µV·s/mg)
T : 1 126.00 and 1 214.69 (°C)
Peak Maximum : 1 172.003 (°C)
Onset : 1 153.654 (°C)
CP-Fe
Fe-Mo
Exo

92
one at ~1300oC were not on the scans of either metal, and so they were attributed to an
interaction. The disappearance of the vanadium plateau was further support for some form of
interaction between vanadium and molybdenum.
Figure 4.19: DTA scan pure molybdenum, pure vanadium and for a 50-50 wt% Mo-V
binary alloy showing an almost zero enthalpy for most sections of the curve.
The thermal analyses of the pure powders and their binary permutations not only allowed for
the deduction of the temperatures where the metals reacted, but gave insight into the enthalpy
of mixing for each pair. A number of models, such as the classical regular solution model and
the embedded-atom method, use the heats of solution to predict the interaction of two elements
during alloying (Hume-Rothery, 1935; Johnson, 1989). All the peaks that emerged after mixing
the elements were attributed to the metals’ enthalpies of mixing and phase transformations of
the alloys. Both the nature of the enthalpies, whether exothermic, endothermic or zero, and
their magnitudes are important for the models.
4.4 Properties of the Cast Alloys
The XRD pattern of the alloy cast from the powder with the Timetal 125 target composition is
shown in Figure 4.20, in which both αTi and βTi were identified, with the βTi having the higher
Exo

93
major peak. The peaks had shifted relative to pure titanium because of the alloying (Topano,
2003). The peak at 2theta = 26o was matched as βTi from the work of Lui et al. (2006).
The peaks were broader and less symmetrical than in Figure 4.8, and this indicated a range of
lattice parameters, since the alloy had not been homogenised.
Figure 4.20: XRD pattern of the Timetal 125 style alloy in the as-cast condition.
When compared to the superposed stick diagrams, the peaks in Figure 4.20 were generally
shifted both to the left and right, and this suggested that the interplanar spacing, d, of the
titanium lattice increased in some directions, and decreased in others, after alloying (Warren,
1969), according to the modified Bragg’s equation in Equation 4.1 (Bragg, 1913).
𝐬𝐢𝐧𝛉 =𝐧𝛌
𝟐𝐝 Equation 4.1
where θ is the diffraction angle, n is an integer, d is the interplanar distance, and λ is the incident
wavelength. The cast alloy was not expected to have the same peak pattern as pure titanium.
However, the patterns for pure titanium were used to determine if the alloy was αTi or βTi.
Titanium - beta-Ti - Cubic
Titanium - alpha-Ti - Hexagonal
X13_09_TiMetal_125_3
Lin
(C
ounts
)
0
100
200
300
400
500
600
700
800
900
1000
1100
1200
1300
1400
1500
1600
1700
1800
2-Theta - Scale
2 10 20 30 40 50 60 70 80 90
(βTi)
(βTi) (αTi)
(βTi)
(αTi)
(αTi) (αTi) (βTi)

94
4.4.1 Density of the as-cast Timetal 125 style alloy
The theoretical density of the Timetal 125 style alloy was calculated to be 5.04g.cm-3, based
on the weighting of the elements, xi, in the alloy and their respective densities, according to
Equation 4.2. Table 4.5 gives the measured densities of a number of the as-cast alloys, where
the targeted composition was Timetal 125. To minimize measurement error, the density of
each sample was measured in triplicate, and averaged.
𝛒𝐚𝐥𝐥𝐨𝐲 = ∑ 𝐱𝐢𝛒𝐢 Equation 4.2
The theoretical densities of the Timetal 125 style alloy in the as-cast condition were
consistently 98.8±0.2%, and this relatively low density was an indication of possible porosity
in the castings. Additionally, the as-cast microstructure, shown in Figure 4.21, had a large
volume fraction of precipitates.
Table 4.5: Densities of the Timetal 125 style samples in the as-cast condition (g.cm-3).
Density 1 Density 2 Density 3 Average density Theoretical Density (%)
4.973 4.971 4.977 4.974±0.003 98.6±0.2
4.981 4.983 4.984 4.983±0.001 98.8±0.2
4.983 4.981 4.985 4.983±0.002 98.8±0.3
4.976 4.979 4.978 4.978±0.001 98.7±0.2
4.973 4.974 4.969 4.972±0.003 98.7±0.2
4.977 4.973 4.977 4.976±0.002 98.7±0.2
4.4.2 Microstructure of the Cast Timetal 125 style alloy
In the as-cast condition, the Timetal 125 style alloy had a microstructure of αTi grains with
fine βTi precipitates, as shown in the optical micrograph in Figure 4.21. This was because the
cooling rate after the casting operation was not fast enough to retain a completely βTi
microstructure, as would normally be expected. The grain size was determined to be 19±7µm
by the grain intercept method, and the small size was attributed to rapid cooling, due to the
high thermal conductivity of the copper mould. The microstructure had precipitates, which
formed as colonies. However, many of the αTi grains had areas without precipitates, and this
allowed for measurement of composition of the matrix by EDX. The colonies of precipitates
were also large enough to have their compositions determined.

95
Figure 4.21: Optical micrograph of the Timetal 125 style alloy in the as-cast condition
(micron bar = 100µm).
Composition analyses by energy dispersive X-ray spectroscopy showed the precipitates had
elevated amounts of iron, molybdenum and vanadium than the matrix, while aluminium was
more uniform, as shown in Table 4.6. The EDX was only a comparative measure, since the
analysis of the precipitates also included part of the main grains. It was not possible to view
the phases without etching. Consequently, the EDX analysis was on etched samples, making it
more of a comparative than quantitative study, since some elements were possibly lost during
etching. It was not possible to measure the composition of the grain boundaries due to their
size. Therefore, it could not be determined if they were compositionally different from the
matrix, or the precipitate colonies. However, their difference in contrast from both the matrix
and colonies suggested they may have been different, but this might have been due to sample
preparation.
Table 4.6: EDX analyses of the matrix and precipitates (wt%).
Element Matrix Precipitates
Ti 79.5±1.3 78.3±0.6
Al 2.7±0.1 2.2±0.2
Fe 5.3±0.3 6.3±0.2
Mo 5.3±0.5 6.3±0.4
V 5.7±0.4 6.9±0.6
The SEM micrograph in Figure 4.22 shows some fine precipitates within the grains. The size
of these precipitates, as well as the thickness of the grain boundaries, was submicron. Their

96
small size did not allow for separate analysis by EDX, which made it impossible to determine
if they were compositionally different from the colonies. At this magnification some pores
could be seen, and it was concluded porosity was a contributing factor to the relatively low
density of the alloy in the as-cast condition.
Figure 4.22: SEM-BSE image of the Timetal 125 style alloy in the as-cast condition
showing intragranular precipitates and porosity (micron bar = 20µm).
Five mounted Timetal 125 style alloy castings were kept in a desiccator at low temperature.
The first sample was examined after 5 hours, and did not show any difference from the as-cast
samples. However, the sample that was examined after 24 hours had fewer precipitate colonies,
as shown in Figure 4.23(a). The as-cast samples’ microstructures changed over time at
roomloi98 temperature. Natural ageing of titanium alloys has not been reported to result in
observable changes in microstructure. So, the apparent changes were attributed to etch effects,
since the samples had been etched for metallography prior to storage. It is possible that the
etchant continued acting on the samples even after washing and storage, resulting partial
dissolution of prone phases, particularly βTi.

97
Figure 4.23: Optical micrographs of a cast Timetal 125 style alloy sample after (a) 24h,
(b) 48h, (c) 72h (d) 300h at room temperature showing dissolution of precipitates (all
micron bars = 100µm).
The samples aged for 48 and 72 hours did not contain the precipitate colonies, as shown in
Figures 4.23 (c) and (d). This showed the colonies were possibly metastable, and there was a
driving force to achieve which homogeneity. The driving force for the dissolution was believed
to be the unoptimised microstructure in the as-cast condition. However, an observable change
in microstructure at room temperature in titanium alloys has never been reported. The observed
change (dissolution) was likely to be due to etch effects, as the etchant possibly continued to
act on the desiccated samples.
Table 4.7: Grain size as a function of time.
Ageing time (h) Grain size (µm)
0 19±7
24 19±8
48 20±8
72 23±11
300 23±11
(a) (b)
(c) (d)
Colonies of precipitates
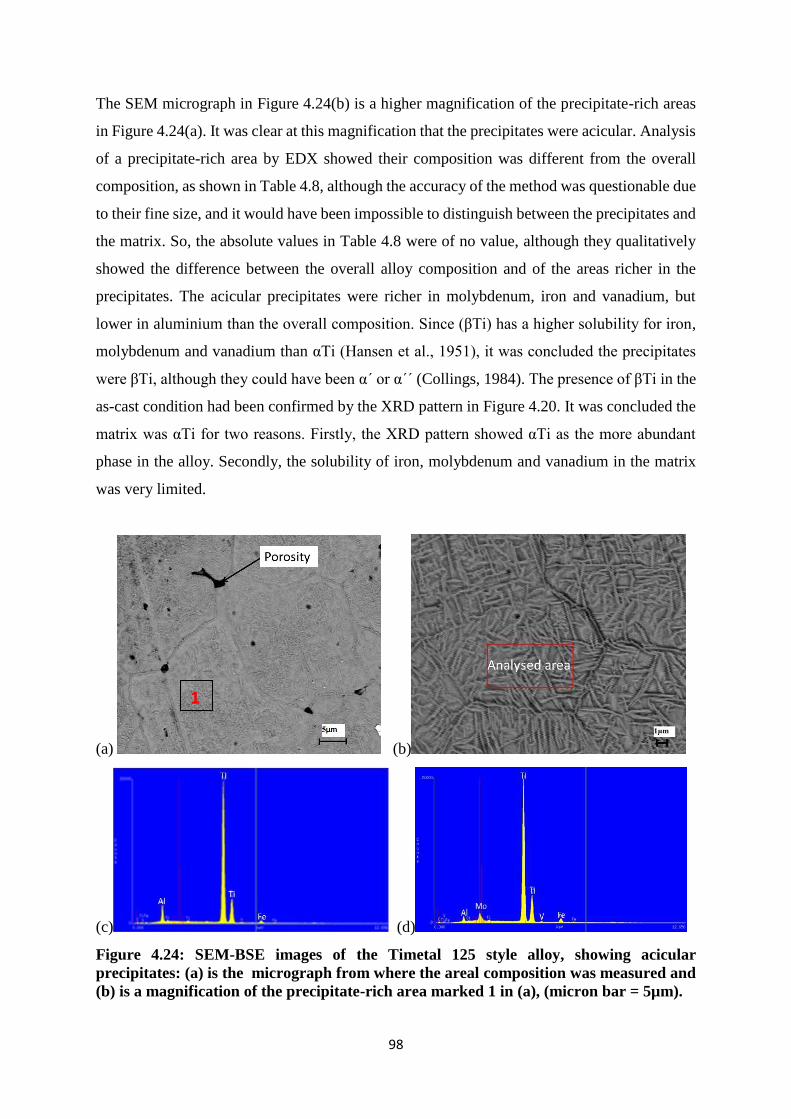
98
The SEM micrograph in Figure 4.24(b) is a higher magnification of the precipitate-rich areas
in Figure 4.24(a). It was clear at this magnification that the precipitates were acicular. Analysis
of a precipitate-rich area by EDX showed their composition was different from the overall
composition, as shown in Table 4.8, although the accuracy of the method was questionable due
to their fine size, and it would have been impossible to distinguish between the precipitates and
the matrix. So, the absolute values in Table 4.8 were of no value, although they qualitatively
showed the difference between the overall alloy composition and of the areas richer in the
precipitates. The acicular precipitates were richer in molybdenum, iron and vanadium, but
lower in aluminium than the overall composition. Since (βTi) has a higher solubility for iron,
molybdenum and vanadium than αTi (Hansen et al., 1951), it was concluded the precipitates
were βTi, although they could have been α΄ or α΄΄ (Collings, 1984). The presence of βTi in the
as-cast condition had been confirmed by the XRD pattern in Figure 4.20. It was concluded the
matrix was αTi for two reasons. Firstly, the XRD pattern showed αTi as the more abundant
phase in the alloy. Secondly, the solubility of iron, molybdenum and vanadium in the matrix
was very limited.
(a) (b)
(c) (d)
Figure 4.24: SEM-BSE images of the Timetal 125 style alloy, showing acicular
precipitates: (a) is the micrograph from where the areal composition was measured and
(b) is a magnification of the precipitate-rich area marked 1 in (a), (micron bar = 5µm).
1

99
The areal alloy composition of the micrograph in Figure 4.24 (a), shown in the EDX spectrum
in Figure 4.24 (c), and the composition of the analysed area in Figure 4.24 (b) are shown in
Table 4.8. Although for iron, molybdenum and vanadium, there were differences, since both
areas analysed had precipitates, the differences for the other elements were not significant.
Also, it was only possible to view the grains under scanning microscope after etching.
However, etching would have partly dissolved the less corrosion-resistant βTi, which may have
affected the analyses, bringing the compositions of the two phases closer together.
Although Figure 4.24(b) was taken from a precipitate-rich area in Figure 4.24(a), the analysis
definitely included the matrix as well. So, it was mainly a qualitative comparison of the overall
composition and that of areas richer in the precipitates.
Table 4.8: Areal and spot composition determined by EDX (wt%).
Element Overall Analysed area (Figure 4.24(b)
Al 2.6±0.1 2.1±0.2
Fe 5.8±0.3 6.1±0.3
Mo 6.0±0.3 7.4±0.2
V 6.1±0.4 6.6±0.2
Ti 80.5±0.2 77.8±0.2
4.4.3 Phase Reactions of the Timetal 125 style alloy
The differential thermal analysis results for one of the Timetal 125 style alloy castings are
shown in the scan in Figure 4.25. No major heat flow peaks were observed, except for an
exothermic peak at 590oC and 800oC on heating, and an endothermic one at 800oC on cooling.
Since no chemical reactions were expected in the cast alloy, the peaks in Figure 4.25 were
attributed to phase transformations.
The exothermic peak at 590oC was attributed to the αTi transforming to βTi, while the peak at
800oC on the cooling curve was attributed to the onset of the transformation of αTi to βTi
transformation (the beta transus). The very small endothermic peak at 837oC could not be
readily assigned to any transformation, but its presence was confirmed when similar tests
showed it was reproducible.
The thermogravimetric curve was flat, showing no change in mass during the experiment. This
excluded the possibility of the alloy having reacted with oxygen, and gave some level of
confidence in the results.

100
Figure 4.25: TGA-DTA scan for the cast Timetal 125 style alloy, showing first αTi to βTi
transfornation at 590oC and the final α ↔ β transformation at 800oC.
4.4.4 Mechanical Properties of the cast Timetal 125 style alloy
There was no appreciable change in density with time, as shown in Table 4.9, but this may
have been due to the method used, which is not very sensitive. Density measurements from
light microscopy may have been more accurate than from the Archimedes’ water immersion
method. The dissolution of the precipitates, Figure 4.23, did not result in a measurable change
in the ultimate tensile strength or elongation.
Table 4.9: Density of the Timetal 125 style alloy castings after extended time g.cm-3).
Time (h) ρ1 ρ2 ρ3 Mean Theoretical density (%)
0 4.973 4.971 4.977 4.974±0.003 98.81±0.06
24 4.983 4.981 4.985 4.983±0.002 98.99±0.04
48 4.987 4.987 4.998 4.990±0.006 99.12±0.11
72 4.989 4.986 4.986 4.987±0.002 99.07±0.04
120 4.989 4.990 4.989 4.990±0.001 99.12±0.02
180 4.990 4.988 4.989 4.989±0.001 99.11±0.02
240 4.988 4.989 4.989 4.989±0.001 99.11±0.02
The hardness of the Timetal 125 style alloy was highest in the as-cast condition, ~495±15HV,
Table 4.13, and decreased with increasing heat treatment temperature and time. The highest
strength and lowest ductility of the Timetal 125 style alloy were also observed in the as-cast
Sample Temperature (°C)12001000800600400200
TG
(%
)
100
80
60
40
20
0
HeatF
low
(µ
V)
10
9
8
7
6
5
4
3
2
1
0
-1
-2
-3
-4
-5
-6
-7
-8
-9
-10
-11
-12
-13
-14
Exo
Heat : -0.072 (µV·s/mg)
T : 574.60 and 599.56 (°C)
Onset : 587.866 (°C)
Heat : -0.114 (µV·s/mg)
T : 833.88 and 855.97 (°C)
Onset : 836.773 (°C)
Heat : 0.012 (µV·s/mg)
T : 800.86 and 799.23 (°C)
Onset : 800.859 (°C)
m (mg) 0.496
m (%) 0.742
Remaining Mass : 67.286 (mg)
Tinf : 149.31 (°C), 978.4 (s)
m (mg) -1.522
m (%) -2.278
Remaining Mass : 65.268 (mg)
Tinf : 1 099.95 (°C), 6 277.6 (s)
TG
Exo

101
condition. The tensile strength in the as-cast condition was consistently above 1470MPa, while
the elongation at fracture averaged 3.1±0.2%, as shown in Table 4.10. The low ductility was
due to the unoptimised microstructure and assumed high dislocation density from the rapid
cooling after casting. The stress-strain curve did not have a plastic region, and this was
corroborated by the tensile specimens which did not neck. Many of the as-cast samples
fractured at the head-gauge interface, as shown in the photographs in Figure 4.26, and did not
show necking, as shown in Figure 4.26(a) and (b).
Figure 4.26: Photographs of tensile specimens after fracture (a) and (b) brittle fracture
at the head-gauge interface in the as-cast condition, and (c) and (d) ductile fracture after
heat treatment for 60mins at 900oC followed by water quenching (original length of the
tensile specimens was 80mm).
The fracture at the heads was attributed to the profile of the casting die, which did not allow
for tapering from head to the gauge and hence acted as a stress concentrator. This led to change
in the design of the die, which resulted in fracture at the desired position. However, the change
still resulted in brittle fracture, although the measurable strain before fracture indicated the
alloy was not completely brittle.
The photographs of the tensile specimens analysed after heat treatment at 900oC for 60 minutes,
followed by water quenching, are shown in Figure 4.26(c) and (d) for comparison. They
(a) (b)
(c) (d)
Brittle fracture
Cup
Cone Neck

102
showed a cup and cone after fracture, indicating ductile failure. Since the alloy was not cold
worked after casting, dislocation density was not expected to be high. The major strengthening
mechanisms in the as-cast condition were precipitation hardening and Hall-Petch strengthening
due to the small grain size. Therefore, the change from a brittle to a ductile mode of failure was
due to the loss of precipitates and grain growth during heat treatment.
Table 4.10 gives the properties of the Timetal 125 style alloy in the as-cast condition. The
results were reproducible, as shown by the relatively small errors. The fracture strength in the
as-cast condition was ~1500MPa, as shown in the stress-strain curve in Figure 4.27. While it
is not uncommon for titanium alloys to attain such high strengths (Papirno, 1968), the strains
are normally higher than what was recorded for the test alloy. The curves were typical of a
more brittle material, with no plastic region. The elongation at fracture was very small,
3.1±0.2%, probably showing the effect of the precipitates and the unoptimised microstructure.
Table 4.10: Mechanical properties of the Timetal 125 style alloy in the as-cast condition.
UTS (MPa) Strain ϵ (%) Fracture toughness (MPa.m1/2) Reduction in Area (%)
1439 3.0 22 1.6
1432 3.3 24 1.7
1453 2.9 22 1.7
1499 3.0 22 1.6
1513 2.9 22 1.5
1483 3.0 22 1.6
1476±24 3.1±0.2 22±1 1.6±10.1
The modulus of elasticity of the alloy was estimated from the slope to be ~483GPa, a stiffness
much higher than the typical 105-120GPa associated with titanium alloys (Srinivan and Rao,
2012). A more accurate measurement would have required the use of strain gauges. This
directly supported that the microstructure was not optimal. Fracture toughness was estimated
from the area under the stress-strain curve. Such a calculation was just an approximation, and
the values were only qualitative, but could be used for comparison. Similar calculations from
stress-strain curves of known titanium alloys showed values in the range 44-68MPa.m-1/2 (Kim,
1994). However, from the values presented in Table 4.10, the fracture toughness of the Timetal
125 style alloy in the as-cast condition was about half that of common titanium alloys and about
the same as of titanium aluminides, which range between 12-35MPa.m-1/2 (Kim, 1994).

103
Figure 4.27: Stress-strain curve of the Timetal 125 style alloy in the as-cast condition
showing high strength and relatively low ductility.
4.5 Spark Plasma Sintering
The sintered Timetal 125 style alloy had precipitates inside well-developed large polygonal
grains. The samples had porosity, which decreased with increasing sintering temperature and
time. Samples sintered at 1100oC, Figure 4.28(a), had a density less than 85% theoretical, due
to the amount and size of pores. After sintering above 1200oC, the samples were far less porous
and the microstructure had needle-like precipitates inside some of the grains. There were also
some regions without precipitates. Although the volume fraction of pores appeared higher in
Figure 4.28 than Figure 4.21, the castings were more porous, particularly when compared to
samples sintered at 1200oC. It was suspected that the pores in the as-cast microstructure were
masked by the slightly smaller grain sizes and precipitates.
The samples sintered at 1200oC for less than 10 minutes had large pores and their density was
below 95% of theoretical. This necessitated the use of longer sintering periods. After sintering
for between 10 and 20 minutes had a density greater than 98%, due to less porosity. However,
they had much larger grains than those sintered for shorter periods. Grain size plays a key role
in the mechanical properties of a material, and the effort to improve the density of the sintered
samples by increasing the holding time had the adverse effect of causing excessive grain
growth.
0
200
400
600
800
1000
1200
1400
1600
0 1 2 3 4Strain (%)
Stre
ss (
MP
a)
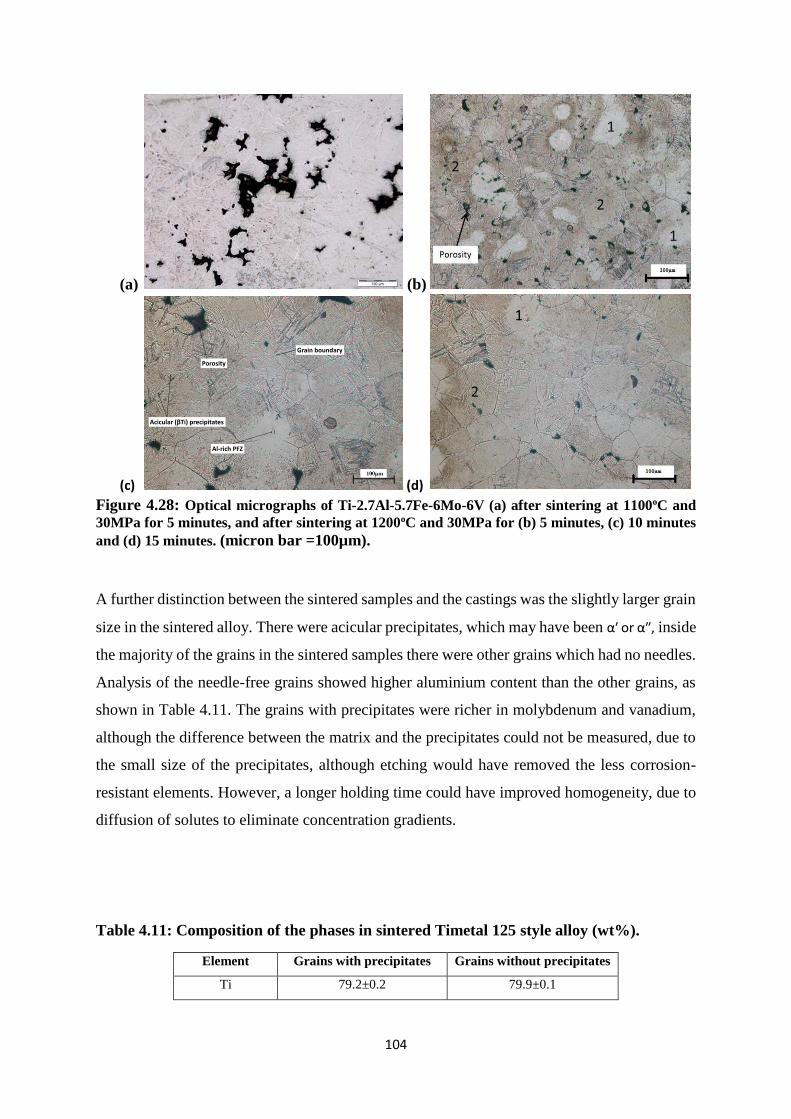
104
(a) (b)
(c) (d)
Figure 4.28: Optical micrographs of Ti-2.7Al-5.7Fe-6Mo-6V (a) after sintering at 1100oC and
30MPa for 5 minutes, and after sintering at 1200oC and 30MPa for (b) 5 minutes, (c) 10 minutes
and (d) 15 minutes. (micron bar =100µm).
A further distinction between the sintered samples and the castings was the slightly larger grain
size in the sintered alloy. There were acicular precipitates, which may have been αʹ or αʺ, inside
the majority of the grains in the sintered samples there were other grains which had no needles.
Analysis of the needle-free grains showed higher aluminium content than the other grains, as
shown in Table 4.11. The grains with precipitates were richer in molybdenum and vanadium,
although the difference between the matrix and the precipitates could not be measured, due to
the small size of the precipitates, although etching would have removed the less corrosion-
resistant elements. However, a longer holding time could have improved homogeneity, due to
diffusion of solutes to eliminate concentration gradients.
Table 4.11: Composition of the phases in sintered Timetal 125 style alloy (wt%).
Element Grains with precipitates Grains without precipitates
Ti 79.2±0.2 79.9±0.1
1
Porosity
Grain boundary
Al-rich PFZ
Acicular (βTi) precipitates

105
Al 1.9±0.3 4.3±0.3
Fe 2.6±0.5 3.8±0.2
Mo 8.9±0.3 5.9±0.3
V 7.4±0.2 6.1±0.2
The SEM micrograph where the analyses in Table 4.12 were taken is shown in Figure 4.29,
from where another phase was observed. The phase was darker than both the matrix and
precipitates, and EDX showed it was higher in iron, as shown in Table 4.11. The SEM
micrograph also showed the porosity of the sintered alloys, and confirmed the dark spots in the
optical micrograph in Figure 4.29 were pores.
Figure 4.29: SEM-BSE image of the Timetal 125 style alloy after spark plasma sintering
at 1200oC, 30MPa for 5 mins, showing porosity.
The density of sintered Timetal 125 sintered at 1200oC for 5 minutes was on average 99.0±0.2%
of the theoretical, as shown in Table 4.12. This was marginally higher than the castings, and
was attributed to the more compact microstructure in the sintered samples, with less porosity.
The increase in density on extending sintering time to 20 minutes was less than 0.1%, possibly
indicating that although the pores after 5 minutes were large, they were not many. Additionally,
sintering for more than 10 minutes resulted in excessive grain growth, Figures 4.28(c) and (d).
Table 4.12: Densities of the Timetal 125 style alloy sintered at 1200oC for 5 minutes at
30MPa (g.cm-3).
ρ1 ρ2 ρ3 Mean Theoretical Density (%)

106
4.99 4.99 5.01 5.00 99.1 ±0.2
4.98 4.99 4.98 4.99 98.9±0.2
5.01 4.99 5.00 5.00 99.2±0.2
4.98 4.98 5.00 4.99 98.9 ±0.2
5.00 4.99 5.01 5.00 99.2 ±0.2
4.99 5.02 4.98 5.00 99.1 ±0.2
5.00 4.98 4.99 4.99 99.0 ±0.2
The Timetal 125 style alloy was harder when sintered than cast, although the difference was
very small, as shown in Table 4.13. The increase in hardness was attributed to higher
densification in the sintered alloys than the castings (which contained porosity) and possibly
the presence of ωTi. Since sintered samples could not be subjected to tensile tests, it was not
possible to determine their strain at fracture. However, because there was direct proportionality
between hardness and fracture strength, it was inferred that the sintered Timetal 125 style alloy
had a slightly higher fracture strength, and hence lower ductility. The as-cast samples had small
αTi and βTi grains, with colonies of βTi precipitates, while the sintered samples had a coarser
microstructure, with acicular precipitates. The difference in microstructure between the as-cast
(finer αTi grains with βTi precipitates) and as-sintered alloys (coarser αTi grains with acicular
αʹ, αʺ or βTi precipitates) was due to the pressure during sintering, and the different cooling
rates.
Table 4.13: Hardnesses of the sintered Timetal 125 style alloy.
Sample HV
S1 513±8
S2 517±6
S3 509±8
S4 515±9
S5 501±5
S6 506±6
S7 514±9
Mean 511±7
As-cast 495±15

107
4.6 Heat Treatment Response of the Timetal 125 style alloy
The mechanical properties of Timetal 125 in the as-cast condition made it unsuitable for any
application because the microstructure was not optimized. As a remedy, some stabilizing heat
treatment was necessary. Since the target was to obtain an optimized βTi alloy, it was necessary
to solution-treat first, and then age. During annealing, the precipitates gradually dissolved,
resulting in a more uniform microstructure. The grain size of the matrix generally increased
with annealing temperature and time, resulting in a significant change in the mechanical
properties. However, extended heat treatment at any temperature resulted in the grain size
reaching a plateau.
The hardness and tensile strength decreased with increasing annealing temperature and time,
while ductility increased appreciably. After annealing, the stress-strain curves showed a clear
yield point, UTS and a plastic region before fracture. Visual inspection of the annealed tensile
specimens revealed significant reduction in cross sectional area around the region of failure,
by necking, as shown in Figure 4.26.
4.6.1 Annealing the Timetal 125 style alloy Castings at 300oC
After annealing at 300oC for 20 minutes (Figure 4.30a), the alloy had far fewer precipitates and
a larger mean grain size than in the as-cast condition. The grain size increased rapidly up to 60
minutes, and marginally thereafter, and the amount of precipitates was significantly lower than
in the as-cast condition. When the heat treatment time was extended to 30 minutes, a fine phase
precipitated inside the grains. It was not possible to analyze the precipitates by EDX because
of their small size, so no distinction could be made between their composition and that of the
matrix.
Grain size results are listed in Table 4.14. Grain growth was not rapid during the first 5 minutes,
but this changed on extending to 20 minutes. The grain size increased by less than 2% in the
first 5 minutes, and this small change in grain size was suspected to have been due to the
competing precipitation reaction. However, there was more significant grain growth between
5 and 60 minutes. Very marginal growth was observed on extending time to 2 hours, as shown
in Table 4.14. The slower growth rate on extending to 2 hours was attributed to equilibration
of the microstructure, resulting in a loss in the driving force as the interfacial energy decreased
with increasing grain size.
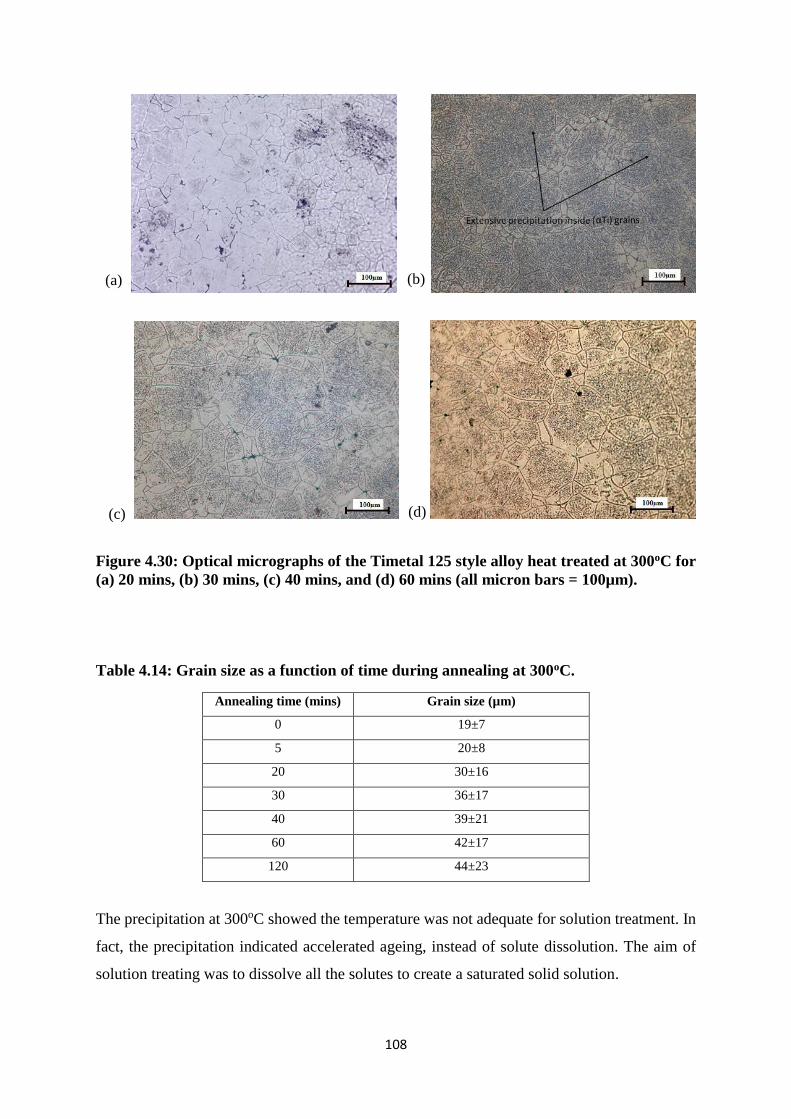
108
Figure 4.30: Optical micrographs of the Timetal 125 style alloy heat treated at 300oC for
(a) 20 mins, (b) 30 mins, (c) 40 mins, and (d) 60 mins (all micron bars = 100µm).
Table 4.14: Grain size as a function of time during annealing at 300oC.
Annealing time (mins) Grain size (µm)
0 19±7
5 20±8
20 30±16
30 36±17
40 39±21
60 42±17
120 44±23
The precipitation at 300oC showed the temperature was not adequate for solution treatment. In
fact, the precipitation indicated accelerated ageing, instead of solute dissolution. The aim of
solution treating was to dissolve all the solutes to create a saturated solid solution.
αTi) grains
(a) (b)
(c) (d)
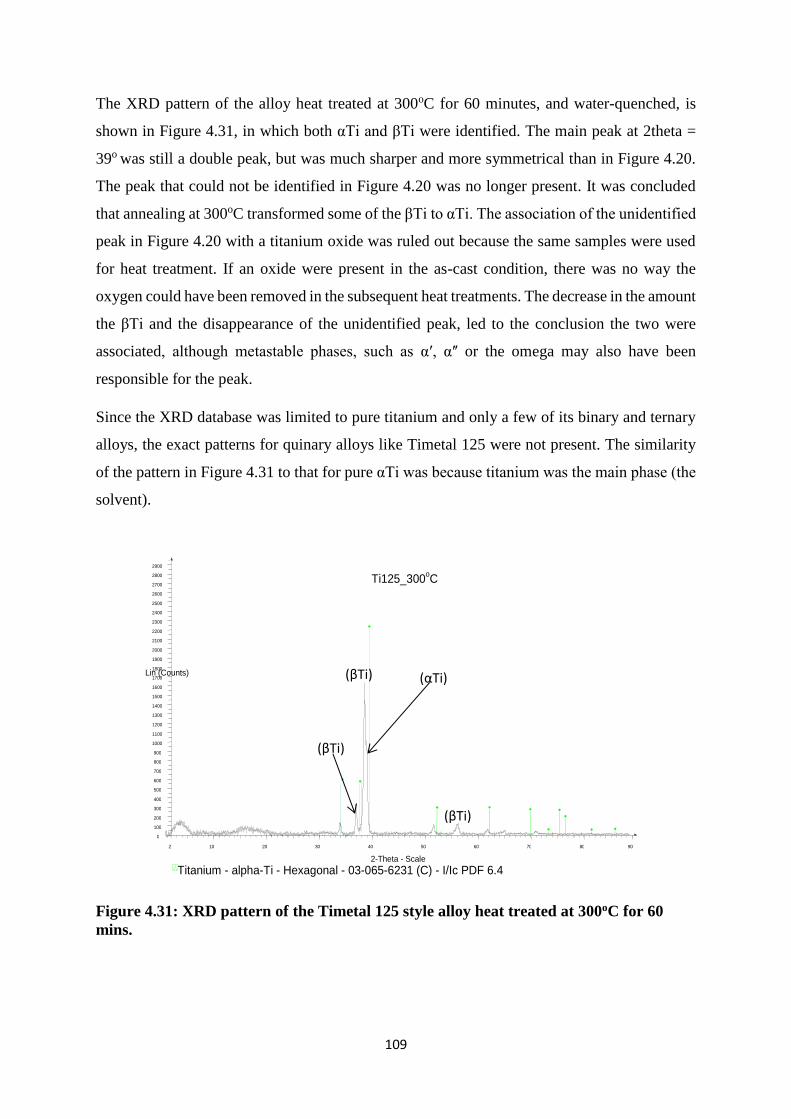
109
The XRD pattern of the alloy heat treated at 300oC for 60 minutes, and water-quenched, is
shown in Figure 4.31, in which both αTi and βTi were identified. The main peak at 2theta =
39o was still a double peak, but was much sharper and more symmetrical than in Figure 4.20.
The peak that could not be identified in Figure 4.20 was no longer present. It was concluded
that annealing at 300oC transformed some of the βTi to αTi. The association of the unidentified
peak in Figure 4.20 with a titanium oxide was ruled out because the same samples were used
for heat treatment. If an oxide were present in the as-cast condition, there was no way the
oxygen could have been removed in the subsequent heat treatments. The decrease in the amount
the βTi and the disappearance of the unidentified peak, led to the conclusion the two were
associated, although metastable phases, such as αʹ, αʺ or the omega may also have been
responsible for the peak.
Since the XRD database was limited to pure titanium and only a few of its binary and ternary
alloys, the exact patterns for quinary alloys like Timetal 125 were not present. The similarity
of the pattern in Figure 4.31 to that for pure αTi was because titanium was the main phase (the
solvent).
Figure 4.31: XRD pattern of the Timetal 125 style alloy heat treated at 300oC for 60
mins.
Titanium - alpha-Ti - Hexagonal - 03-065-6231 (C) - I/Ic PDF 6.4
Ti125_300oC
Lin (Counts)
0 100 200 300 400 500 600 700 800 900
1000 1100 1200 1300 1400 1500 1600 1700 1800 1900 2000 2100 2200 2300 2400 2500 2600 2700 2800 2900
2-Theta - Scale 2 10 20 30 40 50 60 70 80 90
(βTi)
(βTi)
(βTi)
(αTi)

110
After annealing at 300oC for 2 hours, the strength decreased to 1411±17MPa, while strain at
fracture increased to 4.2±0.2%. The hardness of the alloy was 480±13HV, which was similar
to the 495±15HV in the as-cast condition. The decrease in strength, and the corresponding
increase in ductility were attributed to dissolution of precipitates during the heat treatment, as
well as the increase in grain size.
4.6.2 Annealing the Timetal 125 style alloy at 400oC
Further grain growth was observed upon annealing the Timetal 125 style alloy at 400oC, as
shown in the optical micrographs in Figure 4.32. After annealing for 20 minutes, the grain size
was 42±21µm, which was approximately the same as after 2 hours at 300oC. The grain size
increased further and reached a plateau at 52±18µm after 60 minutes. Therefore, elevating
temperature marginally accelerated grain growth, and increased the mean grain size. However,
the microstructure was not different from that at 300oC. The precipitates were still present, but
they appeared to be more than at 300oC. The grain sizes after annealing at 400oC for the
different test periods are shown in Table 4.15. The grain size for the time recorded as 0 minutes
was for the alloy in the as-cast condition. Similar to at 300oC, grain growth was slow in the
first 5 minutes, probably due to some incubation, but rapid thereafter, before the grain size
reached a plateau.
Figure 4.32: Optical micrographs of the Timetal 125 style alloy heat treated at 400oC for
(a) 20 mins, and (b) 60 mins (micron bars =100µm).
(a) (b)
Analysed area (light phase)
Analysed area (precipitates)

111
Table 4.15: Grain size as a function of time during annealing at 400oC.
Annealing time (mins) Grain size (µm)
0 19±7
5 21±9
20 42±21
30 48±22
40 50±19
60 52±18
120 53±21
An attempt was made to measure the compositions of the light phase (matrix) and the
precipitates, and the results are shown in Table 4.16. They were similar because of the fine
sizes of the precipitates. The lack of compositional difference between the matrix and the
precipitates was likely due to the inability to separately analyse the phases due to the fineness
and distribution of the precipitates.
Table 4.16: EDX analyses of the light and dark contrast phases after annealing the
Timetal 125 style alloy at 400oC (wt%).
Element Matrix (light phase) Precipitates (Dark phase)
Ti 80.0±1.3 79.4±0.8
Al 2.7±0.6 2.6±0.5
Fe 5.3±0.3 6.0±0.4
Mo 5.9±0.5 6.1±0.5
V 6.1±0.4 5.9±0.5
The SEM micrograph from where the analyses in Table 4.16 were taken is given in Figure
4.33, which shows the fineness of the precipitates and how intimately they were mixed with
the matrix. Since the interaction volume of the electron beam and the sample can spread up to
2µm, and the beam can also penetrate the sample, the ability to separately analyse such fine
grains was questionable. Furthermore, the matrix had no grains without precipitates to be
separately analysed with precision. Therefore, the analyses in Table 4.16 are likely to have
included both the matrix and the precipitates, which explains the similarity in composition. The
microstructure had some dark regions, particularly at the triple points. These had a higher iron
content than the overall alloy composition, because EDX analysis showed their iron content
was 6.7±0.3wt%, compared to the overall 5.8±0.4wt%.

112
Figure 4.33: SEM-BSE image of the Timetal 125 style alloy after annealing at 400oC for
2 hours (micron bar = 50µm).
The strength and hardness of the alloy further decreased to 1373±11MPa and 454±8HV,
respectively, while strain at fracture increased to 5.1±0.3%. There was not much difference
with respect to the type and volume fraction of precipitates after annealing at 300oC and 400oC.
The notable difference was the larger grain size at 400oC. Therefore, the decrease in strength
and hardness, as well as the increase in ductility, were attributed to the larger grain size.
4.6.3 Annealing the Timetal 125 style alloy at 500oC
The microstructure after annealing at 500oC was similar to that at 400oC, except for a reduction
in the amount of the precipitates, as shown in the optical micrographs in Figure 4.34. The
number of grains without precipitates increased, but such grains were smaller than those that
still contained the precipitates. The average size of the grains did not significantly change on
elevating the temperature to 500oC. The mean grain size was 55±24µm after 20 minutes, and
61±25µm after 60 minutes, which were marginally larger than the mean grain sizes for samples
annealed at 400oC for 60 minutes. It was suspected that the dissolution of the precipitates was
a competing process which consumed some of the energy that could have been used for grain
growth. However, grain growth was rapid in the first 5 minutes, showing there was enough
energy to overcome incubation.
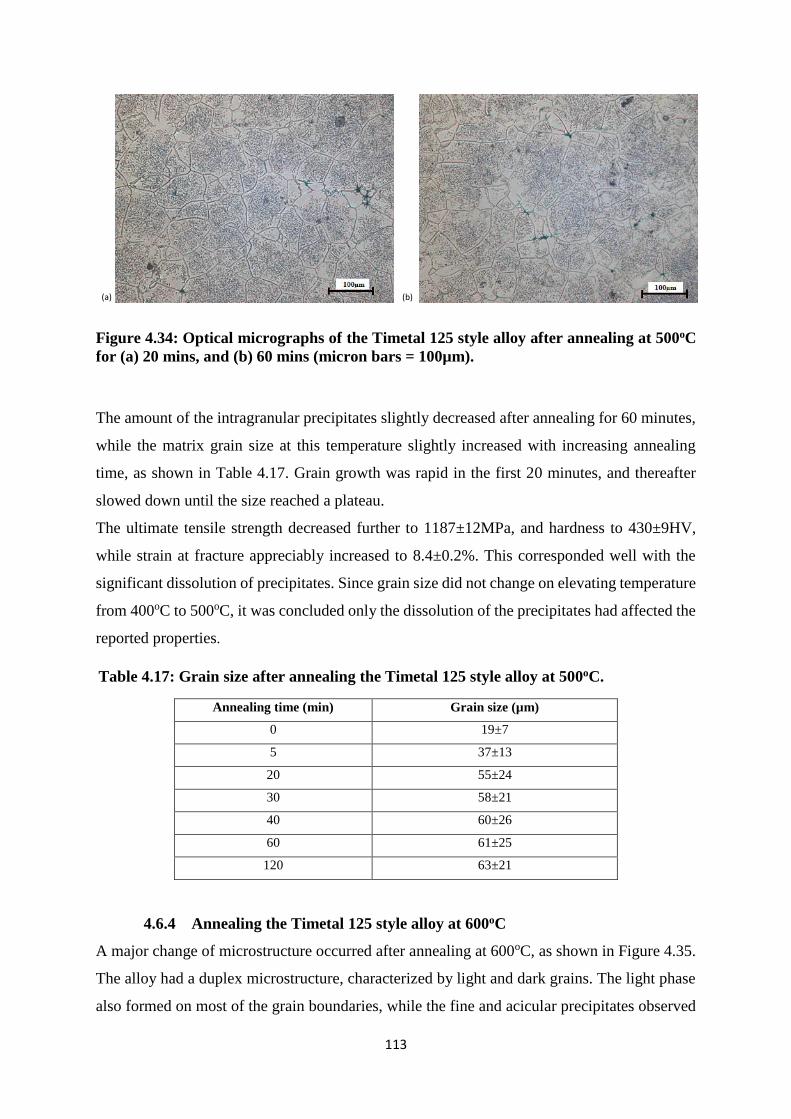
113
Figure 4.34: Optical micrographs of the Timetal 125 style alloy after annealing at 500oC
for (a) 20 mins, and (b) 60 mins (micron bars = 100µm).
The amount of the intragranular precipitates slightly decreased after annealing for 60 minutes,
while the matrix grain size at this temperature slightly increased with increasing annealing
time, as shown in Table 4.17. Grain growth was rapid in the first 20 minutes, and thereafter
slowed down until the size reached a plateau.
The ultimate tensile strength decreased further to 1187±12MPa, and hardness to 430±9HV,
while strain at fracture appreciably increased to 8.4±0.2%. This corresponded well with the
significant dissolution of precipitates. Since grain size did not change on elevating temperature
from 400oC to 500oC, it was concluded only the dissolution of the precipitates had affected the
reported properties.
Table 4.17: Grain size after annealing the Timetal 125 style alloy at 500oC.
Annealing time (min) Grain size (µm)
0 19±7
5 37±13
20 55±24
30 58±21
40 60±26
60 61±25
120 63±21
4.6.4 Annealing the Timetal 125 style alloy at 600oC
A major change of microstructure occurred after annealing at 600oC, as shown in Figure 4.35.
The alloy had a duplex microstructure, characterized by light and dark grains. The light phase
also formed on most of the grain boundaries, while the fine and acicular precipitates observed
(a) (b)

114
at lower annealing temperatures were no longer present. The mean grain size was much smaller
than at the lower annealing temperatures. After heat treating for 60 minutes, the average grain
size of βTi (the darker phase) increased from 22±18µm to 39±15µm.
Figure 4.35: Optical micrographs of the Timetal 125 style alloy heat treated at 600oC for
(a) 20 mins and (b) 60 mins (micron bars = 100µm).
Energy dispersive X-ray spectroscopy analysis of the two phases showed the darker was lean
in aluminium but rich in iron, molybdenum and vanadium, while the lighter was richer in
aluminium, as shown in Table 4.18. It was concluded that the relatively darker phase was βTi,
while the lighter was αTi. This strongly supported that the α-β transformation of Timetal 125
commenced at ~590oC, as was shown on the DTA scan in Figure 4.25.
Table 4.18: EDX analyses of the matrix and precipitates after annealing the Timetal 125
style alloy at 600oC (wt%).
Element Light αTi Dark βTi
Ti 80.0±0.3 79.1±0.2
Al 3.9±0.3 1.9±0.1
Fe 4.7±0.3 5.9±0.4
Mo 5.6±0.3 6.8±0.3
V 5.8±0.2 6.3±0.3
Although attempts to measure the elemental compositions of the acicular precipitates at lower
annealing temperatures were unsuccessful, it was inferred that they were αTi because of their
disappearance at a temperature associated with the onset of the α-β transformation.
The absence of the acicular precipitates inside the grains was clearer on the SEM micrograph
in Figure 4.36, where also the analyses in Table 4.18 were taken. The lighter phase had areas
large enough for accurate analysis without interference from the matrix. The parallel marks in
(a) (b)

115
the grain labeled 1 could have been due to scratching during sample preparation. The
composition of the grain was the same as the other dark grains.
Figure 4.36: SEM-SE image of the Timetal 125 style alloy after annealing at 600oC for 2
hours (micron bar =50µm).
While the grain growth generally increased with increasing temperatures at the lower annealing
temperatures, the grain size at 600oC was smaller. This was attributed to the partial
transformation of the αTi matrix to the βTi occurring at the expense of the prior αTi grains.
The XRD pattern after annealing at 600oC for 2 hours is shown in Figure 4.37. It showed αTi
and possibly omega titanium, although the matching was poor. However, the presence of
omega titanium (Ti8.86V1.14) was rejected based on the very small amount of vanadium in the
alloy. For the whole alloy to transform to full omega, about 15 wt% V would be required, yet
vanadium made only 6 wt% of the alloy. The αTi was a better match but with some shifts,
which was expected since the sample was not pure titanium, and there was solid solution.
Two low angle peaks could not be identified, and this underlined the inadequacy of the database
that was employed. However, the very pronounced broadening of these peaks compared to the
rest, as well as their occurrence at very low angles, suggested they may have been background
noise, probably due to the plasticene sample holder.
αTi

116
Figure 4.37: XRD pattern of the Timetal 125 style alloy annealed at 600oC for 2 hours,
followed by water-quenching (2 theta in decades).
Tensile test and hardness results showed both strength and hardness were lower than after
annealing at 500oC. The tensile strength was 978±10MPa, and hardness was marginally lower
at 419±11HV. However, strain at fracture increased to 9.7±0.3%, and this was also evident in
the test samples, which showed a significant reduction in area at the point of fracture. The
significant decrease in strength and the corresponding increase in strain were attributed to the
completely different microstructure, which was also precipitate-free.
4.6.5 Annealing the Timetal 125 style alloy at 700oC
After heat treating at 700oC, the microstructure of the alloy was still duplex and very similar to
that at 600oC, except for larger mean grain size of the (βTi), as shown in Figure 4.38. However,
a few of the light grains were actually larger than at 600oC. The mean grain size of the lighter
phase diminished on elevating to 700oC. However, similar to 600oC, the light phase was still
mainly present on all the grain boundaries, and the mean grain size of the lighter contrast phase
further decreased to 33±14µm.
Titanium Vanadium - omega-Ti8.86V1.14 - Hexagonal - 03-065-5702 Titanium - alpha-Ti - Hexagonal - 03-065-6231
Ti125 600oC 2 hours
Lin
(C
ounts
)
0
100
200
300
400
500
2-Theta - Scale 2 1 2 3 4 5 6 7 8 9
Unidentified peaks
βTi βTi
βTi

117
Figure 4.38: Optical micrograph of the Timetal 125 style alloy heat treated at 700oC for
60 mins (micron bar = 100µm).
The composition of the two phases, determined by EDX, showed a slightly elevated amount of
aluminium in the lighter phase, almost 50% higher than the same phase at 600oC. The darker
phase had a composition very similar to the dark phase at 600oC, as shown in Table 4.19. The
increased amount of aluminium in the remaining αTi was attributed to the limited solubility of
aluminium in (βTi) (Duerig and Williams, 1984).
Table 4.19: EDX analyses of the matrix and precipitates after annealing the Timetal 125
style alloy at 700oC (wt%).
Element Light αTi darker βTi
Ti 77.1±0.3 79.1±0.2
Al 5.5±0.3 2.1±0.1
Fe 5.7±0.4 5.8±0.1
Mo 5.9±0.3 6.5±0.5
V 5.8±0.2 6.3±0.3
The SEM micrograph from where the analyses in Table 4.19 were taken is shown in Figure
4.39. The lighter phase was thinner than after annealing at 600oC for the same time period,
probably due to decomposition, but there were still areas large enough for accurate analyses
without interacting with the matrix.

118
Figure 4.39: SEM-SE image of the Timetal 125 style alloy after annealing at 700oC for 2
hours (micron bar =100µm).
Tensile tests gave an ultimate strength of 879±11MPa after annealing at 700oC for 2 hours,
which was almost similar to the strength after annealing at 600oC for the same time period. The
strain at fracture was 10.4±0.6%, which was also not significantly different from that at 600oC.
Hardness results were also similar to those obtained at 600oC. The hardness of the alloy after
annealing at 700oC for 2 hours was 413±9HV. The very marginal changes of these properties
between 600oC and 700oC were concomitant with the small change in microstructure in the
temperature interval.
4.6.6 Annealing the Timetal 125 style alloy at 800oC
Except for the grain boundaries, the αTi completely transformed on annealing at 800oC, and a
homogeneous βTi was the matrix, as shown in Figure 4.40. However, the grains had some dark
spots, which could not be separately analysed due to their size. The grain size increased from
37±14µm at 700oC to 56±24µm after 20 minutes at 800oC. However, there was very limited
isothermal grain growth as time increased, probably showing that the available energy was
utilised for the transformation of the lighter phase. After 60 minutes the mean grain size was
very similar to at 20 minutes, at 58±26µm.
The lighter α phase defined the grain boundaries of the βTi matrix, and it was easier to view
the pores after annealing at this temperature, although the reason for the sudden clarity was not

119
clear. Clearly, the alloy had porosity from the time of casting, as the pores could not have
formed during annealing.
Figure 4.40: Optical micrographs of the Timetal 125 style alloy heat treated at 800oC for
(a) 20 mins, and (b) 60 mins (micron bars =100µm).
The significant decrease of αTi on heat treating the alloy at 800oC gave the most direct support
to the interpretation of the DTA scan in Figure 4.25. It supported that the peak at 800oC on
cooling was the beta transus of the Timetal 125 style alloy. This was corroborated by the XRD
pattern after quenching from 800oC, shown in Figure 4.41, which showed only βTi, and a wide
peak which could not be identified. It was concluded that above 800oC, the alloy was mostly
single phase βTi, and that it was duplex from 800oC to room temperature, with both αTi and
βTi. However, the αTi precipitates were still present on the grain boundaries, even after 2 hours.
This probably suggested the alloy had to be heat treated for longer to ensure complete
transformation.
The closest match to the XRD pattern in Figure 4.41 was βTi, although the fitting was not
perfect due to it comprising a solid solution, rather than pure titanium. The broad peak around
15o 2theta had been observed in the XRD pattern after annealing at 600oC, in Figure 4.34.
However, when compared to Figure 4.37, the XRD pattern was significantly different. There
main peak was around 2theta = 40o, while many of the lower intensity peaks in Figure 4.37
were no longer present, except for the broad peak around 2theta = 18o, which could have been
due to the amorphous sample holder. The higher angle peaks associated with beta titanium
were also present.
(a) (b)

120
Figure 4.41: XRD pattern of the alloy in the after heat treatment at 800oC for 2 hours
showing (βTi).
Tensile test results showed a significant decrease in strength, and increase in strain at fracture
after heat treating at 800oC. The tensile strength was 844±16MPa, and strain at fracture was
13.2±0.7%. The strength was lower than at all the lower annealing temperatures, while this was
the highest ductility for the same temperature interval. Hardness decreased from 413±9HV at
700oC, to 389±11HV. The decrease in strength and hardness, as well as the increase in ductility,
were attributed to further dissolution of the precipitates, as shown in Figure 4.40.
Since the matrix was now a single phase, measurement of grain size became more accurate and
reliable. The mean grain size was still smaller than at the lower heat treatment temperatures, as
shown in Table 4.20. The small grain size was attributed to plenty nuclei offered by the prior
αTi grains and precipitates.
Titanium - beta - Ti -
Cubic
_ Ti - 125 - 900 o C 2
I
0 100 200 300 400 500 600 700 800 900
1000 1100 1200 1300 1400 1500 1600 1700 1800 1900 2000 2100 2200 2300
2 - Theta - Scale 2 10 20 30 40 50 60 70 80 90
Unidentified peak
(βTi)
(βTi) (βTi)

121
Table 4.20: Grain size of the Timetal 125 style alloy after annealing at 800oC.
Annealing time (min)
Grain size (µm)
0 19±7
20 52±22
30 56±19
40 59±23
60 61±19
120 66±22
4.6.7 Solution Treatment of the Timetal 125 style alloy at 900oC
Annealing at 900oC for 2 hours resulted in a microstructure similar to that at 800oC, but the
difference in contrast between the grain boundaries and the matrix was less pronounced, as
shown in Figure 4.42. This decrease in contrast was attributed to further transformation of the
α to β, resulting in a more homogeneous composition.
Figure 4.42: Optical micrograph of the Timetal 125 style alloy heat treated at 900oC for
2 hours (micron bar = 100µm).
Due to the fine size of the grain boundaries, particularly when observed under SEM in Figure
4.43, it was not possible to separately analyse them. However, it was clear that most of the αTi
had transformed to βTi, except on the grain boundaries. This was further support that the beta
transus of the samples was ~800oC on cooling. The incomplete transformation probably
showed the alloy needed to be annealed for a longer period to equilibrate.

122
Figure 4.43: SEM-SE micrograph of the Timetal 125 style alloy after annealing at 900oC
for 2 hours (micron bar =100µm).
The grains were generally equiaxed, with a mean grain size of 40±16µm. The grain size was
smaller than after ageing at 800oC for 2 hours, and the reason for this decrease in the mean
grain size after the temperature was elevated by as much as 100oC was not immediately clear.
The alloy was still porous after heat treatment at this temperature, as shown in Figures 4.42
and 4.43.
The XRD pattern of the Timetal 125 style alloy after annealing at 900oC is shown in Figure
4.44, in which the peaks were sharper and narrower than in the as-cast condition, or after
annealing at 800oC, although some shift was still present. The sharper peaks were attributed to
the more homogeneous microstructure, while their symmetry was attributed to the dissolution
of precipitates. The broad peaks which were suspected to be noise in Figure 4.37 and 4.40 were
no longer present, but a sharp peak which could not be identified appeared at 26o 2theta. The
same peak was present in the XRD pattern of the as-cast alloy in Figure 4.20, in which it could
also not be identified.

123
Figure 4.44: XRD pattern of the Timetal 125 style alloy after annealing at 900oC for 2
hours.
4.7 Properties of the Solution Treated Timetal 125 style alloy
The alloys were deemed to be solution-treated after annealing at 900oC for 2 hours, followed
by water quenching. The stress-strain curve of solution-treated alloy is shown in Figure 4.45.
The alloy was ductile, and had its lowest strength in this state. Visual inspection of the broken
samples showed significant necking, and a comparison of the gauge thicknesses showed
30±5% reduction in area at fracture. Heat treatment at the various temperatures improved
ductility, but at the expense of strength and hardness, Table 4.21.
Table 4.21: Variation of UTS, strain and hardness of the Timetal 125 style alloy with
annealing temperature.
Temperature (oC) UTS (MPa) Strain (%) Hardness (HV)
As-cast 1476±11 3.1±0.2 495±8
300 1411±12 4.2±0.4 480±9
400 1373±11 5.1±0.3 454±8
500 1187±12 8.4±0.2 430±9
600 978±10 9.7±0.3 419±11
700 879±11 10.4±0.6 413±9
800 844±13 13.2±0.6 389±11
900 769±13 15.7±0.6 375±7
The tensile strength and strain at fracture of the Timetal 125 style alloy after solution treatment
were 769±13MPa and 15.7±0.6%, respectively. Hardness was also substantially lower than
Titanium - beta-Ti - Cubic
X13_09_TiMetal_125_900oC-2 hours
Lin
(C
ounts
)
0
1000
2000
3000
2-Theta - Scale 2 10 20 30 40 50 60 70 80 90

124
after annealing at the lower test temperatures. The microhardness results for the overall sample
gave a hardness of 375±7HV, which was similar to at 800oC, but much lower than for the lower
annealing temperatures.
The decrease in strength and hardness, as well as the increase in strain at fracture, were
attributed to the absence of precipitates and secondary phases after annealing at 900oC, and
hence lack of precipitation hardening. Since the increase in ductility far outweighed the loss in
strength, the fracture toughness of the alloy increased.
Figure 4.45: Stress-strain curve of the Timetal 125 style alloy after heat treatment at
900oC followed by water quenching.
Heat treating lower than 800oC resulted in a microstructure characterized by precipitates, as
was shown in the micrographs of the alloys annealed at the lower temperatures. Complete
solutionization only occurred between 800oC and 900oC. Since 800oC was below the
transformation temperature, it did not guarantee a single phase. Therefore, a higher temperature
was necessary to ensure a fully (βTi) microstructure. The choice of 900oC was purely because
the increments in test temperature were 100oC, otherwise the optimum was in this temperature
interval.

125
4.8 Solution Treatment and Ageing (STA) of the Timetal 125 style alloy
After keeping the solution-treated alloys for ~5 hours, fine precipitates formed inside the (βTi)
grains, as shown in Figure 4.46, although this was probably due to surface oxidation and etch
effects. Their size was too small for analysis by EDX, and they were homogeneously
distributed in the matrix, which made analysis of the matrix unreliable. However, there were a
few areas where the volume of the precipitates was high enough to allow analysis by EDX.
There were no grains without precipitates, so only the overall composition was measured, and
compared to the composition of the precipitates, to derive a difference. The grain size after 72
h was 43+21µm, which was the same as in the solution-treated state.
Figure 4.46: Optical micrographs of the Timetal 125 style alloy after solution treatment
at 900oC for 60 minutes followed by natural ageing for (a) 5 hours and (b) 72 hours
(micron bars = 100µm).
The EDX results in Table 4.21 showed the precipitates were higher in aluminium compared to
the overall composition. The precipitates were αTi, or possibly α΄ or α΄΄ from transformed β,
formed from the partial decomposition of the βTi phase. The matrix had equiaxed grains, with
approximately the same size as the mean grain size after solution treatment.
Table 4.22: EDX analysis of the phases in Timetal 125 (wt%).
Phase Ti Al Fe Mo V
Matrix 79.7±0.9 2.6±0.2 5.7±0.3 6.0±0.2 6.0±0.1
Precipitates 79.0±1.1 3.7±0.3 5.8±0.3 6.0±0.3 6.1±0.1
The SEM micrograph from where the analyses in Table 4.21 were taken is shown in Figure
4.47. Although the precipitates were small, and their separate analysis unreliable, there were
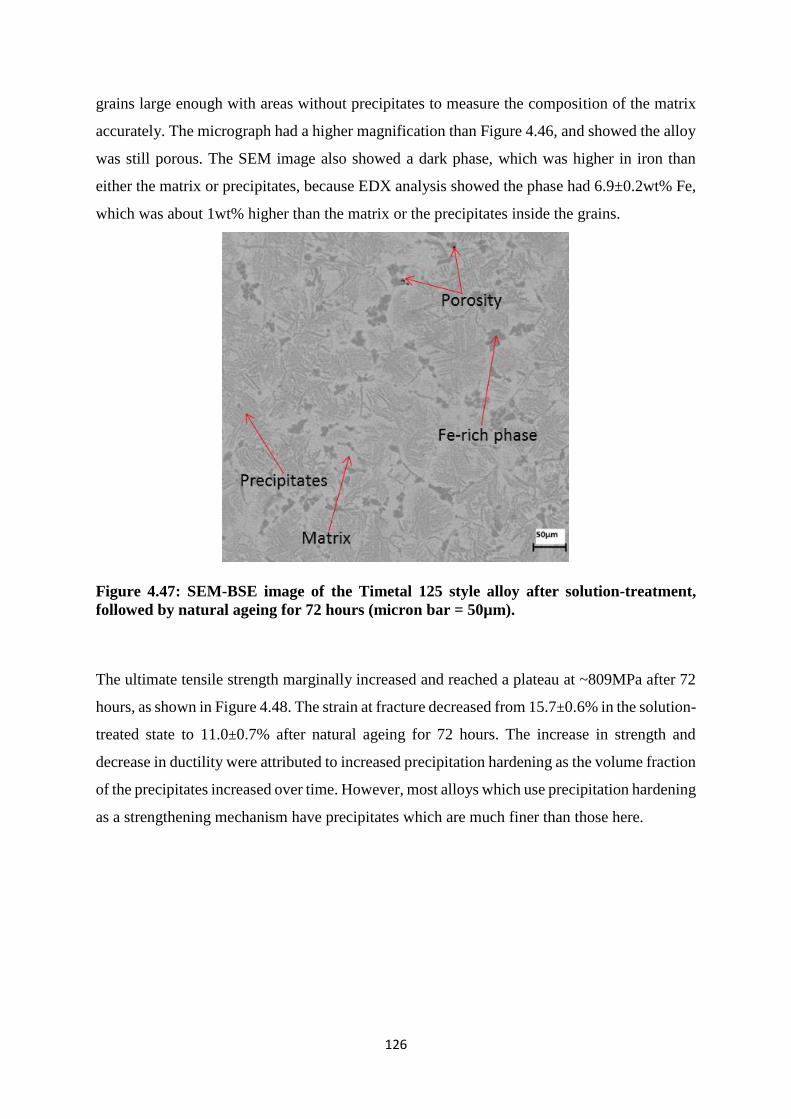
126
grains large enough with areas without precipitates to measure the composition of the matrix
accurately. The micrograph had a higher magnification than Figure 4.46, and showed the alloy
was still porous. The SEM image also showed a dark phase, which was higher in iron than
either the matrix or precipitates, because EDX analysis showed the phase had 6.9±0.2wt% Fe,
which was about 1wt% higher than the matrix or the precipitates inside the grains.
Figure 4.47: SEM-BSE image of the Timetal 125 style alloy after solution-treatment,
followed by natural ageing for 72 hours (micron bar = 50µm).
The ultimate tensile strength marginally increased and reached a plateau at ~809MPa after 72
hours, as shown in Figure 4.48. The strain at fracture decreased from 15.7±0.6% in the solution-
treated state to 11.0±0.7% after natural ageing for 72 hours. The increase in strength and
decrease in ductility were attributed to increased precipitation hardening as the volume fraction
of the precipitates increased over time. However, most alloys which use precipitation hardening
as a strengthening mechanism have precipitates which are much finer than those here.

127
Figure 4.48: Variation of the ultimate tensile strength of the Timetal 125 style alloy with
time at after solution treatment at 900oC.
Hardness showed a similar trend, and the increase was also marginal. When the solution-treated
Timetal 125 style alloy was subsequently artificially aged at various temperatures, grain size
generally increased with increasing ageing temperature and time. From about 500oC,
precipitation also occurred along the grain boundaries, and the precipitates coarsened, while
many of the grains became free of precipitates. Thus, it was easier to measure their elemental
compositions.
4.8.1 Ageing the Timetal 125 style alloy at 400oC
The microstructure after ageing at 400oC is shown in Figure 4.49, in which the most distinct
feature was the allotriomorphic precipitates along the grain boundaries, which also extended
into the grains. There were also some precipitates inside the grains, although they were much
smaller than those along the grain boundaries. The mean grain size after ageing at this
temperature was significant, showing increasing temperature greatly improved the kinetics of
grain growth. Unlike the grains in the naturally aged alloy, there were many grains which had
areas without precipitates. The areas void of precipitates were analyzed by EDX, and their
composition was the alloy composition, Ti.2.7Al5.7Fe6Mo6V (wt%). However, it was not
possible to analyze the precipitates separately because of their small size.

128
The microstructure still contained equiaxed grains, with most triple points at ~120o. The alloy
was still porous, although the volume fraction of the pores was smaller than after annealing.
This was supported by the higher density of the samples (99.6±0.2%), which was significantly
higher than the densities in the annealed state.
Figure 4.49: Optical micrographs of Timetal 125 after solution treatment at 900oC,
followed by artificial ageing at 400oC for (a) 20 mins., and (b) 60 mins (micron bars =
100µm).
The grain size after 20 minutes was 45±17µm, which was about the same as in the solution-
treated state. The lack of grain growth was attributed to the precipitation in this time period, as
shown in Figure 4.48(a). The size marginally increased to 48±22µm when time was increased
to 40 minutes, but no further growth was observed beyond this, as shown in Table 4.23. The
lack of growth was attributed to a loss in driving force as the interfacial energy decreased with
increasing grain size. Also, the precipitation of the αTi precipitates was a competing process.
The grain size corresponding 0 minutes was for the alloy immediately after solution-treatment.
Table 4.23: Grain size of the (βTi) matrix during ageing the Timetal 125 style alloy at
400oC.
Soaking time (minutes) Grain size (μm)
0 40±16
20 45±17
40 48±22
60 49±18
120 50±21
Allotriomorphic (αTi) on (βTi) grain boundary
(a) (b)

129
Figure 4.50 is a higher magnification optical micrograph after ageing the solution treated
Timetal 125 style alloy at 400oC for 2 hours. It clearly showed the acicular precipitates, as well
as grains which had regions near the grain boundaries without precipitates. The alloy annealed
for 2 hours appeared to have less precipitates within the grains. This was attributed to
coarsening, which was particularly evident along the grain boundaries, where some
allotriomorphs were present.
Figure 4.50: Optical micrograph of the Timetal 125 style alloy after Solution treatment
at 900oC and artificial ageing at 400oC for 2 hours (micron bar = 20µm).
The strength of Timetal 125 after ageing at 400oC for 60 minutes was 1153±21MPa, while
strain at fracture decreased to 8.9±0.4%. The hardness of the overall sample was 429±8HV,
which was much higher than for the solution-treated alloy. The increase in strength and
hardness, as well as the corresponding decrease in strain, was attributed to age hardening due
to increased precipitation of the secondary αTi.
4.8.2 Ageing the Timetal 125 style alloy at 500oC
Metallography showed the microstructure of Timetal 125 after ageing at 500oC was similar to
after ageing at 400oC, at least with respect to the phases present. After ageing for 20 minutes,
the acicular precipitates appeared inside the βTi grains. There were precipitates along the grain
boundaries, together with some allotriomorphic precipitates. Compared to the microstructure
after ageing at 400oC for 60 minutes in Figure 4.51, where the precipitates were fine; after only
20 minutes at 500oC the precipitates had coarsened. The same coarsening happened at 400oC,

130
but after extending the ageing to 2 hours. Therefore, elevating to 500oC accelerated the
formation of the acicular precipitates, and their coarsening into allotriomorphic αTi. In terms
of the phases present, no change was noticed between the two temperatures, suggesting that
the two temperatures marked the same two-phase field.
Figure 4.51: Optical micrographs of Timetal 125 after solution treatment at 900oC for 60
minutes followed by artificial ageing at 500oC for (a) 20 mins, and (b) 60 mins (micron
bars = 100µm).
On extending the ageing to 60 minutes, the volume fraction of the acicular precipitates and
grain size increased, while the precipitates along the grain boundaries coarsened into
allotriomorphic precipitates, as shown in Figure 4.51(b). The apparent increase in the
precipitation was attributed to further decomposition of the metastable βTi into αTi. The spread
in grain size after ageing was large, as shown in Table 4.24. The grain size reached a plateau
at 55±20μm after 40 minutes, which was slightly larger than the average grain size at 400oC.
The very marginal grain growth as temperature was increased was attributed to the competing
precipitation reaction, and resistance to grain boundary mobility due to the increasing
precipitates.
Table 4.24: Grain size after solution treating at 900oC and ageing at 500oC.
Soaking Time (mins) Grain size (μm)
0 40±16
20 50±19
30 53±22
40 55±20
60 56±21
120 57±26
(a) (b)

131
Figure 4.52 is a high magnification optical micrograph after ageing for 2 hours at 500oC, and
it shows the allotriomorphic αTi, as well as the acicular precipitates within the βTi grains. It
was possible to separately analyze the matrix and the allotriomorphic phase by EDX, but not
the acicular precipitates, as shown in Table 4.25.
Figure 4.52: Optical micrograph of the Timetal 125 style alloy after solution treatment at
900oC for 60 minutes followed by artificial ageing for at 500oC for 2 hours (micron bar =
100µm).
Table 4.25: EDX analyses of the matrix and the allotriomorphic precipitates.
Phase Ti Al Fe Mo V
Matrix 79.5±0.4 2.6±0.2 5.7±0.3 6.2±0.2 6.0±0.1
Precipitates 78.9±0.1 5.9±0.4 4.2±0.3 5.1±0.3 5.9±0.1
The SEM image from where the analyses in Table 4.25 were taken is shown in Figure 4.53.
The acicular precipitates inside the grains were not easy to observe, but were suspected to be
the dark spots inside the matrix. The dark and light phases were distinct and large enough to
allow for separate analysis. The allotriomorphic precipitates were richer in aluminium, and
lower in the other solute elements, and this was further confirmation that they were αTi, while
the matrix was βTi. The higher magnification SEM image also showed the coarsening of the
αTi along the grain boundaries.
Acicular precipitates
(αTi) from coalescence
(βTi)

132
Figure 4.53: SEM-SE image of the Timetal 125 style alloy after ageing at 500oC for 2
hours (micron bar = 50µm).
The Timetal 125 style alloy attained its highest strength (1285MPa) after ageing at 500oC for
60 minutes, while elongation at fracture was at its lowest, at 6.3±0.2%. Hardness of the alloy
was also highest after ageing at this temperature. The microhardness analysis gave an average
value of 497±6HV for the matrix, and 370±9HV for the precipitates along the grain boundaries.
This was the highest hardness recorded for the matrix. The hardness of the allotriomorphs was
similar to lower temperatures, and lower than the matrix. This was further support that the
lighter phase was αTi. Attempts to age for longer periods at 500oC resulted in a gradual
decrease in strength, which was attributed to over-ageing. Extended ageing time, as well as
ageing higher than 500oC, resulted in the coarsening of the αTi precipitates.
4.8.3 Ageing the Timetal 125 style alloy at 600oC
Partial dissolution of the precipitates inside the grains occurred when the alloy was aged at
600oC, resulting in some grains which did not contain precipitates, as shown in Figure 4.54.
The precipitates along the grain boundaries were thinner than after ageing at 500oC. It was
suspected the αTi was dissolving into the βTi matrix.
Many of the βTi grains became precipitate-free, but all the grain boundaries still contained the
αTi precipitates. The dissolution of the αTi precipitates was attributed to the α-β
transformation, which was supported by the DTA scan in Figure 4.25. EDX analyses of the
allotriomorphic phase showed an even higher aluminium content than at 500oC, and this
(βTi)
(αTi)
Porosity

133
showed aluminium was retained in the residual αTi during the transformation, while the other
solute elements partitioned to beta.
Figure 4.54: Optical micrographs the Timetal 125 style alloy after solution treatment at
900oC, followed by ageing at 600oC for 2 hours (micron bar = 100µm).
There was a small increase in the mean grain size when temperature was increased from 500oC
to 600oC. However, similar to the observations at 500oC, the grain size did not change
significantly with increasing ageing time. Also, the change in grain size between 500oC and
600oC was very small. The grain size was 58±26µm after ageing for 2 hours at 500oC, while it
was 67±24µm at 600oC for the same period. Therefore, the increase in grain size was very
marginal, and this probably showed the phase transformation in this temperature range was
competing with grain growth. The grain size reached a plateau after ~40 minutes, just like at
the lower ageing temperatures, as shown in Table 4.26.
Table 4.26: Grain size of the Timetal 125 style alloy after STA at 900oC and 600oC.
Soaking Time (minutes) Grain size (μm)
0 40±16
20 55±21
30 59±23
40 62±34
60 65±21
120 66±24

134
The coarsening of the precipitates inside the grains for ageing times beyond 40 minutes at
600oC was an indication of over-ageing, although most alloys with precipitation hardening
have much finer precipitates than seen here. This was in agreement with the loss in tensile
strength and hardness upon increasing the ageing temperature from 500 to 600oC. The tensile
strength fell from its peak of 1285±23MPa at 500oC to 1249±19MPa after ageing at 600oC for
60 minutes, as shown in Figure 4.55. However, compared to all the other lower ageing
temperatures, the tensile strength was higher. The elongation at fracture increased from
6.3±0.2% at 500oC to 7.6±0.2% after ageing at 600oC for 60 minutes.
Figure 4.55: Variation of ultimate tensile strength of the Timetal 125 style alloy with
ageing temperature after soaking for 60 minutes.
4.8.4 Ageing the Timetal 125 style alloy at 700oC
The average size of the acicular precipitates and the thickness of the precipitates along the grain
boundaries decreased after ageing for 700oC, even for as short as 20 minutes, as shown in
Figure 4.56, and the grains were mainly equiaxed.
There was no appreciable change in grain size on increasing temperature from 600oC to 700oC,
and even on increasing the ageing time at 700oC. The grain size for samples that were aged for
1 hour was 49±14µm, which was actually smaller than 67±24µm after 2 hours at 600oC. There
was a small reduction in the amount of both the acicular and allotriomorphic precipitates

135
compared to after ageing at 600oC. The decrease in the mean grain size was attributed to βTi
nucleating on the many prior αTi grains.
Figure 4.56: Optical micrograph of the Timetal 125 style alloy after solution treatment,
followed by ageing at 700oC for (a) 20 mins and (b) 60 mins (micron bar =100µm).
Tensile test results showed ultimate tensile strength and strain at fracture for alloys aged at
700oC for 60 minutes were 1099±17MPa and 9.4±0.3% respectively. This was a decrease from
the strength that was recorded at 600oC, and an increase in the strain at fracture. Hardness
measurements gave a mean of 445±17HV, which was also lower than at 600oC. The softening
of the alloy, as shown by the decrease in strength and hardness, was further support that it was
over-aged.
4.8.5 Ageing the Timetal 125 style alloy at 800oC
The optical micrographs after ageing at 800oC for 20 and 60 minutes are shown in Figure 4.57.
The microstructure was similar to after solution treatment at 900oC, shown in Figure 4.42.
However, the phase that precipitated along the grain boundaries was still present. The single
phase microstructure supported that the beta transus of the alloy was ~800oC, and showed both
the acicular and grain boundary precipitates were αTi.
Tensile test results showed the ultimate strength was 793±36MPa, while the strain at fracture
was 14.1±0.4%. The values were very similar to when the alloy was solution treated. The
hardness was 389±8HV, which was also close to the hardness after solution treatment. The
density of the alloy after ageing at this temperature for 60 minutes was 99.6±0.3%, which was
also similar to the solution-treated state, and significantly higher than at all the other ageing
temperatures.
(a) (b)

136
Figure 4.57: Optical micrographs of the Timetal 125 style alloy after ageing at 800oC for
(a) 20 minutes and (b) 60 minutes (micron bar = 100µm).
4.9 Thermodynamic modelling
The phase assemblage of, as well as the partitioning of the solute elements in, Timetal 125 was
modeled by Thermo Calc. The alloy composition was fixed to that of Timetal 125, while
pressure was invariant at 1 atm. The basis of the modeling was a mathematical description of
the Gibbs energy of all the composition permutations at different temperatures, to establish the
phases which had the elements at their lowest chemical potential. Temperature-phase
proportion (T-x) plots were then intrinsically generated, and compared with experimental data.
This was important, since the development and interpretation of quinary phase diagrams are
not trivial. Similar to phase diagrams, T-x plots are also equilibrium thermodynamic diagrams,
and hence their predictions may not always be the same as experimental observations.
4.9.1 Phase compositions of Timetal 125
The calculated phase composition of Timetal 125 at different temperatures is shown in the
Thermo-Calc temperature-phase proportion plot in Figure 4.58. The calculation showed four
phases to be thermodynamically stable in Timetal 125, the melting point at ~1540oC. αTi and
βTi, as well as liquid titanium, were calculated to be stable. The TIM-B2 phases refer to the
ordered compounds TiFe, TiMo or TiV (Yang et al., 2012), and were also shown to be stable,
but at much lower temperatures and in smaller quantities. At ~500oC, the proportions were
calculated to be ~56wt% βTi, 43wt% αTi, and 1wt% intermetallic phases.
(a) (b)

137
Figure 4.58: Thermo-Calc temperature-phase proportion plot of the phase composition
of Timetal 125 using the titanium alloy database V3 (TTTI3).
The calculation showed the alloy to be completely liquid for temperatures above ~1650oC,
below which the first solid was βTi. The mass fraction of the βTi was calculated to increase
with decreasing temperature, down to ~1540oC where the alloy was completely beta. The phase
was calculated to lie between ~1540oC and 670oC, where the first αTi appeared. Therefore, the
calculation determined the beta transus of Timetal 125 to be ~670oC. On cooling further, the
mass fraction of the αTi was shown to increase, while TiAl was calculated to be stable below
~510oC. All the temperature-phase proportion diagrams were calculated down to about 600oC,
since the data below this would have been less accurate. The βTi would be expected to decrease
with temperature, until there was only αTi (extrapolated to be roughly 0-100oC from the
diagram).
The compositions of titanium in the liquid, βTi and αTi are shown in Figure 4.59. When
completely liquid, the alloy was calculated to have the alloy composition, with 79.6 wt%
titanium and the solute elements as the balance. Upon solidification, the first βTi was calculated
to contain a slightly elevated amount of titanium, showing the last liquid to solidify contained

138
an elevated amount of some of the alloying elements. Below 1540oC, the solute elements were
shown to homogenise in the βTi, resulting in the phase having the alloy composition.
Figure 4.59: Titanium in the liquid, βTi and αTi phase calculated by Themo-Calc using
the titanium alloy database V3 (TTTI3).
Below 670oC, the calculation showed the formation of the first αTi, containing ~95wt% Ti.
The amount of titanium in the βTi was calculated to decrease with decreasing temperature, with
most of the alloying elements remaining in the βTi during the transformation. This showed a
lower solubility of the solutes in αTi.
4.9.2 Solute partitioning in Timetal 125
The chemical composition of the phases was calculated to continuously change from 670oC
down to room temperature, as shown in Figure 4.60. The first βTi to solidify was calculated to
be rich in molybdenum, and lean in iron. The calculation showed a similar vanadium
composition for the liquid and the βTi, i.e. a similar solubility of the element in the two phases.
This phase had ~9.5wt% Mo, 2.5wt% Fe, 3.0wt% Al, 6wt% V, with the balance as titanium.
According to the calculation, this composition would to persist down to ~1600oC, as shown in
Figure 4.60, where the mass fraction of the βTi was calculated to be ~30% according to Figure

139
4.58. Below 1600oC, the amount of molybdenum and aluminium in the forming βTi decreased,
while iron increased. On cooling to ~1540oC, the overall composition of the βTi was calculated
to be the same as the alloy composition.
Figure 4.60: Solute partitioning in βTi during equilibrium cooling of Timetal 125
calculated by Thermo-Calc using the titanium alloy database V3 (TTTI3).
No further changes in composition were calculated, down to ~670oC where the first αTi was
calculated to form. The first αTi to form was calculated to be richer in aluminium, and not to
contain much of the other alloying elements. Figure 4.60 shows a rapid decrease in aluminium,
and rapid increases in molybdenum, iron and vanadium in the βTi for temperatures lower than
670oC. This showed the solubility of aluminium was much higher in (αTi), while that of the
other solute elements was calculated to be much lower.

140
Figure 4.61: Composition of hcp Ti as function of temperature, calculated by Thermo-
Calc for the Timetal 125 composition using the titanium alloy database V3 (TTTI3).
The composition of αTi calculated by Thermo-Calc is shown in Figure 4.61. The compositions
calculated above 670oC were regarded as irrelevant, since Figure 4.58 had calculated the beta
phase as the only stable one. The first αTi was calculated to have the composition 4.5wt% Al,
0.1wt% Fe, 1.0wt% V, 0.5wt% Mo, with the balance as titanium. This supported the lower
solubility of all the solute elements, except aluminium, in αTi.
The high solubility of aluminium in αTi was also calculated in the Thermo-Calc temperature-
phase proportion plot in Figure 4.62. It was calculated the melt would have unlimited solubility
of all the solutes, hence would have the alloy composition down to ~1540oC, where the first
solid would form. The first βTi to precipitate was calculated to contain ~3.5wt% Al, but the
aluminium content was shown to rapidly decrease to 2.7wt% as the temperature decreased.
Between 1540oC and 670oC, where the alloy was calculated to be single-phase, the aluminium
concentration would remain at 2.7wt%. Below the transus, the calculation showed the first αTi
to contain ~4.5wt% Al, while the aluminium content of the remaining βTi was shown to

141
continuously decrease. The calculation showed the solubility of aluminium was higher in the
solid than the liquid phase, as shown by the rapid decrease of aluminium content in the liquid
upon the nucleation of the βTi.
Figure 4.62: Partitioning of aluminium during equilibrium cooling of Timetal 125
calculated by Thermo-Calc using the titanium alloy database V3 (TTTI3).
The behaviour of iron was calculated to be the complete opposite, as shown in Figure 4.63.
When completely molten, the iron content was shown to be same as the alloy composition, but
the first solid to nucleate was calculated to be lower in iron than the melt. This showed the last
liquid to solidify would be much higher in iron than the first, or the βTi.
The βTi progressively became richer in iron with decreasing temperature, until the alloy was
completely solid, where the iron content of the single βTi phase reached the alloy composition,
i.e. 5.7wt% Fe. Below the transus, the untransformed βTi was richer in iron, probably due to
rejection of the iron from the precipitating αTi. The first αTi was calculated to contain ~1.0wt%
Fe, as shown in Figures 4.61 and 4.63. This showed iron had a very limited solubility in hcp

142
titanium. Extrapolation of Figure 4.63 showed the iron content in the βTi would continue to
increase until complete transformation to αTi.
Figure 4.63: Partitioning of iron during equilibrium cooling of Timetal 125 calculated by
Thermo-Calc using the titanium alloy database V3 (TTTI3).
Molybdenum was calculated to have a similar behaviour to iron, as shown in Figure 4.64. The
first βTi to nucleate from the liquid was shown to contain ~9.5wt% Mo, while the last liquid
was calculated to have less than 3wt% Mo. This showed a higher solubility of molybdenum in
the βTi than the liquid phase. The molybdenum content of the βTi was calculated to
progressively decrease with decreasing temperature, as the leaner melt solidified, down to
~1540oC where the overall composition was calculated to be the same as the alloy composition,
i.e. 6wt% Mo.

143
Figure 4.64: Partitioning of molybdenum during equilibrium cooling of Timetal 125
calculated by Thermo-Calc using the titanium alloy database V3 (TTTI3).
Below the transus, the αTi phase was calculated to reject molybdenum to the untransformed
beta, resulting in a high concentration of molybdenum in the last βTi to transform. The
molybdenum content of the αTi was calculated to be ~0.5wt% between 600oC and 500oC, while
the untransformed βTi could contain almost 10wt% Mo. The ordered compound TiMo was
shown to be stable for temperatures lower than 600oC (shown as phase 4 in Figure 4.64).
The calculation showed a very similar solubility of vanadium in the liquid and βTi, as shown
in Figure 4.65. The first βTi was calculated to have the same vanadium concentration as the
liquid, and the vanadium concentration in the βTi was shown not to change, down to the
transus.

144
Figure 4.65: Partitioning of vanadium during equilibrium cooling of Timetal 125
calculated by Thermo-Calc using the titanium alloy database V3 (TTTI3).
The first αTi was calculated to be low in vanadium, with a content of ~1.0wt%, while the
vanadium concentration in the untransformed βTi was calculated to increase up to 10wt% as
the temperature further decreased from the transus. Extrapolation to lower temperatures
showed the concentration of vanadium in αTi would eventually be the same as the alloy
composition upon complete transformation. However, unlike iron and molybdenum, the level
of segregation of vanadium in both αTi and βTi was calculated to be much lower. The phase
compositions of Timetal 125 calculated by the Thermo-Calc during solidification are shown in
Table 4.27.

145
Table 4.27: Phase composition of Timetal 125 calculated by Thermo Calc (wt%).
Temperature (oC) Phase 1 Phase 2 Phase 3
>1540 Liquid (Ti2.7Al5.7Fe6Mo6V) - -
670-1540 (βTi)
(Ti2.7Al5.7Fe6Mo6V)
- -
670 (βTi)
(Ti2.5Al5.8Fe6.2Mo6.2V)
(αTi)
(Ti4.6Al0.1Fe0.5Mo1.0V)
-
600 (βTi)
(Ti2.3Al7Fe7Mo6.7V)
(αTi)
(Ti4.5Al0.1Fe0.5Mo1.0V)
TixFe1-x
TixMo1-x
TixV1-x

146
5.Chapter 5 DISCUSSION
5.1 Thermal analysis of the Elemental and Blended Powders
The thermal behaviour of the elemental powders, except vanadium, could be readily related to
their known thermal properties. The endothermic peak on the DTA scan for the titanium
powder in Figure 4.3 was attributed to its allotropic transformation, shown in Equation 5.1.
𝛂𝐓𝐢 + 𝛃𝐓𝐢 ↔ 𝛃𝐓𝐢 Equation 5.1
McQuillan (1949), through metallographic analysis, showed ultrapure titanium changed from
hcp to bcc at 882oC. Chureemart and Pinsook (2006) attributed the allotropic transformation to
a sudden rapid increase in the anharmonic vibrational entropy of the hcp structure at this
temperature. The beta transus is very sensitive to impurity levels (Ogden and Jaffee, 1955; Guo
et al., 2005), and Ogden and Jaffee (1955) found that even minute quantities of interstitials,
particularly oxygen and nitrogen, have a profound effect on the transus, so that 0.1wt% O can
alter it by 40oC. The transformation temperature in Figure 4.3 was slightly lower than reported
by McQuillan (1949). The difference may be due to the amount of interstitials in the source
powder, compared to McQuillan (1949) and Ogden and Jaffee (1955). Additionally, the method
used to determine the transus in the present work was different from the methods used by the
earlier researchers, which relied on metallography (McQuillan, 1949; Ogden and Jaffee, 1952;
Wells, 1962).
More recent techniques of determining the transus, such as dilatometry, thermal analysis and
resistivity measurements are accurate, but their precision normally depends on heating rate
(Gridner et al., 1985). Using resistivity measurements, Markovsky and Semiatin (2009)
determined the beta transus of CP titanium to be ~880oC at a heating rate of 2oC.min-1, but
~960oC when the rate was increased to 400oC.min-1. Normally, peaks appear at higher
temperatures due to rapid heating. The transus in Figure 4.3 was lower than of McQuillan
(1949), suggesting the heating was not too rapid. The lower value may have been due to the
extra low interstitial content of the source powder, Table 4.1. However, the absolute error with
the present work was only 1%, showing good agreement with the earlier researchers.
The DTA scan for the aluminium powder in Figure 4.4 showed a single endothermic peak at
659oC on heating, and an exothermic one at 642oC on cooling. Davis (1808) reported that
aluminium is not allotropic, and determined its melting point to be 660.3oC. The solidification
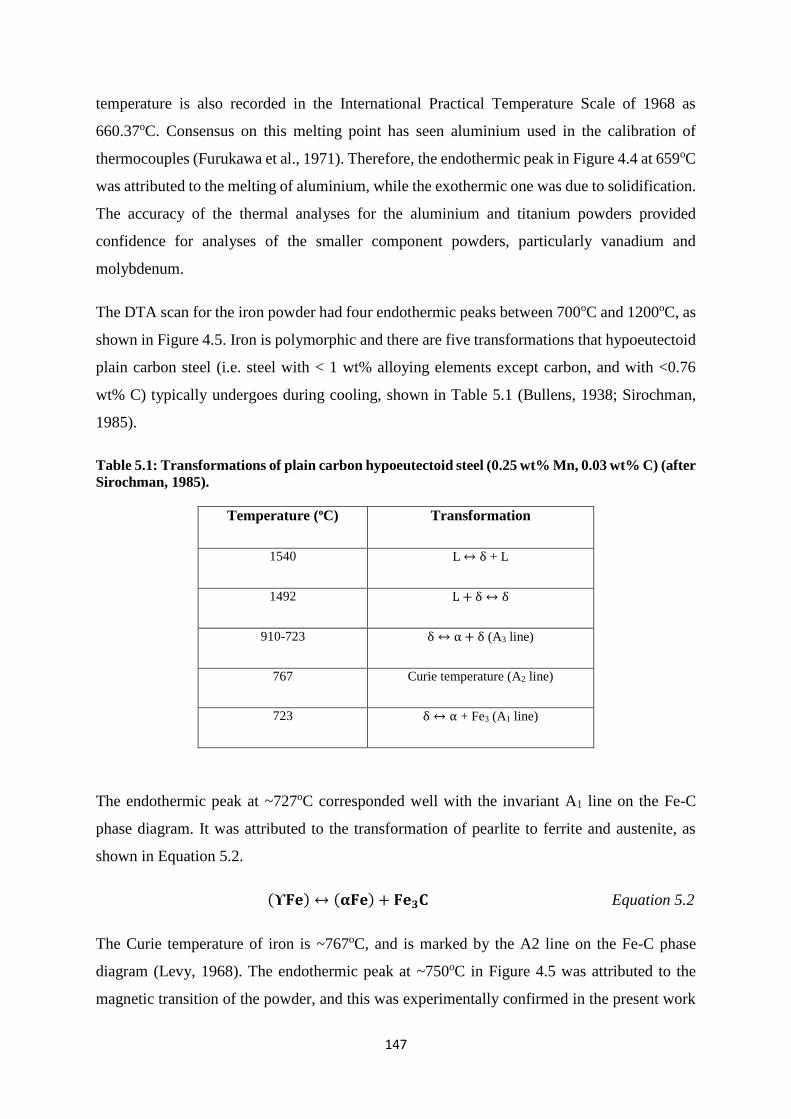
147
temperature is also recorded in the International Practical Temperature Scale of 1968 as
660.37oC. Consensus on this melting point has seen aluminium used in the calibration of
thermocouples (Furukawa et al., 1971). Therefore, the endothermic peak in Figure 4.4 at 659oC
was attributed to the melting of aluminium, while the exothermic one was due to solidification.
The accuracy of the thermal analyses for the aluminium and titanium powders provided
confidence for analyses of the smaller component powders, particularly vanadium and
molybdenum.
The DTA scan for the iron powder had four endothermic peaks between 700oC and 1200oC, as
shown in Figure 4.5. Iron is polymorphic and there are five transformations that hypoeutectoid
plain carbon steel (i.e. steel with < 1 wt% alloying elements except carbon, and with <0.76
wt% C) typically undergoes during cooling, shown in Table 5.1 (Bullens, 1938; Sirochman,
1985).
Table 5.1: Transformations of plain carbon hypoeutectoid steel (0.25 wt% Mn, 0.03 wt% C) (after
Sirochman, 1985).
Temperature (oC) Transformation
1540 L ↔ δ + L
1492 L + δ ↔ δ
910-723 δ ↔ α + δ (A3 line)
767 Curie temperature (A2 line)
723 δ ↔ α + Fe3 (A1 line)
The endothermic peak at ~727oC corresponded well with the invariant A1 line on the Fe-C
phase diagram. It was attributed to the transformation of pearlite to ferrite and austenite, as
shown in Equation 5.2.
(ϒ𝐅𝐞) ↔ (𝛂𝐅𝐞) + 𝐅𝐞𝟑𝐂 Equation 5.2
The Curie temperature of iron is ~767oC, and is marked by the A2 line on the Fe-C phase
diagram (Levy, 1968). The endothermic peak at ~750oC in Figure 4.5 was attributed to the
magnetic transition of the powder, and this was experimentally confirmed in the present work
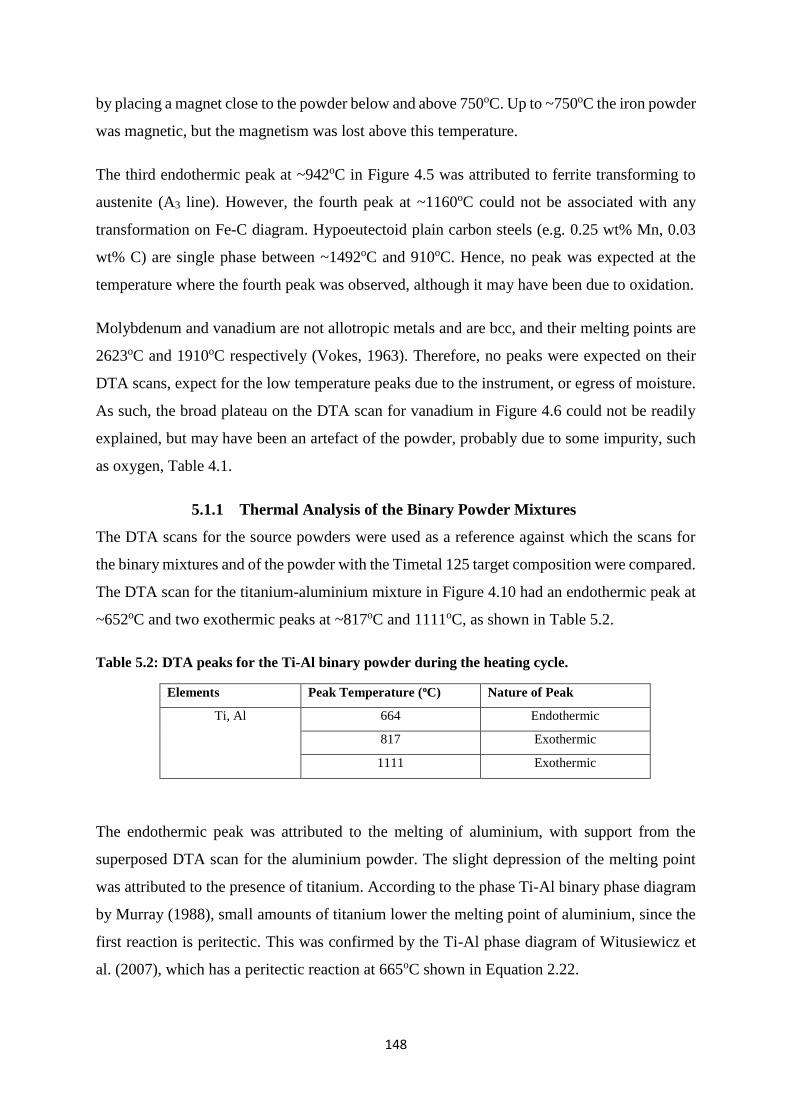
148
by placing a magnet close to the powder below and above 750oC. Up to ~750oC the iron powder
was magnetic, but the magnetism was lost above this temperature.
The third endothermic peak at ~942oC in Figure 4.5 was attributed to ferrite transforming to
austenite (A3 line). However, the fourth peak at ~1160oC could not be associated with any
transformation on Fe-C diagram. Hypoeutectoid plain carbon steels (e.g. 0.25 wt% Mn, 0.03
wt% C) are single phase between ~1492oC and 910oC. Hence, no peak was expected at the
temperature where the fourth peak was observed, although it may have been due to oxidation.
Molybdenum and vanadium are not allotropic metals and are bcc, and their melting points are
2623oC and 1910oC respectively (Vokes, 1963). Therefore, no peaks were expected on their
DTA scans, expect for the low temperature peaks due to the instrument, or egress of moisture.
As such, the broad plateau on the DTA scan for vanadium in Figure 4.6 could not be readily
explained, but may have been an artefact of the powder, probably due to some impurity, such
as oxygen, Table 4.1.
5.1.1 Thermal Analysis of the Binary Powder Mixtures
The DTA scans for the source powders were used as a reference against which the scans for
the binary mixtures and of the powder with the Timetal 125 target composition were compared.
The DTA scan for the titanium-aluminium mixture in Figure 4.10 had an endothermic peak at
~652oC and two exothermic peaks at ~817oC and 1111oC, as shown in Table 5.2.
Table 5.2: DTA peaks for the Ti-Al binary powder during the heating cycle.
Elements Peak Temperature (oC) Nature of Peak
Ti, Al 664 Endothermic
817 Exothermic
1111 Exothermic
The endothermic peak was attributed to the melting of aluminium, with support from the
superposed DTA scan for the aluminium powder. The slight depression of the melting point
was attributed to the presence of titanium. According to the phase Ti-Al binary phase diagram
by Murray (1988), small amounts of titanium lower the melting point of aluminium, since the
first reaction is peritectic. This was confirmed by the Ti-Al phase diagram of Witusiewicz et
al. (2007), which has a peritectic reaction at 665oC shown in Equation 2.22.

149
The absence of heat flow peaks below 652oC did not preclude the possibility of the two metals
partially forming solid solution. Hume Rothery (1935) showed the formation of solid solution
was associated with a very low enthalpy of mixing. Therefore, it is possible that part of the
aluminium may have dissolved in titanium before aluminium melted. Manchot and Richter
(1907) showed very limited solubility of titanium in aluminium (< 0.2 wt% Ti), while Duwez
(1951), Ogden (1951) and Witusiewicz (2007) showed up to 26 wt% Al can dissolve in
titanium at 1200oC. The Ti-Al phase diagrams by Shull et al. (1985), Murray (1989), and even
the disputed ones by Bumps et al. (1951) and Ogden et al. (1952) agree on the high solubility
of aluminium in αTi, particularly below 800oC. So, although the first peak appeared at 652oC,
it is possible some dissolution of aluminium may have already occurred.
The exothermic peaks in Figure 4.10 were unique to the Ti-Al mixture. The first, at 817oC was
attributed to the enthalpy of mixing the two metals, and the energy release showed the Ti-Al
bond is stronger than the average Ti-Ti or Al-Al bond (Hume-Rothery, 1935). According to
Hume-Rothery (1935), when the bond between two metals is stronger than the average bonds
of either metal, an intermetallic compound is normally formed, as this yields the lowest
possible energy state of the system.
Jong and Yong (1995) performed differential thermal analysis on a titanium-aluminium
mixture while undertaking “self-propagating high temperature synthesis of Ti-Al”. Their DTA
scan was similar to Figure 4.10, and they attributed the exothermic peak at 820oC to the
formation of TiAl3, and that at 1111oC to the formation of Ti3Al and TiAl. All the phase
diagrams are unanimous on the formation of titanium aluminides, but none has a transformation
around ~817oC (Bumps et al., 1952; Ogden et al., 1951; Shull et al., 1985; Murray, 1988; Brann
and Ellner, 2001; Batalu, 2006). However, there was agreement with the peritectic reaction,
Equation 2.23, at 809oC by Witusiewiscz et al. (2007).
The phase diagram by Shull et al. (1985) has a eutectoid reaction at ~1111oC, while Murray
(1988) has the same at 1125oC. The reaction is shown in Equation 5.3. The present work agreed
with the work of both Shull et al. (1985) and Jong and Yong (1995) with respect to a
transformation around 1111oC. On the currently accepted Ti-Al phase diagram by
Witusiewiscz (2007), the eutectoid reaction, Equation 5.3, occurred at 1119oC, which is in
agreement with the present work.

150
(𝛂𝐓𝐢) ↔ 𝐓𝐢𝟑𝐀𝐥 + 𝐓𝐢𝐀𝐥 Equation 5.3
The Ti-Al intermetallic compound was termed (𝛿Ti) by Bumps et al. (1952), while Ti3Al was
named 𝛼2 by Sagel (1956). The two phases feature in all the available Ti-Al phase diagrams,
but with little agreement on how they are formed, or their phase boundaries (Kubaschewski
and Goldberg, 1983). However, the most recent re-evaluation of the Ti-Al binary by
Witusiewiscz et al. (2007) sets the α + β phase field between 1119oC and 1160oC.
The endothermic peak associated with the beta transus was not on the DTA scan of the Ti-Al
powder in Figure 4.10. This was due to at least one of the following. Firstly, aluminium elevates
the transus to higher temperatures (McQuillan 1949; Hansen et al., 1951). Secondly, at ~64
at.% Al, there was enough aluminium to convert all the titanium to intermetallic compounds,
so there was no free 𝛼Ti to undergo the polymorphic transformation.
The titanium-iron DTA scan in Figure 4.11 had unique endothermic peaks at ~598oC and
~1300oC, while the endothermic peaks at 725oC and 746oC were also on the scan of the
elemental iron powder, as shown in Table 5.3.
Table 5.3: DTA peaks for the Ti-Fe binary powder during the heating cycle.
Elements Peak Temperature (oC) Nature of Peak
Ti, Fe 598 Endothermic
725 Endothermic
746 Endothermic
1140 Endothermic
1300 Endothermic
The presence of these peaks showed there was unreacted iron in the mixture, at least up to
746oC. The scan for the mixture had a broad endothermic peak at approximately the same
temperature as in Figure 4.3, which was attributed to the beta transus, since there was excess
titanium (46 at.% Fe).
The Ti-Fe phase diagram by Murray (1981) has a eutectoid at 598oC, which agreed with the
endothermic peak at 598oC in Figure 4.11. Novakova et al. (1998) reported a peak at the same
temperature in a study of solid solutions from mechanical alloying of TiFe, and attributed it to
the eutectoid reaction in Equation 5.4.

151
(𝛃𝐓𝐢) ↔ (𝛂𝐓𝐢) + 𝐓𝐢 𝐅𝐞 Equation 5.4
The endothermic peak at ~1140oC in Figure 4.11 was also unique to the mixture, and the closest
transformation it could be associated with was the eutectic reaction on the Ti-Fe phase diagram
by Murray (1981), although the large temperature difference made it questionable. Wang and
Fu (2008) reported an endothermic peak at 1146oC in a study of T-Fe-C composites, and
attributed it to the eutectic reaction between remnant carbon and iron. However, it is unlikely
that the peak at 1140oC in Figure 4.11 was due to the same reaction, since there was no carbon
in the powder.
The Fe-Ti phase diagram by Murray (1992) in Figure 5.1, and that by Hirokai (2000) have a
eutectic reaction at 1289oC. The Ti-Fe DTA scan in Figure 4.11 had an endothermic peak at
1296oC, which agreed with the eutectic reaction in the two phase diagrams. The peak was thus
associated with the reaction in Equation 5.5.
𝐋 ↔ (𝛂𝐓𝐢) + 𝐓𝐢𝐅𝐞 Equation 5.5
Figure 5.1: Ti-Fe binary phase diagram (Murray, 1992).
For titanium and vanadium, the DTA scan was flat with small endothermic peaks at ~330oC
and 870oC, as well as an exothermic one at ~587oC, as shown in Table 5.4.

152
Table 5.4: DTA peaks for the Ti-V binary powder during the heating cycle.
Elements Peak Temperature (oC) Nature of Peak
Ti, V 330 Endothermic
587 Exothermic
870 Endothermic
The 330oC peak was unique to the mixture. Guo et al. (2005) modelled the beta transus using
Equation 5.6. They also experimentally determined the beta transus of several titanium alloys.
𝛃𝐭𝐫 = 𝟖𝟖𝟐𝐨𝐂 + 𝟐𝟏. 𝟏 [𝐀𝐥]𝐞𝐪 – 𝟗. 𝟓 [𝐌𝐨]𝐞𝐪 Equation 5.6
where 𝛽tr is transus temperature in oC, [Al]eq and [Mo]eq are the aluminium and molybdenum
equivalence of the alloy respectively. The calculated results were mainly in good agreement
with their experimental data (Guo et al., 2005). The beta transus of the 50 wt% Ti-V binary
alloy was calculated to be 310oC using the same equation. This was in good agreement with
the 330oC endothermic peak in Figure 4.12. Thus, the peak was attributed to the monotectoid
reaction in Equation 5.7.
(𝛃𝐓𝐢, 𝐕) ↔ (𝛂𝐓𝐢) + (𝐕) Equation 5.7
However, the Ti-V phase diagrams by Hansen et al. (1951), Rhodes and Williams (1970) and
Murray (1989) have the monotectoid reaction ~675oC, and that by Saunders (1990) does not
have such a transformation. In agreement with Saunders (1990), the latest assessed Ti-V phase
diagram by Kostov et al. (2006) does not have the monotectoid reaction. Kostov et al. (2006)
argued that experimenting with the Ti-V system is difficult due to the high reactivity of both
titanium and vanadium at elevated temperatures, and questioned the purity of the materials
used in earlier work.
The exothermic peak at 587oC in Figure 4.12 could not be associated with any transformation
on the Ti-V phase diagrams. It was suspected to be the broad plateau on the scan of the source
vanadium powder, shifted and was less intense due to the presence of titanium. Although closer
to the monotectoid temperatures on the phase diagrams by Hansen et al. (1951), Rhodes and
Williams (1970) and Murray (1989), the peak was exothermic, although from the transus peak
in Figure 4.3 the αTi to βTi transformation of titanium was endothermic. So, the peak could
not have been due to the polymorphic transformation of titanium. The small endothermic peak
at ~870oC was due to excess αTi transforming to (βTi), since for a 50 wt% Ti composition,
there was excess Ti.
153
The peak associated with the transus at 310oC showed vanadium is a strong beta-stabilizer,
since it significantly lowered the transus. Below this temperature, titanium was hcp and thus
different from the vanadium’s bcc structure, and this difference in crystal structure gave the
large enthalpy of mixing (Hume-Rothery, 1935; Muzotini, 2010). The Regular Solution Model
by Hume-Rothery (1935) posits two metals can form a solid solution, characterized by an
almost zero enthalpy of mixing, if they have the same crystal structure, similar valence and
their atomic size difference is less than 15%. In Timetal 125 all the elements have similar
valence and size; hence, the only major factor that determines their solubility in titanium is
crystal structure.
Above the monotectoid temperature, titanium and vanadium had the same crystal structure, i.e.
bcc (Smirnov and Finkel, 1966). This explains why no peaks, other than the vanadium plateau
and the transus peak were observed on the DTA scan. This was also in agreement with the
Thermo-Calc modelling in Figure 4.65, which showed only solid solution above the beta
transus.
The Ti-Mo DTA scan had similar characteristics to the Ti-V scan. The beta transus of the binary
powder was calculated as ~410oC using Equation 5.6. This was in agreement with the
endothermic peak at ~419oC in Figure 4.13. Thus, the peak was attributed to the monotectoid
reaction in Equation 2.23. However, this did not agree with the phase diagrams by Hoch and
Viswanathan (1951) or Murray (1981), which show the same transformation at 695oC, as
shown in Figure 2.23. The close agreement between the α-β transformation temperature in the
current work and the modelling by Guo et al. (2005) and the disparity with the established
phase diagrams cannot be readily explained. However, the monotectoid temperatures on the
Ti-V and Ti-Mo phase diagrams are for 21 wt% V (Rhodes and Williams, 1975; Murray, 1981),
and 22 wt% Mo (Murray, 1989). The binary powders contained 50wt% solute and this may
have caused the further depression of the transus in both cases.
The Ti-Mo DTA scan had a small endothermic peak at ~870oC which was due to the allotropic
transformation of αTi to βTi, since at 50 wt% Mo the powder had excess titanium. Other than
these peaks, the scan was flat above the monotectoid temperature. This is also in agreement
with the criteria for extended solid solutions by Hume-Rothery (1935). Above the monotectoid
temperature, titanium and molybdenum are both bcc and, regardless of temperature, they have
similar valence, electronegativity and atomic size (Pauling, 1932; Sminorv and Frankel, 1966).

154
For the aluminium and iron binary powder, a sharp exothermic peak was observed at ~1150oC
in Figure 4.14. Kostov et al. (2006) calculated the enthalpy of mixing of aluminium and iron
at various temperatures, and showed aluminium and iron have a strong negative deviation from
Raoult’s behaviour at high temperature. They argued this was mainly due to the different
crystal structures and the Al-Fe bond is much stronger than the average Al-Al and Fe-Fe bonds.
The assessed Al-Fe phase diagram by Sundman et al. (2009) has a series of Al-Fe intermetallic
compounds, which directly supports the calculation by Kostov et al. (2006).
The Al-Fe DTA scan in Figure 4.14 had the aluminium melting peak, and the A1 and A2 peaks
were preserved. This showed the two metals did not react until 1160oC. A similar scan was
produced by Stein and Martin (2007). The present results and those by Stein and Martin (2007)
did not agree with the Hume-Rothery (1935) criteria for extended solid solution formation.
Aluminium has an fcc crystal structure in its crystalline state, while iron is bcc below 910oC,
above which it transforms to fcc. If the Hume-Rothery criteria were universally correct, the
two metals should have reacted below 910oC, where their crystal structures are different.
Additionally, there should have not been a peak at 1160oC, since the two shared the same
crystal structure at that temperature. So, although the Hume-Rothery criteria appear to work
for many systems, they did not work here, but this might have been due to the scan rate being
too fast to allow the equilibrium reaction. From CALPHAD modelling of the Al-Fe system by
Seierstein (1998) and Du et al. (2008), a number of invariant reactions were calculated between
1150oC and 1161oC, Table 5.5. Pinpointing the exact reaction responsible for the exothermic
peak in Figure 4.41 would require complementary tests. It is possible that the rest of peaks for
the reactions in Table 5.5 may have been masked by the high intensity of the exothermic peak
in Figure 4.14.
The DTA scan for the Al-V mixture in Figure 4.15 had the aluminium melting peak and two
unique exothermic peaks at 733oC and 967oC, and did not have the broad plateau associated
with pure vanadium in this study. However, the intensity of the aluminium melting peak was
not proportional to the amount of dilution. This, together with the absence of the vanadium
broad peak, showed the two metals interacted at a lower temperature. This was consistent with
the Al-V binary phase diagram by Murray (1989), which shows very limited solubility of
vanadium in aluminium and a series of fine intermetallic compounds. However, the Al-V phase
diagram shows vanadium can accommodate up to ~48 at.% Al at ~1700oC (Murray, 1989).

155
Table 5.5: CALPHAD modelling of the invariant reactions in the Al-Fe binary system
(Seierstein, 1998 and Du et al., 2008).
Reaction temperature from CALPHAD modelling (oC)
Invariant reactions Seierstein (1998) Du et al. (2008)
L + FeAl ↔ Fe5Al8 1222 1222
L ↔ Fe2Al5 1161 1158
L ↔ Fe5Al8 + Fe2Al5 1157 1155
L + Fe2Al5 ↔ Fe4Al13 1151 1155
Fe5Al8 + Fe2Al5 ↔ FeAl2 1155 1153
Fe5Al8 ↔ FeAl + FeAl2 1095 1094
L ↔ Fe4Al13 + (Al) 654 654
The Al-Al bond energy is 264±0.4 kJ.mol-1, V-V is 269±0.1 kJ.mol-1 and Al-V is 147±1 kJ.mol-
1 (Luo, 2007). Thus, it is not favourable to form the Al-V bonds at low temperatures, and this
explains the flat DTA scan, up to the melting of aluminium. However, the exothermic peak at
733oC shows the Al-V bond is much stronger than the average Al-Al or V-V bonds at the
temperature, which makes the formation of Al-V intermetallic compounds favourable.
Kostov et al. (2006) calculated the Al-V binary using FACTSAGE and their phase diagram
concurs with the thermodynamic calculations by Kubaschewski and Heymer (1960) and with
the high temperature calorimetry results by Neckel and Nowotny (1968). They all showed
strong negative deviation from Raoultian behaviour, showing good solubility, and a tendency
to form intermetallic compounds.
The DTA scan for the Al-Mo powder showed a highly exothermic peak at ~790oC and a much
smaller exothermic one at 733oC, as shown in Figure 4.16. The highly exothermic peak was
attributed to the enthalpy of mixing, and showed an even stronger negative deviation from ideal
Raoultian behaviour. The aluminium melting peak was preserved and its intensity was
proportional to the dilution. This showed very minimal interaction between the two metals, at
least up to ~733oC. The Al-Mo bond strength could not be found in the literature, but the Mo-
Mo bond strength is reported to be ~435±2 kJ.mol-1 (Luo et al., 2010). The Al-Mo phase
diagram by Saunders (1997) shows virtually no solubility of molybdenum in aluminium and
less than 5 wt% Al in molybdenum at 1400oC. Furthermore, it shows a series of Al-Mo
intermetallic compounds. The tendency to form intermetallic compounds conformed to the
156
predictions by Hume-Rothery (1935), since the two metals have different crystal structures and
electronegativities. The Al-Mo phase diagram by Saunders (1997) has a peritectic reaction at
735oC, which is close to the exothermic peak at ~733oC in Figure 4.16. Therefore, the peak
was attributed to the reaction given by Equations 5.8. The exothermic peak at 790oC was not
associated with any transformation on the Al-Mo phase diagram, and was attributed to the
enthalpy of mixing.
𝐋 + 𝐀𝐥𝟒𝐌𝐨 ↔ 𝐀𝐥𝟏𝟐𝐌𝐨 Equation 5.8
The DTA scans for Fe-V and Fe-Mo binary powders in Figures 4.17 and 4.18 respectively
showed iron had a tendency to form solid solutions with vanadium and molybdenum. The DTA
scans were a summation of the individual scans, without peaks associated with the interaction
of iron with either metal. This showed their enthalpies of mixing were very small, and indicated
a propensity to form solid solutions. The Fe-V binary phase diagram by Raghavan (1994) also
supports the mutual solubility of the two. Iron, vanadium and molybdenum have similar atomic
sizes and share the same bcc crystal structure up to ~723oC, where ferrite transforms to
austenite.
Similar behaviour was observed with molybdenum and vanadium, as shown in Figure 4.19.
The flat scan showed the two metals formed an ideal solid solution. The two metals exist with
a bcc crystal structure throughout their solid state. Furthermore, their atomic sizes and
electronegativities are very similar (Pauling, 1932), as shown in Table 5.6. Therefore, the Mo-
V bond strength should be very similar to the average Mo-Mo and V-V bond energies.
The knowledge gained from the DTA scans of the source and binary powders made it possible
to interpret the DTA scan for the powder with the Timetal 125 target composition in Figure
4.9. The endothermic peak at 659oC was attributed to the melting of aluminium, with support
from the DTA scan for pure aluminium in Figure 4.4. Thus, aluminium did not react with any
of the metals up to this temperature.
The exothermic peak at 668oC was unique to the mixture, and may have been due to a reaction
of aluminium with titanium or molybdenum, since the DTA scans for Al-Ti and Al-Mo had
exothermic peaks around the same temperature. However, it was clear that aluminium was
involved. A control experiment to confirm the involvement was conducted by analyzing a
powder with a similar composition to the Timetal 125 powder, but without aluminium. The
DTA scan is shown in Figure 5. 3, in which the endothermic peak at 659oC and the exothermic

157
ones at 668oC and 714oC in Figure 4.9 were absent. This showed all the three peaks were
associated with aluminium. As explained earlier, the endothermic peak at 659oC was clearly
due to the melting of aluminium (Davies, 1808; Furukawa et al., 1971).
Figure 5.2 also shows the DTA scan for a similar powder mixture, but without titanium. The
exothermic peak at 668oC was absent, and this confirmed it was due to the reaction of titanium
and aluminium. The DTA scan for a titanium and aluminium mixture by Jong and Yong (1995)
had an exothermic peak at 720oC, which they attributed to the formation of TiAl3. In the present
work, the exothermic peak at 668oC was attributed to the same reaction, and the lower reaction
temperature was attributed to the presence of iron, molybdenum and vanadium.
Table 5.6: Atomic radii and electronegativities of the constituents of Timetal 125 (after Pauling,
1932).
Element Size (pm) Electronegativity
(Pauling units)
Ti 146.20 1.54
Al 143.20 1.61
Fe 140.00 1.83
V 134.60 1.63
Mo 127.40 1.83
It was concluded that the peak at 714oC was due to a reaction of aluminium and molybdenum.
It was not clear why the reaction of aluminium with titanium at 668oC did not consume all the
aluminium, particularly with only 2.7wt% Al in the mixture. If it had, then the peak at 714oC
would have been absent. A possible explanation is that the aluminium powder was too coarse,
resulting in poor kinetics. The use of flake aluminium could possibly change the wetting
process and its uptake. Considering the Thermo-Calc calculations in Section 4.9, it is clear
intermetallic compounds in Timetal 125 are only stable at temperatures below 600oC, and in
very small quantities. Above ~600oC, only (βTi) solid solution and liquid were calculated to
be stable. The currently accepted Ti-Al phase diagram by Witusiewiscz et al. (2007), and even
the earlier diagrams by Ogden et al. (1951), Bumps et al. (1952), Shull et al. (1985) and Murray

158
(1988), show a solubility of aluminium greater than 10 wt% above 600oC. Therefore, although
titanium and aluminium reacted to form TiAl3 at 668oC, the intermetallic compound
decomposed to form the αTi solid solution. This was in agreement with the eutectoid reaction
on the phase diagram by Murray (1988). All the Ti-Al phase diagrams are also in agreement
with respect to the stability of titanium aluminides. Ti3Al and TiAl are only stable at more than
~10 wt% Al (Ogden, 1952; Murray, 1988). Therefore, aluminium was present in the αTi solid
solution after the reaction at 668oC, and was still able to react with molybdenum at 714oC.
The exothermic peak at 1216oC in Figure 4.9 was attributed to a reaction of iron. This was
confirmed by testing a powder mixture without iron. The DTA scan is shown in Figure 5.3,
and did not have the peak. The Al-Fe phase diagram by Benjamin (1970) shows a phase
transition at 1216oC, which also supports the peak was due to iron.
Figure 5.2: Superposed DTA scans for Ti-Fe-Mo-V (no aluminium) and Al-Fe-V-Mo (no
titanium) powders.
The DTA curve for cooling in Figure 4.9 did not have any peaks, and this indicated the
irreversibility of the reactions associated with the peaks on the heating curve. There was no
exothermic peak associated with the solidification of aluminium, which showed there was no
longer elemental aluminium in the mixture after the thermal treatment.
Sample Temperature (°C)
1400120010008006004002000
HeatF
low
(µ
V)
50
45
40
35
30
25
20
15
10
5
0
No-Al
No-Ti
Heat : -14.737 (µV·s/mg)
T : 834.79 and 882.35 (°C)
Peak Maximum : 857.946 (°C)
Onset : 840.518 (°C)
Heat : -14.838 (µV·s/mg)
T : 926.60 and 1 067.96 (°C)
Peak Maximum : 990.643 (°C)
Onset : 955.512 (°C)
Heat : -83.552 (µV·s/mg)
T : 1 019.33 and 1 178.14 (°C)
Peak Maximum : 1 040.471 (°C)
Onset : 1 020.384 (°C)
Heat : 19.137 (µV·s/mg)
T : 637.75 and 671.84 (°C)
Peak Maximum : 659.547 (°C)
Onset : 648.125 (°C)
Exo

159
Figure 5.3: DTA Scan for Ti-Al-Mo-V powder (no iron).
5.2 Microstructural changes during annealing of the Timetal 125 style
alloy
The microstructure of the Timetal 125 style alloy in the as-cast condition consisted of very fine
grains and colonies of precipitates. The precipitates had a higher iron, molybdenum and
vanadium content than the matrix. The small grain size was consistent with rapid cooling (Ence
and Margolin, 1961; Brooks, 1982). The presence of the precipitates was also due to rapid
cooling, which did not allow them sufficient time to transform to αTi (Chandrasekaran et al.,
1973). Clearly, the cooling was not rapid enough to suppress βTi from transforming to αTi,
although it prevented its complete transformation, according to the XRD pattern in Figure 4.20.
Taddei et al. (2007) found similar microstructures in Ti-35Nb-72r-5Ta, “TNZT”. The alloy
comprised a βTi matrix and intragranular αTi precipitates, as shown in Figure 2.6. However,
the difference from the present work is the Timetal 125 style alloy microstructure αTi grains
and βTi precipitates in the as-cast condition. This shows the high thermal conductivity of the
copper mould was not sufficient to quench the alloy, and the cooling was not slow enough to
allow all the βTi to transform to αTi. So, the Timetal 125 style alloy requires direct water
quenching to obtain a fully βTi microstructure.
Exo

160
The as-cast microstructure had porosity, Figure 4.22. The porosity was not likely due to
shrinkage, since the castings were small. According to Ferencz and Grama (2011), shrinkage
porosity is normally limited to thick sections where, as the metal reduces in volume during
solidification, there is inability to feed the shrinkage with more metal. The voids in the as-cast
Timetal 125 style alloy were much more consistent with gas porosity (Degarmo et al., 2003).
Although the powders were degassed before casting, the likelihood of removing all the
entrapped gas was low. Furthermore, the casting was not under vacuum, but in an argon
atmosphere. Therefore, the chance of gas dissolving in the melt before solidification was
certain. The porosity in the cast and sintered Timetal 125 style alloy indicated it may be
necessary to HIP to achieve full density. However, at 99% theoretical density, both centrifugal
casting and spark plasma sintering should suffice for most of the alloy’s applications.
The lower concentration of aluminium in the precipitates than the matrix showed the
precipitates were βTi. According to Ageev and Petrova (1970), non-transition metals tend to
stabilize the titanium hcp structure, since they cannot increase the d-electron density of
titanium. Such metals have a much lower solubility in βTi than in the αTi phase (Ageev and
Petrova, 1970). The presence of both phases in the as-cast condition was confirmed by the
XRD pattern in Figure 4.20. The small amount of precipitates was concomitant with the
relatively low peak intensities of the βTi phase in Figure 4.20. Although no Reitveld analysis
was done, the relative peak intensities of the βTi phase clearly showed it was the minor
constituent, and this further supported that the precipitates were βTi.
Sieniawski et al. (2013) showed the phase composition of all titanium alloys cooled from the
βTi phase field depends on the cooling rate, and the molybdenum equivalence controls the
kinetics of βTi → αTi transformation. In Ti-6Al-2Mo-2Cr, they demonstrated that cooling at a
rate higher than 180oC.min-1 led to the development of a martensitic structure. They also
showed that with increasing [Mo]eq, the Ms temperature could be suppressed to below room
temperature, making it possible to retain βTi after quenching (Sieniawski et al., 2013).
The as-cast Timetal 125 style alloy did not contain martensite, despite the rapid cooling
(Sieniawski et al., 2013), and this was attributed to the high molybdenum equivalence of the
alloy (Leyens and Peters, 2003). Duerig and Williams (1983) and Sieniawski et al. (2013)
showed that there are two main microstructures in βTi alloys: lamellar which is formed after
slow cooling when deformation and heat treatments occur above the transus, and equiaxed
which is normally formed after deformation or heat treatment in the α+β phase field. There was

161
no lamellar structure in the as-cast Timetal 125 style alloy, and the grains were generally
equiaxed. The high thermal conductivity of the copper mould was responsible for the relatively
fast cooling after casting, and hence the absence of the lamellar microstructure. On the other
hand, the cooling rate was not rapid enough to by-pass the 𝛼+𝛽 phase field, and this led to the
formation of the equiaxed microstructure (Duerig and Williams, 1983).
The compositions of the matrix and precipitates indicated the Timetal 125 style alloy did not
have the equilibrium microstructure in the as-cast condition. The Thermo-Calc calculations
showed an aluminium composition of less than 2 wt% in βTi, and ~10 wt% for each of Fe, Mo
and V in the same phase, as shown in Figure 4.60. Yet the EDX analysis in Table 4.6, although
not accurate due to the small size of the precipitates, showed higher aluminium content for the
precipitates and lower concentrations of the other solute elements.
According to Bullens (1938), the partitioning of the constituents of an alloy system is due to
diffusion, which is a time-dependent process. Non-equilibrium cooling denies the system the
chance to diffuse and equilibrate (Hammond and Kelly, 1968). Consequently, the Gibbs energy
of such a rapidly cooled alloy is not at its lowest, hence the tendency to transform at a later
stage, even at ambient temperature. Since diffusion is temperature dependent, equilibration at
low temperatures is a relatively slow process. While many βTi alloys form the intermediate
omega phase upon quenching (Williams et al., 1973; Roy, 1973; Collings, 1984), the phase
was not present on the XRD pattern of the as-cast Timetal 125 style alloy. According to
Williams (1971), the presence of β- and α-stabilizers suppresses the formation of the omega
phase. The Timetal 125 style alloy contained both stabilizers, and its phase composition at
room temperature was in agreement with Williams (1971).
Grain growth is also a time-dependent process, and according to Beck (1956), the driving force
for grain growth is the decrease in surface energy due to the reduction in the total grain
boundary area. The early work on the heat treatment of steel by Bullens (1938) showed grain
growth is a diffusion-controlled process governed by time. The kinetics and extent of growth
are controlled by temperature according to the Arrhenius equation (Arrhenius, 1889; Beck,
1956).
As mentioned earlier, the presence of αTi in the as-cast alloy was due to the relatively slow
cooling after casting. The retention of βTi in titanium alloys is only possible after water-
quenching from the βTi phase field (Hansen et al., 1951). So, the cooling by the copper mould

162
was not rapid enough to produce the desired βTi microstructure. According to Guo et al. (2005),
retention of βTi is only possible for titanium alloys with molybdenum equivalence greater than
10. By calculation, the [Mo]eq of Timetal 125 was 24, which concurred with the value reported
by Leyens and Peters (2003). The [Mo]eq was high enough to allow the retention of a fully βTi
microstructure upon water-quenching, according to Guo et al. (2005). Therefore, it is plausible
that the presence of the precipitates in the as-cast microstructure was due to the relatively slow
cooling after casting.
The broad and asymmetrical peaks on the XRD pattern of the as-cast alloy in Figure 4.20 were
another indication of the unoptimised microstructure, as they showed a range of lattice
parameters (Warren, 1969). From the work of Bragg (1913) on X-ray diffraction, the lattice
spacing, d, determines the peaks’ positions. The XRD pattern in Figure 4.20 showed peak shifts
both to the left and to the right, and this showed the dissolution of the solute elements expanded
the titanium hcp lattice in some directions and contracted it in others (Warren, 1969). The
reasons for this are two-fold. Firstly, the solute atoms were not the exact size as the titanium
atoms. Hence in substituting the titanium atoms, some distortion of the lattice occurred.
Secondly, the electronegativities were different, resulting in a difference in the attraction of the
bonding electrons. None of the solute elements were small enough to fit into the interstices of
titanium. According to Ogden and Jaffee (1955) only O, N, C and H can dissolve interstitially
in αTi. While it is possible that some of these interstitial elements were present in the as-cast
alloy, particularly oxygen, the degree of lattice distortion by an interstitial atom is normally
less pronounced than of a substitution atom (Gupta and Weinig, 1962). Hence the distortion
observed in Figure 4.20 was mainly due to the metallic solutes.
5.2.1 Microstructural changes during annealing of the Timetal 125 style
alloy
From the DTA scan in Figure 4.25, the beta transus of Timetal 125 style alloy is ~800oC.
Furthermore, as discussed in Section 5.1, the first αTi transforms to βTi at ~600oC. On
annealing the Timetal 125 style alloy at any temperature below 600oC, the equilibrium phase
was αTi. Therefore, under these heat treatment conditions, the tendency was for βTi to
transform to αTi. Since the precipitates in the as-cast microstructure were βTi, they transformed
to αTi when the alloy was kept at a temperature below ~600oC.

163
The major microstructural changes between room temperature and 500oC were an increase in
mean grain size and the dissolution of precipitates. Under equilibrium cooling conditions, the
stable crystal structure of any titanium alloy is hcp below the transus (McQuillan, 1949). So,
the βTi precipitates were metastable, and increasing the annealing temperature accelerated their
transformation to αTi, as well as the equilibrium grain size. The mean grain size increased to
~44µm in 60 minutes at 300oC, according to Figure 4.30 and Table 4.14. This was in agreement
with the work of Bullens (1938), Beck (1954) and Gil et al. (1995), which shows temperature
increases both the rate and extent of grain growth for most metals and alloy systems.
There was a further increase in the average grain size when temperature increased to 400oC
and 500oC. The increase could have been more if there was no precipitation at these
temperatures. The initial dissolution of precipitates at low temperature was due to the βTi →
αTi transformation, as stated earlier. However, extensive precipitation occurred after annealing
at 300oC for 30 minutes, as well as at 400oC and 500oC. According to the XRD pattern in
Figure 4.31, there was βTi after annealing at 300oC. The precipitation was an indication of
ageing (Chandrasekaran et al., 1973; Birmingham et al., 2007). Hosh and Viswanathan (1971)
reported similar precipitation in Ti-Mo alloys, and argued the precipitation showed the αTi
phase was saturated with the solute elements and had to precipitate the secondary βTi phase in
order to lower energy.
More precipitation occurred after annealing at 400oC for the same reason as at 300oC, while
the apparent increase in the relative amount of precipitates was due to the increased stability of
βTi with increasing temperature. The precipitation led to relaxation of the titanium lattice, as
shown by the sharper and more symmetrical XRD peaks in Figure 4.31, mainly due to the
change in aluminium content. The peaks were slightly moved to the left compared to Figure
4.20, showing the ejection of the solute elements reduced the lattice parameter of the hcp
titanium solvent. While it was not possible to separately analyze the precipitates by EDX, and
the XRD pattern showed αTi and βTi.
The only microstructural difference after annealing at 500oC was the apparent reduction in the
amount of the αTi precipitates, otherwise the grains grew in a similar fashion to the lower
annealing temperatures. The decrease in the amount of precipitates was attributed to their
dissolution. For many systems, including alloys, solubility generally increases with
temperature (Hildebrand, 1928; Levi et al., 1987). Apart from the increased solubility, the
reduction in the amount of the precipitates may have been due to their limited stability at the
164
temperature. From the DTA scan for Timetal 125 style alloy in Figure 4.25, the 𝛼 phase in the
alloy was stable up to ~590oC. Therefore, it is possible that annealing close to this temperature
may have caused some of the precipitates to transform. Furthermore, although the alloy was
annealed at 500oC, the possibility of localised hot spots in any system is always high (Lamaire
and Backofen, 1972). Hot spots are areas that are at a much higher temperature than the
average, and they normally occur due to uneven heating or if there are composition gradients
in the material (Rudnev, 2005), although this was not likely due to the small size of the samples
in this investigation.
Compared to the grain size after annealing at 300oC, there was no further growth after annealing
at 400oC and 500oC. This was not in agreement with much work, where grain size generally
increases with increasing heat treatment temperature (Demer & Beck, 1948; Oluwole and
Akinkunmi, 2011). However, such models are limited to normal grain growth where there are
no competing processes, such as precipitation, dissolution, and resistance to grain growth due
to secondary phases, or phase transformations. In such cases, the competing processes may
have lower activation energies than grain growth, and may occur preferentially at the expense
of grain growth (Beck, 1956; Rodriguez and Plannel, 1995). The precipitation during annealing
occurred in pre-existing grains and hence was heterogeneous. Heterogeneous nucleation is
generally a low energy process and hence easier than more energy demanding processes like
grain growth (Bullens, 1938; German, 1996). Therefore, it is the precipitation during annealing
at 300oC and 400oC that hindered further grain growth.
The lack of significant grain growth after annealing at 500oC was attributed to the dissolution
of the precipitates formed at the lower annealing temperatures. The dissolution occurred in
preference to grain growth due to its lower activation energy. Green and Brown (1954) age-
hardened β brass, and observed that grain growth was slower, and the maximum grain size was
limited, when precipitation or dissolution, were competing processes. Although it was a
different alloy system from the current work, the findings from the present work were in
agreement.
After annealing the Timetal 125 style alloy at 600oC, even at 20 minutes, the microstructure
was different from those at lower temperatures. The microstructure was duplex, and the mean
grain size was smaller than at the lower annealing temperatures. The change to a duplex
microstructure signalled the start of the αTi → βTi transformation, in agreement with the DTA
scan in Figure 4.25. A significant number of the grains became βTi, while all the grain
165
boundaries contained the untransformed αTi precipitates. According to Pearl and Tomlin
(1963) and Ivasishin (2003), this is common in many β and α + β titanium alloys. In a study
of the coarsening behaviour of a duplex titanium alloy by Semiatin et al. (2004), it was also
observed that upon αTi → βTi transformation, most of the grain boundaries contained the
untransformed αTi phase until the temperature when the transformation was complete. Grain
boundaries are regions of high interfacial energy and are generally reactive. So, if any βTi
would revert to the αTi phase, the most likely place would be on the grain boundaries first (Van
Loo and Rieck, 1973).
There were at least two processes competing with grain growth at 600oC. Firstly, all the
precipitates observed at the lower annealing temperatures dissolved after heat treating at 600oC.
As discussed earlier, the dissolution is less energy demanding than grain growth and occurs at
its expense (Bullens, 1938; German, 1996).
The lighter phase in Figure 4.36 was identified αTi, since it contained a much higher amount
of aluminium than the other phase. The accepted Ti-Al binary phase diagram by Witusiewicz
et al. (2007) showed the solubility of aluminium was much higher in αTi than in the βTi phase.
The Thermo-Calc calculation in Figure 4.62 also showed a much higher solubility of
aluminium in αTi than in the βTi phase, while a similar calculation in Figure 4.61 showed very
limited solubility of Fe, Mo and V in αTi. This concurred with Ageev and Petrova (1970), who
showed non-transition metals, such as aluminium, were better accommodated in the αTi phase,
while transition metals, like the rest of the solute elements, were more stable in the βTi phase.
According to Hume-Rothery et al. (1935) and Muzotini (2010), the compatibility of iron,
molybdenum and vanadium with βTi is because they share the same crystal structure, in
addition to the other requirements for forming solid solution. Both molybdenum and vanadium
are bcc, while although allotropic, both iron and titanium have the same crystal structure above
~910oC. While aluminium does not share the same crystal structure with titanium at any
temperature, it is much easier for close packed structures to accommodate each other (Hume
Rothery et al., 1935), hence the relatively high solubility of aluminium in the αTi phase.
The XRD pattern after annealing at 600oC in Figure 4.37 showed the possible presence of the
𝜔 phase by some of its peaks. It was in very small quantities due to the small amount of
vanadium in the alloy. Williams et al. (1971) showed that the formation of the omega phase is
only possible in titanium alloys with just enough βTi stabilizers to prevent the formation of
martensite. Both Williams et al. (1971) and Collings (1984) found that the phase forms as
166
nanosized precipitates, ~5µm, and can only be resolved under a transmission electron
microscope. So, although no such phase was observed under the optical or scanning electron
microscope in the present work, its presence was possible.
After annealing at 700oC, the microstructure was very similar to the alloy annealed at 600oC,
showing the two temperatures were the same phase field. The microstructure was in agreement
with the DTA scan Figure 4.25, which showed a phase change at 590oC and another at 800oC.
As stated in Section 5.1, the alloy appeared mainly αTi, although possibly ith some fine
precipitates that could not be resolved, and Thermo-Calc showed that it should have been two-
phase (Figure 4.58).
Thus, the 590oC to 800oC interval marked the two-phase field for the Timetal 125 style alloy.
However, the Thermo-Calc calculation showed the upper temperature limit for the two phase
field was much lower. Figures 4.59 and 4.60 calculated the beta transus to be 670oC, while
Leyens and Peters (2003) reported the beta transus of Timetal 125 as 750oC. The most likely
reason for the difference could be impurity content, particularly oxygen. Ogden and Jaffee
(1955) found the beta transus is raised by ~50oC per 0.1wt% of N, and 40oC per 0.1wt% of O.
The Thermo-Calc calculation was undertaken with no interstitials in the alloy (although they
could have been incorporated into the calculation), which is not practically possible even under
best practices. So, the calculated transformation temperature marked the lowest possible
transus of Timetal 125. The alloy of Leyens and Peters (2003) contained 0.18 wt% O, and the
elevation of the transus agreed with Ogden and Jaffee (1955).
The source titanium powder contained 0.08±0.02 wt% O, Table 4.1. Although the casting
chamber was repeatedly vacuumed and purged with argon, removing all the oxygen was highly
unlikely. Furthermore, even the argon gas contained some oxygen, although minute. Titanium
has an extreme affinity for oxygen and will scavenge even the minute amount in the protective
gas (Wells, 1962). So, the actual transus strongly depends on the cleanliness of the casting
environment, and the present work confirmed this.
Another difference between the alloys aged at 600oC and 700oC was the much higher
aluminium content in the αTi phase after ageing at the higher temperature. As the αTi continued
to transform to βTi at 700oC, aluminium was rejected to the residual αTi phase due to its limited
solubility in βTi. On the other hand, the solute partitioning of the other elements was more
uniform, Table 4.19. According to the Thermo-Calc calculations in Figures 4.60 and 4.61, the

167
experimental alloy was not at equilibrium, even after annealing for 60 minutes, since the
concentrations of Fe, Mo and V in the βTi phase were supposed to be ~10 wt%, while
aluminium was calculated to be ~2.7 wt%. The Thermo-Calc calculation is for equilibrium
conditions. Also, according to Figure 4.61, the concentration of aluminium in αTi was
calculated to be ~4.5 wt%, while the other solute elements were calculated to be less than 1
wt% at equilibrium, when quenched from 700oC. The disagreement between the calculated
concentrations and the present work is due to the short annealing period. The partitioning of
solutes is a diffusion process, dependent on time and temperature.
The microstructure of the Timetal 125 style alloy after annealing at 900oC was single phase.
The change from the duplex microstructure at 800oC to the single phase after annealing at
900oC showed the beta transus of the alloy was in this temperature interval. This concurred
with the DTA scan in Figure 4.25, which had an exothermic peak at ~800oC on heating. It is
known that α → β transformation is endothermic (Matthew and Donachie, 1988; Peng et al.,
2007), and this was also demonstrated in the present work in Figure 4.3. Therefore, the reverse
reaction is exothermic, and so, the exothermic peak in Figure 4.25 was consistent with a βTi →
αTi transformation. Additionally, the change from a duplex to a single phase microstructure at
the same temperature as the exothermic peak was the most direct proof that the peak marked
the transus of the alloy. It was concluded that the peak was due to the phase transformation in
Equation 5.9.
𝛃𝐓𝐢 ↔ 𝛂𝐓𝐢 + 𝛃𝐓𝐢 Equation 5.9
The presence of the αTi phase on the grain boundaries indicated the alloy had not equilibrated,
and the αTi → βTi transformation was slow. In a very early study, Duwez (1951) found the
allotropic transformation of titanium was a relatively fast process. In similar studies with
alloyed titanium, it has become clear that the kinetics depend on the chemical composition
(Tarin et al. 2012). In the dilatometric measurements by Dabroswki (2011) of Ti-6Al-4V, the
𝛼 → 𝛽 transformation was a relatively slow process. The same work showed that cooling Ti-
6Al-4V at a rate higher than 23.1oC.s-1 resulted in a βTi → αTi transformation, while for rates
between 23.1oC.s-1 and 7.3oC.s-1 there was also diffusional βTi → αTi transformation in
addition to the martensitic reaction. It was only for cooling rates lower than 7.3oC.s-1 that an
equiaxed microstructure developed (Dabroswki, 2011). Tarin et al. (2012), with extra low
interstitial (ELI) Ti-6Al-4V, concluded the kinetics of the allotropic transformation depended
on impurity content, and slowed with increasing solute content.

168
The equiaxed microstructure of the Timetal 125 style alloy for all the annealing temperatures
in the present work agreed with the work of Dabroswki (2011) with respect to cooling rate. In
the present work, the ampoules were not broken to allow the actual sample to directly contact
water during quenching, and so, the cooling was less rapid than it could have been. The
untransformed αTi on the grain boundaries was due to kinetic limitations, and indicated a
longer holding time was required to equilibrate. If the alloy been isothermally held for a longer
period, the αTi precipitates along the grain boundaries would have also transformed (Pederson
et al., 2001). Bein and Bechet (1996) studied the transformation kinetics in the titanium alloys
Ti-6.2.4.6, 𝛽-CEZ and Ti-10.2.3 and found direct proportionality between resistivity and mass
fraction of the (αTi) phase in the alloys, as well as with heat treatment temperature. They
concluded the kinetics and extent of the 𝛼 → 𝛽 transformation depend on the composition of
the alloy composition and temperature (Bein and Bechet, 1996). They also observed that
nucleation of the αTi phase occurred on the grain boundaries, and after saturation of the
nucleation site the αTi phase grew into the grains or coarsened into allotriomorphic precipitates
(Bein and Bechet, 1996). Therefore, the αTi precipitates on the grain boundaries were more
stable than elsewhere, and this partly explains the presence of the untransformed αTi
precipitates along the grain boundaries after ageing at 800oC, Figure 4.40.
The major difference after ageing at 900oC was most of the grain boundary (αTi) precipitates
had transformed, otherwise the matrix was the same. So, above 800oC, the alloy was single-
phase and this microstructure was expected to persist until melting. The lack of precipitates
after ageing at 900oC showed the alloy was in the solution-treated state. So, the solution-
treatment temperature for Timetal is anywhere above 800oC, but below its melting point. This
is consistent with Moskalenko et al. (1973) and Greenfield and Pierce (1973), who reported
solution-treatment must be carried out at least 50oC above the transus.
5.2.2 Microstructural changes during artificial ageing
After solution-treatment, the alloy was completely βTi, as shown in Figures 4.42 and 4.44. Like
many systems, solubility generally increases with increasing temperature. At 900oC, the βTi
phase could accommodate all the solutes in solid solution. Quenching from this temperature
kinetically hindered the diffusion of atoms into their equilibrium positions. As a result, the
retained solid solution contained solutes in excess of their solubility limits at room temperature.
Therefore, the tendency was for the excess solute to be ejected from the matrix until below

169
saturation (Greaves, 1924). However, due to the low temperature, the precipitation was
relatively slow.
Precipitation occurred immediately after solution treatment, as shown in Figure 4.46, and
although the precipitates were too fine to be measured separately, they were inferred to be αTi.
For Ti-6Al-4V, Ti-6Al-6V-2Sn and Ti-8Al-1Mo-1V, Fopiano and Hickey (1968) observed
that after solution-treatment in the α+β phase region, the aluminium content of the 𝛼 phase and
the vanadium content of the 𝛽 phase approached their overall contents in the alloy. Considering
the compositions of the matrix and precipitates in Table 4.21, the aluminium content of the
precipitates was much higher. It was partly for this reason that the precipitates were identified
as αTi, although they could have been the omega phase, αʹ or αʺ. The second reason is αTi is
the stable phase below the transus (McQuillan, 1949; Hansen et al., 1951). So, under
equilibrium cooling, any transformation below the transus should form the more stable αTi
phase. The increase in the amount of precipitates with increasing time was because under
equilibrium conditions, phase transformations are time-dependent diffusion processes (Bain
and Griffiths, 1927; Beck, 1956).
Artificial ageing was carried out from 400oC because almost all reported βTi alloys are aged
in the 400oC-600oC temperature interval (Silcock, 1955; Sridhar et al., 1987; Gasik et al.,
2009). The precipitation of the lighter phase after ageing at 400oC, Figure 4.49, was due to the
decomposition of the βTi retained after solution-treatment. Thus, the lighter phase was formed
from the transformation in Equation 5.9. The iron-rich phase in Figure 4.47 was identified as
TiFe (BCC-B2), from the Thermo-Calc calculation in Figure 4.63, and this was confirmed by
Hong et al. (2012).
The grain size after ageing at 400oC was similar to that obtained after solution-treatment, and
the lack of growth was attributed to the competing αTi precipitation reaction. Demer et al.
(1948) had similar results with Al-Mg alloys, where the grain growth exponent was abnormally
low upon the precipitation of a second phase. Similar results were reported by Baker (2009)
during the transformation of austenite to ferrite in vanadium steels. Reinbach and Nowikow
(1956) investigated the effects of solute additions to titanium alloys on grain growth, and
showed the activation energy grain growth in the βTi phase ranged from 20 kJ.mol-1 in pure
titanium to above 200 kJ.mol-1 in solute-stabilised β titanium alloys. Furthermore, from the
DTA scan in Figure 4.3, β-α transformation is exothermic, and so energy is removed from the
system. How well the energy is utilized by the (βTi) phase for grain growth depends on its heat

170
capacity. The marginal grain growth may have been indicative of a relatively low heat capacity
of βTi. Additionally, from Figure 4.50, some of the available energy was used for coarsening
the αTi precipitates upon extended ageing. Clearly, the heat released from the precipitation was
preferentially used for coarsening the αTi precipitates. This coarsening was faster and more
pronounced after ageing at 500oC, Figures 4.51 and 4.52. It was so extensive that the grain size
was smaller than at the lower temperature because of the volume occupied by the precipitates.
For Ti-Mo alloys, Hosh and Viswanathan (1971) found similar αTi precipitate coarsening, and
the precipitation occurred on the grain boundaries. As the precipitates grew and thickened, they
consumed the volume initially occupied by the matrix grains, which resulted in a smaller grain
size. Similar results were reported by Chandrasekaran et al. (1972). Therefore, the smaller
mean grain size with increasing ageing temperature and time was due to the αTi precipitates
occupying some of the sample’s volume. In fact, some of the precipitates coarsened into
allotriomorphs, Figure 4.52. The thinning of the grain boundary precipitates after ageing at
600oC was attributed to their dissolution, due to the reversal of the transformation in Equation
5.9. The thinner precipitates resulted in an increase in the surface area occupied by the βTi
grains, hence the increase in the matrix grain size compared to 500oC. The dissolution further
confirmed the lower boundary of the two-phase field for the Timetal 125 style alloy was
~600oC, as shown in Figure 4.25. Thus, from above 590oC, there were two types of βTi; the
primary βTi from the quenching and secondary βTi from the decomposition of the αTi
precipitates. However, the secondary βTi phase could not be resolved under an optical or
scanning electron microscope, for two possible reasons. Firstly, it is possible the secondary βTi
was too small to resolve under these microscopes. Secondly, the secondary βTi phase may have
had a similar composition to the primary one, making it impossible to differentiate the two.
Further αTi decomposition occurred after ageing 700oC, resulting in more distinct βTi grain
boundaries and a marginal increase in the grain size. Since the α+β two-phase field for the
Timetal 125 style alloy lies between 590oC and 800oC, no major differences in microstructure
were expected in this temperature interval, except a decrease in the amount of the αTi with
increasing temperature. Studying Ti-6Al-4V, Segal et al. (1956), Yolton et al. (1979) and
Sridhar et al. (1987) found the (αTi) precipitates continuously transformed with increasing
temperature in the two-phase region, resulting in more defined boundaries for the parent (βTi)
phase and an increase in matrix grain size, which concurred with the present work.

171
The acicular precipitates in Figure 4.56 were attributed to untransformed αTi. This agreed with
their disappearance after ageing the alloy at 800oC, where the matrix became single phase,
although some αTi was still present on the grain boundaries, as shown in Figure 4.57. Thus, at
800oC, the alloy was no longer in the aged condition, since it was now essentially βTi. This
was consistent with Moskalenko et al. (1973), Greenfield and Pierce (1973) and Srivastava et
al. (2004), where the ageing of solution-treated β titanium alloys occurred mainly between
400oC and 600oC
5.3 Kinetics of grain growth in the Timetal 125 style alloy
The grain size of Timetal 125 continuously changed during heat treatment, and the two factors
that appeared to have a significant effect are temperature and time. To a large degree, the mean
grain size increased with increasing temperature, and also isothermally with increasing holding
time. The current results concurred with Bains and Griffiths (1927), Demer and Beck (1948),
Beck et al. (1956), Rodriguez et al. (1995) and Oluwole and Akinkunmi (2011).
To explain the grain growth during annealing, as well as during the ageing of solution-treated
alloys, it is important to briefly describe the major differences between the microstructures
obtained from the two heat treatments. In the as-cast condition, the Timetal 125 style alloy had
an αTi matrix and a few colonies of βTi precipitates. So, the kinetics of grain growth during
annealing was based on the αTi matrix, which competed with the decomposition of the βTi
precipitates initially, and with the precipitation of the secondary βTi precipitates above 590oC.
The artificial ageing was for the solution-treated alloy, where the matrix was βTi because of
the water quenching. In this case, the grain growth was of the βTi matrix, competing with the
precipitation of the αTi precipitates, and the αTi → βTi) transformation above 590oC. The rates
of grain growth were different in the two cases, and this was attributed to a difference in the
activation energy for grain growth in the αTi and βTi phases.
5.3.1 Grain growth during the annealing of the Timetal 125 style alloy
The grain sizes after annealing of the Timetal 125 style alloy are shown in Figure 5.4, where
grain growth was rapid in the first 20 minutes at all the annealing temperatures. Thereafter, it
slowed, and the mean grain size reached a plateau. A similar trend was reported by Gil et al.
(1995) in a study of the kinetics of grain growth in Ti-6Al-4V, where grain growth was rapid
in the first 15 minutes, and the mean grain size reached a plateau after about 30 minutes.

172
Furthermore, the mean grain sizes after annealing at various temperatures were of the same
order of magnitude as in the present work. The initial rapid grain growth has been observed in
many other crystalline systems, and was attributed to the driving force being at its maximum
due to the high grain boundary surface area per unit volume at the beginning (Kurtz and Carpay,
1980). As the grains grow, the grain boundary surface area per unit volume decreases, resulting
in a decrease in the driving force and the growth rate.
There was a general increase in the rate and extent of grain growth between 300oC and 500oC,
as shown in Figure 5.4. However, there was sluggish grain growth at 300oC and 400oC in the
first 20 minutes, which made the curves sigmoidal. This showed an incubation period, probably
due to some resistance initially. Barto and Ebert (1971) found a similar trend in highly
deformed steels, and attributed the incubation period to grain boundary pinning by fine
particles. The sudden increase in grain size after the incubation period showed the alloy had
acquired enough energy to overcome the resistance.
The mean grain sizes after annealing at 600oC were smaller than at the lower temperatures.
Additionally, the rate of grain growth was slower. The slower and less significant grain growth
at this temperature was attributed to the αTi to βTi transformation, which commenced at 590oC,
according to Figure 4.25. Grain growth normally increases with increasing temperature,
provided there are competing side reactions (Beck, 1956; Rodriguez et al., 1995). Since there
was precipitation of βTi from the saturated matrix, it is possible that most of the available
energy was expended in that process, to the extent grain growth at the temperature was
marginal. Furthermore, the βTi nucleated on the many nuclei provided by the αTi grains, hence
their smaller size.
The mean grain size increased when temperature increased from 600oC to 800oC, but was
similar to after annealing at 500oC for similar periods, although the growth was much more
rapid in the first 20 minutes at 800oC. The increase in grain size when compared to at 600oC
was due to the extra thermal energy. The nucleation of βTi had already occurred at ̴ 600oC, and
as temperature increased, the new grains grew. However, compared to 500oC, there was no
increase in the mean grain size when temperature increased to 800oC. This was attributed to
800oC being a transformation temperature, Figure 4.25. Hence, there was a competing process,
and since the matrix at the two temperatures was different, the mechanisms governing the
growth may have also been different.
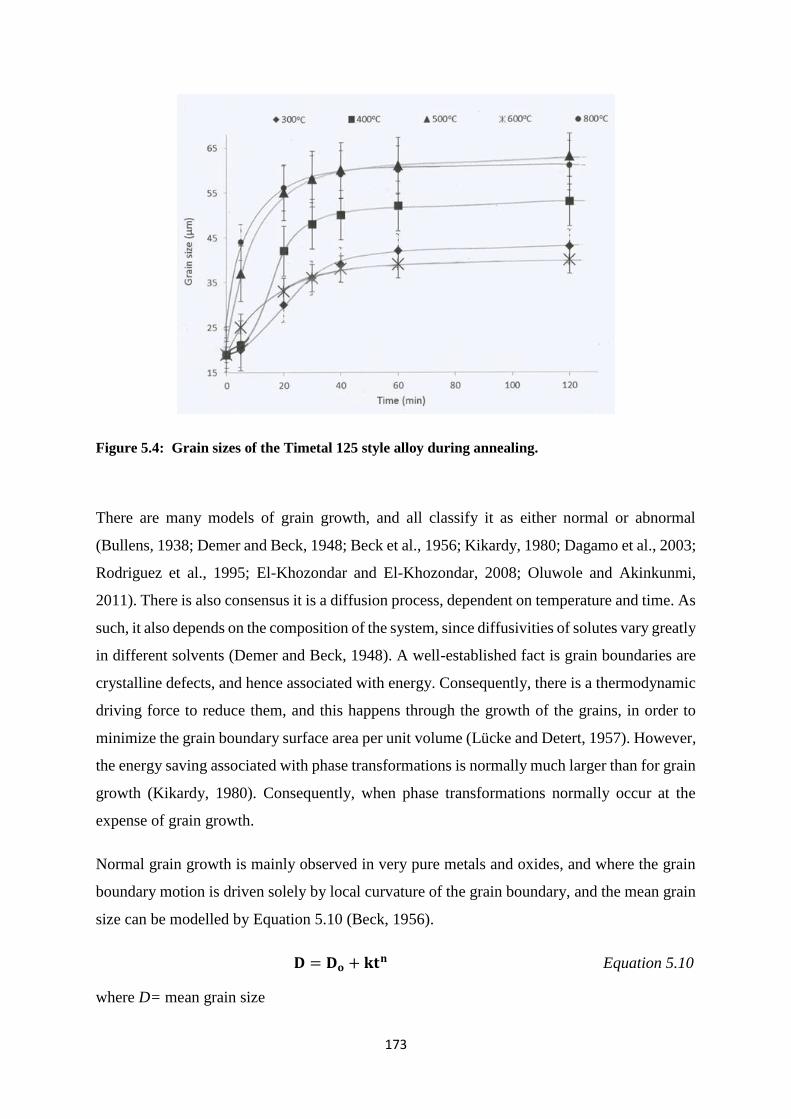
173
Figure 5.4: Grain sizes of the Timetal 125 style alloy during annealing.
There are many models of grain growth, and all classify it as either normal or abnormal
(Bullens, 1938; Demer and Beck, 1948; Beck et al., 1956; Kikardy, 1980; Dagamo et al., 2003;
Rodriguez et al., 1995; El-Khozondar and El-Khozondar, 2008; Oluwole and Akinkunmi,
2011). There is also consensus it is a diffusion process, dependent on temperature and time. As
such, it also depends on the composition of the system, since diffusivities of solutes vary greatly
in different solvents (Demer and Beck, 1948). A well-established fact is grain boundaries are
crystalline defects, and hence associated with energy. Consequently, there is a thermodynamic
driving force to reduce them, and this happens through the growth of the grains, in order to
minimize the grain boundary surface area per unit volume (Lücke and Detert, 1957). However,
the energy saving associated with phase transformations is normally much larger than for grain
growth (Kikardy, 1980). Consequently, when phase transformations normally occur at the
expense of grain growth.
Normal grain growth is mainly observed in very pure metals and oxides, and where the grain
boundary motion is driven solely by local curvature of the grain boundary, and the mean grain
size can be modelled by Equation 5.10 (Beck, 1956).
𝐃 = 𝐃𝐨 + 𝐤𝐭𝐧 Equation 5.10
where D= mean grain size

174
Do = initial grain size
t = time
k = the rate constant
n = growth exponent.
For normal grain growth, the growth exponent is approximately 0.5 (Beck et al., 1956;
Hamphrey and Harthley, 1995). In reality, grain boundary motion is affected by many other
factors, including precipitates and phase transformations (Lücke and Detert, 1957). The net
effect is almost always to retard growth by decreasing the growth exponent and increasing the
activation energy. Even slight changes of the activation energy have a profound effect on the
rate constant, since the two are exponentially related according to Arrhenius equation in
Equation 2.9 (Arrhenius, 1889).
According to Kurtz and Carpay (1980), lognormality, grain stability and uniformity are the key
indicators of normal grain growth. Therefore, grain growth at 300oC may have not been normal.
In the as-cast condition, the Timetal 125 style alloy had colonies of metastable βTi precipitates,
which transformed to αTi during annealing. Phase transformations normally result in a much
higher reduction of the system’s energy compared to grain growth (Kirkaldy, 1980), and so
they normally occur at the expense of grain growth. The abnormality at 300oC may have been
due to the competing β-α transformation, as the precipitates dissolved. This is plausible since
the deviation from lognormality was only in the first 30 minutes as shown in Figure 5.4, which
corresponded with the precipitates’ dissolution, indicated in Figure 4.30 (a). The subsequent
intragranular precipitation did not have a noticeable effect on the lognormality of grain growth
according to the microstructures and growth curves at the higher annealing temperatures. Since
grain growth is governed by Equation 5.10, a plot of ln (D-Do) versus ln (t) should be linear,
as shown in Figure 5.5.
𝐥𝐧(𝐃 − 𝐃𝐨) = 𝐥𝐧(𝐤) + 𝐧𝐥𝐧(𝐭) Equation 5.11
The slope will be equal to the growth exponent and the intercept will be the natural log of the
rate constant at the respective temperature. There was a good linear correlation at 500oC and
800oC, but much poorer fits at the lower annealing temperatures, particularly 300oC. Yet
although there was good correlation at 500oC and 800oC, the slope in either case was much
smaller than expected for normal grain growth (Beck, 1956). The growth exponent at 500oC
175
was 0.1, while at 800oC it was 0.06, and these fell short of the 0.5 usually observed when grains
grow normally (Pask and Evans, 1980).
Normal grain growth has only been observed in high purity metals and dense oxides (Pask and
Evans, 1980). The presence of solutes in alloy systems normally results in grain growth that is
far from normal due to a number of reasons, such as solute drag (Hamphrey and Harthley,
1995; Pask and Evans, 1980). Additionally, inclusions reduce the grain boundary surface area
when they are at a grain boundary, resulting in a decrease in the driving force (Pask and Evans,
1980).
The very low growth exponents at 500oC and 800oC clearly indicate a significant hindrance to
free grain growth. The kinetics of grain growth in pure titanium has been studied by Rodriguez
and Plannel (1995), and their heat treatment temperatures and periods were similar to the
present work. They reported normal growth (n ~0.5) when the microstructure was either
completely αTi or completely βTi, but slower than normal growth at 900oC where the αTi phase
transformed to βTi. Grain growth was slower (n ~0.3) in the α + β phase field, and this was
attributed to the presence of a second phase hindering free movement of the grain boundaries.
Furthermore, they reported the activation energy for grain growth as 100 kJ.mol-1 in αTi, and
20 kJ.mol-1 in the βTi phase. The much lower activation for the βTi phase was attributed to the
much more open bcc structure, which allows easier diffusion compared to hcp (Rodriguez and
Plannel, 1995). The activation energy for grain growth in the Timetal 125 style alloy was
calculated using Equations 5.13 and 5.14 (Arrhenius, 1889).

176
Figure 5.5: ln(D-Do) vs. In(t) for annealing the Timetal 125 style alloy at different temperatures.
𝐤 = 𝐤𝐨𝐞−𝐄
𝐑𝐓 Equation 5.12
𝐥𝐧𝐤 = 𝐥𝐧𝐤𝐨 −𝐄
𝐑
𝟏
𝐓 Equation 5.13
where k = rate constant at any temperature, ko = pre-exponential factor, E = activation energy
for grain growth, T = absolute temperature, and R = universal gas constant.
A plot of ln(k) vs. (-1/T) should be linear, with the y-intercept equal to ln(ko), and the slope
equal to E/R. The rate constants, k, were obtained at various temperatures from the intercepts
in Figure 5.4, and are presented in Table 5.7. The linear correlation between ln(k) and (-1/T)
plots was poor, as shown by the very low regression coefficient in Figure 5.6. This was
attributed to some of the energy being used for phase transformations at 600oC and 800oC,
instead of grain growth. However, for the lower temperatures, a good linear correlation was
observed.
Table 5.7: Rate constants for grain growth at different annealing temperatures.
T (K) k

177
593.15 12.3
693.15 24.2
793.15 46.5
893.15 21.0
1093.15 46.6
As discussed earlier, phase transformations lead to a higher reduction of energy than grain
growth, and tend to occur at its expense (Demer and Beck, 1948; Kikardy, 1980; Pask and
Evans, 1980). Furthermore, the mechanism of grain growth may have been very different from
temperatures lower than 800oC, where the alloy was either completely αTi or duplex. Gil et al.
(1995) found much higher activation energy for grain growth in α- than β-Ti-6Al-4V. So, the
kinetics of grain growth was expected to improve above 800oC. However, since 800oC was a
transformation temperature, a significant amount of the energy was used for the transformation.
From the slope, the activation energy for grain growth of αTi matrix in the Timetal 125 style
alloy was calculated to be ~11 kJ.mol-1. However, after removing the outliers, the activation
energy was ~20.3 kJ.mol-1. In both cases, the order of magnitude did not agree with the much
higher activation energy in the αTi phase reported by Gil et al. (1995). A very simplistic reason
is the alloy in the present work was different from the Ti-6Al-4V that they investigated.
However, according to Duerig (1984), grain boundary movement is more difficult in solute-
rich titanium alloys than in leaner ones. The weight of solutes in Timetal 125 is almost double
in Ti-6Al-4V, and according to Duerig (1984), grain growth should be more difficult in the
former alloy. The very low activation energy was probably due to the non-equilibrium
equilibrium composition, because of the excess solute.

178
Figure 5.6: ln (k) versus (-1/T) for the Timetal 125 style alloy after annealing at different
temperatures.
5.3.2 Grain growth during the ageing of the Timetal 125 style alloy
The artificial ageing of the Timetal 125 style alloy was after solution-treatment at 900oC.
Therefore, the starting matrix was the βTi phase rather than αTi during annealing. Clearly, the
mechanisms and activation energies for grain growth were different in the two processes,
because of the dissimilar crystal structures.
The mean grain sizes after ageing at the different temperatures are shown in Figure 5.7, where
it is clear grain growth was less rapid than during annealing. The slower grain growth was
attributed to the supersaturated lattice, which had the propensity to eject the excess solute. This
was energetically more favourable than grain growth, as it would result in a more significant
decrease of the total energy. At all the ageing temperatures, the rates slowed with time, before
the mean size reached a plateau. The decrease in the rate was due to a decrease in the surface
area to volume ratio as the grains grew. There was a clear increase in the mean grain size and
growth rate with increasing temperature, Figure 5.7. Although there was nucleation of αTi from
the saturated βTi, it occurred at all the ageing the temperatures, and therefore it could not be
used as a basis for comparison. However, the mean grain size at 600oC was expected to be
much larger, had it not been for the competing transformation of the αTi to βTi at 590oC.

179
Similar small changes of grain size close to transformation temperatures have been reported in
nickel-based and other βTi alloys (Decker et al., 1956; Devaraj, 2011).
Figure 5.7: Grain size after solution treating the Timetal 125 style alloy and ageing at different
temperatures.
The relatively small increase in the mean grain size on increasing temperature from 400oC to
500oC was due to coarsening of the αTi precipitates, which occupied some of the volume
initially occupied by the βTi grains, as shown in Figure 5.8. Since the temperature was still
below the transus, further decomposition of the matrix to αTi was observed, leading to
shrinkage of the βTi grains and an increase in the volume occupied by the precipitates. If the
precipitation had been inside the grains, not much change in the grain size would have been
observed. However, like in many systems, precipitation was mainly on the grain boundaries as
shown in Figure 4.49, and this occurred at the expense of the βTi grain boundary area.
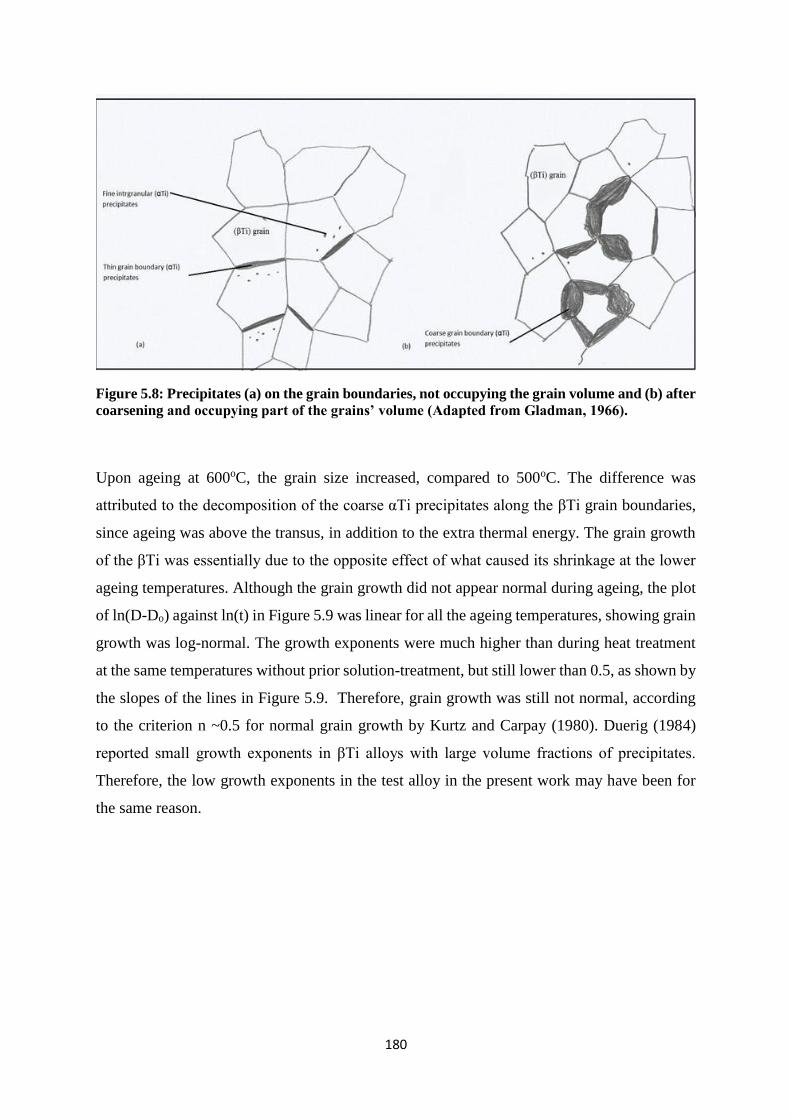
180
Figure 5.8: Precipitates (a) on the grain boundaries, not occupying the grain volume and (b) after
coarsening and occupying part of the grains’ volume (Adapted from Gladman, 1966).
Upon ageing at 600oC, the grain size increased, compared to 500oC. The difference was
attributed to the decomposition of the coarse αTi precipitates along the βTi grain boundaries,
since ageing was above the transus, in addition to the extra thermal energy. The grain growth
of the βTi was essentially due to the opposite effect of what caused its shrinkage at the lower
ageing temperatures. Although the grain growth did not appear normal during ageing, the plot
of ln(D-Do) against ln(t) in Figure 5.9 was linear for all the ageing temperatures, showing grain
growth was log-normal. The growth exponents were much higher than during heat treatment
at the same temperatures without prior solution-treatment, but still lower than 0.5, as shown by
the slopes of the lines in Figure 5.9. Therefore, grain growth was still not normal, according
to the criterion n ~0.5 for normal grain growth by Kurtz and Carpay (1980). Duerig (1984)
reported small growth exponents in βTi alloys with large volume fractions of precipitates.
Therefore, the low growth exponents in the test alloy in the present work may have been for
the same reason.

181
Figure 5.9: ln(D-Do) vs. ln(t) at the different ageing temperatures.
5.4 Mechanical properties of the Timetal 125 style alloy
The mechanical properties investigated were ultimate tensile strength, ductility, stiffness and
hardness, and they varied with heat treatment, mainly because of the resultant microstructure
and the αTi/βTi ratio. Although the sintered samples were not subjected to mechanical testing,
their microstructure and density indicated they had mechanical properties comparable to the
castings. Clearly, the sintering temperature, time and pressure have to be optimized in order to
eliminate porosity without excessive grain growth. Zhang et al. (2013) reported an increase of
ultimate compressive strength of Ti6Al4V (wt%) from 1578MPa to 1830MPa by increasing
cooling rate from 1.6oC.s-1 to 6.9oC.s-1, through rapid gas quenching. Similarly, the properties
of the sintered Timetal 125 are expected to be sensitive to the cooling rate.
5.5.1 Mechanical properties of the annealed Timetal 125 style alloy
The ultimate tensile strength of the Timetal 125 style alloy progressively decreased with
increasing annealing temperature, while its strain at fracture increased, as shown in Figure 5.10.
Momeni et al. (2015) carried out some compression tests on Timetal 125 and concluded the
alloy could be safely used up to at least 300oC, but the mechanical tests in the present work
were all done at room temperature. The decrease in strength and the corresponding increase in

182
ductility were both attributed to the dissolution of the βTi precipitates, as well as the increase
in the grain size. The mechanical strength of polycrystalline materials is affected by a number
of factors, including the presence of precipitates or a second phase, grain size, inclusions and
purity (Petch, 1953; Watanabe and Tsurekawa, 1999). Strain rate is also an important factor
(Zener and Hollomon, 1944), although it is not discussed further, since it was invariant in the
present work. Generally, fine grained materials have higher tensile and fatigue strengths than
coarser grained ones at ambient temperature (Petch, 1953).
Figure 5.10: Ultimate tensile strength and strain at fracture of Timetal 125 after annealing at
various temperatures.
In the as-cast condition, the Timetal 125 style alloy was fine-grained and had colonies of βTi
precipitates. These two features increased tensile strength, but were deleterious to ductility
(Zener, 1948; Petch, 1953; Taplin et al., 1979; Xiao et al., 2009). On annealing at 300oC, a
significant amount of the precipitates dissolved into the matrix, which decreased the
precipitation hardening, although the precipitates were probably too large for optimum
precipitation hardening. Additionally, the grain size increased, which decreased Hall-Petch
strengthening (Petch, 1953). So, there were at least two operative strengthening mechanisms
that were weakened by raising the temperature. Although the alloy was not observed under a
transmission electron microscope (TEM), where nanosized precipitates are resolvable, it is
likely that such precipitates, if present, could have also dissolved at 300oC. So, other
0
2
4
6
8
10
12
14
16
18
0
200
400
600
800
1000
1200
1400
1600
As-cast 300 400 500 600 700 800 900
UTS (MPa) Elongation (%)
UTS
(M
Pa)
Strain
at fracture (%
)
Temperature (oC)

183
strengthening mechanisms such as Zener pinning may have also been compromised (Zener,
1948).
The further decrease in strength at 400oC and 500oC was due to increased dissolution of the
precipitates and further grain growth, supported by Figures 4.32, 4.34 and 5.4. Although some
precipitation occurred inside the grains, it did not appear to strengthen the alloy. According to
Zener (1948), the morphology, size and distribution of precipitates determine their
strengthening effect. Generally, strength due to precipitation hardening tends to increase with
the amount of the second phase, due to solute drag and the ability of the many particles to
hinder the movement of dislocations. According to Smith et al. (1979), solute atoms may not
fit well into a lattice, and tend to segregate to the grain boundaries, where they are better
accommodated. Thus, the disorder and internal energy of the grain boundaries decrease, and
grain boundary mobility becomes more difficult (solute drag). So, as the βTi precipitates
dissolved at 400oC and 500oC, particularly from the grain boundaries, the alloy weakened as
the solute drag decreased, in addition to the decrease in the effective pinning of the grain
boundaries. Huang and Humphreys (2012) found that grain boundary mobility in Al-Mg alloys
depended strongly on the concentration of the magnesium solute. They attributed this to the
drag pressure on migrating grain boundaries, due to the magnesium solute that lagged behind.
The increase in the strain at fracture was also due to the precipitate dissolution, lower solute
drag and the increased grain size. As the grain size increased, the number of grain boundaries,
which are dislocations (Hull, 1975), decreased and allowed much more extension before
fracture. The dissolution of the precipitates also resulted in an improvement in ductility. In
addition to the dissolution of the precipitates, which resulted in a more homogenous
microstructure, the annealing also relaxed any micro-strains induced during the rapid cooling
after casting (Steels, 1991).
After annealing at 600oC, both tensile strength and hardness decreased further, while ductility
improved. This was in the two-phase region, hence some of the αTi transformed to (βTi), as
shown in Figure 4.35. Since the mean grain size was smaller than at the lower annealing
temperatures, the decrease in strength was not due to grain growth. The intragranular
precipitates obtained at the lower ageing temperatures had all dissolved, so if they had any
strengthening effect, it too was lost. The decrease in hardness was attributed to the formation
of the softer βTi at the expense of the former αTi grains. This was in agreement with Fopiano
and Hickey (1970) for Ti-6Al-4V, Ti-6Al-6V-2Sn and Ti-8Al-1Mo-1V, where the hardness of
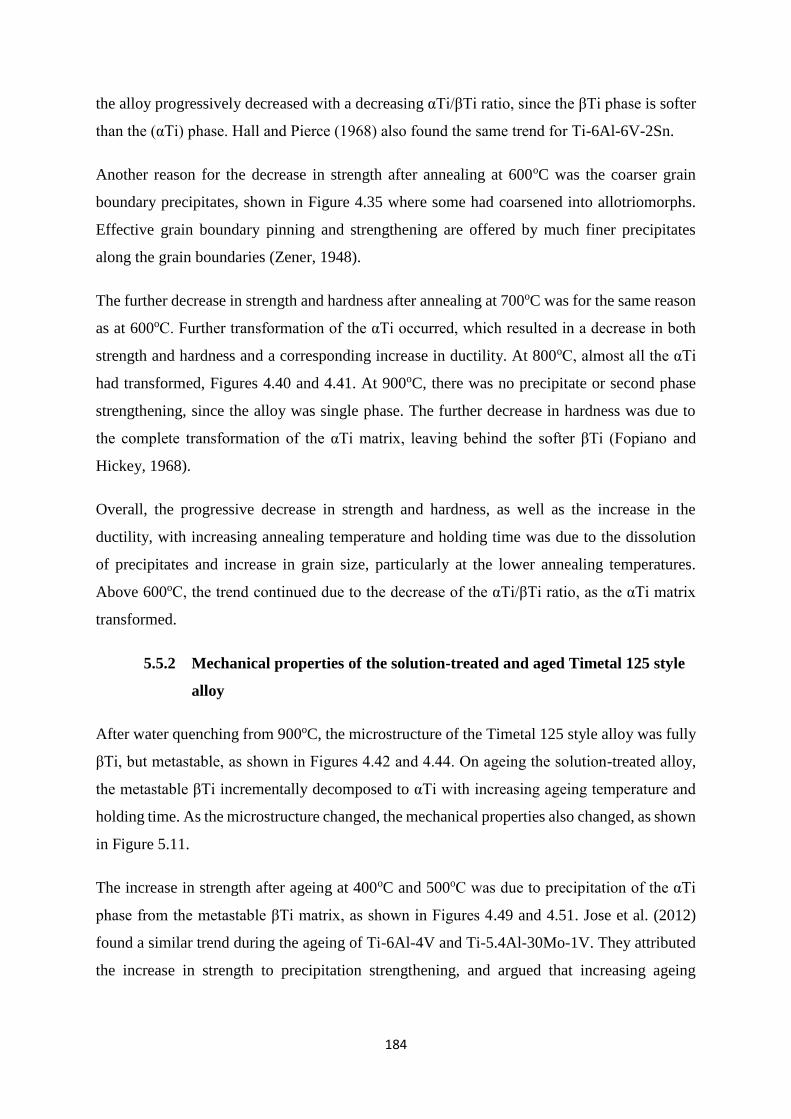
184
the alloy progressively decreased with a decreasing αTi/βTi ratio, since the βTi phase is softer
than the (αTi) phase. Hall and Pierce (1968) also found the same trend for Ti-6Al-6V-2Sn.
Another reason for the decrease in strength after annealing at 600oC was the coarser grain
boundary precipitates, shown in Figure 4.35 where some had coarsened into allotriomorphs.
Effective grain boundary pinning and strengthening are offered by much finer precipitates
along the grain boundaries (Zener, 1948).
The further decrease in strength and hardness after annealing at 700oC was for the same reason
as at 600oC. Further transformation of the αTi occurred, which resulted in a decrease in both
strength and hardness and a corresponding increase in ductility. At 800oC, almost all the αTi
had transformed, Figures 4.40 and 4.41. At 900oC, there was no precipitate or second phase
strengthening, since the alloy was single phase. The further decrease in hardness was due to
the complete transformation of the αTi matrix, leaving behind the softer βTi (Fopiano and
Hickey, 1968).
Overall, the progressive decrease in strength and hardness, as well as the increase in the
ductility, with increasing annealing temperature and holding time was due to the dissolution
of precipitates and increase in grain size, particularly at the lower annealing temperatures.
Above 600oC, the trend continued due to the decrease of the αTi/βTi ratio, as the αTi matrix
transformed.
5.5.2 Mechanical properties of the solution-treated and aged Timetal 125 style
alloy
After water quenching from 900oC, the microstructure of the Timetal 125 style alloy was fully
βTi, but metastable, as shown in Figures 4.42 and 4.44. On ageing the solution-treated alloy,
the metastable βTi incrementally decomposed to αTi with increasing ageing temperature and
holding time. As the microstructure changed, the mechanical properties also changed, as shown
in Figure 5.11.
The increase in strength after ageing at 400oC and 500oC was due to precipitation of the αTi
phase from the metastable βTi matrix, as shown in Figures 4.49 and 4.51. Jose et al. (2012)
found a similar trend during the ageing of Ti-6Al-4V and Ti-5.4Al-30Mo-1V. They attributed
the increase in strength to precipitation strengthening, and argued that increasing ageing

185
facilitated more precipitation and higher strength. A similar argument was given by Ibrahim et
al. (2012) for Ti-1.5Al-4.5Fe-6.6Mo (wt%), “LCB titanium”.
Ball (1971) extensively studied the factors affecting strength and ductility in Ti-6Al-6V-2Sn.
He found increased strength and hardness and a corresponding decrease in ductility with
increasing mass fraction of the αTi phase, and attributed this to second phase strengthening.
Ibrahim et al. (2012) recorded a maximum tensile strength of 1565MPa after ageing the LCB
titanium at 500oC for 0.5h, and a decrease to 1515MPa after holding for 4h. They attributed
the high strength after 0.5h to a good distribution of the secondary αTi phase inside the grains
and on the grain boundaries. There was more secondary αTi after 4 hours, which was
heterogeneously distributed inside the grains and on the grain boundaries, and they argued the
coarser αTi precipitates were not effective for strengthening (Ibrahim et al., 2012).
Figure 5.11: Ultimate tensile strength and strain at fracture of the Timetal 125 style alloy after
solution-treatment and ageing at various temperatures.
As the amount of the αTi increased in the Timetal 125 style alloy, both strength and hardness
increased, but at the expense of ductility, which was consistent with the findings of Ibrahim et
al. (2009). Ball (1971) and Ibrahim et al. (2012) found the strengthening decreased when the
precipitates coarsened, particularly after extended ageing. Additionally, heat treatment above
the transus resulted in the complete loss of the strengthening by the αTi phase, due to complete
transformation to βTi.
The decrease in strength and hardness after ageing at 600oC was due to the dissolution of the
0
2
4
6
8
10
12
14
16
18
0
200
400
600
800
1000
1200
1400
1600
ST 300 400 500 600 700 800 900
UTS (MPa) Elongation (%)
Temperature (oC)
UTS
(M
Pa)
Strain
at fracture (%
)

186
αTi precipitates, Figure 4.53. As temperature increased from 590oC to 800oC, the αTi/βTi ratio
continuously decreased in the two-phase field, until all αTi had transformed to βTi at the
transus. Thus, there was a strong positive correlation between the αTi/βTi ratio and strength,
while the opposite was true for ductility, which again concurred with Hickey (1966), Schwenk
et al. (1967), Hall and Pierce (1968), Molinev et al. (1970), Ball (1971) and Ibrahim et al.
(2009).
The dissolution of the αTi precipitates was clear, particularly comparing Figures 4.49 and 4.53.
Therefore, at 600oC, the Timetal 125 style alloy was over-aged. The further decrease in strength
and hardness after ageing at 700oC was due to further decomposition of the αTi precipitates,
Figure 4.55. The remaining precipitates were mainly concentrated inside the grains, which
according to Ibrahim et al. (2012) weaken the grain boundaries and decrease strength.
The continued loss of strength after ageing at 800oC was also due to further loss of the αTi
phase, Figure 4.56. Additionally, the grain size increased, further lowering strength. Grain size
increased because the competing α-β transformation had ceased (Brasche and Buck, 1989). The
overall hardness of the Timetal 125 style alloy during ageing varied as shown in Figure 5.12.
Barksdale (1968) found a hardness of ~200HV for pure titanium, furnace-cooled from 920oC,
whereas Rocha et al. (2006) measured ~340HV for Ti-6Al-6V. Smorlaczyk et al. (2013) found
hardnesses between 349HV and 468HV for Ti-6Al-4V, depending on heat treatment and
microstructure. The hardnesses observed in the current work were of the same order of
magnitude as those reported for Ti-6Al-4V (Rocha et al., 2006; Smorlaczyk et al., 2013), and
the effect of the relative amounts of the two phases on mechanical properties agreed with
Barksdale (1968) and Brasche and Buck (1989). Hardness was lowest in the solution-treated
state because of the absence of the harder αTi phase (Brasche and Buck, 1989). In the present
work, as the metastable βTi matrix transformed, the αTi/βTi ratio increased, resulting in an
increase in hardness. Like strength, hardness also reached a peak at 500oC. The drop above
500oC was due to over-ageing, which resulted in a decrease in the fraction of the αTi due to its
dissolution. The hardness was unlikely to optimum because of the coarse precipitates.

187
Figure 5.12: Overall Vickers hardness of the Timetal 125 style alloy after annealing and ageing
at different temperatures.
The effect of holding time on the ultimate tensile strength of the samples at the different ageing
temperatures is shown in Figure 5.13. Ageing between 300oC and 500oC increased the ultimate
tensile strength almost linearly with increasing holding time. The increase in strength with
increasing time was attributed to an increase in the amount of αTi precipitated and hence
increased second phase strengthening. As these temperatures were below the α → α+β
transformation temperature, the alpha precipitates were expected to increase with time.
Figure 5.13: Effect of holding time on the UTS of the Timetal 125 style alloy at the different ageing
temperatures.

188
It can be expected that extended ageing above 600oC would eventually result in a decrease in
strength as the microstructure had higher proportions of αTi. This is evident on the 500oC
graph, where no appreciable change in strength was observed after 40 minutes, Figure 5.13. A
similar trend was observed at 600oC and 700oC but only up to 60 minutes, beyond which there
was a noticeable decrease in strength. The increase in strength up to 60 minutes was for the
same reasons mentioned above, while the drop after 60 minutes was due to over-ageing. The α
→ α+β transformation temperature was 590oC, and ageing above this temperature resulted in
the strengthening alpha precipitates transforming to βTi and hence decreased precipitate
strengthening. Overall, there was an increase in strength with increasing ageing temperature up
to 500oC, and this was due to accelerated precipitation due to the increasing available thermal
energy. This trend is clearer in Figure 5.14, where the effect of ageing temperature on the
ultimate tensile strength of the samples is shown at different holding times.
Figure 5.14: Effect of holding time on the UTS of the Timetal 125 style alloy at the different ageing
temperatures.
The tensile strength had a maximum on each plot. The increase in strength was due to the
amount of the strengthening αTi precipitates increasing. The strength then decreased due to
over-ageing as the precipitates coarsened or transformed to the more stable βTi. The samples
aged for less than 40 minutes showed a UTS peak at 600oC and a shoulder at 500oC. This was
attributed to the formation of another precipitate, possibly αʹ, αʺ or βʹ. Samples aged longer

189
than 40 minutes had a single maximum UTS at 500oC. The samples aged for the longer periods
had the higher peak at 500oC, while those aged for shorter times had higher peaks at 600oC.
The absence of the second peak from the samples aged for longer was possibly because there
was sufficient time at high temperature to transform these non-equilibrium precipitates.
Figure 5.15 shows the variation of cross-sectional area (R.A) of the tensile specimens with
ageing temperature for different holding times. The plots had a minimum at 500oC for samples
aged for 40 minutes or longer. The samples aged for 20 or 30 minutes had the minimum at
600oC. The samples aged for 5 minutes had a minimum R.A at 700oC. This was possibly
because there was very limited time for the strengthening precipitates to form at the lower
temperatures.
Figure 5.15: Variation of R.A. with ageing temperature for different holding periods.
The decrease in R.A up to 500oC was in agreement with decreasing elongation as the strength
increased with increasing ageing temperature. Up to 500oC, the aspect ratio of the specimens
did not significantly change, since there was not much elongation before fracture. At these
lower temperatures the reduction in area decreased with increasing ageing time. This was in
agreement with the tensile test results in Figure 5.13, which showed that between 300oC and
500oC the strength increased with increasing holding time, due to increased precipitation of
αTi. Above 500oC, the reduction in area increased, both with increasing ageing temperature
and holding time. In the two phase region, both temperature and increasing time led to the
190
transformation of the α precipitates and a decrease in the α/β ratio, hence a decline in strength
and the corresponding increase in elongation at fracture. The effect of holding time on the
reduction in area is clearer in Figure 5.16.
Figure 5.16: Effect of holding time on the reduction in area at fracture after ageing at different
temperatures.
After ageing at between 300oC and 500oC, the reduction in area decreased with increasing
holding time at those temperatures. This was because these temperatures were the αTi stability
region, and hence the amount of the alpha precipitates increased with increasing soaking time.
Consequently, the precipitation hardening improved progressively with time. At 500oC, the
reduction in area slightly increased after holding for more than 60 minutes. This was attributed
to more pronounced decomposition of βTi to αTi, due to better kinetics because of the higher
temperature. The R.A. was initially small after ageing above 500oC for short holding times, but
significantly increased as holding time increased. The initial small values were due extensive
precipitation hardening, due to formation of a significant amount αTi precipitates in the early
stages of the ageing because of the good kinetics provided for by the high temperatures.
However, these precipitates dissolved or transformed to βTi as the temperature equilibrated
over time, since the temperatures were either in the two phase region or in the beta stability
region. Thus, as holding period increased, the strengthening effect of the alpha precipitates
diminished, resulting in lower strength, larger elongation, and hence higher reductions in area
at fracture.

191
5.5.3 Effect of grain size on the mechanical properties of the Timetal 125 style
alloy
Petch (1953) reported an inverse proportionality between the yield strength of a crystalline
material and the square of its mean grain size, as shown in the Hall-Petch relationship in
Equation 5.14.
𝛔𝐲 = 𝛔𝐨 +𝐤𝐲
𝐝𝟏/𝟐 Equation 5.14
where 𝜎𝑦 = yield strength of the material
𝜎𝑜 = base strength for dislocation movement
d = mean grain diameter
ky = Hall-Petch strengthening coefficient.
Petch (1953) showed that fine grained materials generally have higher yield strengths due to
the presence of many grain boundaries per unit volume. Grain boundaries are crystalline
defects that impede the movement of dislocations, and lead to dislocation pile-up, which in
turn creates a repulsive force against approaching dislocations (Petch, 1953; Hull, 1975). In
materials where Hall-Petch strengthening is the dominant mechanism, the yield strength is
related to the grain size by Equation 5.14. Therefore, a plot of the yield stress against the inverse
of the square root the mean grain diameter should yield a straight line. The slope of the line
will be equal to the strengthening coefficient of the material, and the intercept will be the
minimum strength for dislocation movement in the material, provided the strengthening
mechanism is dominated by grain size.
The Hall-Petch plot for the Timetal 125 style alloy is shown in Figure 5.17, and is clearly not
linear. This shows strengthening in the Timetal 125 style alloy was not only controlled by grain
size. There were other operative strengthening mechanisms, such as the precipitates. From
Figure 5.17, strength was higher in the coarser grained alloys, which is not typical of a material
where the strengthening mechanism is grain size (Petch, 1953). The Hall-Petch equation is
applicable to systems where strengthening is controlled by grain size, and the equation fails
when grain boundary strengthening is not the dominant mechanism (Conrad and Narayan,
2000; Kashyap and Chandrashekar, 2001).
During the annealing and ageing of the Timetal 125 style alloy, there was a constant change in
the mass and volume fraction of the αTi and βTi phases, presence or absence of precipitates of

192
different morphologies, as well as variation of grain size. All these parameters affected the
mechanical properties in different ways. The non-linearity of the Hall-Petch plot in Figure 5.17
does not mean grain size had no effect on the strength of the Timetal 125 style alloy. However,
it shows that Hall-Petch strengthening was not the dominant mechanism in the alloy. As
discussed earlier, the αTi/βTi ratio seemed to have a more significant effect, while the
morphology and distribution of the precipitates after each heat treatment cycle also had effects
on strength. To quantify the effect of grain boundary strengthening (Hall-Petch), it will be
important to investigate the effect of grain size on the yield strength in a phase field where
there are no competing processes, such as phase transformations.
Figure 5.17: Hall-Petch plot for the Timetal 125 style alloy.
5.6 Proposed thermomechanical treatment of the Timetal 125 style alloy
Timetal 125 was successfully produced by semi-centrifugal casting and spark plasma sintering
of blended elemental powders. The castings were thermally treated by annealing, followed by
solution-treatment and ageing. The results showed it was not possible to retain a fully βTi
microstructure in the as-cast condition, in spite of the high thermal conductivity of the copper
moulds and the fast cooling rates. Additionally, the Timetal 125 style metal is brittle in the as-
cast condition, making it unusable for any application with impact loading, or where tensile or

193
shear strength is important, such as a high strength fastener. To improve ductility and fracture
toughness, it was necessary to anneal, solution-treat and age. However, a separate annealing
heat treatment is not necessary, since annealing above 800oC resulted in the solution-treated
microstructure. After solution-treatment for 1h, water-quenching resulted in a homogeneous
βTi microstructure, which was metastable at low temperature. Therefore, a stabilizing heat
treatment was required. Furthermore, the alloy did not have a high strength in the solution-
treated state. So, after stabilizing the microstructure, it was critical to strengthen the alloy by
ageing, without significantly compromising ductility and fracture toughness. The short holding
times were based on the small size of the castings, and will increase in larger castings. So, the
proposed heat treatment cycle does not prescribe holding times. However, the heat treatment
temperature should be independent of the size of the casting.
To obtain Timetal 125 of high tensile strength, with good ductility and fracture toughness, it is
important to de-gas the starting powder mixture before any thermal treatment. The castings or
sintered alloys should be solution-treated between 850oC and 950oC. The holding time for each
heat treatment depends on the thickest section of the part. Thicker sections require more time
achieve a uniform temperature distribution (Richards, 1976; Johnson and Tomsett, 2013). The
holding times for different sections of titanium alloys are stipulated in the Indian Standard for
titanium alloys heat treatment, IS 12366, (Sangathan and Nehru, 1988).
All the heat treatments should be in a protected environment, through use of a protective gas
or a vacuum. After solution-treatment, the alloy should be water-quenched to retain the (βTi)
microstructure. Thereafter, it has to be aged between 500oC and 600oC to impart strength. After
the ageing, the Timetal 125 style alloy should be water-quenched, otherwise βTi transforms to
αTi. According to Greenfield and Pierce (1973), it may be necessary to anneal the solution-
treated and aged alloy, to remove micro-strains from the quenching, as well as to stabilize the
final microstructure and hence mechanical properties.
5.7 Summary
Thermal analysis succeeded in establishing the chemical reactions in the powder blend and the
associated reaction temperatures, as well as the transformation temperatures for the Timetal
125 style alloy. It proved to be a critical alloy design technique that is both time and cost
effective, particularly when complemented by Thermo-Calc calculations. The α+β phase

194
boundaries were accurately determined by DTA, and the temperatures corresponded well with
the microstructures at the different temperatures.
To obtain the best combination of strength and ductility, the Timetal 125 style alloy cannot be
solution-treated below 800oC, since the microstructure will not be fully βTi, according to the
DTA scans. If heat treated and quenched from a temperature below 590oC, the alloy will be
completely αTi, while if heat treated between 590oC and 800oC, it will be α +β. Although a
fully αTi microstructure will produce the highest ductility, it will not have the necessary
strength. Also, quenching from the α+β phase field without prior solution-treatment above the
transus will produce a duplex equiaxed microstructure, which will not strengthen the alloy
adequately. So, solution-treatment between 850oC and 950oC, as dictated by both DTA and the
optical microstructures, is a pre-requisite for strength. Thereafter, fine αTi should be nucleated
on the grain boundaries by ageing between 500oC and 590oC. If aged at a higher temperature,
the Timetal 125 style alloy loses strength as the αTi precipitates decompose to βTi.
The thermal analysis and metallography results, as well as the Thermo-Calc calculations, were
important for process design. Clearly, at the sintering temperature, as well as after
solidification, the Timetal 125 style alloy’s microstructure was fully βTi. A design that allows
direct water-quenching from these temperatures would eliminate the need to reheat to the
solution-treatment temperature, which would save costs, particularly for large sections. Also,
instead of immediately cooling from the casting or sintering temperature, the castings and
sintered alloys could be transferred to a furnace preheated to the solution-treatment
temperature, and subsequently quenched, provided a protective atmosphere is present
throughout the operation.
The microstructure of the castings and sintered Timetal 125 style alloy showed that cooling
rate was an important process parameter which needed close control. The presence of αTi after
casting or sintering showed the cooling was not rapid enough. Although the Timetal 125 style
alloy had its highest tensile strength in the as-cast condition, it was brittle and not tough. The
brittleness may support the presence of the omega phase in the as-cast condition, since the
phase has been associated with embrittlement in βTi alloys, where it has been observed. On
annealing the as-cast Timetal 125 style alloy to achieve higher ductility, the strength decreased
to below the EN6116 standard. So, an αTi matrix was not enough to impart the right
combination of strength and ductility. The increase in ductility was mainly due to the

195
dissolution of the βTi precipitates, increase in the mean grain size and perhaps the
decomposition of the omega phase, although this was not directly observed in the present work.
To obtain the desired mechanical properties, the Timetal 125 alloy should be water-quenched
from the ageing temperature, otherwise the βTi matrix transforms to αTi. It is important to
establish the time-temperature-transformation (TTT) curve for the Timetal 125 style alloy, to
use as a guideline for cooling the alloy. The transformation characteristics of the Timetal 125
style alloy should also be established, so that the depth of penetration of the βTi phase after
water-quenching is known. That way, the quenching set-up necessary to achieve a completely
βTi microstructure for any size section can be designed. So, to obtain the desired properties for
high strength fasteners, Timetal 125 has to have a non-equilibrium microstructure. This has
implications on the long term properties of the alloy, as the metastable microstructure could
transform in service. However, many similar metastable alloys have been successfully used on
critical components for many years without catastrophic results (Emsley, 2001; Merlin, 2009).
On the other hand, equilibrium cooling of the alloy would give the stable αTi phase, but with
this microstructure, the alloy would not achieve the strength levels recorded with the βTi
matrix.
The effects of the amount, nature and morphology of precipitates on the mechanical properties
of the Timetal 125 style alloy were discussed. The strength of the alloy depended mainly on
the amount and distribution of the αTi precipitates in the retained βTi matrix. Without the
precipitates, the alloy had very low strength, as shown by the solution-treated state. Relatively
fine precipitates, particularly on the grain boundaries, had the highest strengthening effect,
while they maintained the ductility of the alloy at an acceptable level. Once coarse, the
strengthening effect diminished, and this had implications on how the alloy was heat treated.
The coarsening occurred at relatively high temperatures, or after isothermally holding for
extended periods. So, the ageing temperature should be as low as possible, and the holding
time should be short.
Although the kinetics of grain growth in the Timetal 125 style alloy could not be fitted to the
known models, the growth obeyed thermodynamic principles in that it was rapid initially and
the grain size reached a plateau over time, showing the grain size would not infinitely increase
in time at any temperature. At any heat treatment temperature, the growth was either log-
normal or sigmoidal with time, and in this regard the grain models were obeyed. Deviation
from normalcy was with respect to grain size as a function of temperature. Generally, grain

196
size is expected to increase with increasing temperature, but after ageing at 800oC the mean
grain size of the Timetal 125 style alloy was smaller than at the lower temperatures. This was
because of the competing phase transformation at the temperature. So, the grain growth models
that were presented are limited to normal grain growth, where there are no side processes
competing for energy. It was also clear that the Hall-Petch effect was not the major
strengthening mechanism in the Timetal 125 style alloy, and strengthening by the secondary
αTi precipitates was more dominant.

197
6.Chapter 6
CONCLUSIONS AND RECOMMENDATIONS FOR FUTURE STUDY
6.1 Conclusions
This work set out to determine if Timetal 125 (Ti-2.7Al-5.7Fe-6Mo-6V, wt%) could be
produced from casting or sintering low cost elemental powders. Since it was possible to
produce the alloy by these methods, the study next sought to establish the thermochemical
treatments necessary to achieve the minimum mechanical properties for its use as a high
strength fastener for aerostructures, as specified in the EN6116 standard. The following were
found from the present study.
The Timetal 125 style alloy was consolidated to ~99% theoretical density by semi-
centrifugal casting or spark plasma sintering of its elemental powders.
Both the as-cast and sintered alloys contained micro-porosity.
The beta transus of the Timetal 125 style alloy was ~800oC on cooling, and the α+β
phase field existed down to room temperature.
As-cast Timetal 125 style alloy was fine grained αTi and βTi, with colonies of βTi
precipitates on some αTi grains.
The Timetal 125 style alloy had a strength >1500MPa and a strain at fracture of ~3%
in the as-cast condition, which would make it unusable as a high strength fastener in
this condition.
The Timetal 125 style alloy was softened by annealing between 300oC and 800oC.
Solution-annealing of Timetal 125 was optimally carried out between 850oC and 950oC.
Water quenching from the annealing temperature was sufficient to obtain a
supersaturated βTi microstructure at room temperature.
The solution-treated alloy was metastable, and naturally aged.
The Timetal 125 style alloy was significantly strengthened by artificial ageing.
On ageing, αTi precipitates nucleated on the βTi grain boundaries, and strengthened the
alloy, but reduced its ductility.
The strength of the aged Timetal 125 style was directly proportional to the amount of
α, which in turn depended on the ageing temperature and time.

198
After ageing above 400oC, long ageing times led to coarsening of the αTi precipitates,
and a reduction in strength.
The Timetal 125 style alloy had an ultimate tensile strength of ~1285 MPa and
elongation of ~6.3% after ageing at 500oC, and conformed to EN6116 specifications in
this state.
The Timetal 125 style alloy lost strength due to over-ageing above 590oC, or if held
isothermally between 500oC and 590oC after ageing for more than 2 h.
Generally, the mean grain size of the Timetal 125 style alloy increased with annealing
or ageing temperature and time.
When there were competing processes, such as precipitation and grain growth, the mean
grain sizes did not conform to standard models of normal grain growth.
The mean grain size after annealing or ageing in the α+β phase field was smaller than
at the lower heat treatment temperatures, since the matrix had to accommodate both
phases.
Hall-Petch strengthening was not the dominant mechanism in the Timetal 125 style,
since there was no correlation between grain size and strength.
6.2 Recommendations for future study
Many aspects of the current work could have been done better or differently had there been no
constraints on equipment and time. To gain even better understanding of the properties and
behaviour of the Timetal 125 style alloy, the limitations of the present work need to be
addressed, and the following areas should be further explored.
While most DTA peaks were successfully related to transformations on established
binary, as well as the available ternary phase diagrams, a more direct measurement by
in situ HT-XRD is necessary. All the peaks which could not be attributed to
transformations on the current phase diagrams should be identified with HT-XRD.
The somewhat abnormal differential thermal behaviour of the vanadium powder needs
further investigation. It is important to establish if the broad peak was strictly due to
vanadium, or if it was an artefact of the powder that was used in the present work. In
this regard, vanadium powders from other suppliers would have to be thermally
analysed. If the peak was consistent, then it may be necessary to use cast vanadium to
confirm whether it is truly representative.

199
The casting operation, using the Manfredi induction casting machine, relied mainly on
human judgment, and so the actual casting parameters were not convincingly
established. A better understanding of the heating rate during induction, pouring
temperature and centrifuging speed is necessary to better control the casting operation.
A data logger is necessary to keep track of heating rate and temperature during the
casting operation.
While the theoretical density of the sintered Timetal 125 style alloy was about 99%, it
is important to make it even higher. Thus, work should be done to establish if the alloy
can be subsequently hot isostatically pressed to decrease porosity, and hence improve
its density.
Additionally, it would be useful to investigate if cold isostatic pressing of the green
compacts prior to spark plasma sintering could improve the density of the sintered alloy.
A better furnace configuration which uses a vacuum instead of protective gas could
protect the workpieces even more, since titanium can scavenge even the very low levels
of oxygen in industrially pure argon or helium.
The ampoules containing the test samples were not broken upon contacting the
quenching water, to prevent oxidation. So, the cooling could have been more rapid. The
retention of a completely βTi microstructure is only possible upon water-quenching of
a beta-stabilised titanium alloy from the βTi phase field. In future work, the ampoules
need to be broken on contact with the water to allow direct contact of the alloys with
water. The microstructures of such samples should be compared to those produced in
this work to establish any fundamental differences. However, after direct water
quenching, it is important to grind off the samples’ surfaces to remove the alpha casing
before further analysis.
Evaluation of the microstructures was limited to optical and scanning electron
microscopy. While optical microscopy was powerful for understanding the phases, their
morphology, grain boundaries and similar features, it could not resolve much finer
particles. Scanning electron microscopy, particularly when combined with EDX, was
useful in establishing the compositions of the phases of the Timetal 125 style alloy.
However, a much deeper understanding the alloy could be obtained by analyzing near
an atomic scale by high resolution transmission electron microscopy (HRTEM). It is
possible that some phases could not be identified by optical and scanning electron
microscopy, as well as by XRD. One such phase could be omega titanium. Such small

200
particles may have significant effects on the mechanical properties, making their
understanding important. Therefore, future research effort on Timetal 125 should seek
to understand the real operative strengthening mechanisms at the scale of dislocations,
and HRTEM will be necessary.
As Ti, Mo and V are strong carbide formers, they should be analysed for carbon, as
well as oxygen and nitrogen, since these have an effect on the microstructure and
mechanical properties.
Surface analyses of the starting powders for oxygen and hydroxyl species is
recommended, since these persist through any high temperature processing of titanium,
with deleterious effects on the mechanical properties of the final alloy.
More mechanical properties could have been directly measured. While the stress-strain
curves gave a good indication of other properties, such as fracture toughness, direct
measurements would be more accurate. The mechanical testing was limited mainly to
tensile tests, yet properties such as compression and shear strength are also important.
Direct measurement of shear strength is particularly important, since high strength
fasteners are constantly subjected to shear.
All the mechanical tests were at ambient temperature, although service temperatures of
Timetal 125 can be up 300oC. Thus, it is important to investigate how its mechanical
properties depend on temperature. There are well-established tensile testing instruments
which could be used to determine the tensile and compression strengths, elongation and
fracture toughness of Timetal 125 as a function of temperature.
The fatigue resistance of the Timetal 125 style alloy was not measured in the present
work, yet it is an important design property which needs investigation in the future.
High strength fasteners are subjected to cyclic loading, and could fail by fatigue. So, it
is important to establish their fatigue resistance and how it varies with temperature.
The corrosion resistance of Timetal 125 is an important property which needs
investigation. It determines the integrity, longevity and safety of the assemblies
fastened by the alloy. Timetal 125 contains iron, an element prone to corrosion. How
the components of the alloy interact to alter the corrosion resistance of titanium was not
investigated in this work, and needs attention.

201
7.Chapter 7 References
Adam, Kensington, N. (1941) The Physics and Chemistry of Surfaces, 3rd Edn., Oxford University
Press, UK, pp. 35-39.
Ageev, N.V., Petrova, L.A. (1973) Metastable Beta-Alloys of Titanium, Defence Technical
Information Centre, Foreign Technology Division, Ohio, USA, pp. 1-11.
Ahmed, T., Flower, H.M. (1992) The Phase Transformation in Alloys Based on Titanium
Aluminides Ti3Al-V and TiAl-V, Materials Science Engineering A., Vol. 152, pp. 31-36.
Ahmed, T., Rack, H.J., Flower, H.M. (1994) Liquidus Projection of Ti-Al-V System Based on Arc
Melted and Cast Microstructures, Materials Science and Technology, Vol. 10, pp. 681-690.
Ahmed, T., Flower, H.M. (1994) Partial Isothermal Sections of Ti-Al-V Ternary Diagram,
Materials Science and Technology, Vol. 10, pp. 272-288.
Aloman, A., Georgeta, C. (2006) Critical Analysis of the Ti-Al phase diagram, Science Bulletin,
Series B, Vol. 68, pp. 1-14.
Arajs, S., Colvin, R.V. (1964) Ferromagnetic‐Paramagnetic Transition in Iron, Journal of Applied
Physics, Vol. 35 (2), pp. 1-3.
Arrhenius, S.A. (1889) Über die Dissociationswärme und den Einflusß der Temperature auf den
Dissociationsgrad der Elektrolyte, Journal of Physical Chemistry., Vol. 4, pp. 96–116.
Arnold, S.V. (1959) US Army requirements for titanium with respect to vehicular use, Water Town
Arsenal Laboratories, USA, pp. 1-43.
Bain, E.C.,Griffiths, E.W. (1927) Introduction to iron-chromium-nickel alloys, Transactions
AIME, Vol. 75, pp. 166-213.
Ball, M.J. (1971) Factors affecting the ductility and microstructure of Ti-6Al-6V-2Sn titanium
alloy weldments, Master of Science Thesis, Missouri University of Science and
Technology, Curtis Laws Wilson Library, pp. 97-109.
Batalu, D., Cosmeleata, G., Aloman, A. (2006) A critical analysis of the Ti-Al phase diagrams,
Science Bulletin, Vol. 68 (4), pp. 77-81.
Beck, P.A. (1956) Orientation Relationships in Recrystallization and in Grain Growth,
Metallurgical Transactions, Vol. 3, pp. 16-25.
Bein, S., Bechet, J. (2006) Phase transformation kinetics and Mechanisms in Titanium Alloys Ti-
6.2.4.6, β-CEZ and Ti-10.2.3., Journal de Physique, Vol. 44 (1), pp. 99-108.
Birmingham, M.J., McDonald, S.D., Dargush, M.S., St. John, D.H. (2007) Microstructure of Cast
Titanium Alloys, Materials Forum, Vol. 31, pp. 84-89.

202
Birringer, R. (1989) Nanocrystalline materials, Journal of Materials Science and Engineering,
Vol. 117A, pp. 33-43.
Biswas, C.P. (1973) Strain Hardening of Titanium by Severe Plastic Deformation, PhD Thesis,
Massachusetts Institute of Technology, USA, pp. 1-133.
Bohanek, E. (1973) Titanium Science and Technology, Vol. 3, Plenum Press, New York, p. 35-61.
Boyer, R.R. (1994) Aerospace Applications of Beta Titanium Alloys, Journal of Metals, Vol. 46
(7), pp. 20-23.
Branemark, P.I. (1983) Osseointegrated Titanium Fixtures in the Treatment of Edentulousness,
Biomaterials, Vol. 4, pp. 25–28.
Braun, J., Ellner, M. (2001) Phase Equilibria Investigations on the Aluminium-Rich part of the
Binary System Ti-Al, Metallurgical and Materials Transactions, Vol. 32A, pp. 1037-1047.
Brooks, C.R. (1982) Heat treatment, Structure and Properties of Non-ferrous Alloys, ASM
International, Metals Park, Ohio, USA, pp. 93-106.
Brown, E., Harold, G., Hoyler, C.N., Bierwirth, R.A. (1947) Theory and application of radio-
frequency heating, D. Van Nostrand Company Inc. New York, USA, pp. 1-9.
Bumps, E.S., Kessler, H.D., Hansen, M. (1952) Titanium- Aluminium System, Transactions of the
AIME, Vol. 194, pp. 609-614.
Bullens, D. K. (1938) Steel and Its Heat Treatment, Vol. I, 4th Edn., John Wiley & Sons Inc., New
York, USA, pp. 85-87.
Campanelli, C. (2016) Comparison of The Fatigue Strength of Ti-5553 And Ti-6Al-4V for
Aerospace Applications, Proceedings of the 13th world conference on Titanium, 16-20
August, 2015, California, USA, pp. 385-398.
Campbell, F.C. (2006) Manufacturing technology for aerospace structural materials, Elsevier,
Amsterdam, Kidlington, pp. 38-45.
Chan, K.W., Tjong, S.C. (2014) Effect of secondary phase precipitation on the corrosion behaviour
of duplex stainless steels, Materials Journal, Vol. 7, pp. 5268-5304.
Chandrasekaran, V., Taggart, R., Polonis, D.H. (1972) Phase Separation in the beta phase of Ti-
Mo binary alloys, Metallography, Vol. 5 (1), pp. 393-398.
Chang, Y.A., Neumann, J.P., Chen, S. (1990) Thermodynamic Stability of Ordered Intermetallic
Compound Phases, paper presented at the Materials Research Society Symposium
Proceedings, San Francisco, USA, pp.1-6.
Chaudbury, P.K., Long, M., Rack, H.J. (1992) Effect of vanadium on elevated temperature phase
relations titanium aluminides containing 44 at.% Al, Materials Science and Engineering,
Vol. A152, pp. 37-40.
203
Chen, J.K. (2005) Introduction to phase transformations and precipitation, National Sciences and
Engineering Research Council, Canada, pp. 1-12.
Chernova, G.P., Tomashov, N.D., Altovsky, R.M. (1961) Passivity and Corrosion Resistance of
Titanium and its Alloys, Journal of the Electrochemical Society, Vol. 1, pp. 3-7.
Chin, E.S.C, Bierderman, R.R. (1992) The Titanium-Aluminium Phase Diagram, U.S. Army
Materials Technology Laboratories, Massachusetts, USA, Report 44/1, pp. 1-45.
Chureemart, J., Pinsook, U. (2006) The Temperature of the hcp-bcc Phase Transition in Titanium,
Journal of Science, Vol. 31 (1), pp. 25-31.
CIMCOOL (2007) Machining Titanium, internal report 3/07, Milacron Marketing Co., Cincinnati,
Ohio, USA, pp. 1-8.
Collings, E.W. (1975) Solute-induced lattice stability as it relates to superconductivity in titanium-
molybdenum alloys, Solid State Communications, Vol. 18 (12), pp. 1493–1495.
Collings E.W. (1979) Magnetic Studies of Phase Equilibria in Ti-Al (30-57 at.%) Alloys,
Metallurgical Transactions, Vol. 10A, pp. 463-474.
Cotton, J.B., Hines, J.G. (1968) Hydriding of Titanium in Chemical Plant & Protective Measures,
International Conference on Titanium, London, UK, pp. 1-6.
Cottrell, T.L. (1958) The Strength of Chemical Bonds, 2nd Edn., Butterworth, London, UK, pp. 89-
114.
Covington, L.C., Schutz, R.W (1981) Industrial Application of Titanium and Zirconium, ASTM
SP 728, American Society for Testing and Materials, pp. 163-180.
Crossley, F.A. (1981) Aircraft Applications of Titanium: A Review of the Past and Potential for
the Future, Journal of Aircraft, Vol. 18 (12), pp. 993.
Danielson, P., Wilson, R., Alman, D. (2008) Metallographic preparation of titanium, Application
Notes, Struers, USA, pp. 1-6.
Davidge, R.W. (1979) Mechanical Behaviour of Ceramics, Cambridge University Press,
Cambridge, UK, pp. 67-72.
Davim, J.P. (2008) Ed., Machining: fundamentals and recent advances, Springer, London, pp. 1-
61.
Davis, J.R. (2004) Ed., Aluminium and Aluminium Alloys, ASM Specialty Handbook, Materials
Park, Ohio, USA, pp. 36-42.
Davis, J.R. (1997) ASM Specialty Handbook: Heat resistant materials, The Materials Information
Society, Materials Park, Ohio, USA, p. 350.

204
Decker, R.F., Rush, A.I., Dano, A.G., Freeman, J.W. (1956 ) Abnormal grain growth in Nickel-
base heat resistant alloys, The National Advisory Committee for Aeronautics, report no.
51, University of Michigan, USA, pp. 5-9.
Degamo, P.E., Kohser, J.T., Ronald, A. (2003) Materials and Processes in Manufacturing, 9th
Edn., McGraw-Hill, New York, USA, pp. 93-107.
Demer, L.J., Beck, P.A. (1948) Effect of composition on grain growth in aluminium-magnesium
solid solutions, American Institute of Mining and Metallurgical Engineers, Technical
publication no. 2374, pp. 1-16.
Devaraj, A. (2011) Phase Separation and Second Phase Precipitation in Beta Titanium, PhD
Thesis, Toulouse Graduate School, University of North Texas, USA, pp. 3-24.
Doherty, R.D. (2005) Primary Recrystallization, Encyclopaedia of Materials: Science and
Technology, Elsevier Science, Atlanta, USA, pp. 7847-7850.
Donachie, M.J. (2000) Titanium: A Technical Guide, 2nd Edn., ASM International, Materials Park,
Ohio, USA, pp. 101-103.
Duerig, T.W., Williams, J.C. (1984) Overview: Microstructure and Properties of Beta Titanium
Alloys, NDC, CA, USA, pp. 19-69.
Detavernier, C., Deduytsche, D., Van Meirhaeghe, R.L., De Baerdemaeker, J., Dauwe, C. (2003)
Room-temperature grain growth in sputter-deposited Cu films, Applied Physics Letters,
Vol. 82, p. 1863.
Duwez, P. (1949) Titanium, Metals Technology, Vol. 2 (1), pp. 1-4.
Duwez, P. (1951) Partial Titanium-Vanadium Phase Diagram, Journal of Metals, AIME
Transactions, Vol. 3, pp. 13-19.
Duwez, P., Taylor, J.L. (1952) The Titanium-Aluminium Phase Diagram, Transactions of the
Metallurgical Society of the AIME, Vol. 194, pp. 70-71.
Ekman, M., Sadigh, B., Einnarsdotter, K. (1998) Ab initio study of the bcc-hcp transformation in
iron, Physical Review B, Vol. 59 (9), pp. 5296-5303.
Elias, C.N., Lima, J.H.C., Valiev, R., Meyers, M. (2008) Biomedical Applications of Titanium and
its Alloys, Journal of Medicine, Vol. 4, pp. 46-49.
El-Khozondar, R.J., El-Khozondar, H.J. (2008) Numerical modelling of microstructural evolution
in three-phase polycrystalline materials, The Abdus Salam International Centre for
Theoretical Physics, IC/2008/077, pp. 1-17.
Elliot, R.P. (1962) Diffusion in Titanium and Titanium Alloys, Technical Documentary Report
No. ASD-TDR-62-561, Armed Services Technical Information Agency, pp. 1-67.

205
Emsley, J. (2001) Titanium. Nature’s building blocks. An A-Z guide to the Elements, Oxford
University Press, UK, pp. 454-548.
Ence, E., Margolin, N.H. (1961) Phase Relations in the Titanium-Aluminium System,
Transactions AIME, Vol. 22, p. 151.
Eremenko, V.N. (1962) Titanium - Aluminium - Vanadium, Mnogokomponentniye Splavy Titana,
Izd. AN UkrSSR, Kiev, pp. 37-42.
Es-Souni, M. (2001) Creep behaviour and creep microstructures of a high temperature titanium
alloy Ti-5.8Al-4.0Sn-3.5Zr-0.7Nb-.35Si-0.06C (Timetal 834). Primary and Steady-state
creep, Materials Characterization, Vol. 46, pp. 365-379.
Ezugwu, E. (2005) Evaluation of the performance of CBN tools when turning Ti–6Al–4V alloy
with high pressure coolant supplies, International Journal of Machining Tools
Manufacturing, Vol. 45(9), pp.1009–1014.
Fanning, J. (2000) Near-beta titanium alloy for high strength applications and methods for
manufacturing the same, Patent EP2435591 A1, USA, pp. 1-4.
Ferencz, P., Grama, L. (2011) Analysis of the possible causes of porosity in aluminium high
pressure die-cast parts, Scientific Bulletin of the Petru Maior, Vol. 8 (25), pp. 41-46.
Fraizer, E., Cook, J. (1989) An X-Ray Diffraction of RST Al-Ti-V Alloys, Scripta Metallurgica.,
Vol. 23, pp. 39-43.
Frenkel, Ј. (1945) Viscous flow of crystallite bodies under the action of surface tension, Journal
of Physics, Vol. 9 (5), pp. 385-391.
Froes, F.H., Faller, K. (2001) Titanium in Automobiles, The Minerals, Metals and Materials
Society, Vol. 1, pp. 47-56.
Fopiano, P.J, Hickey, C.F. (1968) Strengthening mechanisms during heat treatment of three
titanium alloys- Ti-6Al-4V, Ti-6Al06V-2Sn and Ti-8Al-1Mo-1V, Metals Laboratory
report, Army Materials Research Centre, USA, pp. 1-49.
Fujii, H. (1998) Strengthening of α + β titanium alloys by thermomechanical processing, Minerals
Science and Engineering, Vol. A243, pp. 103-108.
Furukawa, G.T., John L. Riddle J.L., Bigge, W.R. (1971) The International Practical Temperature
Scale of 1968 in the Region 13.81 K to 90.188 K as Maintained at the National Bureau of
Standards, Institute for Basic Standards, National Bureau of Standards, Washington , D.C.
20234, p. 6.
Gasbarre, W.R., MacGeehan, P. (2012) Powder Metallurgy Roadmap, Technology Update for the
Powder Metallurgy Industry, Metal Powder Industries Federation, pp. 1-17.

206
Gasik, M.M., Keski, H., Bilotsky, Y. (2009) Sintering Kinetics of Titanium and Titanium Alloys,
17th Plansee Seminar, Vol. 1, pp. 1-10.
German, R.M. (1996) Sintering Theory and Practice, John Wiley & Sons, Inc., New York, USA,
pp. 27-40.
Gladman, T. (1966) On the Theory of the Effect of Precipitate Particles on Grain Growth in Metals,
Proceedings of the Royal Society A, Vol 294 (1438), pp. 275-281.
Goijaerts, A.M., Govaert L.E., Baaijens F.P.T. (2001) Evaluation of the ductile fracture models of
metals in blanking, Journal of Materials Processing, Vol. 110, pp. 312-323.
Greaves, R.H. (1924) Supersaturated solid solutions, Journal of the Royal Microscopical Society,
Vol. 44 (4), pp. 375-381.
Green, H., Brown, N. (1954) Age softening of beta brass, Journal of Metals, Vol. 1(109), pp. 2-7.
Greenfield, M.A., Pierce, C.M. (1973) Post-weld ageing of a metastable beta titanium alloy, 54th
AWS meeting, Chicago, USA, pp. 524-529.
Greiner, E.S., Ellis, W.C. (1948) Thermal and Electrical Properties of ductile Titanium, Metals
Technology, Vol. 15, pp. 5-6.
Guo, Z., Malinov, S., Sha, W. (2005) Modelling beta transus temperature of titanium alloys using
artificial neural network, Computational Materials Science, Vol. 32, pp. 1-12.
Gupta, G. Weinig, S. (1962) Interactions between interstitial and substitutional solutes in an H.C.P.
lattice, Acta Metallurgica, Vol. 10 (4), pp. 292–298.
Hamajima, T., Lütjering, G., Welssmann, S. (1973) Importance for slip mode for dispersion-
hardened β-titanium alloys, Metallurgical Transactions, Vol. 4 (3), pp. 847-856.
Hall, J.A., Pierce, C.M. (1968) Effect of microstructure on the properties of Ti-6Al-6V-2Sn, Air
force Materials Laboratory Report, USA, pp. 1-21.
Hammond, C. and Kelly, P. M. (1968) Martensitic Transformations in Titanium Alloys,
International Conference on Titanium, London, UK, pp. 1-7.
Hansen, M., Kamen, E.L., Kessler, H.D., McPherson, D.J. (1951) Systems Titanium-Molybdenum
and Titanium-Columbium, Journal of Metals, Vol. 1, pp. 882-891.
Hashimoto, K., Doi, H., Tsujimoto, T. (1986) Reexamination of the Ti-Al-V Ternary Phase
Diagram, Transactions of the Japan Institute of Metals, Vol. 27(10), pp. 741 to 749.
Hayes, F.H. (1993) Aluminium - Titanium - Vanadium, MSIT Ternary Evaluation Program
Effenberg, G. (Ed.), MSI, Materials Science International Services GmbH, Stuttgart;
Document ID: 10.13932.1.20, pp. 3-21.
Hayes, F.H. (1995) The Al-Ti-V (Aluminium - Titanium - Vanadium) System, Journal of Phase
Equilibria, Vol.16, pp. 163-176.

207
Haylock, L. (2007) Evaluation of Timetal 555 high strength fasteners, Alcoa Inc., Alcoa Fastening
Systems, Carson, USA, pp. 1-2.
Hickey, C.F. (1966) Effect of microstructure and cooling rate on the mechanical properties of Ti-
6Al-6V-2Sn, Journal of Materials, Vol. 1 (1), pp. 89-90.
Hildebrand, J.H. (1929) An improvement in the theory of regular solutions, American Chemical
Society, Vol. 51, pp. 66-67.
Hoch, M., Viswanathan, R. (1971) Thermodynamics of titanium alloys: III. The Ti-Mo system,
Metallurgical Transactions, Vol. 2 (10), pp. 2765-2767.
Hong, B.O, Wang, J., Duarte, L., Liu, H. Liu, L. (2012) Thermodynamic reassessment of the Ti-
Fe binary system, Transactions of non-ferrous metals of China, Vol. 22, pp. 2204-2211.
Horiya, T., Kishi, T. (1994) Fracture Toughness of Titanium Alloys, Nippon Steel Technical
Report, No. 62, pp. 1-7.
Huber, R.W., Goode, R.J. (1965) Fracture-Toughness Test for Titanium Alloy Plate and Forgings,
U.S. Naval Research Laboratories, Washington DC, USA, pp. 1-9.
Hull, D. (1975) Introduction to Dislocations, 2nd Edn., Pergamon Press, Oxford, UK, pp. 232-260.
Hultgren, R., Desai, P.D, Hawkins, D.T, Gleiser, M., Kelly, K.K. (1973) Selected values of the
thermodynamic properties of binary alloys, American Society of Metals, Metals Park,
Ohio, USA, pp. 79-83.
Hume-Rothery, W., Powell, H.M., Krist, Z. (1935) Factors Affecting Stabilities of Super lattice
Structures, Nature, Vol. 91 (23), pp. 78-85.
Hurtung, P.D., Kramer, B.M., von Turkovish, B.F. (1982) Tool wear in titanium machining, CIRP
Annals-Manufacturing Technology, Vol. 31(1), pp. 75-80.
Ibrahim, K.M., Mhaede, M., Wagner, L. (2012) Microstructure Evolution and Mechanical
Properties of heat treated LCB titanium alloy, Transitions of Non-ferrous Metals Society
of China, Vol. 22, pp. 2609-2615.
Ivasishin, O.M. (2003) Precipitation and Recrystallisation behaviour of beta titanium alloys during
continuous heat treatment, Metallurgical and Materials Transactions, Vol. 34A, pp. 147-
158.
Jin, Z., Qui, C. (1993) An experimental study and thermodynamic evaluation of the Fe-Mo-Ti
system at 1000°C, Metallurgical Transactions A, Vol. 24(10), pp. 2137–2144.
Jong, T.M., Yong, Y.L. (1995) Differential Thermal Analysis of the Self-propagating High-
temperature Synthesis of Ti-Al mixture, Korean Journal of Materials Research, Vol. 5 (3),
pp. 345-347.

208
Jordan, C.B., Duwez, P. (1956) Approximate Phase Relationships in the Titanium-Aluminium-
Vanadium System at 1800°F and at 1400°F”, Transactions of the American Society of
Metals, Vol. 48, pp.783-794.
Jose, A., Josephkunchu, P., Abraham, M.A. (2012) Effect of ageing on Ti-6Al-4V and Ti-5.4Al-
3Mo-1V alloys, International Journal of Engineering Sciences Research, Vol. 3 (6), pp.
888-893.
Jovanovic, M.T., Bobic, I., Miskovic, Z., Zec, S. (2009) Precision casting of T—based alloys-
Microstructure and Mechanical Properties, Journal of Metals, Vol. 15 (1), pp. 53-69.
Kainuma, R., Fujita, Y., Mitsui, H., Ohnuma, I., Ishida, K. (2000) Phase Equilibria around (hcp,
β(bcc) and ϒ(L10) Phases in Ti-Al Base Ternary Alloys, Intermetallics, Vol. 8, pp. 855-
867.
Kattamis, T.Z., Flemings, M.C. (1966) Dendrite Structure and Grain Size of Undercooled Melts,
Transactions of the Metallurgical Society, Vol. 236, pp. 1520-1526.
Kim, N.J. (1983) The physical metallurgy of HSLA pipeline steels-A review, Journal of Metals,
Vol. 35, p. 21-27.
Kirkaldy, J.S. (1980) A Zener-Hillert model for growth in binary alloy cells, Scripta Metallurgica,
Vol. 14 (7), pp. 739-744.
Kikuchi, R. (1951) A theory of cooperative phenomena, Physical Review, Vol. 81, pp. 988-1003.
Knott, J.F. (1973) Fundamentals of Fracture Mechanics, 1st Edn., John Wiley and Sons, New
York, USA, pp. 34-42.
Kornilov, I.I., Volkova, M.A.(1968) Partial Phase Diagram of the Ternary Ti-Al-V System (up to
45 wt.% Al), Novye Issledovaniya Titanovykh Splavov, pp. 78-89.
Kostov, A., Zivkovic, D., Friedrich, B. (2006) Thermodynamic study of the Ti-V and Al-V system
using FACTSAGE, Journal of Mining and Metallurgy, Vol. 42(B), pp. 57-65.
Kubaschewski, O., Hopkins, B.E. (1962) Oxidation of Metals and Alloys, Butterworths, London,
UK, pp. 59-76.
Kubaschewski, O., Von Goldberg (1983) Titanium: Physico-chemical properties of its compounds
and alloys, International Atomic Agency, Issue 19, Vienna, Germany, pp.75-83.
Kroll, W. (1940) The Production of Ductile Titanium, Transactions of the Electrochemical Society,
Vol. 78, pp. 35-47.
Lamaire, J.C., Backofen, W.A. (1972) Adiabatic instability in orthogonal cutting of steel,
Metallurgical Transactions, Vol. 3, pp. 477-480.
Lennard-Jones, J.E. (1924) On the Determination of Molecular Fields, Proceedings of the Royal
Society, London, A106 (738), pp. 463-477.

209
Levi, C.G., Valencia, J., Meiirabian, R. (1987) Processing of Structural Metals by Rapid
Solidification, ASM, Metals Park, Ohio, USA, pp. 44-47.
Levy, R.A. (1968). Principles of Solid State Physics, Academic Press, Cambridge, Massachusetts,
USA, pp. 179-193.
Leyens, C., Peters, M., Eds. (2003) Titanium and Titanium Alloys: Fundamentals and
Applications, WILEY-VCH Verlag GmbH & Co. KgaA, Wiehneim, Germany, pp. 38-65.
Liberini, M., Scherillo, U., Astarita, A., Prisco, U., Bruno, M., Monetta, M., Bellucci, F., Squillace,
A. (2016) Microstructure of a Hot Forged Ti 5-5-5-3 Aeronautical Component, Journal
of Metallography, Microstructure and Analysis, Vol. 5(3), pp. 207-216.
Loiseau, A., Vannuffel, C. (1988) TiAl2: A re-entrant Phase in the Ti-Al system, Journal of Solid
State Physics, Vol. 107, pp. 655-671.
Luo, Y.R. ((2007) Comprehensive Handbook of Chemical Bond Energies, CRC Press, Boca Raton,
Florida, USA, pp. 9-13.
Lütjering, G., Williams, J.J.C. (2007) Titanium, 2nd Edn., Springer-Verlag Berlin, Heidelberg,
Germany, pp. 25-35.
Litvin, D.A., Smith, D.E. (1971) Titanium for marine applications, Naval Engineers Journal, Vol.
83 (5), pp. 37-44.
Lyman T. (1973), Metals Handbook, Vol. 8, American Society for Metals, Metals Park, OH, USA,
p. 307.
Machado A., Wallbank, J. (1990) Machining of titanium and its alloys—a review, Proceedings of
the Institute of Mechanical Engineers B, Journal of Engineering and Manufacturing,
Vol. 204(1), pp. 53–60.
Malinov, S., Sha, W. (2005) Modelling Thermodynamics, Kinetics, and Phase Transformation
Morphology while Heat Treating Titanium Alloys, Journal of Metals, Vol. 57 (9), pp. 42-
45.
Manchot, W., Richter, P. (1907) Ueber Aluminiumtitanid, Wiley-VCH Verlag GmbH & Co,
Wiehneim, Germany, pp. 13-21.
Marusich T.D. (2005) High Performance Machining of Titanium, Third Wave Systems Inc., Ohio,
USA, pp. 1-4.
Matthew, J., Donachie, Jr. (1988) Titanium: A Technical Guide, Metals Park, ASM International,
Materials Park, Ohio, USA, p. 187.
McQuillan, A.D. (1949) Allotropic Transformations in Titanium, Nature, Vol. 164, pp. 24-31.
210
McQuillan, A.D. (1955) A study of the behaviour of Titanium-rich alloys in Titanium-Tin and
Titanium-Aluminium systems, Journal of the Institute of Metals, Vol. 83 (5), pp. 181-184.
Merlin, P.W. (2009) Design and Development of the Blackbird: Challenges and Lessons Learned,
American Institute of Aeronautics and Astronautics, Vol. 9, pp. 1-38.
Messler, R.W. (2007) Electron Beam Weldability of Advanced Titanium Alloys, Welding Journal,
pp. 79-84.
Mishurda, J.C., Perepezko, J.H. (1991) Microstructure-Property relationships in Titanium
Aluminides and alloys, Minerals, Metals and Materials Society, Warrendale, USA, pp. 3-
28.
Mitchell, D.R. (1970) Properties of welds in Extra Low Interstitial Ti-6Al-6V-2Sn, McDonnell
Aircraft Company, Report 513-928, pp. 1-13.
Mizutani, U. (2010) Hume-Rothery Rules for Structurally Complex Alloy Phases, CRS Press Inc.,
pp. 1-342.
Molinier, R., Moulin, J., Syre, R. (1970) A study of the properties of Ti-6Al-6V-2Sn alloy,
Pergamon Press, USA, pp. 342-359.
Momeni, A., Abbasi, S.M., Morakabati, M., Akhondzadeh, A. (2015) Yield point phenomena in
TIMETAL 125 beta Ti alloy, Materials and Engineering A, Vol. 643, pp. 142-148.
Moskalenko, V.A., Pupstova, V.N., Ul’yanov, R.A. (1970) Strength and ductility of titanium alloys
at low temperatures, Metal Science and Heat Treatment, Vol. 12 (6), pp. 464-466.
Mountford, J.A. Jr. (2002) Titanium-Properties, Advantages and Applications for Solving the
Corrosion Problems in Marine Service, Corrosion, Vol. 3, pp. 1-25.
Moxson, V.S. (2013), ADMA Corp., private communication, October 31.
Munir, Z.A., Aneselemi-Tamburini (2006) the effect of electric field and pressure on the synthesis
and consolidation of materials: A review of the Spark Plasma Sintering method, Journal of
Material Science, Vol. 41, pp. 763-777.
Murakami, M., Ozaki, K., Ono, K., Itsumi, Y. (2011) Effect of alloying elements on machinability
and hot workability of α-β titanium alloys containing iron and carbon, Kobelco Technology
Review, Vol. 30, pp. 13-19.
Murakami, Y., Kimura, H., Nishimura, Y. (1957) On the Titanium-Iron System, Journal of the
Japan Institute of Metals, Vol. 21, pp. 665-669.
Murray, L.J. (1981) Fe-Ti (Iron-Titanium) System, Bulletin of Alloy Phase Equilibria, Vol. 2 (3),
pp. 320-344.

211
Murray, L.J. (1981) The Mo-Ti (Molybdenum-Titanium) System, Bulletin of Alloy Phase
Equilibria, Vol. 2 (2), pp. 185-192.
Murray, L.J. (1988) Calculation of the titanium-aluminium phase diagram, Metallurgical
Transactions A, Vol. 19 (2), pp. 243-247.
Murray, L.J. (1989) Al-V, Bulletin of Alloy Phase Equilibria, Vol. 10 (4), pp. 351-357.
Novakova, A.A., Agladze, O.V., Sveshnikov, S.V., Tarasov, B.P. (1998) Supersaturated solid
solutions and metastable phases formation through different stages of mechanical alloying
of FeTi, Nanostructured Materials, Vol. 10 (3), pp.365-374.
Ogden, H.R., Jaffee, R.I. (1955) The effects of carbon, oxygen and nitrogen on the mechanical
properties of titanium and titanium alloys, TML Report No. 20, Titanium Metallurgical
Laboratory, Battelle Memorial Institute Columbus 1, Ohio, USA, pp. 3-13.
Ogden, H.R., Maykuth, D.J., Finlay, W.L., Jaffee, R.I. (1951) Mechanical Properties of High
Purity Ti-Al Alloys, Transactions of the AIME, Vol. 191, pp. 1150-1155.
Oluwele, O.O., Akinkumni, A.L. (2011) Modelling of grain structures of some carbon steels using
the Voronoi Tesselation, Journal of Minerals and Materials Characterization and
Engineering, Vol. 10 (3), pp. 309-314.
Palm, M., J. Lacaze J. (1998) Assessment of the Al–Fe–Ti system, Max-Planck-Institut für
Eisenforschung GmbH, Germany, pp. 112-131.
Parker, C.M. (1943) Steel in Action, 1st Edn., Jaques Cattel Press, New York, USA, p. 109.
Paruchuri, M., Massalski, T.B. (1991) Phase Diagram Relationships in the Ternary System Ti-Al-
V, Materials Research Society Symposium Proceedings, Vol. 213, pp. 143-149.
Pask, J., Evans, A. (1980) Surfaces and Interfaces in Ceramic and Ceramic-Metal Systems,
Materials Science Research, Vol. 14, pp. 167-189.
Paton, N.E., Williams, J.C. (1973) The influence of oxygen content on the athermal β-ω
transformation, Scripta Metallurgica, Vol. 7 (6), pp. 647–649.
Pauling, L. (1932) The Nature of the Chemical Bond. IV. The Energy of Single Bonds and the
Relative Electronegativity of Atoms, Journal of the American Chemical Society, Vol. 54
(9), pp. 3570–3582.
Peart, R.F., Tomlin, D.H. (1962) Diffusion of solute elements in beta titanium, Acta Metallurgica,
Vol. 10, pp. 123-134.
Pederson, R., Babushkin, O., Skystedt, F., Warren, R. (2001) The use of high temperature X-ray
diffractometry to study phase transitions in Ti-6Al-4V at elevated temperature, Institute of
Materials, pp. 1336-1395.

212
Peng, G.E., Zhou, W., Zhao, Y.Q., Zhou, L. (2007) Ageing characteristics of new metastable beta
titanium alloy, Transaction of Nonferrous Metals Society of China, Vol. 17, pp. 88-92.
Petch, N.J. (1953) The cleavage strength of polycrystals, Journal of the Iron and Steel Institute,
London, UK, Vol. 173, pp. 25-28.
Piegger, E., Craig, R.S. (1963) Structural and magnetic characteristics of TiFe2, ZrCo2 and ZrFe2
alloys, Journal of Chemistry and Physics, Vol. 39, pp. 139-145.
Pines, B.Ya. (1946) On solid State Sintering, Journal of Technical Physics, Vol. 16 (6), pp. 16-
17.
Polonis, D.H., Parr, J.G. (1954) Phase Transformations in Titanium-rich Alloys of Iron and
Titanium, Journal of Metals, Vol. 1 (2), pp. 1148-1154.
Powel, D.T., Scully, J.C. (1968) Stress Corrosion Cracking of Titanium Alloys at Room
Temperature, International Conference on Titanium, London, UK, pp. 1-4.
Rhodes, C.G., Williams, J.C. (1975) The precipitation of α-phase in metastable β -phase Ti alloys,
Metallurgical Transactions A, Vol. 6 (11), pp. 2103-2114.
Rodriguez, F.X.G., Plannel, J.A. (1995) Grain Growth Kinetics of Pure Titanium, Scripta
Metallurgica et Materialia, Vol. 33 (8), pp. 1361-1366.
Roelet, A.D., Brahme, A.P., Roberts, C.G. (2007) An overview of the accomplishments and
challenges in recrystallization and grain growth, Materials Science Forum, Vol. 558-559,
pp. 33-42.
Roy, R. (1973) Phase Transitions, Pergamon Press, Oxford, UK, pp. 13-16.
Sagel, K., Schulz, E., Zwicker, U. (1956) Investigation of the titanium-aluminium system,
Zeitschrift fuer Metallkunde, Vol. 46, pp. 529-34.
Salem, A.A., Shaffer, J.B., Satko, D.P., Semiatin, S.L., Kalidindi, S.R. (2014) Workflow for
integrating mesoscale heterogeneities in materials structure with process simulation of
titanium alloys, Integrating Materials and Manufacturing Innovation, Vol. 3 (24), pp.1-22.
Saunders, S. (1997) The Al-Mo system, Journal of Phase Equilibria, Vol. 18 (4), pp. 370-378.
Seierstein, M. (1998) System Al-Fe, Ansara, I., Dinsdale, A.T., Rand, M.H. (Eds.), EUR 18499
(COST 507, Thermochemical Database for Light Metal Alloys), Vol. 2, Office Official
Public European Commission, Luxembourg, pp. 34-39.
Semiatin, S.L., Kirby, B.C., Salishchev, G.A. (2004) Coarsening Behaviour of an Alpha-Beta
Titanium Alloy, Metallurgical and Materials Transactions A, Vol. 35A, pp. 2809-2819.
Setaram. (2008) SETSYS Evolution, DTA, DSC, TGA, simultaneous TGA-DTA and TGA-DSC,
TMA, dilatometry, Setaram Instrumentation, France, p.6.

213
Sevan, E., Vardan, K. (2006) Rosoboronexport controls titanium in Russia, Sevanco Strategic
Consulting, internal communication, pp. 3-9.
Siekmann, H.J. (1955) How to machine Titanium, Tool Engineer, Vol. 34 (1), pp. 78-82.
Sieniawski, J., Ziaja, W., Kubiak, K., Motyka, M. (2013) Microstructure and Mechanical
Properties of High Strength Two-Phase Titanium Alloys, Journal of Materials Processing
Technology, Vol. 78 (1-3), pp.117-121.
Shao, G., Tsakiropoulos, P., Miodovnik, A.P. (1995) Phase Transformations in Ti-40Al-10V,
Intermetallics, Vol. 3, pp. 315-325.
Shull, R.D., McAlister, A.J., Reno, R.C. (1984) Phase equilibria in the Titanium-Aluminium
System, Proceedings of the 5th International Confererence on Titanium, Munich, Germany,
pp. 1459-1466.
Schwenk, W., Kaehler, W.A., Kennedy, J.R. (1967) Weldability of Titanium Alloy sheets Ti-6Al-
6V-2Sn and Ti-8Al-1Mo-1V, Welding Research Supplement, Vol. 32 (2), pp. 64-72.
Silcock, J.M, Davies, M.H., Hardy, H.K. (1955), Structure of the ω-Precipitate in Titanium–16 per
cent Vanadium Alloy, Nature, Vol. 175 (1), p. 731.
Sirochman, D. (1985) Metals Handbook, Metallography and Microstructures, 9th Edn., American
Society for Metals, Materials Park, Ohio, USA, p. 33.
Skolnick, A., Wilson, R.A. (2012) T-Craft-What, Why & How, SNAME T&R Advanced Ship and
Craft Panel, International Hydrofoil Society conference, 2012, USA, pp. 1-20.
Sluiter, M., Turchi, P.E.A (1991) Phase stability in Ti-V and Ti-Cr Alloys, Physical Reviews B,
Vol. 43 (15), pp. 43-44.
Sridhar, G., Gopalan, R., Sarma D.S. (1987) A Microstructural Characterisation of Solution-
Treated Titanium Alloy Ti-6Al-4V, Journal of Metallography, Vol. 20, pp. 291-310.
Srinivasu, G., Rao, R.N. (2012) Effect of β/α Strength Ratio on the Stress-Strain Curve of a Beta
Titanium Alloy by Finite Element Modelling, International Journal of Mechanical and
Industrial Engineering, Vol. 1 (4), pp. 53-59.
Srivastava, D., Barnajee, S., Ranganathan, S. (2004) The Crystallography of bcc to hcp
(orthohexagonal) martensitic transformation in dilute Zr-Nb Alloys, Transactions of the
Indian Institute of Metals, Vol. 53 (3), pp. 205-223.
Stein, F., Martin, P. (2007) Re-determination of transition temperatures in the Fe–Al system by
differential thermal analysis, International Journal of Materials Research, Vol. 98 (7), pp.
580-588.

214
Stephens, J.R., Witzke, W.R. (1972) Alloy Hardening and Softening in Binary Molybdenum
Alloys as Related to Electron Concentration, Journal of Less-Common Metals, Vol. 29 (6),
pp. 325-342.
Sundman, B., Ohnuma, I., Dupin, N., Kattner, U.R., Fries, S.G. (2009) An assessment of the entire
Al-Fe system including DO3 ordering. Acta Materiela, Vol. 57 (3), pp. 63-69.
Swanson, B.R, Dawson, A., Lane, R. (1990), Aviation Maintenance Technician Handbook, Federal
Aviation Administration (FAA), Oklahoma, USA, pp. 134-136.
Taddei, E.B., Henriques, V.A.R., da Silva C., Cairo, A. (2007) Age-hardening of Ti-35Nb-7Zr-
5Ta alloy for orthopaedic implants, Materials Research, Vol. 10 (3), pp. 57-61.
Taplin, D.M.R., Dunlop, G.L., Langdon, T.G. (1979) Flow and Failure in Superplastic Materials,
Materials Science, Vol. 9, pp. 151-189.
Tarin, P., Gualo, A., Simon, A.G., Piris, M.N., Badia, J.M. (2010) Study of the kinetics of alpha-
beta transformation in ELI Ti-6Al-4V-Mechanical Properties and Microstructure
Characteristics, Materials Science Forum, Vol. 638, pp. 712-717.
Terlinde, G.T., Duerig, T.W., Williams, J.C. (1980) The Effect of Heat Treatment on
Microstructure and Tensile Properties of Ti-I0V-2Fe-3Al, Carnegie-Mellon University,
Pittsburgh, PA U.S.A., pp. 1-11.
Tretyachenko, L. (2005) Aluminium – Titanium –Vanadium, New Series IV, Landolt-Börnstein,
German, pp. 26-53.
Tretyachenko, L. (2005) Aluminium-Molybdenum-Titanium, New Series IV, Landolt-Börnstein,
Heidelberg, Germany, pp. 287-315.
Tsujimoto, T. (1969) The Ti-Rich Corner of the Ternary Ti-Al-V System, Transactions of the
Japan Institute of Metals,Vol.10, pp. 281-286.
Umakoshi, Y., Yamaguchi, M., Yamane, T., Hirano, T. (1988) “Deformation and Improvement of
Ductility of the Intermetallic Compounds Al3V and Al3(V, Ti), Philosophy Magazine, Vol.
58, pp. 651-666.
Van Laar, J.J. (1908) Chemical Thermodynamics, Journal of Physical Chemistry, Vol. 63, pp. 257-
297.
Van Thyne, R.J, Kessler, H.D., Hansen, M. (1952) Systems of Ti-Cr and Ti-Fe, Society for
Automotive Engineers, Vol. 44 (1), pp. 518-538.
Van Loo, F.J.J., Rieck, G.D. (1973) Diffusion in the titanium-aluminium system. Interdiffusion
between solid Al and Ti or Ti-Al alloys, Acta Metallurgica, Vol. 21 (1), pp. 61-71.

215
Vijayaram, T.R. (2013), Titanium and Titanium Alloys for the Future Metal Working Industries,
Metalworld, Vol. 5 pp. 34-38.
Volkova, M.A., Kornilov, I.I. (1970) Investigations of Phase Equilibria and Some Properties of
Alloys of the TiAl-V2Al8 System of the Ti-Al-V System, Izv. Akad. Nauk SSSR, Met., Vol.
5, pp. 202-204.
Walcher, J., Gray, D., Manson, D. (1979) Aspects of Cumulative Fatigue Damage Analysis of
Cold End Rotating Structures, Paper 79-1190 in Proceedings of AIAA/SAE/ASME 15th
Joint Propulsion Meeting, Las Vegas, USA, June 18–20, pp. 1-6.
Watanabe, T., Tsurekawa, S. (1999) The control of brittleness and development of desirable
mechanical properties in polycrystalline systems by grain boundary engineering, Acta
Materialia, Vol. 47 (15–16), pp. 4171–4185.
Wang, H. (2012) Thermodynamic modelling of high strength, high toughness Ti-Alloys, PhD
thesis, School of Metallurgy and Materials, University of Birmingham, p. 7.
Wang, J., Fu, S. J. (2008) Fe–Ti–C composite produced by self-propagating high temperature
synthesis, International Journal of Powder Metallurgy, Vol. 51(4), pp. 295-297.
Weiss, I., Froes, F.H., Elyon, D. (1984) Revealing Deformed and Recrystallized Structures in Beta
Titanium Alloys, Metallurgical Transactions, Vol. 15A, pp. 1493-1496.
Welsch, G., Boyer, R.R., Collings, E.W. (1994) Materials Handbook: Titanium Alloys, ASM
International, Materials Park, Ohio, USA, pp. 177-185.
Wells, R. (1962) Structural Inorganic Chemistry, 3rd Edn., Oxford University Press, UK, pp. 3-38.
Weston, N.S., Derguti, F., Tudball, F., Jackson, M. (2015) Spark plasma sintering of commercial
and development titanium alloy powders, Journal of Materials Science, Vol. 50 (14), pp.
4860–4878.
Williams, J.C., Hickman, B.S, Marcus, H.L. (1971) The effect of omega phase on the mechanical
properties of titanium alloys, Metallurgical Transactions, Vol. 2 (7), pp. 1913-1919.
Williams, D.N., Wood, R.A., Jaffee, R.I., Ogden, H.R. (1963) The effects of zirconium on
titanium-base alloys, Journal of the Less-Common Metals, Vol. 6 (4), pp. 219-225.
Wriedt, H.A., Arajs, S. (1966) Ferromagnetic Curie Temperatures of some iron-zinc solid
solutions, Physica Status Solidi, Vol. 16 (2), pp. 475-478.
Xiao, S.L., Tian, J., Xu, L.J., Chen, Y., Yu, H., Han, J. (2009) Microstructures and mechanical
properties of TiAl alloy prepared by spark plasma sintering, Transactions of Nonferrous
Metals Society of China, Vol. 17, pp. 1423-1427.
Yolton, C.F., Froes, F.H., Malone, R.F. (1979) Alloying element effects in metastable beta
titanium alloys, Metallurgical Transactions, Vol. 10A, pp. 132-134.

216
Zemansky, M.W., Dittman, R.H. (1981) Heat and Thermodynamics, 6th Edn., McGraw-Hill, New
York, USA, pp. 10-39.
Zener, C.M. (1948) Elasticity and Inelasticity of Metals, University of Chicago Press, USA, pp.
34-49.
Zeng, L., Fanning, J., Zenke, A., March, M. (2006) Evaluation of Newly Developed Ti-555 High
Strength Titanium Fasteners, Internal report, Alcoa Inc., Alcoa Fastening Systems, Carson,
USA, pp. 1-3.
Zhang, F., Reich, M.I., Kessler, O., Burkel, E. (2013) The potential of rapid cooling spark plasma
sintering for metallic materials, Materials Today, Vol. 16(5), pp. 192-197.
Zhumagaliev, Y., Baisanov, S., Chekimbaev, A., Nurgali, N. (2010) Phase diagram of Ti-Al-Fe
system, The Twelfth International Ferroalloys Congress Sustainable Future, June 6-9,
Finland, pp. 653-656.
Zwicker, R. (1980) Titanium, Science and Technology, Proceedings of 4th International
Conference on Titanium, Kyoto, Japan, pp. 505-514.

217
8.Chapter 8 APPENDICES
8.1 APPENDIX A: Ti-Al-Mo Ternary System
Figure A1: Isothermal section of the Ti-Al-Mo phase diagram at 1300oC (Tretyachenk,
2005).
Figure A2: Isothermal section of the Ti-Al-Mo phase diagram at 1000oC (Tretyachenk,
2005).

218
Figure A3: Isothermal section of the Ti-Al-Mo phase diagram at 800oC (Tretyachenk,
2005).
Figure A4: Isothermal section of the Ti-Al-Mo phase diagram at 600oC (Tretyachenk,
2005).

219
Table A1: Equilibrium solid phases in the Ti-Al-Mo ternary system (After Tretyachenk, 2005).
Phase Temperature range (oC) Pearson symbol/Space
group/Prototype
(Al)
Al
<664.2
<660.4
cF4
Fm3̅m
Cu
β2(TiMoAl)
cP2
Pm3̅m
CsCl
β (Ti1-x-yMoxAly)
(βTi)(h)
(βMo)
1150
1670-882
<2623
cI2
Im3̅m
W
ρMo3Al
<2150 cP8
Pm3̅m
Cr3Si
ζ2
MoAl(h)
MoAl(l)
1750-1470
<1470
cP2
Pm3̅m
CsCl
cI2
Im3̅m
W
ζ1, MoxAl1-x
Mo37Al63(h)
1570-1490
tP4
P4/mmm
AuCu
δ
Mo3Al8
MoAl3(h)
Mo1-xAl3+x(h)
MoAl4(h)
Mo4Al17
Mo5Al22(h)
<1555
1222-818
1260-1154
1177-942
<1034
964-831
mC22
c2/m
Mo3Al8
mC32
Cm
MoAl3
cP8
Pm3̅m
Cr3Si
mC30
Cm
WAl4
mC84
C2
Mo4Al17
oF216
Fdd2

220
MoAl5(h2)
MoAl5(h1)
MoAl5
MoAl12
800-750
750-648
<650
Mo5Al22
hP12
P63
WAl5
hP60
P3̅
hP36
R3̅c
cI26
IM3̅
WAl12
ζ Tetragonal superstructure of
AuCu type
ε, (Ti1-xMox)1+yAl3-y
TiAl3(h)
TiAl3(l)
1400-1300
<1300
tI8
I4/mmm
TiAl3(h)
tI32
I4mmm
TiAl3(l)
η-TiAl2 <1199 tP4
P4/mmm
AuCu
ϒ-TiAl <1463 tP4
P4/mmm
AuCu
α2(Ti1-xMox)3-yAly
Ti3Al
<1164
hP8
P63/mmc
Ni3Sn

221
Figure A5: Reaction scheme for the Ti-Al-Mo ternary system (Tretyachenk, 2005).

222
8.2 APPENDIX B: Ti-Al-Fe Ternary System
Figure B1: Isothermal section of the Ti-Al-Fe phase diagram at 1200oC (Zhumagaliev et
al., 2010).
Figure B2: Isothermal section of the Ti-Al-Fe phase diagram at 1000oC (Zhumagaliev et
al., 2010).

223
Figure B3: Isothermal section of the Ti-Al-Fe phase diagram at 900oC (Zhumagaliev et
al., 2010).
Figure B4: Liquidus projection of the Ti-Al-Fe phase diagram (Zhumagaliev et al., 2010).

224
8.3 APPENDIX C: Ti-Fe-Mo Ternary System
Figure C1: Isothermal section of the Ti-Fe-Mo phase diagram at 1200oC (Jin and Qui,
1993).
Figure C2: Isothermal section of the Ti-Fe-Mo phase diagram at 1000oC (Jin and Qui,
1993).

225
Figure C3: Isothermal section of the Ti-Fe-Mo phase diagram at 800oC (Jin and Qui,
1993).
226
8.4 PUBLICATIONS
8.4.1 Kinetics of grain growth in Ti-2.7Al-5.7Fe-6Mo-6V alloy, Journal of Mining and
Metallurgy, Section B (in review).
Tapiwa D. Mutava, Lesley A. Cornish, Iakovos Sigalas
School of Chemical and Metallurgical Engineering, University of the Witwatersrand, South Africa,
and
DST-NRF Centre of Excellence in Strong Materials, hosted by the University of the Witwatersrand
(Email: [email protected])
Abstract
The metastable (βTi) alloy Ti-2.7Al-5.7Fe-6Mo-6V (wt%) was produced by semi-centrifugal casting of blended
elemental powders. The phases were identified by X-ray diffraction (XRD), and overall composition was measured
by X-ray fluorescence (XRF). The beta transus was determined by differential thermal analysis (DTA) and optical
microscopy. The cast alloys were annealed at different temperatures under argon, up to 900oC, where they were
in the solution-treated state, and the solution-treated alloys were aged between 400oC and 600oC. The kinetics of
grain growth during heat treatment of the as-cast and solution-treated alloys was investigated by metallography,
using the grain intercept method. Grain growth depended on whether the matrix was (αTi) or (βTi), and on the
competing precipitate dissolution, or nucleation and growth processes. The as-cast alloy had a mean grain size
of 19 ± 7µm, which increased to 63 ± 21µm after heat treating at 500oC for 2h. The alloy was duplex between
590oC and 800oC, and completely (βTi) above 800oC. After solution treatment, the mean grain size was 40 ± 16
µm, which was smaller than at the lower heat treatment temperatures. Following solution treatment, the mean
grain size increased with increasing ageing temperature, up to 66 ± 22µm after 2h at 600oC. The growth exponents
were lower than the 0.5 for normal grain growth in both cases, and there was an incubation period at 300oC and
400oC when the alloy was not solution-treated. Minimal grain growth was observed close to the beta transus.
Key words: grain growth, kinetics, solution-treatment, Timetal 125.
1. Introduction

227
Grain size plays a key role in the mechanical properties and performance of polycrystalline materials [1]. Grains
have a tendency to grow due to their curvature, as this lowers the surface area to volume ratio and reduces their
interfacial energy [2-5]. The growth rate is determined by the grain boundary mobility and the driving force [2, 3],
which in turn depends on composition, temperature and prior thermomechanical treatment [4]. It is also generally
agreed that there is a threshold grain diameter, above which grains grow, while grains below this threshold are
consumed [5]. Since the grain size affects the properties of the material in service [1-7], close control during
thermomechanical treatment is important.
In this study, grain growth during heat treatment of cast Ti-2.7Al-5.7Fe-6Mo-6V (wt%), commercially known as
Timetal 125 [8], was investigated. It is a metastable (βTi) alloy used as a high strength fastener on aerostructures
[8]. Efforts have been made to understand grain growth in titanium alloys and other polycrystalline materials [3, 4,
7-9]. The investigations ranged from experimental observation and measurement [7, 8] to numerical simulations,
such as the Monte Carlo [9] and multi-phase field models [10-14]. While simulations have become well developed
for grain growth in single-phase materials, their predictions are less used for multi-phase materials [10-13]. In all
cases, the simulations have always needed to be validated by experimental evidence. So, although they are cheaper
and quicker, they are not a substitute for observation of grain growth by metallography.
Gil et al. [11] found that grain growth was faster for (βTi) than for (αTi) in pure titanium. This was attributed to
lower activation energy in (βTi), due to easier diffusion in the more open bcc crystal structure, which were 100
kJ.mol-1 in (αTi) and 20 kJ.mol-1 in (βTi). Siemers et al. [14] found the self-diffusion rate to be 2 orders of magnitude
higher in (βTi) than in the (αTi) phase, and that grain size in the (βTi) phase can increase by up to 400%.
However, alloy additions and interstitial content were found to have a significant effect on the activation energy
for grain growth and kinetics in titanium alloys [13-14]. Normally, the presence of alloying elements, in particular
chromium and iron, increases activation energy for grain growth, which in turn retards grain growth in titanium
alloys. In almost all cases, solute elements segregate to grain boundaries and lower the surface energy of the
system. During grain growth, the solute elements lag behind the grain boundaries, creating drag [15]. The activation
energy for grain growth in the (βTi) phase was 95 kJ.mol-1 in Ti-6Al-4V [16], and 211 kJ.mol-1 in Ti-5.6Al-3.5Zr-
1Nb-0.25Mo-0.3Si [13], showing a positive correlation with alloying content. Normal grain growth was observed
in commercially pure (CP) titanium between 700oC and 1100oC, with a growth exponent ~0.5, which marginally
increased with increasing temperature [10, 11]. However, no growth was found around 900oC, which was attributed
to the competing α-β transformation, since the temperature was close to the beta transus [11]. Grain growth was
228
most rapid in the first 10-15 minutes, and slowed until the mean grain size reached a plateau. This was attributed
to the surface area/volume ratio and the interfacial energy between grains, hence driving force, being highest at
the start of grain growth and decreasing as the mean grain size increased [11]. Grain growth in pure metals generally
follows the parabolic growth law [6, 15], but deviation is observed when other phases are present, particularly when
they are small enough to pin the grain boundaries. While it is generally agreed that a second phase reduces grain
boundary mobility, Shvindlerman and Gottstein [18] showed grain growth can be accelerated by precipitation under
the right conditions [18]. This is possible because during precipitation, the grain boundaries become leaner in the
solute, which reduces solute drag [18]. If the precipitates are distributed such that they do not pin the grain
boundaries, the net effect will be accelerated grain growth. [18].
2. Material and Methods
Commercial grade elemental titanium (99.95 wt%), aluminium (99.95 wt%), iron (99.95 wt%), molybdenum
(99.95 wt%) and vanadium (99.95 wt%) powders sourced from Alfa Aeser, South Africa, were blended to
manufacture the Timetal 125 composition. Five 40g samples of the blended powders were cold compacted into
cylindrical shapes using a bench-top Manfredi hydraulic press, to ensure maximum electrical conductivity. The
cold compacts were inductively heated in yttria-stabilised zirconium crucibles in a Manfredi semi-centrifugal
titanium casting furnace. The furnace was cyclically purged by drawing a vacuum to -90 kPa and back-filled with
high purity argon to atmospheric pressure. The samples were inductively heated using a water-cooled copper coil,
centrifuged into a copper mould, and allowed to cool in the argon-filled casting chamber. The castings, measuring
15 mm diameter and 80 mm length, were sectioned into 3 mm thick discs using a LECO MSX 205A machine,
with a 20S30 silicon carbide cutting blade. To avoid burning during cutting, generous amounts of water-based
coolant were used, together with a fast wheel speed (3500 rpm) and slow feed rate (0.5 mm.s-1). One as-cast
sample was analysed by XRF, XRD and a LECO oxygen analyser. Three sectioned samples were kept in the as-
cast condition, while the rest were heat treated in an Elite Thermal Systems TSH 17 muffle furnace, under argon.
The castings were further protected by sealing them in quartz ampoules during heat treatment.
In the first set of experiments, heat treatment was done on the cast samples in 100oC increments from 300oC to
800oC for 20, 30, 40, 60, 120, 240 and 300 minutes at each temperature. These are referred to as annealing
experiments. The samples were quenched in water at 25oC. Subsequently, they were ground using a Manfredi
micro-grinder to remove ~5 µm oxidized surface material. Thereafter, they were polished and etched with Kroll’s
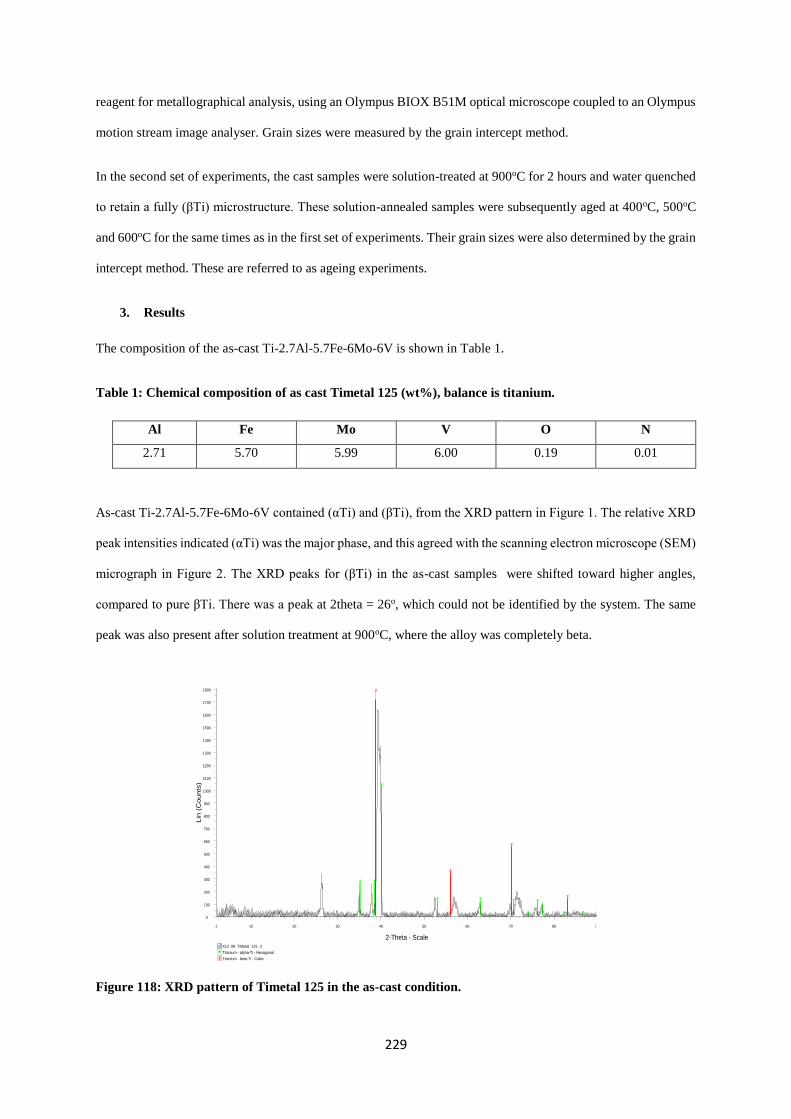
229
reagent for metallographical analysis, using an Olympus BIOX B51M optical microscope coupled to an Olympus
motion stream image analyser. Grain sizes were measured by the grain intercept method.
In the second set of experiments, the cast samples were solution-treated at 900oC for 2 hours and water quenched
to retain a fully (βTi) microstructure. These solution-annealed samples were subsequently aged at 400oC, 500oC
and 600oC for the same times as in the first set of experiments. Their grain sizes were also determined by the grain
intercept method. These are referred to as ageing experiments.
3. Results
The composition of the as-cast Ti-2.7Al-5.7Fe-6Mo-6V is shown in Table 1.
Table 1: Chemical composition of as cast Timetal 125 (wt%), balance is titanium.
Al Fe Mo V O N
2.71 5.70 5.99 6.00 0.19 0.01
As-cast Ti-2.7Al-5.7Fe-6Mo-6V contained (αTi) and (βTi), from the XRD pattern in Figure 1. The relative XRD
peak intensities indicated (αTi) was the major phase, and this agreed with the scanning electron microscope (SEM)
micrograph in Figure 2. The XRD peaks for (βTi) in the as-cast samples were shifted toward higher angles,
compared to pure βTi. There was a peak at 2theta = 26o, which could not be identified by the system. The same
peak was also present after solution treatment at 900oC, where the alloy was completely beta.
Figure 118: XRD pattern of Timetal 125 in the as-cast condition.
Titanium - beta-Ti - Cubic
Titanium - alpha-Ti - Hexagonal
X13_09_TiMetal_125_3
Lin
(C
ounts
)
0
100
200
300
400
500
600
700
800
900
1000
1100
1200
1300
1400
1500
1600
1700
1800
2-Theta - Scale
2 10 20 30 40 50 60 70 80 90

230
The as-cast alloy contained equiaxed grains, with intergranular and grain boundary precipitates, Figure 2. The
intergranular precipitates were richer in iron, molybdenum and vanadium, indicating they were (βTi). It was not
possible to separately analyse the grain boundary precipitates by energy dispersive X-ray fluorescence (EDX),
due to their fine size. The SEM micrograph also showed the as-cast alloy contained porosity, Figure 2.
Figure 19: SEM-BSE image of Timetal 125 in the as-cast condition showing intergranular and grain
boundary precipitates and porosity (micron bar = 5µm).
The optical micrograph of the as-cast sample, Figure 3(a), showed some areas with colonies of (βTi) precipitates,
in addition to those on the grain boundaries. After annealing at 300oC for 60 minutes, the precipitates dissolved,
Figure 3(b). However, a new phase precipitated inside the grains after heat treating at 400oC, and persisted to
500oC, but was too fine to measure separately. A completely different microstructure was observed after heat
treatment at 800oC, Figure 3(e). XRD showed the major phase after heat treating at 800oC was (βTi), indicating
the temperature was close to the beta transus. This was supported by differential thermal analysis (DTA), which
showed the (α+β) phase region was between 590oC and 800oC. The light grain boundary precipitates were
determined to be (αTi) by EDX, although they were too small to analyse accurately.
The mean grain size in the as-cast condition was 19 ± 7µm, which increased after heat treatment, as shown in
Figures 3 and 4. Generally, there was an increase in the mean grain size with increasing annealing temperature
and holding time, until it reached a plateau after ~40 minutes, Figure 4. The growth was rapid in the first 20
minutes, although there was an incubation period at 300oC and 400oC, as indicated by the delayed growth at these
temperatures. In the first 5 minutes, the mean grain sizes at the two temperatures were approximately the same,
Fine (βTi) precipitates
Grain boundary

231
as shown by the overlaying curves. Beyond this, the mean grain size was larger at 400oC than 300oC for each heat
treatment period, but more pronounced growth was observed after heat treating at 500oC. At 800oC, grain growth
was very rapid initially, but the mean grain size was only marginally larger than at 500oC.
(a) (b)
(c) (d)
(e)
Figure 3: Optical micrographs showing the grain sizes of (a) the as-cast alloy, and after heat
treating for 60 minutes at (b) 300oC, (c) 400oC, (d) 500oC and (e) 800oC.
The beta transus of the alloy was determined to be 800oC using DTA, XRD and metallography. After water
quenching from 900oC, the alloy was almost completely (βTi) with a few precipitates along the grain boundaries,
Porosity

232
Figure 5(a), showing it was in the solution-treated state. The mean grain size was 40 ± 3µm, which was smaller
than at 800oC.
Figure 4: Grain size as a function of temperature and time during heat treatment of the cast Timetal 125.
(a) (b)

233
(c) (d)
Figure 5: Optical micrographs of Timetal 125 after (a) solution-treatment, and solution-treatment and
ageing for 60 min at (b) 400oC, (c) 500oC and (d) 600oC.
After ageing, the (αTi) precipitates became more distinct, and coarsened with increasing ageing temperature and
time. Some of the precipitates coarsened into allotriomorphs, Figures 5(c) and (d). In addition to the grain
boundary precipitates, there were also some finer precipitates inside the grains, and the amount of these
precipitates increased with increasing ageing temperature. The variation of the mean grain size with temperature
and time after solution-treatment and ageing is shown in Figure 6. The mean grain size increased with increasing
ageing temperature from 400oC to 600oC. The initial grain growth rate was not as rapid as during annealing.
However, like annealing, the mean grain size reached a plateau after about 40 minutes.
Figure 6: Mean grain size of size after solution-treatment at 900oC and ageing at different temperatures.
Allotriomorphic (αTi)

234
4. Discussion
Isothermal grain growth normally follows the Hillert model [3, 11], shown in Equation 1, where d is the mean grain
diameter, do is the initial mean grain diameter, k is a rate constant, t is time and n is the growth exponent, usually
~0.5 for normal grain growth [10, 18]:
𝐝 = 𝐝𝐨 + 𝐤𝐭𝐧 Equation 1
A plot of ln(d-do) against ln(t) should be linear, with the vertical intercept equal to ln(k) and slope to the growth
exponent, n. Gil et al. [11] argued that k is of the Arrhenius type, shown in Equation 2, since atomic diffusion across
a grain boundary is a simple thermally-activated process:
𝐤 = 𝐤𝐨𝐞−𝐄𝐚𝐑𝐓 Equation 2
where ko is a pre-exponential factor independent of temperature, T is the absolute temperature, Ea is the activation
energy for grain growth and R is the universal gas constant. A plot of ln(k) against (-1/T) should also be linear
with a slope equal to Ea/R and vertical intercept equal to ln(ko). The ln(d-do)-ln(t) plots after annealing Timetal
125 are shown in Figure 7. The plots are linear at 500oC and 800oC, but the fits were poor at the lower
temperatures. The poorer linear correlation at 300oC and 400oC is consistent with the incubation period in Figure
4.

235
Figure 7: ln(d-do) against In(t) after annealing the cast Timetal 125 at different temperatures.
Figure 8 shows similar plots, after solution-treatment and ageing. The plots were less linear than in Figure 7, and
the slopes were generally larger than for annealing. The highest growth exponent was 0.39 at 400oC, but smaller
at 500oC and 600oC. The larger growth exponents were attributed to a lower activation energy for grain growth in
the (βTi) matrix. The smaller exponents at the higher ageing temperatures were due to the competing (αTi)
precipitation and its coarsening, Figures 5(b)-(d).
The matrix after solution-treating was different from the as-cast state. In the as-cast condition, the grains were
mixtures of (αTi) and (βTi), with colonies of (βTi) precipitates, while after solution-treatment, the matrix was
(βTi) and the precipitates were (αTi). Therefore, the mechanisms of grain growth were different, due to the
difference in the activation energy for grain growth because of the dissimilar crystal structures [15, 18-20]. The (α+β)
phase boundaries were determined to be 590oC and 800oC by DTA. The beta transus (800oC) was higher than
reported by Leyens and Peters [5] for the same alloy (760oC), which was attributed to the 0.3 wt% oxygen in the
cast samples, since interstitials appreciably increase the transformation temperature [8, 14].
Figure 8: ln(d-do) vs. In(t) solution-treatment and ageing at different temperatures.
In both sets of experiments, the rapid increase in grain size in the first 20 minutes was due to the high surface
energy/volume ratio and higher interfacial energy initially, and as these decreased as the grains grew, the ratio,
interfacial energy and driving force also decreased, which agreed with Gil et al. [11]. The increase in the mean

236
grain size of the (αTi) matrix between 300oC and 500oC was in response to the increasing thermal energy. The
incubation period at 300oC and 400oC was because part of the thermal energy was used to dissolve the initial (βTi)
precipitates, Figures 3(a) and (b), although other factors like pinning precipitates, too small to resolve under an
optical microscope, may have had an influence [21]. This also explains the poorer linear correlations in the plots in
Figure 7 at 300oC and 400oC. The lack of incubation at 500oC and 800oC, as supported by the more linear plots at
these temperatures and the rapid initial grain growth in Figure 4, indicated there was enough energy to
simultaneously support the dissolution of the precipitates and grain growth. It was not possible to rule out the
possible presence of metastable phases, which normally appear as very fine precipitates, such as martensite and
the omega phase, due to the limitation of the analytical techniques that were used in the present work.
The similarity of grain sizes at 300oC and 400oC was due to the competing (αTi) precipitation reaction, Figures
3(b) and (c). A significant amount of the thermal energy was expended in precipitating the new phase at the
expense of grain growth, since phase transformations lower the Gibbs energy much more than the decrease in
surface energy from growing grains [13]. Since the precipitation occurred in the 300oC to 400oC interval, the
precipitates after heat treating at 500oC should have formed in the same temperature interval. (The (α+β) phase
region was determined to be between 590oC and 800oC by DTA and metallography.) Therefore, the extra thermal
energy from increasing the temperature from 400oC to 500oC was mainly used for grain growth, explaining the
significant increase in grain size in this temperature interval. The smaller mean grain size was attributed to the α-
β transformation occurring at the expense of grain growth. Additionally, the mean grain size of the β phase was
expected to be small, since it was nucleating on the many pre-existing (αTi) grains. Also, the apparent lack of
grain growth at 800oC was also because most of the thermal energy was used for the α-β transformation, since
heat treatment was at the beta transus, which agreed with Gil et al. [11] for CP titanium. Furthermore, the
transformed (βTi) grains would have been very small initially, and would take time to grow.
During ageing, the mean grain size increased with temperature and time, Figure 6. However, at and above the
(βTi) transus, the grains would be expected to be small, since they would have nucleated on the existing (αTi)
grain boundaries before growing. The smaller than expected grain growth at the higher ageing temperatures was
attributed to increasing precipitation of the (αTi) phase, which competed for the available energy and resisted
grain growth by second phase strengthening. Furthermore, the coarsening of the grain boundary precipitates may
have affected the accuracy of measuring the grain sizes at the higher ageing temperatures.

237
The growth exponents, obtained from the slopes in Figures 7 and 8, were all less than 0.5, indicating grain growth
was not normal. However, Kim et al. [6] argued normal grain growth has been observed in materials where n≠0.5,
and that the distribution of the small grains determines the exponent’s value. The similarity of the growth
exponents at 300oC (n ~0.3) and 400oC (n ~0.2) during the annealing of the cast alloy was due to the similarity in
grain sizes and microstructures at the two temperatures. The very low growth exponents at 500oC (n ~0.1) and
800oC (n ~0.06) were attributed to increased solute drag due to solute enrichment of the matrix as the (βTi)
precipitates dissolved [17-20]. The growth exponents during ageing were also smaller than 0.5 at all the test
temperatures, which was attributed to significant solute drag, since all the alloying elements were dissolved in the
matrix after solution-treatment. Additionally, part of the available thermal energy was used to precipitate and
coarsen the (αTi) phase. Unlike the (βTi) precipitates, which simply dissolved during the annealing of the cast
alloy, the (αTi) precipitates obtained after ageing grew. In addition to expending energy, the precipitates grew and
coarsened on the grain boundaries at the expense of the matrix’s volume. In effect, the mean grain sizes after
ageing may have been marginally larger than recorded, due to the masking effect of the coarse precipitates, which
is a weakness of the grain intercept method in multi-phase alloys [11].
5. Conclusions
Blended elemental powders were successfully consolidated by semi-centrifugal casting, and heat treated to form
Ti-2.7Al-5.7Fe-6Mo-6V alloys. XRD showed the as-cast alloy contained both (αTi) and (βTi), and EDX indicated
the matrix was the (αTi) phase. From DTA and metallography, the alloy was (α+β) between 590oC and 800oC,
and completely (βTi) above 800oC. The kinetics of grain growth during heat treatment was quantified by
metallography, using the grain intercept method. The growth kinetics depended on whether the matrix was (αTi)
or (βTi), as well as on the presence of secondary phases. Minimal incubation was required in the (βTi) phase,
suggesting growth was easier than for the (αTi) matrix, due to the more open bcc crystal structure of (βTi). During
heat treatment of the cast sample, grain growth competed with the dissolution of the (βTi) precipitates, while
during ageing of the solid solution samples, the nucleation and growth of the (αTi) precipitates were competing
processes. There was minimal grain growth close to the beta transus because of the competing (αTi)-(βTi)
transformation. The mean grain size after heat treating above the transus was smaller than at the lower
temperatures, because the (βTi) phase nucleated on the many pre-existing (αTi) grain boundaries. The growth

238
exponents were generally smaller than reported for normal grain growth, due to significant solute drag and the
presence of a secondary phase.
Acknowledgements:
Thanks are given to Anglo American Research Laboratories, South Africa, for the provision of the Manfredi
casting machine and all the other facilities used for this work. We also thank Mr Solomon Dlamini of Anglo
American Research for preparation of the metallographic samples. This work was financially supported by Anglo
American Corporate office, South Africa.
References
1. Hirth, J.P. and Lothe, J., Theory of dislocations, Krieger, Malabar, Florida, USA, (1968).
2. Molodov, D.A., Bollmann, C., Konijnenberg, P.J., Barrales-Mora, L.A., Mohles, V., Annealing Texture
and Microstructure Evolution in Titanium during Grain Growth in an External Magnetic Field, Materials
Transactions, (2007), Vol. 48 (11), pp. 2800-2808.
3. Steinbach, I., Pezzolla, F., Nestler, B., Seesselberg, M., Prieler, R., Schmitz, G.J., Rezende, J.L.L.: A
phase-field concept for multiphase systems, Physica D. 94, (1996), pp. 135-147.
4. Takaki, T., Yamanaka, A., Multi-phase field analysis of stress-strain curve and ferrite grain formation
during dynamic strain-induced ferrite transformation, Key Engineering Materials, (2015), Vol. 626, pp.
81-84.
5. Raabe, D., Computational Materials Science, (1998), Wiehneim, Wiley-VCH.
6. Kim, B.N., Hiraga, N.M., Morita, K., Kinetics of Normal Grain Growth Depending on the Size
Distribution of Small Grains, Materials Transactions, Vol. 44 (11), (2003), pp. 2239 to 2244.
7. Deus, A.M., Fortes, M.A. , Ferreira P.J., Vander Sande, J.B. A general approach to grain growth driven
by energy density differences, Acta Materialia, Vol. 50, (2002), pp. 3317–3330.
8. Leyens, C., Peters, M. (Eds.), Titanium and Titanium Alloys: Fundamentals and Applications, (2003),
WILEY-VCH Verlag GmbH & Co. KgaA, Wiehneim, Germany.
9. Tan, M.J. and Zhu, X.J., Dynamic recrystallization in commercially pure titanium, Journal of
Achievements in Materials and Manufacturing Engineering, (2006), Vol. 18 (1-2), pp. 183-186.

239
10. Iqbal, N., van Dijk, N.H., Offerman, S.E., Moret, M.P., Katgerman, L., Kearley, G.J., Real-time
observation of grain nucleation and growth during solidification of aluminium alloys, Acta Materialia,
(2005), Vol. 53, pp. 2875-2880.
11. Gil, F.J, Rodriguez, D., Plannel, J.A., Grain growth kinetics of pure titanium, Scripta Metallurgica et
Materialia, (1995), Vol. 33 (8), pp. 1361-1366.
12. Kim, B.N., Hiraga, K., Morita, K., Kinetics of Normal Grain Growth Depending on the Size Distribution
of Small Grains, Materials Transactions, (2003), Vol. 44 (11), pp. 2239-2244.
13. Reinbach, R., Nowikow, A., Beeinflussung der Rekristallisation des Titans durch Legierungszusätze, Z.
Metallkunde, (1956), Vol. 47, pp. 583-584.
14. Siemers, C., Brunke, F., Starche, M., Laukart, J., Zahra, B., Rosler, J., Rockiki, P., Saksl, K., Advanced
Titanium Alloys containing micrometer-size particles, Proceedings of the 11th World Conference on
Titanium (Ti-2011), Beijing, China, (2011).
15. Huang, Y., Humphreys, F.J., The effect of solutes on grain boundary mobility during recrystallization
and grain growth in some single-phase aluminium alloys, Materials Chemistry and Physics, (2012), Vol.
132, pp.166-174.
16. Gil, F.J., Manero, J.M., Planell, J.A., Effect of Heat Treatment on the Cyclic Softening of Ti-6AI-4V
Alloy, Frees, F.H., Caplan, I.L. (Eds.), (1993), The Minerals, Metals and Materials Society, pp. 1843-
1850.
17. Pask, J., Evans, A., Surfaces and Interfaces in Ceramic and Ceramic-Metal Systems, Materials Science
Research, (1980), Vol. 14, pp. 167-189.
18. Shvindlerman, L.S., Gottstein, G., Precipitation accelerated grain growth, Scripta Materialia, (2004),
Vol. 50, pp. 1051-1054.
19. Krośniak, M., Pałka, P., Boczkal, G., Numerical Models of Vacancy Diffusion Based on Crystal
Structure, Key Engineering Materials, (2016), Vol. 682, pp. 107-112.
20. Semiatin, S.L., Soper, J.C., Sukonnik, I.M., Grain growth in a conventional titanium alloy during rapid,
continuous heat treatment, Scripta Metallurgica et Materiela, (1994), Vol. 30 (7), pp. 951-955.
21. Rios, P.R., A theory for grain boundary pinning by particles, Acta Metallurgica, (1987), Vol. 35 (12),
pp. 2805-2814.

240
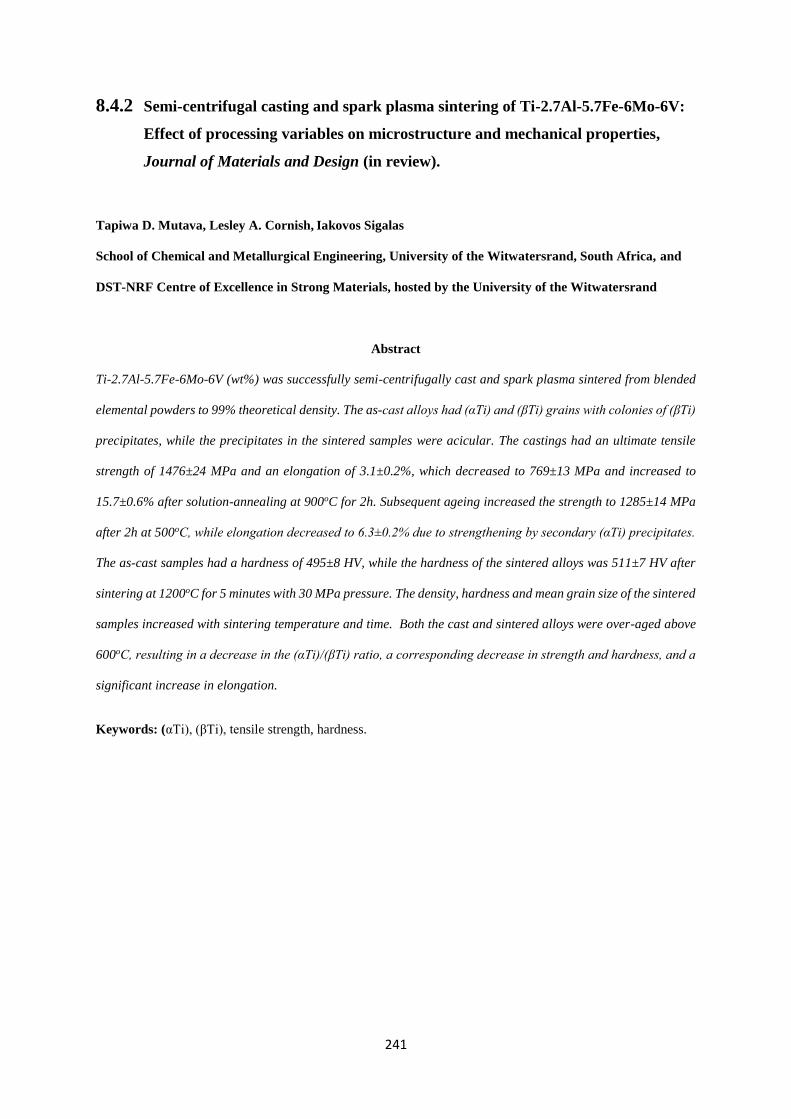
241
8.4.2 Semi-centrifugal casting and spark plasma sintering of Ti-2.7Al-5.7Fe-6Mo-6V:
Effect of processing variables on microstructure and mechanical properties,
Journal of Materials and Design (in review).
Tapiwa D. Mutava, Lesley A. Cornish, Iakovos Sigalas
School of Chemical and Metallurgical Engineering, University of the Witwatersrand, South Africa, and
DST-NRF Centre of Excellence in Strong Materials, hosted by the University of the Witwatersrand
Abstract
Ti-2.7Al-5.7Fe-6Mo-6V (wt%) was successfully semi-centrifugally cast and spark plasma sintered from blended
elemental powders to 99% theoretical density. The as-cast alloys had (αTi) and (βTi) grains with colonies of (βTi)
precipitates, while the precipitates in the sintered samples were acicular. The castings had an ultimate tensile
strength of 1476±24 MPa and an elongation of 3.1±0.2%, which decreased to 769±13 MPa and increased to
15.7±0.6% after solution-annealing at 900oC for 2h. Subsequent ageing increased the strength to 1285±14 MPa
after 2h at 500oC, while elongation decreased to 6.3±0.2% due to strengthening by secondary (αTi) precipitates.
The as-cast samples had a hardness of 495±8 HV, while the hardness of the sintered alloys was 511±7 HV after
sintering at 1200oC for 5 minutes with 30 MPa pressure. The density, hardness and mean grain size of the sintered
samples increased with sintering temperature and time. Both the cast and sintered alloys were over-aged above
600oC, resulting in a decrease in the (αTi)/(βTi) ratio, a corresponding decrease in strength and hardness, and a
significant increase in elongation.
Keywords: (αTi), (βTi), tensile strength, hardness.

242
1. Introduction
Although titanium and its alloys have a superior combination of mechanical properties, and a higher corrosion
resistance than steel and aluminium, their use is still confined to the high-end market because of high extraction
and processing costs [1, 2]. As the use of titanium expands to other industries, efforts are being made to develop
extraction methods and processing technologies with lower cost [3, 4]. Titanium alloys are generally restricted to
small structural parts because they are more difficult to fabricate than steel and aluminium, and forging has been
the preferred method, although it is not sufficiently adaptable to produce large complex shapes [5].
Titanium and its alloys can be manufactured by casting to achieve properties comparable to forgings [5]. However,
unlike steel and aluminium, titanium alloys are very reactive with air in the molten state, and require special
furnaces and moulds to avoid contamination [6]. The entire casting operation is always carried out in a protected
environment, provided by a vacuum or a high purity inert gas [2-6]. Vacuum arc remelting (VAR) and induction-
skull remelting were developed specifically for titanium alloys, to avoid deleterious reactions in the molten state
[2, 7, 8]. The most successful crucibles for the melt are those with a higher affinity for oxygen than titanium,
particularly yttria. In practice, yttria-lined zirconium crucibles are widely used. The major advantage of casting,
particularly precision investment casting, over forging is the ability to produce large complex structures, without
significant material wastage. Additionally, as a near net shape (NNS) technology, casting has much shorter lead
times than forgings and machining, although the properties might not be so good [5].
In the past two decades, significant advances have been made to produce low cost titanium powders and
appropriate processing technologies in response to the growing powder metallurgy (PM) industry and the ever-
increasing demand for cheaper titanium alloys [9]. The only major challenge is developing binders which do not
contaminate titanium, since the current ones de-bind at approximately the same temperature at which titanium
becomes prone to oxygen pick-up [3]. Despite this limitation, many titanium parts are currently produced from
powder. Hot isostatic pressing, pressureless sintering, spark plasma sintering, powder injection moulding, additive
manufacturing (AM) and induction casting are examples of consolidation techniques that have been successfully
demonstrated [3, 5, 8]. However, there is still scepticism amongst designers on the ability of powder metallurgy
titanium parts to match the mechanical properties of castings and forgings [5]. This has led to the application of a
higher safety margin during design, which dictates the use of more material than is justified by cost [5]. However,
as the knowledge and properties of powder metallurgy (PM) and additive manufactured titanium alloys continue
to be developed, acceptance of titanium PM parts is increasing, and the trend is set to continue [3, 5].

243
In the present work, semi-centrifugal casting and spark plasma sintering of a powder blended to target the Ti-
2.7Al-5.7Fe-6Mo-6V (wt%) composition were investigated. The castings were subsequently heat treated, and the
microstructure and mechanical properties were determined. Low cost elemental powders, without a binder, were
used in both cases. Ti-2.7Al-5.7Fe-6Mo-6V, commercially known as Timetal 125, is a metastable (βTi) alloy used
as a high strength fastener on aerostructures [2]. (βTi) alloys are heat treatable, and exhibit the highest strength of
all classes of titanium [7, 10]. However, they are generally heavier and less corrosion-resistant than (αTi) or
((αTi)+(βTi)) alloys [11].
Normally, (βTi) alloys are used in the solution-treated and aged (STA) condition [2, 7]. Their strength originates
from precipitation-hardening by (αTi), which precipitates from the supersaturated (βTi) during ageing [11]. In
solute-lean (βTi) alloys, the metastable omega phase was found to have a strengthening effect, but caused
brittleness [11]. For alloys with a molybdenum equivalence greater than 10, no metastable phases (i.e. martensite
or the omega phase) form, and a fully (βTi) microstructure is obtained at room temperature on water quenching
[12]. (βTi) alloys have low strength and highly ductility in the solution-treated condition, which gives them good
cold working properties [1, 2, 7]. Cold working is necessary, since hot working in the (βTi) field tends to result in
excessive grain growth, due to the more open bcc crystal structure and higher mobility of the solute elements at
elevated temperature [13]. In all titanium alloys, interstitial elements, particularly oxygen, have a significant effect
on mechanical properties [14]. For example, ASTM Grade 1 titanium (0.18 wt% O) has a tensile strength of 170
MPa and elongation of 24%, while ASTM Grade 4 titanium (0.4 wt% O) exhibits 550 MPa and 15% elongation.
In fact, except where corrosion resistance is the key requirement, some level of oxygen is desirable to achieve
high strength [15].
2. Experimental Procedure
Commercial grade elemental powders, sourced from Alfer Aeser, South Africa, were sieved to the +75-106µm
size fraction, and blended to target the Ti-2.7Al-5.7Fe-6Mo-6V composition. The elemental powders were first
individually weighed on a Calerite PS750/C1 balance, to within 0.0001g. The powders were mixed and shaken in
a planetary ball mixer to achieve homogeneity. Blended powder samples of 40g were cold compacted to 30 MPa
in a stainless steel die, using a Manfredi bench-top hydraulic press. The green compacts were consolidated by
casting in a Manfredi centrifugal casting machine using a water-cooled copper induction coil, in the slow heating
mode. Instrument grade argon (supplied by Afrox South Africa) was used as the protective gas, and oxygen and
moisture traps were installed on the argon feed line to minimise contamination. Yttria-lined crucibles were used

244
for melting to ensure minimal contamination of the castings. At the beginning of the casting cycle, the furnace
was evacuated to -90 KPa using an attached Manfredi vacuum pump, and back-filled with argon to atmospheric
pressure. This evacuation and back-filling cycle was done automatically five times before the machine was finally
filled with argon to atmospheric pressure for the melting operation. There was no direct control of the casting
temperature, so melting depended on visual observation using a peep glass in the casting chamber. Induction
heating was allowed to continue until the compact collapsed, before centrifuging into a copper die with a tensile
specimen profile. The castings were allowed to cool to 25oC under the argon in the casting chamber. Disc samples
(15 mm diameter and 3 mm thick) for metallographic analysis were sectioned from the heads of the cast tensile
specimens using a LECO MSX 205A sectioning machine, with a 20S30 silicon carbide cutting blade.
Another set of blended powders with the Timetal 125 target composition was sintered using an FCT-HP D5 spark
plasma sintering machine. A graphite die was used, but had to be lined with a titanium foil to avoid contamination.
The heating rate was 100oC.min-1, pressure was 30 MPa, and the holding time ranged from 5 to 20 minutes,
because samples with low holding times had poor density. The test temperature was varied in increments of 100oC,
from 700oC to 1200oC. The samples were cooled at 100oC.min-1 to room temperature by argon gas flooding. The
sintered samples were simple 5 mm thick discs, with a diameter of 11 mm.
Both the as-cast and sintered samples were ground to remove ~5 µm oxidised surface material. A few sectioned
as-cast and sintered samples were characterized by metallography. The rest of the cast samples were heat treated
enclosed in ampoules in an Elite Thermal Systems TSH 17 furnace at different temperatures and for various
holding times in an argon atmosphere. After each heat treatment, the disc samples were water quenched,
metallographically prepared and analysed by optical and scanning electron microscopy. Each cast disc sample
was enclosed in the same ampoule as the tensile specimen, so that they experienced the same thermal treatment.
Five tensile specimens from each heat treatment were subjected to tensile testing at room temperature.
There were two sets of heat treatments. The first involved heating the as-cast samples from 300oC to 900oC (in
increments of 100oC) and holding for between 5 minutes and 2 hours. These tests are referred to as annealing
experiments. The second set involved a double heat treatment, where the cast samples were first heat treated at
900oC for 2 hours before quenching in water. These solution-treated samples were subsequently aged between
300oC and 700oC for between 5 minutes and 1 hour. These experiments were referred to as ageing experiments.
Metallographic preparation involved grinding and automatic polishing, followed by etching with Kroll’s reagent
for 3-5 s. The etched samples were viewed under an Olympus BIOX B51M optical microscope, connected to an

245
Olympus Motion Stream image analyser. SEM was done with a JEOL JSM 5400 Scanning Electron Microscope
(SEM), coupled to a JSM Energy Dispersive X-ray Spectrum Analyser (EDX). The incident electrons were
accelerated at a voltage of 20 kV, and observations were either in the backscattered electron (BSE) or the
secondary electron (SE) modes. Data acquisition was through an integrated Vantage data acquisition instrument.
Densities of the samples were measured before and after heat treatment using the Archimedes’ water immersion
method. The samples were first weighed in air using a sensitive (0.0001g) Calerite PS750/C1 balance to obtain
their dry mass, and then weighed immersed in water to give the wet mass.
Hardness measurements were done using a Future Tech FM-700 micro-indentation hardness testing instrument,
with a 300 g force. The samples were randomly indented on 10 different areas to give an average hardness value.
Tensile tests were done using an MTS Criterion Universal electromechanical uniaxial tensile testing machine
according to the ASTM-E8 standard. The strain rate was fixed at 0.1 mm.min-1 as required by the ASTM-E8
standard, and data analysis was done on the instrument’s integrated data acquisition computer using
TESTWORKS 4 software.
3. Results
The as-cast alloys were fine grained and consisted of (αTi) and (βTi) grains with colonies of precipitates, while
the precipitates in the sintered samples were acicular, Figure 1. The SEM micrograph of the as-cast sample is
shown in Figure 2(a), and EDX analyses in Table 1 show that the matrix of the as-cast alloys was richer in
aluminium than the precipitates, although the precipitates were too fine to accurately analyse on their own. This
agreed with the XRD result in Figure 3, which showed the major phase was (αTi) and the minor (βTi). The sintered
alloys had an (αTi) matrix and acicular precipitates, with much larger mean grain sizes and a much coarser
microstructure. The precipitates in the sintered samples were slightly richer in iron and vanadium than those in
the as-cast samples, as shown by the EDS analyses in Table 1. The sintered samples had porosity, particularly
around the grain triple points, and some regions without precipitates, Figures 1(b) and 2(b), which were richer in
aluminium. No porosity was observed in the as-cast samples under the optical microscope, although SEM
revealed that they also had porosity, Figure 2(a), and the pores were much smaller, but probably more, than in the
sintered samples, Figure 2(b).
Samples sintered below 1200oC generally disintegrated during metallographic preparation, and could not be
analysed further. At 1200oC, the sintered samples were porous, but the porosity decreased with increasing

246
sintering time, Figure 1(b)-(d). There was a decrease in both the volume fraction and average size of the pores,
while the mean grain size increased with sintering time, Figures 1(b)-(d). The samples were difficult to sinter,
even at 1200oC, hence the unusually along periods (10-20 minutes) used. Although the sintered alloys appeared
to be more porous, the porosity was more localised, and they had a marginally higher density, 99.01±0.02%
theoretical, than the castings, 98.79±0.02%. This was attributed to the pressure during sintering, resulting in a
smaller volume fraction of the pores in the sintered samples. There was also a slight increase in the density of the
sintered alloys with sintering time, Table 2.
(b) (b)
(d) (d)
Figure 1: Optical micrographs of Ti-2.7Al-5.7Fe-6Mo-6V in: (a) as-cast condition, and SPS samples after
sintering at 1200oC and 30 MPa for (b) 5 minutes, (c) 10 minutes and (d) 15 minutes, where 1 indicates
areas without precipitates and 2 indicates grains with precipitates.
Table 1: EDX analyses of the as-cast and sintered samples (wt%).
Sample Area Ti Al Fe Mo V
As-cast Matrix 79.5±0.3 2.7±0.2 5.3±0.1 5.3±0.3 5.7±0.2
As-cast Precipitates 78.3±0.3 2.2±0.1 6.3±0.1 6.9±0.2 6.9±0.2
Sintered Matrix (spots 1) 80.2±0.4 5.1±0.2 4.3±0.2 5.1±0.2 5.3±0.3
Sintered Precipitates (spots 2) 77.8±0.3 1.9±0.3 7.1±0.1 5.8±0.3 7.4±0.2
1
Porosity
Grain boundary
Al-rich PFZ
Acicular (βTi) precipitates
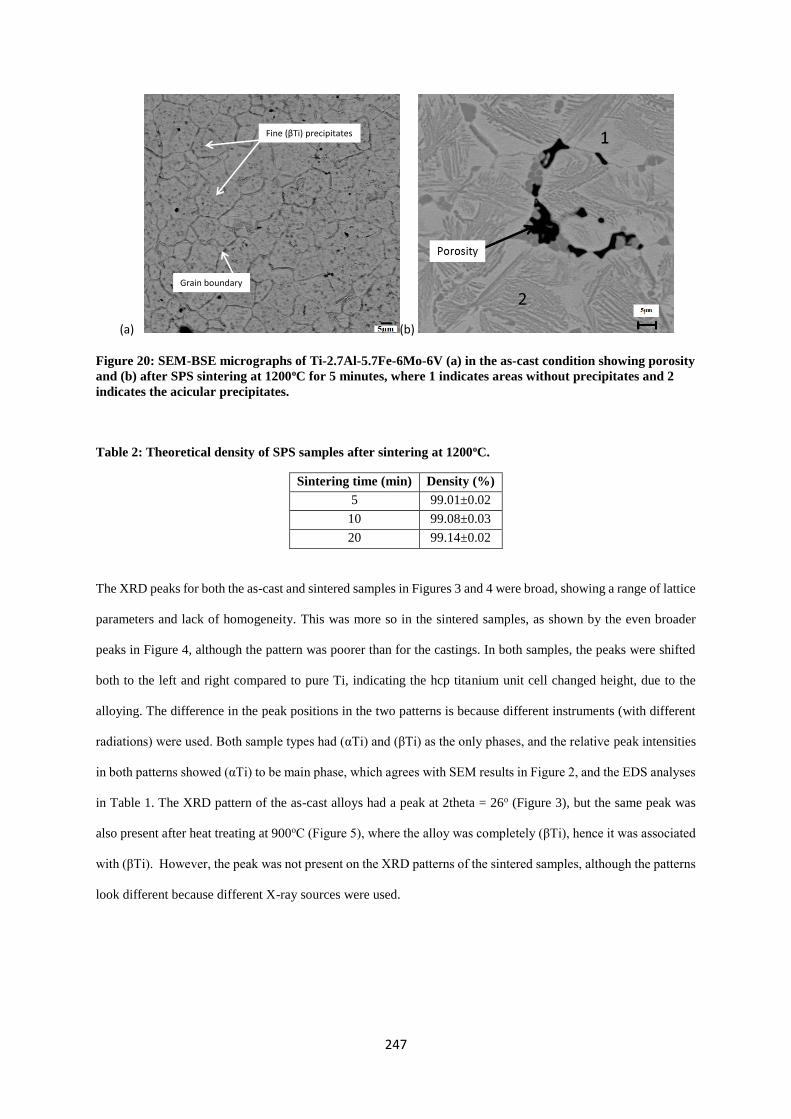
247
(a) (b)
Figure 20: SEM-BSE micrographs of Ti-2.7Al-5.7Fe-6Mo-6V (a) in the as-cast condition showing porosity
and (b) after SPS sintering at 1200oC for 5 minutes, where 1 indicates areas without precipitates and 2
indicates the acicular precipitates.
Table 2: Theoretical density of SPS samples after sintering at 1200oC.
Sintering time (min) Density (%)
5 99.01±0.02
10 99.08±0.03
20 99.14±0.02
The XRD peaks for both the as-cast and sintered samples in Figures 3 and 4 were broad, showing a range of lattice
parameters and lack of homogeneity. This was more so in the sintered samples, as shown by the even broader
peaks in Figure 4, although the pattern was poorer than for the castings. In both samples, the peaks were shifted
both to the left and right compared to pure Ti, indicating the hcp titanium unit cell changed height, due to the
alloying. The difference in the peak positions in the two patterns is because different instruments (with different
radiations) were used. Both sample types had (αTi) and (βTi) as the only phases, and the relative peak intensities
in both patterns showed (αTi) to be main phase, which agrees with SEM results in Figure 2, and the EDS analyses
in Table 1. The XRD pattern of the as-cast alloys had a peak at 2theta = 26o (Figure 3), but the same peak was
also present after heat treating at 900oC (Figure 5), where the alloy was completely (βTi), hence it was associated
with (βTi). However, the peak was not present on the XRD patterns of the sintered samples, although the patterns
look different because different X-ray sources were used.
Fine (βTi) precipitates
Grain boundary

248
Figure 21: XRD pattern of Ti-2.7-5.7Fe-6Mo-6V in the as-cast condition.
Figure 4: XRD pattern of Ti-2.7-5.7Fe-6Mo-6V after sintering at 1200oC for 5 min.
Titanium - beta-Ti - Cubic
Titanium - alpha-Ti - Hexagonal
X13_09_TiMetal_125_3
Lin
(C
ounts
)
0
100
200
300
400
500
600
700
800
900
1000
1100
1200
1300
1400
1500
1600
1700
1800
2-Theta - Scale
2 10 20 30 40 50 60 70 80 90
βTi
(αTi) (βTi)
βTi (αTi)
(αTi) (αTi)

249
Figure 5: XRD pattern of cast Ti-2.7Al-5.7Fe-6Mo-6V after solution-treating at 900oC.
The grains in the as-cast sample were mixtures of (αTi) and (βTi), with (βTi) precipitates. The (βTi) precipitates
in the as-cast microstructure (Figure 6a) completely dissolved after heat treating at 300oC for 2h, Figure 6(b).
However, extensive precipitation occurred after heat treating at 400oC for 2h (Figure 6c), although it was not
possible to separately analyse the intergranular precipitates, due to their fine size, but they were deduced to be
(αTi), possibly with a different composition from the matrix, since their proportion decreased as temperature
increased. The mean grain size increased as the heat treatment temperature increased to 800oC (although the errors
were large), Table 3. At 500oC, the proportion of the intragranular precipitates decreased, Figure 6(d). Generally,
the average grain growth per each 100oC increment was relatively small, possibly due to the competing (βTi)
dissolution and (αTi) nucleation reactions.
Table 3: Grain size of cast Timetal 125 after different heat treatment temperatures (before solution
treatment).
Temperature (oC) Mean grain size (µm)
As-cast 19±7
300 44±23
400 53±21
500 63±21
800 58±26
(βTi)
(βTi)
(βTi) (βTi) (βTi)

250
After heat treating at 600oC, the grains comprised (αTi) and (βTi). The EDX analyses in Table 4 shows (βTi) was
richer in the beta-stabilizers and leaner in aluminium than (αTi), although the EDS analyses were only
comparative, since it was not possible to analyse the fine precipitates without including the matrix. No major
microstructural changes were observed at 700oC, Figure 6(f), showing that the two temperatures lay in the same
phase field. This was also confirmed by DTA (Figure 7), which showed the (αTi)+(βTi) phase field was between
590oC and 800oC. Also, XRD for the as-cast samples in Figure 3 showed both (αTi) and (βTi), whereas there was
only (βTi) at 900oC. At 900oC, the microstructure was almost homogeneous, as shown in Figure 6(h). Thus, 900oC
was deemed to be the solution-treatment temperature for Ti-2.7Al-5.7Fe-6Mo-6V.
The volume fraction of the (αTi) decreased at 700oC, due to transformation to (βTi), with (αTi) outlining the (βTi)
grain boundaries, Figure 6(f). After heat treating at 800oC for 2h, the matrix was mainly (βTi), with (αTi)
precipitates at the grain boundaries, Figure 6(g).
Thus, the microstructure after heat treating at 900oC (Figure 6(h)) was the starting point for all the ageing
treatments. The thermal treatments helped to homogenise the microstructure, as shown in Figure 6(h) and by the
sharper XRD peaks in Figure 5.
(a) (b)
(c) (d)

251
(e) (f)
(g) (h)
Figure 6: Optical micrographs of Ti-2.7Al-5.7Fe-6Mo-6V after heating the as-cast alloy at different
temperatures for 2h. In all the micrographs, the lighter phase is (αTi) and the darker is (βTi).
Table 4: EDX analyses of the phases after heat treatment of the cast alloy at 600oC (wt%).
Phase Ti Al Fe Mo V
(βTi) 79.1±0.2 1.9±0.1 5.9±0.4 6.8±0.3 6.3±0.3
(αTi) 80.0±0.3 3.9±0.3 4.7±0.3 5.6±0.3 5.8±0.2
The ultimate tensile strength (UTS) and hardness of the cast alloys decreased continuously with increasing
annealing temperature (Figure 8). The highest strength (1480 MPa) and hardness (495±15 HV) were in the as-
cast condition, while elongation at fracture was at its lowest, Figures 8 and 11. The hardness of the samples
sintered at 1200oC for 5 minutes was similar, 511±7 HV.

252
Figure 7: TGA-DTA scan for cast Timetal 125, showing initial (αTi) to (βTi) transfornation at 590oC and
the beta transus at 800oC.
After solution-treating the alloy at 900oC for 2h, and subsequently ageing at different temperatures, the
microstructures comprised a (βTi) matrix with (αTi) precipitates, Figure 9(a)-(c). Evenly distributed fine
intragranular and grain boundary precipitates appeared after ageing at 300oC, Figure 9(a). Thick (αTi) precipitates
formed on the grain boundaries after ageing at 400oC, Figure 9(b), and allotriomorphic (αTi) also formed after
ageing at 500oC, Figure 9(c). The mean grain size increased with increasing ageing temperature, and the
intergranular precipitates coarsened, particularly in Figures 9(c) and (d). The thickness of the grain boundary
precipitates decreased after ageing at 600oC, showing they partially dissolved. Both grain boundary and
intragranular precipitates were observed after ageing at 700oC, Figure 9(e), together with coarse polygonal grains
of the (βTi) matrix. There were also some precipitate-free zones (PFZs) adjacent to the grain boundaries. After
ageing at 800oC, Figure 9(f), the microstructure was very similar to the solution-treated state, Figure 6(h), and
XRD (Figure 5) confirmed the alloy was completely (βTi).
Sample Temperature (°C)12001000800600400200
TG
(%
)
100
80
60
40
20
0
HeatF
low
(µ
V)
10
9
8
7
6
5
4
3
2
1
0
-1
-2
-3
-4
-5
-6
-7
-8
-9
-10
-11
-12
-13
-14
Exo
Heat : -0.072 (µV·s/mg)
T : 574.60 and 599.56 (°C)
Onset : 587.866 (°C)
Heat : -0.114 (µV·s/mg)
T : 833.88 and 855.97 (°C)
Onset : 836.773 (°C)
Heat : 0.012 (µV·s/mg)
T : 800.86 and 799.23 (°C)
Onset : 800.859 (°C)
m (mg) 0.496
m (%) 0.742
Remaining Mass : 67.286 (mg)
Tinf : 149.31 (°C), 978.4 (s)
m (mg) -1.522
m (%) -2.278
Remaining Mass : 65.268 (mg)
Tinf : 1 099.95 (°C), 6 277.6 (s)
TG

253
Figure 8: Ultimate tensile strength and elongation of Ti-2.7Al-5.7Fe-6Mo-6V after annealing the cast alloy
at different temperatures.
(a) (b)
(c) (d)

254
(e) (f)
Figure 9: Optical micrographs of Ti-2.7Al-5.7Fe-6Mo-6V after solution-treatment and ageing at different
temperatures for 2h.
The UTS of the cast alloys in the solution-treated (ST) condition was 769±13 MPa, elongation 15.7±0.6% and
hardness 375±7 HV. The ultimate tensile strength increased up to 600oC, then decreased at higher ageing
temperatures, Figure 10. After annealing of the cast samples, elongation at fracture increased with temperature,
as the alloy softened. However, after solution-treatment, elongation decreased with increasing ageing temperature
up to 600oC, and then increased as the alloy became over-aged (Figure 10). The variation of hardness with heat
treatment temperature is shown in Figure 11, where annealing refers to heat treatment of the cast alloy, while the
ageing was after solution-treatment at 900oC and done at different temperatures. Heat treatment of the cast alloy
resulted in decreased hardness with increasing temperature. On the other hand, hardness increased with ageing
temperature up to 500oC, before decreasing at the higher ageing temperatures, similar to the trend of UTS in
Figure 10.
Figure 10: Ultimate tensile strength and elongation of Ti-2.7Al-5.7Fe-6Mo-6V after solution-treatment
and ageing at different temperatures (ST stands for solution-treated).
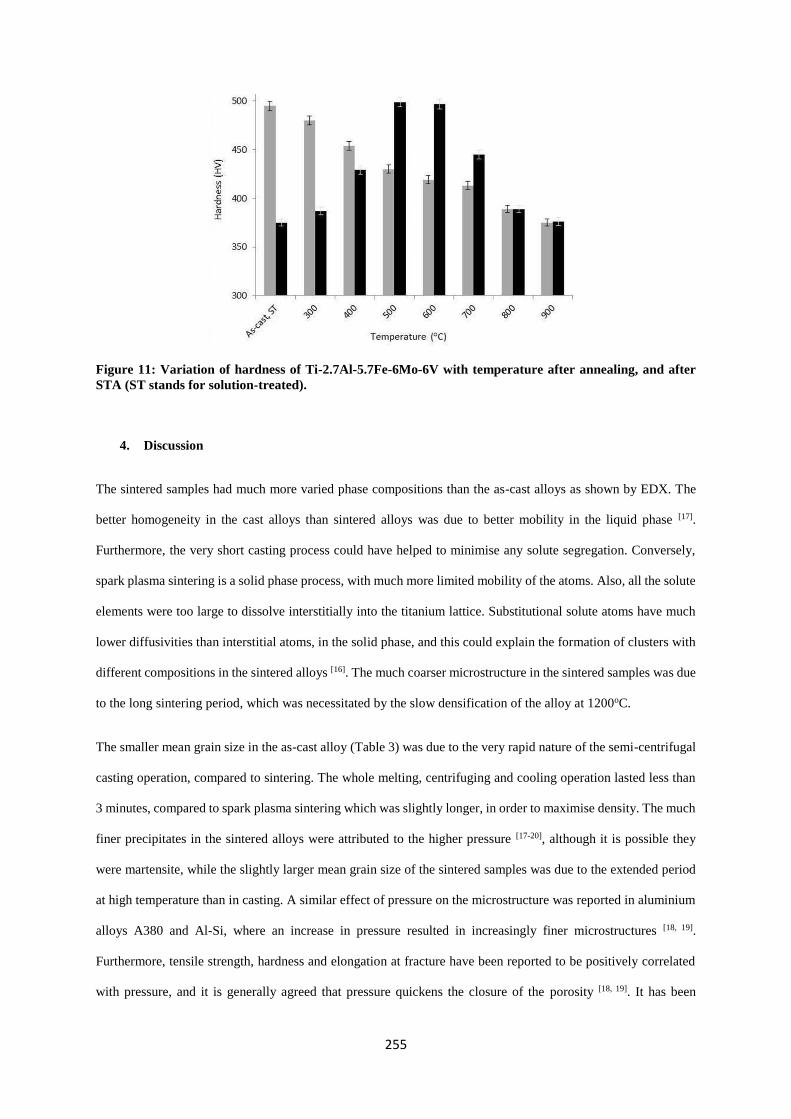
255
Figure 11: Variation of hardness of Ti-2.7Al-5.7Fe-6Mo-6V with temperature after annealing, and after
STA (ST stands for solution-treated).
4. Discussion
The sintered samples had much more varied phase compositions than the as-cast alloys as shown by EDX. The
better homogeneity in the cast alloys than sintered alloys was due to better mobility in the liquid phase [17].
Furthermore, the very short casting process could have helped to minimise any solute segregation. Conversely,
spark plasma sintering is a solid phase process, with much more limited mobility of the atoms. Also, all the solute
elements were too large to dissolve interstitially into the titanium lattice. Substitutional solute atoms have much
lower diffusivities than interstitial atoms, in the solid phase, and this could explain the formation of clusters with
different compositions in the sintered alloys [16]. The much coarser microstructure in the sintered samples was due
to the long sintering period, which was necessitated by the slow densification of the alloy at 1200oC.
The smaller mean grain size in the as-cast alloy (Table 3) was due to the very rapid nature of the semi-centrifugal
casting operation, compared to sintering. The whole melting, centrifuging and cooling operation lasted less than
3 minutes, compared to spark plasma sintering which was slightly longer, in order to maximise density. The much
finer precipitates in the sintered alloys were attributed to the higher pressure [17-20], although it is possible they
were martensite, while the slightly larger mean grain size of the sintered samples was due to the extended period
at high temperature than in casting. A similar effect of pressure on the microstructure was reported in aluminium
alloys A380 and Al-Si, where an increase in pressure resulted in increasingly finer microstructures [18, 19].
Furthermore, tensile strength, hardness and elongation at fracture have been reported to be positively correlated
with pressure, and it is generally agreed that pressure quickens the closure of the porosity [18, 19]. It has been
256
demonstrated in Ti-6Al-4V that pressureless sintering cannot achieve a theoretical density greater than 95%, and
the densities obtained by pressureless sintering were invariably lower than by spark plasma sintering [24, 25]. Thus,
the high density achieved in the spark plasma-sintered samples was due to the applied pressure, in addition to the
sintering temperature and heating rate.
The dissolution of the precipitates at 300oC (Figure 6b) showed that they were (βTi), since the temperature was
below the beta transus. From the present work, the beta transus of Ti-2.7Al-5.7Fe-6Mo-6V was 800oC, but this
could change to higher or lower values depending on interstitial content [2, 14, 20]. The beta-transus is extremely
sensitive to the interstitial elements content, particularly oxygen and nitrogen, and invariably increases as these
impurities increase [2, 14, and 20]. Thus, the equilibrium microstructures of all titanium alloys depend strongly on the
oxygen equivalence of the alloy [20].
The change to a duplex microstructure after heat treating at 600oC indicated the lower (αTi)+(βTi) phase boundary
lay between 500oC and 600oC. The temperature was determined to be 590oC by differential thermal analysis in
Figure 7. The matrix contained ~5wt% Al, and less than 2wt% of each of the other elements, indicating it was
(αTi), while the precipitates contained more of the other elements and less aluminium, showing they were (βTi),
Table 4 (although accurate measurement was not possible due to the small size of the precipitates). The phase
compositions were calculated using Thermo-Calc (with the V3 TTTI database), as a check, and the calculated
values of Fe, Mo and V in (αTi) were much lower than analysed, which also confirms that the analyses of the
small areas were inaccurate. The similarity of the microstructures at 600oC and 700oC showed the two
temperatures were in the same phase field, which agreed with the DTA and XRD results.
The microstructure after heat treating at 800oC showed most of the (αTi) had transformed, except on the grain
boundaries. This indicated the temperature was close to the beta transus, in agreement with the DTA results which
showed the beta transus was 800oC. The microstructure at 900oC was typical of a titanium alloy quenched from
the beta phase field [2], and agreed with the XRD pattern in Figure 5.
The coarsening of the grain boundary (αTi) precipitates after solution treating at 900oC and ageing at 400oC has
been reported in Ti-25Nb-2Mo-4Sn (wt%) and Ti–29Nb–13Ta–4.6Zr (wt%) (βTi) alloys [21-23]. The alloy in the
current investigation had a supersaturated (βTi) matrix after quenching from the (βTi) phase field. The more
thermodynamically stable (αTi) precipitated as temperature increased, and the (βTi) progressively transformed to
(αTi) up to 590oC, where the latter became unstable. The coarsening was predominantly along the grain
boundaries, due to favoured concentration, more space and easier diffusion. The increased (αTi) precipitation and

257
coarsening after ageing at 500oC was in response to the extra thermal energy, although the similarity of the
microstructures showed no phase boundary had been crossed. The grain boundary precipitates after ageing at
600oC were thinner than at 500oC. This was attributed to their dissolution, and transformation to (βTi), since the
temperature was in the (αTi)+(βTi) phase field. The (αTi)/(βTi) ratio decreased as the temperature was increased
to 800oC, resulting in the (αTi) precipitates being confined to the grain boundaries at 800oC. The presence of the
(αTi) precipitates at the transus showed the microstructure was not in full equilibrium.
The increase in strength and hardness up to the 500oC ageing temperature was attributed to precipitate
strengthening by the secondary (αTi), Figures 7(a)-(d), and the decrease in ductility was for the same reason. The
thickening of the precipitates after 2h at 500oC was an indication of over-ageing, Figure 9(c), and when ageing
temperature increased to 600oC, the (αTi) precipitates partially dissolved. The coarsening and eventual dissolution
of the precipitates reduced the ultimate tensile strength and hardness, but improved ductility. As the temperature
increased in the (αTi)+(βTi) phase field, the (αTi)/(βTi) ratio continuously decreased, while the morphology of
the precipitates also changed, until they disappeared above the beta transus. The (αTi) phase is harder than (βTi)
[7], and the increase in hardness up to 500oC was due to increased precipitation of (αTi). The decrease after ageing
at or above 600oC was due to decreasing (αTi)/(βTi) ratio, as (αTi) transformed to (βTi).
The decrease in the ultimate tensile strength and hardness with increasing temperature after annealing the cast
alloys (Figures 8 and 11) was attributed the dissolution of the (αTi) precipitates, and grain growth. However, there
was no significant increase in strength after heat treating at 400oC and 500oC to correspond with the extensive
precipitation at the two temperatures. This indicated there was at least another operative strengthening mechanism.
Normally, strengthening precipitates are not resolvable under an optical microscope [11], and it is possible that any
submicron precipitates dissolved as temperature increased, and the larger precipitates grew. The decrease in
strength between 600oC and 900oC was due to the decreasing (αTi)/(βTi) ratio with increasing temperature, as the
softer (βTi) formed at the expense of (αTi). The lowest strength and highest ductility at 900oC were consistent
with the single-phase microstructure, with no second phase strengthening in the alloy [7]. Thus, forming of Ti-
2.7Al-5.7Fe-6Mo-6V should be done in this state, because the alloy is in its softest state.
Although the shape of the sintered samples was not amenable to tensile testing, the similarity of their density and
hardness to the castings may have indicated they had comparable mechanical properties. However, the pore size
and distribution in the sintered samples were likely to be deleterious to strength and fracture toughness, as has
been observed in similar titanium alloys [17, 24, 25]. The larger average grain size in the sintered samples than the

258
castings was unusual. However, this was attributed to the unusually long sintering time, which was necessitated
by the slow rate of densification at the temperatures that were used. Long processing periods in spark plasma
sintering generally lead to grain growth and coarsening [27-30]. After comparing the sintering behaviour of Timetal
125 to that of Ti-6Al-4V, the slow densification rate was attributed to the very high melting point of molybdenum
[25]. Timetal 125 contains iron and molybdenum, in addition to all the elements in Ti-6Al-4V. Iron improves the
sintering behaviour of titanium alloys, due to its high diffusivity [26], whereas molybdenum has larger and heavier
atoms, with a higher melting point than iron, giving a much slower diffusion rate.
5. Conclusions
Ti-2.7Al-5.7Fe-6Mo-6V can be successfully semi-centrifugally cast or spark plasma sintered from low-cost
blended elemental powders to 99% theoretical density. Although the sintered alloy was not subjected to further
tests, the similarity of its density and hardness to the castings showed it potentially had comparable properties,
although the porosity might have been detrimental. Clearly, the microstructure and properties of Ti-2.7Al-5.7Fe-
6V-6Mo, like of many other alloys, depend on the method of consolidation and the processing parameters used,
such as temperature, pressure and holding time. The alloy had its highest tensile strength (1476±24 MPa) and
hardness (495±15 HV), and lowest ductility (3.1±0.2%), in the as-cast condition, but softened upon heat treatment,
achieving its lowest strength (769±13 MPa) and highest elongation (15.7±0.6%) after solution-annealing at 900oC.
A fully (βTi) microstructure was obtained after water quenching from 900oC. After ageing below 600oC, strength
and hardness increased with increased temperature, while ductility decreased, due to precipitation strengthening,
as the amount of the (αTi) precipitates increased. Above 600oC, the alloy was not optimal, and the amount of the
(αTi) precipitates decreased as they transformed to (βTi). This resulted in a decrease in strength and hardness, and
a corresponding increase in ductility. The optimum ageing temperature for Ti-2.7Al-5.7Fe-6Mo-6V is between
500oC and 600oC for a time proportionate to the size of the sample. In the solution-treated and aged condition, the
alloy can achieve strength of ~1285±11 MPa, hardness of 430±8 HV, while maintaining an elongation of
6.1±0.2%. Although this ductility is much better than the as-cast ductility, it is likely that the alloy was not
optimised because the UTS was much lower.
Acknowledgements

259
Thanks are given to Anglo American Research Laboratories, South Africa, for provision of the Manfredi casting
machine and all the other facilities used for this work. We also thank Mr Solomon Dlamini of Anglo American
Research for preparation of the metallographic samples. This work was financially supported by Anglo American
Corporate office, South Africa.
References
1. Boyer, R.R., Aerospace Applications of Beta Titanium Alloys, Journal of Metals, (1994), Vol. 46 (7),
pp. 20-23.
2. Leyens, C., Peters, M., (EDS.), Titanium and Titanium Alloys: Fundamentals and Applications, (2003),
WILEY-VCH Verlag GmbH & Co. KgaA, Wiehneim, Germany, pp. 8-45.
3. Froes, F.H., Advances in titanium metal injection molding, Powder Metallurgy and Metal Ceramics,
(2007) Vol. 46 (5), pp. 303-310.
4. Ibrahim, K.M., Mhaede, M., Wagner, L., Microstructure Evolution and Mechanical Properties of heat
treated LCB titanium alloy, Transactions of Non-ferrous Metals Society of China, (2012) , Vol. 22, pp.
2609-2615.
5. Veek, S., Lee, D., Tom, T., Titanium investment castings, Advanced Materials and Processes, (2002),
pp. 59-62.
6. Nan, H., Xie, C., Zhao, J. Development and Application of Titanium Alloy Casting Technology in China,
China Foundry, (2005), Vol. 2 (4), pp. 239-241.
7. Donachie, M.J. Titanium: A Technical Guide, 2nd Edn., (2000), ASM International, Materials Park, Ohio,
USA, pp. 96-103.
8. Oh, S.T., Woo, K.D,. Lee, T., Lee, H.C. Effects of heat treatment on mechanical properties of VAR cast
Ti-6Al-4V Alloy, Proceedings of the World Congress on Mechanical, Mechanical and Materials
Engineering, Barcelona, Spain, paper no. 344, (2005), pp. 3441-3445.
9. Gasbarre, W.R., MacGeehan, P. Powder Metallurgy Roadmap, Technology Update for the Powder
Metallurgy Industry, Metal Powder Industries Federation, (2012), pp. 1-17.
10. Davis, J.R. ASM Specialty Handbook: Heat resistant materials, (1997), The Materials Information
Society, Materials Park, Ohio, USA, p. 350.
11. Williams, J.C., Hickman, B.S, Marcus, H.L. The effect of omega phase on the mechanical properties of
titanium alloys, Metallurgical Transactions, (1971), Vol. 2 (7), pp. 1913-1919.

260
12. Guo, Z., Malinov, S., Sha, W. Modelling beta transus temperature of titanium alloys using artificial
neural network, Computational Materials Science, (2005), Vol. 32, pp. 1-12.
13. Siemers, C., Brunke, F., Starche, M., Laukart, J., Zahra, B, Rosler, J., Rockiki, P., Saksl, K. Advanced
Titanium Alloys containing micrometer-size particles Proceedings of the 11th World Conference on
Titanium (Ti-2011), Beijing, China, (2011).
14. Ogden, H.R., Jaffee, R.I. The effects of carbon, oxygen and nitrogen on the mechanical properties of
titanium and titanium alloys, TML Report No. 20, Titanium Metallurgical Laboratory, Battelle Memorial
Institute Columbus 1, Ohio, USA, (1955), pp. 3-13.
15. Paton, N.E., Williams, J.C. The influence of oxygen content on the athermal β-ω transformation, Scripta
Metallurgica, Vol. 17 (6), (1973), pp. 647–649.
16. Chen, Q., Sundman, B. Computation of partial equilibrium solidification with complete interstitial and
negligible substitutional solute back diffusion, Materials Transactions, (2002), Vol. 43 (3), pp. 551-559.
17. Wieding, J., Jonitz, A., Bader, R. The Effect of Structural Design on Mechanical Properties and Cellular
Response of Additive Manufactured Titanium Scaffolds, Materials, (2012), Vol. 5, pp. 1336-1347.
18. Obieka, K.N., Aku, S.Y., Yawas, S., Effect of pressure on the mechanical properties of die-cast
aluminium A380 alloy, Journal of Minerals and Materials Characterization and Engineering, (2014),
Vol. 20, pp. 248-258.
20 Pratheesh, K., Ravi, M., Kanjirathinkal, A., Joseph, M.A. Effects of Strontium and pressure on
microstructure, mechanical and wear properties of near eutectic Al–Si piston alloys, International
Journal of Cast Metals Research, (2015) Vol. 28 (5), pp. 301-309.
21 Szaruga, A., Saqib, M., Omlor, R., Lipsitt. H.A. The effect of oxygen on the beta transus of alpha2-beta
titanium aluminide alloy, Scripta Metallurgica et Materialia, Vol. 26 (5), pp. 787-790.
22 Guo. S., Mang, Q., Liao, G., Hu, L. Zhao, X. Microstructural evolution and mechanical behaviour of
metastable β-type Ti–25Nb–2Mo–4Sn alloy with high strength and low modulus microstructural
evolution and mechanical behaviour of metastable β-type Ti–25Nb–2Mo–4Sn alloy with high strength
and low modulus, Progress in Natural Sciences: Materials International, (2013), Vol. 23 (2), pp. 174-
182.
23 Moffat, D.L., Larbalestier, D.C. The competition between the alpha and omega phases in aged Ti–Nb
alloys, Metallurgical and Materials Transactions A, (1988), Vol. 19, pp. 1687–1694.

261
24 Zhou, Y.L., Niinomi, M., Akahori, T. Decomposition of martensite α″ during ageing treatments and
resulting mechanical properties of Ti–Ta alloys, Materials Science and Engineering A, (2004), Vol.
384, pp. 92–101.
25 Smugeresky, J.E., Dawson, D.B. New titanium alloys for blended elemental powder processing,
Powder Technology, (1981), Vol. 30, pp. 87-94.
26 Ivasishin, O.M., Savvakin, D.G., Froes, F., Mokson, V.C., Bondareva, K.A. Synthesis of alloy Ti-6Al-
4V with low residual porosity by a powder metallurgy method, Powder Metallurgy and Metal Ceramics,
(2002), Vol. 41 (7), pp. 382-390.
27 Bolzoni, L., Ruiz-Navas, E.M., Gordo, E. Understanding the properties of low-cost iron-containing
powder metallurgy titanium alloys, Materials and Design, (2016), Vol. 110, pp. 317-323.
28 Nicula, R., Lüthen, F., Stir, M., Nebe, B. , Burkel, E. Spark plasma sintering synthesis of porous
nanocrystalline titanium alloys for biomedical applications, Biomolecular Engineering, (2007), Vol. 24,
pp. 564-567.
29 Bolzoni, L., Ruiz-Navas, E.M., Neubauer, E., Gordo, E. Inductive hot-pressing of titanium and titanium
alloy powders, Materials Chemistry and Physics, (2012), Vol. 131, pp. 672-679.
30 Bolzoni, L., Esteban, P.G., Ruiz-Navas E.M., Gordo, E. Mechanical behaviour of pressed and sintered
titanium alloys obtained from master alloy addition powders, Journal of the Mechanical Behaviour of
Biomedical Materials, (2012), Vol. 15, pp. 33-45.