Embed Size (px)
Citation preview

University of Babylon, College of Engineering , Engineering Metallurgy , Maithem H-Rasheed
Phase Equilibrium Diagrams:-
Phase equilibrium diagram is a graphic relationship between
temperature and weight ratios of elements and alloys contribute to the
built of the diagram.
Phase diagrams provide information on the following :
Melting point .
Casting condition .
Crystallization condition .
phase transformations (changes).
Phase is a uniform part of an alloy, and a homogeneous aggregation of
mater having a certain chemical composition and structure, and uniform
physical and chemical and mechanical properties.
and which is separated from other alloy constituents by phase boundary.
Every one notes that H2O can exit as a gas, a liquid and a solid. These
are three different phases of water .
solvent: component of a solution present in the greatest amount in alloy .
solute: component or element of solution present in lowest concentration
in alloy .
Solubility Limit :- max. concentration of atoms to be dissolved in
the solvent to form a solid solution.
example solubility of sugar in water.
For example the salt – water solution have a four possible phases:
- Water vapor (steam)
- Liquid salt solution (sodium chloride in water)
- Crystals of water (ice).
- Crystals of salt (sodium chloride).

University of Babylon, College of Engineering , Engineering Metallurgy , Maithem H-Rasheed
Fig (1) Phases and solubility: (a) The three forms of water-gas,
liquid, and solid are each a phase. (b) Water and alcohol
have unlimited solubility. (c) Salt and water have
limited solubility. (d) Oil and water have virtually( practice ) no
solubility.
Fig . (2) Solubility limit of sugar – water solution .

University of Babylon, College of Engineering , Engineering Metallurgy , Maithem H-Rasheed
All curve from three curves in the fig. below represent case equilibrium
of two phases.
Critical point :at a certain pressure and temperature , it mean , no
separate interface between three material phases( gas , liquid , solid ).
Triple point : at a certain pressure and temperature , it mean , the three
phases may be found in equilibrium at the same time .
From a fig. :-
1- the red curve represent , equilibrium of ice and water
vapor(steam).(solid and gas).
2- the blue curve represent , equilibrium of water liquid and water
vapor(steam).(liquid and gas ).
3- the green curve represent , equilibrium of water liquid and water
(ice) .(liquid and solid ).
Note :- the hidden green curve applied on water only .( because the water
expanded when transform to solid ( ice), while all another material
converge(تنكمش ) when densification.
Fig (3) Temp. press. relationship of material .

University of Babylon, College of Engineering , Engineering Metallurgy , Maithem H-Rasheed
Alloying systems :
There are many types of alloying systems which they are:
1- Binary system
It means that alloying have two metals only.
Binary Alloy: when tow metals or a metal and a small amount of a non-
metal are mixed in their molten states and allowed to cool the result is a
binary alloy.
2- Ternary system
It means that alloying have three metals only.
3- Multi system
It means that alloying have three and more than that metals.
In general, binary alloys can be classified into the following types.
1- Simple eutectic type The two components are soluble in each other in the liquid state
but are completely insoluble in each other in the solid state.
2- Solid solution type The two components are completely soluble in each other both in
the liquid state and in the solid state.
3- Combination type
The two components are completely soluble in the liquid state, but
are only partially soluble in each other in the solid state.
Thus this type of alloy combines some of the characteristics of both the
previous types, hence the name ‘combination type’ phase equilibrium
diagram.
Let's now consider these three types of binary alloy systems and their
phase equilibrium diagrams in greater detail.
1) Eutectic type:-
In general case, consider for studying a two components presents which
are referred to as metal A and metal B, with the phase diagram as shown
in figure 1.

University of Babylon, College of Engineering , Engineering Metallurgy , Maithem H-Rasheed
Figure 4. Phase equilibrium diagram (eutectic type).
This point on the diagram is called the eutectic, the temperature at which
it occurs is the eutectic temperature, and the composition is the eutectic
composition.
Eutectic : this is the particular composition of two substances which
freeze simultaneously at the same temperature .
Eutectic temperature: - It is the melting temperature of any alloy with the
eutectic composition.
OR: - The temperature at which the liquid and the solid are in
equilibrium.
In practice, few metal alloys from simple eutectic type phase diagrams.
. carbon steelsAs an example of eutectic are
2- Solid solution alloy is a phase, where two or more elements are
completely soluble in each other.
Depending on the ratio of the solvent (matrix) metal atom size
and solute element atom size,
for example :- gold- silver alloy , cupper- nickel alloy.
Two types of solid solutions may be formed: substitution or interstitial.

University of Babylon, College of Engineering , Engineering Metallurgy , Maithem H-Rasheed
Substitution Solid Solutions:-
If the atoms of the solvent metal and solute element are of similar sizes
(not more, than 15% difference), they form substitution solid solution,
where part of the solvent atoms are substituted by atoms of the alloying
element as shown in figure 2. for example . copper and nickel
Figure 5. Substitution solid solution.
Some substitution solid solutions may form ordered phase where ratio
between concentration of matrix atoms and concentration of alloying
atoms is close to simple numbers like AuCu3 and AuCu.
Figure(6) explain formation of a Substitutional Solid Solution alloy.

University of Babylon, College of Engineering , Engineering Metallurgy , Maithem H-Rasheed
Interstitial solid solution
The atoms of the added element inter the interstices of the parent lattice.
In other words, they fit into the spaces between the atoms of the parent
metal this is of less common occurrence and is only possible if the atoms
of the added element are small compare with those of the parent metal.
Good example is that of carbon in iron to form that various step solid
solutions.
If the atoms of the alloying elements are considerably smaller, than the
atoms of the matrix metal, interstitial solid solution forms, where the
matrix solute atoms are located in the spaces between large solvent atoms
as shown in figure 7.
Figure 7. Interstitial solid solution.
Figure(8) explain formation of an interstitial solid solution
University of Babylon, College of Engineering , Engineering Metallurgy , Maithem H-Rasheed
Fig (9-10) Substitution and interstitial solid solution and distortion.
University of Babylon, College of Engineering , Engineering Metallurgy , Maithem H-Rasheed
In certain alloys containing 3 metals not as ternary alloy, both types of
solid solution may co-exit.
For example, in austenitic manganese steel there is a substitution solid
iron and also an interstitial solid solution of insolution of manganese
.carbon in iron
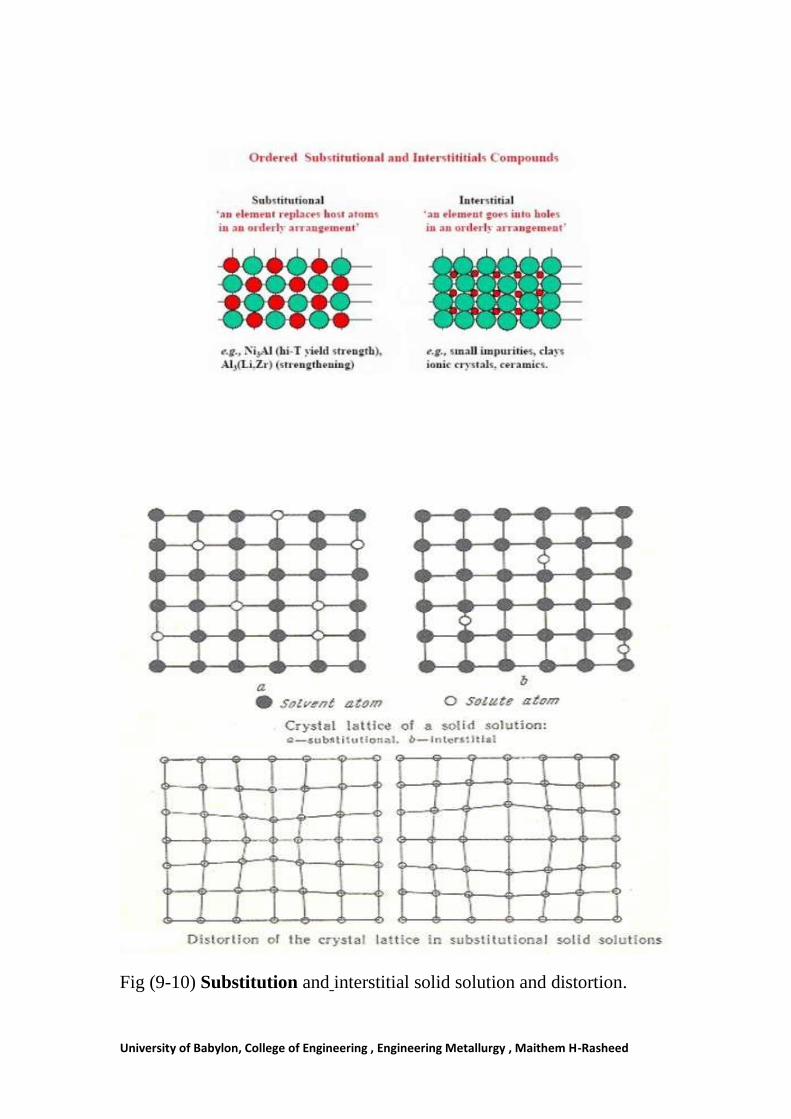
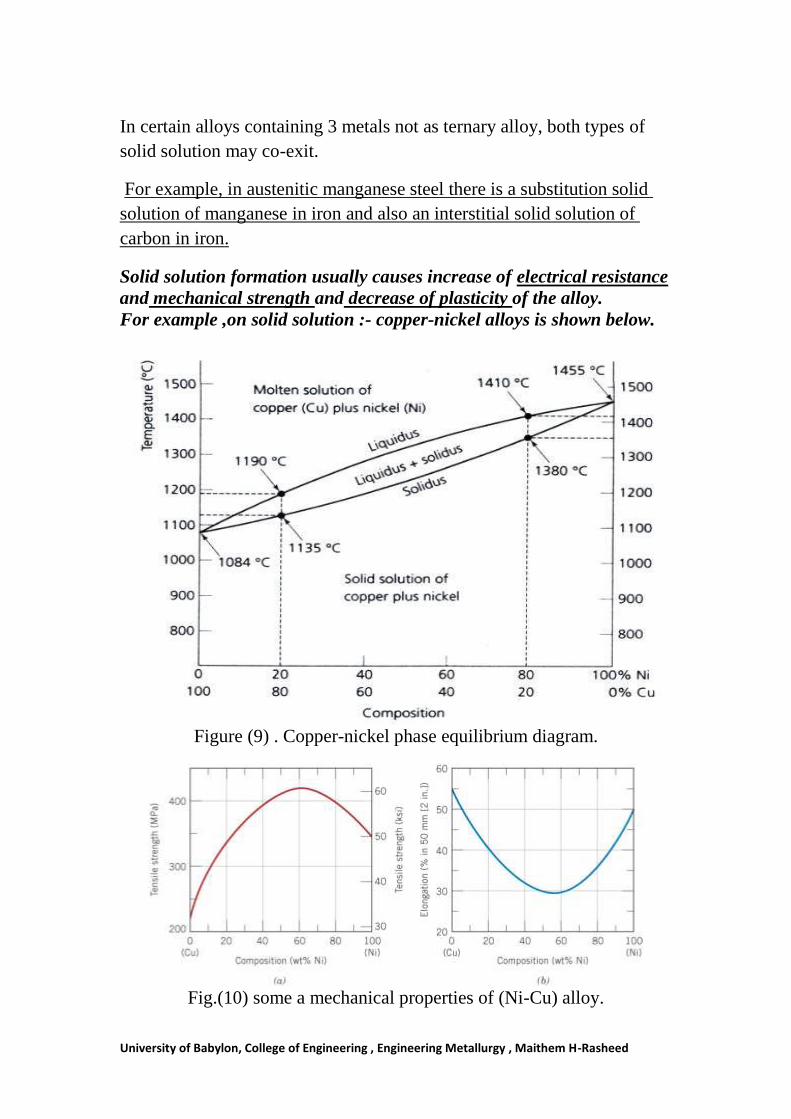
Solid solution formation usually causes increase of electrical resistance
and mechanical strength and decrease of plasticity of the alloy.
For example ,on solid solution :- copper-nickel alloys is shown below.
Figure (9) . Copper-nickel phase equilibrium diagram.
Fig.(10) some a mechanical properties of (Ni-Cu) alloy.

University of Babylon, College of Engineering , Engineering Metallurgy , Maithem H-Rasheed
Factors Effecting in solubility of solid solution alloys:-
1- Similarity the space lattice of solvent metal and soluble element.
2- Atomic diameters for solvent and soluble must be converges .
3- Chemical composition must be near of solvent and soluble.
4- Frequency (HZ/Sec) must be near of solvent and soluble.
5- Type the charges of solvent and soluble.
Cooling Curves:-
1- Pure metals
If a pure metal is allowed to cool slowly from liquid to room temperature
and the temperature drop is plotted against time the resultant cooling
curve will be as show in fig.(11) below

University of Babylon, College of Engineering , Engineering Metallurgy , Maithem H-Rasheed

University of Babylon, College of Engineering , Engineering Metallurgy , Maithem H-Rasheed
Lever Rule The lever rule is a tool used to determine weight percentages of each
phase of a binary equilibrium phase diagram . It is used to determine
the percent weight of liquid and solid phases for a given binary
composition and temperature that is between the liquidus and solidus.
………………………(1)
……………….(2)
………………………..(3)
Sub. (3) in (2)

University of Babylon, College of Engineering , Engineering Metallurgy , Maithem H-Rasheed
and by using same method
……………………….(4)
Sub. (4) in (2)

University of Babylon, College of Engineering , Engineering Metallurgy , Maithem H-Rasheed
Examples :- 1- At point B (35 wt% Ni, 1250ºC) on figure 10.3b, what are the mass fraction liquid
and the mass fraction solid?
Ans.

University of Babylon, College of Engineering , Engineering Metallurgy , Maithem H-Rasheed
Example Problem: 2- Calculate the amount of each phase present in 1 kg of a 50 wt.% Ni- 50 wt.% Cu
alloy at a) 1400°C b) 1300°C c) 1200°C.
Ans.
a) For a 50 wt.% Ni- 50 wt.% Cu alloy at 1400°C, we are in the liquid (L) region of
the phase diagram. Therefore, we have 1 kg of liquid (L).
b) For a 50 wt.% Ni- 50 wt.% Cu alloy at 1300°C, we are in the solid + liquid (α+L)
region of the phase diagram. Here we must use the lever rule to calculate the mass
fraction of each phase.
if we draw a tie line across the α+L region at 1300°C, the endpoints are at about 45 wt.%
Ni and 60 wt.% Ni. Therefore, the mass fractions are:
c) For a 50 wt.% Ni- 50 wt.% Cu alloy at 1200°C, we are in the solid (α) region of the phase diagram. Therefore, we have 1 kg of solid (α).

University of Babylon, College of Engineering , Engineering Metallurgy , Maithem H-Rasheed
3) Phase equilibrium diagrams (Combination type):
Many metals and non-metals are neither completely soluble in each other
in the solid state nor are they completely insoluble. Therefore they form a
phase equilibrium diagram of the type shown in figure 5.
In this system there are two solid solutions labelled α and β. The use of
the Greek letters α, β, γ, etc., in phase equilibrium diagrams may be
defined, in general, as follows:
1- A solid solution of one component A in an excess of another
component B, such that A is the solute and B is the solvent, is
referred to as solid solution α.
2- A solid solution of the component B in an excess of the component A,
so that B now becomes the solute and A becomes the solvent, is referred
to as solid solution β.
3- In a more complex alloy, any further solid solutions or intermetallic
compounds which may be formed would be referred to by the subsequent
letters of the Greek alphabet. That is, γ, β, etc.
Figure 5. Combination type phase equilibrium diagram.