Embed Size (px)
Citation preview

M ~
Smart Commute A Program of METROLINX
PHASE 2: Children's Independent Mobility Across the City of Toronto
Ron N. Buliung Department of Geography University of Toronto Mississauga

Children’s Independent Mobility in the GTHA Phase 2 ii
Phase 2: Children’s independent mobility across the City of Toronto
Acknolwedgements
Ron N. Buliung Department of Geography University of Toronto Mississauga 3359 Mississauga Rd. N. Mississauga, Ontario, L5L 1C6 Tel: 905-569-4419 E-mail: [email protected]
Kristian Larsen Department of Geography University of Toronto Mississauga 3359 Mississauga Rd. N. Mississauga, Ontario, L5L 1C6 Tel: 416-888-6501 E-mail: [email protected]
Guy E.J. Faulkner Faculty of Kinesiology and Physical Education University of Toronto 55 Harbord St. Toronto, Ontario, M5S 2W6 Tel: 416-946-7949 E-mail: [email protected]

Children’s Independent Mobility in the GTHA Phase 2 iii
Foreword
In Metrolinx’s The Big Move, a transport future is envisioned that includes the majority of children using
active modes of transportation; namely, walking and cycling, for school trips. Transforming this vision
into reality requires developing data and insight regarding barriers and enablers to the uptake of active
transportation in childhood that may exist within our social and built environments. The research
contained in this report constitutes the second of two studies on the subject of children’s school travel
and independent mobility in the Greater Toronto and Hamilton Area. The child travelling independently
is the child learning a range of spatial skills while accumulating a wealth of knowledge regarding the use
of active transportation in everyday life. In the first phase we examined the relationship between social
factors, elements of neighbourhood design and the available supply of transport options and school
transportation across the Greater Toronto and Hamilton Area, and within the City of Toronto. We also
studied the social and environmental correlates of children’s independent mobility (travelling about the
neighbourhood or city without adult supervision) within the region. In this second study we take a closer
look into how social and built environments produce differences in school travel and children’s
independent mobility across the City of Toronto.
The principal investigators of this study, Dr. Ron Buliung and Dr. Guy Faulkner, University of Toronto,
wish to acknowledge research funding support from Metrolinx. This work was conducted in
collaboration with Jennifer Lay, Fred Sztabinski, and Joshua Engel-Yan of the Policy, Planning and
Innovation Division at Metrolinx. Data used in this research was collected with research funding support
from the Built Environment, Obesity and Health Strategic Initiative of the Heart and Stroke Foundation
and the Canadian Institutes of Health Research (CIHR).
Children’s Independent Mobility in the GTHA Phase 2 iv
Table of Contents
Foreword ...................................................................................................................................................... iii
List of Figures ................................................................................................................................................ v
List of Tables ................................................................................................................................................ vi
Executive summary ..................................................................................................................................... vii
Data sources and methods .................................................................................................................... viii
Findings .................................................................................................................................................... ix
Takeaways for Regional Transportation Planning in the GTHA ................................................................ x
Introduction .................................................................................................................................................. 1
Correlates of walking and independent mobility: What do we know? .................................................... 2
Individual and social characteristics ......................................................................................................... 3
Objective environmental variables ........................................................................................................... 3
Parental and child perceptions ................................................................................................................. 5
Methods ........................................................................................................................................................ 6
Data sources and the BEAT Project ........................................................................................................... 6
GIS analysis of built environment ............................................................................................................. 9
Traffic data around the school ................................................................................................................ 11
Age and gender interaction with the environment ................................................................................ 14
Empirical analysis and modelling ............................................................................................................ 15
Results ......................................................................................................................................................... 18
Age and gender interactions with urban structure ................................................................................ 22
Regression models - To school trip ......................................................................................................... 23
Walk versus driven .............................................................................................................................. 23
Independent versus escorted ............................................................................................................. 26
From school trip ...................................................................................................................................... 28
Walk versus driven .............................................................................................................................. 28
Independent versus escorted ............................................................................................................. 30
Discussion and conclusion .......................................................................................................................... 33
Individual and social characteristics ....................................................................................................... 34
Route based environment ...................................................................................................................... 35
Perceptions ............................................................................................................................................. 36
References .................................................................................................................................................. 37
Children’s Independent Mobility in the GTHA Phase 2 v
List of Figures Figure 1: Sample of school neighbourhoods and street design .................................................................. 8
Figure 2: Example of a hypothetical completed map illustrating the route to and from school .............. 9
Figure 3: Example of traffic count locations and vehicle counts, 8:00-8:45 a.m. ................................... 13
Figure 4: Example of traffic count locations and vehicle fleet mix, higher values represent more
passenger vehicles, 8:00-8:45 a.m. ............................................................................................................ 14
Figure 5: Rates of walking to school in pre and post 1960 neighbourhoods by gender and age ............ 23
Figure 6: Rates of independent travel to school in pre and post 1960 neighbourhoods by gender
and age 23
Children’s Independent Mobility in the GTHA Phase 2 vi
List of Tables
Table 1: Pedestrian safety multiplier for car equivalency ........................................................................ 12
Table 2: Social, individual and environmental variables examined ......................................................... 16
Table 3: Significance of correlations in preliminary analysis .................................................................... 17
Table 4: Descriptive statistics to school .................................................................................................... 19
Table 5: Descriptive statistics from school ................................................................................................ 21
Table 6: Logistic regression estimation results with walk as dependent variable for to school trip ...... 24
Table 7: Logistic regression estimation results with walking independently as the dependent variable
for to school trip ......................................................................................................................................... 27
Table 8: Logistic regression estimation results with walking as dependent variable for from school trip
.................................................................................................................................................................... 29
Table 9: Logistic regression estimation results with walking independent as the dependent variable for
from school trip .......................................................................................................................................... 31

Children’s Independent Mobility in the GTHA Phase 2 vii
Executive summary
In ‘The Big Move’, Metrolinx’s regional transportation plan, the goal is to have 60% of children walking
or cycling to school in the Greater Toronto and Hamilton Area (GTHA) by 2031. There is also an
emphasis on sustainable transportation for adults, where the goals is to have 20% of work trips taken by
active modes such as walking and cycling, but also to have 30% of adults commuting on transit. By
2031, the young children of today will be working adults who commute to and from work. What will the
environment look like for them? How will they traverse through the environment to get to and from
work? Will years of escorting children in automobiles simply reproduce their auto-oriented lifestyle? If
we want to encourage sustainable transportation in the future, we need to act now by establishing
walking and cycling patterns in today’s children. It is important to establish active commuting at a
young age, as such travel choices may continue along the life-course. 1 School trips provide one
opportunity to integrate walking or cycling into daily routines. Over the past four decades, however,
rates of active transport to school (ATS) have declined across Canada and in the United States, while the
number of children being driven to school in an automobile has increased dramatically.2,3 While rates
of walking have declined, the prevalence of childhood obesity has also increased. 4,5 Decreases in daily
physical activity may partly explain the rise in childhood overweight and obesity rates.6 School travel is
one potential opportunity to integrate daily physical activity through ATS. 7 Establishing walking not only
provides direct physical activity benefits in the short term; active travel choices in childhood may
influence transport decisions later in life. 8 Encouraging walking for school travel may relate to higher
rates of walking to work or transit use as children and youth become an adult commuting labour force.
Travelling by automobile may produce the opposite effect. Children who spend a lot of time sedentary
(i.e. driven in a vehicle) are more likely to continue with such a pattern of behaviour into their adult
lives.9 Thus, it is important to focus efforts on increasing rates of walking and/or cycling for today’s
children and youth, as this may also improve rates of active commuting in the future.
Although there are many immediate and lifelong benefits related to walking to and from school,
it is unrealistic to expect that parents will always be available to escort their child. Furthermore, parents
should not have to always make themselves available. Consistently escorting children to and from
school denies children of the opportunity to learn about the efficacy and even enjoyment associated
with walking through the environment without adult supervision. This highlights the importance of
children’s independent mobility (CIM), which is when children have the freedom to travel without adult
supervision.10,11 Independent mobility for children provides an opportunity within their young lives to
develop conflict resolution (social) and environmental (way-finding, navigation) knowledge and skills

Children’s Independent Mobility in the GTHA Phase 2 viii
related to cognitive development. Children who travel independently are also using sustainable
transport modes such as transit, walking or cycling. Encouraging independent travel for school trips also
typically translates into more independent mobility to other destinations.12 There are many benefits of
independent mobility related to cognitive development and knowledge acquisition, but CIM also
provides children with a very clear opportunity to learn about the importance of sustainable transport
and how it can be applied to their travel decisions. The purpose of this study is to assess how the built
and social environment in Toronto relates to school travel decisions pertaining to mode choice and
independent mobility. This is phase two of a two study research project examining CIM and school
travel in the Greater Toronto and Hamilton Area.
Data sources and methods
This study was set in the City of Toronto using data from the Built Environment and Active
Transportation Research Project (BEAT). The BEAT project is a large-scale multidisciplinary study
conducted at the University of Toronto to explore the relationship between the built environment,
school travel patterns and levels of physical activity. As part of the project, grade 5 and 6 students and
their parents from 17 schools located across Toronto’s diverse range of neighbourhoods independently
completed travel behaviour surveys (n=1035) and a mapping exercise to obtain routes travelled to and
from school. Geographic Information Systems (GIS) analysis was performed to examine objective
characteristics along the route to and from school, while data on transport/traffic and
neighbourhood/built environment perceptions were obtained from the travel behaviour survey. Binary
logistic regression was used as the statistical method to test for associations between social, individual,
objective and perceived neighbourhood characteristics in relation to mode of travel and independent
mobility. The overarching goal of the work is to ascertain the ways in which our social and built
environments affect children’s independent mobility and mode of travel to and from school across the
City of Toronto. Separate models were specified for the trip to and from school; past research
demonstrates differences in the social and environmental links to school travel according to trip
direction (to/from school).24,25
Children’s Independent Mobility in the GTHA Phase 2 ix
Findings
This research first tested what features relate to mode of school travel and then examined independent
mobility. Findings from each part of the study are reported below:
Mode choice: walk versus being driven
To School
1. The more vehicles within a household relative to the number of licensed drivers, the less likely a
child is to walk to school.
2. Households with a stay-at-home parent (irrespective of the parent’s gender) are more likely to
have children walking to school.
3. Children are less likely to walk when distances are longer.
4. Children who would have to cross a lot of streets en route are less likely to walk.
5. If a route does not have full sidewalk coverage children are less likely to walk.
6. Children are less likely to walk if their parents perceive strangers as a concern.
From School
1. Higher income neighbourhoods produce less walking.
2. Children are less likely to walk when distances are longer.
3. Children who would have to cross a lot of streets en route are less likely to walk.
4. Children whose school route goes through areas constructed prior to 1960 are more likely to
walk.
5. Children who perceive their neighbourhood as safe to walk alone are more likely to walk.
6. Children are less likely to walk if their parents perceive strangers as a concern.
CIM: Independent versus escorted walking
To School
1. Older children (aged 11 and 12) are more likely to walk to school without adult supervision.
2. Children who identified themselves as boys were more likely to walk without adult supervision
than children who self-identified as girls.
3. Longer distances are more likely to be covered with adult supervision.
4. Parents with a flexible work schedule are more likely to walk with their child.
5. Both objective and perceived traffic volume around the school related to independent travel. If
there were more vehicles around the school, children were less likely to walk without an adult.

Children’s Independent Mobility in the GTHA Phase 2 x
6. Children who perceive their neighbourhood as safe to walk alone are more likely to walk
independently.
From School
1. Older children (aged 11 and 12) are more likely to walk without adult supervision.
2. Children who self-identified as boys were more likely to walk independently than children who
self-identified as girls.
3. Both objective and perceived traffic volume around the school related to independent travel. If
there were more vehicles around the school, children were less likely to walk without an adult.
4. Children who perceive their neighbourhood as safe to walk alone are more likely to walk
independently.
5. If a parent is home with his or her child, that child is more likely to be escorted (i.e. walked).
Takeaways for Regional Transportation Planning in the GTHA
Findings suggest that certain characteristics relate to both mode of travel and CIM, but there are
differences in how each of these variables influences mode choice and independent travel. In general,
findings suggest that age, gender, distance, street crossings, traffic around the school and the child’s
perception of living in a safe area to walk alone influenced walking and CIM to some degree.
If a route had missing sidewalks children were less likely to walk. Policies and plans should aim
to complete sidewalk networks in areas around schools where this feature is missing from the built
environment and no new developments should be constructed without a complete sidewalk network.
The completion of the sidewalk network will not only benefit children when walking to school, but will
also improve the walking infrastructure for people of all ages and could potentially relate to a more
attractive environment for everyone.
Distance was found to be the most statistically significant correlate of school travel mode.
Longer distances produce less walking and independent travel to school. Changes in the distance
between a home and school can relate to, for example, school closures and the amalgamation of school
districts. If a child’s local school closes, distance to their new school will likely be longer, reducing the
odds of walking or travelling independently.
In some places, and for some children, distance to school may also relate to housing
affordability and neighbourhood design, things that may largely be beyond the control of households
with restricted choices in the housing market due to income. For example, it is difficult to select yourself
into a neighbourhood with short distances to a highly resourced school if your income will not permit

Children’s Independent Mobility in the GTHA Phase 2 xi
such mobility within the housing market. Thinking carefully about how school travel distances are
produced is an important part of developing policies that would see distance attenuated as a barrier to
the uptake of ATS. Time and time again school closure will be revisited as boards and the province look
to rationalize the cost of educational services; school closures are not a new issue. It is important,
however, to consider the indirect costs associated with such potential closures and the possible impact
school closure could have for the health of children and their environments, not just today, but moving
forward.
Children were more likely to walk if they lived in households where a parent indicated that he or
she was available at home during the school day. Children in these households were more likely to walk,
but less likely to walk independently. This likely relates to the fact that when parents are at home, they
have time to escort their child(ren) and it appears from the findings that many of these parents prefer to
walk over escorting in a motor vehicle. Also, within the sample of walkers, children of parents with a
more flexible work schedule were more likely to escort their child. Workplace policies that allow for flex
hours may help to get more children walking to school in the short term. Even though flex hours may
encourage escorted walking, more children walking remains a step in the right direction. Of the two
issues, getting more children walking is probably more critical than sorting out precisely how to make
this walking happen without adult supervision. Moreover, the presence of adults known to children
during the school trip does not necessarily mean that the adults are hovering directly over their children.
There are many different kinds of adult supervised travel, wherein children – under the watchful yet
distant eye, of their parents, are able to experience independent moments of play and decision making
along the way. Higher rates of walking also directly relates to the number of motor vehicles around the
school. Previous research suggests that reducing the number of motor vehicles is one way to encourage
independent walking among children. 13 Thus, policies and plans targeting increases to escorted walking
may indirectly promote CIM in the long term.
Within the Big Move, the goal is to have 60% of children walking to and from school. This study
suggests that moving forward plans and policies should focus on improving traffic safety concerns,
completing sidewalk networks and understanding the importance of distance in school travel decisions.
Findings from this study also suggest that more work is needed within Toronto’s newer residential areas
as children in these neighbourhoods had significantly lower odds of walking. Any revision to the Big
Move should consider precisely how school travel and CIM may indeed connect to the longer range
targets related to getting the region’s population moving, as establishing active and sustainable travel
patterns in today’s youth is crucial in order to meet future goals.

Phase 2: Children’s independent mobility across the City of Toronto
Introduction
The journey to and from school is one of the most important opportunities to establish daily physical
activity for children through the use of active modes such as walking or cycling.7 Rates of active
transport to school (ATS) have decreased over the past few decades, as many more parents and
caregivers are driving children to and from school.2,3 More specifically, in Toronto, almost 56% of
children aged 11 to 13 walked to school in 1986; but by 2006, the rate dropped to 48%.2 For automobile
travel in Toronto, in 1986 only 14% of children aged 11 to 13 were driven to school compared to 28% in
2006.2 Over the same time period as these decreases in ATS were observed, the prevalence of
childhood obesity has increased.4,5 Recent decreases in physical activity levels may be partly to blame for
the current trends in childhood obesity.6 Walking to and from school, on its own, will not solve the
obesity epidemic nor will it allow children to reach their daily recommended levels of physical activity,
but it does give children daily (weekday) physical activity through the use of sustainable transportation,
contributing toward the construction of a healthier lifestyle.
There are physical activity benefits to walking to school, but another important aspect of school
travel relates to the fact that today’s children and youth are tomorrow’s commuting adults. Research
has discussed the importance of establishing walking at a young age as this can influence how people
choose to travel later in life.8 Thus, more children and youth walking today could translate into more
adults walking to work, transit stations or other destinations in the future. Research has also reported
similar trends for children who are driven. Children who spend more time sedentary (sitting in an
automobile) are less likely to walk (or engage in other forms of physical activity) as adults and are likely
to continue their sedentary ways.9 These findings highlight the importance of supporting and
encouraging children to walk to and from school. Not only will walking provide them with daily physical
activity during the week, but they may also continue to use walking as a method of commuting as they
enter the workforce. In The Big Move, Metrolinx’s regional transportation plan for the Greater Toronto
and Hamilton Area (GTHA), the goal is to have 60% of children using ATS and to have 30% of adult work
trips taken by transit and 20% by walking or cycling by 2031. Targeting childhood as a time of
intervention with regard to transportation choices could help with the process of meeting longer term
goals for school and non-school travel using active and sustainable modes.
Although there are many immediate and lifelong benefits related to walking to and from school,
it is unrealistic to expect that parents will always be available to escort their child. Furthermore, parents

Children’s Independent Mobility in the GTHA Phase 2 2
should not have to always make themselves available. Consistently escorting children to and from
school denies children of the opportunity to learn about the efficacy and even enjoyment associated
with walking through the environment without adult supervision. This highlights the importance of
children’s independent mobility (CIM), which is when children have the freedom to travel without adult
supervision.10,11 Independent mobility for children provides an opportunity within their young lives to
develop conflict resolution (social) and environmental (way-finding, navigation) knowledge and skills,
related to cognitive development. Children who travel independently are also using sustainable
transport modes such as transit, walking or cycling. Encouraging independent travel for school trips also
typically translates into more independent mobility to other destinations and increases participation in
unsupervised outdoor play (i.e., parks).12 There are many benefits of independent mobility, aside from
physical activity, 14,15 CIM also relates to cognitive development, knowledge acquisition and sense of
community for children.16,17,18 For instance, one study reported that children who were allowed to travel
independently obtained more knowledge of their neighbourhood and had improved or enhanced
cognitive development.19 Another study reported that children who travel and play outside
independently had a stronger sense of community and were less concerned about crime than others.20
Finally, CIM also provides children with a very clear opportunity to learn about the importance of
sustainable transport and how it can be applied to their travel decisions.
The purpose of this study is to assess how the built and social environment in Toronto relates to
school travel decisions pertaining to mode choice and independent mobility. This is phase two of a two-
step research project examining CIM and school travel in the GTHA. Phase one primarily focused on
school travel across the GTHA; this study focuses on Toronto. The following section will provide
background literature on how neighbourhood features and perceptions may relate to independent
mobility for children.
Correlates of walking and independent mobility: What do we know?
Many recent studies have examined how certain social and environmental characteristics relate to ATS.
Much of the previous research highlights the importance of transportation infrastructure in increasing
the number of children who walk or cycle to and from school. Features such as street crossings,
sidewalk coverage, major streets and traffic calming features may influence rates of ATS, but when
looking across this research, we find a mix of findings. Due to this diversity of findings, there is a need to
conduct school travel studies within the geographical context where policies will be developed to

Children’s Independent Mobility in the GTHA Phase 2 3
influence mode choice and independent travel. Less research has been conducted into how social and
environmental factors impact independent walking; that is, children or youth walking without adult
supervision. This study provides additional evidence on how social and environmental characteristics
relate to walking and independent travel in Toronto.
Individual and social characteristics
Research has produced fairly consistent findings related to ATS, independent mobility and characteristics
of the individual or social environment. Many studies report a connection between a child’s gender and
rates of active travel, with boys more commonly walking or cycling.21,22,23,24,25 For independent travel,
boys also typically have higher rates and are more often permitted by adults to travel without adult
supervision.16,26 Results pertaining to the child’s age have been mixed in relation to rates of walking, but
research commonly finds a positive connection between child age and independent travel.27,28,29,30 As
children age, they are more likely to walk without adult supervision. This is one of the most consistent
findings reported in the CIM literature and most state that between the ages of 11 and 12 children start
to acquire more independent travel.27,28,29,30
Household resources such as income and vehicle ownership can also relate to children’s walking
outcomes. Some studies report a significant relationship between household automobile ownership and
rates of children walking to school, while others have not found a connection.24,31,32,33 Research in
Toronto suggests that a higher ratio of vehicles per licenced driver may be associated with a lower rate
of walking for children’s trips to school.24,33 No statistically meaningful relationship has been reported
between household automobile ownership and CIM.11,34 Household or neighbourhood income is
commonly examined in the mode choice literature, with a higher household income related to a lower
rate of ATS.25,32,35,36,56 Less is known about how income relates to CIM. Findings from a study in the GTHA
suggests that income does not relate to independent travel patterns,29 but further research is needed to
examine potential relationships between socio-economic class and CIM.
Objective environmental variables
Distance between home and school is one of the most common reasons why children do not walk to and
from school, as the distance increases the probability of walking decreases.24,25,31,36,37,38 Distance may
also relate to independent travel, as recent work has found that children who travel shorter distances
Children’s Independent Mobility in the GTHA Phase 2 4
are more likely to walk without adult supervision.29,39,40 Shorter distances directly translate into fewer
minutes of risk exposure (objective or perceived), which may be why distances relate to CIM. Aside from
distance, environmental characteristics associated with land uses and motor vehicle traffic can relate to
both walking and independent travel. Land use mix is commonly associated with adult travel patterns,
as it allows for shorter distances to and from varied destinations. To date, no conclusive findings have
been reported regarding mixed land uses and school travel. A few studies have found a positive
relationship,56,58 while others have found no association.33,37 For CIM, even less is known regarding land
use mix, but research has found that particular land uses such as retail or recreational purposes may
associate with more CIM.41,42
Many of the built environmental features examined in previous work relate to traffic control and
transportation infrastructure. Traffic safety is a major concern in determining both mode of travel and
whether a child can travel independently. 13,45,43,44 Sidewalks provide pedestrians their own space away
from moving vehicles and are obviously a key piece of pedestrian infrastructure. While many
neighbourhoods within the study area have sidewalks, there are places where these features are
missing. Once again results have been inconsistent regarding how sidewalks relate to or influence
children’s mode of travel. Some studies have reported a positive association,22,35,45 while others have
not found a significant relationship.25,46 At least one study has found a significant relationship between
sidewalk coverage and CIM,47 but more work is needed.
Street crossings are a common correlate of ATS and thought to relate to traffic safety. Street
crossings are typically measured as intersection density, which is a measure of both street connectivity
and crossings. If there are more intersections within an environment, children will have more route
options and possibly shorter distances, but this will also mean that they will have to cross more streets.
Recent research in Toronto reported that a higher density of street crossings relates to lower odds of
walking,33 suggesting that safety concerns around street crossings may present a barrier to walking.
However, findings related to street crossings are not conclusive, as research in other cities has found a
positive association between street crossings and rates of active travel.31,48 The type of street may also
influence decisions; crossing local streets may be deemed ‘ok’ by parents, while major arterials may be
perceived to be more dangerous. Inconclusive or mixed findings are reported for intersection density
and mode choice as some state higher rates of children walking,31,56,57 but others have found lower rates
of walking.49,50 Again, the relationship between street crossings and CIM is unclear, but most likely a

Children’s Independent Mobility in the GTHA Phase 2 5
highly localized phenomenon. Although it is believed that street crossings may deter independent travel
due to safety concerns, more research is needed to test this hypothesis.41
Few studies have examined how street trees may interact with children’s mode of school travel
or independent mobility, but some recent work has highlighted the importance of this feature. One
Canadian study found a relationship between street trees and walking on the trip to school;58 while a
study in Taiwan reported a significant relationship between street trees and independent school travel.47
Urban tree cover likely also correlates to the age of the neighbourhood or era of development. Older
more established neighbourhoods likely have a higher density of street trees and other features within
these areas may be producing the increases in walking. Regardless, tree planting efforts are an
affordable and modifiable feature of the environment, so it is important for researchers and policy
makers to try and understand the significance of street trees.
Traffic-calming devices are also rarely examined in the children’s travel literature. Traffic-
calming features are supposed to slow down traffic and reduce the number of accidents,51 but how they
interact with ATS and CIM is unknown. Recent studies in Toronto, found no relationship between traffic-
calming features and walking to school,33,52 but a study by Tranter and Pawson highlights the need for
more traffic-calming features in the neighbourhood to encourage walking and CIM.53 Traffic-calming
devices many slow down motor vehicle traffic and reduce safety concerns of parents, but more evidence
is necessary.
Although traffic safety is an important correlate of school travel and child escort decisions,43,44,45
few studies actually look at traffic volume and the mix of vehicle types around schools. Most research to
date examines how perceptions of traffic safety relate to both mode of travel and CIM. Many of these
studies have found a negative relationship between perceptions of traffic safety and independent travel.
34,39,42 Only one known study has examined the objective traffic environment, where more motor
vehicles around the school in the morning were negatively associated with walking on the trip to school,
but specific vehicle type was not significant.33 More work is needed to explore the relationship between
measured traffic volume and fleet characteristics, school travel decision processes and outcomes.
Parental and child perceptions
Perceptions of safety and convenience relate to both school travel mode choice and escort decisions.
What parents perceive as the most convenient or the quickest travel option is commonly associated with

Children’s Independent Mobility in the GTHA Phase 2 6
decisions related to how children travel and whether they are escorted to school.54,55 On the other hand,
safety concerns related to traffic,43,44,45,46 crime27,42 and strangers27,33 also influence child transport
decisions. This study aims to contribute greater insight into how certain environmental characteristics
relate to ATS and CIM, but also to compare how objective characteristics relate to perceptions of the
environment. The primary research question for this study is: what are the social and environmental
correlates of CIM across different types of neighbourhoods in the City of Toronto? This question will be
explored by thoroughly examining environmental characteristics along the route to school, along with
perceptions from both the child and parent in relation to both mode choice and independent travel.
Methods
Data sources and the BEAT Project
This phase of the study was set in the City of Toronto using data from the Built Environment and Active
Transportation Research Project (BEAT). The BEAT project is a large-scale multidisciplinary study
conducted at the University of Toronto to explore the relationship between the built environment,
school travel patterns and levels of children’s physical activity. As part of the project, grade 5 and 6
students and their parents independently completed travel behaviour surveys (n=1035) at 17
elementary schools within the City of Toronto. Individual level data on the household, mode of travel to
and from school, whether the child was escorted or travelled independently, along with perceptions of
the environment were obtained from child and parental travel behaviour surveys. In January 2010, all
elementary school principals within the Toronto District School Board (TDSB) received an invitation to
participate if their school had grade 5 and 6 (n=469). This process produced a pool of interested
principals. Researchers then targeted select schools to ensure a mix of income and built environments
within the 17 school neighbourhoods.
In order to target diversity within the environment, the City of Toronto was classified into two
broad neighbourhood types with unique environmental characteristics, the pre-amalgamated City of
Toronto and the inner suburbs. A significant difference between these neighbourhood types was the era
of development, which creates contrasting transportation options, built environments and other social
characteristics that may relate to transportation decisions. In the pre-amalgamated city, which consists
of neighbourhoods within the City of Toronto as of 1998, higher residential density, mixed land uses,
more connected street network (gridded), a higher density of intersections and shorter straight blocks

Children’s Independent Mobility in the GTHA Phase 2 7
typically exist. In the inner suburbs, which were mostly developed in the post-World War II era, the
streets are typically curvilinear (as the road system hierarchy pushes traffic to the arterials), there is
more open space, residential densities are much lower, and land uses are more highly segregated.
Within each of these two broad classification schemes, environmental differences also exist and by no
means are neighbourhoods within the pre-amalgamated city or within the inner suburbs identical;
however, this approach to neighbourhood classification helps provide a degree of variability within the
environment and helps to ensure representation of multiple neighbourhood types in the study. Nine of
the sampled schools were within the pre-amalgamated city, while eight were in the inner suburbs.
Figure 1 illustrates how street design varies for the schools in the contrasting neighbourhood types. In
general, schools in the pre-amalgamated city are situated within a more gridded connected street
network than those in the inner suburbs.
The sampling frame applied in the BEAT project also accounted for income; eight of the schools
were in neighbourhoods that were classified as high income, while nine of the schools were in lower
income areas. High-income neighbourhoods can be defined as schools in census tracts with household
income levels in the top quartile (greater than $69 072.50), whereas low-income neighbourhoods are
within the bottom quartile (less than $40 003.50). This sampling frame allows for the exploration into
how both environmental and socio-economic characteristics relate to transport decisions.
Both the University of Toronto research ethics board and the TDSB ethics review board granted
ethics approval for this study. Data collection commenced in the spring of 2010 and was completed in
the spring of 2011. Data collection only took place in the spring and fall to avoid seasonal variations that
may take place during the winter months. Teachers of grade 5 and 6 students recruited the children and
their parents. Eligible students obtained a consent form asking for the child’s home address. The home
addresses were used to create maps of the home neighbourhood highlighting the home and school.
After in-classroom instruction, children completed the travel behaviour survey and were sent home with
the parental survey and their blank map where parents and children were asked to draw their typical
routes to and from school. Figure 2, illustrates an example of a completed map. To preserve
respondent anonymity, this map displays a hypothetical example; the street names are incorrect and
neither the student nor the school participated in the study.

Children’s Independent Mobility in the GTHA Phase 2 8
Pre-amalgamated city 1:6 000
Figure 1: Sample of school neighbourhoods and street design

Children’s Independent Mobility in the GTHA Phase 2 9
Figure 2: Example of a hypothetical completed map illustrating the route to and from school
GIS analysis of built environment
Data from the BEAT project surveys were manually entered into a database, while all paper route maps
were digitized into Geographic Information Systems route files. Due to data loss and inaccurate maps,
there were 978 to school and 981 from school routes produced. The sample was further reduced to
exclude students who live beyond 2km from school as this distance makes walking very difficult.
Furthermore, students who took transit, rode a bicycle, or the school bus were also excluded due to low
response. The final sample only included students with accurate route data who lived within 2km of
school and walked or were driven to/from school (n=840 to school and n=838 from school). Mode of
travel does not necessary need to be consistent for the trips to and from school, several students were
driven to school but walked home and were still included in the sample. The digitized route maps allow
for exploration of objective environmental characteristics along each child’s reported route, rather than
relying on neighbourhood buffers46,56,57,58 or shortest path analysis.25,31,59 The route based analysis likely

Children’s Independent Mobility in the GTHA Phase 2 10
provides a more accurate approach for exploring the environment as it examines features children are
more likely to interact with over time. The route itself also provides accurate data on the distance
between home and school for both the trip to and from school.
The City of Toronto (http://www.toronto.ca/) provided GIS data on sidewalks, street trees,
traffic-calming devices and the street network, while parcel level data on land use was obtained from
the Municipal Property Assessment Corporation (MPAC). All previously collected datasets were verified
prior to use with field surveys and the use of aerial photography. To account for distance travelled,
many of the route based measures examine the density or number of features per kilometre or route.
Distance between home and school was measured as the route based distance in kilometres between
the child’s home and school. Due to changes in the routes travelled, resulting from differences in daily
activity patterns, slight differences can exist for the route to and from school. The number of
intersections crossed was measured by calculating the number of intersections each route crosses
divided by the route length. A similar metric was applied to examine the number of major street
crossings per kilometre of route length. Major streets are defined as minor or major arterials within the
City of Toronto.
Sidewalk availability is hypothesised as an important infrastructure state to facilitate safe
walking. The density of missing sidewalks was compiled by taking the total length of missing sidewalk
along the route divided by the route distance. Since it is unknown which side of the street children were
travelling along, sidewalks were only deemed missing if they were not present on either side of the
street. Traffic calming devices may also relate to transport decisions. Traffic-calming features in this
study included speed bumps, chicanes, raised intersections, gateways, raised crosswalks, and traffic
circles. The number of traffic calming features along the route was measured against the total length of
the route. Finally street trees may relate to children’s travel,58 and the number of street trees along the
route was again measured based on the distance travelled.
Land use mix is commonly measured in this kind of research using an entropy-based index.58 This
study applied a similar approach but rather than examining the area around the home or school, a route
based approach was applied. Land uses were examined along the property frontages for each child’s
route. This method is similar to previous work but applies a different spatial scale due to the nature of
the route based analysis.33 To facilitate route based land use mix analysis, all land parcels within the City
of Toronto were classified into five broad land use classes (parks, residential, commercial, industrial, and
institutional). Each land use parcel was converted into linear features at the front of each property. The

Children’s Independent Mobility in the GTHA Phase 2 11
total length of frontage for each land use class was calculated for every route, and entered into an
entropy mix. Land use mix was calculated using the following formula:
[Land Use Mix = −∑ l (ρ ln ρ)/ ln n]
where l is the land use, p is the proportion of parcel frontage within a land use category, and n is the
total number of land use classes. Values can only range from zero to one, with zero representing a route
with only a single land use and one indicating near equal presence of all five land uses.
Survey data on income was incomplete as many participants preferred not to disclose that
information. Since no household level income variable was available, an aggregated neighbourhood
income variable was created from Canada census data. Income for each respondent was assigned based
on the location of their home and the corresponding median household income in their dissemination
area (DA). For example, if the home was located in a DA with a median household income of $61 000,
this was the value assigned the household. It is important to understand that this variable does not
capture the income of the respondent or household per se, but rather the average income of residents
immediately surrounding the child’s home, giving some insight into the income condition within the area
immediately surrounding each household. In Toronto, dissemination areas are the smallest spatial unit
where income level data is available and are typically only a few blocks in size.
Traffic data around the school
Manual motor vehicle traffic counts were obtained at all access and egress points around each sampled
school. This approach ensures traffic data are available for at least one intersection on every child’s
route, unless their route physically does not cross any streets. Traffic counts were conducted in the
morning and afternoon. Following methods used by Boarnet et al.45, data collection started one half
hour before school started in the morning and continued for another 15 minutes after school begins.
For the trip home, the same approach was applied, with data collection commencing 15 minutes before
the end of the school day and continuing for 30 minutes after school finished. School start and end
times were confirmed by school principals. In agreement with common practice on traffic volume and
flow, data collection only took place on Tuesdays, Wednesdays and Thursdays, as traffic patterns vary on
Mondays and Fridays.60 To avoid seasonal variations, traffic data collection only took place in the spring
and fall and not on days with bad weather (i.e., rain or thunder storms). Counters were also given a tool
to record data on motor vehicle type. Training was given in advance to help counters distinguish among
different motor vehicles.

Children’s Independent Mobility in the GTHA Phase 2 12
This study examines the traffic environment in two different ways. First, the traffic environment
is examined as a measure of traffic volume around the school, which measures the maximum traffic
volume at one of the data collection points along the child’s route. Maximum volume refers to the
intersection with the highest volume of traffic or the worst-case scenario along a child’s route to or from
school. The maximum traffic volume was examined rather than the average, as some children’s routes
cross only one intersection with traffic data, while others cross multiple. Examining the maximum
volume assumes that the higher traffic volume would relate more to travel mode and independent
mobility; parents may have in mind the worst possible perceived traffic conditions when considering
school travel. This hypothesis corresponds with traffic safety research, which highlights how greater
traffic volumes relate to an increased perceived safety risk.61,62,63
The second measure of the traffic environment that was examined is vehicle fleet mix. Little
work to date has examined this variable so it is unknown exactly how this particular feature relates to
mode choice or independent travel. It is believed that an increased presence of larger motor vehicles
(such as trucks and buses) could affect perceptions of traffic safety, which could relate to varying rates of
walking and independent travel. To examine vehicle fleet mix, this study adopted the passenger car
equivalents measure used in transportation demand planning, which models how vehicle size relates to
roadway capacity. Passenger car equivalents essentially assign a multiplier to larger vehicles so that one
truck is equal to four cars or one bus is equal to three cars.64 Although this is a verified method for
traffic demand modelling, no known index exists in relation to traffic safety, school travel mode choice
or CIM. Since there is a direct relationship between the weight of the vehicle and risk of fatality,65 a
weight based multiplier was adopted. Table 1 displays the multipliers applied to each vehicle type.66,67*
For school bus, trucks and buses the multiplier was based on the average weight for a vehicle that is
filled to half its capacity, as vehicle mass varies with occupancy.
Table 1: Pedestrian safety multiplier for car equivalency Vehicle type Multiplier
Car 1.0
SUV / Mini van 1.3
Transit vehicle 11.2
School bus 6.1
Truck 13.2

Children’s Independent Mobility in the GTHA Phase 2 13
Once vehicle weights were applied, data were aggregated into four categories: passenger
vehicles, transit vehicle, school bus and truck. The weighted volume for each of these categories was
then entered into a reverse entropy index using the following formula:
[Fleet mix= (∑ v(p ln p)/ ln n) + 1]
where v is vehicle type, p is the proportion of vehicle types at the intersections dedicated to each of the
vehicle types and n is the total number of vehicle categories (four). This measure is similar to the
entropy index used to determine land use mix; however, in this case a value of one represents an
intersection with only passenger vehicles, while a value of zero would relate to an intersection with
trucks, school buses and transit vehicles. Figures 3 and 4 illustrate the location where traffic counts took
place and how vehicle fleet mix and traffic volume may vary by intersection. Once again, the figures
portray a hypothetical example. Larger circles at intersections represent higher traffic volumes or more
passenger vehicles
Figure 3: Example of traffic count locations and vehicle counts, 8:00-8:45 a.m.

Children’s Independent Mobility in the GTHA Phase 2 14
Figure 4: Example of traffic count locations and vehicle fleet mix, higher values represent more passenger vehicles, 8:00-8:45 a.m.
Age and gender interaction with the environment
Findings from the first phase of this study suggested that the relationship between age and CIM
differentiates by neighbourhood type across the GTHA. Children living in an area that was constructed
prior to 1960 were able to gain independence when travelling at a younger age. This study aims to
further examine this relationship in Toronto only. To do this a binary control variable for urban structure
was created for areas that were constructed prior to 1960 and those that were built after 1960. This
was calculated by examining era of development in all of the dissemination areas along each identified
school route. The pre-1960 areas had a majority (or over 50%) of dwellings along the route built prior to
1960, while the post-1960 had a majority of dwellings along the route constructed after 1960. The year
1960 was selected to correspond with previous work completed in phase one of the study, but also
because research has highlighted that it was during this timeframe that street and neighbourhood
design started to significantly change.68 Some areas constructed after 1960 were more likely to
experience ‘superblock’ development and a less connected curvilinear street network became the norm
in some places, particularly within Toronto’s newer inner suburban neighbourhoods.68
This binary pre/post 1960 variable controls for the environment, but also allows for the
examination of interactions with child gender or age. The gender and age interaction variables look at

Children’s Independent Mobility in the GTHA Phase 2 15
the relationship between the binary urban structure (pre/post 1960) variable in relation to gender (for
mode of travel) and age (for CIM). The reason for exploring the interaction terms relates to the findings
from phase one of the study in which age influenced independent travel differently for those living in pre
and post 1960 neighbourhoods. Here we hypothesise that the mobility experiences of children who self-
identify as boys or girls may indeed be affected by where they live. Gendered risk perception, in relation
to school travel and CIM could be very different when studied across older and newer neighbourhoods.
It could also be the case that boys attain independent mobility earlier than girls, hence our interested in
studying interactions between age, gender, place – school travel and CIM.
Empirical analysis and modelling
A binomial logistic regression modeling approach was applied in two stages to answer the primary
research question: what are the social and environmental correlates of CIM across different types of
neighbourhoods in the City of Toronto? Separate models and testing were performed for the
examination of the to school and from school routes. The purpose of these models is to test the
association between individual and social characteristics, the objective environment and perceptions in
relation to CIM for the trip to and from school.
First the data were modelled to determine how individual and social characteristics, objective
environmental and perceptions related to mode of travel. Two separate models were constructed for
the trip to and from school because it is anticipated that correlates of school travel will vary with trip
direction. Following these results a second set of logistic regression models were specified and
estimated to explore how individual and social, objective environmental and perceptions related to
independent travel within the City of Toronto. Table 2 displays a list of all of the variables examined.
Prior to entering variables into the model, univariate logistic regression (single factor analysis)
was performed to understand what characteristics were independently related to either walking or
independent mobility. These tests were performed separately for both the trip to and from school. A
variable was entered into the adjusted analysis if it was significant at the p < 0.05 level. Table 3 reports
the results from the univarate testing and whether the variable was positively or negatively associated
to walking or independent travel. All significant variables are highlighted in bold and entered into the
final models.
Children’s Independent Mobility in the GTHA Phase 2 16
Table 2: Social, individual and environmental variables examined Social and individual Route based environmental Child and parent perceptions
Child's age Intersections crossed on route Worried about strangers (child and parent)
Vehicle per licensed driver Major street crossings on route Safe area to walk alone (child)
Gender Missing sidewalks on route Worried about older kids (child)
Distance to/from school* Maximum traffic on route Traffic around the school (parent)
Home dissemination area Income Traffic calming devices on route Busy street crossings (parent)
Employment Status (parent home with children) Land use mix (entropy index)
Education attainment (father and mother) Street tree density
Flexible work schedule (parents) Vehicle fleet index
Gender interaction†
Age interaction†
Distance to/from school*
Pre/post 1960
*Distance to/from school relates to the street design in the environment, but also to where parents live and what school their child attends
†Age and gender interaction relates to both social and built environment
After preliminary analysis, all significant variables were tested to ensure no mulitcollinearity
issues were present through Pearson correlations and variance inflation factor (VIF) tests, where no
issues were identified. The logistic regression models were built in two steps (walking versus driven and
independent walking versus escorted walking) for both the trip to school and from school. Each of these
models were constructed in three blocks. First a binomial logistic regression model examined how
individual and social characteristics related to mode of travel with walking (versus driven) as the
dependent variable. The second step added variables related to the objective environment along the
route and age/gender interactions, while the final block added the perceptions of the child and parent.
The three-block approach allows for more detailed exploration of how each of the correlates may relate
to mode choice.
The second set of models was designed to explore how social and environmental correlates
related to independent school travel (walking without an adult versus escorted walking). Once again
these models were constructed separately for the trip to and from school using the three block method,
individual and social only, adding the route based objective environment, age and gender interactions
and then by adding the child and parent perceptions.

Children’s Independent Mobility in the GTHA Phase 2 17
Table 3: Significance of correlations in preliminary analysis
Variable
To School From School Mode of travel Independent Mode of travel Independent
p value Direction p value Direction p value Direction p value Direction
Age 0.107 - <0.001 + 0.678 - <0.001 + Gender (girls as referent) 0.003 + <0.001 + 0.002 + <0.001 + Distance (km) <0.001 - <0.001 - <0.001 - <0.001 - Intersections crossed on route <0.001 - <0.001 - <0.001 - <0.001 - Major crossings 0.002 - <0.001 - 0.421 - <0.001 - Missing sidewalks <0.001 - 0.010 - 0.093 - 0.120 - Maximum traffic <0.001 - <0.001 - 0.005 - <0.001 - Land use mix <0.001 - <0.001 - <0.001 - <0.001 - Traffic calming density 0.114 + 0.868 - 0.684 + 0.022 + Vehicle fleet index 0.441 + 0.071 - 0.279 - 0.205 - Home DA income 0.002 - 0.118 - <0.001 - 0.053 - Street tree density 0.206 + 0.269 - 0.578 - <0.001 - Vehicles per licensed driver <0.001 - 0.537 + 0.028 - 0.069 - Urban structure (pre-1960) 0.246 + 0.001 - <0.001 + <0.001 - Gender interaction (Boys: pre-1960) 0.006 + 0.879 + <0.001 + 0.158 - Age interaction 0.286 - 0.006 + 0.101 + <0.001 - Safe area to walk alone
No ----- ----- ----- ----- Do not know 0.193 + 0.239 + 0.094 + 0.535 + Yes <0.001 + <0.001 + <0.001 + <0.001 + Worried about strangers No ----- ----- ----- ----- Do not know 0.410 - 0.016 - 0.213 - 0.006 - Yes 0.298 - 0.271 - 0.170 - 0.309 - Worried about older kids No ----- ----- ----- ----- Do not know 0.827 + 0.584 + 0.562 - 0.081 - Yes 0.049 + 0.084 + 0.313 + 0.465 + Education, father Elementary ----- ----- ----- ----- Secondary 0.485 - 0.847 - 0.239 - 0.315 - College 0.177 - 0.697 - 0.166 - 0.512 - University 0.378 - 0.446 - 0.394 - 0.139 - Graduate 0.254 - 0.479 - 0.179 - 0.100 - Education, mother Elementary ----- ----- ----- ----- Secondary 0.041 - 0.544 - 0.998 - 0.962 + College 0.048 - 0.536 - 0.998 - 0.906 + University 0.073 - 0.251 - 0.998 - 0.549 - Graduate 0.080 - 0.703 - 0.998 - 0.299 - Employment status Other ----- ----- ----- ----- Home with children 0.020 + 0.496 + 0.654 - 0.034 - Fear of strangers Strongly agree <0.001 - 0.013 - <0.001 - 0.027 - Somewhat agree <0.001 - 0.064 - 0.010 - 0.141 - Neither agree nor disagree 0.001 - 0.416 - 0.074 - 0.336 - Somewhat disagree 0.029 - 0.858 - 0.871 - 0.887 + Strongly disagree ----- ----- ----- -----

Children’s Independent Mobility in the GTHA Phase 2 18
Traffic around school Strongly agree <0.001 - <0.001 - <0.001 - <0.001 - Somewhat agree 0.001 - <0.001 - 0.006 - <0.001 - Neither agree nor disagree 0.066 - 0.034 - 0.113 - 0.010 - Somewhat disagree 0.512 - 0.226 - 0.912 - 0.036 - Strongly disagree ----- ----- ----- ----- Busy street crossings Strongly agree <0.001 - 0.165 + <0.001 - <0.001 - Somewhat agree <0.001 - 0.001 + <0.001 - <0.001 - Neither agree nor disagree 0.001 - <0.001 + 0.002 - 0.041 - Somewhat disagree 0.043 - <0.001 + 0.002 - 0.002 - Strongly disagree ----- ----- ----- ----- Flexible work hours Strongly agree 0.042 + 0.005 - 0.992 + <0.001 - Somewhat agree 0.871 + 0.015 - 0.864 - 0.024 - Neither agree nor disagree 0.616 + 0.809 - 0.476 - 0.261 - Somewhat disagree 0.629 - 0.326 - 0.171 - 0.064 - Strongly disagree ----- ----- ----- -----
Results
For the trip to school, 651 students were walking, while 189 were driven (Table 4). Rates of walking
were even higher when travelling home from school (n=708), as fewer children were driven (n=130)
(Table 5). Within the sample of walkers, 428 children walked independently to school (without adult
supervision), and 223 were escorted by an adult. On the trip home from school even more children
were walking unescorted by an adult (n=477), but due to the higher rates of overall walking, a few more
children were also walking escorted (n=231). The median age within the sample was 11 years, with
children ranging from age 9 to 13 years. There was a very good mix of boys (n=392, 397) and girls
(n=448, 441) for both the trips to and from school. It was a highly educated sample, with over 70% of
fathers and mothers obtaining a college diploma or higher. The median household income for the home
dissemination areas within the sample was $71 433 and households had an average (median) of one car
per licenced driver. Nearly 15% of parents reported being home with their children. Finally, nearly one
third of the sampled parents strongly agreed that they have a flexible work schedule.
Children’s Independent Mobility in the GTHA Phase 2 19
Table 4: Descriptive statistics to school
n Percentage Minimum Maximum Mean Median Std.
Deviation
Age 840 -- 9.000 13.000 10.550 11.000 0.714 Distance (km) 840 -- 0.037 1.918 0.687 0.603 0.410 Intersections crossed on route 840 -- 0.000 21.550 5.741 5.834 3.211
Major crossings on route 840 -- 0.000 10.460 1.497 0.000 2.413 Missing sidewalks 840 -- 0.000 0.811 0.026 0.000 0.106 Maximum traffic 840 -- 0.000 3 482.000 455.090 260.000 509.806 Land use mix 840 -- 0.000 0.960 0.213 0.157 0.229 Traffic calming density 840 -- 0.000 9.390 0.577 0.000 1.382 Vehicle fleet index 840 -- 0.000 1.000 0.445 0.418 0.194 Home DA income 840 -- 15 335.000 246 341.000 72 436.060 71 432.500 40 656.437 Street tree density 840 -- 0.000 320.281 75.041 71.063 65.083 Vehicles per licensed driver 840 -- 0.000 3.000 0.853 1.000 0.278 Gender Girls 448 53.3 -- -- -- -- --
Boys 392 46.7 -- -- -- -- --
Mode of travel Driven 189 22.5 -- -- -- -- -- Walk 651 77.5 -- -- -- -- -- Independent travel Escorted 223 34.3 -- -- -- -- -- Walk independent 428 65.7 -- -- -- -- -- Urban structure Pre-1960 473 56.3 -- -- -- -- -- Post-1960 367 43.7 -- -- -- -- -- Safe area to walk alone No 71 8.5 -- -- -- -- --
Do not know 185 22.0 -- -- -- -- --
Yes 584 69.5 -- -- -- -- --
Worried about strangers No 386 46.0 -- -- -- -- --
Do not know 172 20.5 -- -- -- -- --
Yes 282 33.6 -- -- -- -- --
Worried about older kids No 569 67.7 -- -- -- -- --
Do not know 139 16.5 -- -- -- -- --
Yes 132 15.7 -- -- -- -- --
Education, father Elementary 27 3.2 -- -- -- -- --
Secondary 155 18.5 -- -- -- -- --
College 165 19.6 -- -- -- -- --
University 307 36.5 -- -- -- -- --
Graduate 127 15.1 -- -- -- -- --
Education, mother Elementary 24 2.9 -- -- -- -- --
Secondary 174 20.7 -- -- -- -- --
College 211 25.1 -- -- -- -- --
University 263 31.3 -- -- -- -- --
Graduate 122 14.5 -- -- -- -- --
Employment status Other 1 307 85.5 -- -- -- -- --
Home with children 222 14.5 -- -- -- -- --
Children’s Independent Mobility in the GTHA Phase 2 20
Fear of strangers
Strongly agree 238 28.3 -- -- -- -- --
Somewhat agree 260 31.0 -- -- -- -- --
Neither agree nor disagree 95 11.3 -- -- -- -- --
Somewhat disagree 105 12.5 -- -- -- -- --
Strongly disagree 113 13.5 -- -- -- -- --
Traffic around school Strongly agree 201 23.9 -- -- -- -- --
Somewhat agree 245 29.2 -- -- -- -- --
Neither agree nor disagree 97 11.5 -- -- -- -- --
Somewhat disagree 124 14.8 -- -- -- -- --
Strongly disagree 144 17.1 -- -- -- -- --
Busy street crossings Strongly agree 57 6.8 -- -- -- -- --
Somewhat agree 84 10.0 -- -- -- -- --
Neither agree nor disagree 83 9.9 -- -- -- -- --
Somewhat disagree 179 21.3 -- -- -- -- --
Strongly disagree 408 48.6 -- -- -- -- --
Flexible work hours Strongly agree 260 32.1 -- -- -- -- --
Somewhat agree 149 18.4 -- -- -- -- --
Neither agree nor disagree 151 18.0 -- -- -- -- --
Somewhat disagree 95 11.3 -- -- -- -- --
Strongly disagree 156 18.6 -- -- -- -- --
Within the reduced sample, the median distance to school was 603m and the trip home was
nearly identical at 604m. There was a good mix of built environments, with 56% of school travel routes
being located in neighbourhoods largely developed prior to 1960 and 44% after 1960. On average,
children had to cross between 5 and 6 intersections along their routes for both school trips, but very few
were considered major streets (mean 1.4, median 0). Most of the routes had complete sidewalks,
although as displayed in the mean and maximum values on Tables 4 and 5, some areas were missing this
feature. Many routes also did not have traffic calming features, as the mean value suggests that there
was just over 0.5 traffic calming features per 1 route km. There were over 70 street trees per km of
route for the trip to school, with even more trees on the routes home from school. In general, routes
were dominated by residential land uses, as the average land use mix value was between 0.15 and 0.2.
In relation to traffic, there were more motor vehicles around schools in the morning (median 260) than
the afternoon (median 223). The vehicle fleet index was higher for routes to school, which means there
were more passenger vehicles around school in the morning. Results from both the child and parent’s
perceptions were similar for both the trip to and from school.

Children’s Independent Mobility in the GTHA Phase 2 21
Table 5: Descriptive statistics from school
n Percentage Minimum Maximum Mean Median Std. Deviation
Age 838 -- 9.000 13.000 10.550 11.000 0.715
Distance (km) 838 -- 0.048 1.989 0.691 0.604 0.415 Intersections crossed on route 838 -- 0.000 21.600 5.614 5.740 3.212
Major crossings on route 838 -- 0.000 9.550 1.418 0.000 2.311
Missing sidewalks 838 -- 0.000 0.810 0.026 0.000 0.102
Maximum traffic 838 -- 0.000 3089.000 398.605 223.000 472.112
Land use mix 838 -- 0.000 0.960 0.207 0.145 0.228
Traffic calming density 838 -- 0.000 12.890 0.620 0.000 1.528
Vehicle fleet index 838 -- 0.000 1.000 0.347 0.335 0.258
Home DA income 838 -- 15 335.000 246 341.000 72 129.732 71 432.500 40 473.999
Street tree density 838 -- 0.000 329.902 83.037 78.072 61.872
Vehicles per licensed driver 838 -- 0.000 3.000 0.851 1.000 0.278
Gender
Girls 441 52.6 -- -- -- -- --
Boys 397 47.4 -- -- -- -- --
Mode of travel
Driven 130 15.5 -- -- -- -- --
Walk 708 84.5 -- -- -- -- --
Independent travel
Escorted 231 32.6 -- -- -- -- --
Walk independent 477 67.4 -- -- -- -- -- Urban structure Pre-1960 457 54.5 -- -- -- -- -- Post-1960 381 45.5 -- -- -- -- --
Safe area to walk alone
No 68 8.1 -- -- -- -- --
Do not know 185 22.1 -- -- -- -- --
Yes 584 69.8 -- -- -- -- --
Worried about strangers
No 388 46.3 -- -- -- -- --
Do not know 172 20.5 -- -- -- -- --
Yes 278 33.2 -- -- -- -- --
Worried about older kids
No 566 67.5 -- -- -- -- --
Do not know 141 16.8 -- -- -- -- --
Yes 131 15.6 -- -- -- -- --
Education, father
Elementary 27 3.2 -- -- -- -- --
Secondary 158 18.9 -- -- -- -- --
College 166 19.8 -- -- -- -- --
University 303 36.2 -- -- -- -- --
Graduate 125 14.9 -- -- -- -- --
Education, mother
Elementary 24 2.9 -- -- -- -- --
Secondary 173 20.6 -- -- -- -- --
College 215 25.7 -- -- -- -- --
University 260 31.0 -- -- -- -- --
Graduate 120 14.3 -- -- -- -- -- Employment status Other 1 308 85.5 -- -- -- -- --
Home with children 220 14.5 -- -- -- -- --

Children’s Independent Mobility in the GTHA Phase 2 22
Fear of strangers
Strongly agree 241 28.8 -- -- -- -- --
Somewhat agree 259 31.9 -- -- -- -- --
Neither agree nor disagree 94 11.2 -- -- -- -- --
Somewhat disagree 103 12.3 -- -- -- -- --
Strongly disagree 112 13.4 -- -- -- -- --
Traffic around school
Strongly agree 163 19.5 -- -- -- -- --
Somewhat agree 213 25.4 -- -- -- -- --
Neither agree nor disagree 141 16.8 -- -- -- -- --
Somewhat disagree 138 16.5 -- -- -- -- --
Strongly disagree 156 18.6 -- -- -- -- --
Busy street crossings
Strongly agree 59 7.0 -- -- -- -- --
Somewhat agree 82 9.8 -- -- -- -- --
Neither agree nor disagree 80 9.5 -- -- -- -- --
Somewhat disagree 180 21.5 -- -- -- -- --
Strongly disagree 408 48.7 -- -- -- -- --
Flexible work hours
Strongly agree 258 30.8 -- -- -- -- --
Somewhat agree 146 17.4 -- -- -- -- --
Neither agree nor disagree 150 17.9 -- -- -- -- --
Somewhat disagree 95 11.3 -- -- -- -- -- Strongly disagree 160 19.1 -- -- -- -- --
Age and gender interactions with urban structure
Prior to the inclusion of the age/gender interaction into the models, preliminary tests were completed to
examine any possible relationships. Figure 5, illustrates how rates of walking vary in the pre and post-
1960 neighbourhoods by age and gender, while figure 6 displays rates of independent mobility by child
age and gender. Preliminary testing revealed interactions between age, gender and the urban structure
along the school route. Boys have higher rates of walking in both types of neighbourhoods, and more
children were walking in the pre-1960 areas regardless of gender. Differences were observed regarding
independent travel, with more children travelling independently to school at older ages. More boys
appear to accumulate experience with CIM earlier than girls (Figure 6). Rates were also higher for
children living in areas constructed after 1960. Findings from these preliminary tests highlight the need
for further exploration in the regression models.

Children’s Independent Mobility in the GTHA Phase 2 23
Figure 5: Rates of walking to school in pre and post 1960 neighbourhoods by gender and age
Figure 6: Rates of independent travel to school in pre and post 1960 neighbourhoods by gender and age
Regression models - To school trip
Walk versus driven
Walking versus driving was the dependent variable used in the first set of models. As Table 6 displays,
several individual, social, route characteristics and perceptions related to walking to school. In block 1,
Children’s Independent Mobility in the GTHA Phase 2 24
gender was a significant variable as boys were 1.6 times more likely to walk to school. Having a higher
ratio of vehicles and licenced drivers decreased the odds of walking. For employment status, having a
parent at home with a child increased the odds of walking to school. The R2 value for the first block was
only 0.06, which means the model only accounts for 6% of the variance.
Model fit improved with the addition of the route based environmental characteristics and
gender interactions suggesting that the environment along the child’s route may play an important role
in mode of travel to school. In block 2, vehicles per licenced driver and having a parent at home with a
child remained significant, while distance, intersections crossed and missing sidewalks also were
important. As distance increased or students live farther from school, the odds of walking decreased
(sample was restricted to only those living within 2km). If the route had to cross more intersection
(regardless of type) the odds of walking were also lower. Finally, if the route was missing sidewalks (on
both sides of the street), children were less likely to walk to school. Child’s gender was no longer a
significant variable once the gender interaction variable was entered into the model. This suggests that
gender is a significant social characteristic, but no significant relationship exists regarding the interaction
of gender and living in a pre or post-1960 neighbourhood in Toronto.
Table 6: Logistic regression estimation results with walk as dependent variable for to school trip Block 1: Individual and social characteristics
Coefficient S.E. Wald p value Odds Ratio
Gendera 0.490 0.176 7.721 0.005 1.633
Incomeb -0.004 0.002 3.853 0.051 0.996
Vehicles per licensed driver -1.027 0.331 9.631 0.002 0.358 Home with children
c 0.426 0.212 4.020 0.045 1.531
Constant 2.081 0.338 37.908 <0.001 8.014
R2: 0.06
Block 2: Individual, social and environmental characteristics
Coefficient S.E. Wald p value Odds Ratio
Gendera 0.130 0.314 0.172 0.679 1.139
Incomeb <0.001 0.003 0.001 0.977 0.999
Vehicles per licensed driver -1.202 0.405 8.819 0.003 0.301 Home with children
c 0.479 0.257 3.471 0.062 1.614
Distance (km) -2.990 0.299 100.224 <0.001 0.050 Intersections crossed on route -0.157 0.040 15.461 <0.001 0.855 Missing sidewalks
d -1.859 0.884 4.426 0.035 0.156
Maximum traffic volumee
-0.028 0.019 2.097 0.148 0.973 Land use mix -0.085 0.538 0.025 0.874 0.918 Urban structure (pre-1960)
h 0.188 0.282 0.446 0.504 1.207
Gender interaction*
0.584 0.433 1.815 0.178 1.793 Constant 5.538 0.598 85.882 <0.001 254.247
R2: 0.42

Children’s Independent Mobility in the GTHA Phase 2 25
Block 3: Individual, social, environmental characteristics and perceptions
Coefficient S.E. Wald p value Odds Ratio
Gendera 0.067 0.331 0.041 0.839 1.070
Incomeb -0.001 0.003 0.099 0.753 0.999
Vehicles per licensed driver -1.123 0.422 7.079 0.008 0.325 Home with children
c 0.548 0.273 4.021 0.045 1.730
Distance (km) -2.966 0.330 80.801 <0.001 0.052 Intersections crossed on route -0.167 0.041 16.624 <0.001 0.846 Missing sidewalks
d -2.097 0.936 5.021 0.025 0.123
Maximum traffic volumee
-0.031 0.020 2.319 0.128 0.970 Land use mix 0.054 0.563 0.009 0.924 1.055 Urban structure (pre-1960)
h -0.028 0.301 0.009 0.926 0.972
Gender interaction* 0.570 0.448 1.618 0.203 1.769
Safe area to walk alone (child)f
No ----- ----- ----- ----- ----- Do not know 0.316 0.421 0.566 0.452 1.372 Yes 0.736 0.403 3.334 0.068 2.088 Fear of strangers
g
Strongly agree -1.224 0.465 6.938 0.008 0.294 Somewhat agree -1.058 0.453 5.446 0.020 0.347 Neither agree nor disagree -0.845 0.518 2.661 0.103 0.430 Somewhat disagree -0.924 0.513 3.248 0.071 0.397 Strongly disagree ----- ----- ----- ----- ----- Heavy traffic around the school
g
Strongly agree -0.455 0.406 1.260 0.262 0.634 Somewhat agree -0.328 0.386 0.724 0.395 0.720 Neither agree nor disagree -0.231 0.471 0.240 0.624 0.794 Somewhat disagree -0.066 0.444 0.022 0.882 0.936 Strongly disagree ----- ----- ----- ----- ----- Busy streets to cross
g
Strongly agree -0.354 0.444 0.635 0.425 0.702 Somewhat agree 0.898 0.385 5.427 0.020 2.454 Neither agree nor disagree 0.369 0.377 0.958 0.328 1.447 Somewhat disagree 0.451 0.300 2.262 0.133 1.570 Strongly disagree ----- ----- ----- ----- ----- Constant 6.153 0.860 51.223 <0.001 470.296
R2: 0.47
Note: Significant variables with a p-value of <.05 are in bold. SE = standard error. aFemale as referent. bHome DA level income in $1000 increments. cBased on parent survey, one parent answered home with children, all other employment categories as referent. dProportion of route with sidewalk missing on both sides of street. eMaximum traffic in 100-vehicle increments. fNo as referent, on the basis of the child survey. gStrongly disagree as referent, on the basis of the parent survey. hPost-1960 as referent *Female in post-1960 as referent
In block 3, once the perceptions were added to the model, having a parent at home with
children and the vehicles per licenced driver ratio remain significant, as did distance, intersections and
sidewalks. The perceptions did add to the model, increasing the R2 value of the model to 0.47. This
means that adding the perceptions only increased the strength of the model by 3%. Children were less
likely to walk to school if parents were somewhat or strongly concerned about strangers, while parents
somewhat agreeing to busy street crossings seemed to increase the odds of walking to school.
Children’s Independent Mobility in the GTHA Phase 2 26
Independent versus escorted
Child age and gender and parents’ having a flexible work schedule were all significant in the first block
(Table 7). The odds of walking independently to school increased with childhood age. Boys were also
2.2 times more likely to be independent walkers for the trip to school than girls. Parents who have a
more flexible work schedule were more likely to escort (walk with) their children, as the odds of walking
independently to school were lower when parents agreed or somewhat agreed that their work schedule
was flexible. Overall, individual and social characteristics accounted for 18% of the variance in the
model (R2: 0.18). This value is much higher than the previous to school model, suggesting that social and
individual characteristics may relate more to independent walking than mode choice.
In the second block of the model when the route based environmental variables were added,
the same individual and social variables were again significant. The only environmental variables that
were relevant in this block were distance to school and maximum motor vehicle traffic around the
school. As distance increased so did the odds of walking independently, suggesting that distance relates
to both mode choice and independent mobility when travelling to school. A new finding in this model
relates to traffic around the school. If a school route encounters an intersection with a higher volume of
motor vehicles, children are less likely to walk independently. This suggests that traffic safety may
influence decisions related to CIM. Once the age-environment interaction variable was added, the
child’s age was still significant, but the urban structure variable was no longer significant. Adding the
route-based environmental variables to the model increased the R2 to 0.25, meaning that the model
explains 25% of the variance.
Finally, when perceptions were added to the model in block 3, there were no changes in the
significance of the individual, social or environmental variables (and values also stayed very similar). A
child’s perception of living in a safe area to walk alone significantly increased the odds of walking
independently to school. Walking independently was also related to parental responses over heavy
traffic around the school related to CIM. Parents who somewhat agreed or neither agreed nor
disagreed to statements regarding heavy traffic around the school in the morning produced lower odds
of walking independently for the to school trip, suggesting that traffic concerns or perceptions of traffic
were evident within this sample. Overall the final model produced a R2 value of 0.30 which explains 30%
of the variance.

Children’s Independent Mobility in the GTHA Phase 2 27
Table 7: Logistic regression estimation results with walking independently as the dependent variable for to school trip Block 1: Individual and social characteristics
Coefficient S.E. Wald p value Odds Ratio
Age 0.741 0.141 27.763 <0.001 2.098 Gender
a 0.798 0.187 18.242 <0.001 2.222
Flexible work scheduleg
Strongly agree -1.184 0.284 17.377 <0.001 0.306 Somewhat agree -0.947 0.317 8.954 0.003 0.388 Neither agree nor disagree -0.224 0.338 0.440 0.507 0.799 Somewhat disagree -0.266 0.380 0.489 0.484 0.767 Strongly disagree ----- ----- ------ ----- ----- Constant -6.787 1.492 20.694 <0.001 0.001
R2: 0.18
Block 2: Individual, social and environmental characteristics
Coefficient S.E. Wald p value Odds Ratio
Age 0.658 0.236 7.804 0.005 1.931 Gender
a 0.784 0.195 16.214 <0.001 2.190
Flexible work scheduleg
Strongly agree -1.183 0.295 16.034 <0.001 0.306 Somewhat agree -0.999 0.328 9.283 0.002 0.368 Neither agree nor disagree -0.172 0.352 0.240 0.624 0.842 Somewhat disagree -0.167 0.395 0.178 0.673 0.846 Strongly disagree ----- ----- ----- ----- ----- Distance (km) -0.959 0.327 8.581 0.003 0.383 Intersections crossed on route -0.008 0.032 0.055 0.815 0.992 Missing sidewalks
d 0.075 1.089 0.005 0.945 1.078
Maximum traffic volumee
-0.046 0.023 4.001 0.045 0.955 Land use mix -0.420 0.471 0.795 0.373 0.657 Urban structure (pre-1960)
h -2.798 3.130 0.799 0.371 0.061
Age interaction* 0.218 0.300 0.526 0.468 1.243
Constant -4.709 2.445 3.709 0.054 0.009
R2: 0.25
Block 3: Individual, social, environmental characteristics and perceptions
Coefficient S.E. Wald p value Odds Ratio
Age 0.664 0.246 7.267 0.007 1.943 Gender
a 0.735 0.204 13.032 <0.001 2.086
Flexible work scheduleg
Strongly agree -1.228 0.306 16.125 <0.001 0.293 Somewhat agree -1.122 0.344 10.651 0.001 0.326 Neither agree nor disagree -0.145 0.366 0.157 0.692 0.865 Somewhat disagree -0.220 0.409 0.288 0.592 0.803 Strongly disagree ----- ----- ----- ----- ----- Distance (km) -0.807 0.361 5.013 0.025 0.446 Intersections crossed on route 0.002 0.034 0.004 0.952 1.002 Missing sidewalks
d -0.626 1.126 0.309 0.578 0.534
Maximum traffic volumee
-0.044 0.024 3.251 0.041 0.957 Land use mix -0.369 0.490 0.567 0.451 0.691 Urban structure (pre-1960)
h -1.921 3.263 0.347 0.556 0.147
Age interaction* 0.122 0.312 0.153 0.696 1.130
Safe area to walk alone (child)f
No ----- ----- ----- ----- ----- Do not know 0.229 0.436 0.276 0.599 1.257 Yes 1.242 0.407 9.312 0.002 3.462

Children’s Independent Mobility in the GTHA Phase 2 28
Worried about strangers (child) f
No ----- ----- ----- ----- ----- Do not know -0.490 0.268 3.340 0.068 0.612 Yes 0.199 0.254 0.614 0.433 1.220 Heavy traffic around the school
g
Strongly agree -0.562 0.354 2.523 0.112 0.570 Somewhat agree -0.605 0.318 3.619 0.047 0.546 Neither agree nor disagree -0.84 0.385 4.758 0.029 0.432 Somewhat disagree -0.459 0.360 1.626 0.202 0.632 Strongly disagree ----- ----- ----- ----- ----- Busy streets to cross
g
Strongly agree 0.047 0.569 0.007 0.935 1.048 Somewhat agree -0.068 0.384 0.032 0.858 0.934 Neither agree nor disagree 0.486 0.384 1.600 0.206 1.625 Somewhat disagree 0.242 0.268 0.820 0.365 1.274 Strongly disagree ----- ----- ----- ----- ----- Constant -5.304 2.589 4.198 0.040 0.005
R2: 0.30
Note: Significant variables with a p-value of <.05 are in bold. SE = standard error. aFemale as referent. dProportion of route with sidewalk missing on both sides of street. eMaximum traffic in 100-vehicle increments. fNo as referent, on the basis of the child survey. gStrongly disagree as referent, on the basis of the parent survey. hPost-1960 as referent *Age = 3 in post-1960 as referent
From school trip
Walk versus driven
Preliminary testing for the trip from school discovered many differences in the variables related to mode
of travel versus trip to school. Only gender and income were significantly related to mode of travel in
the first block of the analysis (Table 8). Once again, boys were more likely to walk on the school trip
than girls: the value for the trip from school even higher on the trip home with boys having an odds ratio
of over 1.8 versus 1.6 on the trip to school. The home dissemination area income was also significant: as
income increased, the odds of walking decreased. In the first block of the model, the R2 value was only
0.05, which only explains 5% of the variance.
When the route-based environment and gender interaction was added to the model, gender
was no longer significant, but income maintained a similar effect, even when accounting for the
environment. The only new significant variables were the distance between home and school,
intersections crossed on the route and living in a pre-1960 neighbourhood. Once again, as distance
increased the odds of walking decreased. Intersections appear to have the same impact on the trip from
school, as crossing more streets decreased the odds of children walking. One new finding relates to the
urban structure variable, having a route where the environment was predominantly constructed prior to
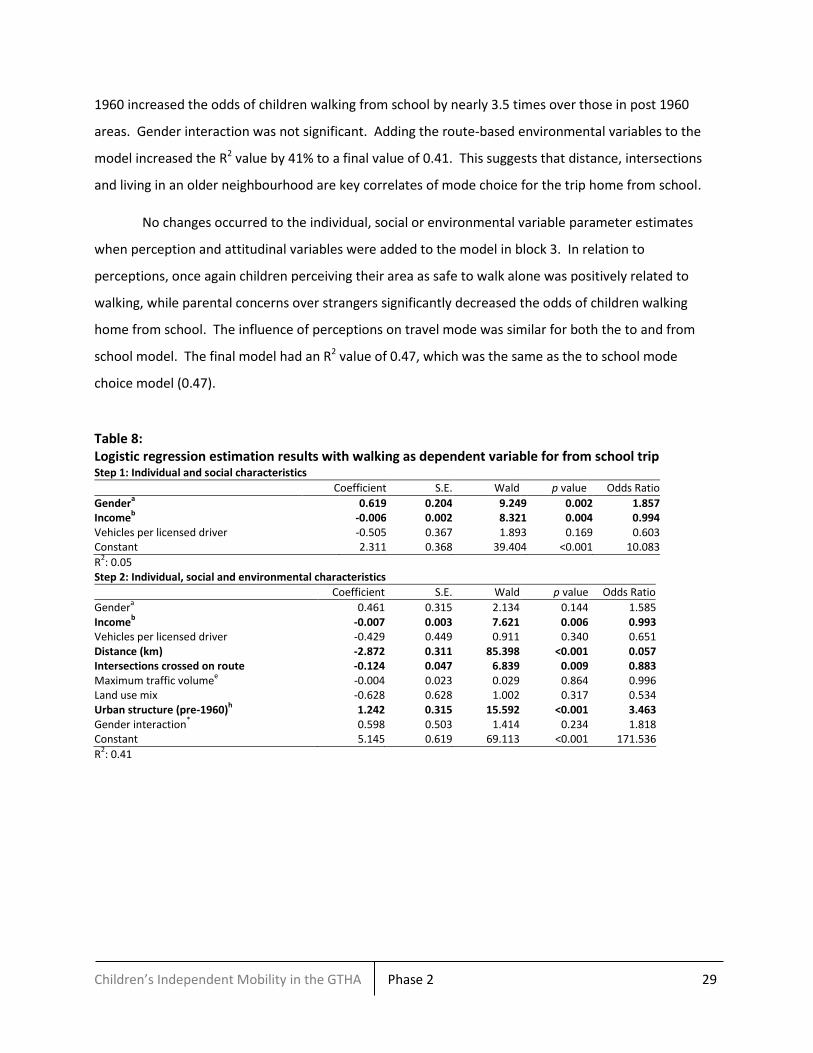
Children’s Independent Mobility in the GTHA Phase 2 29
1960 increased the odds of children walking from school by nearly 3.5 times over those in post 1960
areas. Gender interaction was not significant. Adding the route-based environmental variables to the
model increased the R2 value by 41% to a final value of 0.41. This suggests that distance, intersections
and living in an older neighbourhood are key correlates of mode choice for the trip home from school.
No changes occurred to the individual, social or environmental variable parameter estimates
when perception and attitudinal variables were added to the model in block 3. In relation to
perceptions, once again children perceiving their area as safe to walk alone was positively related to
walking, while parental concerns over strangers significantly decreased the odds of children walking
home from school. The influence of perceptions on travel mode was similar for both the to and from
school model. The final model had an R2 value of 0.47, which was the same as the to school mode
choice model (0.47).
Table 8: Logistic regression estimation results with walking as dependent variable for from school trip Step 1: Individual and social characteristics
Coefficient S.E. Wald p value Odds Ratio
Gendera 0.619 0.204 9.249 0.002 1.857
Incomeb -0.006 0.002 8.321 0.004 0.994
Vehicles per licensed driver -0.505 0.367 1.893 0.169 0.603 Constant 2.311 0.368 39.404 <0.001 10.083
R2: 0.05
Step 2: Individual, social and environmental characteristics
Coefficient S.E. Wald p value Odds Ratio
Gendera 0.461 0.315 2.134 0.144 1.585
Incomeb -0.007 0.003 7.621 0.006 0.993
Vehicles per licensed driver -0.429 0.449 0.911 0.340 0.651 Distance (km) -2.872 0.311 85.398 <0.001 0.057 Intersections crossed on route -0.124 0.047 6.839 0.009 0.883 Maximum traffic volume
e -0.004 0.023 0.029 0.864 0.996
Land use mix -0.628 0.628 1.002 0.317 0.534 Urban structure (pre-1960)
h 1.242 0.315 15.592 <0.001 3.463
Gender interaction* 0.598 0.503 1.414 0.234 1.818
Constant 5.145 0.619 69.113 <0.001 171.536
R2: 0.41

Children’s Independent Mobility in the GTHA Phase 2 30
Step 3: Individual, social, environmental characteristics and perceptions
Coefficient S.E. Wald p value Odds Ratio
Gendera 0.258 0.339 0.579 0.447 1.295
Incomeb -0.010 0.003 12.188 <0.001 0.990
Vehicles per licensed driver -0.239 0.479 0.249 0.618 0.787 Distance (km) -2.681 0.341 61.705 <0.001 0.069 Intersections crossed on route -0.142 0.050 7.991 0.005 0.868 Maximum traffic volume
e -0.003 0.023 0.016 0.900 0.997
Land use mix -0.564 0.662 0.725 0.394 0.569 Urban structure (pre-1960)
h 0.978 0.340 8.287 0.004 2.660
Gender interaction* 0.694 0.525 1.744 0.187 2.002
Safe area to walk alone (child)f
No ----- ----- ----- ----- ----- Do not know 0.582 0.432 1.816 0.178 1.789 Yes 1.250 0.416 9.051 0.003 3.492 Fear of strangers
g
Strongly agree -1.061 0.527 4.052 0.044 0.346 Somewhat agree -0.626 0.518 1.458 0.227 0.535 Neither agree nor disagree -0.341 0.595 0.329 0.566 0.711 Somewhat disagree -0.002 0.662 <0.001 0.997 0.998 Strongly disagree ----- ----- ----- ----- ----- Heavy traffic around the school
g
Strongly agree -0.233 0.472 0.244 0.621 0.792 Somewhat agree -0.293 0.455 0.415 0.520 0.746 Neither agree nor disagree 0.019 0.561 0.001 0.973 1.019 Somewhat disagree 0.440 0.567 0.602 0.438 1.553 Strongly disagree ----- ----- ----- ----- ----- Busy streets to cross
g
Strongly agree -0.548 0.479 1.310 0.252 0.578 Somewhat agree 0.310 0.425 0.532 0.466 1.363 Neither agree nor disagree 0.108 0.439 0.060 0.806 1.114 Somewhat disagree -0.153 0.343 0.200 0.655 0.858 Strongly disagree ----- ----- ----- ----- ----- Constant 5.177 0.905 32.719 <0.001 177.065
R2: 0.47
Note: Significant variables with a p-value of <.05 are in bold. SE = standard error. aFemale as referent. bHome DA level income in $1000 increments. dProportion of route with sidewalk missing on both sides of street. eMaximum traffic in 100-vehicle increments. fNo as referent, on the basis of the child survey. gStrongly disagree as referent, on the basis of the parent survey. hPost-1960 as referent *Age = 3 in post-1960 as referent
Independent versus escorted
Once again, the univariate testing revealed differences between the trip to school and trip from school
in relation to independent mobility. This suggests that there are trip specific differences in how certain
individual, social and environmental (objective and perceived) variables relate to independent travel for
children. Age was significant: the older the child, the more likely they are to walk without adult
supervision (Table 9). The odds ratio for the trip home is actually even larger than what was discovered
for the trip to school: children are two times more likely to walk to school independently for every year

Children’s Independent Mobility in the GTHA Phase 2 31
older they are, versus nearly 2.2 times on the trip from school. Overall, age is significant, but may be
more important on the trip from school. Gender again produced similar results; boys are more likely to
travel independently than girls. Having a parent at home, also related to independent travel. When a
parent indicated she/he was at home they were more likely to escort (walk with) their children (as
indicated by the negative odds ratio for walking independently). One of the parents having a flexible
work schedule was also a significant variable; if the parent somewhat or strongly agreed that they had a
flexible work schedule, their child was less likely to walk independently from school. The individual and
social variables entered in block 1 produced a R2 value of 0.16, which accounts for 16% of the variance.
Table 9: Logistic regression estimation results with walking independent as the dependent variable for from school trip Step 1: Individual and social characteristics
Coefficient S.E. Wald p value Odds Ratio
Age 0.766 0.130 34.513 <0.001 2.152 Gender
a 0.625 0.177 12.430 <0.001 1.868
Home with childrenc
-0.413 0.197 4.397 0.036 0.662 Flexible work schedule
g
Strongly agree -0.970 0.264 13.513 <0.001 0.379 Somewhat agree -0.663 0.295 5.050 0.025 0.515 Neither agree nor disagree -0.388 0.306 1.605 0.205 0.678 Somewhat disagree -0.489 0.344 2.019 0.155 0.613 Strongly disagree ----- ----- ----- ----- ----- Constant -6.901 1.384 24.863 <0.001 0.001
R2: 0.16
Step 2: Individual, social and environmental characteristics
Coefficient S.E. Wald p value Odds Ratio
Age 0.521 0.222 5.503 0.019 1.683 Gender
a 0.614 0.184 11.125 0.001 1.848
Home with children -0.466 0.205 5.175 0.023 0.627 Flexible work schedule
g
Strongly agree -0.912 0.275 11.025 0.001 0.402 Somewhat agree -0.642 0.306 4.398 0.036 0.526 Neither agree nor disagree -0.359 0.318 1.270 0.260 0.699 Somewhat disagree -0.365 0.357 1.046 0.306 0.694 Strongly disagree ----- ----- ----- ----- ----- Distance (km) -0.454 0.292 2.416 0.120 0.635 Intersections crossed on route -0.013 0.031 0.188 0.665 0.987 Maximum traffic volume
e -0.045 0.021 4.595 0.032 0.956
Land use mix -0.185 0.462 0.159 0.690 0.831 Traffic calming density -0.062 0.059 1.101 0.294 0.940 Street tree density -0.006 0.004 1.884 0.170 0.994 Urban structure (pre-1960)
h -5.039 2.924 2.970 0.085 0.006
Age interaction*
0.444 0.280 2.515 0.113 1.559 Constant -3.101 2.341 1.755 0.185 0.045
R2: 0.21
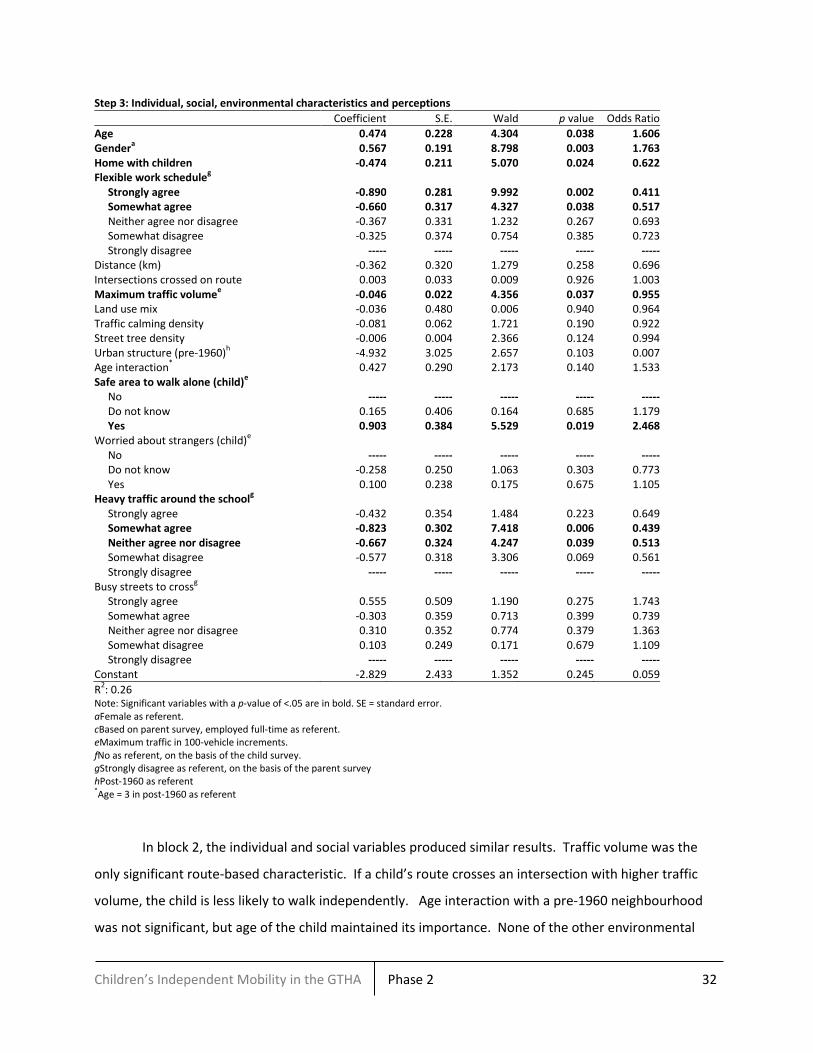
Children’s Independent Mobility in the GTHA Phase 2 32
Step 3: Individual, social, environmental characteristics and perceptions
Coefficient S.E. Wald p value Odds Ratio
Age 0.474 0.228 4.304 0.038 1.606 Gender
a 0.567 0.191 8.798 0.003 1.763
Home with children -0.474 0.211 5.070 0.024 0.622 Flexible work schedule
g
Strongly agree -0.890 0.281 9.992 0.002 0.411 Somewhat agree -0.660 0.317 4.327 0.038 0.517 Neither agree nor disagree -0.367 0.331 1.232 0.267 0.693 Somewhat disagree -0.325 0.374 0.754 0.385 0.723 Strongly disagree ----- ----- ----- ----- ----- Distance (km) -0.362 0.320 1.279 0.258 0.696 Intersections crossed on route 0.003 0.033 0.009 0.926 1.003 Maximum traffic volume
e -0.046 0.022 4.356 0.037 0.955
Land use mix -0.036 0.480 0.006 0.940 0.964 Traffic calming density -0.081 0.062 1.721 0.190 0.922 Street tree density
-0.006 0.004 2.366 0.124 0.994
Urban structure (pre-1960)h -4.932 3.025 2.657 0.103 0.007
Age interaction* 0.427 0.290 2.173 0.140 1.533
Safe area to walk alone (child)e
No ----- ----- ----- ----- ----- Do not know 0.165 0.406 0.164 0.685 1.179 Yes 0.903 0.384 5.529 0.019 2.468 Worried about strangers (child)
e
No ----- ----- ----- ----- ----- Do not know -0.258 0.250 1.063 0.303 0.773 Yes 0.100 0.238 0.175 0.675 1.105 Heavy traffic around the school
g
Strongly agree -0.432 0.354 1.484 0.223 0.649 Somewhat agree -0.823 0.302 7.418 0.006 0.439 Neither agree nor disagree -0.667 0.324 4.247 0.039 0.513 Somewhat disagree -0.577 0.318 3.306 0.069 0.561 Strongly disagree ----- ----- ----- ----- ----- Busy streets to cross
g
Strongly agree 0.555 0.509 1.190 0.275 1.743 Somewhat agree -0.303 0.359 0.713 0.399 0.739 Neither agree nor disagree 0.310 0.352 0.774 0.379 1.363 Somewhat disagree 0.103 0.249 0.171 0.679 1.109 Strongly disagree ----- ----- ----- ----- ----- Constant -2.829 2.433 1.352 0.245 0.059
R2: 0.26
Note: Significant variables with a p-value of <.05 are in bold. SE = standard error. aFemale as referent. cBased on parent survey, employed full-time as referent. eMaximum traffic in 100-vehicle increments. fNo as referent, on the basis of the child survey. gStrongly disagree as referent, on the basis of the parent survey hPost-1960 as referent *Age = 3 in post-1960 as referent
In block 2, the individual and social variables produced similar results. Traffic volume was the
only significant route-based characteristic. If a child’s route crosses an intersection with higher traffic
volume, the child is less likely to walk independently. Age interaction with a pre-1960 neighbourhood
was not significant, but age of the child maintained its importance. None of the other environmental

Children’s Independent Mobility in the GTHA Phase 2 33
variables were statistically significant in the trip from school model. Overall, adding the route-based
environmental variables increased the R2 value to 0.21 from 0.16.
Adding perception and attitudinal variables did not impact the presence of the social, individual
or environmental variables in the model. Children perceiving to live in an area safe to walk alone was
positively related to walking independently. Parental perceptions of traffic around the school also
related to independent travel. When parents somewhat agreed (or neither agree or disagree) to traffic
volume concerns around the school, they were more likely to escort their children. The final model
produced a R2 value of 0.26, which was slightly lower than the trip to school model adding further
evidence to suggest that it is important to consider the to and from trips as separate but related pieces
of childhood travel that could likely benefit from individual attention on the policy and planning front.
Discussion and conclusion
Findings from this study suggest that individual and social characteristics, the route-based environment,
and perceptions all relate to mode of travel and CIM, but that each of these categories of variables has a
different relationship with mode choice and independent travel. Differences in what relates to mode
choice and CIM were also, as expected, observed for the trip to school versus from school models. In
general, findings suggest that age, gender, distance, street crossings, traffic around the school, living in a
pre-1960’s neighbourhood, the child’s perception of living in a safe area to walk alone and parental
concerns over strangers related to walking and CIM to some degree. As the distance increased the odds
of both walking with an adult and walking independently to school decreased. The finding for distance is
not surprising as it is consistent with previous research .24,25,31,39,40 As Tranter and Sharpe discuss in their
recent paper, distance to school can be related to policies regarding school closures or amalgamation.13
If a child’s local school closes, distance to their new school will likely be longer, reducing the odds of
walking with an adult or walking independently. It is important to consider these indirect costs
surrounding the rationalization of the costs of educational service provision through district
amalgamation and/or school closure.
Children’s Independent Mobility in the GTHA Phase 2 34
Individual and social characteristics
Child age and gender were both significantly related to independent travel for trips to school and from
school, but the interaction with the built environment was not. The fact that age and gender were
important is consistent with previous work on the topic,16,26,27,30 as older children and boys have been
found to be more likely to walk independently for school trips. Household characteristics such as
income, vehicles per licenced driver, and having a parent at home with their child all related to walking.
A higher ratio of vehicles per licenced drivers and income decreased the odds of walking, while having a
self-identifying stay at home parent increased the odds of walking. The number of vehicles per licenced
driver was only significant for the trip to school. This finding likely relates to the fact that while timing
aligns to enable many parents to drop off their child on the way to work, fewer are able to leave work
early to chauffeur their child home by car. Even if a household vehicle is available, without an available
driver, children will end up walking home. On the other hand, being older or male increased the odds of
walking independently, while having a parent with a flexible work schedule or having a father at home
all decreased the odds of walking independently.
If a parent was available at home, their child was more likely to walk to school. For the trip
home from school, having a parent at home decreased the odds of children walking independently. This
likely relates to the fact that when a parent is at home, they are likely going to be involved in their
children’s transport. Furthermore, if parents had a flexible work schedule, children were again less likely
to walk independently to school. These findings highlight that having a parent available when children
are travelling to school may increase rates of walking overall, but not specifically CIM in the short term.
Workplace policies that allow for flexible hours may help to get more children walking to school. Even
though flexible hours may encourage escorted walking, more children actively commuting is a step in
the right direction. Furthermore, higher rates of walking directly translates into fewer children being
driven, which can decrease the number of motor vehicles around the school. Tranter and Sharpe discuss
how lower rates of driving can encourage CIM in the long term, through a reduction in the number of
vehicles around the school and decreased traffic safety concerns.13 Traffic concerns were evident within
the results for independent travel (both objective and perceived), thus any approach to increase
escorted walking may indirectly promote CIM in the long term. More children being escorted on foot,
translates into fewer vehicles around the school, which over time can relate to an increase in CIM.13
Furthermore, encouraging both escorted and independent walking at a young age commonly relates to
more walking as an adult.1,8 The goal within The Big Move is to have 30% of adult commuters taking
transit and 20% walking or cycling by 2031. Creating opportunities in daily life for children to walk to

Children’s Independent Mobility in the GTHA Phase 2 35
various destinations, school included, may indeed be a key element in achieving longer range active
transport goals for the adult population.
Route based environment
Several route-based features related to both escorted walking and CIM. Street crossings or the number
of intersections a child must cross along their route was negatively related to escorted walking for trips
to and from school. This variable was also significant for the trip to school in relation to independent
travel. Crossing fewer streets increased the odds of walking to school independently. This finding is
important, as it is not commonly discussed within the CIM literature, and emphasizes the need for safer
street crossings around schools, if indeed CIM or walking is conceptualized as a desirable planning goal.
Signalized crossings, crossing guards or other traffic control methods could improve objective or
perceived risk which may carry over to the production of improved rates of both CIM and overall ATS.
If a route had a higher proportion of missing sidewalks, the odds of walking to school were
significantly lower. Again, from a traffic safety perspective this finding suggests that children, or their
parents, may require (to attenuate perceived risk and/or objective risk) pedestrian infrastructure to
encourage walking. Although sidewalks were not significant in the CIM models, previous work has
highlighted the importance of sidewalks.47 Ensuring adequate sidewalk coverage seems to be a
desirable planning goal. Furthermore, no new developments should be constructed without a complete
sidewalk network. The completion of the sidewalk network will not only benefit children when walking
to school, but will also improve the walking infrastructure for people of all ages and abilities and could
potentially relate to a more attractive environment for everyone.
Finally, higher motor vehicle traffic volumes around the school in the morning and afternoon
decreased the odds of a child walking independently. No known study has examined measured
(objective) traffic volumes along the route in relation to CIM. This finding stresses the importance of
traffic safety in determining whether a child can/will walk independently. Again, any steps that can be
taken to reduce the number of motor vehicles around the school may increase the odds of walking and
CIM. We found also that much of the traffic producing the barrier is generated from within the
passenger vehicle fleet. So indeed the public makes a clear-cut contribution to producing this traffic
safety barrier and therefore needs to be adequately engaged in developing solutions. There is clearly a
need to encourage walking of all types (escorted included) as it will mean fewer motor vehicles around
Children’s Independent Mobility in the GTHA Phase 2 36
the school. As previously discussed, if flexible work hours for parents can encourage escorted walking,
these policies should be promoted as they can reduce the number of vehicles around a child’s school.
Perceptions
Few studies to date have simultaneously examined socio-environmental perceptions and objective
environmental metrics. What appears to be important from this study is that the objective environment
appeared to have more of a relationship with both escorted walking and CIM than child and parent
perceptions. This was evidenced by both the number of significant variables, but also by the change in
the quality or fit of the models with the addition of blocks of variables relating to objective
environmental characteristics. The only significant perceived variable for children in both the mode
choice and independent model was living in a safe area to walk alone. It is difficult to construct policy
recommendations from this finding as this is a vague question. Parental concerns over strangers was a
significant variable in the mode choice models (to and from school). It appears from these findings that
traffic safety and concerns about strangers relate to rates of escorted walking and CIM, which is
consistent with previous work in Toronto.30,33 These findings reiterate the need to improve pedestrian
infrastructure and traffic control measures, but also to look at ways to help parents understand and
manage their perceptions regarding the potential role of strangers in their children’s lives. The fact that
perceptions of heavy motor vehicle traffic around the school and objective traffic around the school
related to independent travel emphasizes the importance of the traffic environment around the school.
Overall, it is extremely important to get children walking, as this will reduce the number of vehicles
around the school, increase rates of CIM and help to meet the future ATS goals set by Metrolinx for the
GTHA.
Children’s Independent Mobility in the GTHA Phase 2 37
References
1 Roberts, I., 1996. Children and sport: walking to school as future benefits. BMJ, Vol.312, 1996, pp.
1229.
2 Buliung, R.N., Mitra R. and G. Faulkner. Active school transportation in the Greater Toronto Area, Canada: An exploration of trends in space and time (1986–2006). Preventive Medicine, Vol.48, 2009, pp.507–512.
3 McDonald, N.C., Brown, A.L., Marchetti, L.M., and M.S. Pedroso. U.S. School Travel, 2009: An
Assessment of Trends. American Journal of Preventive Medicine, Vol.41, 2011, pp.146–151. 4 Wang, Y. Disparities in Pediatric Obesity in the United States. Advances in Nutrition, Vol.2, 2011, pp.23-
31. 5 Shields, M. Overweight and obesity among children and youth. Statistics Canada: Health Reports,
Vol.17, 2006, pp.27-42. 6 Goran, M.I. Energy expenditure, body composition, and disease risk in children and adolescents.
Proceedings of the Nutrition Society, Vol.56, 2008, pp.195–209. 7 Murtagh, E.M., and Murphy, M.H. Active travel to school and physical activity levels of Irish primary
school children. Pediatric Exercise Science, Vol.23, 2011, pp.230-236. 8 Telama, R., Yang, X., Viikari, J., Valimaki, I., Wanne, O., and Raitakari, O. Physical activity from childhood
to adulthood: A 21 year tracking study. American Journal of Preventive Medicine, Vol. 28, 2005, pp. 267-273.
9 Thorp, A.A., Owen, N., Neuhaus, M., and Dunstan, D.W. Sedentary behaviors and subsequent health
outcomes in adults: A systematic review of longitudinal studies, 1996-2011. American Journal of Preventive Medicine, Vol.41, 2011, pp. 207-215.
10 Hillman, M., Adams, J., and Whitelegg, J. One False Move: A Study of Children’s Independent Mobility.
London: PSI Press, 1990. 11 Tranter, P., and Whitelegg, J. Children’s travel behaviours in Canberra: Car-dependent lifestyles in a
low-density city. Journal of Transport Geography, Vol.2, 1994, pp. 265–273. 12 Page, A.S., Cooper, A.R., Griew, P., and Jago, P. Independent mobility, perceptions of the built
environment and children’s participation in play, active travel and structured exercise and sport: The PEACH Project. International Journal of Behavioral Nutrition and Physical Activity, Vol.7, 2010.
13 Tranter, P., and Sharpe, S. Disney-Pixar to the rescue: Harnessing positive affect for enhancing
children’s active mobility. Journal of Transport Geography, Vol.20, 2010, pp. 34-40.

Children’s Independent Mobility in the GTHA Phase 2 38
14 Schoeppe, S., Duncan, M.J., Badland, H., Oliver, M., and Curtis, C. Associations of children’s
independent mobility and active travel with physical activity, sedentary behavior and weight status: A systematic review. Journal of Science and Medicine in Sport, Vol.16, 2013, pp. 312–319.
15 Mackett, R.L., Brown, B., Gong, Y., Kitazawa, K. and Paskins, J. Children’s independent movement in
the local environment. Built Environment, Vol.33, 2007, pp.454–468. 16 Brown, B., Mackett, R., Gong, Y., Kitazawa, K., Paskins, J. Gender differences in children’s pathways to
independent mobility. Children’s Geographies, Vol.6, 2008, pp. 385–401. 17 Rissotto, A., and Giuliani, M.G. Learning neighbourhood environments: The loss of experience in a
modern world. In: Children and Their Environments: Learning, Using and Designing Spaces. Eds: Spencer, C. and Blades, M. Cambridge: Cambridge University Press, 2006, pp. 75–90.
18 Horelli, L. A comparison of children’s autonomous mobility and environmental participation in
northern and southern Europe – The cases of Finland and Italy. Journal of Community and Applied Social Psychology, Vol.11, 2001, pp. 451–455.
19 Rissotto, A., and Tonucci, F. Freedom of movement and environmental knowledge in elementary
school children. Journal of Environmental Psychology, Vol.22, 2002, pp.65–77. 20 Prezza, M., and Pacilli, M.G. Current fear of crime, sense of community, and loneliness in Italian
adolescents: The role of autonomous mobility and play during childhood. Journal of Community Psychology, Vol.35, 2007, pp. 151–170.
21 Evenson, K.R., Huston, S.L., McMillen, B.J., Bors, P., and Ward, D.S. Statewide prevalence and
correlates of walking and bicycling to school. Archives of Pediatrics and Adolescent Medicine, Vol.157, 2003, pp. 887-892.
22 Fulton, J.E., Shisler, J.L., Yore, M.M., and Caspersen, C.J. Active transportation to school: Findings from
a national survey. Research Quarterly for Exercise and Sport, Vol.76, 2005, pp. 352-357. 23 Yarlagadda, A.K., and Srinivasan, S. Modeling children’s school travel mode and parental escort
decisions. Transportation, Vol.35, 2008, pp. 201-218. 24 Mitra, R., Buliung, R.N., and Roorda, M.J. The built environment and school travel mode choice in
Toronto, Canada. Transportation Research Record, Vol.2156, 2010, pp. 150-159. 25 Larsen, K., Gilliland, J., and Hess, P.M. Route based analysis to capture the environmental influences
on a child's mode of travel between home and school. Annals of the Association of American Geographers, Vol.102, 2012, pp. 1-18.
26 Fyhri, A., and Hjorthol, R. Children’s independent mobility to school, friends and leisure activities.
Journal of Transport Geography, Vol.17, 2009, pp. 377–384.
Children’s Independent Mobility in the GTHA Phase 2 39
27 Alparone, F.R., and Pacilli, M.G. On children’s independent mobility: The interplay of demographic,
environmental, and psychological factors. Children’s Geographies, Vol.10, 2012, pp. 109–122. 28 Prezza, M., Pilloni, S., Morabito, C., Sersante, C., Alparone, F.R., and Giuliani, M,V. The influence of
psychosocial and environmental factors on children’s independent mobility and relationship to peer frequentation. Journal of Community and Applied Social Psychology, Vol.11, 2001, pp. 435–450.
29 Mammen G., Faulkner G., Buliung, R., and Lay, J. Understanding the drive to escort: a cross-sectional
analysis examining parental attitudes towards children’s school travel and independent mobility. BMC Public Health, Vol.12, 2012, pp.862.
30 Mitra, R., Faulkner, G.E.J., Buliung, R.N., and Stone, M.R. Do parental perceptions of the
neighbourhood environment influence environment influence children’s independent mobility? Evidence from Toronto, Canada. Urban Studies, Vol.51, 2014, pp. 1-19.
31 Schlossberg, M., Greene, J., Phillips, P.P., Johnson, B., and Parker, B. School trips: Effects of urban form
and distance on travel mode. Journal of the American Planning Association, Vol.72, 2006, pp. 337-346.
32 Vovsha, P., and Petersen, E. Escorting children to school: A statistical analysis and applied modeling
approach. Transportation Research Record, Vol.1898, 2005, pp. 87-97. 33 Larsen, K, Buliung, R.N, and Faulkner, G.E.J. Safety and school travel: How does the environment along
the route relate to safety and mode choice? Transportation Research Record, Vol.2327, 2013, pp. 9-18.
34 Johansson, M. Environmental and parental factors as determinants of mode for children’s leisure
travel. Journal of Environmental Psychology, Vol.26, 2006, pp. 156–169. 35 Dalton, M.A., Longacre, M. R., Drake, K.M., Gibson, L., Adachi-Mejia, A.M., Swain, K., Xie, H., and
Owens, P.E. Built Environment Predictors of Active Travel to School Among Rural Adolescents. American Journal of Preventive Medicine, Vol.40, 2011, pp. 312–319.
36 McMillan, T.E. Urban form and a child's trip to school: The current literature and a framework for
future research. Journal of Planning Literature, Vol.19, 2005, pp. 440-456. 37 Ewing, R., Schroeer, W., and Greene, W. School Location and Student Travel: Analysis of Factors
Affecting Mode Choice. Transportation Research Record, Vol.1895, 2004, pp. 55-63. 38 Mitra, R., and Buliung, R.N. Built environment correlates of active school transportation:
Neighborhood and the modifiable areal unit problem. Journal of Transport Geography, Vol.20, 2012, pp. 51-61.
39 Fyhri, A., Hjorthol, R., Mackett, R.L., Fotel, T.N., Kytta, M. Children’s active travel and independent
mobility in four countries: Development, social contributing trends and measures. Transport Policy, Vol.18, 2011, pp. 703–710.
Children’s Independent Mobility in the GTHA Phase 2 40
40 Prezza, M., Alparone, F.R., Renzi, D., Pietrobono, A. Social participation and independent mobility in
children: The effects of two implementations of “we go to school alone.” Journal of Prevention & Intervention in the Community, Vol.38, 2010, pp. 8-25.
41 Broberg, A., Salminen, S. and Kytta, M. Physical environmental characteristics promoting independent
and active transport to children’s meaningful places. Applied Geography, Vol.38, 2013, pp. 43–52. 42 Villanueva, K., Giles-Corti, B., Bulsara, M. Timperio, A., McCormack, G., Beesley, B., Trapp, G., and
Middleton, N. Where do children travel to and what local opportunities are available? The relationship between neighborhood destinations and children’s independent mobility. Environment and Behavior, Vol.46, 2012, pp.679-705.
43 Collins, D.C.A., and Kearns, R.A. The safe journeys of an enterprising school: Negotiating landscapes of
opportunity and risk. Health and Place, Vol.7, 2002, pp. 293-306. 44 Tranter, P., and Whitelegg, J. Children’s travel behaviours in Canberra: Car-dependent lifestyles in a
low-density city. Journal of Transport Geography, Vol.2, 1994, pp. 265–273. 45 Boarnet, M.G., Day, K., Anderson, C., McMillan, T., and Alfonzo, M. California’s safe routes to school
program: Impacts on walking, bicycling, and pedestrian safety, Journal of the American Planning Association, Vol.71, 2005, pp. 301-317.
46 McMillan, T.E. The relative influence of urban form on a child’s travel mode to school. Transportation
Research Part A, Vol.41, 2007, pp. 69-79. 47 Lin, J., and Chang, H. Built environment effects on children’s school travel in Taipei: Independence and
travel mode. Urban Studies, Vol.47, 2010, pp. 867–889. 48 Kerr, J., Frank, L., Sallis, J.F., and Chapman, J. Urban form correlates of pedestrian travel in youth:
Difference by gender, race-ethnicity and household attributes. Transportation Research Part D, Vol.12, 2007, pp.177-182.
49 Timperio, A., Crawford, D., Telford, A., and Salmon, J. Perceptions about local neighborhood and
walking and cycling among children. Preventive Medicine, Vol.38, 2004, pp.39-47. 50 Ulfarsson, G.F., and Shankar, V.N. Children’s travel to school: Discrete choice modeling of correlated
motorized and nonmotorized transportation modes using covariance heterogeneity. Environment and Planning B: Planning and Design, Vol.35, 2008, pp.195-206.
51 Morrison, D. S., Thomson, H., and Petticrew, M. Evaluation of the health effects of a neighbourhood
traffic calming scheme. Journal of Epidemiology and Community Health, Vol.58, 2004, pp. 837–840. 52 Rothman, L., To, T., Buliung, R., Macarthur, C., and Howard, A. Influence of social and built
environment features on children walking to school: an observational study. Preventive Medicine, Vol. 60, 2014, pp. 10-15.
Children’s Independent Mobility in the GTHA Phase 2 41
53 Tranter, P., and Pawson, E. Children’s access to local environments: A case-study of Christchurch, New
Zealand. Local Environment, Vol.6, 2001, pp.27-48. 54 McDonald, N.C. and Aalborg, A.E. Why parents drive children to school? Implications for Safe Routes
to School Program. Journal of the American Planning Association, Vol.75, 2009, pp. 331–342. 55 Faulkner, G.E.J., Richichi, V., Buliung, R.N., Fusco, C., and Moola, F. What’s “quickest and easiest?":
Parental decision making about school trip mode. International Journal of Behavioral Nutrition and Physical Activity, Vol.7, 2010: pp.62.
56 Kerr, J., Rosenberg, D., Sallis, J.F., Saelens, B.E., Frank, L.D., and Conway, T.L. Active commuting to
school: Associations with environment and parental concerns, Medicine and Science in Sports and Exercise, Vol.38, 2006, pp. 787-794.
57 Frank, L., Kerr, J., Chapman, J., and Sallis, J. Urban form relationships with walk trip frequency and
distance among youth. American Journal of Health Promotion, Vol.21, 2007. 58 Larsen, K, Gilliland, J., Hess, P.M., Tucker, P., Irwin, J., and He, M. 2009. Identifying influences of
physical environments and socio-demographic characteristics on a child's mode of travel to and from school. American Journal of Public Health, 99: 520-526.
59 Timperio, A., Ball, K., Salmon, J., Roberts, R., Giles-Corti, B., Simmons, D., Baur, L. A., and Crawford, C.
Personal, family, social, and environmental correlates of active commuting to school. American Journal of Preventive Medicine, Vol.30, 2006, pp. 45-51.
60 Box CP, and Oppenlander, J.C. Manual of Traffic Engineering Studies. Chapter 3: Traffic volumes.
Institute of Transpiration Engineers: Arlington, Virginia, 1976. 61 Lee, C., and Abdel-Aty, M. Comprehensive analysis of vehicle-pedestrian crashes at intersections in
Florida. Accident Analysis and Prevention, Vol.37, 2005, pp. 775-786. 62 Sze, N.N., and Wong, S.C. Diagnostic analysis of the logistic model for pedestrian injury severity in
traffic crashes. Accident Analysis and Prevention, Vol.39, 2007, pp. 1267-1278. 63 Zegeer, C.V., and Bushell, M. Pedestrian crash trends and potential counter measures from around the
world. Accident Analysis and Prevention, Vol.44, 2012, pp. 3-11. 64 Transportation Research Board (TRB). Highway Capacity Manual. Special Report 209.National Research
Council: Washington, D.C., 1985. 65 Tay, R. Marginal effects of changing the vehicle mix on fatal crashes. Journal of Transport Economics
and Policy, Vol.37, 2003, pp. 439-450.

Children’s Independent Mobility in the GTHA Phase 2 42
66 United States Environmental Protection Agency (EPA). Moves 2010 Highway Vehicle: Population and
Activity Data. United States Environmental Protection Agency, 2010. Available from http://www.epa.gov/otaq/models/moves/420r10026.pdf (Last assessed June 1, 2012).
67 National Highway Traffic Safety Administration (NHTSA). Vehicle weight, fatality risk and crash
compatibility of passenger cars and light trucks. US Department of Transportation: Springfield, Virginia, 2003.
68 Neptis Foundation. Shaping the Toronto region, past, present, and future. 2008. Available from:
http://www.neptis.org/sites/default/files/toronto_metropolitan_region_shaping_the_toronto_region/shaping_report_web_20080902_0.pdf