Embed Size (px)
Citation preview

1
Pharmacy Trends and Management Opportunities
Kerry Bendel, R.Ph.Director of Pharmacy
Medica
September 14, 2007

2
Agenda
Pharmacy Trend Experience
Trend Drivers and Management Opportunities
Call to Action

3
Pharmacy Trend Experience

4
Rx Drugs
Source: “Medicare-approved Drug Discount Cards and Prescription Drug Prices,”Chisholm et al, Am J Health-Syst Pharm – Vol 62, July 15, 2005

5
MCHA Pharmacy Utilization PMPM
$0.00
$20.00
$40.00
$60.00
$80.00
$100.00
$120.00
$140.00
$160.00
$180.00
Jan-06 Feb-06 Mar-06 Apr-06 May-06 Jun-06 Jul-06 Aug-06 Sep-06 Oct-06 Nov-06 Dec-06 Jan-07 Feb-07 Mar-07 Apr-07 May-07 Jun-07
Amt P
aid
PM
PM
0
0.3
0.6
0.9
1.2
1.5
1.8
2.1
2.4
2.7
Rx's
PM
PM
Amount Paid PMPM# Rx's PMPM
6
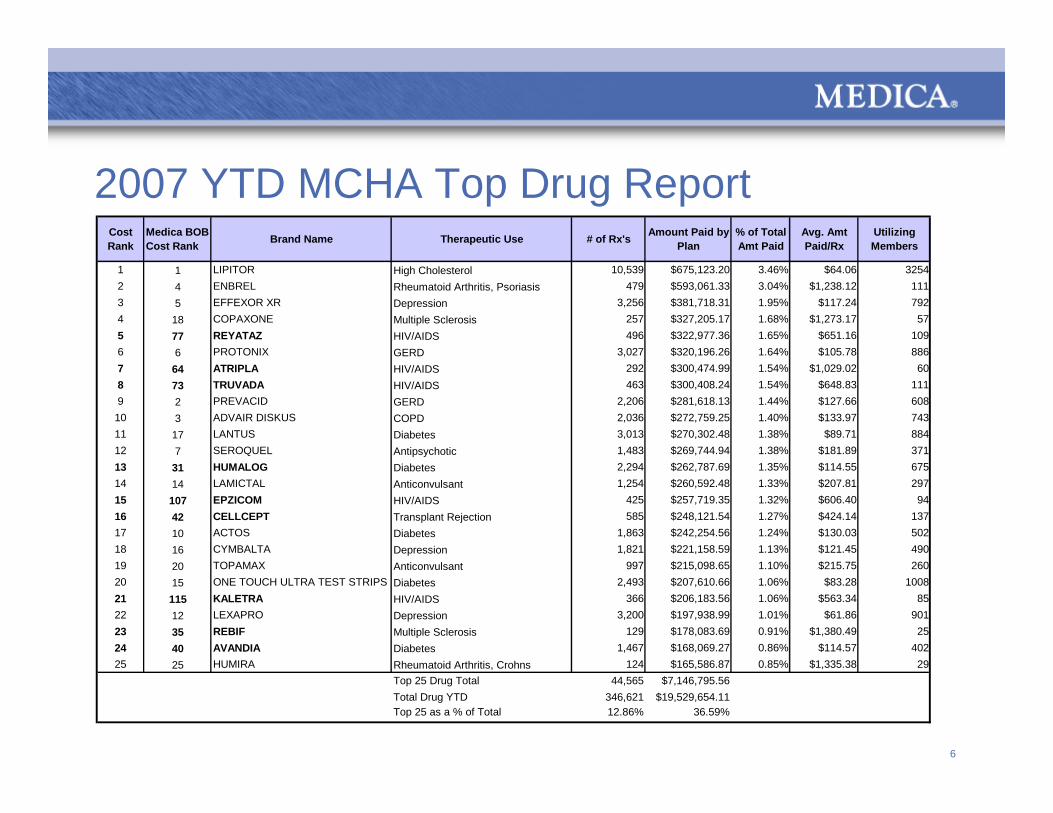
2007 YTD MCHA Top Drug ReportCost Rank
Medica BOB Cost Rank Brand Name Therapeutic Use # of Rx's Amount Paid by
Plan% of Total Amt Paid
Avg. Amt Paid/Rx
Utilizing Members
1 1 LIPITOR High Cholesterol 10,539 $675,123.20 3.46% $64.06 32542 4 ENBREL Rheumatoid Arthritis, Psoriasis 479 $593,061.33 3.04% $1,238.12 1113 5 EFFEXOR XR Depression 3,256 $381,718.31 1.95% $117.24 7924 18 COPAXONE Multiple Sclerosis 257 $327,205.17 1.68% $1,273.17 575 77 REYATAZ HIV/AIDS 496 $322,977.36 1.65% $651.16 1096 6 PROTONIX GERD 3,027 $320,196.26 1.64% $105.78 8867 64 ATRIPLA HIV/AIDS 292 $300,474.99 1.54% $1,029.02 608 73 TRUVADA HIV/AIDS 463 $300,408.24 1.54% $648.83 1119 2 PREVACID GERD 2,206 $281,618.13 1.44% $127.66 608
10 3 ADVAIR DISKUS COPD 2,036 $272,759.25 1.40% $133.97 74311 17 LANTUS Diabetes 3,013 $270,302.48 1.38% $89.71 88412 7 SEROQUEL Antipsychotic 1,483 $269,744.94 1.38% $181.89 37113 31 HUMALOG Diabetes 2,294 $262,787.69 1.35% $114.55 67514 14 LAMICTAL Anticonvulsant 1,254 $260,592.48 1.33% $207.81 29715 107 EPZICOM HIV/AIDS 425 $257,719.35 1.32% $606.40 9416 42 CELLCEPT Transplant Rejection 585 $248,121.54 1.27% $424.14 13717 10 ACTOS Diabetes 1,863 $242,254.56 1.24% $130.03 50218 16 CYMBALTA Depression 1,821 $221,158.59 1.13% $121.45 49019 20 TOPAMAX Anticonvulsant 997 $215,098.65 1.10% $215.75 26020 15 ONE TOUCH ULTRA TEST STRIPS Diabetes 2,493 $207,610.66 1.06% $83.28 100821 115 KALETRA HIV/AIDS 366 $206,183.56 1.06% $563.34 8522 12 LEXAPRO Depression 3,200 $197,938.99 1.01% $61.86 90123 35 REBIF Multiple Sclerosis 129 $178,083.69 0.91% $1,380.49 2524 40 AVANDIA Diabetes 1,467 $168,069.27 0.86% $114.57 40225 25 HUMIRA Rheumatoid Arthritis, Crohns 124 $165,586.87 0.85% $1,335.38 29
Top 25 Drug Total 44,565 $7,146,795.56Total Drug YTD 346,621 $19,529,654.11Top 25 as a % of Total 12.86% 36.59%

7
Plan Paid Per Prescription
$0.00
$25.00
$50.00
$75.00
$100.00
$125.00
$150.00
Jan-06
Feb-06
Mar-06
Apr-06
May-06
Jun-06
Jul-06 Aug-06
Sep-06
Oct-06
Nov-06
Dec-06
Jan-07
Feb-07
Mar-07
Apr-07
May-07
Jun-07
BrandGeneric

8
MCHA Generic Utilization
53.00%
54.00%
55.00%
56.00%
57.00%
58.00%
59.00%
60.00%
Jan-06
Feb-06
Mar-06
Apr-06
May-06
Jun-06
Jul-06
Aug-06
Sep-06
Oct-06
Nov-06
Dec-06
Jan-07
Feb-07
Mar-07
Apr-07
May-07
Jun-07

9
7.90%
5.40% 4.87%
13.41%
7.20%
2.80%2.90%
-7.31%
9.00%-12.00%
1.00%
-5.00%
-10.00%
-5.00%
0.00%
5.00%
10.00%
15.00%
2005 2006 2007
Drug Trend
ESI*Medco+MedicaMCHA
(Projected)
Source: *ESI 2005, 2006 Drug Trend Reports+ Medco 2005, 2006, 2007 Drug Trend Reports

10
Trend Drivers and Management Opportunities
11
Member Contribution
Price
Utilization
Mix
Benefit Coverage
Demographics
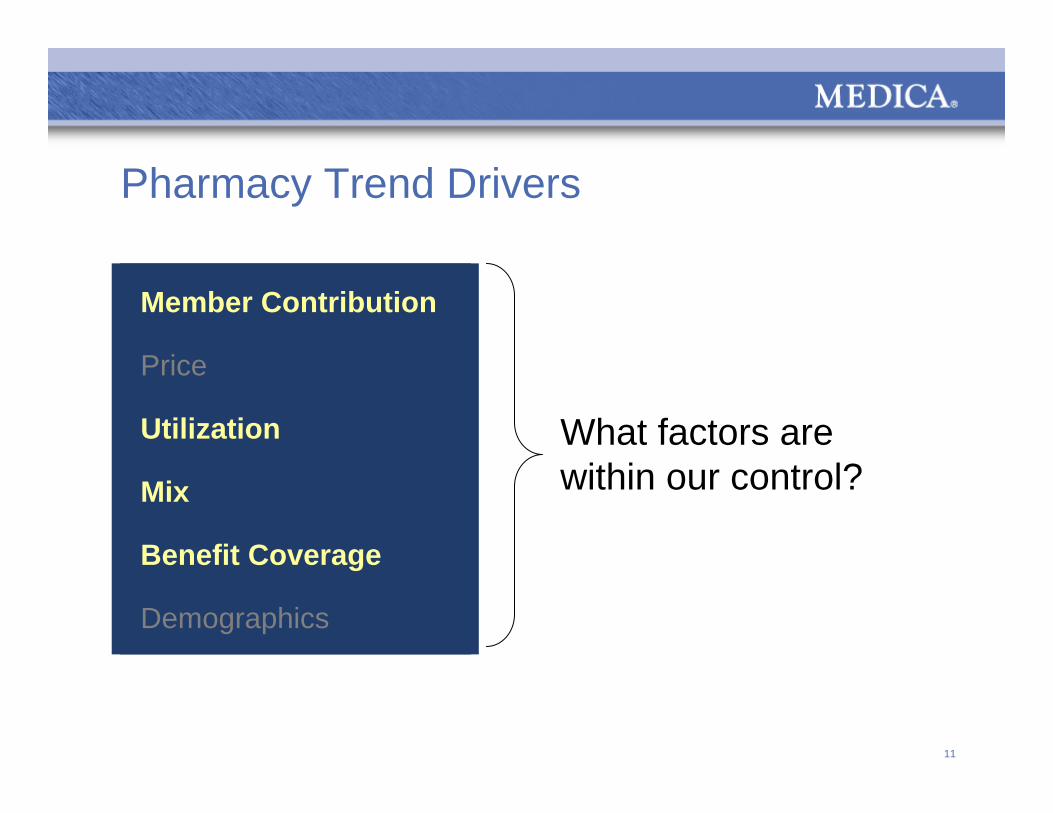
Introduction to Drug Trend Drivers
Pharmacy Trend Drivers
What factors arewithin our control?
Member Contribution
Price
Utilization
Mix
Benefit Coverage
Demographics

12
Introduction to Drug Trend Drivers
Pharmacy Trend Drivers
Member Contribution
Price
Utilization
Mix
Benefit Coverage
Demographics
Strategies used to address controllable influences
Formulary management
Clinical and trend management
Plan design

13
Cost and Quality – Asking tough questions
Can we have it all and expect someone else to pay for it?
Will medicine save us despite our unhealthy lifestyles?
Should we pay for care that’s not recommended by experts nor based on evidence?
What defines medically necessary?

14
Cost and Quality – Making Tough DecisionsPreferred productsPrior authorization – medical necessityGeneric incentives
Formulary Management
Step therapy: Use of a generic or low cost brand prior to a higher cost brand when medically appropriate.Quantity level limits: Supports benefit design, member cost share and prevents wasteDisease and care management: Chronic condition coaching
Clinical / Trend Management
Cost ShareNetwork Restrictions Coverage exclusions or restrictions by category
Plan Design

15
Intervention Targets
• Generic incentives
• Formulary notifications
• Online self-service
• Disease education and management
• Specialty pharmacy services
• Wellness and lifestyle programs
Members
• Formulary Interventions
• Pay for performance
• Generic samples
• Retrospective DUR
Physicians
• Brand & generic substitution
• Therapeutic substitution
• On-line point-of-service edits
Pharmacists

16
MCHA Statin Utilization
0100200300400500600700800900
1000110012001300140015001600170018001900200021002200230024002500
Jan-06 Feb-06 Mar-06 Apr-06 May-06
Jun-06 Jul-06 Aug-06
Sep-06 Oct-06 Nov-06 Dec-06 Jan-07 Feb-07 Mar-07 Apr-07 May-07
Jun-07
LIPIT ORSIM V A ST A T INV Y T OR INC R EST ORLOV A ST A T INPR A V A ST A T IN SOD IU MPR A V A C HOLLESC OLLESC OL X LM EV A C ORZ OC OR
Impact of Managing the Formulary

17
A Call to Action

18
The Impact of Decision Making
The True Cost of a Prescription Decision
Nexium: $185Prilosec OTC: $20
$165 per month
The new math equation is:
Prilosec OTC + = Nexium
$17,172
NPV* = $17,172
* Net Present Value

19
The Obesity Burden64%: Increase in diabetes patients, 1987-2002
1,000%: Increase in obesity-related costs, 1987-2002
$1,244: Annual health care spending difference, normal weight v. obese adults.
Source: Health Affairs, June 2005% of U.S. Health Spending
On Obesity-linked Conditions

20
Specialty Pharmacy Cost
1 IMS Health, Company Reports and JP Morgan estimates2 Ernst & Young, “Competitive Growth, Growing Competition,” Beyond Borders 2005

21
MEDICA