Embed Size (px)
Citation preview
UV-Visible Spectroscopy
IPT/BPUT/B.Pharm/7th Sem/PH 7.4/Pharma. Analysis-III/Dr.M.K.Sahoo
1
PH 7.4 PHARMACEUTICAL ANALYSIS-III (Theory)
The theoretical aspects, basic instrumentation, elements of interpretation of spectra, and applications of the following analytical techniques should be discussed. UNIT -I
1. Ultraviolet and visible spectrophotometry 2. Fluorimetry 3. Infrared spectrophotometry 4. Flame Photometry
Key Notes to UV-VISIBLE SPECTROSCOPY
Introduction to EMR & spectroscopy
Theory of spectroscopy {EMR, wavelength, wave no., frequency, energy, absorption of light(Ia),
transmission of light(It)}
Types of spectroscopy (molecular absorption spectroscopy, molecular emission spectroscopy)
Principles of UV-visible spectroscopy
Region of UV-visible light (UV: 200nm-400nm, Visible: 400nm-800nm)
Principle in colorimetry
λmax, calibration curve,
Laws involved in principle (Beer and Lambert’s law, derivation)
Absorbance, Transmittance, Absorptivity, molecular extinction co-efficient
Electronic states of molecule (ground state, excited state)
Various types of electronic transitions states of molecules (σσ*, nσ*, ππ*, nπ*)
Instrumentation
Visible or colorimeter
Source of light (Tungsten lamp, carbon arc)
Filters (Absorption, Interference)
Sample cells (Glass/Plastic :- Rectangular/cylindrical)
Detectors
Single/double beam colorimeter
UV
Source of light ( Hydrogen lamp, Deuterium lamp, Xenon discharge lamp, mercury arc
lamp)
Monochromators {Prism (Refractive and Reflective), Grating (Diffraction, Transmission)
Sample cells (Quartz :- Rectangular/cylindrical)
Detectors ( Photovoltaic cells, Phototubes, Photomultiplier tubes)
Readout device
Single/double beam UV spectrophotometer
Deviation of Beer’s law, Factors involved for deviation (Instrumental, Physiochemical changes)
Solvent used and effect of solvent on λmax
Some specific effects: Chromophore/ chromogenic agent, Auxochrome, Isobestic point, Bathochromic
effect, Hypsochromic effect, Hyperchromic effect, Hypochromic effect
Applications in Pharmacy
Qualitative analysis
Quantitative analysis
Structure elucidation of organic compounds
Impurity studies

UV-Visible Spectroscopy
IPT/BPUT/B.Pharm/7th Sem/PH 7.4/Pharma. Analysis-III/Dr.M.K.Sahoo
2
Introduction to Electro Magnetic Radiation (EMR)
Light travels in a straight line, but phenomenon like interference, refraction, diffraction, etc. could not
explain this. To explain these phenomenon, light is supposed to travel in waves.
Light or EMR is a form of energy that is transmitted through space at a constant velocity of 3 x 10⁸ m/s.
these radiations are said to have dual nature exhibiting both:
Wave character
Particle character or corpuscular theory
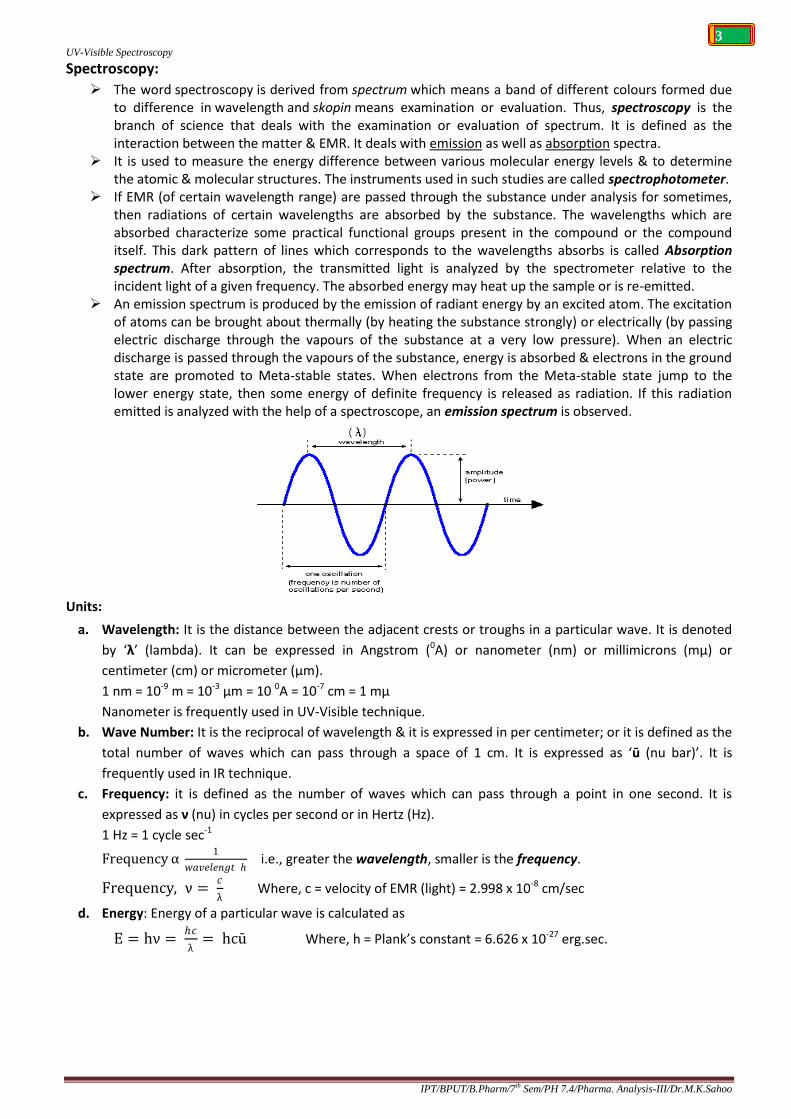
According to wave theory, light travel in the form of waves. This wave motion consists of oscillating electric (E)
& magnetic (H) fields (vectors) directed perpendicular to each & perpendicular to the direction of the
propagation of wave as shown in the figure.
These are characterized by their wavelengths or frequencies or wave numbers. The energy carried by an EMR is directly proportional to the frequency. The emission or absorption of radiation is quantized & each quantum of radiation is called Photon. All types of radiations travel with the same velocity & no medium is required for their propagation.
They can travel through vacuum also. When visible light (a group of EMR) is passed through a prism, it is split up into seven colours which
correspond to definite wavelengths. This phenomenon is called ‘dispersion’.
UV-Visible Spectroscopy
IPT/BPUT/B.Pharm/7th Sem/PH 7.4/Pharma. Analysis-III/Dr.M.K.Sahoo
3
Spectroscopy:
The word spectroscopy is derived from spectrum which means a band of different colours formed due to difference in wavelength and skopin means examination or evaluation. Thus, spectroscopy is the branch of science that deals with the examination or evaluation of spectrum. It is defined as the interaction between the matter & EMR. It deals with emission as well as absorption spectra.
It is used to measure the energy difference between various molecular energy levels & to determine the atomic & molecular structures. The instruments used in such studies are called spectrophotometer.
If EMR (of certain wavelength range) are passed through the substance under analysis for sometimes, then radiations of certain wavelengths are absorbed by the substance. The wavelengths which are absorbed characterize some practical functional groups present in the compound or the compound itself. This dark pattern of lines which corresponds to the wavelengths absorbs is called Absorption spectrum. After absorption, the transmitted light is analyzed by the spectrometer relative to the incident light of a given frequency. The absorbed energy may heat up the sample or is re-emitted.
An emission spectrum is produced by the emission of radiant energy by an excited atom. The excitation of atoms can be brought about thermally (by heating the substance strongly) or electrically (by passing electric discharge through the vapours of the substance at a very low pressure). When an electric discharge is passed through the vapours of the substance, energy is absorbed & electrons in the ground state are promoted to Meta-stable states. When electrons from the Meta-stable state jump to the lower energy state, then some energy of definite frequency is released as radiation. If this radiation emitted is analyzed with the help of a spectroscope, an emission spectrum is observed.
Units:
a. Wavelength: It is the distance between the adjacent crests or troughs in a particular wave. It is denoted
by ‘λ’ (lambda). It can be expressed in Angstrom (0A) or nanometer (nm) or millimicrons (mμ) or
centimeter (cm) or micrometer (μm).
1 nm = 10-9 m = 10-3 μm = 10 0A = 10-7 cm = 1 mμ
Nanometer is frequently used in UV-Visible technique.
b. Wave Number: It is the reciprocal of wavelength & it is expressed in per centimeter; or it is defined as the
total number of waves which can pass through a space of 1 cm. It is expressed as ‘ū (nu bar)’. It is
frequently used in IR technique.
c. Frequency: it is defined as the number of waves which can pass through a point in one second. It is
expressed as ν (nu) in cycles per second or in Hertz (Hz).
1 Hz = 1 cycle sec-1
Frequency α 1
𝑤𝑎𝑣𝑒𝑙𝑒𝑛𝑔𝑡 ℎ i.e., greater the wavelength, smaller is the frequency.
Frequency, ν = 𝑐
λ Where, c = velocity of EMR (light) = 2.998 x 10⁻⁸ cm/sec
d. Energy: Energy of a particular wave is calculated as
E = hν = ℎ𝑐
λ= hcū Where, h = Plank’s constant = 6.626 x 10⁻²⁷ erg.sec.

UV-Visible Spectroscopy
IPT/BPUT/B.Pharm/7th Sem/PH 7.4/Pharma. Analysis-III/Dr.M.K.Sahoo
4
Molecular absorption spectra:
When molecules absorb energy and get excited, then either of the following energy changes occurs.
a. Transition of an electron to high energy level,
b. Change in the intermolecular vibrations of the molecule,
c. Change of the moment of inertia of the molecule around its centre of gravity,
d. Transitions between electronic levels are found in the UV & visible regions,
e. Transitions between vibrational levels, but within same electronic level in mid & near IR region,
f. Transitions between neighbouring rotational levels in far IR & microwave regions.
Quantum theory of EMR:
Quantum theory describes the EMR as consisting of a stream of energy packets, called Photons or
Quanta, which travel in the direction of propagation of the beam with the velocity of light.
Thus, during emission or absorption of light by chemical species, the energy changes take place only
discretely always as integral multiples of small units of energy i.e. photon.
The energy of the photon is proportional to the frequency of radiation, i.e. E α ν, or, E = hν ,
Where, h = Plank’s constant = 6.626 x 10⁻²⁷ erg.sec.
The energy of a photon is called quantum of energy & this depends only on the frequency but not on
the intensity of radiation.
Electromagnetic spectrum:
The electromagnetic spectrum, for most spectroscopic purposes, is considered to be consisting of
region of radiant energy ranging from wavelengths of 10 m to 1 x12-12 cm.
When a molecule absorbs EMR, it can undergo various types of excitation. This excitation may be
Electronic excitation,
Rotation excitation,
Excitation leading to a change in nuclear spin,
Excitation resulting in bond deformation & so on.
If the energy available approaches the ionization potential of the molecule, an electron may be ejected
& ionization may occur.
Since each mode of excitation requires a specific quantity of energy, the different absorptions appear in
different regions of the electromagnetic spectrum.
The various regions of electromagnetic spectrum are set out in table & are labeled either according to
the wavelength/ wave no. range used, or according to the type of the molecular energy levels involved,
e.g. UV (electronic) spectra, IR (vibrational) spectra or RF (NMR) spectra.
Type of Radiation Wavelength Wave no. Type of molecular spectrum
RF > 100 mm < 3 x 10⁹ Hz NMR (Spin orientation)
Microwave 1 – 100 mm 10 – 0.1 cm-1 Rotational
Far IR 50 μm – 1mm 200 – 10cm-1 Vibrational fundamental or rotational
Mid IR 2.5 μm – 50 μm 4000 – 667 cm-1 Vibrational fundamental
Near IR 780nm – 2.5 μm (13 – 4) x 103 cm-1 Vibrational (overtones)
Visible 380nm – 780nm (2.6 – 1.3) x 104 cm-1 Electronic (valence orbital)
Near UV 200nm – 380nm (5 – 2.6) x 104 cm-1 Electronic (valence orbital)
Vacuum UV 10nm – 200nm (102 – 5) x 104 cm-1 Electronic (valence orbital)
X-rays 10pm – 10nm 109 - 106 cm-1 Electronic (core orbitals)
Gamma rays 10-10 cm 1010cm-1 Mossbaurer effect (Nuclear transitions)
excited states of nuclei Cosmic rays 10-12 cm 1012cm-1
UV-Visible Spectroscopy
IPT/BPUT/B.Pharm/7th Sem/PH 7.4/Pharma. Analysis-III/Dr.M.K.Sahoo
5
Absorption of EMR by organic molecules: When a molecule absorbs radiation, its energy increases in proportion to the energy of the photon as E =
hν Since the energy absorbed by a molecule is quantatised, there will not be continuous absorption by a
molecule throughout a particular spectral range; instead the molecule absorb those frequencies which will provide it with the exact quantity of energy (quantum theory) necessary to raise its normal energy level to a higher level or levels.
Thus, when light radiations are passed through an organic compound or, when an organic molecule interacts with EMR, then electrons of the component atoms are excited. It may change its energy from E1 to E2 by absorption of radiation of frequency ‘ν’ so that, E2 - E1 = ∆E = nhν, when, n = an integer.
The lowest state of energy of an atom or molecule is called ground state. By absorbing one quantum of energy ‘hν’, the molecule is promoted to the next higher level & is said to be in the b. Similarly absorption of more energy in integral multiples of hν, will result in further excitation to next higher energy levels.
Study of absorbed radiations from a continuous source that are utilized in raising the internal energy of a molecule constitutes absorption spectroscopy.
In general, an absorption spectrum curve will consist of a series of peaks, each peak coinciding with a value of ‘ν’ which satisfies the relation (E2 - E1 = nhν).
After absorption of energy, the excited species returns to the ground state by emitting the energies radiations. The study of this emitted radiation constitutes emission spectroscopy.
The portions of EMR which do not satisfy relation may either simply pass through the matter or undergo scattering or reflection with or without change of wavelength.
UV-Visible Spectroscopy
IPT/BPUT/B.Pharm/7th Sem/PH 7.4/Pharma. Analysis-III/Dr.M.K.Sahoo
6
UV-Visible spectroscopy UV wavelength region 200nm – 380nm, Visible wavelength region 380nm – 780nm
It is also known as Electronic spectroscopy since it involves the promotion of electrons (σ, π, n-
electrons) from the ground state to the higher energy state.
It very useful to measure the number of conjugated double bonds & also aromatic conjugation within
the various molecules.
It distinguishes between conjugated & non-conjugated systems, α, β- unsaturated carbonyl compounds
from β, γ-analogues, homo annular & hetero annular conjugated dienes, etc.
Principle:
Since the energy levels of a molecule are quantized, the energy required to bring about the excitation is
a fixed quantity. Thus, the EMR with only a particular value of frequency will be able to cause excitation. If the
substance is exposed to radiation of some different value of frequency, energy will not be absorbed & thus,
light radiation will not suffer any loss in intensity.
When UV or Visible radiation is passed through a substance, absorption of energy results in the
promotion of electron from the ground electronic state to the excited electronic state. The amount of
absorption of energy depends upon wavelength of the radiation & the structure of compound.
During the process of absorption, a large number of photon-molecule collisions are possible but only
those collisions will cause absorption of energy in which the energy of the photon matches the energy
difference between the ground & the excited electronic state of the molecule. The absorption of energy
is quantized.
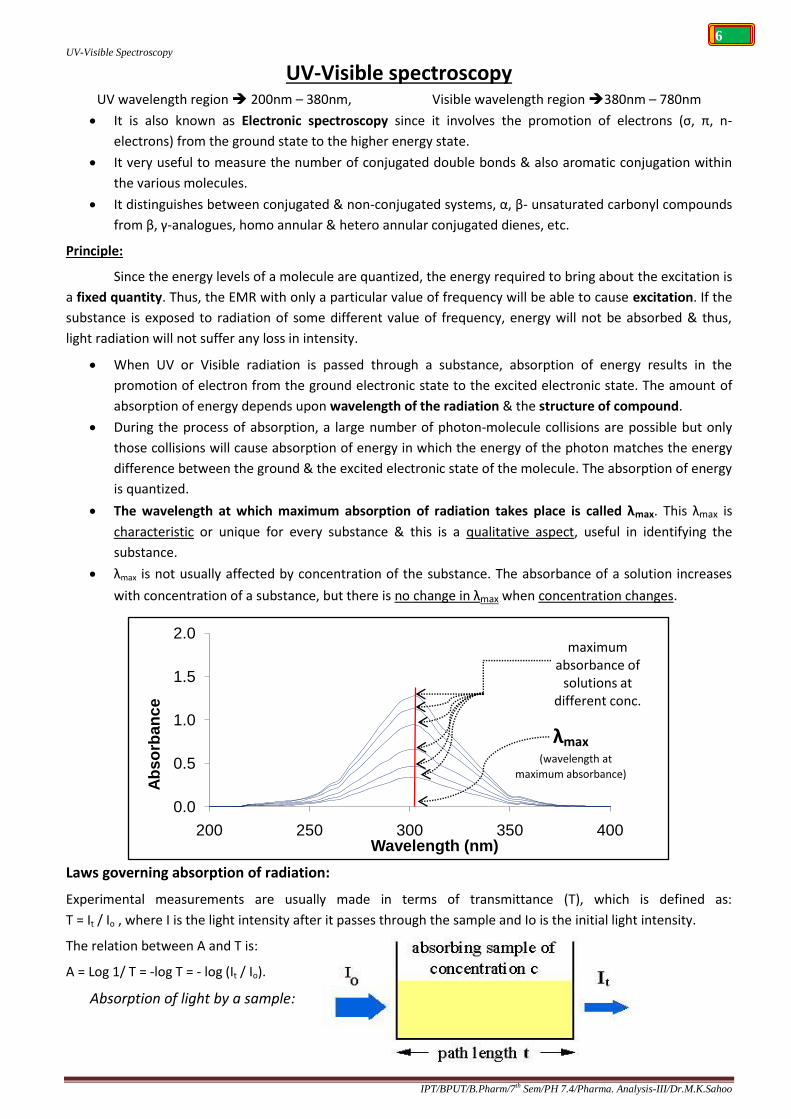
The wavelength at which maximum absorption of radiation takes place is called λmax. This λmax is
characteristic or unique for every substance & this is a qualitative aspect, useful in identifying the
substance.
λmax is not usually affected by concentration of the substance. The absorbance of a solution increases
with concentration of a substance, but there is no change in λmax when concentration changes.
Laws governing absorption of radiation:
Experimental measurements are usually made in terms of transmittance (T), which is defined as:
T = It / Io , where I is the light intensity after it passes through the sample and Io is the initial light intensity.
The relation between A and T is:
A = Log 1/ T = -log T = - log (It / Io).
Absorption of light by a sample:
0.0
0.5
1.0
1.5
2.0
200 250 300 350 400
Ab
so
rban
ce
Wavelength (nm)
maximum absorbance of
solutions at different conc.
λmax(wavelength at
maximum absorbance)

UV-Visible Spectroscopy
IPT/BPUT/B.Pharm/7th Sem/PH 7.4/Pharma. Analysis-III/Dr.M.K.Sahoo
7
There are two laws which govern the absorption of light by the molecules. These are:
1. Beer’s law, 2. Lambert’s Law
1. Beer’s Law: This law states that, “when a beam of monochromatic radiation is passed through a solution of
an absorbing substance, the rate of decrease of intensity of radiation with concentration of the absorbing
solution is proportional to the intensity of incident radiation as well as the concentration of the solution.”
-dI/dC α I
or, -dI/dC = KI (where K = proportionality constant)
or, -dI/I = K dC -------equn. 1
Let, when concentration = 0, then I = I0 (intensity of incident light)
& when concentration = c, then I = It (intensity of transmitted light)
By integrating the equn.1, I0∫ It -dI/I = o∫
c K dc
-[ln I]I0
It = K [C]o c
+ b -------equn. 2
When ‘c’ = 0, intercept ‘b’ = 0
Thus, -[ln It – ln I0] = K [c-0] + 0
or, -ln It + ln I0 = Kc
or, ln I0 -ln It = Kc
or, ln I0/It = Kc
or, I0/It = eKc Or, I0 = It eKc
-------equn. 3
or, It /I0 = e-Kc
or, It = I0 e-Kc
2. Lambert’s Law: It states that, “when a beam of monochromatic radiation passes through a homogenous
absorbing medium, the rate of decrease of intensity of radiation with thickness (path length) of the absorbing
solution is proportional to the intensity of incident radiation.”
-dI/dt α I
or, -dI/dt = KI (where K = proportionality constant)
or, -dI/I = K dt -------equn. 4
Let, when pathlength = 0, then, I = I0 (intensity of incident light)
& when pathlength = t, then, I = It (intensity of transmitted light)
By integrating the equn.4, I0∫ It -dI/I = o∫
t K dt
-[ln I]I0
It = K [t]o t + b -------equn. 5
When ‘t’ = 0, intercept ‘b’ = 0
Thus, -[ln It – ln I0] = K [t-0] + 0
or, -ln It + ln I0 = Kt
or, ln I0 -ln It = Kt
or, ln I0/It = Kt
or, I0/It = eKt Or, I0 = It eKc
-------equn. 6
or, It /I0 = e-Kt
or, It = I0 e-Kt
by combining equn. 3 & 6, we get

UV-Visible Spectroscopy
IPT/BPUT/B.Pharm/7th Sem/PH 7.4/Pharma. Analysis-III/Dr.M.K.Sahoo
8
I0 = It eKct
-------equn. 7
The above equn. can also be written by changing the natural logarithm to the base 10.
I0 = It 10act, where ‘a’ = extinction coefficient = K/2.303
or, I0/It = 10act
or, log I0/It = act
We know, transmittance (T) is expressed in terms of %T , T = It / Io
& absorbance ‘A’ = log 1/T = -log T = - log (It / Io) = log I0/It = act = εct
Where ε = molecular extinction coefficient or molar absorptivity, c = concentration of solution in moles/liter,
t = path length of the sample medium (usually 1cm)
or, ε = A/ct
or, ε = E1%1cm x molecular weight/10
Where, E1%1cm = absorbance of 1% w/v solution using a path length 1 cm, which is constant for each substance.
Visible spectroscopy (colorimetry):
It is concerned with the study of absorption of visible radiation whose wavelength ranges from 380nm –
780nm.
All coloured substances absorb in this wavelength region in different manner.
Colourless solutions are converted to coloured solution by reacting with chemicals called as ‘chromogenic
reagent’ and the involved reaction is called as ‘chromogenic reaction’.
The absorbing capacity of a coloured substance is directly proportional to the amount of desired
constituent.
Properties of coloured system:
Sensitivity: Solution should be intensely coloured & hence an easily detectable change in intensity can be
obtained by small changes in the concentration.
Stability: Intensity of colour should remain constant for a long time.
Specificity: Only desired constituent should develop a colour.
Conformity of Beer’s law: The measurement may be facilitated for a single or poly-component system, if
Beer’s law is obeyed by the coloured solution.
Theories of Electronic Spectroscopy
When the molecule absorbs UV or visible light, its electron get promoted from the ground state to the
higher energy state.
In the ground state, the spins of the electrons in each molecular orbital are essentially paired.
In the higher energy state, if the spins of the electrons are opposite and unpaired, then it is called as an
excited singlet state.
On the other hand, if spins of the electrons in the excited state are parallel and unpaired, it is called as
an excited triplet state. The triplet state is always lower in energy than the corresponding excited
singlet state. Therefore triplet state is more stable as compared to the excited singlet state.
In the triplet excited state, electrons are farther apart in space & thus, electron-electron repulsion is
minimized.
Normally the absorption of UV or visible light results in singlet ground state to excited singlet state
transition, i.e. excitation proceeds with the retention of spins.
An excited singlet state is converted to excited triplet state with the emission of energy as light. The
transition from the singlet ground state to excited triplet state is symmetry forbidden.
The higher energy states are designated as high energy molecular orbitals & also called as anti-bonding
orbitals.
UV-Visible Spectroscopy
IPT/BPUT/B.Pharm/7th Sem/PH 7.4/Pharma. Analysis-III/Dr.M.K.Sahoo
9
The higher probable transition due to absorption of quantized energy involves the promotion of one
electron from the highest occupied molecular orbital (HOMO) to the lowest available unfilled
molecular orbital (LUMO).
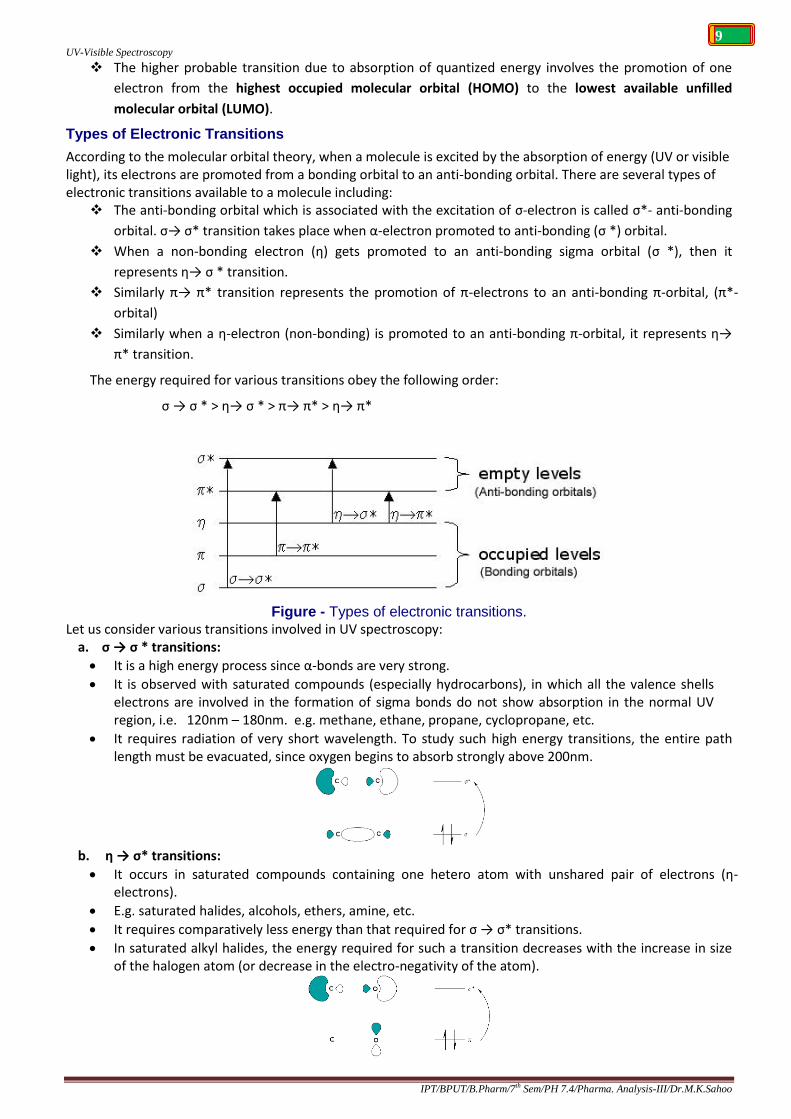
Types of Electronic Transitions
According to the molecular orbital theory, when a molecule is excited by the absorption of energy (UV or visible light), its electrons are promoted from a bonding orbital to an anti-bonding orbital. There are several types of electronic transitions available to a molecule including: The anti-bonding orbital which is associated with the excitation of σ-electron is called σ*- anti-bonding
orbital. σ→ σ* transition takes place when α-electron promoted to anti-bonding (σ *) orbital.
When a non-bonding electron (η) gets promoted to an anti-bonding sigma orbital (σ *), then it
represents η→ σ * transition.
Similarly π→ π* transition represents the promotion of π-electrons to an anti-bonding π-orbital, (π*-
orbital)
Similarly when a η-electron (non-bonding) is promoted to an anti-bonding π-orbital, it represents η→
π* transition.
The energy required for various transitions obey the following order:
σ → σ * > η→ σ * > π→ π* > η→ π*
Figure - Types of electronic transitions.
Let us consider various transitions involved in UV spectroscopy: a. σ → σ * transitions:
It is a high energy process since α-bonds are very strong.
It is observed with saturated compounds (especially hydrocarbons), in which all the valence shells electrons are involved in the formation of sigma bonds do not show absorption in the normal UV region, i.e. 120nm – 180nm. e.g. methane, ethane, propane, cyclopropane, etc.
It requires radiation of very short wavelength. To study such high energy transitions, the entire path length must be evacuated, since oxygen begins to absorb strongly above 200nm.
b. η → σ* transitions:
It occurs in saturated compounds containing one hetero atom with unshared pair of electrons (η-electrons).
E.g. saturated halides, alcohols, ethers, amine, etc.
It requires comparatively less energy than that required for σ → σ* transitions.
In saturated alkyl halides, the energy required for such a transition decreases with the increase in size of the halogen atom (or decrease in the electro-negativity of the atom).

UV-Visible Spectroscopy
IPT/BPUT/B.Pharm/7th Sem/PH 7.4/Pharma. Analysis-III/Dr.M.K.Sahoo
10
c. π → π* transitions:
This type transitions occur in the unsaturated centers of the molecule; i.e. in compounds containing double or triple bonds & also in aromatics.
Absorption usually occurs within the region of ordinary UV-spectrophotometer.
The excitation of π-electron requires smaller energy & hence, transition of this type occurs at longer wavelength.
A π-electron of a double bond is excited to π*-orbital. E.g. alkenes, alkynes, carbonyl compounds, cyanides, azo compounds, etc.
This transition requires still lesser energy as compared to η→σ* transition.
d. η → π* transitions:
In this type, an electron of unshared electron pair on hetero atom gets excited to π*-anti-bonding orbital.
This type of transition requires least amount of energy out of all the transitions, & hence occurs at longer wavelength.
Absorption occurring at lower wavelength is usually intense. In simple cases, it is quite easy to tell whether the transition is η→π* or π→π* since the excitation coefficient for the former is quite low as compared to that of later. The exact electronic structure of the molecules in the excited state is not known but the electronic transition involves the redistribution of electrons within the molecule. E.g. aldehydes, ketones, nitro compounds, etc. contain both η→π* & π→π* transitions.
Instrumentation: UV or visible spectrophotometer / colorimeter consist of following apparatus as per requirement / maker.
Source of light/ radiation
Filter / monochromator (converts polychromatic light to monochromatic light). Monochromator (Entrance slit, collimator, Prism/Grating, collimator, exit slit)
Sample cell
Detector
Apparatus Colorimeter Spectrophotometer
Visible UV
Source of radiation Tungsten lamp, carbon arc lamp
Tungsten lamp, carbon arc lamp
Hydrogen lamp, deuterium lamp, xenon lamp, mercury arc lamp
Filters/ monochromators
Absorption filter , interference filter
Prism type monochromator (Dispersive / Refractive, Littrow / Reflective type)
Grating type monochromator (Diffraction, Transmission)
Sample cell Cylindrical Glass/plastic type
Rectangular glass type Rectangular quartz type
Detector Barrier layer cell / photo voltaic cell
Phototubes / photo emissive cells, Photomultiplier tubes
Phototubes / photo emissive cells, Photomultiplier tubes
UV-Visible Spectroscopy
IPT/BPUT/B.Pharm/7th Sem/PH 7.4/Pharma. Analysis-III/Dr.M.K.Sahoo
11
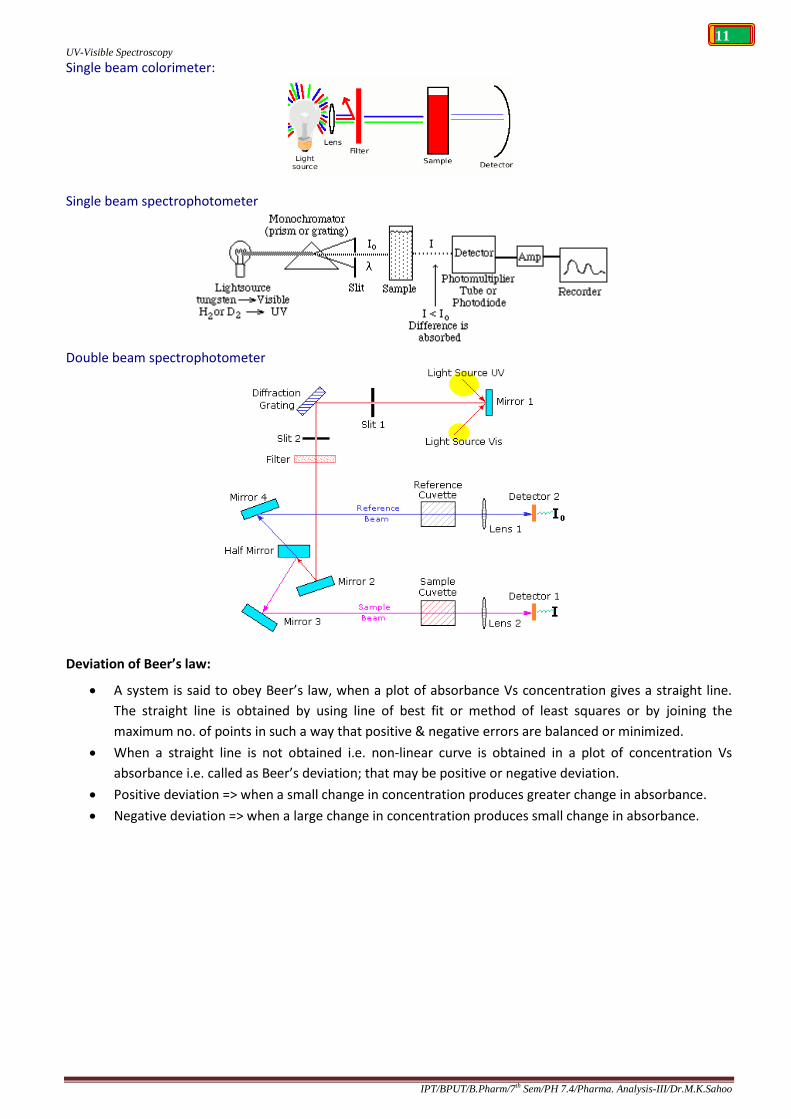
Single beam colorimeter:
Single beam spectrophotometer
Double beam spectrophotometer
Deviation of Beer’s law:
A system is said to obey Beer’s law, when a plot of absorbance Vs concentration gives a straight line.
The straight line is obtained by using line of best fit or method of least squares or by joining the
maximum no. of points in such a way that positive & negative errors are balanced or minimized.
When a straight line is not obtained i.e. non-linear curve is obtained in a plot of concentration Vs
absorbance i.e. called as Beer’s deviation; that may be positive or negative deviation.
Positive deviation => when a small change in concentration produces greater change in absorbance.
Negative deviation => when a large change in concentration produces small change in absorbance.

UV-Visible Spectroscopy
IPT/BPUT/B.Pharm/7th Sem/PH 7.4/Pharma. Analysis-III/Dr.M.K.Sahoo
12
Factors involved for deviation:
i. Instrumental -
a. Stray radiation
b. Improper slit width
c. Fluctuation in single beam
d. Use of non-monochromatic light
ii. Physiochemical changes in solution –
Association => Methylene blue at concentration 10-5 present as monomer form and absorbs at λmax
660nm, but above concentration 10-4 present as dimer & trimer form and absorbs at λmax 600nm.
Dissociation => K2Cr2O7 in higher concentration solution orange in colour & shows λmax 450nm
where as in lower concentration yellow solution & absorbs at λmax 410nm.
Cr2O72- + H2O ↔ 2HCrO4
2- ↔ 2H+ + 2CrO42-
Orange yellow
Ionization (change in pH)
Faulty development of colour (incompletion of reaction) shows instability in colour. E.g.
determination of Fe using thioglycolic acid before completion of reaction.
Refractive index at higher concentration.
Some specific effects (The Chromophore concept):
All those compounds which absorb light of wavelength between 400-800nm appear coloured to the human eye. Exact colour depends upon the wavelength of light absorbed by the compound.
Originally, a Chromophore was considered any system or unsaturated atoms/groups, which is responsible for imparting colour to the compound. E.g. Nitro group gives yellow colour, aryl conjugated azo group gives azo dyes colour.
Chromophore/ chromogenic agent: Chromophore is defined as any isolated covalently bonded group that shows a characteristic
absorption in the ultraviolet or the visible region. The absorption occurs irrespective of the fact whether colour is produced or not. Some important
chromophores are Ethylenic, acetylenic, carbonyls, acids, esters, nitrile groups, etc. A carbonyl isolated group does not produce any colour in the UV spectroscopy by absorbing
light. There are two types of chromophores Chromophores in which the group contains π-electrons & they undergo π→π* transitions, e.g.
ethylenes, acetylenes, etc.
0.000
0.200
0.400
0.600
0.800
1.000
1.200
1.400
1.600
1.800
2.000
0 4 8 12 16 20
Ab
sorb
ance
Concentration (μg/ml)
Calibration curve
+ve deviation
-ve deviation
Linearity

UV-Visible Spectroscopy
IPT/BPUT/B.Pharm/7th Sem/PH 7.4/Pharma. Analysis-III/Dr.M.K.Sahoo
13
Chromophores which contain both π-electrons & η-electrons, such chromophores undergo two types of transitions i.e. π→π* & η→π*; e.g. carbonyls, nitriles, azo compounds, nitro compound, etc.
Auxochrome: An auxochrome can be defined as any group which does not itself acts as a chromophore but
whose presence brings about a shift of the absorption band towards the red end of the spectrum (longer wavelength).
These are covalently saturated groups with lone pair of electrons. The absorption at longer wavelength is due to the combination of a chromophore & an
auxochrome to give rise to another chromophore. An auxochromic group is called as colour enhancing group.
Auxochromic group do not show characteristic absorption above 200 nm. Some common auxochromic groups are –OH, -OR, _NH2, -NHR, -NR2, -SH, etc.
The effect of the auxochrome is due to its ability to extend the conjugation of a chromophore by the sharing of non-bonding electrons. Thus, a new chromophore results which has a different value of the absorption maximum as well as the extinction coefficient. E.g.
=> λmax = 225nm, εmax = 203
NH2 => λmax = 280nm, εmax = 1430
Mechanism: Hence, (-NH2) amino group is an auxochrome. All auxochromic groups contain non-bonding electrons. Due to this, there is extension of conjugation of the chromophore by sharing the non-bonding electrons.
Terminology for absorption shifts
Changes in chemical structure or the environment lead to changes in the absorption spectrum of molecules and materials. There are several terms that are commonly used to describe these shifts,
Bathochromic effect,
Hypsochromic effect,
Hyperchromic effect,
Hypochromic effect
a. Bathochromic shift: The absorptions of two or more chromophores which are separated by more than one bond are usually
additive, but when chromophores are conjugated, i.e. separated by a single bond, pronounced effects are produced. The maximum absorption is shifted to longer wavelengths, thus bringing it into the working range of spectrophotometers. The effect, by virtue of which the absorption maximum is shifted towards longer wavelength due to the
presence of an auxochrome or by the change of solvent, is called as Bathochromic shift or Red shift. b. Hypsochromic shift: It is an effect by virtue of which the absorption maximum is shifted towards shorter wavelength. The
absorption shifted towards shorter wavelength is called Blue shift or Hypsochromic shift. It may be caused by the removal of conjugation & also by changing the polarity of the solvent. E.g. aniline
has λmax 280nm, because the pair of electrons on nitrogen atom is in conjugation with the π-bond system of the benzene ring. But in acidic medium, aniline behaves as C6H5-NH3
+ (anilinium ion) as the electron pair is no longer present & hence conjugation is removed, which causes blue shift & absorption occurs at shorter wavelength (λmax = 203nm).
c. Hyperchromic shift: It is an effect due to which the intensity of absorption maximum increases, i.e. εmax increases.
UV-Visible Spectroscopy
IPT/BPUT/B.Pharm/7th Sem/PH 7.4/Pharma. Analysis-III/Dr.M.K.Sahoo
14
E.g. Pyridine => λmax = 257 nm, εmax = 2750 2-methyl pyridine => λmax = 262 nm, εmax = 3560 The introduction of an auxochrome usually increases intensity of absorption.
d. Hypochromic shift: It is an effect due to which the intensity of absorption maximum decreases i.e. extinction coefficient, εmax
decreases. The introduction of group which distorts the geometry of the molecule causes hypochromic effect.
E.g. Biphenyl => λmax = 250 nm, εmax = 19000 2-methyl biphenyl => λmax = 237 nm, εmax = 10250
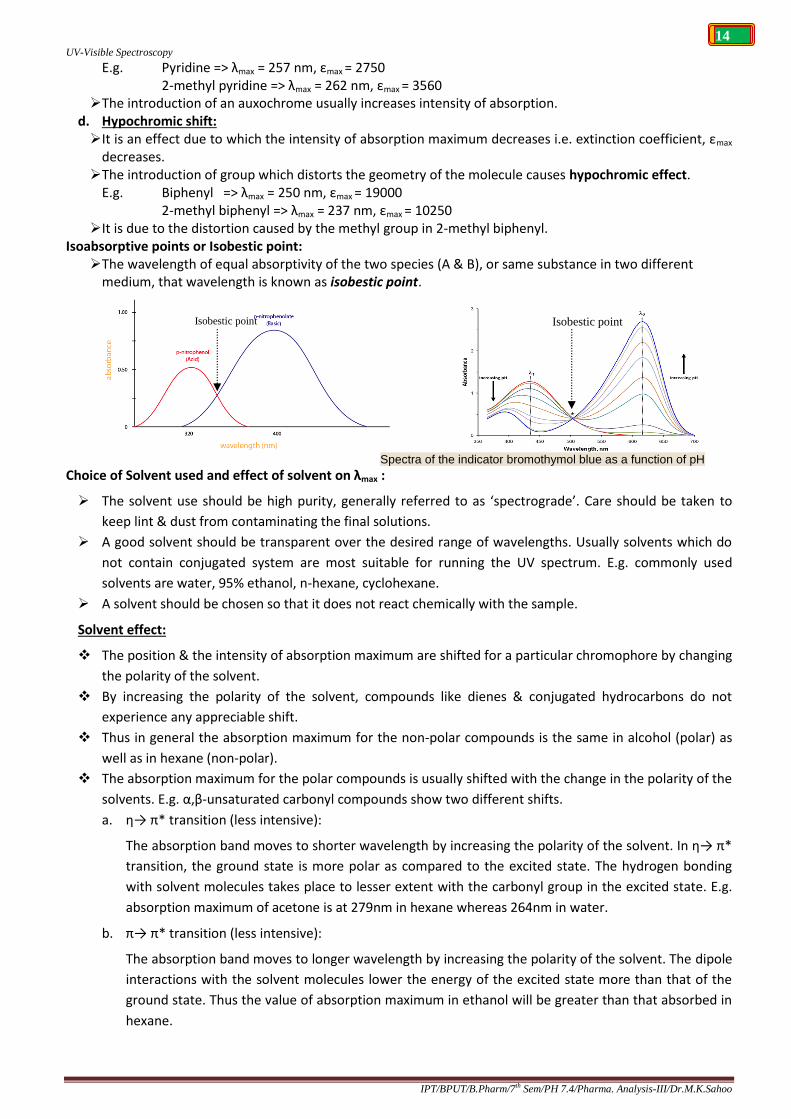
It is due to the distortion caused by the methyl group in 2-methyl biphenyl. Isoabsorptive points or Isobestic point: The wavelength of equal absorptivity of the two species (A & B), or same substance in two different
medium, that wavelength is known as isobestic point.
Spectra of the indicator bromothymol blue as a function of pH
Choice of Solvent used and effect of solvent on λmax :
The solvent use should be high purity, generally referred to as ‘spectrograde’. Care should be taken to
keep lint & dust from contaminating the final solutions.
A good solvent should be transparent over the desired range of wavelengths. Usually solvents which do
not contain conjugated system are most suitable for running the UV spectrum. E.g. commonly used
solvents are water, 95% ethanol, n-hexane, cyclohexane.
A solvent should be chosen so that it does not react chemically with the sample.
Solvent effect:
The position & the intensity of absorption maximum are shifted for a particular chromophore by changing
the polarity of the solvent.
By increasing the polarity of the solvent, compounds like dienes & conjugated hydrocarbons do not
experience any appreciable shift.
Thus in general the absorption maximum for the non-polar compounds is the same in alcohol (polar) as
well as in hexane (non-polar).
The absorption maximum for the polar compounds is usually shifted with the change in the polarity of the
solvents. E.g. α,β-unsaturated carbonyl compounds show two different shifts.
a. η→ π* transition (less intensive):
The absorption band moves to shorter wavelength by increasing the polarity of the solvent. In η→ π*
transition, the ground state is more polar as compared to the excited state. The hydrogen bonding
with solvent molecules takes place to lesser extent with the carbonyl group in the excited state. E.g.
absorption maximum of acetone is at 279nm in hexane whereas 264nm in water.
b. π→ π* transition (less intensive):
The absorption band moves to longer wavelength by increasing the polarity of the solvent. The dipole
interactions with the solvent molecules lower the energy of the excited state more than that of the
ground state. Thus the value of absorption maximum in ethanol will be greater than that absorbed in
hexane.
Isobestic point Isobestic point
UV-Visible Spectroscopy
IPT/BPUT/B.Pharm/7th Sem/PH 7.4/Pharma. Analysis-III/Dr.M.K.Sahoo
15
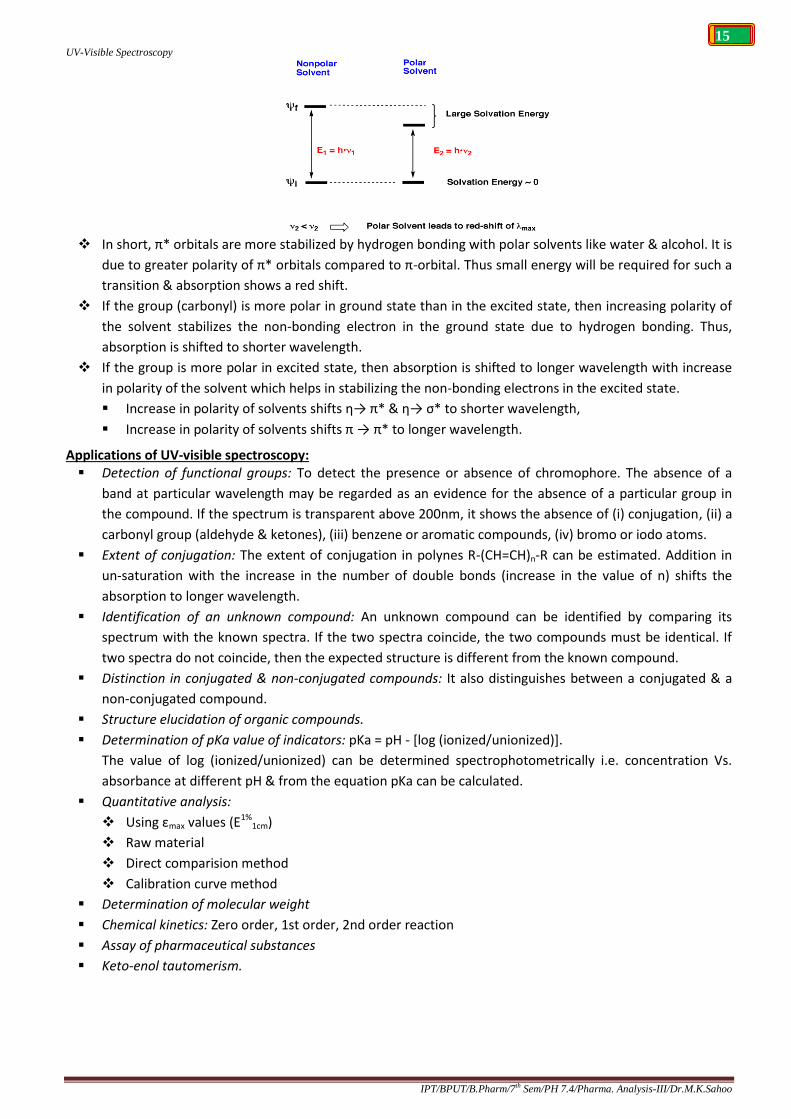
In short, π* orbitals are more stabilized by hydrogen bonding with polar solvents like water & alcohol. It is
due to greater polarity of π* orbitals compared to π-orbital. Thus small energy will be required for such a
transition & absorption shows a red shift.
If the group (carbonyl) is more polar in ground state than in the excited state, then increasing polarity of
the solvent stabilizes the non-bonding electron in the ground state due to hydrogen bonding. Thus,
absorption is shifted to shorter wavelength.
If the group is more polar in excited state, then absorption is shifted to longer wavelength with increase
in polarity of the solvent which helps in stabilizing the non-bonding electrons in the excited state.
Increase in polarity of solvents shifts η→ π* & η→ σ* to shorter wavelength,
Increase in polarity of solvents shifts π → π* to longer wavelength.
Applications of UV-visible spectroscopy: Detection of functional groups: To detect the presence or absence of chromophore. The absence of a
band at particular wavelength may be regarded as an evidence for the absence of a particular group in
the compound. If the spectrum is transparent above 200nm, it shows the absence of (i) conjugation, (ii) a
carbonyl group (aldehyde & ketones), (iii) benzene or aromatic compounds, (iv) bromo or iodo atoms.
Extent of conjugation: The extent of conjugation in polynes R-(CH=CH)n-R can be estimated. Addition in
un-saturation with the increase in the number of double bonds (increase in the value of n) shifts the
absorption to longer wavelength.
Identification of an unknown compound: An unknown compound can be identified by comparing its
spectrum with the known spectra. If the two spectra coincide, the two compounds must be identical. If
two spectra do not coincide, then the expected structure is different from the known compound.
Distinction in conjugated & non-conjugated compounds: It also distinguishes between a conjugated & a
non-conjugated compound.
Structure elucidation of organic compounds.
Determination of pKa value of indicators: pKa = pH - [log (ionized/unionized)].
The value of log (ionized/unionized) can be determined spectrophotometrically i.e. concentration Vs.
absorbance at different pH & from the equation pKa can be calculated.
Quantitative analysis:
Using εmax values (E1%1cm)
Raw material
Direct comparision method
Calibration curve method
Determination of molecular weight
Chemical kinetics: Zero order, 1st order, 2nd order reaction
Assay of pharmaceutical substances
Keto-enol tautomerism.

IR Spectroscopy
IPT/BPUT/B.Pharm/7th Sem/PH 7.4/Pharma. Analysis-III/Dr.M.K.Sahoo
1
PH 7.4 PHARMACEUTICAL ANALYSIS-III (Theory)
The theoretical aspects, basic instrumentation, elements of interpretation of spectra, and applications of the following analytical techniques should be discussed.
UNIT -I
1. Ultraviolet and visible spectrophotometry
2. Fluorimetry
3. Infrared spectrophotometry
4. Flame Photometry
Infra Red (IR) spectroscopy IR spectrum gives sufficient information about the structure of a compound.
It provides a spectrum containing a large no. of absorption bonds from which a wealth of information can be derived about the structure of an organic compound.
Absorption of radiation in the IR (quantized) region results in the excitation of bond deformations, either stretching or bending.
When IR light of quantized frequency is incident on the molecule, energy is absorbed & the amplitude of that vibration is increased.
An IR spectrum is obtained when the frequency of molecular vibration corresponds to the frequency of the IR radiation absorbed.
The normal rage of an infrared spectrum, used by organic chemistry for structural work, extends from 4000 cm-1 (2.5µ) to 667 cm-1 (15µ). It is also known as fundamental vibrational region.
The region from 12500 cm-1 (0.8 µ) to 4000 cm-1 (2.5µ) is called Near Infra red region & contains absorption bonds due to harmonic overtones of fundamental bonds & combination bonds.
The region extending from 667 cm-1 (15µ) to 50 cm-1 (200µ) is referred to as for infrared region. It deals with the pure rotational motion of the molecule.
Wave Length (λ) ----->
0.8μ 2.5μ 15μ 200μ .
Near IR Region
Middle IR Region Far IR Region
Functional Group Region Fingerprint Region
12500 cm-1 4000 cm-1 1400 cm-1 900 cm-1 667 cm-1 50 cm-1
Wave Number (ū) ----->
The absorption of IR radiations can be expressed either in terms of wavelength (λ) or in wave number (ū). Mostly IR spectra of organic compounds are plotted as percentage transmittance against wave number.
Wave number = 1/ wavelength in cm
e.g. Wavelength ( λ) = 2.5 μ= 2.5 x 10⁻⁴cm
Wave number (ū) = 1 / λ = 1 / 2.5 x 10⁻⁴cm = 4000 cm-1
if, λ= 15μ = 15x10-4 cm
ū = 1 / λ = 1 / 15x10-4 cm = 667 cm
Band intensity is either expressed in terms of absorbance (A) or Transmittance (T)
A = log10 (1 /T)
Fundamental group & Finger Print region:-
The region of the IR spectrum from 4000 cm-1 to 1400 cm-1 exhibit absorption bonds assignable to a number of functional groups & is called functional group region. These bands are useful diagnostically but more usually they supplement the region below 1400 cm-1.
The region from 1400 cm-1 to 900 cm-1 is complex because it contains apart from fundamental stretching & bending vibrations many bands resulting from the sum or difference of their vibrational
IR Spectroscopy
IPT/BPUT/B.Pharm/7th Sem/PH 7.4/Pharma. Analysis-III/Dr.M.K.Sahoo
2
frequencies. Specific vibrational assignments in this region are, therefore, very difficult. Thus, this part of the spectrum is characteristic of a compound & is called finger-print region.
Similar molecules may show very similar spectra in the functional group region but certainly exhibit discernible differences in the finger-print region.
Principles of IR Spectroscopy:-
The absorption of IR radiation causes an excitation of molecule from a lower to higher vibrational level. Each vibrational level is associated with a number of closely spaced rotational levels. So, the IR spectrum is
considered as vibrational rotational spectra. All the bonds in a molecule are not capable of absorbing IR energy but only those bonds which are
accompanied by a change in dipole moment will absorb in the IR region. Such vibrational transitions which are accompanied by a change in the dipole-moment of the molecule are called IR active transitions.
On the other hand, the vibrational transitions which are not accompanied by a change in dipole moment of the molecule are not directly observed and these are IR inactive. E.g. vibrational transitions of C=0, N-H, O-H etc. bonds are accompanied by a change in dipole-moment and thus, absorb strongly in the IR region. But transitions in the carbon-carbon bonds in symmetrical alkenes and alkynes are not accompanied by the change in dipole-moment and hence do not absorb in the IR region.
Since the absorption in IR region is quantized, a molecule of the organic compound will show a no. of peaks in the IR region.
Theory of Molecular vibrations:-
Absorption in IR region is due to the changes in the vibrational and rotational levels. When radiations with frequency range less than 100 cm-1 are absorbed, molecular rotation takes place in the substance. As this absorption is quantized, discrete lines are formed in the spectrum due to molecular rotation.
Molecular vibrations are set in, when more energetic radiation region 104-102-cm-1 are passed through the sample of substance.
In the IR spectroscopy (2.5µ - 15 µ), the absorbed energy which depends upon:-
(i) Masses of the atoms present in a molecule.
(ii) Strength of the bonds.
(iii) The arrangement of atoms within the molecule.
It has been found that no two compounds except the enantiomers can have similar IR spectra. The atoms in a molecule are not held rigidly. The molecule may be visualized as consisting of balls of
different sizes tied with springs of varying strengths. Here balls and springs correspond to atoms and chemical bonds respectively. When IR light is passed through the sample, the vibrational and the rotational energies of the molecules are increases. There are two kinds of fundamental vibrations are:-
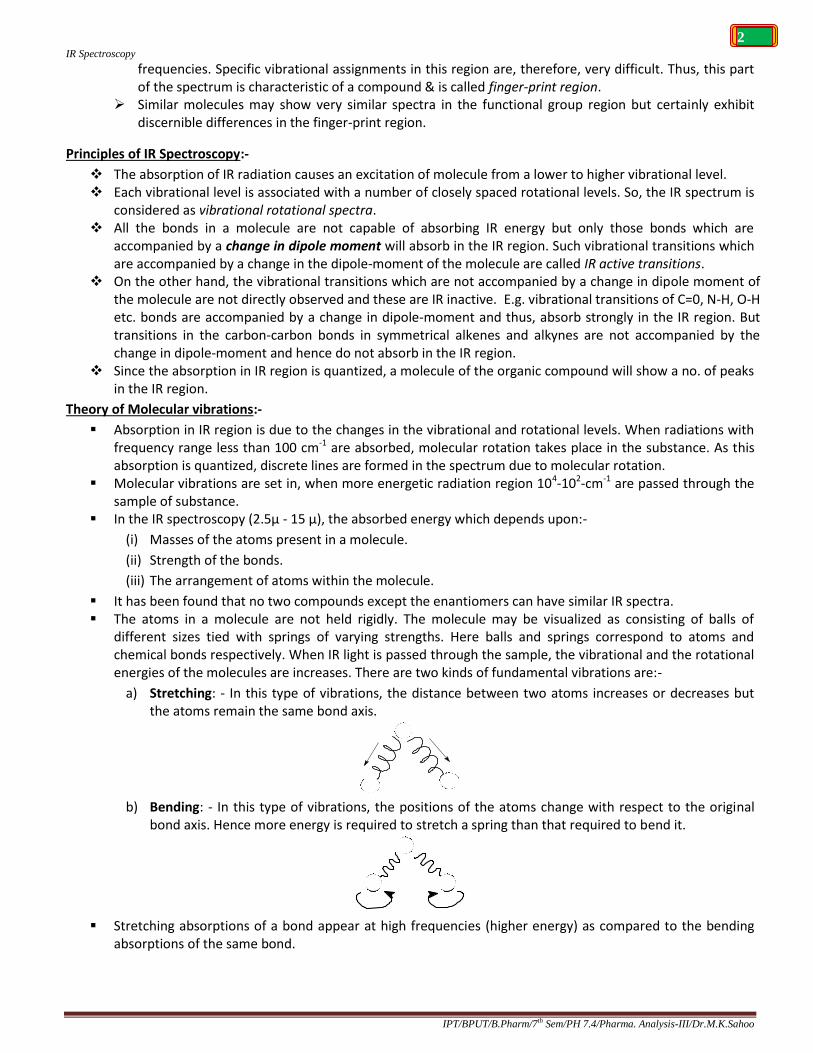
a) Stretching: - In this type of vibrations, the distance between two atoms increases or decreases but the atoms remain the same bond axis.
b) Bending: - In this type of vibrations, the positions of the atoms change with respect to the original
bond axis. Hence more energy is required to stretch a spring than that required to bend it.
Stretching absorptions of a bond appear at high frequencies (higher energy) as compared to the bending
absorptions of the same bond.

IR Spectroscopy
IPT/BPUT/B.Pharm/7th Sem/PH 7.4/Pharma. Analysis-III/Dr.M.K.Sahoo
3
Types of stretching vibrations:-
Stretching vibrations require higher energy and occur at higher frequency.
a) Symmetrical stretching:-
In this stretching, both the atoms move in and out simultaneously, i.e. the movement of the atoms with respect to a particular atom in a molecule is in the same direction.
e.g.
C
H
H
b) Asymmetrical stretching:-
In this type, one atom moves in while the other moves out i.e., one atom approaches the central atom while the other departs it.
e.g.
C
H
H
one hydrogen moves in while other the moves out
Types of Bending vibrations:-
Bending vibrations require lower energy and occur at lower frequency. They are two types.
a) In plane bending:-
In which the atoms remain in the same plane as the nodal plane of the system. It is also two types.
(i) In-plane scissoring deformation:-
In this type, both the atoms swing in concert toward opposite direction, i.e. two atoms approach each other.
C
H H
Scissoring
C
H HCarbon is the pivot & hydrogen as the points of a pair of scissors
(ii) In-plane rocking deformation:-
In this type both the atoms swing to the same side and then both to the other side i.e. the movement of the atom takes place in same direction.
C
H H
Rocking
C
HH
Imagine a person (C) sitting on a rocking chair and hydrogen (H) as tips of the rockers. Then there is a plane passing through all the atoms. This is a poor ground frequency as all the atoms move.
b) Out of plane bending:-
When the atoms bond out of the nodal plane, the bending mode is called out-of-plane bending. It is also two types.
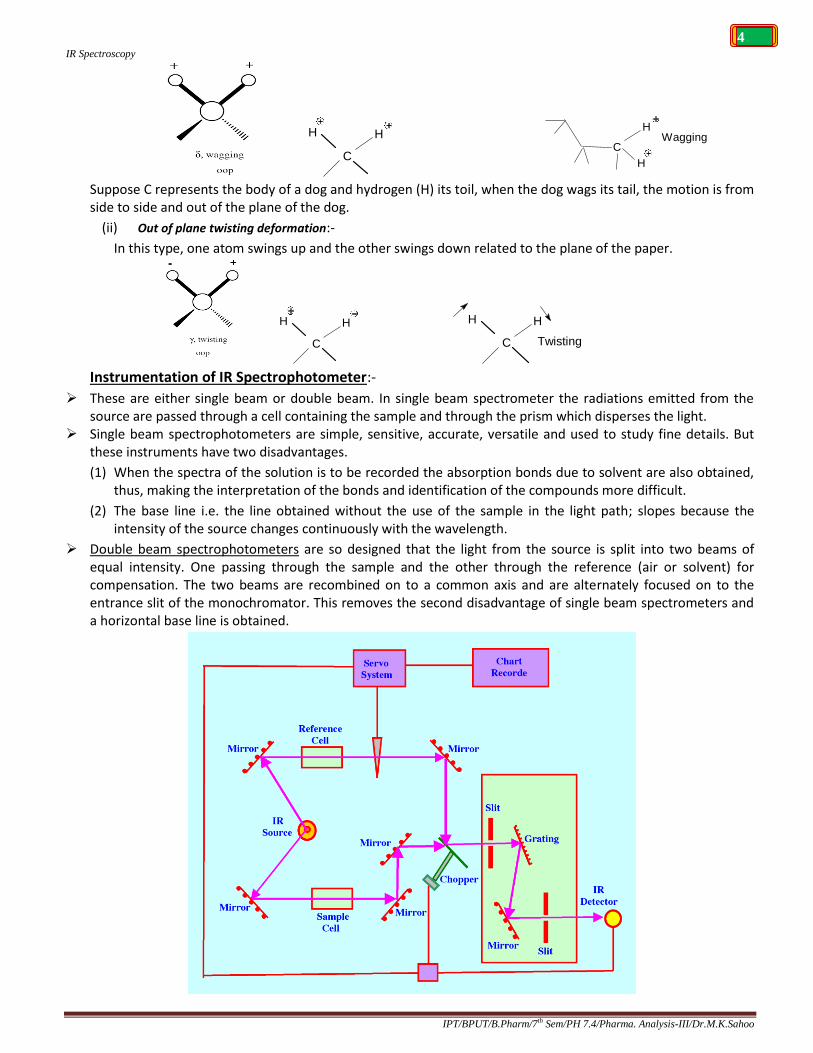
(i) Out of plane wagging deformation:-
In this type, both the atoms swing up and down out of the plane of the paper in unison, i.e. two atoms move up and down plane with respect to the central atom.
IR Spectroscopy
IPT/BPUT/B.Pharm/7th Sem/PH 7.4/Pharma. Analysis-III/Dr.M.K.Sahoo
4
C
H H
WaggingC
H
H
Suppose C represents the body of a dog and hydrogen (H) its toil, when the dog wags its tail, the motion is from side to side and out of the plane of the dog.
(ii) Out of plane twisting deformation:-
In this type, one atom swings up and the other swings down related to the plane of the paper.
C
H H
C
H H
Twisting
Instrumentation of IR Spectrophotometer:-
These are either single beam or double beam. In single beam spectrometer the radiations emitted from the source are passed through a cell containing the sample and through the prism which disperses the light.
Single beam spectrophotometers are simple, sensitive, accurate, versatile and used to study fine details. But these instruments have two disadvantages.
(1) When the spectra of the solution is to be recorded the absorption bonds due to solvent are also obtained, thus, making the interpretation of the bonds and identification of the compounds more difficult.
(2) The base line i.e. the line obtained without the use of the sample in the light path; slopes because the intensity of the source changes continuously with the wavelength.
Double beam spectrophotometers are so designed that the light from the source is split into two beams of equal intensity. One passing through the sample and the other through the reference (air or solvent) for compensation. The two beams are recombined on to a common axis and are alternately focused on to the entrance slit of the monochromator. This removes the second disadvantage of single beam spectrometers and a horizontal base line is obtained.
IR Spectroscopy
IPT/BPUT/B.Pharm/7th Sem/PH 7.4/Pharma. Analysis-III/Dr.M.K.Sahoo
5
Components of Double beam IR spectrophotometer:-
(1) Radiation source.
(2) Sampling area.
(3) Monochromator and optical material.
(4) Detector.
(5) Instrument for the measurement of response of the recorder (Amplifier).
(1) Radiation source:-
(a) Nernst glower:- It consists of a rod of the sintered mixture of the oxides of Zirconium, yttrium, thorium, cerium, Erbium. IR radiation is produced by electrically heating the rod at 1000-18000c temperature.
(b) Globar: - It consists of a rod of silicon carbide, can also be electrically heated to produce IR radiation. Usually 5cm in length and 0.5 cm in diameter rod is used, having maximum radiation 5500cm-1 - 5000cm-1 and minimum about 600cm-1
(c) Nichrome wire.
(d) Carbon arc
(e) Rhodium wire
(2) Sampling area:- (Sampling Technique):-
Various techniques can be employed for placing the sample in the path of the IR beam depending upon the state of sample i.e. solid, liquid or Gas.
(a) Solid samples: - Solid samples may be used in the form of solution, powder, glassy film or pellet. (i) Solids run in solution: - It the solid is soluble in some suitable solvent, its solution can be made and
run in one of the cells for liquids. Carbon disulphide is transparent below 1330cm-1. These solvents can be used for solution.
(ii) Solid films: - Amorphous solid samples may be cast into films from solution on an IR transmitting window or solid melted between salt plates and allowed to cool into a film. A solid film can also be deposited over the alkali metal halide (NaCl or KBr) disc by putting a drop of the solution of the sample (sample dissolved in a volatile solvent) on the disc and evaporating the solvent. Polymers, fats and waxy materials show excellent spectra in this way.
(iii) Mulling Techniques: - Mulls are prepared by thoroughly grinding 1mg of a solid in a smooth agate mortar. The powdered sample is mixed with little mulling reagents, such as, (1) Nujol (a mixture of liquid paraffinic hydrocarbons with high molecular weights), (2) Hexachlorobutadiene, (3) Chlorofluoro-carbon oil. (4) Per-fluoro kerosene. The powdered sample is mulled to form a paste which is then transferred to flat plates of NaCl. The use of mulling reagent makes possible a scan, essentially free of interfering bonds, over the 4000-667 cm-1regions.
(iv) Pressed Pellet Techniques:-
This technique depends on the fact that dry, powdered alkali halide such as KBr, KI, CsBr; can be pressed under high pressure in vacuum to form transparent discs. The resulting transparent discs are inserted into a special holder of the spectrophotometer. The substance under investigation should be absolutely dry as water absorbs strongly at about 3710cm-1 and also near 1630 cm-1. The sample (solid substance) is ground with KBr and is made into a disc after drying and then pressing it under elevated temperature at high pressure. Also a blank disc is prepared with pure KBr which may be placed in the path of the reference beam. It is often advisable to carry out grinding under IR lamp to avoid condensation of atmospheric moisture. Grinding is usually done in agate mortar and pestle. Discs obtained from poorly ground mixture scatter more light than they disperse. The particle size of the ground mixture should be less than 2mµ to avoid scattering. A complete spectrum can be scanned by mixing 1-2% of the solid sample with KBr and then grinding it to the desired particle size. KBr is transparent to the IR region (2.5µ-15µ).
(b) Liquid samples: - The simplest technique consists of sampling a liquid in a thin film (0.1 to 0.3mm) squeezed between two NaCl plates i.e. plates made of the material transparent to IR light. Non-corrosive and too viscous liquids are measured in sealed tubes to prevent undue evaporation. The cells (which may be cavity cell, sandwich cell, demountable cells) are usually rinsed, filled and emptied with the aid of a

IR Spectroscopy
IPT/BPUT/B.Pharm/7th Sem/PH 7.4/Pharma. Analysis-III/Dr.M.K.Sahoo
6
hypodermic syringe (without needle). The cap of the cell is plugged with Teflon. CCl4 and CS2 are used as solvents for dissolve limited number of compounds. These are volatile, toxic and transparent in 4000-1350 cm-1 for CCl4 and 1330-625 cm-1 for CS2. A drop of the low melting substance can be placed on the NaCl plate and another NaCl plate is placed on it. The pair of NaCl plates enclosing the liquid film is then placed in the path of the sample beam.
(c) Gases samples:-
The vapour or gas is introduced into a special gas cell, usually about 10cm long. The walls of the cell are made of NaCl, which allows the cell to be placed directly in the path of the sample beam. Very few organic compounds can be examined as gases. The low frequency rotational changes in the gaseous phase often split the high frequency vibrational bonds. Only few thermally stable metal carbonyls, Cyclopentadienyl compounds and certain acetyl acetone complexes can be examined in the gas phase.
(3) Monochromator and optical material:-
The separation of desired frequencies can be achieved by means of monochromator. To obtain monochromatic light, optical prisms or gratings can be used.
For prism material, glass or quartz can’t be used since they absorb strongly through most of the IR region. Sodium chloride (NaCl) or certain alkali metal halides like LiF, KBr, CaF2, etc. are commonly used as cell containers or for prism material as these are transparent to most of the IR region under consideration.
NaCl is hygroscopic and is, therefore, protected from the condensation of moisture by working at suitable temperature.
Prisms suitable for use below 250cm-1 are not commercially available. It is therefore, necessary to use gratings in order to obtain spectra below 250cm-1.
Gratings disperse the energy into more than one order and the undesirable wavelengths are separated with high quality filters.
Reflecting gratings have several advantages as dispersing element such as
(a) Gratings provide more nearly linear dispersion.
(b) They resist the attack by water.
(c) Prism or filters can be employed in conjugation with the grating.
Both transmission and interference filters have been developed for IR region.
(4) Detectors: - The IR detectors may be selective or non-selective.
The selective detectors are those whose response is markedly dependent upon the wavelength of the incident radiation. E.g. Photocells, Photographic Plates, Photoconductive cells and IR Phosphors.
The non-selective detectors are whose response is directly proportional to incident energy but relatively independent of wavelength, e.g. Thermocouples, Bolometer, Golay or Pneumatic cell.
(a) Thermocouple:-
It is made by evaporating metals such as bismuth, or other supporting base. It is housed in an evacuated chamber with a KBr window to prevent loss of energy by convection. The radiant energy heats one of the two bimetallic junctions and an emf is produced between the two junctions proportional to the degree of heating. Thermocouples thus depend upon the peltier effect in which a potential develops between two junctions of different metals when the junctions are at different temperatures.
(b) Bolometer:-
It gives electrical signal as a result of the change in resistance of a metallic conductor with temperature. The main advantage of metal bolometer is faster response time because of small thermal capacity. Recently introduced thermisters bolometers have increased sensitivity. Thermisters are made of a fused mixture of metal oxides (e.g. Mn, Ni, Co) in which the resistance decreases exponentially with increasing temperatures.
(c) Pneumatic/Golay Cell:-
It consists of two cells; the first 3mm cell is filled with a gas (xenon) and connected to a smaller cell through a tube. One end of the smaller tube is closed by a curved diaphragm which acts as a mirror. The radiation falls on the first cell and heat is conducted to the gas, causing it to expand, which in turn the mirror on the

IR Spectroscopy
IPT/BPUT/B.Pharm/7th Sem/PH 7.4/Pharma. Analysis-III/Dr.M.K.Sahoo
7
second cell. A steady beam of light from a lamp inside the detector can be focused upon diaphragm which reflects the light on to a photocell connected to an amplifier and recorder.
(5) Amplifiers:-
Fourier Transform Spectrometers
Fourier transform spectrometers have recently replaced dispersive instruments for most applications due to their superior speed and sensitivity. They have greatly extended the capabilities of infrared spectroscopy and have been applied to many areas that are very difficult or nearly impossible to analyze by dispersive instruments. Instead of viewing each component frequency sequentially, as in a dispersive IR spectrometer, all frequencies are examined simultaneously in Fourier transform infrared (FTIR) spectroscopy.
Spectrometer Components
There are three basic spectrometer components in an FT system: radiation source, interferometer, and detector. A simplified optical layout of a typical FTIR spectrometer is illustrated in Fig. The same types of radiation sources are used for both dispersive and Fourier transforms spectrometers. However, the source is more often water-cooled in FTIR instruments to provide better power and stability. In contrast, a completely different approach is taken in an FTIR spectrometer to differentiate and measure the absorption at component frequencies. The monochromator is replaced by an interferometer, which divides radiant beams, generates an optical path difference between the beams, and then recombines them in order to produce repetitive interference signals measured as a function of optical path difference by a detector. As its name implies, the interferometer produces interference signals, which contain infrared spectral information generated after passing through a sample.
The most commonly used interferometer is a Michelson interferometer. It consists of three active components: a moving mirror, a fixed mirror, and a beam splitter. The two mirrors are perpendicular to each other. The beam splitter is a semi reflecting device and is often made by depositing a thin film of germanium onto a flat KBr substrate. Radiation from the broadband IR source is collimated and directed into the interferometer, and impinges on the beam splitter. At the beam splitter, half the IR beam is transmitted to the fixed mirror and the remaining half is reflected to the moving mirror. After the divided beams are reflected from the two mirrors, they are recombined at the beam splitter. Due to changes in the relative position of the moving mirror to the fixed mirror, an interference pattern is generated. The resulting beam then passes through the sample and is eventually focused on the detector.
For an easier explanation, the detector response for a single-frequency component from the IR source is first considered. This simulates an idealized situation where the source is monochromatic, such as a laser source. As previously described, differences in the optical paths between the two split beams are created by varying the relative position of moving mirror to the fixed mirror. If the two arms of the interferometer are of equal length, the two split beams travel through the exact same path length. The two beams are totally in phase with each other; thus, they interfere constructively and lead to a maximum in the detector response. This position of the moving mirror is called the point of zero path
IR Spectroscopy
IPT/BPUT/B.Pharm/7th Sem/PH 7.4/Pharma. Analysis-III/Dr.M.K.Sahoo
8
difference (ZPD). When the moving mirror travels in either direction by the distance l/4, the optical path (beam splitter–mirror–beam splitter) is changed by 2 (l/4), or l/2. The two beams are 180° out of phase with each other, and thus interfere destructively. As the moving mirror travels another l/4, the optical path difference is now 2 (l/2), or l. The two beams are again in phase with each other and result in another constructive interference.
When the mirror is moved at a constant velocity, the intensity of radiation reaching the detector varies in a sinusoidal manner to produce the interferogram output shown in Fig. The interferogram is the record of the interference signal. It is actually a time domain spectrum and records the detector response changes versus time within the mirror scan. If the sample happens to absorb at this frequency, the amplitude of the sinusoidal wave is reduced by an amount proportional to the amount of sample in the beam.
Extension of the same process to three component frequencies results in a more complex interferogram, which is the summation of three individual modulated waves, as shown in Fig. In contrast to this simple, symmetric interferogram, the interferogram produced with a broadband IR source displays extensive interference patterns. It is a complex summation of superimposed sinusoidal waves, each wave corresponding to a single frequency. When this IR beam is directed through the sample, the amplitudes of a set of waves are reduced by absorption if the frequency of this set of waves is the same as one of the characteristic frequencies of the sample.
The interferogram contains information over the entire IR region to which the detector is responsive. A mathematical operation known as Fourier transformation converts the interferogram (a time domain spectrum displaying intensity versus time within the mirror scan) to the final IR spectrum, which is the familiar frequency domain spectrum showing intensity versus frequency. This also explains how the term Fourier transform infrared spectrometry is created.
The detector signal is sampled at small, precise intervals during the mirror scan. The sampling rate is controlled by an internal, independent reference, a modulated monochromatic beam from helium neon (HeNe) laser focused on a separate detector.
The two most popular detectors for a FTIR spectrometer are deuterated triglycine sulfate (DTGS) and mercury cadmium telluride (MCT). The response times of many detectors (for example, thermocouple and thermisters) used in dispersive IR instruments are too slow for the rapid scan times (1 sec or less) of the interferometer. The DTGS detector is a pyroelectric detector that delivers rapid responses because it measures the changes in temperature rather than the value of temperature. The MCT detector is a photon (or quantum) detector that depends on the quantum nature of radiation and also exhibits very fast responses. Whereas DTGS detectors operate at room temperature, MCT detectors must be maintained at liquid nitrogen temperature (77 °K) to be effective. In general, the MCT detector is faster and more sensitive than the DTGS detector.
FTIR Advantages
FTIR instruments have distinct advantages over dispersive spectrometers:
Better speed and sensitivity (Felgett advantage). A complete spectrum can be obtained during a single scan of the moving mirror, while the detector observes all frequencies simultaneously.
An FTIR instrument can achieve the same signal-to-noise (S/N) ratio of a dispersive spectrometer in a fraction of the time (1 sec or less versus 10 to 15 min). The S/N ratio is proportional to the square root of the total number of measurements. Because multiple spectra can be readily collected in 1 min or less, sensitivity can be greatly improved by increasing S/N through coaddition of many repeated scans.
Increased optical throughput (Jaquinot advantage). Energy-wasting slits are not required in the interferometer because dispersion or filtering is not needed. Instead, a circular optical aperture is commonly used in FTIR systems. The beam area of an FT instrument is usually 75 to 100 times larger than the slit width of a dispersive spectrometer. Thus, more radiation energy is made available. This constitutes a major advantage for many samples or sampling techniques that are energy-limited.
IR Spectroscopy
IPT/BPUT/B.Pharm/7th Sem/PH 7.4/Pharma. Analysis-III/Dr.M.K.Sahoo
9
Internal laser reference (Connes advantage). The use of a helium neon laser as the internal reference in many FTIR systems provides an automatic calibration in an accuracy of better than 0.01 cm–1. This eliminates the need for external calibrations.
Simpler mechanical design. There is only one moving part, the moving mirror, resulting in less wear and better reliability.
Elimination of stray light and emission contributions. The interferometer in FTIR modulates all the frequencies. The unmodulated stray light and sample emissions (if any) are not detected.
Powerful data station. Modern FTIR spectrometers are usually equipped with a powerful, computerized data system. It can perform a wide variety of data processing tasks such as Fourier transformation, interactive spectral subtraction, baseline correction, smoothing, integration, and library searching.
Applications of IR:-
(1) Identification of organic compounds:-
The identity of an organic compound can be established from its finger print region. The identity of an organic compound is confirmed if its finger print region exactly matches with the known spectrum of that compound. The compounds containing the same functional groups may have similar absorptions above 1500cm-1 but they differ considerably in finger print region.
(2) Structure determination:-
IR helps to establish the structure of an unknown compound. All major functional groups absorb at their characteristic wave numbers. From the data available due to absorption frequencies the probable structure can be predicted.
(3) Qualitative analysis of functional groups:-
The presence or the absence of absorption bonds help in predicting the presence of certain functional groups in the compound. The presence of oxygen reveals that the group may be –0H, C=0, C00R, C00H, anhydride, etc.
(4) Distinction between two types of hydrogen bonding:-
It is known that in hydrogen bonding, the electron cloud transfers from a hydrogen atom to the neighbouring electronegative atom. The condition is that the s-orbital of proton should effectively overlap the p-orbital of the acceptor group. It may be noted that the strength of hydrogen bond is maximum when the proton donor group and the axis of lone pair orbital are collinear and varies inversely to the distance between X and Y (where X is ‘H’ containing group and Y is oxygen, nitrogen or halogen atom).
The molecules of the substances which contain active hydrogen grouping (say -0H, C00H, etc.) undergo self association; e.g. the -0H compounds in the solid or liquid state exist as polymeric aggregates. The absorption in aggregate form occurs at lower frequencies and bonds formed are relatively broad. But when such a substance is dissolved in non-polar solvent, such as CCl4, the aggregates or polymers break in dimmers and monomers. Due to this, the 0-H structure absorption shifts to higher frequencies and the peak become sharp. Further this technique helps to distinguish between intra-molecular and intermolecular hydrogen bonding. E.g. O-nitro phenol exhibits intra-molecular hydrogen bonding where as p-nitro phenol exhibits intermolecular hydrogen bonding. Intro-molecular H-bonded compounds doesn’t show any shift in absorption on dilution on dilution whereas intermolecular H-bonded does.
(5) Identification of drug substance: - IR spectrum of sample and standard compound to identify a substance. If the spectra are same, then the identity of the sample can be confirmed.
(6) Identifying the impurities in a drug sample: - Impurities have different chemical nature when compared to the pure drug. Hence these impurities give rise to additional peaks that of the pure drug.
(7) Study of polymers.
(8) Ratio of cis-trans isomers in a mixture of compounds.
(9) Quantitative analysis: - The quality of a substance can be determined either in pure form or as a mixture of 2 or more components. In this, the peak which is characteristic for the drug is chosen and a comparison of

IR Spectroscopy
IPT/BPUT/B.Pharm/7th Sem/PH 7.4/Pharma. Analysis-III/Dr.M.K.Sahoo
10
the area of peaks for standard and sample is done. This method is called as Baseline technique and is thus used to determine the quantity of a substance.
(10) Analysis of Petroleum Hydrocarbons, Oil, and Grease Contents. (11) Qualitative Analysis of Multilayered Polymeric Films using FTIR Microspectroscopy.