Embed Size (px)
Citation preview
5/14/2018 pharma010709-090504162215-phpapp02 - slidepdf.com
http://slidepdf.com/reader/full/pharma010709-090504162215-phpapp02 1/88
www.ibe.org
P H A R M A C E U T I C A L SDecember 2008
5/14/2018 pharma010709-090504162215-phpapp02 - slidepdf.com
http://slidepdf.com/reader/full/pharma010709-090504162215-phpapp02 2/88
www.ibe.org
MARKET OVERVIEW
5/14/2018 pharma010709-090504162215-phpapp02 - slidepdf.com
http://slidepdf.com/reader/full/pharma010709-090504162215-phpapp02 3/88
www.ibe.org
MARKET OVERVIEWPHARMACEUTICALS • December 2008
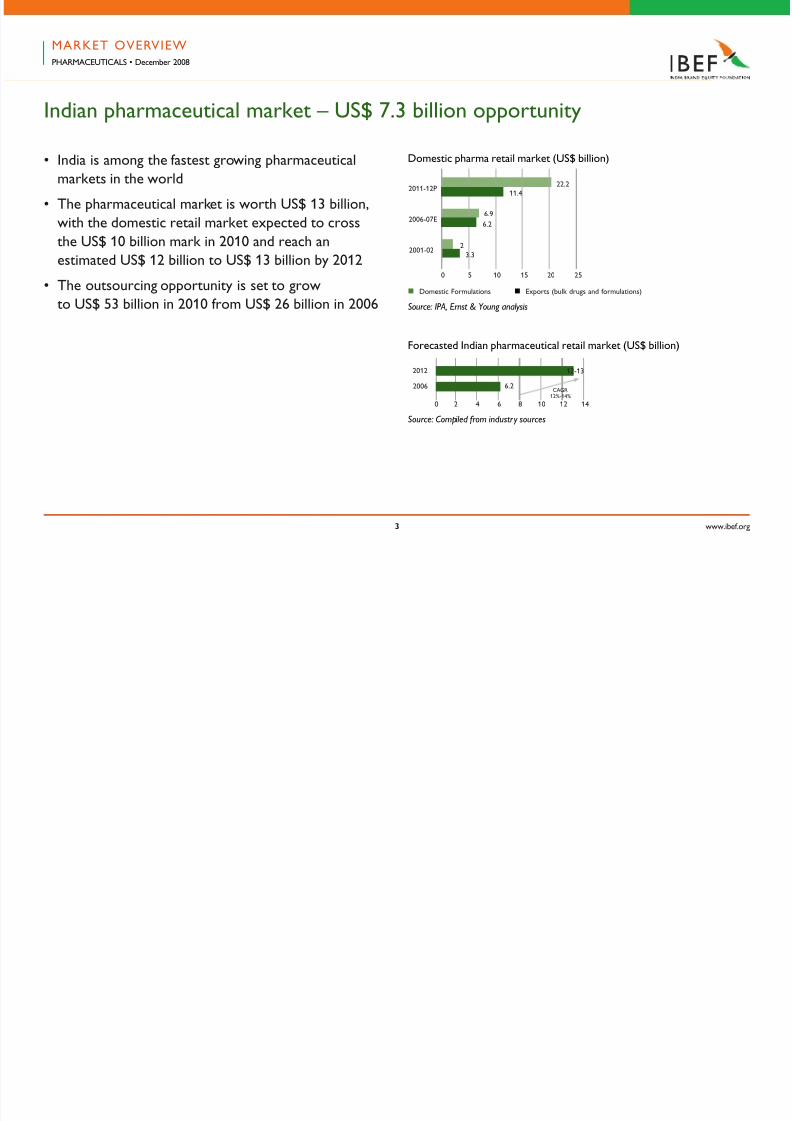
Indian pharmaceutical market – US$ 7.3 billion opportunity
Domestic pharma retail market (US$ billion)• India is among the astest growing pharmaceutical
markets in the world
• The pharmaceutical market is worth US$ 13 billion,
with the domestic retail market expected to cross
the US$ 10 billion mark in 2010 and reach an
estimated US$ 12 billion to US$ 13 billion by 2012
• The outsourcing opportunity is set to grow
to US$ 53 billion in 2010 rom US$ 26 billion in 2006
Forecasted Indian pharmaceutical retail market (US$ billion)
Source: Compiled from industr y sources
2012
2006
12-13
6.2CAGR
12%-14%
Source: IPA, Ernst & Young analysis
0 2 4 6 8 10 12 14
2001-02
22.211.4
6.9
6.2
2
3.3
0 5 10 15 20 25
2006-07E
2011-12P
n Domestic Formulations n Exports (bulk drugs and ormulations)
5/14/2018 pharma010709-090504162215-phpapp02 - slidepdf.com
http://slidepdf.com/reader/full/pharma010709-090504162215-phpapp02 4/88
www.ibe.org
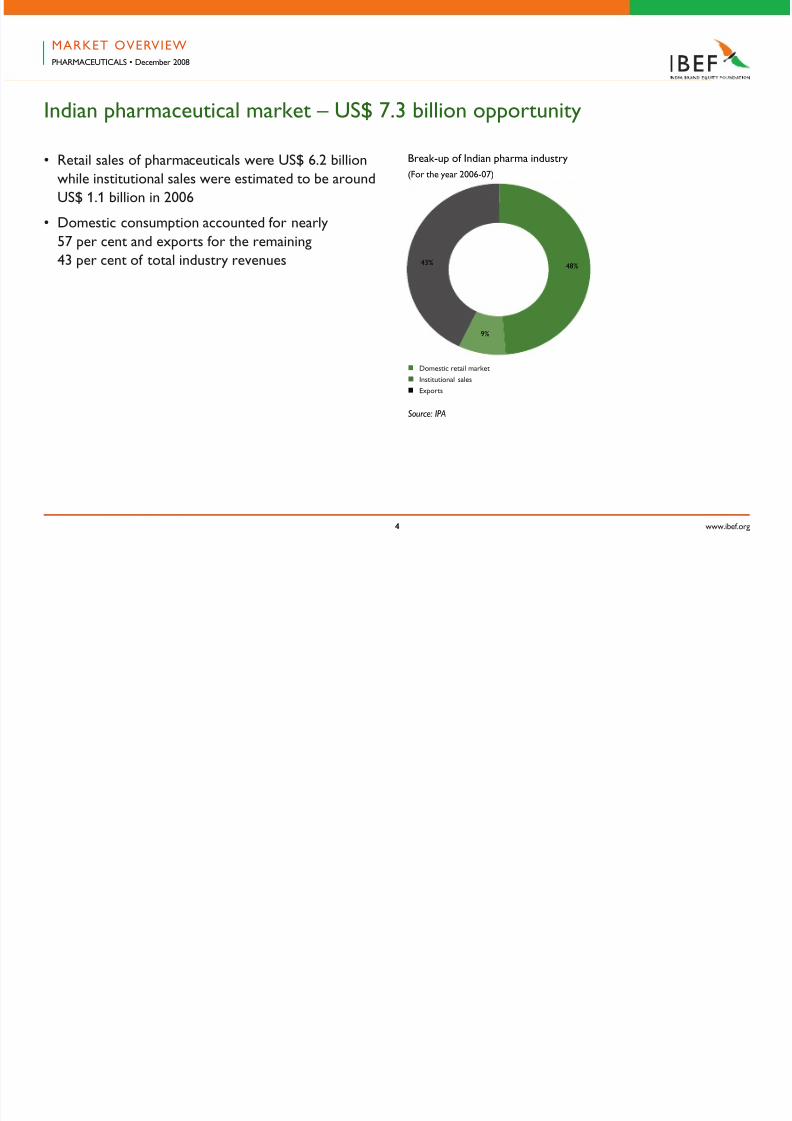
Indian pharmaceutical market – US$ 7.3 billion opportunity
Source: IPA
n Domestic retail market
n Institutional sales
n Exports
48%
9%
43%
Break-up o Indian pharma industry• Retail sales o pharmaceuticals were US$ 6.2 billion
while institutional sales were estimated to be around
US$ 1.1 billion in 2006
• Domestic consumption accounted or nearly
57 per cent and exports or the remaining
43 per cent o total industry revenues
(For the year 2006-07)
MARKET OVERVIEWPHARMACEUTICALS • December 2008
5/14/2018 pharma010709-090504162215-phpapp02 - slidepdf.com
http://slidepdf.com/reader/full/pharma010709-090504162215-phpapp02 5/88
www.ibe.org
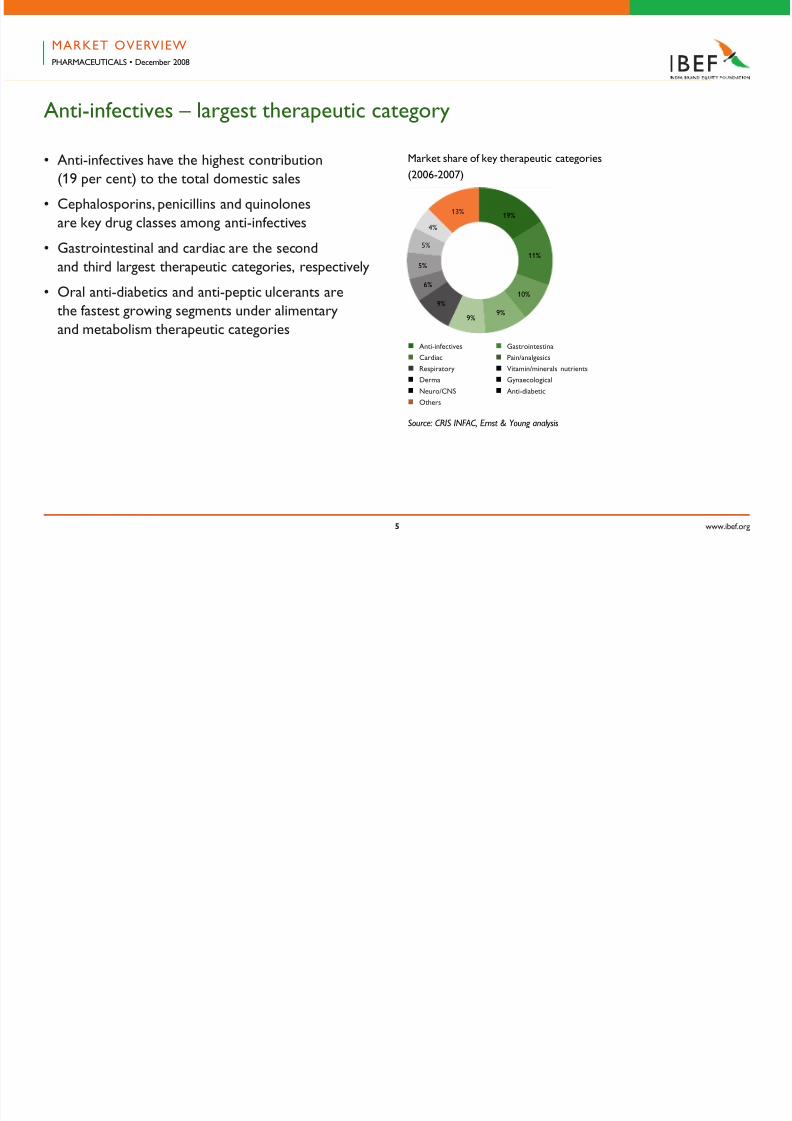
Anti-inectives – largest therapeutic category
(2006-2007)• Anti-inectives have the highest contribution
(19 per cent) to the total domestic sales
• Cephalosporins, penicillins and quinolones
are key drug classes among anti-inectives
• Gastrointestinal and cardiac are the second
and third largest therapeutic categories, respectively
• Oral anti-diabetics and anti-peptic ulcerants are
the astest growing segments under alimentary
and metabolism therapeutic categories
Source: CRIS INFAC, Ernst & Young analysis
n Anti-inectives n Gastrointestinal
n Cardiac n Pain/analgesics
n Respiratory n Vitamin/minerals nutrients
n Derma n Gynaecological
n Neuro/CNS n Anti-diabetic
n Others
19%
Market share o key therapeutic categories
MARKET OVERVIEWPHARMACEUTICALS • December 2008
11%
10%
9%9%
9%
6%
5%
5%
4%
13%
5/14/2018 pharma010709-090504162215-phpapp02 - slidepdf.com
http://slidepdf.com/reader/full/pharma010709-090504162215-phpapp02 6/88
www.ibe.org
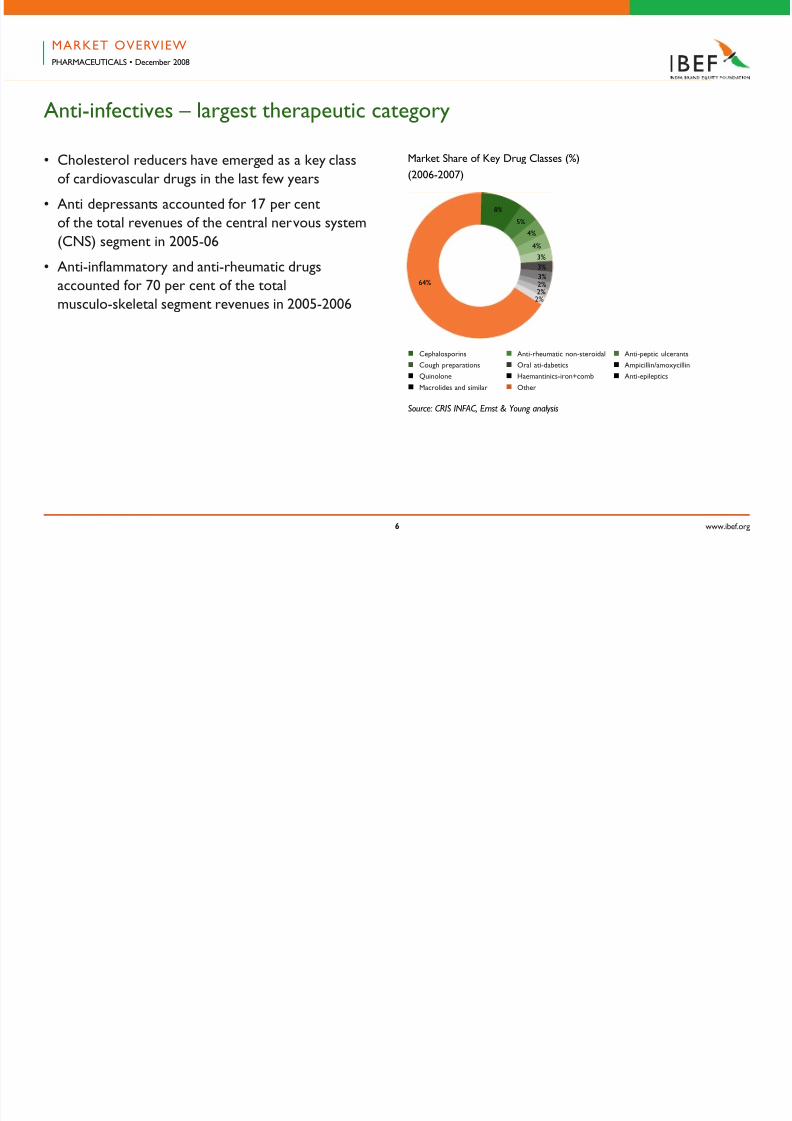
Anti-inectives – largest therapeutic category
• Cholesterol reducers have emerged as a key class
o cardiovascular drugs in the last ew years
• Anti depressants accounted or 17 per cent
o the total revenues o the central nervous system
(CNS) segment in 2005-06
• Anti-inammatory and anti-rheumatic drugs
accounted or 70 per cent o the total
musculo-skeletal segment revenues in 2005-2006
Market Share o Key Drug Classes (%)
n Cephalosporins n Anti-rheumatic non-steroidal n Anti-peptic ulcerants
n Cough preparations n Oral ati-dabetics n Ampicillin/amoxycillin
n Quinolone n Haemantinics-iron+comb n Anti-epileptics
n Macrolides and similar n Other
64%
Source: CRIS INFAC, Ernst & Young analysis
MARKET OVERVIEWPHARMACEUTICALS • December 2008
8%
5%
4%
4%
3%
3%
3%2%2%2%
(2006-2007)
5/14/2018 pharma010709-090504162215-phpapp02 - slidepdf.com
http://slidepdf.com/reader/full/pharma010709-090504162215-phpapp02 7/88
www.ibe.org
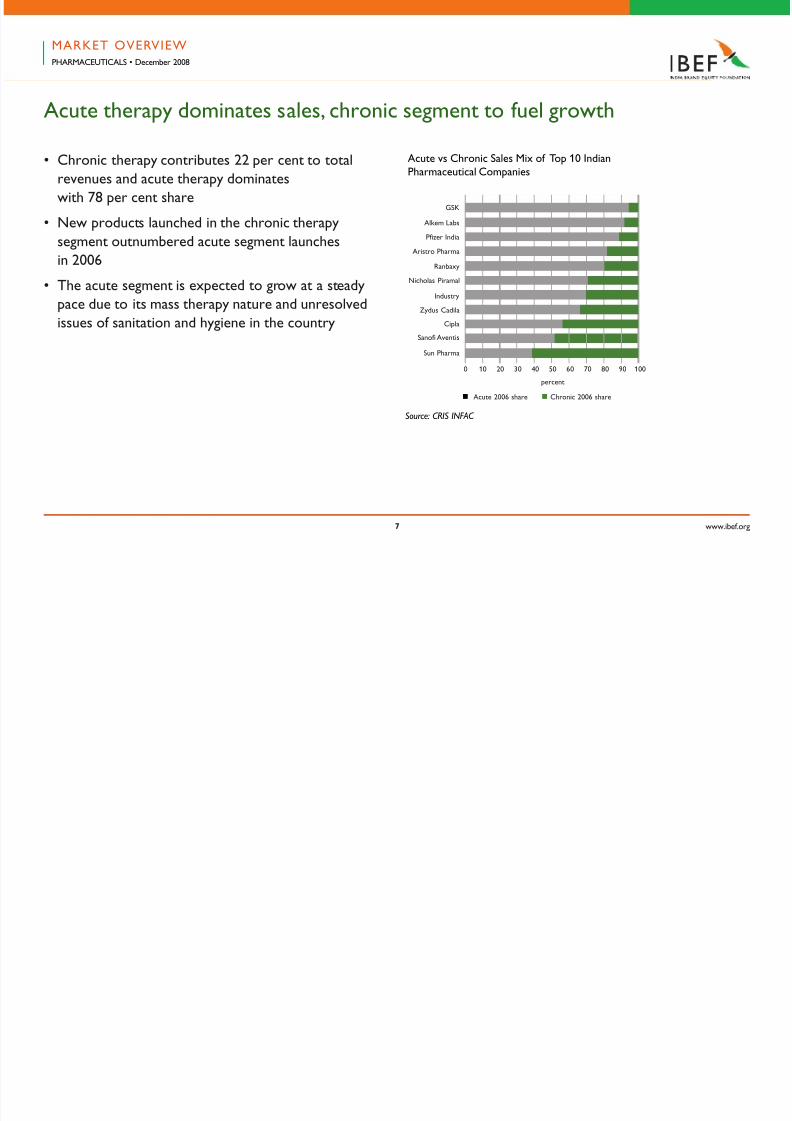
Acute therapy dominates sales, chronic segment to uel growth
Acute vs Chronic Sales Mix o Top 10 IndianPharmaceutical Companies
Source: CRIS INFAC
• Chronic therapy contributes 22 per cent to total
revenues and acute therapy dominates
with 78 per cent share
• New products launched in the chronic therapy
segment outnumbered acute segment launches
in 2006
• The acute segment is expected to grow at a steady
pace due to its mass therapy nature and unresolved
issues o sanitation and hygiene in the country
n Acute 2006 share n Chronic 2006 share
GSK
Alkem Labs
Pizer India
Aristro Pharma
Ranbaxy
Nicholas Piramal
Industry
Zydus Cadila
Cipla
Sanoi Aventis
Sun Pharma
0 20 30 40 50 60 70 80 90 10010
percent
MARKET OVERVIEWPHARMACEUTICALS • December 2008
5/14/2018 pharma010709-090504162215-phpapp02 - slidepdf.com
http://slidepdf.com/reader/full/pharma010709-090504162215-phpapp02 8/88
www.ibe.org
Acute therapy dominates sales, chronic segment to uel growth
Key drivers o chronic therapy segments
• Growing geriatric population: 4.9 per cent o total
Indian population in 2005 consisted o 65+ age
group. This is urther expected to increase
to 6.4 per cent by 2015 and 7.5 per cent by 2020
• Rapid urbanisation: An increasing number
o people are suering rom liestyle diseases such
as diabetes, obesity, depression, etc., due to rapid
urbanisation. The urban population has grown
by 31 per cent in a decade – rom 217 million
in 1991 to 285 million in 2001 – as against 18 per cent
population growth in rural areas.
MARKET OVERVIEWPHARMACEUTICALS • December 2008
5/14/2018 pharma010709-090504162215-phpapp02 - slidepdf.com
http://slidepdf.com/reader/full/pharma010709-090504162215-phpapp02 9/88
www.ibe.org
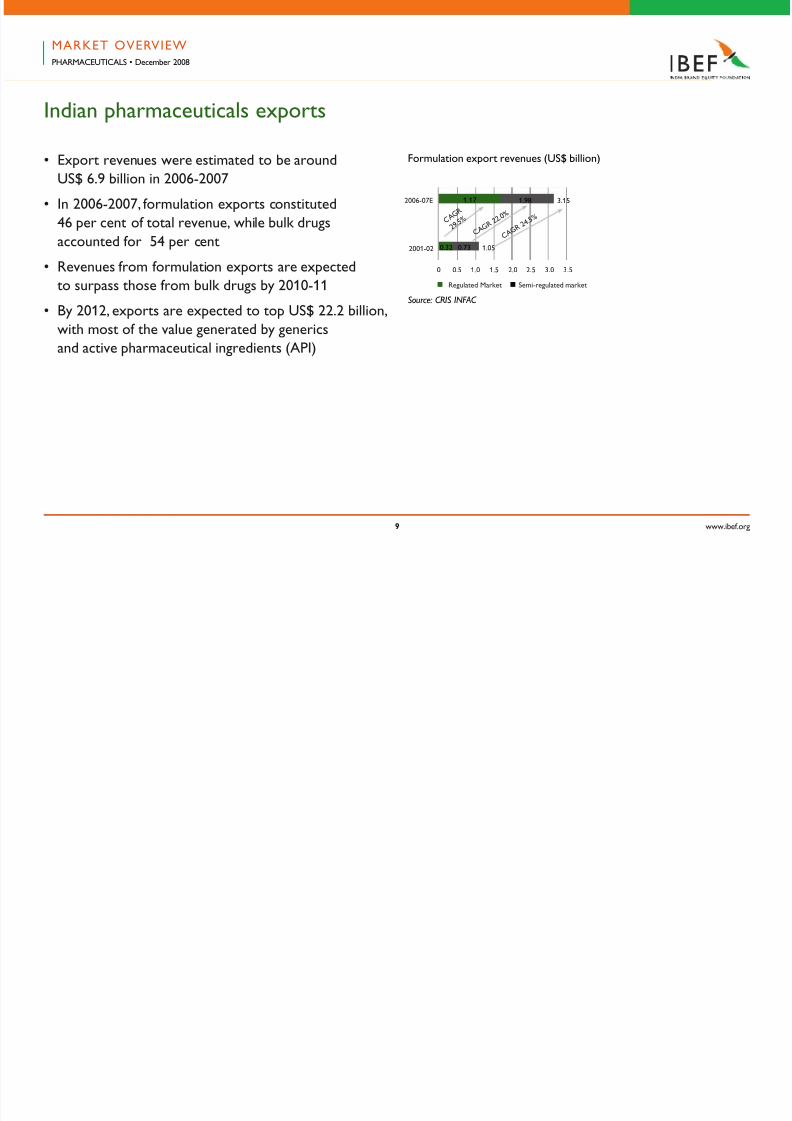
Indian pharmaceuticals exports
• Export revenues were estimated to be around
US$ 6.9 billion in 2006-2007
• In 2006-2007, ormulation exports constituted
46 per cent o total revenue, while bulk drugs
accounted or 54 per cent
• Revenues rom ormulation exports are expected
to surpass those rom bulk drugs by 2010-11
• By 2012, exports are expected to top US$ 22.2 billion,
with most o the value generated by generics
and active pharmaceutical ingredients (API)
Formulation export revenues (US$ billion)
MARKET OVERVIEWPHARMACEUTICALS • December 2008
n Regulated Market n Semi-regulated market
Source: CRIS INFAC
2006-07E
2001-02
0 1.0 1.5 2.0 2.5 3.0 3.50.5
3.151.17
0.730.32
C A G R
2 9. 5 %
C A G R
2 2. 0 %
1.98
1.05
C A G R
2 4. 5 %
5/14/2018 pharma010709-090504162215-phpapp02 - slidepdf.com
http://slidepdf.com/reader/full/pharma010709-090504162215-phpapp02 10/88
www.ibe.org10
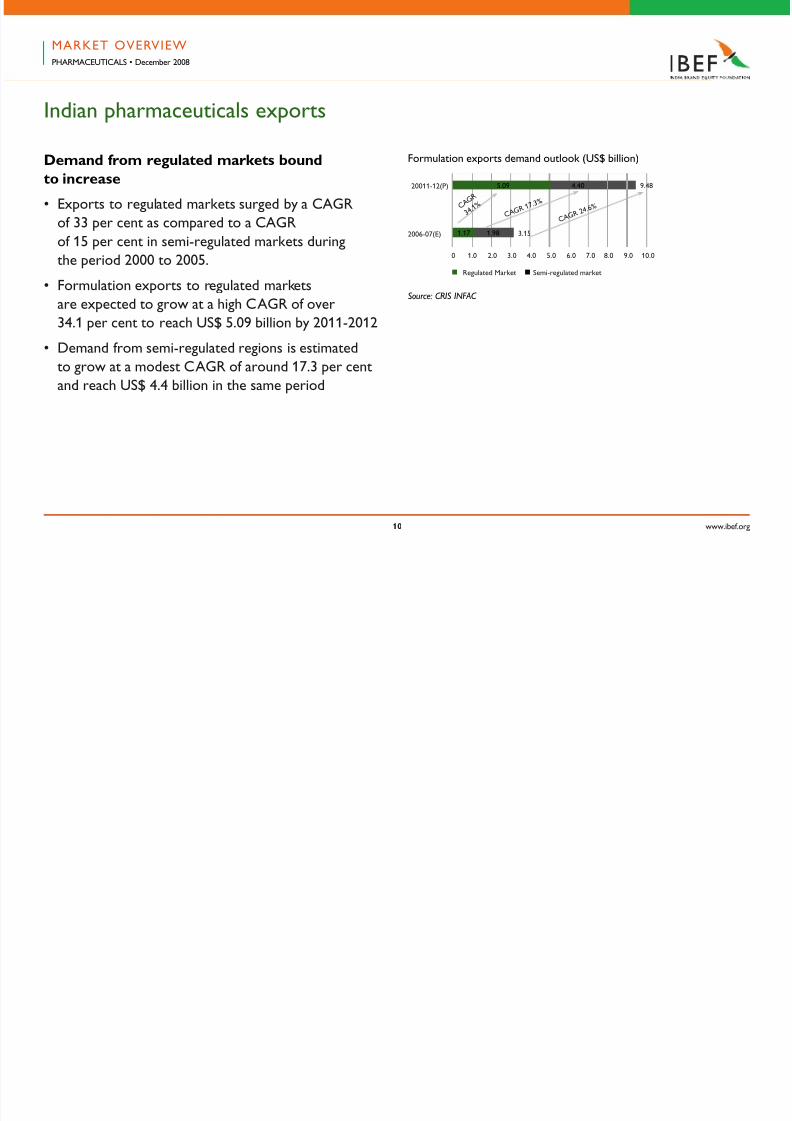
Indian pharmaceuticals exports
Demand rom regulated markets bound
to increase
• Exports to regulated markets surged by a CAGR
o 33 per cent as compared to a CAGR
o 15 per cent in semi-regulated markets during
the period 2000 to 2005.
• Formulation exports to regulated markets
are expected to grow at a high CAGR o over
34.1 per cent to reach US$ 5.09 billion by 2011-2012
• Demand rom semi-regulated regions is estimated
to grow at a modest CAGR o around 17.3 per cent
and reach US$ 4.4 billion in the same period
Formulation exports demand outlook (US$ billion)
Source: CRIS INFAC
MARKET OVERVIEWPHARMACEUTICALS • December 2008
n Regulated Market n Semi-regulated market
20011-12(P)
2006-07(E)
0 2.0 3.0 4.0 5.0 6.0 7.01.0
4.40
1.981.17
C A G R
3 4. 1 %
CA G R
1 7. 3 %
3.15
CA G R
2 4. 6 %
8.0 9.0 10.0
5.09 9.48
5/14/2018 pharma010709-090504162215-phpapp02 - slidepdf.com
http://slidepdf.com/reader/full/pharma010709-090504162215-phpapp02 11/88
www.ibe.org11
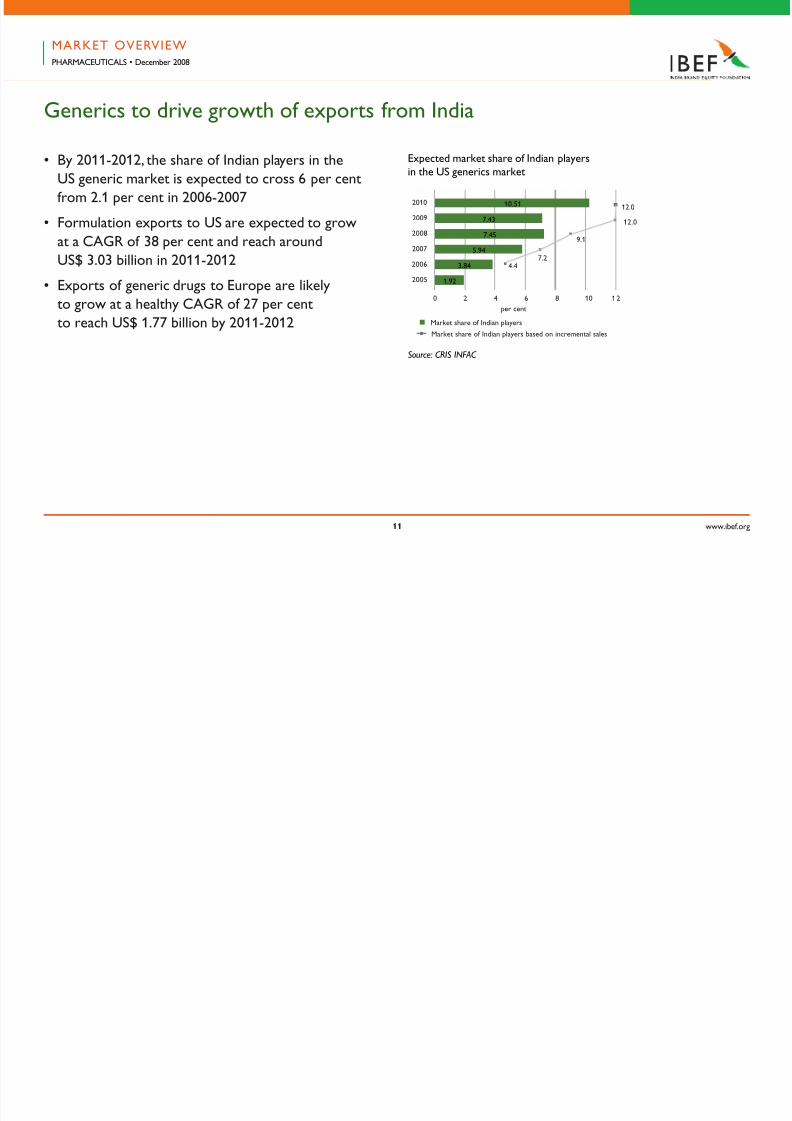
Generics to drive growth o exports rom India
• By 2011-2012, the share o Indian players in the
US generic market is expected to cross 6 per cent
rom 2.1 per cent in 2006-2007
• Formulation exports to US are expected to grow
at a CAGR o 38 per cent and reach around
US$ 3.03 billion in 2011-2012
• Exports o generic drugs to Europe are likely
to grow at a healthy CAGR o 27 per cent
to reach US$ 1.77 billion by 2011-2012
Expected market share o Indian playersin the US generics market
n Market share o Indian players
Market share o Indian players based on incremental sales
Source: CRIS INFAC
2010
2009
2008
2007
2006
2005
0 2 4 6 8 10 12
10.51 12.0
12.0
9.1
7.24.4
7.43
7.45
5.94
3.84
1.92
per cent
MARKET OVERVIEWPHARMACEUTICALS • December 2008
5/14/2018 pharma010709-090504162215-phpapp02 - slidepdf.com
http://slidepdf.com/reader/full/pharma010709-090504162215-phpapp02 12/88
www.ibe.org1
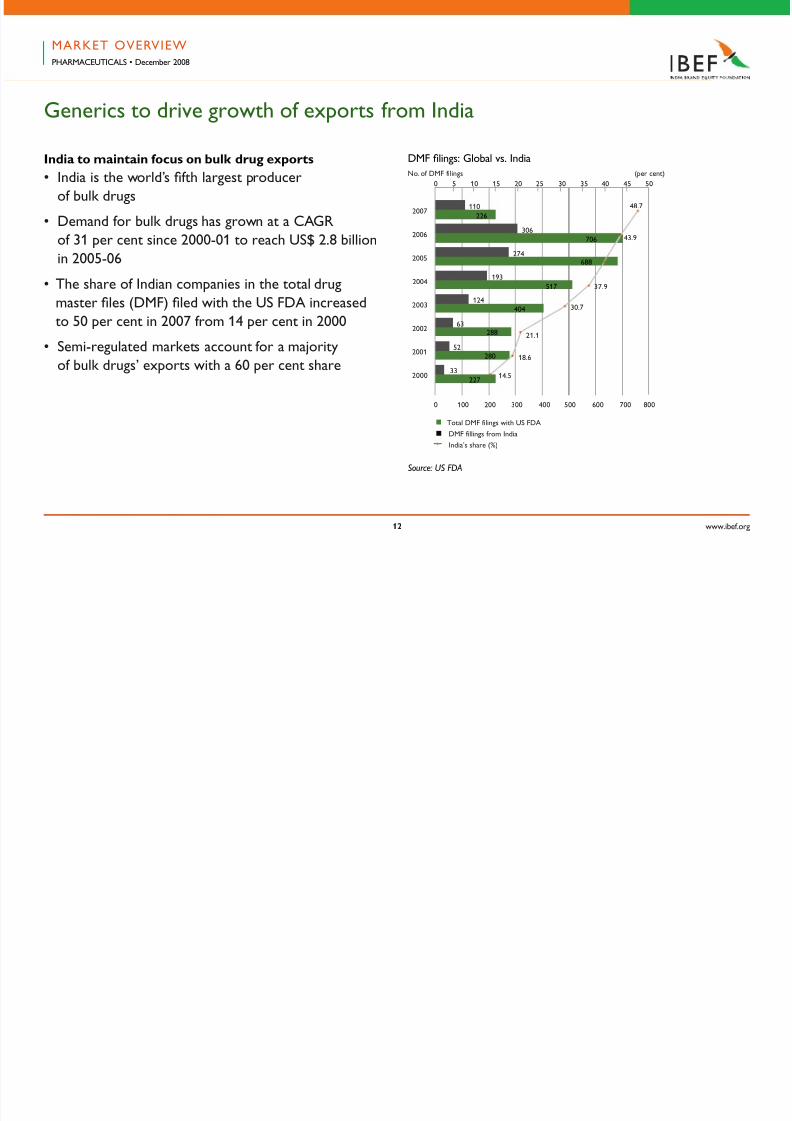
Generics to drive growth o exports rom India
India to maintain ocus on bulk drug exports
• India is the world’s fth largest producer
o bulk drugs
• Demand or bulk drugs has grown at a CAGR
o 31 per cent since 2000-01 to reach US$ 2.8 billion
in 2005-06
• The share o Indian companies in the total drug
master fles (DMF) fled with the US FDA increased
to 50 per cent in 2007 rom 14 per cent in 2000
• Semi-regulated markets account or a majority
o bulk drugs’ exports with a 60 per cent share
DMF flings: Global vs. India
Source: US FDA
MARKET OVERVIEWPHARMACEUTICALS • December 2008
2005
2004
2001
2000
2003404
2002
0 100 200 300 400 600 700500 800
2006
2007
0 5 10 15 20 30 3525 5040 45
227
33
28052
28863
193517
124
274688
706306
110
226
14.5
18.6
21.1
30.7
37.9
43.9
48.7
n Total DMF ilings with US FDA
n DMF illings rom India
India’s share (%)
No. o DMF ilings (per cent)
5/14/2018 pharma010709-090504162215-phpapp02 - slidepdf.com
http://slidepdf.com/reader/full/pharma010709-090504162215-phpapp02 13/88
www.ibe.org1
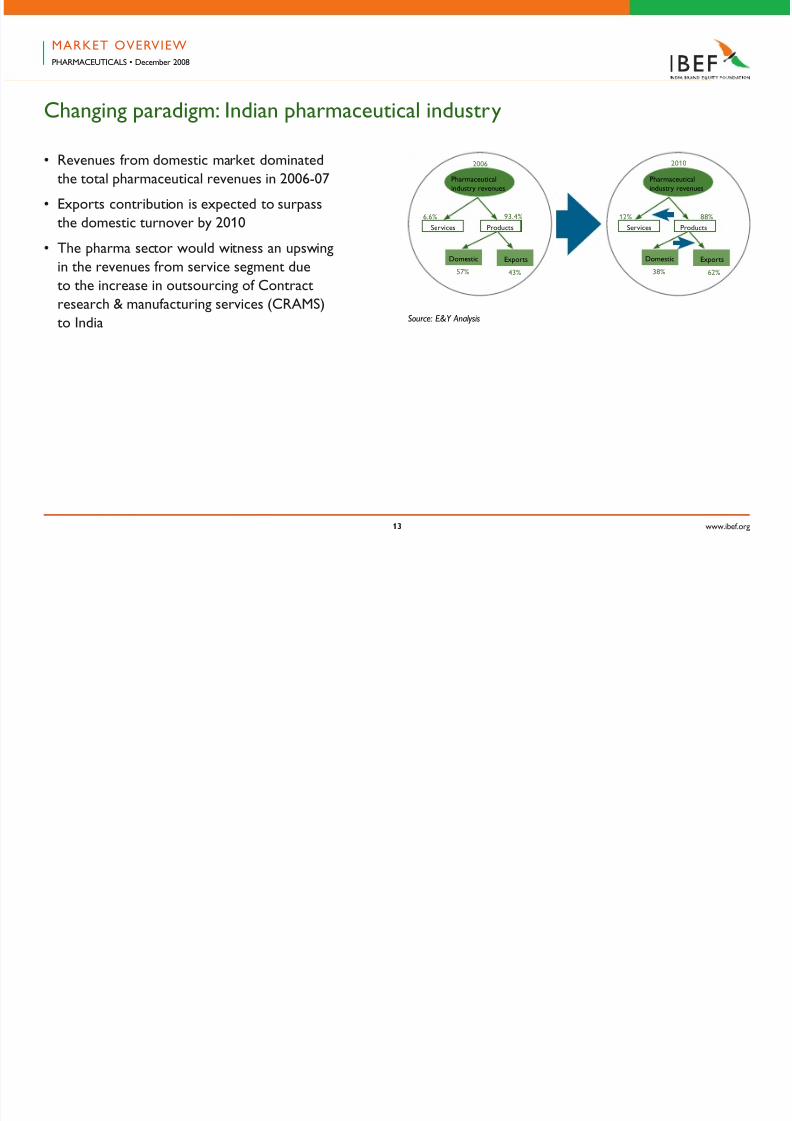
Changing paradigm: Indian pharmaceutical industry
• Revenues rom domestic market dominated
the total pharmaceutical revenues in 2006-07
• Exports contribution is expected to surpass
the domestic turnover by 2010
• The pharma sector would witness an upswing
in the revenues rom service segment due
to the increase in outsourcing o Contract
research & manuacturing services (CRAMS)
to India
Pharmaceuticalindustry revenues
Services Products
Domestic Exports
Pharmaceuticalindustry revenues
Services Products
Domestic Exports
2006 2010
12% 88%
38% 62%
6.6% 93.4%
57% 43%
Source: E&Y Analysis
MARKET OVERVIEWPHARMACEUTICALS • December 2008
5/14/2018 pharma010709-090504162215-phpapp02 - slidepdf.com
http://slidepdf.com/reader/full/pharma010709-090504162215-phpapp02 14/88
www.ibe.org1
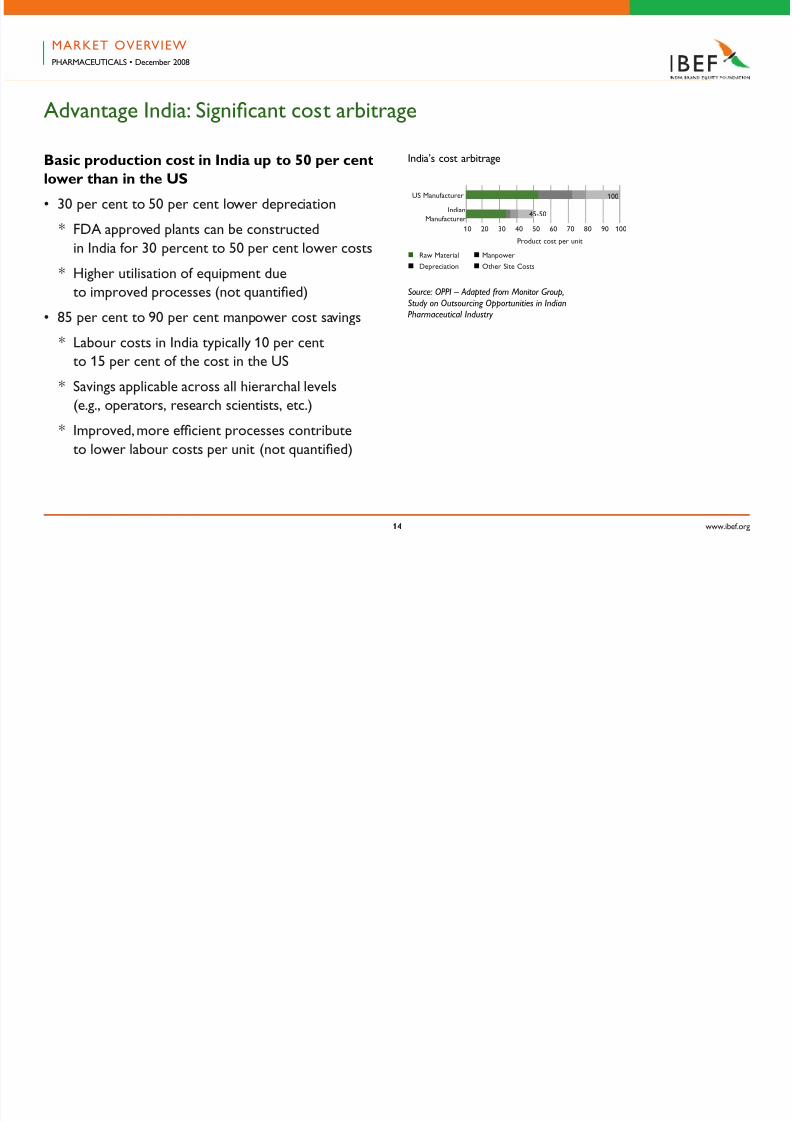
Advantage India: Signifcant cost arbitrage
Basic production cost in India up to 0 per cent
lower than in the US
• 30 per cent to 50 per cent lower depreciation
* FDA approved plants can be constructed
in India or 30 percent to 50 per cent lower costs
* Higher utilisation o equipment dueto improved processes (not quantifed)
• 85 per cent to 90 per cent manpower cost savings
* Labour costs in India typically 10 per cent
to 15 per cent o the cost in the US
* Savings applicable across all hierarchal levels
(e.g., operators, research scientists, etc.)
* Improved, more efcient processes contribute
to lower labour costs per unit (not quantifed)
India’s cost arbitrage
Source: OPPI – Adapted from Monitor Group,
Study on Outsourcing Opportunities in IndianPharmaceutical Industry
n Raw Material n Manpower
n Depreciation n Other Site Costs
Product cost per unit
IndianManuacturer
100US Manuacturer
10 20 30 40 50 60 70 80 90 100
45-50
MARKET OVERVIEWPHARMACEUTICALS • December 2008
5/14/2018 pharma010709-090504162215-phpapp02 - slidepdf.com
http://slidepdf.com/reader/full/pharma010709-090504162215-phpapp02 15/88
www.ibe.org1
Advantage India: Signifcant cost arbitrage
• 40 per cent to 50 per cent savings in raw materials
* Bulk drugs can be manuactured in house
at 40 per cent to 50 per cent o ethicals’ cost
* Excipients and intermediates sourced locally
at 20-30 per cent lower costs
* Most other raw materials can be sourcedinternally and rom China
MARKET OVERVIEWPHARMACEUTICALS • December 2008
5/14/2018 pharma010709-090504162215-phpapp02 - slidepdf.com
http://slidepdf.com/reader/full/pharma010709-090504162215-phpapp02 16/88
www.ibe.org1
Established inrastructure or pharma R&D and manuacturing
Ahmedabad
Ankleshwar,
Vapi
Vadodara
Mumbai
Tarapur
Aurangabad
Pune
Hyderabad,
Medak
Vizag
Chennai
Pondicherry
Baddi
Bangalore
Mysore
Goa
Pantnagar
Haridawar
Ahmedabad
Ankleshwar,
Vapi
Vadodara
Mumbai
Tarapur
Aurangabad
Pune
Hyderabad,
Medak
Vizag
Chennai
Pondicherry
Baddi
Bangalore
Mysore
Goa
Pantnagar
Haridawar
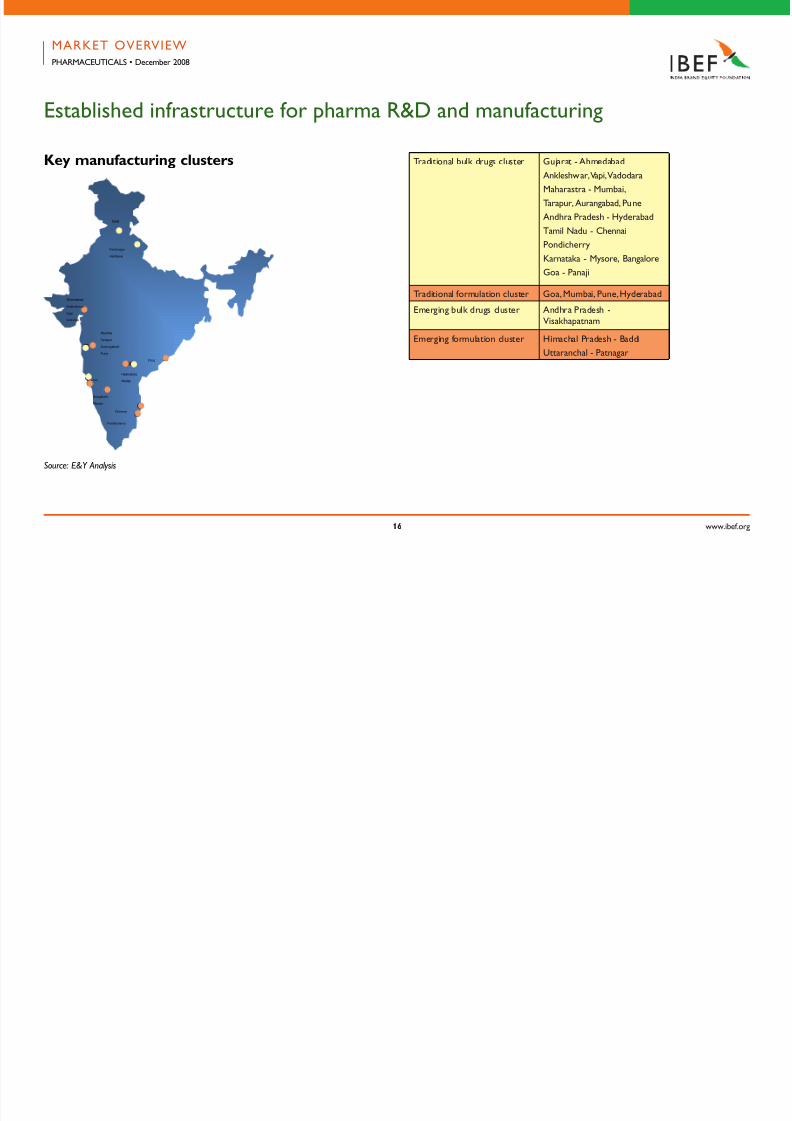
Key manuacturing clusters
Source: E&Y Analysis
Traditional bulk drugs cluster Gujarat - Ahmedabad
Ankleshwar, Vapi, Vadodara
Maharastra - Mumbai,
Tarapur, Aurangabad, Pune
Andhra Pradesh - Hyderabad
Tamil Nadu - Chennai
Pondicherry
Karnataka - Mysore, Bangalore
Goa - Panaji
Traditional ormulation cluster Goa, Mumbai, Pune, Hyderabad
Emerging bulk drugs cluster Andhra Pradesh -Visakhapatnam
Emerging ormulation cluster Himachal Pradesh - Baddi
Uttaranchal - Patnagar
MARKET OVERVIEWPHARMACEUTICALS • December 2008
5/14/2018 pharma010709-090504162215-phpapp02 - slidepdf.com
http://slidepdf.com/reader/full/pharma010709-090504162215-phpapp02 17/88
www.ibe.org1
Established inrastructure or pharma R&D and manuacturing
Ahmedabad
Mumbai
Aurangabad
Pune
Hyderabad,
Chennai
NCR
Bangalore
Ahmedabad
Mumbai
Aurangabad
Pune
Hyderabad,
Chennai
NCR
Bangalore
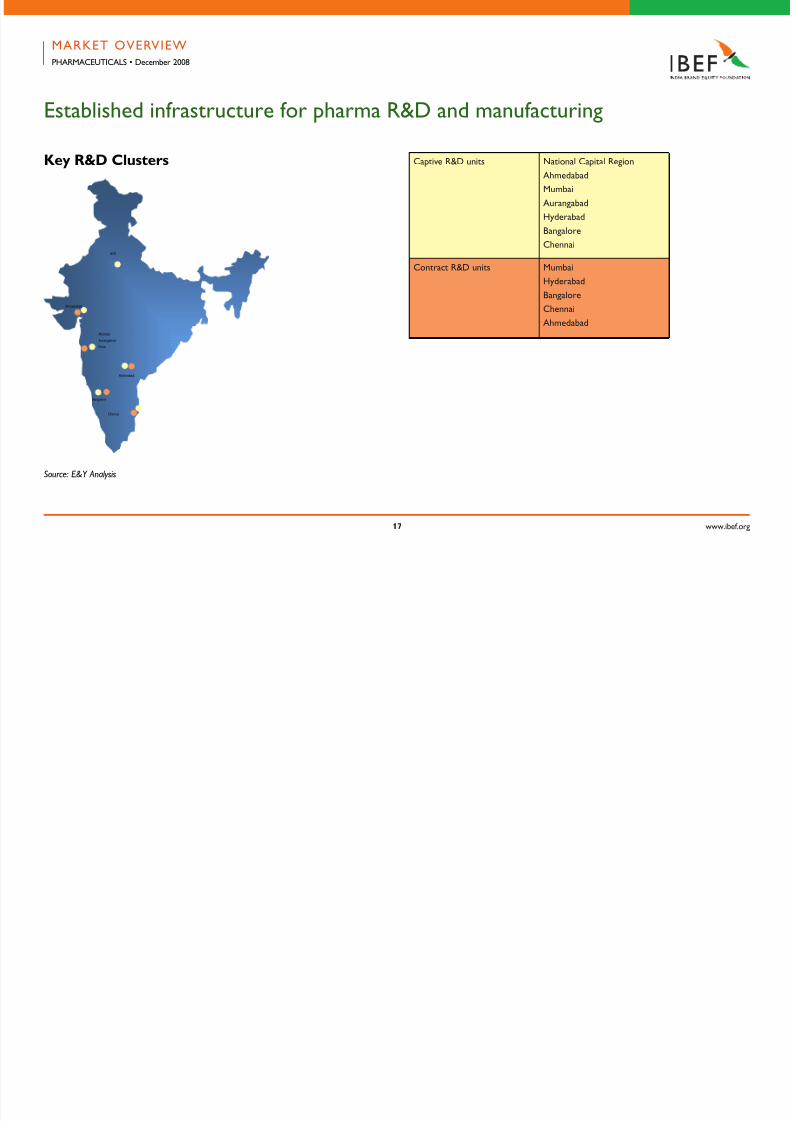
Key R&D Clusters
Source: E&Y Analysis
Captive R&D units National Capital Region
Ahmedabad
Mumbai
Aurangabad
Hyderabad
Bangalore
Chennai
Contract R&D units Mumbai
Hyderabad
Bangalore
Chennai
Ahmedabad
MARKET OVERVIEWPHARMACEUTICALS • December 2008
5/14/2018 pharma010709-090504162215-phpapp02 - slidepdf.com
http://slidepdf.com/reader/full/pharma010709-090504162215-phpapp02 18/88
www.ibe.org1
Enabling research inrastructure
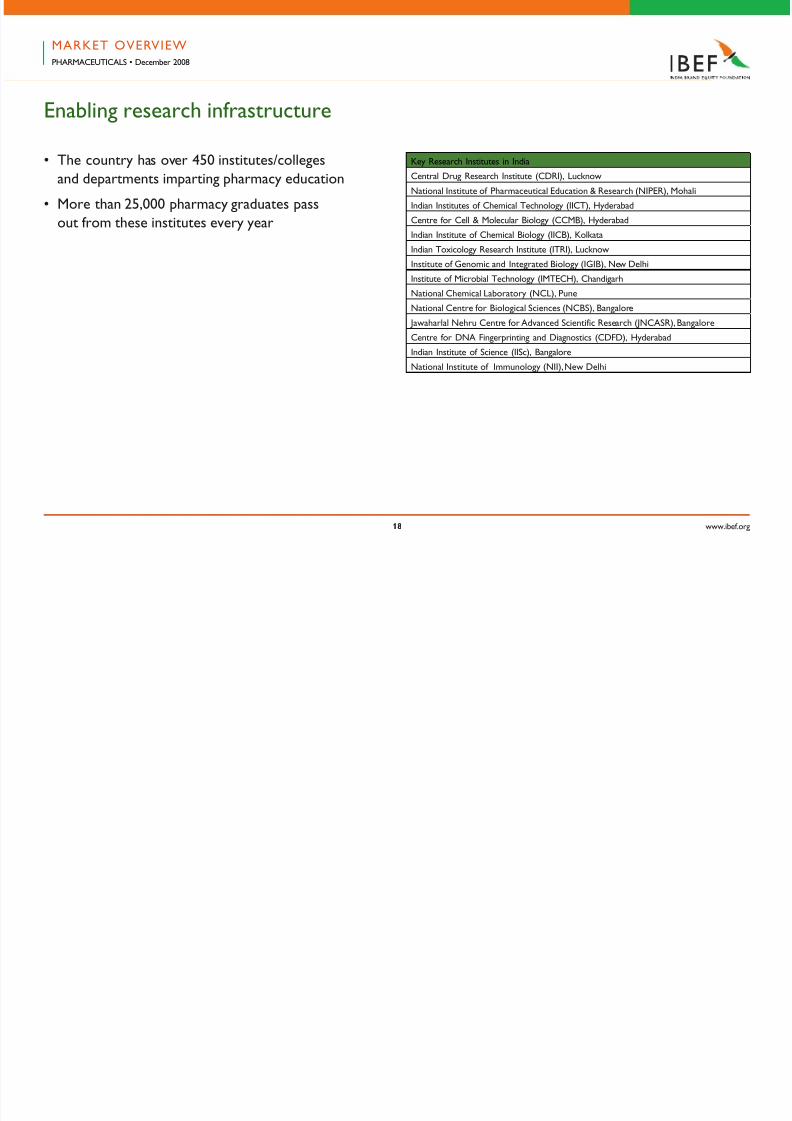
• The country has over 450 institutes/colleges
and departments imparting pharmacy education
• More than 25,000 pharmacy graduates pass
out rom these institutes every year
Key Research Institutes in India
Central Drug Research Institute (CDRI), Lucknow
National Institute o Pharmaceutical Education & Research (NIPER), Mohali
Indian Institutes o Chemical Technology (IICT), Hyderabad
Centre or Cell & Molecular Biology (CCMB), Hyderabad
Indian Institute o Chemical Biology (IICB), Kolkata
Indian Toxicology Research Institute (ITRI), Lucknow
Institute o Genomic and Integrated Biology (IGIB), New Delhi
Institute o Microbial Technology (IMTECH), ChandigarhNational Chemical Laboratory (NCL), Pune
National Centre or Biological Sciences (NCBS), Bangalore
Jawaharlal Nehru Centre or Advanced Scientiic Research (JNCASR), Bangalore
Centre or DNA Fingerprinting and Diagnostics (CDFD), Hyderabad
Indian Institute o Science (IISc), Bangalore
National Institute o Immunology (NII), New Delhi
MARKET OVERVIEWPHARMACEUTICALS • December 2008
5/14/2018 pharma010709-090504162215-phpapp02 - slidepdf.com
http://slidepdf.com/reader/full/pharma010709-090504162215-phpapp02 19/88
www.ibe.org1
Source: CRIS INFAC
Enabling research inrastructure
Talent statistics
• Around 1,000 biotech and biochemistry
postgraduates pass out every year
• Around 10,000 chemistry postgraduate
students every year
• Around 2,500 chemical engineering studentspass out every year. India had a pool o around
50,000 chemical engineering graduates till 2004-05
• Around 4,500 students pursue PhDs in various
science streams
• 1,000 students pursue PhDs
in engineering stream
• 1,000 students pursue PhDs in chemistry
MARKET OVERVIEWPHARMACEUTICALS • December 2008
5/14/2018 pharma010709-090504162215-phpapp02 - slidepdf.com
http://slidepdf.com/reader/full/pharma010709-090504162215-phpapp02 20/88
www.ibe.org0
Enabling research inrastructure
Case study: Government to introduce
our more NIPERS
• The National Institute o Pharmaceutical
Education and Research, India, was established
by the Government o India to cater to the
long-standing demand or setting up a dedicated
nodal institution or quality higher educationand advanced research in the pharmaceutical
sciences. The benefts delivered by NIPER
prompted the Government to set up our
new NIPERs at Kolkata, Ahmedabad, Hyderabad
and Hajipur (Bihar) in 2007
MARKET OVERVIEWPHARMACEUTICALS • December 2008
5/14/2018 pharma010709-090504162215-phpapp02 - slidepdf.com
http://slidepdf.com/reader/full/pharma010709-090504162215-phpapp02 21/88
1
www.ibe.org
POLICY
5/14/2018 pharma010709-090504162215-phpapp02 - slidepdf.com
http://slidepdf.com/reader/full/pharma010709-090504162215-phpapp02 22/88
www.ibe.org
Regulatory ramework
• The main regulatory body in India is the Central
Drug Standard Control Organization (CDSCO)
under the Ministry o Health and Family Welare
• CDSCO is presided over by the Drug Controller-
General o India (DCGI), who is in charge o approval
o licenses or drugs at both the Central and
state levels
• India introduced the product patent regime,
in accordance with the TRIPS agreement, in January
2005 with an amendment to the patent act
• Foreign direct investment (FDI) up to 100 per cent
is permitted through the automatic route in drugs
and pharmaceuticals
POLICYPHARMACEUTICALS • December 2008
Source: “India Pharmaceuticals and Healthcare Report Q2 2008”, Business Monitor International
5/14/2018 pharma010709-090504162215-phpapp02 - slidepdf.com
http://slidepdf.com/reader/full/pharma010709-090504162215-phpapp02 23/88
www.ibe.org
Regulatory ramework
• For licensable drugs and pharmaceuticals
manuactured by recombinant DNA technology
and specifc cell/tissue targeted ormulations,
FDI needs prior government approvals
• The industry is undergoing consolidation due
to recent legislation and policy updates:
• Manuacturing unit should adhere to good
manuacturing practices (GMP) outlined in
Schedule M o the Drugs and Cosmetics Act
• Manuacturing units are required to comply
with the WHO and international standards
o production
• National Pharmaceutical Pricing Authority (NPPA)is responsible or fxing and controlling the prices
o 74 bulk drugs and ormulations under the Essential
Commodities Act
POLICYPHARMACEUTICALS • December 2008
Source: “India Pharmaceuticals and Healthcare Report Q2 2008”, Business Monitor International
5/14/2018 pharma010709-090504162215-phpapp02 - slidepdf.com
http://slidepdf.com/reader/full/pharma010709-090504162215-phpapp02 24/88
www.ibe.org
Drug regulatory environment in India in transition
Existing drug regulatory system
• India has a biurcated drug regulatory system.
Regulatory unctions are divided between the
Centre and state authorities
• Existing inrastructure at the Centre and the
state is inadequate to perorm the assigned
unctions o drug administration with efciency
and speed
POLICYPHARMACEUTICALS • December 2008
5/14/2018 pharma010709-090504162215-phpapp02 - slidepdf.com
http://slidepdf.com/reader/full/pharma010709-090504162215-phpapp02 25/88
www.ibe.org
Drug regulatory environment in India in transition
Proposed new system
• The Central Cabinet approved the ormation
o the Central Drug Authority (CDA) in January 2007
• Proposed organisational structure o the
CDA would be analogous to the US FDA
• It would be a strong, well equipped, empowered,independent and proessionally managed body
• It is expected to acilitate upgradation
o the national drugs regulator, uniormity
o licencing, and enorcement and improvement
in drug regulations
• Efciency and efcacy o drug administration
is expected to be much ater this transition
POLICYPHARMACEUTICALS • December 2008
5/14/2018 pharma010709-090504162215-phpapp02 - slidepdf.com
http://slidepdf.com/reader/full/pharma010709-090504162215-phpapp02 26/88
www.ibe.org
CDA – India’s new drug regulator
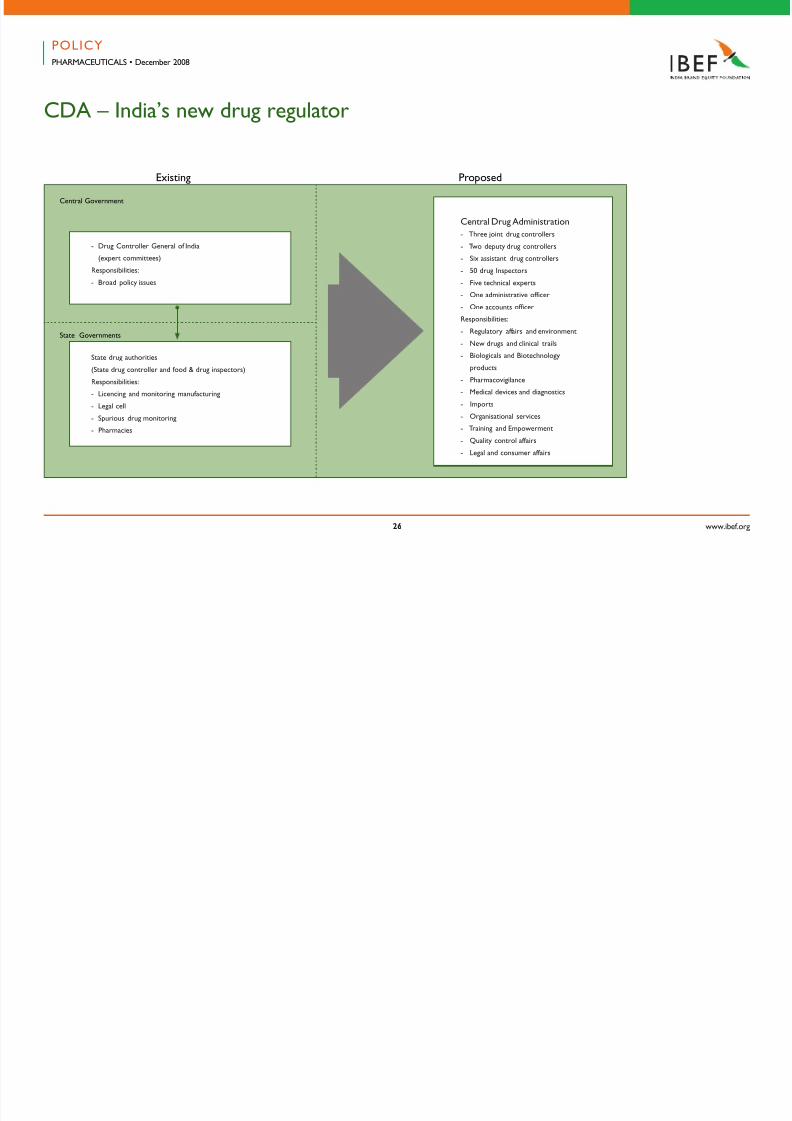
Existing Proposed
Central Drug Administration
- Three joint drug controllers
- Two deputy drug controllers
- Six assistant drug controllers
- 50 drug Inspectors
- Five technical experts
- One administrative oicer
- One accounts oicer
Responsibilities:
- Regulatory aairs and environment
- New drugs and clinical trails
- Biologicals and Biotechnology
products
- Pharmacovigilance
- Medical devices and diagnostics
- Imports
- Organisational services- Training and Empowerment
- Quality control aairs
- Legal and consumer aairs
- Drug Controller General o India
(expert committees)
Responsibilities:
- Broad policy issues
State drug authorities
(State drug controller and ood & drug inspectors)
Responsibilities:
- Licencing and monitoring manuacturing
- Legal cell
- Spurious drug monitoring
- Pharmacies
Central Government
State Governments
POLICYPHARMACEUTICALS • December 2008
5/14/2018 pharma010709-090504162215-phpapp02 - slidepdf.com
http://slidepdf.com/reader/full/pharma010709-090504162215-phpapp02 27/88
www.ibe.org
Budget 2007-2008: Pharmaceutical industry perspective
Budget measures
• Increase in allocation to the health sector
by 15 per cent over 2007-2008
• Allocation to the National Rural Health Mission
(NRHM) increased to US$ 29.3 billion
• Provision o US$ 2.4 billion to the National AidsControl Programme and allocation o US$ 2.5 billion
or eradication o polio with ocus on high-risk
districts in Uttar Pradesh and Bihar
• Customs duty to be reduced rom 10 per cent
to fve per cent on certain specifed lie saving
drugs and on bulk drugs used or their manuacture;
these drugs also exempted rom excise dutyor countervailing duty
POLICYPHARMACEUTICALS • December 2008
Note: Exchange rate 1US$ = INR 41
5/14/2018 pharma010709-090504162215-phpapp02 - slidepdf.com
http://slidepdf.com/reader/full/pharma010709-090504162215-phpapp02 28/88
www.ibe.org
Budget 2007-2008: Pharmaceutical industry perspective
Budget measures
• Excise duty on all goods produced
in the pharmaceutical sector reduced
rom 16 per cent to eight per cent
• Anti-AIDS drug, ‘Atazanavir’, as well as bulk drugs
or its manuacture to be exempted rom excise duty
• In order to promote outsourcing o research,
weighted deduction o 125 per cent on any payment
made to companies engaged in R&D
POLICYPHARMACEUTICALS • December 2008
Note: Exchange rate 1US$ = INR 41
5/14/2018 pharma010709-090504162215-phpapp02 - slidepdf.com
http://slidepdf.com/reader/full/pharma010709-090504162215-phpapp02 29/88
www.ibe.org
Budget 2007-2008: Pharmaceutical industry perspective
Budget impact
• Increase in allocation to the healthcare sector
is a positive given the need to ramp up healthcare
inrastructure in the country and improve the
accessibility o quality healthcare to a larger section
o the population
• Reduction o excise duty rom 16 per cent to eightper cent positively impacts all pharma companies
enabling them to boost proftability given that the
excise duty is being paid on MRP.
• Increased allocation o unds or eradication o HIV/
AIDS and polio and reduction in customs duty on
certain lie saving drugs rom 10 to fve per cent
would help companies having product pipelinecatering to these segments.
POLICYPHARMACEUTICALS • December 2008
Note: Exchange rate 1US$ = INR 41
5/14/2018 pharma010709-090504162215-phpapp02 - slidepdf.com
http://slidepdf.com/reader/full/pharma010709-090504162215-phpapp02 30/88
www.ibe.org0
Budget 2007-2008: Pharmaceutical industry perspective
Budget impact
• Weighted deduction o 125 per cent on payments
made or outsourcing research services is a positive
or the sector as a whole given that the emphasis
on R&D has increased
• Government would provide US$ 5.2 billion
or establishing and developing six NationalInstitutes o Pharmaceutical Education
and Research (NIPERs) in the next fve years.
POLICYPHARMACEUTICALS • December 2008
Note: Exchange rate 1US$ = INR 41
5/14/2018 pharma010709-090504162215-phpapp02 - slidepdf.com
http://slidepdf.com/reader/full/pharma010709-090504162215-phpapp02 31/88
1
www.ibe.org
KEY TRENDS AND DRIVERS
5/14/2018 pharma010709-090504162215-phpapp02 - slidepdf.com
http://slidepdf.com/reader/full/pharma010709-090504162215-phpapp02 32/88
www.ibe.org
Increasing penetration driving growth
• Expansion o healthcare acilities in the rural
and ar ung areas has enhanced accessibility
• Increased government spending on roads,
telecommunication and health inrastructure
has acilitated the oray o pharmaceutical
companies into relatively distant pocketso the market
• With sales revenues o US$ 1.4 billion, Indian
pharmaceutical market in rural areas witnessed
a growth o 39 per cent as compared to the growth
o 18 per cent in the overall domestic market
in November 2006*
• New product launches in 2006-07 contributed
to only 1 per cent o the market while 15 per cent
o the growth is being contributed by volume growth
Changing growth undamentals o domestic market
*Source: The Economic Times, January 26, 2007
KEY TRENDS AND DRIVERSPHARMACEUTICALS • December 2008
5/14/2018 pharma010709-090504162215-phpapp02 - slidepdf.com
http://slidepdf.com/reader/full/pharma010709-090504162215-phpapp02 33/88
www.ibe.org
** Source: E&Y FICCI Healthcare Report
Changing growth undamentals o domestic market
Expansion o private sector healthcare
driving accessibility
• Medical value travel has led to an investment
spurt in the private healthcare services
in the country
• There has been accelerated investment rom
the private sector in healthcare acilities acrosstier-I and tier-II cities in the country
• Estimated one million beds would be added
by 2012 taking the total beds available in the
country to over two million**
KEY TRENDS AND DRIVERSPHARMACEUTICALS • December 2008
5/14/2018 pharma010709-090504162215-phpapp02 - slidepdf.com
http://slidepdf.com/reader/full/pharma010709-090504162215-phpapp02 34/88
www.ibe.org
Changing growth undamentals o domestic market
• Estimated US$ 69.7 billion would be invested
by private sector in healthcare inrastructure
by 2012
• Number o patients visiting Indian hospitals
is expected to rise by 30 per cent to 22 million
by 2015
KEY TRENDS AND DRIVERSPHARMACEUTICALS • December 2008
5/14/2018 pharma010709-090504162215-phpapp02 - slidepdf.com
http://slidepdf.com/reader/full/pharma010709-090504162215-phpapp02 35/88
www.ibe.org
Changing growth undamentals o domestic market
Increasing penetration o medical insurance
• Penetration o medical insurance would grow
at a higher pace due to increasing inux
o oreign players
• Favourable regulatory changes such as permitting
Foreign Direct Investment (FDI) o 51 per cent in the
stand-alone health insurance companies and settingthe minimum capital requirement at US$ 5.4 million
would drive growth in this segment.
• Indian middle class with its increasing purchasing
potential is expected to become a major
buyer segment
• Increasing penetration o customised
insurance plans would drive the aordability,
inuencing the consumption o medical
and healthcare products
KEY TRENDS AND DRIVERSPHARMACEUTICALS • December 2008
5/14/2018 pharma010709-090504162215-phpapp02 - slidepdf.com
http://slidepdf.com/reader/full/pharma010709-090504162215-phpapp02 36/88
www.ibe.org
Rising disposable income to drive drug consumption
• 16.4 million middle class households with
annual income ranging between US$ 4,849
to US$ 24,242 in 2006
• Segment expected to grow at a CAGR o 14 per cent,
to touch 28.4 million by 2010 and be the key
driver o consumption
• 1.7 million households in the upper incomegroup with annual income greater than
US$ 24,242 in 2006
• Aggregated household expenditure on healthcare
services increased at a CAGR o 9.3 per cent
in the period 1993-94 and 2001-02*
• Healthcare expenditure is expected
to rise by 15 per cent per annum*
*Source: E&Y FICCI Healthcare Report
KEY TRENDS AND DRIVERSPHARMACEUTICALS • December 2008
5/14/2018 pharma010709-090504162215-phpapp02 - slidepdf.com
http://slidepdf.com/reader/full/pharma010709-090504162215-phpapp02 37/88
www.ibe.org
Rising disposable income to drive drug consumption
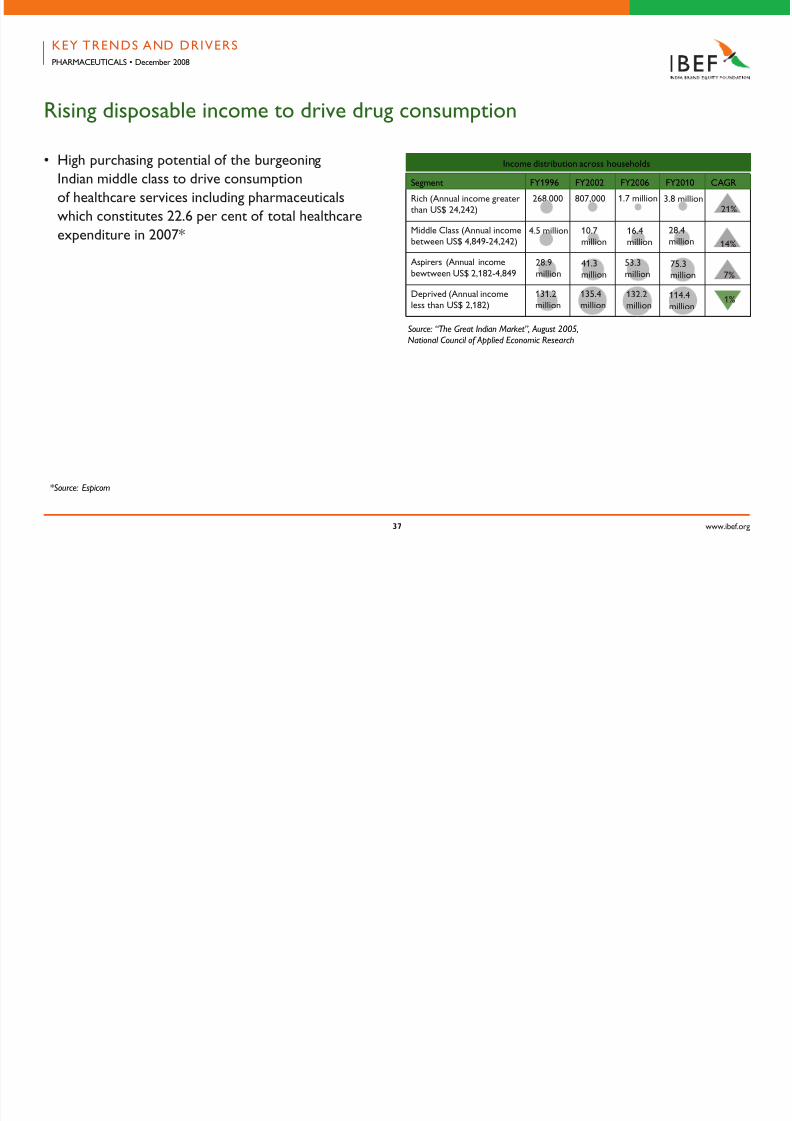
• High purchasing potential o the burgeoning
Indian middle class to drive consumption
o healthcare services including pharmaceuticals
which constitutes 22.6 per cent o total healthcare
expenditure in 2007*
Segment FY1996 FY2002 FY2006 FY2010 CAGR
Rich (Annual income greaterthan US$ 24,242)
807,000
Middle Class (Annual incomebetween US$ 4,849-24,242)
Aspirers (Annual income
bewtween US$ 2,182-4,849
Deprived (Annual incomeless than US$ 2,182)
268,000
4.5 million
28.9million
1.7 million 3.8 million21%
14%
7%
1%131.2
million
135.4
million
41.3million
10.7million
132.2million
53.3million
16.4million
28.4million
75.3million
114.4million
Source: “The Great Indian Market”, August 2005,National Council of Applied Economic Research
Income distribution across households
*Source: Espicom
KEY TRENDS AND DRIVERSPHARMACEUTICALS • December 2008
5/14/2018 pharma010709-090504162215-phpapp02 - slidepdf.com
http://slidepdf.com/reader/full/pharma010709-090504162215-phpapp02 38/88
www.ibe.org
Focus o Indian companies shiting rom the US
• Pricing pressures and shrinking margins in the
generics space and the increasing litigation
instances in the US are compelling Indian companies
to consider opportunities beyond US
• Indian companies have invested more than
US$ 1.2 billion in the European markets
Increasing Focus on Japan
• Japan is the world’s second largest pharmaceutical
market ater the US
• With sales worth US$ 60 billion in 2006,
it constitutes around 11 per cent o the global market
• Generics penetration has been extremely low
till date in Japan
• Government has initiated a string o pro-generics
legislation reorms to increase the penetration
upto 40 per cent rom the present 16 per cent
KEY TRENDS AND DRIVERSPHARMACEUTICALS • December 2008
5/14/2018 pharma010709-090504162215-phpapp02 - slidepdf.com
http://slidepdf.com/reader/full/pharma010709-090504162215-phpapp02 39/88
www.ibe.org
Focus o Indian companies shiting rom the US
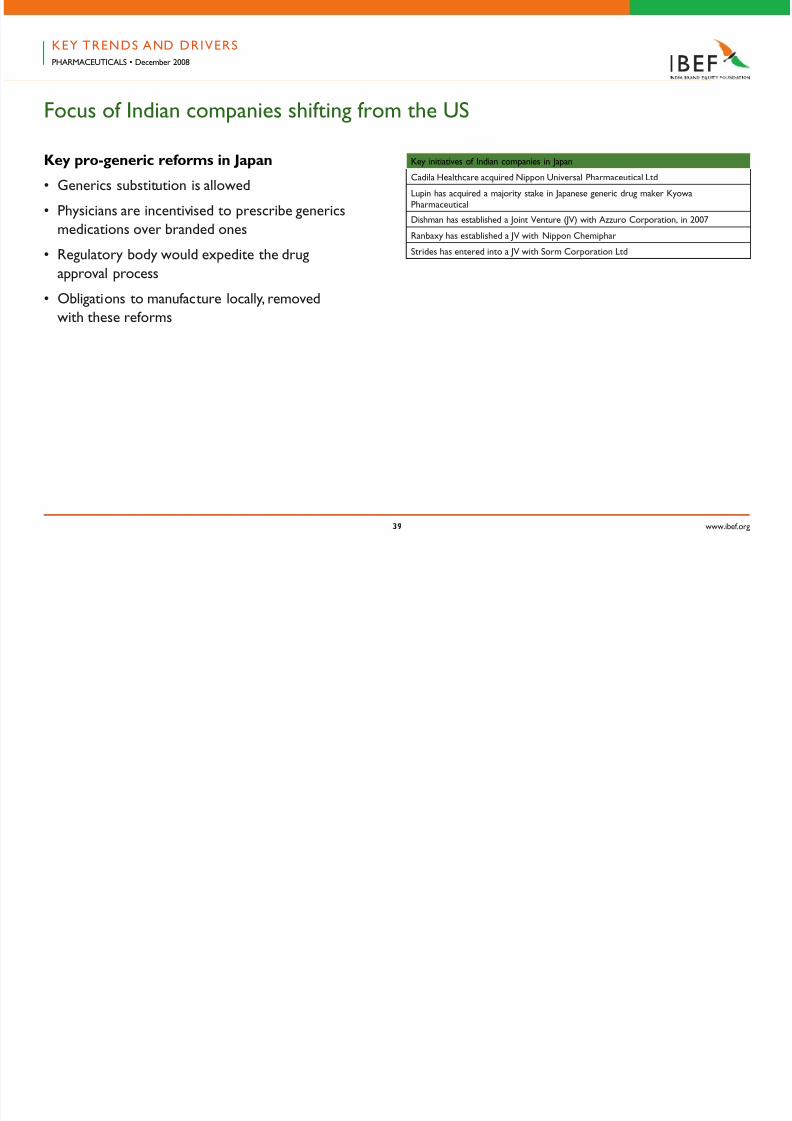
Key pro-generic reorms in Japan
• Generics substitution is allowed
• Physicians are incentivised to prescribe generics
medications over branded ones
• Regulatory body would expedite the drug
approval process
• Obligations to manuacture locally, removed
with these reorms
Key initiatives o Indian companies in Japan
Cadila Healthcare acquired Nippon Universal Pharmaceutical Ltd
Lupin has acquired a majority stake in Japanese generic drug maker KyowaPharmaceutical
Dishman has established a Joint Venture (JV) with Azzuro Corporation, in 2007
Ranbaxy has established a JV with Nippon Chemiphar
Strides has entered into a JV with Sorm Corporation Ltd
KEY TRENDS AND DRIVERSPHARMACEUTICALS • December 2008
5/14/2018 pharma010709-090504162215-phpapp02 - slidepdf.com
http://slidepdf.com/reader/full/pharma010709-090504162215-phpapp02 40/88
www.ibe.org0
Indian companies preerring the inorganic growth route
• M&A has been the key strategy adopted
by Indian companies to gain a oothold
in the export markets
• Large Indian companies have increased their
oothold in the regulated markets
• Small and medium sized players are ocusing
on semi-regulated markets
• Increased penetration, access to established
distribution networks and increase in buyer
confdence due to localised presence, have been
the key actors driving acquisition led growth
KEY TRENDS AND DRIVERSPHARMACEUTICALS • December 2008
5/14/2018 pharma010709-090504162215-phpapp02 - slidepdf.com
http://slidepdf.com/reader/full/pharma010709-090504162215-phpapp02 41/88
www.ibe.org1
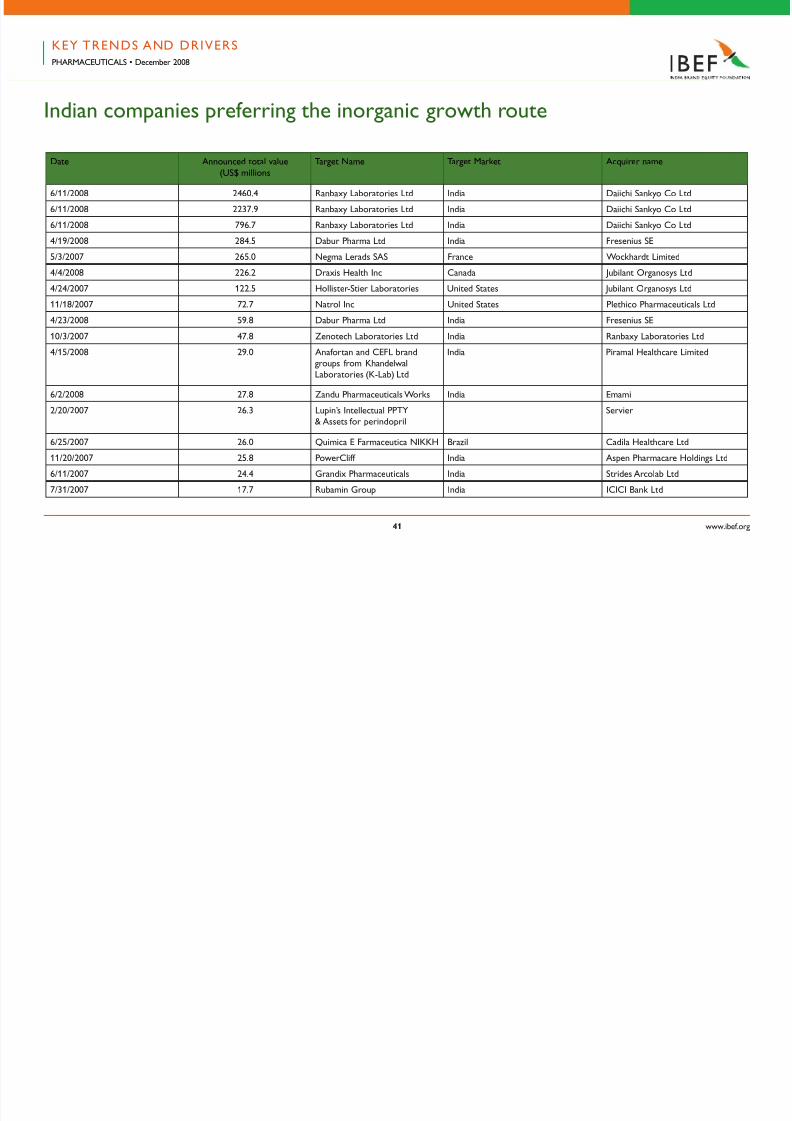
Indian companies preerring the inorganic growth route
Date Announced total value
(US$ millions
Target Name Target Market Acquirer name
6/11/2008 2460.4 Ranbaxy Laboratories Ltd India Daiichi Sankyo Co Ltd
6/11/2008 2237.9 Ranbaxy Laboratories Ltd India Daiichi Sankyo Co Ltd
6/11/2008 796.7 Ranbaxy Laboratories Ltd India Daiichi Sankyo Co Ltd
4/19/2008 284.5 Dabur Pharma Ltd India Fresenius SE
5/3/2007 265.0 Negma Lerads SAS France Wockhardt Limited
4/4/2008 226.2 Draxis Health Inc Canada Jubilant Organosys Ltd
4/24/2007 122.5 Hollister-Stier Laboratories United States Jubilant Organosys Ltd
11/18/2007 72.7 Natrol Inc United States Plethico Pharmaceuticals Ltd
4/23/2008 59.8 Dabur Pharma Ltd India Fresenius SE
10/3/2007 47.8 Zenotech Laboratories Ltd India Ranbaxy Laboratories Ltd
4/15/2008 29.0 Anaortan and CEFL brandgroups rom KhandelwalLaboratories (K-Lab) Ltd
India Piramal Healthcare Limited
6/2/2008 27.8 Zandu Pharmaceuticals Works India Emami
2/20/2007 26.3 Lupin’s Intellectual PPTY
& Assets or perindopril
Servier
6/25/2007 26.0 Quimica E Farmaceutica NIKKH Brazil Cadila Healthcare Ltd
11/20/2007 25.8 PowerCli India Aspen Pharmacare Holdings Ltd
6/11/2007 24.4 Grandix Pharmaceuticals India Strides Arcolab Ltd
7/31/2007 17.7 Rubamin Group India ICICI Bank Ltd
KEY TRENDS AND DRIVERSPHARMACEUTICALS • December 2008
5/14/2018 pharma010709-090504162215-phpapp02 - slidepdf.com
http://slidepdf.com/reader/full/pharma010709-090504162215-phpapp02 42/88
www.ibe.org
PHARMACEUTICALSDecember 2008
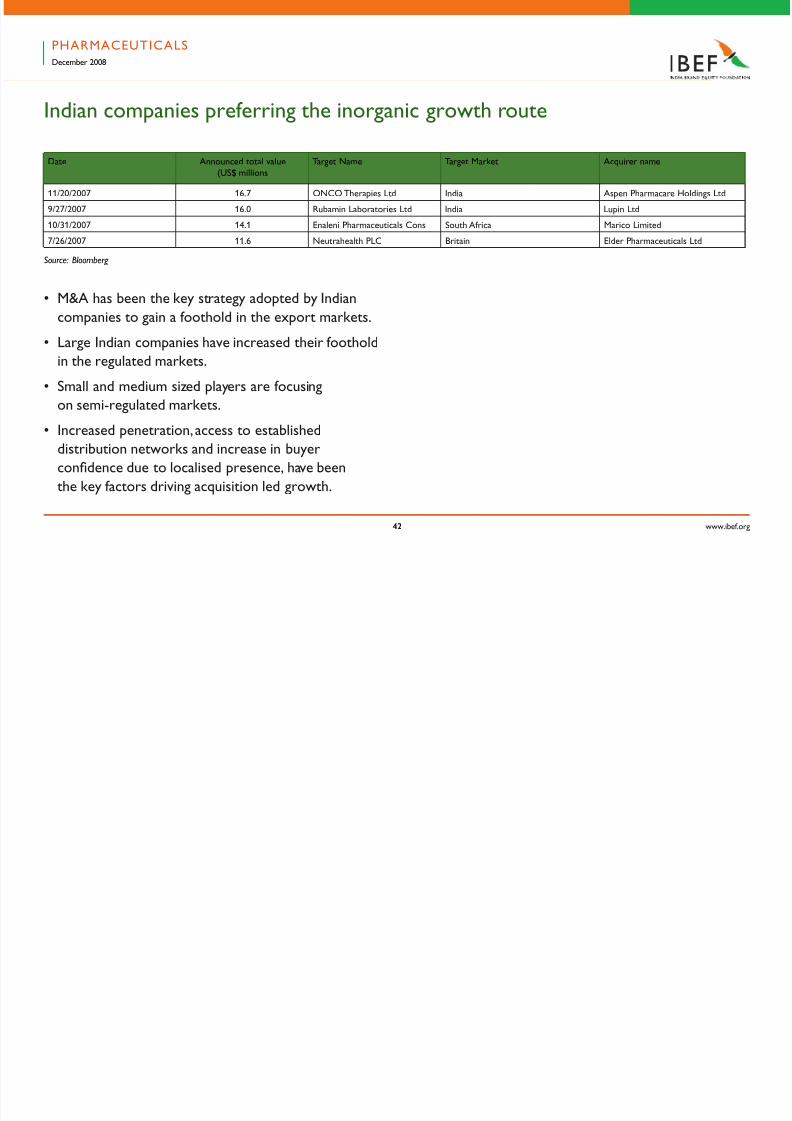
Indian companies preerring the inorganic growth route
Source: Bloomberg
Date Announced total value
(US$ millions
Target Name Target Market Acquirer name
11/20/2007 16.7 ONCO Therapies Ltd India Aspen Pharmacare Holdings Ltd
9/27/2007 16.0 Rubamin Laboratories Ltd India Lupin Ltd
10/31/2007 14.1 Enaleni Pharmaceuticals Cons South Arica Marico Limited
7/26/2007 11.6 Neutrahealth PLC Britain Elder Pharmaceuticals Ltd
• M&A has been the key strategy adopted by Indian
companies to gain a oothold in the export markets.
• Large Indian companies have increased their oothold
in the regulated markets.
• Small and medium sized players are ocusing
on semi-regulated markets.
• Increased penetration, access to established
distribution networks and increase in buyer
confdence due to localised presence, have been
the key actors driving acquisition led growth.
5/14/2018 pharma010709-090504162215-phpapp02 - slidepdf.com
http://slidepdf.com/reader/full/pharma010709-090504162215-phpapp02 43/88
www.ibe.org
Rising confdence o global pharma companies in the Indian market
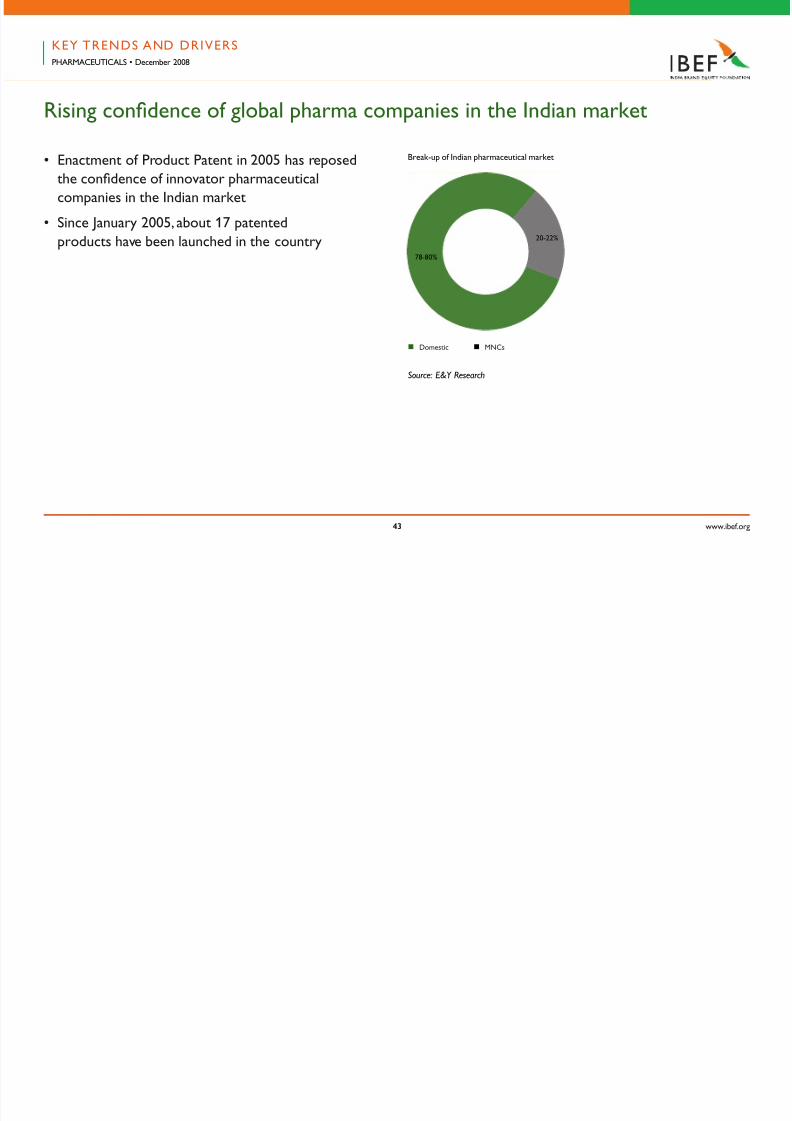
Break-up o Indian pharmaceutical market
Source: E&Y Research
n Domestic n MNCs
78-80%
20-22%
• Enactment o Product Patent in 2005 has reposed
the confdence o innovator pharmaceutical
companies in the Indian market
• Since January 2005, about 17 patented
products have been launched in the country
KEY TRENDS AND DRIVERSPHARMACEUTICALS • December 2008
5/14/2018 pharma010709-090504162215-phpapp02 - slidepdf.com
http://slidepdf.com/reader/full/pharma010709-090504162215-phpapp02 44/88
www.ibe.org
Rising confdence o global pharma companies in the Indian market
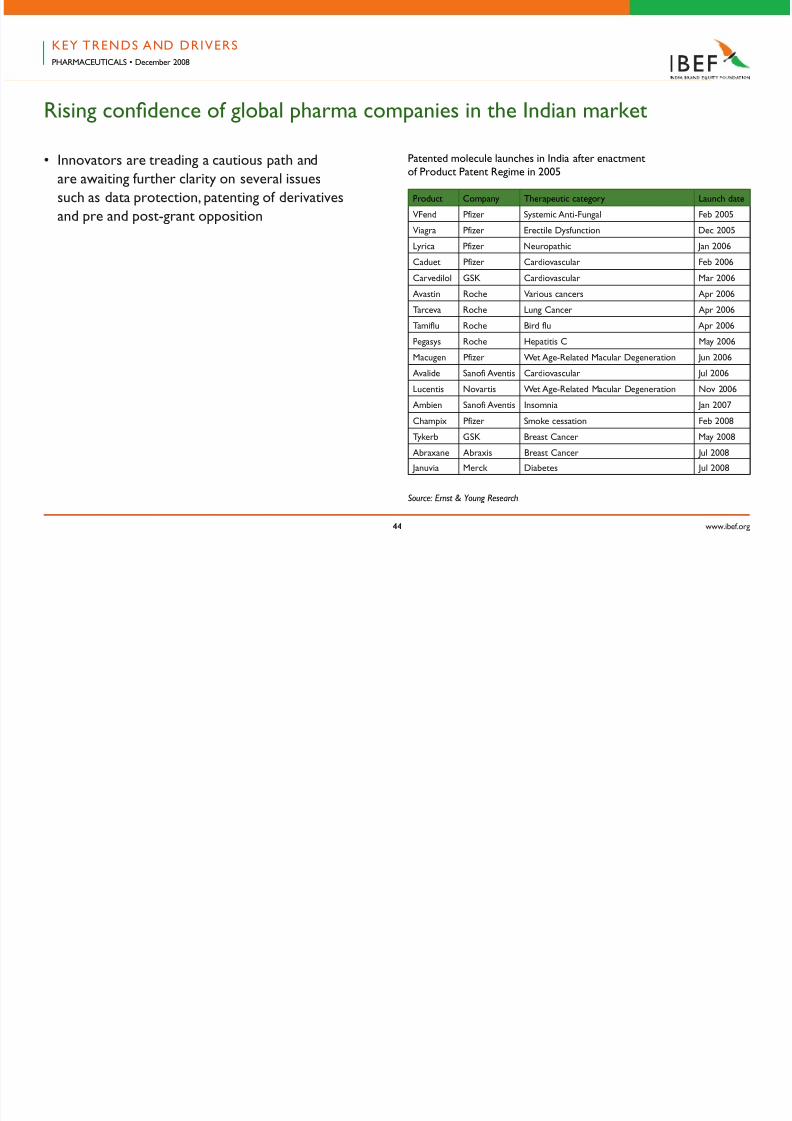
Product Company Therapeutic category Launch date
VFend Pizer Systemic Anti-Fungal Feb 2005
Viagra Pizer Erectile Dysunction Dec 2005
Lyrica Pizer Neuropathic Jan 2006
Caduet Pizer Cardiovascular Feb 2006
Carvedilol GSK Cardiovascular Mar 2006
Avastin Roche Various cancers Apr 2006
Tarceva Roche Lung Cancer Apr 2006
Tamilu Roche Bird lu Apr 2006
Pegasys Roche Hepatitis C May 2006
Macugen Pizer Wet Age-Related Macular Degeneration Jun 2006
Avalide Sanoi Aventis Cardiovascular Jul 2006
Lucentis Novartis Wet Age-Related Macular Degeneration Nov 2006
Ambien Sanoi Aventis Insomnia Jan 2007
Champix Pizer Smoke cessation Feb 2008
Tykerb GSK Breast Cancer May 2008
Abraxane Abraxis Breast Cancer Jul 2008
Januvia Merck Diabetes Jul 2008
• Innovators are treading a cautious path and
are awaiting urther clarity on several issues
such as data protection, patenting o derivatives
and pre and post-grant opposition
Source: Ernst & Young Research
Patented molecule launches in India ater enactmento Product Patent Regime in 2005
KEY TRENDS AND DRIVERSPHARMACEUTICALS • December 2008
5/14/2018 pharma010709-090504162215-phpapp02 - slidepdf.com
http://slidepdf.com/reader/full/pharma010709-090504162215-phpapp02 45/88
www.ibe.org
Global pharmaceutical companies establishing local presence
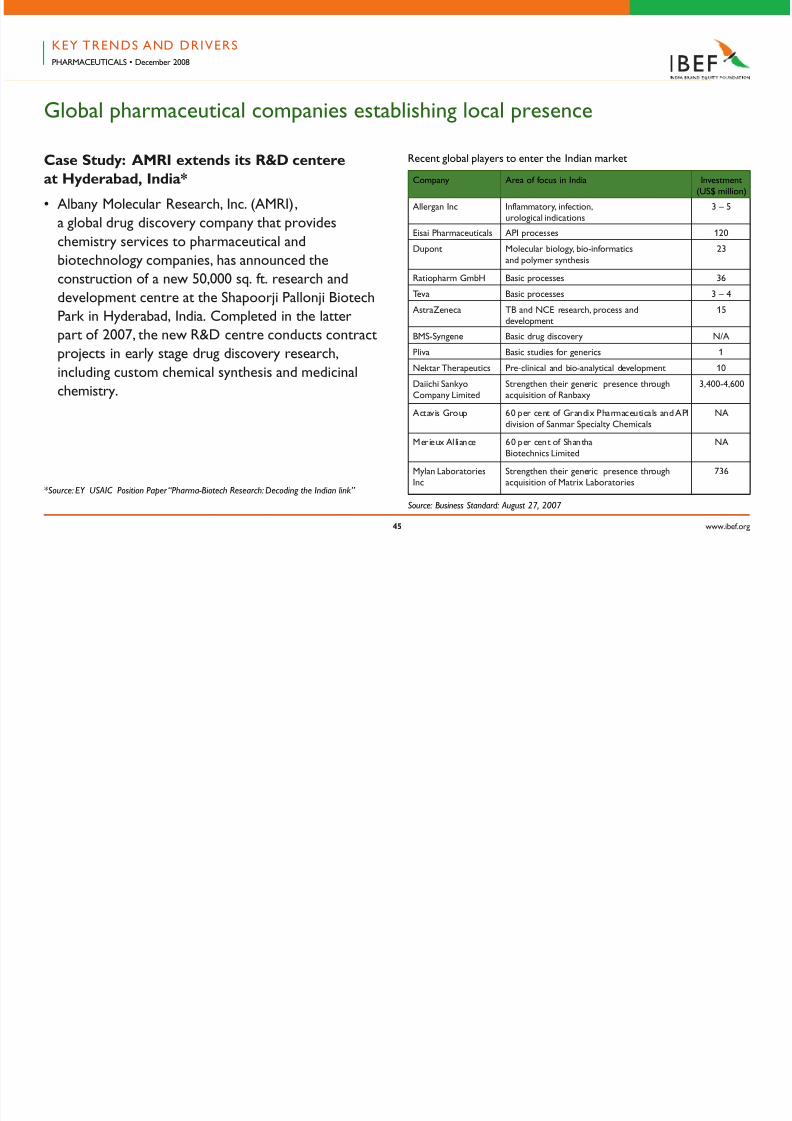
Company Area o ocus in India Investment(US$ million)
Allergan Inc Inlammatory, inection,
urological indications
3 – 5
Eisai Pharmaceuticals API processes 120
Dupont Molecular biology, bio-inormatics
and polymer synthesis
23
Ratiopharm GmbH Basic processes 36
Teva Basic processes 3 – 4
AstraZeneca TB and NCE research, process anddevelopment
15
BMS-Syngene Basic drug discovery N/A
Pliva Basic studies or generics 1
Nektar Therapeutics Pre-clinical and bio-analytical development 10
Daiichi SankyoCompany Limited
Strengthen their generic presence throughacquisition o Ranbaxy
3,400-4,600
Actavis Group 60 per cent o Grandix Pharmaceuticals and API
division o Sanmar Specialty Chemicals
NA
Merieux Al liance 60 per cent o ShanthaBiotechnics Limited
NA
Mylan LaboratoriesInc
Strengthen their generic presence throughacquisition o Matrix Laboratories
736
Case Study: AMRI extends its R&D centere
at Hyderabad, India*
• Albany Molecular Research, Inc. (AMRI),
a global drug discovery company that provides
chemistry services to pharmaceutical and
biotechnology companies, has announced the
construction o a new 50,000 sq. t. research anddevelopment centre at the Shapoorji Pallonji Biotech
Park in Hyderabad, India. Completed in the latter
part o 2007, the new R&D centre conducts contract
projects in early stage drug discovery research,
including custom chemical synthesis and medicinal
chemistry.
Source: Business Standard: August 27, 2007
Recent global players to enter the Indian market
*Source: EY USAIC Position Paper “Pharma-Biotech Research: Decoding the Indian link”
KEY TRENDS AND DRIVERSPHARMACEUTICALS • December 2008
5/14/2018 pharma010709-090504162215-phpapp02 - slidepdf.com
http://slidepdf.com/reader/full/pharma010709-090504162215-phpapp02 46/88
www.ibe.org
Global pharmaceutical companies establishing local presence
• In addition, a scale-up laboratory, would be used
to develop efcient methods or producing larger
quantities o active pharmaceutical ingredients and
intermediates. When ully staed, the new acility
would add over 100 employees to the company’s
existing Hyderabad operations, which currently
has 19 employees in the acility at ICICI Knowledge
Park. The current acility can accommodate up to
40 employees and is expected to reach ull capacity
in the coming months.
KEY TRENDS AND DRIVERSPHARMACEUTICALS • December 2008
*Source: EY USAIC Position Paper “Pharma-Biotech Research: Decoding the Indian link”
5/14/2018 pharma010709-090504162215-phpapp02 - slidepdf.com
http://slidepdf.com/reader/full/pharma010709-090504162215-phpapp02 47/88
www.ibe.org
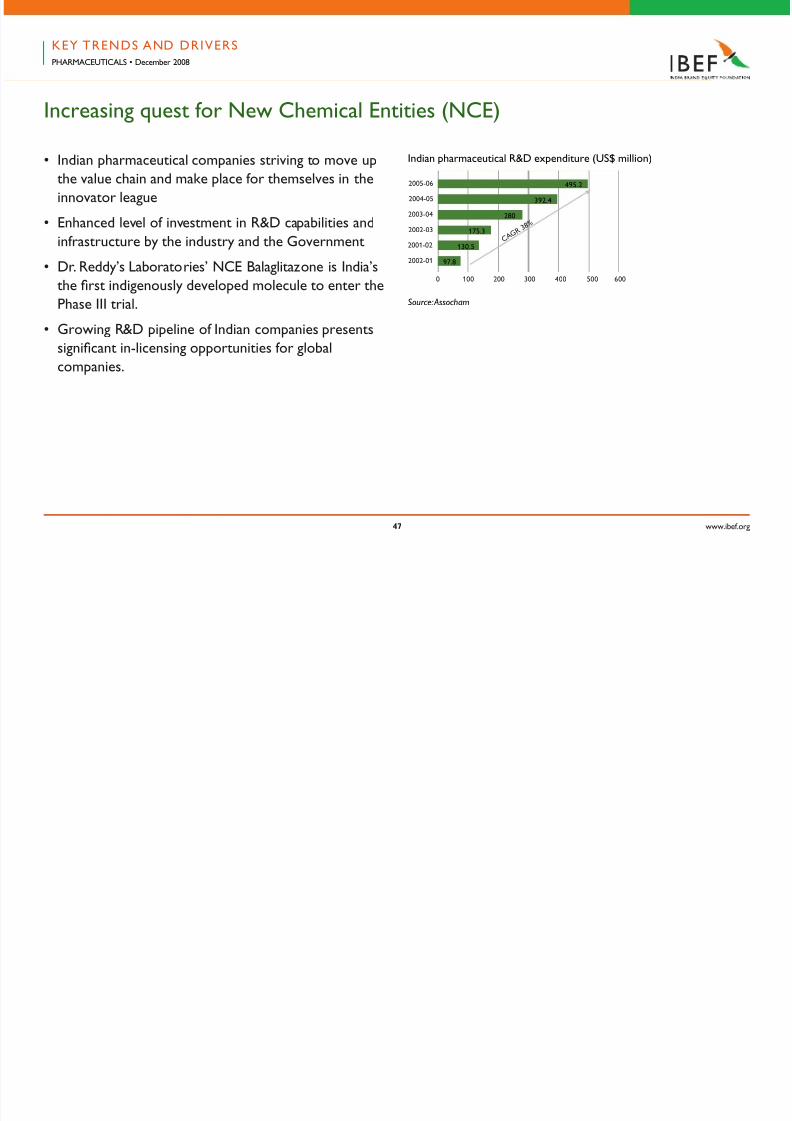
Increasing quest or New Chemical Entities (NCE)
• Indian pharmaceutical companies striving to move up
the value chain and make place or themselves in the
innovator league
• Enhanced level o investment in R&D capabilities and
inrastructure by the industry and the Government
• Dr. Reddy’s Laboratories’ NCE Balaglitazone is India’s
the frst indigenously developed molecule to enter thePhase III trial.
• Growing R&D pipeline o Indian companies presents
signifcant in-licensing opportunities or global
companies.
KEY TRENDS AND DRIVERSPHARMACEUTICALS • December 2008
Indian pharmaceutical R&D expenditure (US$ million)
Source: Assocham
2005-06
2004-05
2003-04
2002-03
2001-02
2002-01
100 200 300 400 500 600
495.2
392.4
280
175.3
130.5
97.8
0
C A G R
3 8 %
5/14/2018 pharma010709-090504162215-phpapp02 - slidepdf.com
http://slidepdf.com/reader/full/pharma010709-090504162215-phpapp02 48/88
www.ibe.org
KEY TRENDS AND D RIVERSPHARMACEUTICALS • December 2008
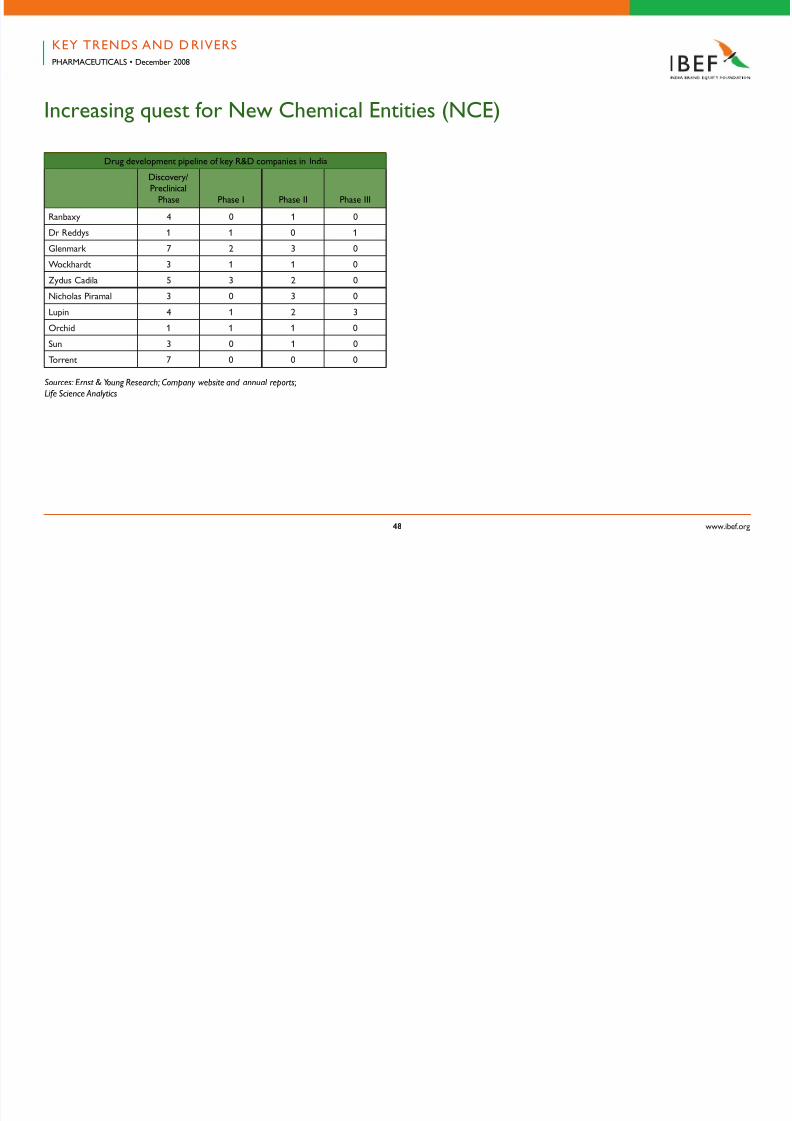
Drug development pipeline o key R&D companies in India
Discovery/Preclinical
Phase Phase I Phase II Phase III
Ranbaxy 4 0 1 0
Dr Reddys 1 1 0 1
Glenmark 7 2 3 0
Wockhardt 3 1 1 0
Zydus Cadila 5 3 2 0Nicholas Piramal 3 0 3 0
Lupin 4 1 2 3
Orchid 1 1 1 0
Sun 3 0 1 0
Torrent 7 0 0 0
Sources: Ernst & Young Research; Company website and annual reports;Life Science Analytics
Increasing quest or New Chemical Entities (NCE)
5/14/2018 pharma010709-090504162215-phpapp02 - slidepdf.com
http://slidepdf.com/reader/full/pharma010709-090504162215-phpapp02 49/88
www.ibe.org
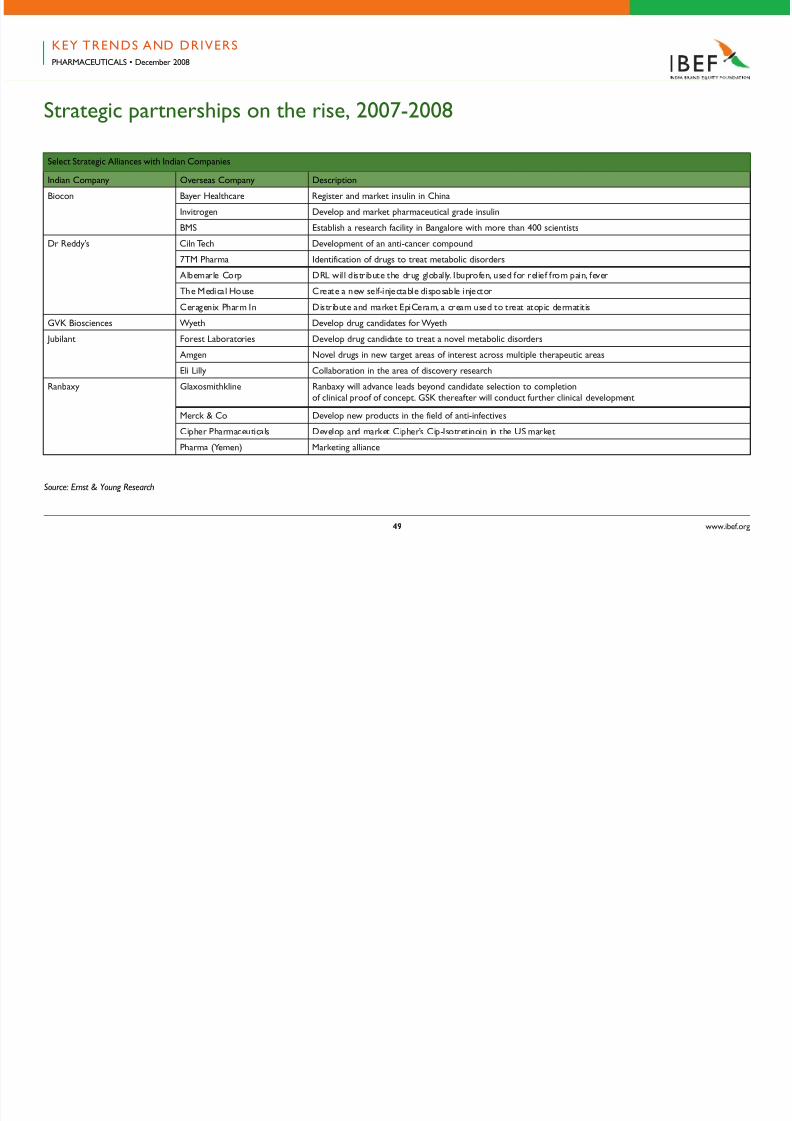
Strategic partnerships on the rise, 2007-2008
Select Strategic Alliances with Indian Companies
Indian Company Overseas Company Description
Biocon Bayer Healthcare Register and market insulin in China
Invitrogen Develop and market pharmaceutical grade insulin
BMS Establish a research acility in Bangalore with more than 400 scientists
Dr Reddy’s Ciln Tech Development o an anti-cancer compound
7TM Pharma Identiication o drugs to treat metabolic disorders
Albemarle Corp DRL will distribute the drug globally. Ibuproen, used or relie rom pain, ever
The Medical House Create a new sel-injectable disposable injector
Ceragenix Pharm In Distribute and market EpiCeram, a cream used to treat atopic dermatitis
GVK Biosciences Wyeth Develop drug candidates or Wyeth
Jubilant Forest Laboratories Develop drug candidate to treat a novel metabolic disorders
Amgen Novel drugs in new target areas o interest across multiple therapeutic areas
Eli Lilly Collaboration in the area o discovery research
Ranbaxy Glaxosmithkline Ranbaxy will advance leads beyond candidate selection to completiono clinical proo o concept. GSK thereater will conduct urther clinical development
Merck & Co Develop new products in the ield o anti-inectives
Cipher Pharmaceuticals Develop and market Cipher’s Cip-Isotretinoin in the US market
Pharma (Yemen) Marketing alliance
Source: Ernst & Young Research
KEY TRENDS AND DRIVERSPHARMACEUTICALS • December 2008
5/14/2018 pharma010709-090504162215-phpapp02 - slidepdf.com
http://slidepdf.com/reader/full/pharma010709-090504162215-phpapp02 50/88
www.ibe.org0
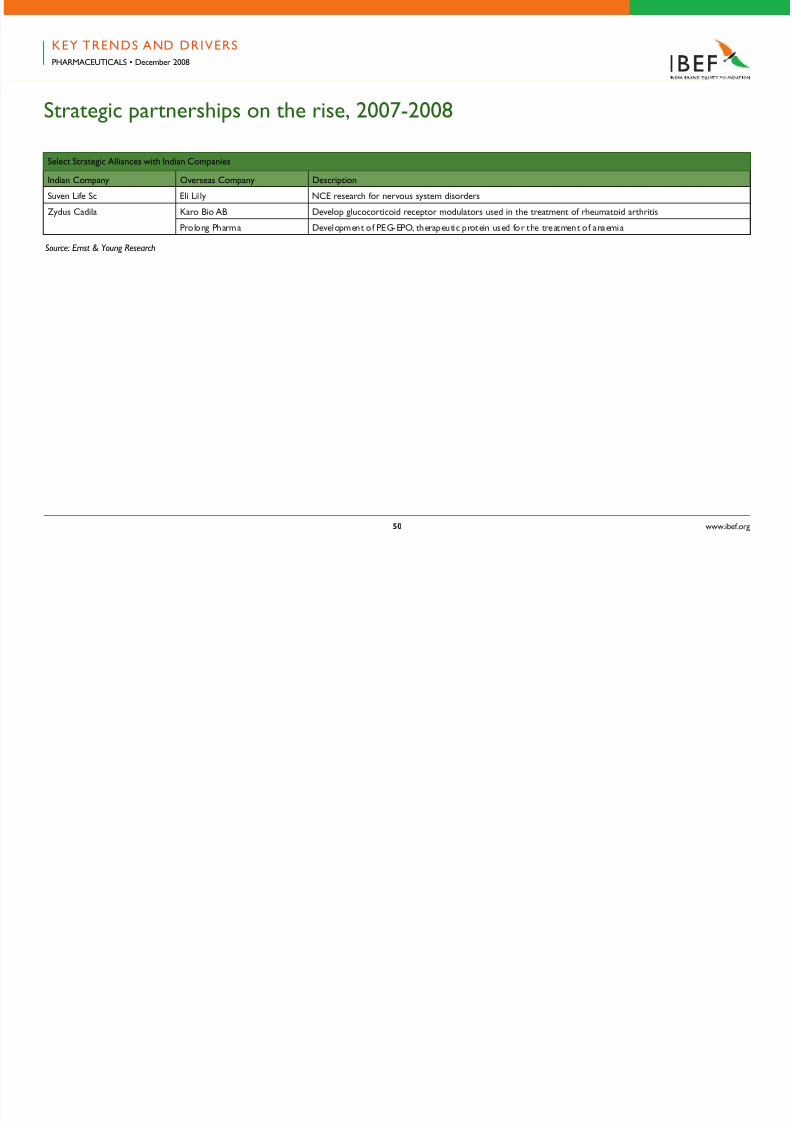
Strategic partnerships on the rise, 2007-2008
Source: Ernst & Young Research
KEY TRENDS AND DRIVERSPHARMACEUTICALS • December 2008
Select Strategic Alliances with Indian Companies
Indian Company Overseas Company Description
Suven Lie Sc Eli Lilly NCE research or nervous system disorders
Zydus Cadila Karo Bio AB Develop glucocorticoid receptor modulators used in the treatment o rheumatoid arthritis
Prolong Pharma Development o PEG-EPO, therapeutic protein used or the treatment o anaemia
5/14/2018 pharma010709-090504162215-phpapp02 - slidepdf.com
http://slidepdf.com/reader/full/pharma010709-090504162215-phpapp02 51/88
www.ibe.org1
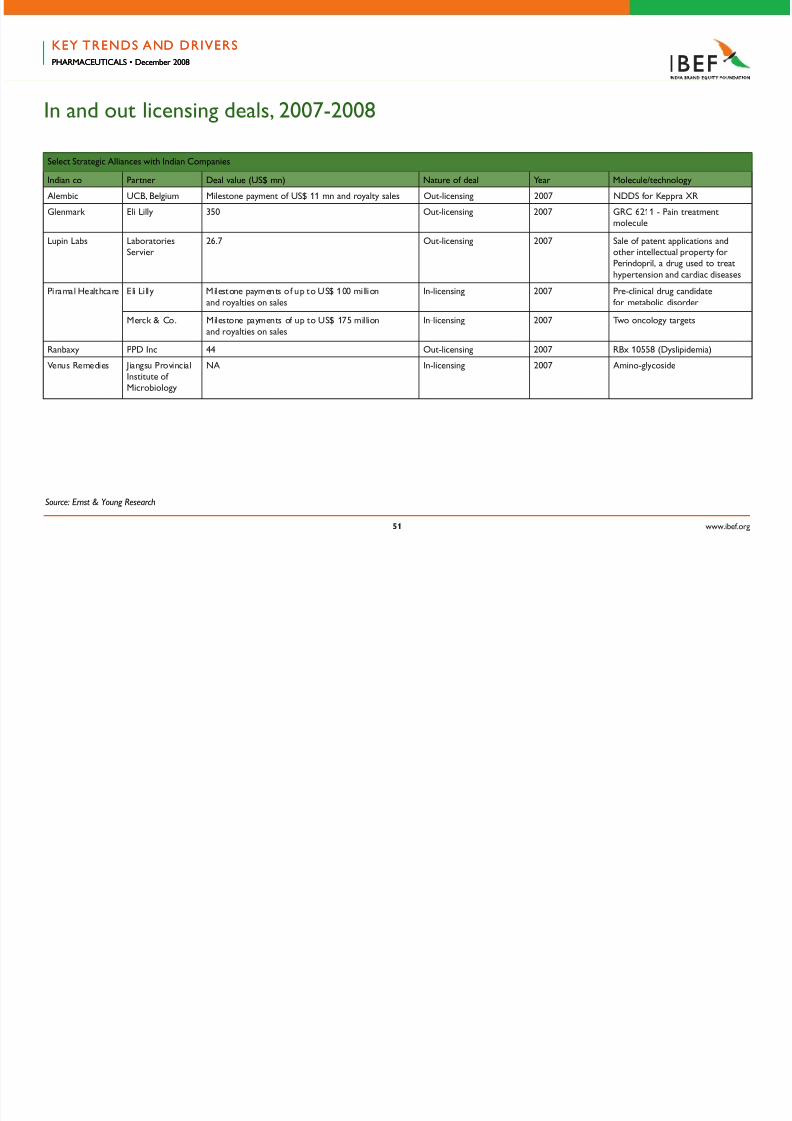
Select Strategic Alliances with Indian Companies
Indian co Partner Deal value (US$ mn) Nature o deal Year Molecule/technology
Alembic UCB, Belgium Milestone payment o US$ 11 mn and royalty sales Out-licensing 2007 NDDS or Keppra XR
Glenmark Eli Lilly 350 Out-licensing 2007 GRC 6211 - Pain treatmentmolecule
Lupin Labs LaboratoriesServier
26.7 Out-licensing 2007 Sale o patent applications andother intellectual property orPerindopril, a drug used to treat
hypertension and cardiac diseases
Piramal Healthcare Eli Li lly Milestone payments o up to US$ 100 mi llion
and royalties on sales
In-licensing 2007 Pre-clinical drug candidate
or metabolic disorder
Merck & Co. Milestone payments o up to US$ 175 million
and royalties on sales
In-licensing 2007 Two oncology targets
Ranbaxy PPD Inc 44 Out-licensing 2007 RBx 10558 (Dyslipidemia)
Venus Remedies Jiangsu ProvincialInstitute o Microbiology
NA In-licensing 2007 Amino-glycoside
KEY TRENDS AND DRIVERSPHARMACEUTICALS • December 2008
In and out licensing deals, 2007-2008
Source: Ernst & Young Research
KEY TRENDS AND DRIVERSPHARMACEUTICALS • December 2008
5/14/2018 pharma010709-090504162215-phpapp02 - slidepdf.com
http://slidepdf.com/reader/full/pharma010709-090504162215-phpapp02 52/88
www.ibe.org
Private Equity (PE) deals in pharmaceuticals and healthcare, 2007
KEY TRENDS AND DRIVERSPHARMACEUTICALS • December 2008
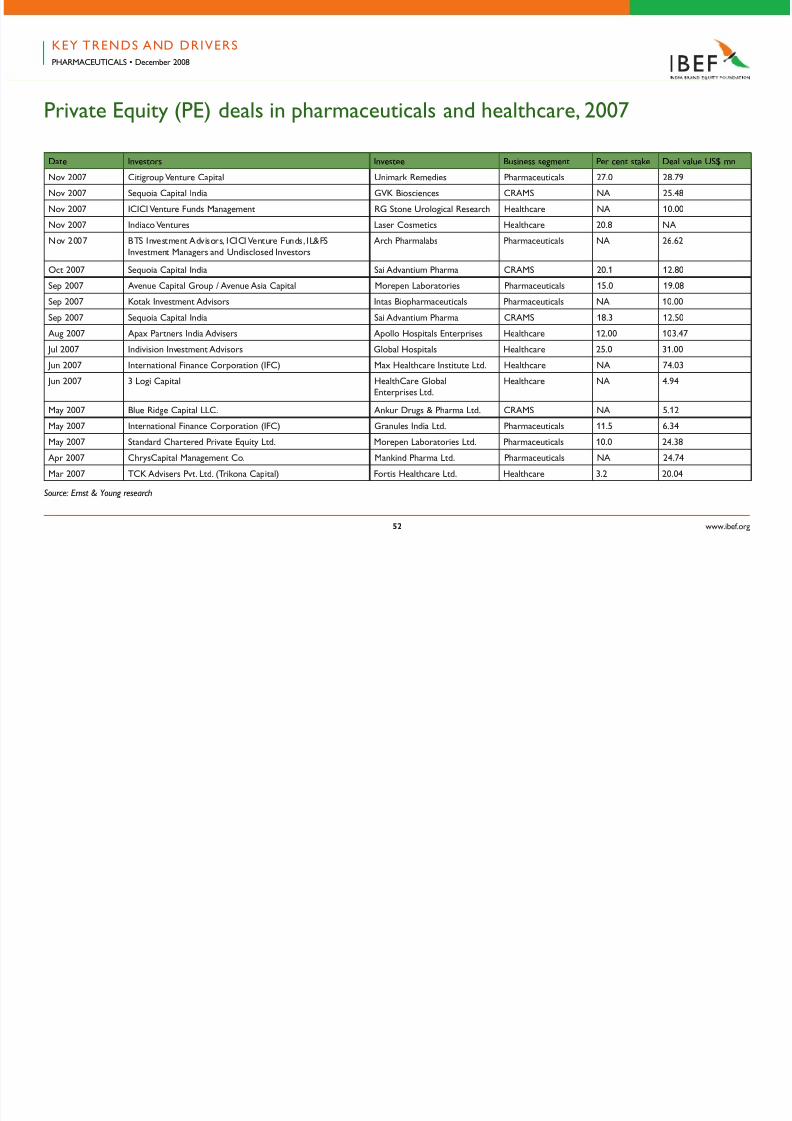
Date Investors Investee Business segment Per cent stake Deal value US$ mn
Nov 2007 Citigroup Venture Capital Unimark Remedies Pharmaceuticals 27.0 28.79
Nov 2007 Sequoia Capital India GVK Biosciences CRAMS NA 25.48
Nov 2007 ICICI Venture Funds Management RG Stone Urological Research Healthcare NA 10.00
Nov 2007 Indiaco Ventures Laser Cosmetics Healthcare 20.8 NA
Nov 2007 BTS Investment Advisors, ICICI Venture Funds, IL&FSInvestment Managers and Undisclosed Investors
Arch Pharmalabs Pharmaceuticals NA 26.62
Oct 2007 Sequoia Capital India Sai Advantium Pharma CRAMS 20.1 12.80
Sep 2007 Avenue Capital Group / Avenue Asia Capital Morepen Laboratories Pharmaceuticals 15.0 19.08
Sep 2007 Kotak Investment Advisors Intas Biopharmaceuticals Pharmaceuticals NA 10.00
Sep 2007 Sequoia Capital India Sai Advantium Pharma CRAMS 18.3 12.50
Aug 2007 Apax Partners India Advisers Apollo Hospitals Enterprises Healthcare 12.00 103.47
Jul 2007 Indivision Investment Advisors Global Hospitals Healthcare 25.0 31.00
Jun 2007 International Finance Corporation (IFC) Max Healthcare Institute Ltd. Healthcare NA 74.03
Jun 2007 3 Logi Capital HealthCare GlobalEnterprises Ltd.
Healthcare NA 4.94
May 2007 Blue Ridge Capital LLC. Ankur Drugs & Pharma Ltd. CRAMS NA 5.12
May 2007 International Finance Corporation (IFC) Granules India Ltd. Pharmaceuticals 11.5 6.34
May 2007 Standard Chartered Private Equity Ltd. Morepen Laboratories Ltd. Pharmaceuticals 10.0 24.38
Apr 2007 ChrysCapital Management Co. Mankind Pharma Ltd. Pharmaceuticals NA 24.74
Mar 2007 TCK Advisers Pvt. Ltd. (Trikona Capital) Fortis Healthcare Ltd. Healthcare 3.2 20.04
Source: Ernst & Young research
5/14/2018 pharma010709-090504162215-phpapp02 - slidepdf.com
http://slidepdf.com/reader/full/pharma010709-090504162215-phpapp02 53/88
www.ibe.org
KEY TRENDS AND DRIVERSPHARMACEUTICALS • December 2008
Private Equity (PE) deals in pharmaceuticals and healthcare, 2007
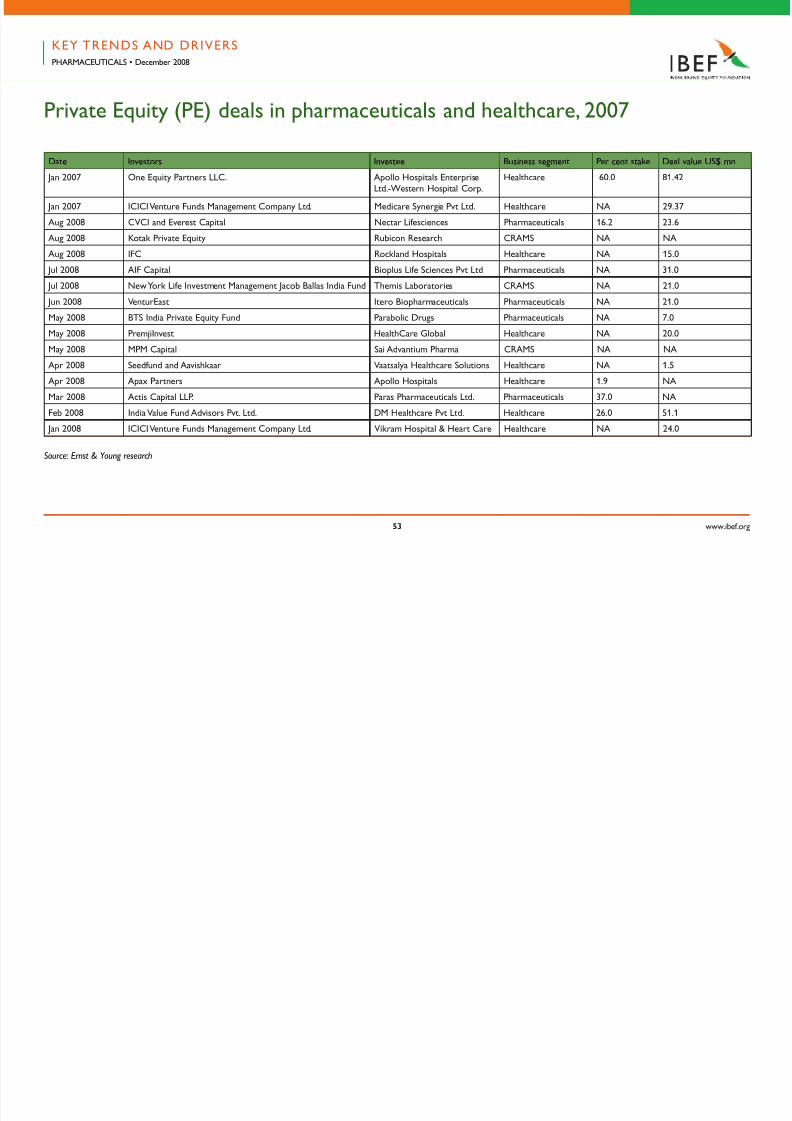
Date Investors Investee Business segment Per cent stake Deal value US$ mn
Jan 2007 One Equity Partners LLC. Apollo Hospitals EnterpriseLtd.-Western Hospital Corp.
Healthcare 60.0 81.42
Jan 2007 ICICI Venture Funds Management Company Ltd. Medicare Synergie Pvt Ltd. Healthcare NA 29.37
Aug 2008 CVCI and Everest Capital Nectar Liesciences Pharmaceuticals 16.2 23.6
Aug 2008 Kotak Private Equity Rubicon Research CRAMS NA NA
Aug 2008 IFC Rockland Hospitals Healthcare NA 15.0
Jul 2008 AIF Capital Bioplus Lie Sciences Pvt Ltd Pharmaceuticals NA 31.0
Jul 2008 New York Lie Investment Management Jacob Ballas India Fund Themis Laboratories CRAMS NA 21.0
Jun 2008 VenturEast Itero Biopharmaceuticals Pharmaceuticals NA 21.0
May 2008 BTS India Private Equity Fund Parabolic Drugs Pharmaceuticals NA 7.0
May 2008 PremjiInvest HealthCare Global Healthcare NA 20.0
May 2008 MPM Capital Sai Advantium Pharma CRAMS NA NA
Apr 2008 Seedund and Aavishkaar Vaatsalya Healthcare Solutions Healthcare NA 1.5
Apr 2008 Apax Partners Apollo Hospitals Healthcare 1.9 NA
Mar 2008 Actis Capital LLP. Paras Pharmaceuticals Ltd. Pharmaceuticals 37.0 NA
Feb 2008 India Value Fund Advisors Pvt. Ltd. DM Healthcare Pvt Ltd. Healthcare 26.0 51.1
Jan 2008 ICICI Venture Funds Management Company Ltd. Vikram Hospital & Heart Care Healthcare NA 24.0
Source: Ernst & Young research
5/14/2018 pharma010709-090504162215-phpapp02 - slidepdf.com
http://slidepdf.com/reader/full/pharma010709-090504162215-phpapp02 54/88
www.ibe.org
KEY TRENDS AND DRIVERSPHARMACEUTICALS • December 2008
Private Equity (PE) deals in pharmaceuticals and healthcare, 2007
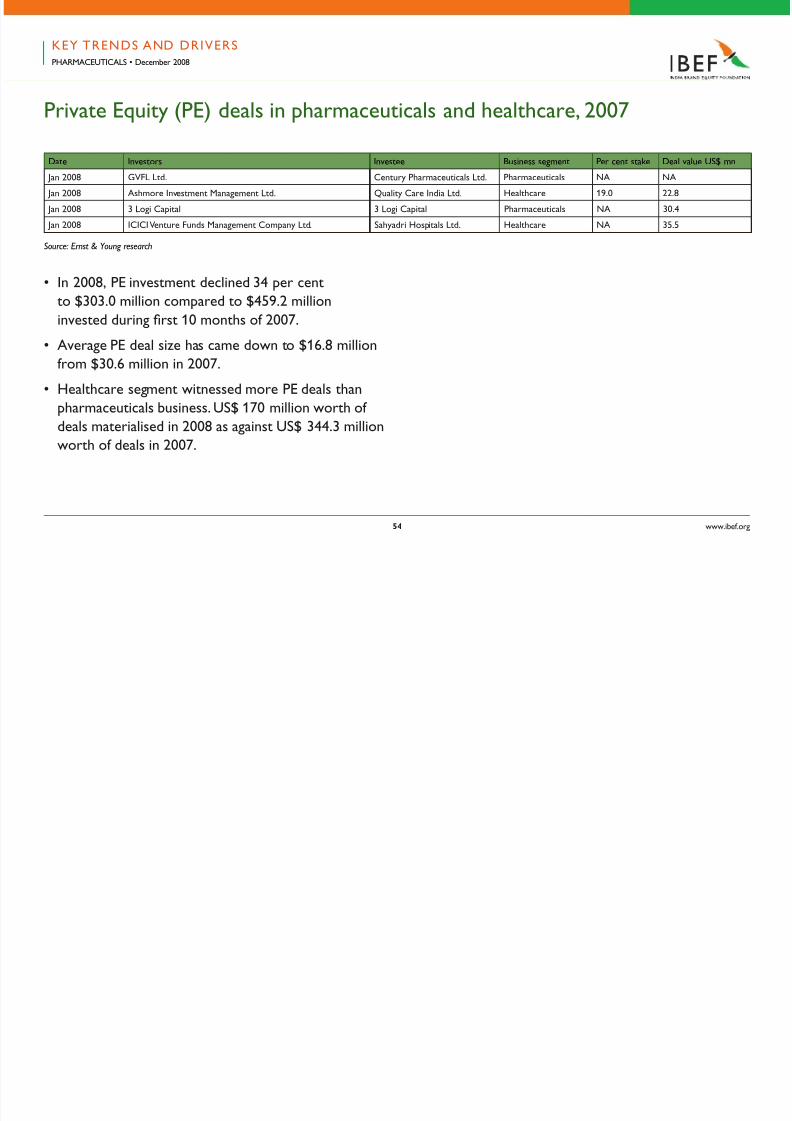
Date Investors Investee Business segment Per cent stake Deal value US$ mn
Jan 2008 GVFL Ltd. Century Pharmaceuticals Ltd. Pharmaceuticals NA NA
Jan 2008 Ashmore Investment Management Ltd. Quality Care India Ltd. Healthcare 19.0 22.8
Jan 2008 3 Logi Capital 3 Logi Capital Pharmaceuticals NA 30.4
Jan 2008 ICICI Venture Funds Management Company Ltd. Sahyadri Hospitals Ltd. Healthcare NA 35.5
Source: Ernst & Young research
• In 2008, PE investment declined 34 per centto $303.0 million compared to $459.2 million
invested during frst 10 months o 2007.
• Average PE deal size has came down to $16.8 million
rom $30.6 million in 2007.
• Healthcare segment witnessed more PE deals than
pharmaceuticals business. US$ 170 million worth o
deals materialised in 2008 as against US$ 344.3 millionworth o deals in 2007.
5/14/2018 pharma010709-090504162215-phpapp02 - slidepdf.com
http://slidepdf.com/reader/full/pharma010709-090504162215-phpapp02 55/88
www.ibe.org
KEY PLAYERS
5/14/2018 pharma010709-090504162215-phpapp02 - slidepdf.com
http://slidepdf.com/reader/full/pharma010709-090504162215-phpapp02 56/88
www.ibe.org
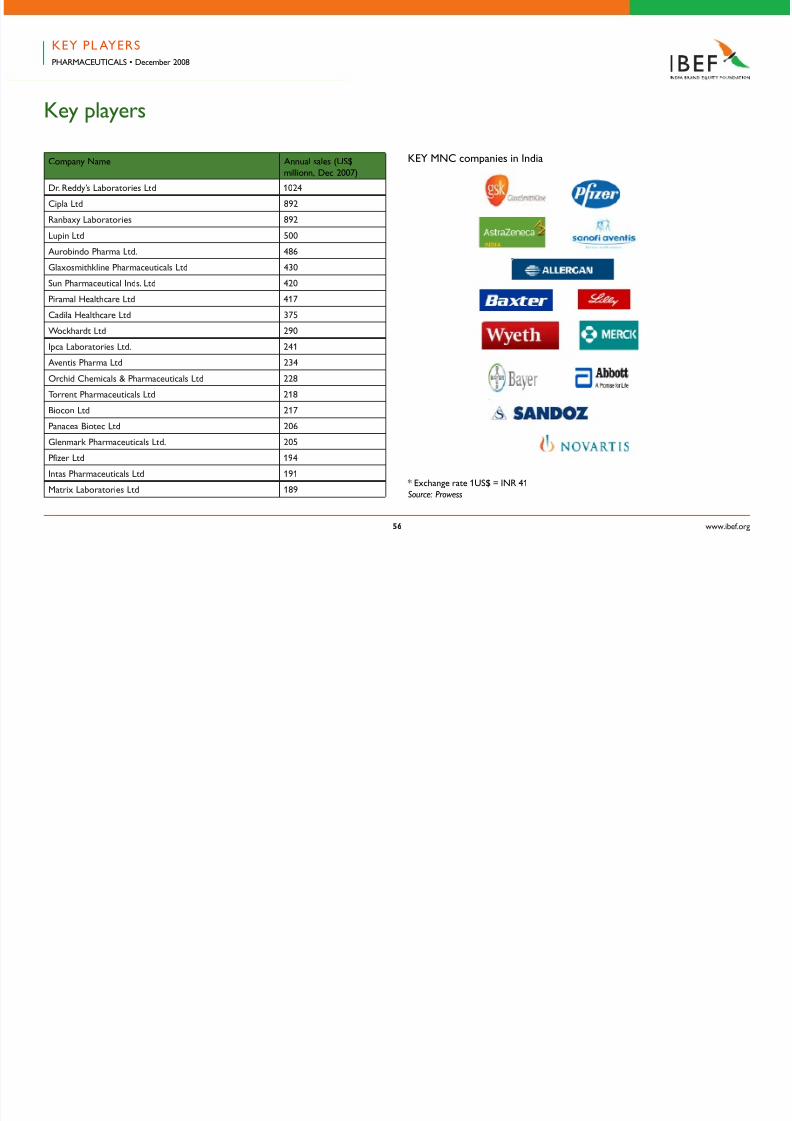
Key players
Company Name Annual sales (US$
millionn, Dec 2007)
Dr. Reddy’s Laboratories Ltd 1024
Cipla Ltd 892
Ranbaxy Laboratories 892
Lupin Ltd 500
Aurobindo Pharma Ltd. 486
Glaxosmithkline Pharmaceuticals Ltd 430
Sun Pharmaceutical Inds. Ltd 420Piramal Healthcare Ltd 417
Cadila Healthcare Ltd 375
Wockhardt Ltd 290
Ipca Laboratories Ltd. 241
Aventis Pharma Ltd 234
Orchid Chemicals & Pharmaceuticals Ltd 228
Torrent Pharmaceuticals Ltd 218
Biocon Ltd 217
Panacea Biotec Ltd 206
Glenmark Pharmaceuticals Ltd. 205
Pizer Ltd 194
Intas Pharmaceuticals Ltd 191
Matrix Laboratories Ltd 189Source: Prowess
KEY PL AYERSPHARMACEUTICALS • December 2008
* Exchange rate 1US$ = INR 41
KEY MNC companies in India
5/14/2018 pharma010709-090504162215-phpapp02 - slidepdf.com
http://slidepdf.com/reader/full/pharma010709-090504162215-phpapp02 57/88
www.ibe.org
Select domestic players
Ranbaxy
• Incorporated in 1961
• Ranked among the top
10 generics companies in the world
• Ground operations in 49 countries and
manuacturing operations in 11 nations
• Exports contribute to around
80 per cent o the total revenues
• The company’s net proft in frst quarter
o 2008 was US$ 39 million.
KEY PL AYERSPHARMACEUTICALS • December 2008
5/14/2018 pharma010709-090504162215-phpapp02 - slidepdf.com
http://slidepdf.com/reader/full/pharma010709-090504162215-phpapp02 58/88
www.ibe.org
Select domestic players
Ranbaxy
• Aspires to become a research based
pharmaceutical company with revenues
o US$ 5 billion by 2012
• Envisions being in top fve global generics players
by 2012
• TC presence: Anti-inectives, CVS, diabetes,dermatological, neuro-psychiatry,
Pain management, GI and Nutritional
KEY PL AYERSPHARMACEUTICALS • December 2008
5/14/2018 pharma010709-090504162215-phpapp02 - slidepdf.com
http://slidepdf.com/reader/full/pharma010709-090504162215-phpapp02 59/88
www.ibe.org
Select domestic players
Dr. Reddy’s Labs
• Established in 1984
• Ranks among the top 15 generics players
in the world
• First pharmaceutical company in Asia-Pacifc
(outside Japan) to be listed on NYSE
• Presence in 35 countries with operations in
over 115 countries
• Generated revenues o US$ 1.5 billion in 2007
• Overseas business contributes to around 86 per cent
o the total revenues
• Aspires to become a discovery led global
pharmaceutical company and one o the top 10generic companies in the world
• TC presence: Anti-inectives, CVS, diabetes,
dermatological, pain management, GI, nutritional,
dental, urological and oncology
KEY PL AYERSPHARMACEUTICALS • December 2008

5/14/2018 pharma010709-090504162215-phpapp02 - slidepdf.com
http://slidepdf.com/reader/full/pharma010709-090504162215-phpapp02 60/88
www.ibe.org0
Select domestic players
CIPLA
• Set up in 1935
• World’s largest manuacturer o cost eective
anti-retroviral drugs
• Cipla’s products are bought by over 170 countries
across all the continents
• Partnerships with nine companies or over
125 products
• Recorded a turnover o US$ 800 million in 2007
• Exports account or over 50 per cent o the overall
sales
• Over 100 Drug Master File (DMF) registrations
in the US and over 85 in Europe
• Presence across most o the therapeutic category
KEY PL AYERSPHARMACEUTICALS • December 2008
5/14/2018 pharma010709-090504162215-phpapp02 - slidepdf.com
http://slidepdf.com/reader/full/pharma010709-090504162215-phpapp02 61/88
www.ibe.org1
Select domestic players
Nicholas Piramal India Ltd. (NPIL)
• Came into existence in 1988
• Fourth largest pharmaceutical company
and is the leader in the CVS segment
• Has grown primarily on acquisitions, mergers
and alliances in the last 15 years
• Merged with Global Bulk Drugs and Fine Chemicals
(India) in 2003
• Acquired Pfzer’s custom manuacturing plant located
in Morpeth (UK)
• NPIL recorded a turnover o US$ 335 million
• Domestic market accounts or approximately
87 per cent o the company’s annual sales
• TC presence: Anti-inectives, CVS, diabetes,
dermatological, pain management, GI, respiratory,
nutritional, CNS and urological
KEY PL AYERSPHARMACEUTICALS • December 2008
KEY PL AYERS
5/14/2018 pharma010709-090504162215-phpapp02 - slidepdf.com
http://slidepdf.com/reader/full/pharma010709-090504162215-phpapp02 62/88
www.ibe.org
Select oreign players
GlaxoSmithKline
• Two manuacturing units in India, located
at Nasik and Thane
• 2000-strong feldworkers and a country
wide network o over 4000 stockists
• Net sales o the pharmaceuticals business segment
was US$ 326 million, which constitutes 92 per cent
o the company’s total sales
• It exported bulk drugs and ormulations worth
US$ 7.1 million
• Two R&D centres which are approved by the
Department o Scientifc and Industrial Research,
Government o India• TC presence: Anti-inectives, CVS, diabetes,
dermatological, pain management, CNS, GI,
nutritional, gynaecological, respiratory, sera
and immunoglobulin, hormones
KEY PL AYERSPHARMACEUTICALS • December 2008
KEY PL AYERS
5/14/2018 pharma010709-090504162215-phpapp02 - slidepdf.com
http://slidepdf.com/reader/full/pharma010709-090504162215-phpapp02 63/88
www.ibe.org
Select oreign players
Pfzer India
• Forayed in the Indian market in 1950
• Manuacturing acility at Thane, Maharashtra
• Launched fve patented products since 2005 - Vend,
Viagra, Lyrica, Caduet and Macugen
• Seven o Pfzer’s brands eature amongthe top 100 pharmaceutical brands
• Pfzer Limited (India) has a turnover
o US$ 172 million (November 2006)
• Clinical research investments
o US$ 15.75 million in India
• TC presence: Anti-inectives, CVS, dermatological,
sera and immunoglobulin, pain management, diabetes,
CNS, GI, nutritional, gynaecological and respiratory
KEY PL AYERSPHARMACEUTICALS • December 2008
KEY PL AYERS
5/14/2018 pharma010709-090504162215-phpapp02 - slidepdf.com
http://slidepdf.com/reader/full/pharma010709-090504162215-phpapp02 64/88
www.ibe.org
Select oreign players
AstraZeneca
• R&D, manuacturing and marketing ofces
in Bangalore
• R&D centre is dedicated to the ‘Discovery o Novel
Therapies or the Developing World’ diseases with
more than 90 scientists
• Added a state-o-the-art process R&D acilityemploying more than 50 scientists
• Sales turnover o US$ 62.9 million in 2006
with a PAT o US$ 11.5 million
• TC presence: Focus on respiratory, maternal health,
oncology, inection, pain control and anaesthesia
KEY PL AYERSPHARMACEUTICALS • December 2008
KEY PL AYERS
5/14/2018 pharma010709-090504162215-phpapp02 - slidepdf.com
http://slidepdf.com/reader/full/pharma010709-090504162215-phpapp02 65/88
www.ibe.org
Select oreign players
Sanof Aventis
• Incorporated in1956 under the name
Hoechst Fedco Pharma Pvt. Ltd.
• 1,840 employees
• Manuacturing acilities in Ankleshwar and Goa
• TC presence: CVS, thrombosis, oncology, metabolicdisorders, CNS, internal medicine and vaccines
KEY PL AYERSPHARMACEUTICALS • December 2008
KEY PL AYERS
5/14/2018 pharma010709-090504162215-phpapp02 - slidepdf.com
http://slidepdf.com/reader/full/pharma010709-090504162215-phpapp02 66/88
www.ibe.org
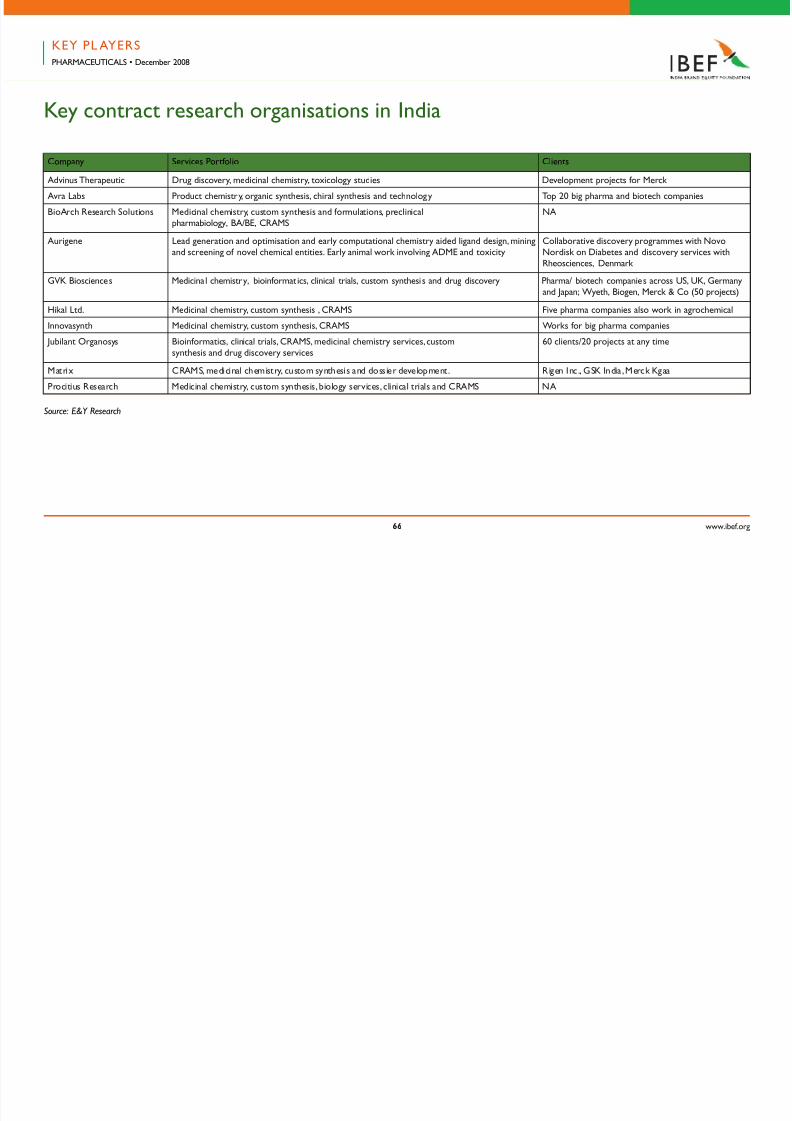
Company Services Portolio Clients
Advinus Therapeutic Drug discovery, medicinal chemistry, toxicology studies Development projects or Merck
Avra Labs Product chemistry, organic synthesis, chiral synthesis and technology Top 20 big pharma and biotech companies
BioArch Research Solutions Medicinal chemistry, custom synthesis and ormulations, preclinicalpharmabiology, BA/BE, CRAMS
NA
Aurigene Lead generation and optimisation and early computational chemistry aided ligand design, miningand screening o novel chemical entities. Early animal work involving ADME and toxicity
Collaborative discovery programmes with NovoNordisk on Diabetes and discovery services withRheosciences, Denmark
GVK Biosciences Medicinal chemistry, bioinormatics, clinical trials, custom synthesis and drug discovery Pharma/ biotech companies across US, UK, Germanyand Japan; Wyeth, Biogen, Merck & Co (50 projects)
Hikal Ltd. Medicinal chemistry, custom synthesis , CRAMS Five pharma companies also work in agrochemical
Innovasynth Medicinal chemistry, custom synthesis, CRAMS Works or big pharma companies
Jubilant Organosys Bioinormatics, clinical trials, CRAMS, medicinal chemistry services , customsynthesis and drug discovery services
60 clients/20 projects at any time
Matrix CRAMS, medicinal chemistry, custom synthesis and dossier development. Rigen Inc., GSK India, Merck Kgaa
Procitius Research Medicinal chemistry, custom synthesis, biology services, clinical trials and CRAMS NA
Key contract research organisations in India
Source: E&Y Research
KEY PL AYERSPHARMACEUTICALS • December 2008
KEY PL AYERS
5/14/2018 pharma010709-090504162215-phpapp02 - slidepdf.com
http://slidepdf.com/reader/full/pharma010709-090504162215-phpapp02 67/88
www.ibe.org
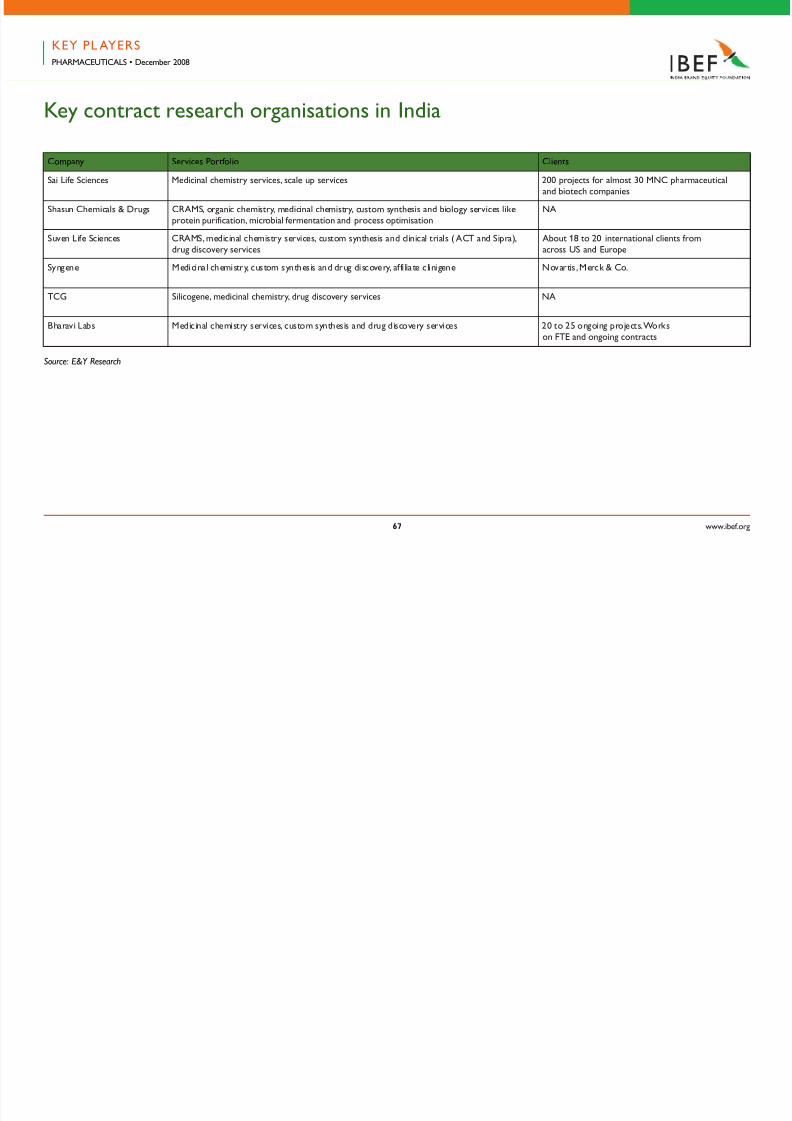
Company Services Portolio Clients
Sai Lie Sciences Medicinal chemistry services, scale up services 200 projects or almost 30 MNC pharmaceuticaland biotech companies
Shasun Chemicals & Drugs CRAMS, organic chemistry, medicinal chemistry, custom synthesis and biology services likeprotein puriication, microbial ermentation and process optimisation
NA
Suven Lie Sciences CRAMS, medicinal chemistry services, custom synthesis and clinical trials ( ACT and Sipra),drug discovery services
About 18 to 20 international clients romacross US and Europe
Syngene Medicinal chemistry, custom synthesis and drug discovery, a i liate c linigene Novartis , Merck & Co.
TCG Silicogene, medicinal chemistry, drug discovery services NA
Bharavi Labs Medicinal chemistry services, custom synthesis and drug discovery services 20 to 25 ongoing projects. Workson FTE and ongoing contracts
Key contract research organisations in India
Source: E&Y Research
KEY PL AYERSPHARMACEUTICALS • December 2008
KEY OPPORTUNITIES
5/14/2018 pharma010709-090504162215-phpapp02 - slidepdf.com
http://slidepdf.com/reader/full/pharma010709-090504162215-phpapp02 68/88
www.ibe.org
KEY OPPORTUNITIES
KEY OPPORTUNITIES
5/14/2018 pharma010709-090504162215-phpapp02 - slidepdf.com
http://slidepdf.com/reader/full/pharma010709-090504162215-phpapp02 69/88
www.ibe.org
Contract research – India an emerging hotspot
• Contract research recorded a growth
o 45 per cent to reach $ 175 million in 2006
• Presently, a major portion o the services
is limited to chemistry based lead
identifcation/optimisation, preclinical
and clinical research stages
• Select companies provide biology basedservices or target validation; notable
examples are Avesthagen, Ocimum Biosolutions
and TCG Liesciences
• Bioinormatics companies that oer research
enabling sotware technologies are also emerging
as a valuable segment
KEY OPPORTUNITIESPHARMACEUTICALS • December 2008
KEY OPPORTUNITIES
5/14/2018 pharma010709-090504162215-phpapp02 - slidepdf.com
http://slidepdf.com/reader/full/pharma010709-090504162215-phpapp02 70/88
www.ibe.org0
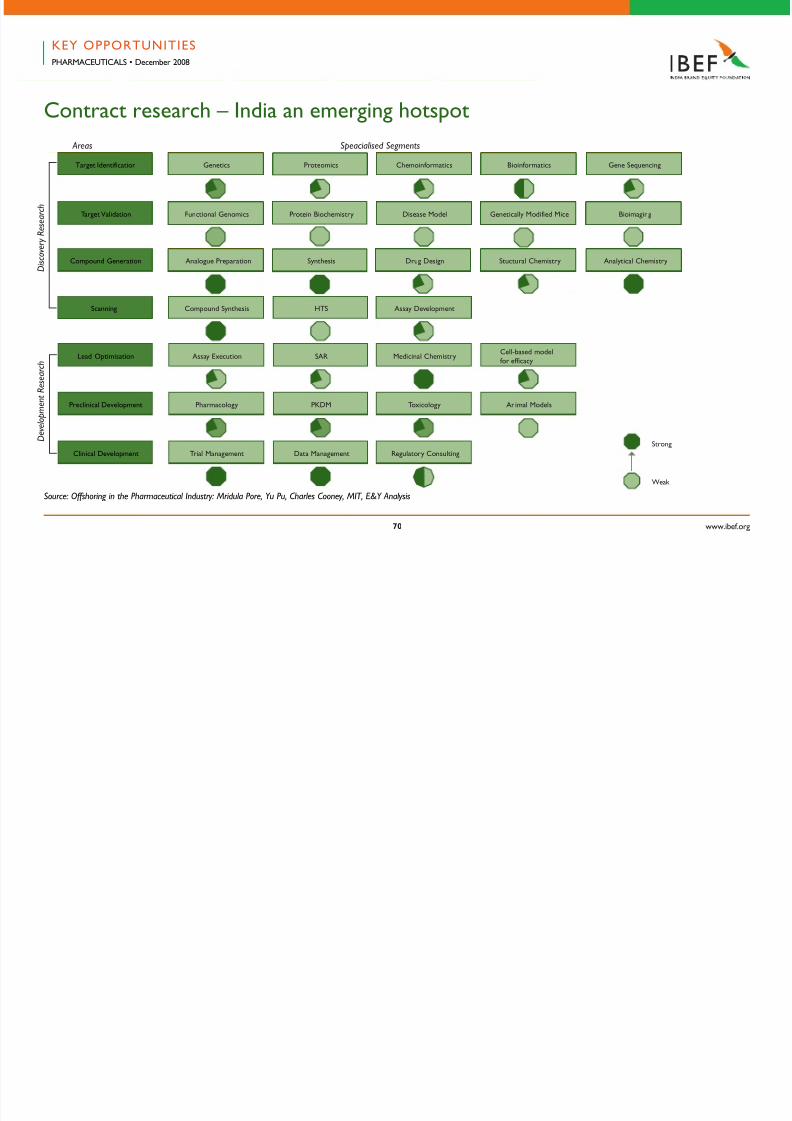
Contract research – India an emerging hotspot
Scanning
Target Identiication Genetics Proteomics Chemoinormatics Bioinormatics Gene Sequencing
Target Validation Functional Genomics Protein Biochemistry Disease Model Genetically Modiied Mice Bioimaging
Compound Generation Analogue Preparation Synthesis Drug Design Stuctural Chemistry Analytical Chemistry
Compound Synthesis HTS Assay Development
Lead Optimisation Assay Execution SAR Medicinal ChemistryCell-based modelor eicacy
Preclinical Development Pharmacology PKDM Toxicology Animal Models
Clinical Development Trial Management Data Management Regulatory Consulting
Source: Offshoring in the Pharmaceutical Industry: Mridula Pore, Yu Pu, Charles Cooney, MIT, E&Y Analysis
Strong
Weak
D i s c o v e r y R e s e a r c h
D e v e l o p m e n t R e s e a r c h
Areas Speacialised Segments
KEY OPPORTUNITIESPHARMACEUTICALS • December 2008
KEY OPPORTUNITIES
5/14/2018 pharma010709-090504162215-phpapp02 - slidepdf.com
http://slidepdf.com/reader/full/pharma010709-090504162215-phpapp02 71/88
www.ibe.org1
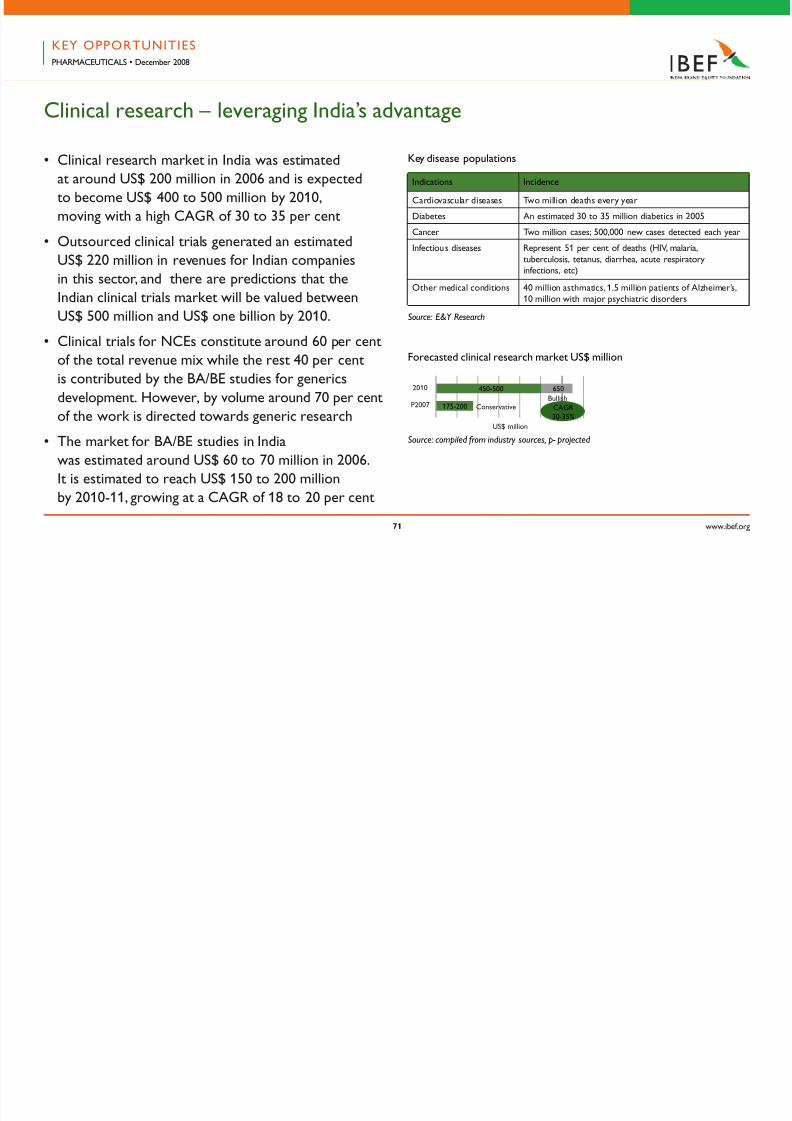
Clinical research – leveraging India’s advantage
• Clinical research market in India was estimated
at around US$ 200 million in 2006 and is expected
to become US$ 400 to 500 million by 2010,
moving with a high CAGR o 30 to 35 per cent
• Outsourced clinical trials generated an estimated
US$ 220 million in revenues or Indian companies
in this sector, and there are predictions that the
Indian clinical trials market will be valued between
US$ 500 million and US$ one billion by 2010.
• Clinical trials or NCEs constitute around 60 per cent
o the total revenue mix while the rest 40 per cent
is contributed by the BA/BE studies or generics
development. However, by volume around 70 per cent
o the work is directed towards generic research
• The market or BA/BE studies in India
was estimated around US$ 60 to 70 million in 2006.
It is estimated to reach US$ 150 to 200 million
by 2010-11, growing at a CAGR o 18 to 20 per cent
Indications Incidence
Cardiovascular diseases Two million deaths every year
Diabetes An estimated 30 to 35 million diabetics in 2005
Cancer Two million cases; 500,000 new cases detected each year
Inectious diseases Represent 51 per cent o deaths (HIV, malaria,
tuberculosis, tetanus, diarrhea, acute respiratoryinections, etc)
Other medical conditions 40 million asthmatics, 1.5 million patients o Alzheimer’s,10 million with major psychiatric disorders
Key disease populations
Source: E&Y Research
Forecasted clinical research market US$ million
2010
P2007 CAGR30-35%
Bullish
450-500
175-200 Conservative
650
US$ million
Source: compiled from industry sources, p- projected
KEY OPPORTUNITIESPHARMACEUTICALS • December 2008
KEY OPPORTUNITIES
5/14/2018 pharma010709-090504162215-phpapp02 - slidepdf.com
http://slidepdf.com/reader/full/pharma010709-090504162215-phpapp02 72/88
www.ibe.org
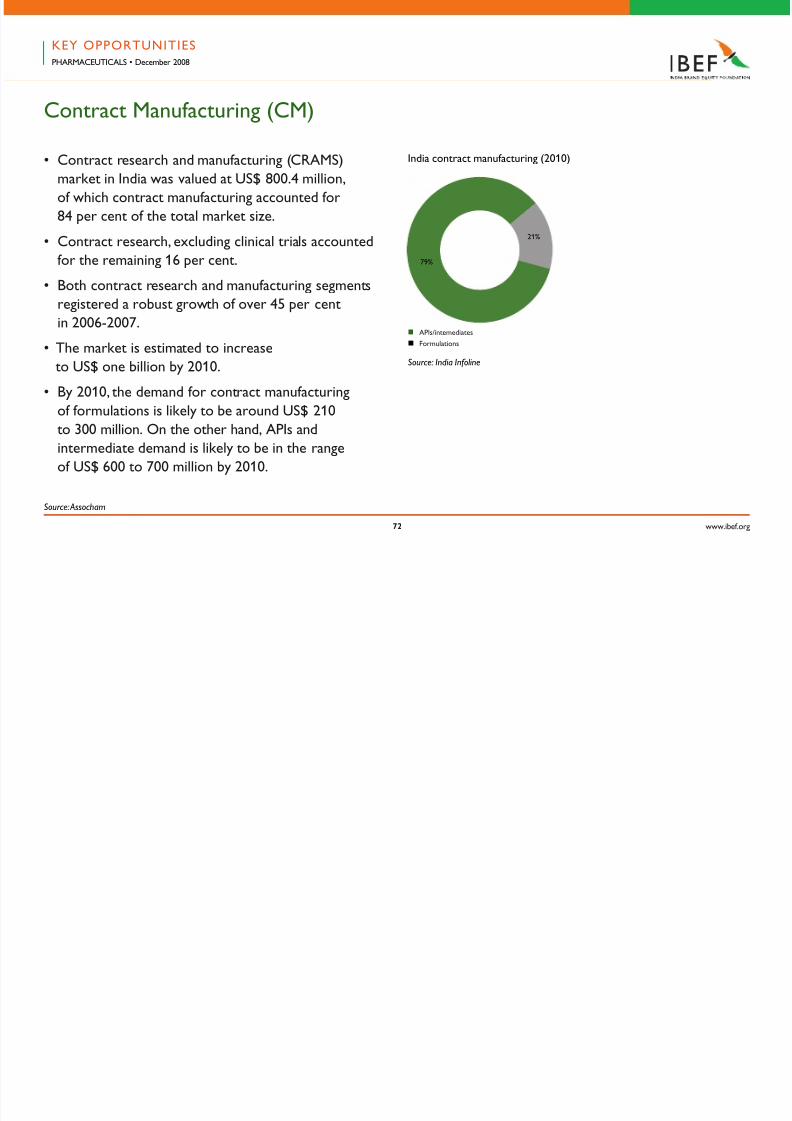
Contract Manuacturing (CM)
• Contract research and manuacturing (CRAMS)
market in India was valued at US$ 800.4 million,
o which contract manuacturing accounted or
84 per cent o the total market size.
• Contract research, excluding clinical trials accounted
or the remaining 16 per cent.
• Both contract research and manuacturing segmentsregistered a robust growth o over 45 per cent
in 2006-2007.
• The market is estimated to increase
to US$ one billion by 2010.
• By 2010, the demand or contract manuacturing
o ormulations is likely to be around US$ 210
to 300 million. On the other hand, APIs andintermediate demand is likely to be in the range
o US$ 600 to 700 million by 2010.
Source: India Infoline
n APls/intemediates
n Formulations
79%
21%
India contract manuacturing (2010)
Source: Assocham
KEY OPPORTUNITIESPHARMACEUTICALS • December 2008
KEY OPPORTUNITIES
5/14/2018 pharma010709-090504162215-phpapp02 - slidepdf.com
http://slidepdf.com/reader/full/pharma010709-090504162215-phpapp02 73/88
www.ibe.org
Contract Manuacturing (CM)
Key Growth Drivers
• Rise in the confdence o global pharma
due to enorcement o product patent
• Large capital investment by Indian companies
in building world class production acilities
• Increased service oerings by Indian players
Source: Assocham
KEY OPPORTUNITIESPHARMACEUTICALS • December 2008
KEY OPPORTUNITIES
5/14/2018 pharma010709-090504162215-phpapp02 - slidepdf.com
http://slidepdf.com/reader/full/pharma010709-090504162215-phpapp02 74/88
www.ibe.org
Oncology – Indian players eyeing the global opportunity
• Cancer accounts or an estimated
7.6 million deaths globally
• Treatment or cancer is estimated to become
the largest sales value area at US$ 55 billion
by 2009, rom the current US$ 45 billion
• The oncology pipeline is the richest in number
and potential in value, with a large numbero pharmaceutical and biotech companies
ocusing on oncology drugs
O O U SPHARMACEUTICALS • December 2008
KEY OPPORTUNITIES
5/14/2018 pharma010709-090504162215-phpapp02 - slidepdf.com
http://slidepdf.com/reader/full/pharma010709-090504162215-phpapp02 75/88
www.ibe.org
Oncology – Indian players eyeing the global opportunity
• Over 50 new oncology products are expected
to be launched in the next fve years with new
players entering the market
• About 30 per cent o all launches
by 2010 will be in oncology
• The global oncology drug market is growing
at 17 per cent annually• Presently, the Indian oncology market stands at
US$ 18.6 million and is expected to treble by 2010
PHARMACEUTICALS • December 2008
KEY OPPORTUNITIES
5/14/2018 pharma010709-090504162215-phpapp02 - slidepdf.com
http://slidepdf.com/reader/full/pharma010709-090504162215-phpapp02 76/88
www.ibe.org
Oncology – Indian players eyeing the global opportunity
• Biocon recently launched its monoclonal antibody-
based drug BIOMAb-EGFR or treating solid tumours.
The company is looking at introducing products
in the US and Europe
• Dabur Pharmaceuticals introduced a
nano technology based chemotherapy agent,
Nanoxel, in the country and plans to take it to
the US and the European markets and has already
planned clinical trials there
• Ranbaxy Laboratories Ltd has entered into
a strategic alliance with Zenotech Laboratories
Ltd. Ranbaxy will market Zenotech’s oncology
cytotoxic injectible products under the Ranbaxy
label, leveraging its global marketing and
distribution network, in the key markets o Latin
America (LATAM), including Brazil and Mexico,
Russia and other CIS markets
PHARMACEUTICALS • December 2008
KEY OPPORTUNITIES
5/14/2018 pharma010709-090504162215-phpapp02 - slidepdf.com
http://slidepdf.com/reader/full/pharma010709-090504162215-phpapp02 77/88
www.ibe.org
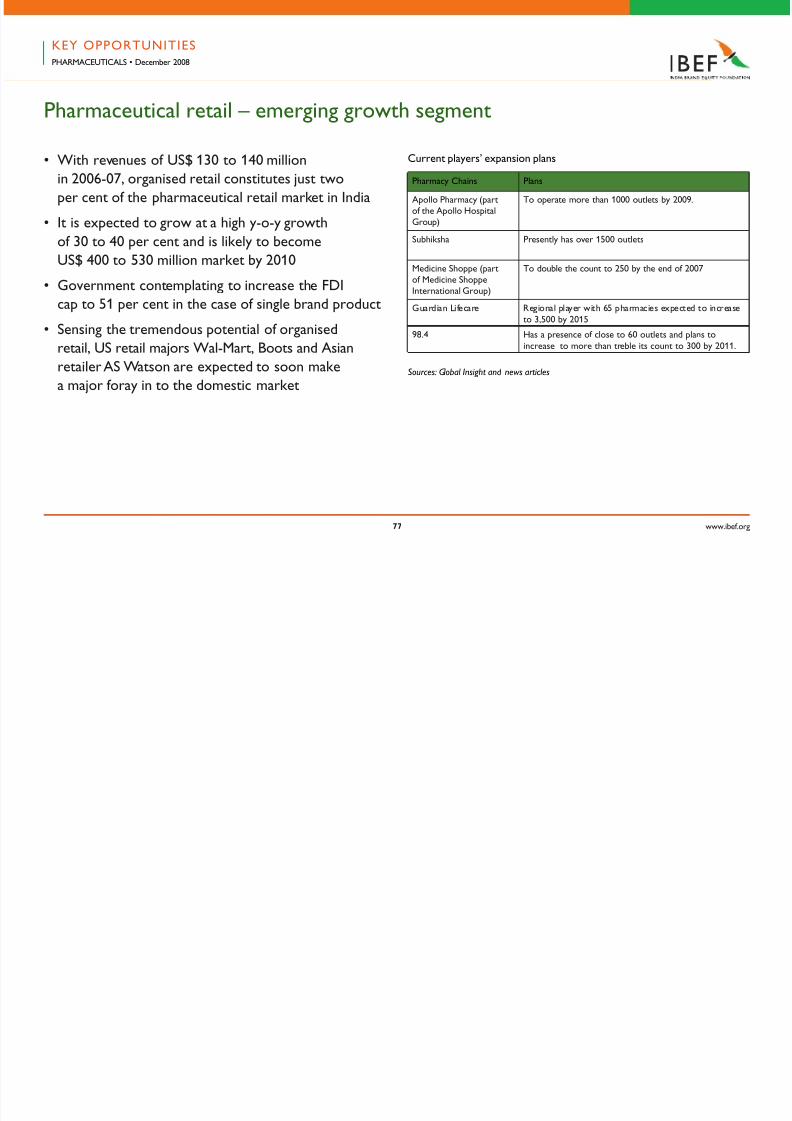
Pharmaceutical retail – emerging growth segment
• With revenues o US$ 130 to 140 million
in 2006-07, organised retail constitutes just two
per cent o the pharmaceutical retail market in India
• It is expected to grow at a high y-o-y growth
o 30 to 40 per cent and is likely to become
US$ 400 to 530 million market by 2010
• Government contemplating to increase the FDIcap to 51 per cent in the case o single brand product
• Sensing the tremendous potential o organised
retail, US retail majors Wal-Mart, Boots and Asian
retailer AS Watson are expected to soon make
a major oray in to the domestic marketSources: Global Insight and news articles
Pharmacy Chains Plans
Apollo Pharmacy (parto the Apollo HospitalGroup)
To operate more than 1000 outlets by 2009.
Subhiksha Presently has over 1500 outlets
Medicine Shoppe (parto Medicine Shoppe
International Group)
To double the count to 250 by the end o 2007
Guardian Liecare Regional player with 65 pharmacies expected to increase
to 3,500 by 2015
98.4 Has a presence o close to 60 outlets and plans toincrease to more than treble its count to 300 by 2011.
Current players’ expansion plans
PHARMACEUTICALS • December 2008
KEY OPPORTUNITIES
5/14/2018 pharma010709-090504162215-phpapp02 - slidepdf.com
http://slidepdf.com/reader/full/pharma010709-090504162215-phpapp02 78/88
www.ibe.org
Indian pharmaceutical players - retail plans
Case Study: Reliance Retail
• The Mukesh Dhirubhai Ambani Group
is planning a oray into the pharma retail
segment. This is part o an overall strategy or
building super-malls in 21 zones across India.
Through its biopharmaceutical venture,
Reliance Lie Sciences, the frm is due
to increase investments, targeting US$ 33 billion
o the local market by 2012
• The company has allocated US$ 2.2 billion or
setting up production acilities. The frm is also
keen on acquiring small local drug-producing
units and companies to oer low-margin drugs
at the retail level
PHARMACEUTICALS • December 2008
KEY OPPORTUNITIES
5/14/2018 pharma010709-090504162215-phpapp02 - slidepdf.com
http://slidepdf.com/reader/full/pharma010709-090504162215-phpapp02 79/88
www.ibe.org
Indian pharmaceutical players - retail plans
Case Study: AIOCD
• All India Organisation o Chemists and Druggists
(AIOCD) is a leading industry association with
a membership o around 6,00,000 pharma retailers
and wholesalers in the country. It would acilitate
the creation o a centralised procurement system
and a Special Purpose Vehicle (SPV) network
in each state
• A centralised procurement system is part
o a general push by AIOCD towards a network
o small pharma retailers, who have dominated
the Indian market or decades. This initiative
was test-piloted last year in Maharashtra,
where the largest network o small pharma
retailers exists
PHARMACEUTICALS • December 2008
KEY OPPORTUNITIES
5/14/2018 pharma010709-090504162215-phpapp02 - slidepdf.com
http://slidepdf.com/reader/full/pharma010709-090504162215-phpapp02 80/88
www.ibe.org0
Indian pharmaceutical players - retail plans
Case Study: Ranbaxy/Fortis
• Ranbaxy-backed Fortis Healthcare has laid
plans to enter the pharma retail segment,
investing close to US$ 1.7 billion. Fortis will
roll out 1,000 shops covering 400 towns across
the country in fve years. The frst 250 o these
are expected to be operational by the end
o 2008-09. The retail unit will promote products
and services oered by both Ranbaxy
Laboratories and Fortis Healthcare
PHARMACEUTICALS • December 2008
KEY OPPORTUNITIES
5/14/2018 pharma010709-090504162215-phpapp02 - slidepdf.com
http://slidepdf.com/reader/full/pharma010709-090504162215-phpapp02 81/88
www.ibe.org1
Indian pharmaceutical players - retail plans
Case Study: Zydus Cadila
• Zydus Cadila plans to create a separate company
rom its health product lines. The frst outlet
o this new company was commissioned
in 2007. The company expects to enhance its
product range by launching a smoking-cessation
product and hopes to improve its revenues
by close to 300 per cent to US$ one billion
rom the current US$ 266 million
PHARMACEUTICALS • December 2008
KEY OPPORTUNITIES
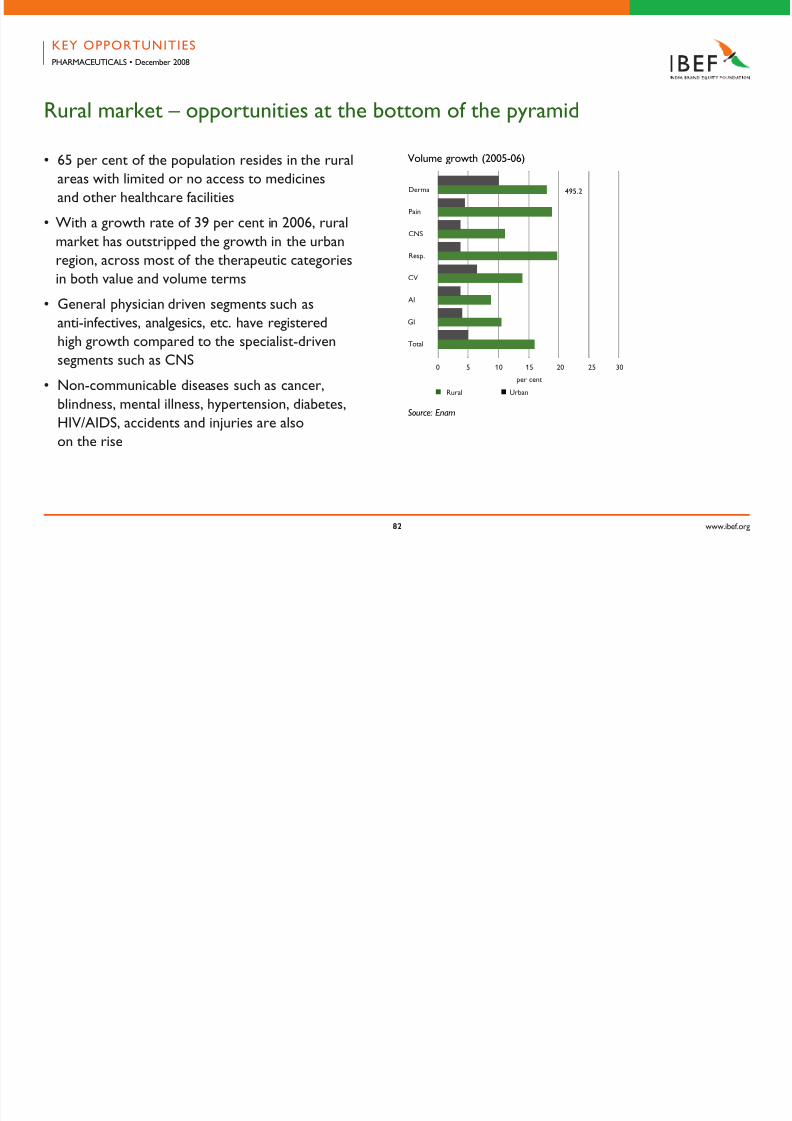
5/14/2018 pharma010709-090504162215-phpapp02 - slidepdf.com
http://slidepdf.com/reader/full/pharma010709-090504162215-phpapp02 82/88
www.ibe.org
Rural market – opportunities at the bottom o the pyramid
• 65 per cent o the population resides in the rural
areas with limited or no access to medicines
and other healthcare acilities
• With a growth rate o 39 per cent in 2006, rural
market has outstripped the growth in the urban
region, across most o the therapeutic categories
in both value and volume terms
• General physician driven segments such as
anti-inectives, analgesics, etc. have registered
high growth compared to the specialist-driven
segments such as CNS
• Non-communicable diseases such as cancer,
blindness, mental illness, hypertension, diabetes,
HIV/AIDS, accidents and injuries are alsoon the rise
PHARMACEUTICALS • December 2008
Volume growth (2005-06)
Source: Enam
CNS
Resp.
CV
AI
GI
Total
97.8
5 10 15 20 25 300
Pain
Derma 495.2
per cent
n Rural n Urban
KEY OPPORTUNITIES
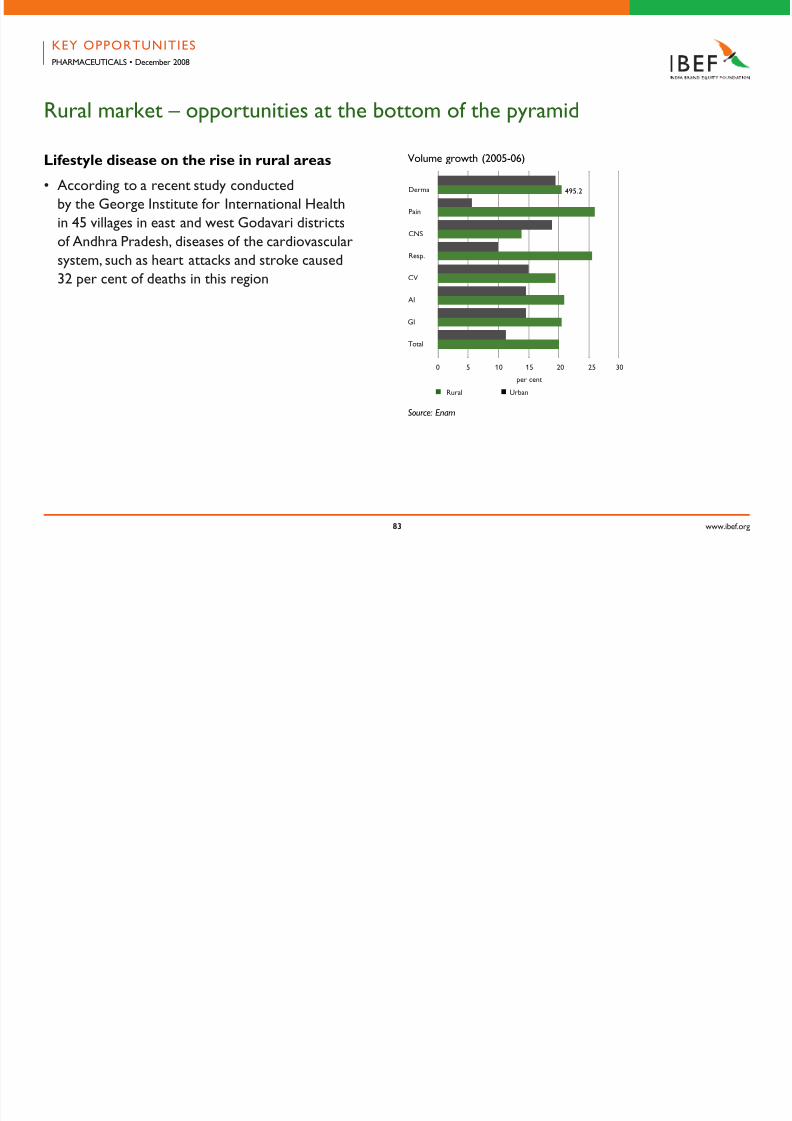
5/14/2018 pharma010709-090504162215-phpapp02 - slidepdf.com
http://slidepdf.com/reader/full/pharma010709-090504162215-phpapp02 83/88
www.ibe.org
Rural market – opportunities at the bottom o the pyramid
Liestyle disease on the rise in rural areas
• According to a recent study conducted
by the George Institute or International Health
in 45 villages in east and west Godavari districts
o Andhra Pradesh, diseases o the cardiovascular
system, such as heart attacks and stroke caused
32 per cent o deaths in this region
PHARMACEUTICALS • December 2008
Volume growth (2005-06)
Source: Enam
CNS
Resp.
CV
AI
GI
Total
97.8
5 10 15 20 25 300
Pain
Derma 495.2
per cent
n Rural n Urban
KEY OPPORTUNITIES
5/14/2018 pharma010709-090504162215-phpapp02 - slidepdf.com
http://slidepdf.com/reader/full/pharma010709-090504162215-phpapp02 84/88
www.ibe.org
Biopharma – domestic players eyeing the global bio-similar market
• Globally, sales o biological drugs are estimated
to reach US$ 52 billion by 2010
• Leading Indian companies are intensiying
their ocus on the biotech segment
• Presently one in every our drugs under development
is biologic
• Moreover, Indian players are also eyeing thehuge opportunity presented by biosimilars
across the globe
PHARMACEUTICALS • December 2008
KEY OPPORTUNITIES
5/14/2018 pharma010709-090504162215-phpapp02 - slidepdf.com
http://slidepdf.com/reader/full/pharma010709-090504162215-phpapp02 85/88
www.ibe.org
Biopharma – domestic players eyeing the global bio-similar market
• Leading Indian pharmaceutical companies such
as Biocon, Ranbaxy, Dr.Reddy’s, Wockhardt and
Glenmark have invested in manuacturing
acilities or biosimilars
• A legal ramework or biosimilars has been
established in the EU
• Further, US is expected to set up an approvalramework or biosimilars soon
PHARMACEUTICALS • December 2008
KEY OPPORTUNITIES
5/14/2018 pharma010709-090504162215-phpapp02 - slidepdf.com
http://slidepdf.com/reader/full/pharma010709-090504162215-phpapp02 86/88
www.ibe.org
Biopharma – domestic players eying the global bio-similar market
Key Initiatives o Indian Companies
• Ranbaxy Laboratories has signed a development
and marketing agreement with generic
injectables company Zenotech Laboratories
to produce its frst biosimilar G-CSF
• Reliance Lie Sciences has bought 74 per cent stake
in GeneMedix. The joint entity will developbiosimilar drugs and oer ull service in CRAMS
• DRL has created a copy o Roche’s Rituximab
which is used to treat Non-Hodgkin’s lymphoma
which generated more than US$ two billion last year.
Marketed by Genentech Inc. and Biogen Idec
Inc. as Rituxan in the US
• Dr. Reddy’s sells Graeel or flgrastim in India,which is used to boost white blood-cell
production and is marketed by Amgen in the US
PHARMACEUTICALS • December 2008
KEY OPPORTUNITIES
5/14/2018 pharma010709-090504162215-phpapp02 - slidepdf.com
http://slidepdf.com/reader/full/pharma010709-090504162215-phpapp02 87/88
www.ibe.org
Biopharma – domestic players eyeing the global bio-similar market
• Glenmark has set up biologics research acility
in Switzerland with 25+ European scientists.
It expects frst biological lead to enter into clinics
in 2009 and two more by 2010
• Glenmark tied up with US based Dyax
to expedite biologics research. Dyax will perorm
unded research or three o Glenmark’s targets
in the areas o inammation and oncology
• Biocon has started clinical trial on Insugen,
BIOMAb-EGFR trials in the regulated markets
PHARMACEUTICALS • December 2008
PHARMACEUTICALSD b 2008
5/14/2018 pharma010709-090504162215-phpapp02 - slidepdf.com
http://slidepdf.com/reader/full/pharma010709-090504162215-phpapp02 88/88
December 2008
This presentation has been prepared jointly by the
India Brand Equity Foundation (“IBEF”) and Ernst & Young
Pvt. Ltd. (“Authors”).
All rights reserved. All copyright in this presentation and related
works is owned by IBEF and the Authors. The same may not be
reproduced, wholly or in part in any material orm (including
photocopying or storing it in any medium by electronic
means and whether or not transiently or incidentally to some
other use o this presentation), modifed or in any manner
communicated to any third party except with the written
approval o IBEF.
This presentation is or inormation purposes only. While due
care has been taken during the compilation o this presentation
to ensure that the inormation is accurate to the best o the
Author’s and IBEF’s knowledge and belie, the content is not
to be construed in any manner whatsoever as a substitute or
proessional advice.
The Author and IBEF neither recommend or endorse any
specifc products or services that may have been mentioned
in this presentation and nor do they assume any liability or
responsibility or the outcome o decisions taken as a result
o any reliance placed in this presentation.
Neither the Author nor IBEF shall be liable or any direct or
indirect damages that may arise due to any act or omission
on the part o the user due to any reliance placed or guidance
taken rom any portion o this presentation.
DISCLAIMER