Embed Size (px)
Citation preview
Pharm Country™ – A BioSpace Hotbed Campaign © 2012-2013 BioSpace. All Rights Reserved. (888) BIOSPACE
biospace.com/pharmcountry
Pharm CountryEconomic Outlook Report
New Jersey New York Connecticut Pennsylvania
2888-BIOSPACE | 6465 South Greenwood Plaza Boulevard, Suite 400 Centennial, CO 80111 | BioSpace.com
Pharm Country: Economic Outlook
IntroductionAfter several difficult years with job losses routinely numbering in the tens of thousands, things are finally looking up for the life sciences industry. According to the Bureau of Labor statistics, employment in biopharmaceutical and medical device manufacturing will increase 10 percent this decade. However, the true economic contribution of this vital sector is even greater than that. Analysts have estimated that every biopharmaceutical industry job supports five positions in other industries across the US economy—from manufacturing to construction to transportation and beyond 1. In addition to these essential jobs, the sector produces valuable exports, which are also increasing. Experts predict an increase of 304 percent in biopharmaceutical exports over the next 15 years. Medical equipment exports are predicted to increase by 192 percent 2.
The total economic output of the industry was $918 billion in 2009 3. According to the Pharmaceutical Research and Manufacturers of America, the sector supports nearly four million jobs across the economy and reinvests billions of dollars into research and development each year 4.
Of course, it’s rather volatile and unpredictable as well. Encompassing biotechnology, pharmaceutical and medical device development and manufacturing as well as education, research and clinical trials, industry players include privately funded and publically traded companies—all intricately interconnected.
You will find a number of them in Pharm Country, the BioSpace hotbed region of Connecticut, New York State, New Jersey, and Pennsylvania. It is home to world-class research institutions, life science companies and pharmaceutical powerhouses. Employers include ViroPharma Incorporated, MedImmune, Watson Pharmaceuticals, Pfizer, SGS, Amicus Therapeutics, Purdue Pharma L.P., and Regeneron Pharmaceuticals, Inc.
For many of these organizations—and the professionals who wish to work for them—2013 is shaping up to be a prosperous year. Pharm Country was third on BioSpace.com’s list of top hiring locations in 2012, only behind California and Massachusetts, and employers continue to post new jobs every month.
3888-BIOSPACE | 6465 South Greenwood Plaza Boulevard, Suite 400 Centennial, CO 80111 | BioSpace.com
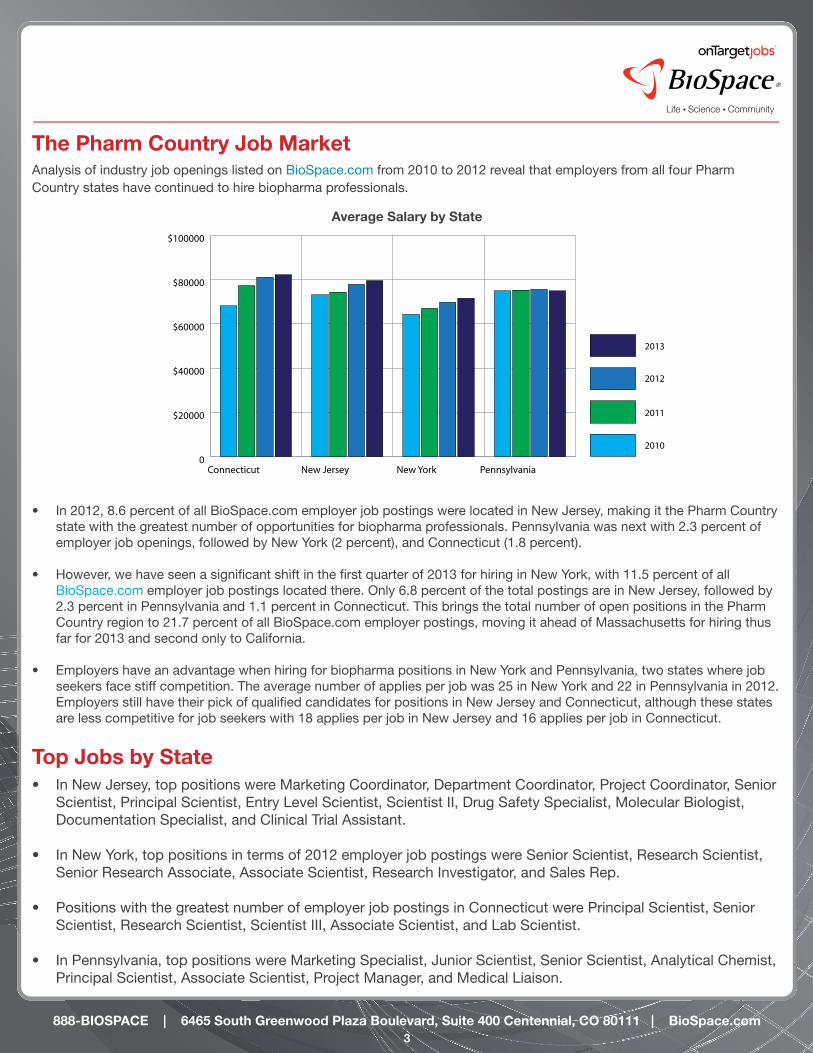
The Pharm Country Job MarketAnalysis of industry job openings listed on BioSpace.com from 2010 to 2012 reveal that employers from all four Pharm Country states have continued to hire biopharma professionals.
0
$20000
$40000
$60000
$80000
$100000
2013
2012
2011
2010
PennsylvaniaNew YorkNew JerseyConnecticut
Average Salary by State
• In 2012, 8.6 percent of all BioSpace.com employer job postings were located in New Jersey, making it the Pharm Country state with the greatest number of opportunities for biopharma professionals. Pennsylvania was next with 2.3 percent of employer job openings, followed by New York (2 percent), and Connecticut (1.8 percent).
• However, we have seen a significant shift in the first quarter of 2013 for hiring in New York, with 11.5 percent of all BioSpace.com employer job postings located there. Only 6.8 percent of the total postings are in New Jersey, followed by 2.3 percent in Pennsylvania and 1.1 percent in Connecticut. This brings the total number of open positions in the Pharm Country region to 21.7 percent of all BioSpace.com employer postings, moving it ahead of Massachusetts for hiring thus far for 2013 and second only to California.
• Employers have an advantage when hiring for biopharma positions in New York and Pennsylvania, two states where job seekers face stiff competition. The average number of applies per job was 25 in New York and 22 in Pennsylvania in 2012. Employers still have their pick of qualified candidates for positions in New Jersey and Connecticut, although these states are less competitive for job seekers with 18 applies per job in New Jersey and 16 applies per job in Connecticut.
Top Jobs by State• In New Jersey, top positions were Marketing Coordinator, Department Coordinator, Project Coordinator, Senior
Scientist, Principal Scientist, Entry Level Scientist, Scientist II, Drug Safety Specialist, Molecular Biologist, Documentation Specialist, and Clinical Trial Assistant.
• In New York, top positions in terms of 2012 employer job postings were Senior Scientist, Research Scientist, Senior Research Associate, Associate Scientist, Research Investigator, and Sales Rep.
• Positions with the greatest number of employer job postings in Connecticut were Principal Scientist, Senior Scientist, Research Scientist, Scientist III, Associate Scientist, and Lab Scientist.
• In Pennsylvania, top positions were Marketing Specialist, Junior Scientist, Senior Scientist, Analytical Chemist, Principal Scientist, Associate Scientist, Project Manager, and Medical Liaison.
4888-BIOSPACE | 6465 South Greenwood Plaza Boulevard, Suite 400 Centennial, CO 80111 | BioSpace.com
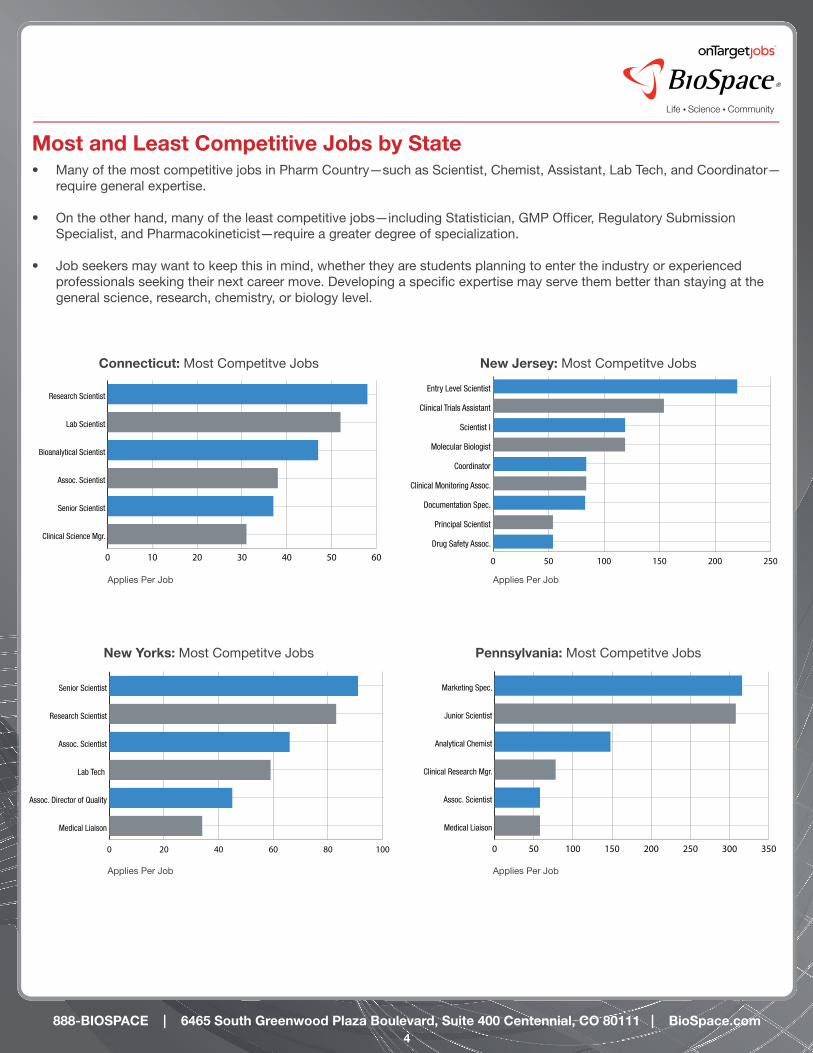
Most and Least Competitive Jobs by State• Many of the most competitive jobs in Pharm Country—such as Scientist, Chemist, Assistant, Lab Tech, and Coordinator—
require general expertise.
• On the other hand, many of the least competitive jobs—including Statistician, GMP Officer, Regulatory Submission Specialist, and Pharmacokineticist—require a greater degree of specialization.
• Job seekers may want to keep this in mind, whether they are students planning to enter the industry or experienced professionals seeking their next career move. Developing a specific expertise may serve them better than staying at the general science, research, chemistry, or biology level.
0 10 20 30 40 50 60
Clinical Science Mgr.
Senior Scientist
Assoc. Scientist
Bioanalytical Scientist
Lab Scientist
Research Scientist
0 50 100 150 200 250 300 350
Medical Liaison
Assoc. Scientist
Clinical Research Mgr.
Analytical Chemist
Junior Scientist
Marketing Spec.
0 50 100 150 200 250
Drug Safety Assoc.
Principal Scientist
Documentation Spec.
Clinical Monitoring Assoc.
Coordinator
Molecular Biologist
Scientist I
Clinical Trials Assistant
Entry Level Scientist
0 20 40 60 80 100
Medical Liaison
Assoc. Director of Quality
Lab Tech
Assoc. Scientist
Research Scientist
Senior Scientist
New Jersey: Most Competitve Jobs
New Yorks: Most Competitve Jobs
Connecticut: Most Competitve Jobs
Pennsylvania: Most Competitve Jobs
Applies Per Job
Applies Per Job
Applies Per Job
Applies Per Job
5888-BIOSPACE | 6465 South Greenwood Plaza Boulevard, Suite 400 Centennial, CO 80111 | BioSpace.com
Possible Job Market Contributing Factors Drug Approvals Continue – The FDA approved a record number of drugs in 2012, and America’s biopharmaceutical companies have more than 900 biologic medicines and vaccines in the development pipeline right now 5. This should sustain hiring within the industry, as the US continues to outpace Europe and Canada in the approval of new medicines 6. However, there is one potential bump in the road. The government’s recent sequestration measures reduced FDA funding, which could slow the review process for fiscal year 2013.
Health IT Gaining Ground – In May 2012, MedXCom in Bedminster, NJ, was working on a HIPPA-friendly smartphone application that doctors can use to talk to patients about their health issues. In July, MedStarr opened doors in New York, generating crowd funding for healthcare technology and service entrepreneurs. Pharm Country, already a mecca of technology, should see an expansion of health IT companies in 20137.
The Pharm Country WorkforceSalary Analysis
Analysis of salary data collected from the BioSpace.com candidate pool reveals a few trends Pharm Country life science professionals should find reassuring. For the most part, salaries increased from 2010 to 2012 and many have continued that upswing into 2013. However, it’s important to note that the data set for the current year is still relatively small, encompassing only resumes entered within the first three months of 2013. This may skew the results somewhat, through we removed any data that appeared to contribute to large inconsistencies.
• Average salaries across all positions have increased from 2010 to 2013 in all Pharm Country states. In most cases, increases have been quite substantial. The average in Connecticut has increased by 20.6 percent, followed by 11.4 percent in New York and 8.8 percent in New Jersey. There has been little change in salary in Pennsylvania.
• Overall, Connecticut appears to pay biopharma employees best, holding the spot for the highest average salary for three out of the four years analyzed (all but 2010). Average salary in New York State is lower than that of other Pharm Country states for all four years. This may be a result, at least in part, of supply and demand. In Connecticut, employers receive the fewest applies per job, and may be required to pay more for the best professionals. Employers in New York receive the most applies per position, giving them a greater advantage over job seekers and the upper hand in salary negotiations.
• Salaries in Pharm Country are keeping pace with inflation. According to the US Consumer Price Index data, the cumulative rate of inflation from 2010 to 2013 is 6.5 percent. Average salaries in Pharm Country have outpaced inflation in Connecticut, New York and New Jersey. Pennsylvania’s average salary has changed little over the last three years, so professionals in that area might be feeling inflation’s pinch.
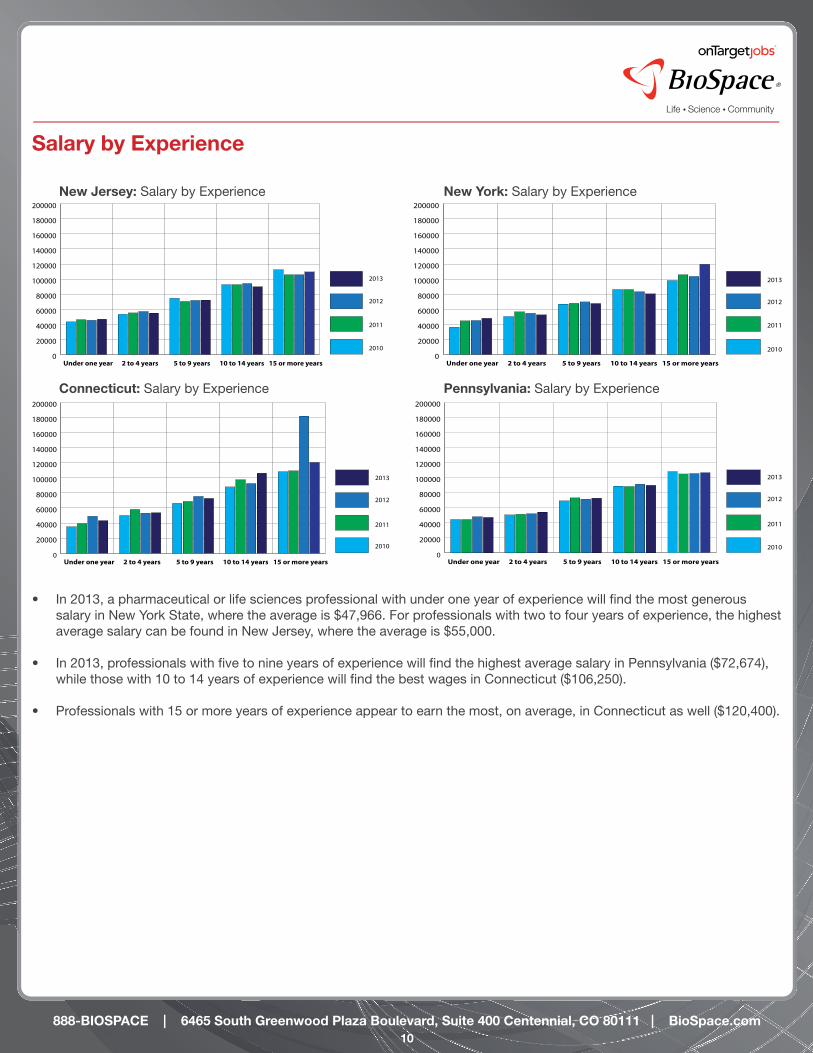
• In 2013, a pharmaceutical or life sciences professional with under one year of experience will find the most generous salary in New York State, where the average is $47,966. For professionals with two to four years of experience, the highest average salary can be found in New Jersey, where the average is $55,000.
6888-BIOSPACE | 6465 South Greenwood Plaza Boulevard, Suite 400 Centennial, CO 80111 | BioSpace.com
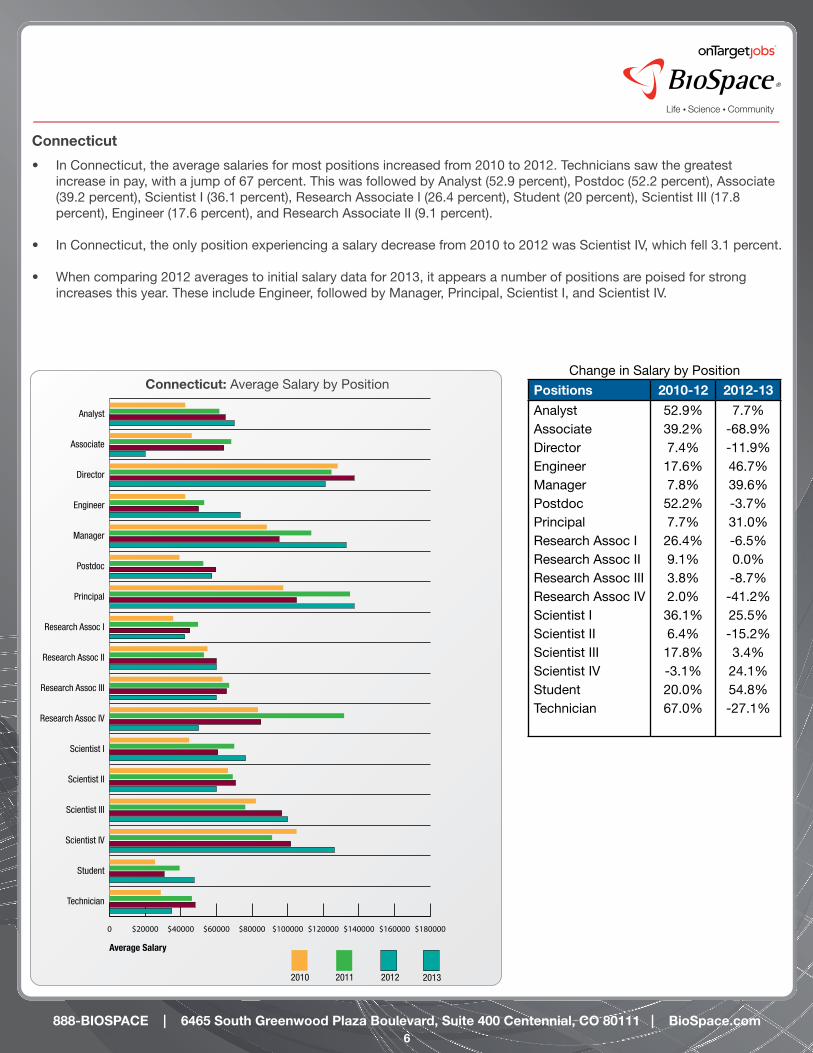
Connecticut
• In Connecticut, the average salaries for most positions increased from 2010 to 2012. Technicians saw the greatest increase in pay, with a jump of 67 percent. This was followed by Analyst (52.9 percent), Postdoc (52.2 percent), Associate (39.2 percent), Scientist I (36.1 percent), Research Associate I (26.4 percent), Student (20 percent), Scientist III (17.8 percent), Engineer (17.6 percent), and Research Associate II (9.1 percent).
• In Connecticut, the only position experiencing a salary decrease from 2010 to 2012 was Scientist IV, which fell 3.1 percent.
• When comparing 2012 averages to initial salary data for 2013, it appears a number of positions are poised for strong increases this year. These include Engineer, followed by Manager, Principal, Scientist I, and Scientist IV.
0 $20000 $40000 $60000 $80000 $100000 $120000 $140000 $160000 $180000
Technician
Student
Scientist IV
Scientist III
Scientist II
Scientist I
Research Assoc IV
Research Assoc III
Research Assoc II
Research Assoc I
Principal
Postdoc
Manager
Engineer
Director
Associate
Analyst
2010 2011 2012 2013
Average Salary
Positions 2010-12 2012-13
AnalystAssociateDirectorEngineerManagerPostdocPrincipalResearch Assoc IResearch Assoc IIResearch Assoc IIIResearch Assoc IVScientist IScientist IIScientist IIIScientist IVStudentTechnician
52.9%39.2%7.4%17.6%7.8%52.2%7.7%26.4%9.1%3.8%2.0%36.1%6.4%17.8%-3.1%20.0%67.0%
7.7%-68.9%-11.9%46.7%39.6%-3.7%31.0%-6.5%0.0%-8.7%
-41.2%25.5%-15.2%3.4%
24.1%54.8%-27.1%
Connecticut: Average Salary by PositionChange in Salary by Position
7888-BIOSPACE | 6465 South Greenwood Plaza Boulevard, Suite 400 Centennial, CO 80111 | BioSpace.com
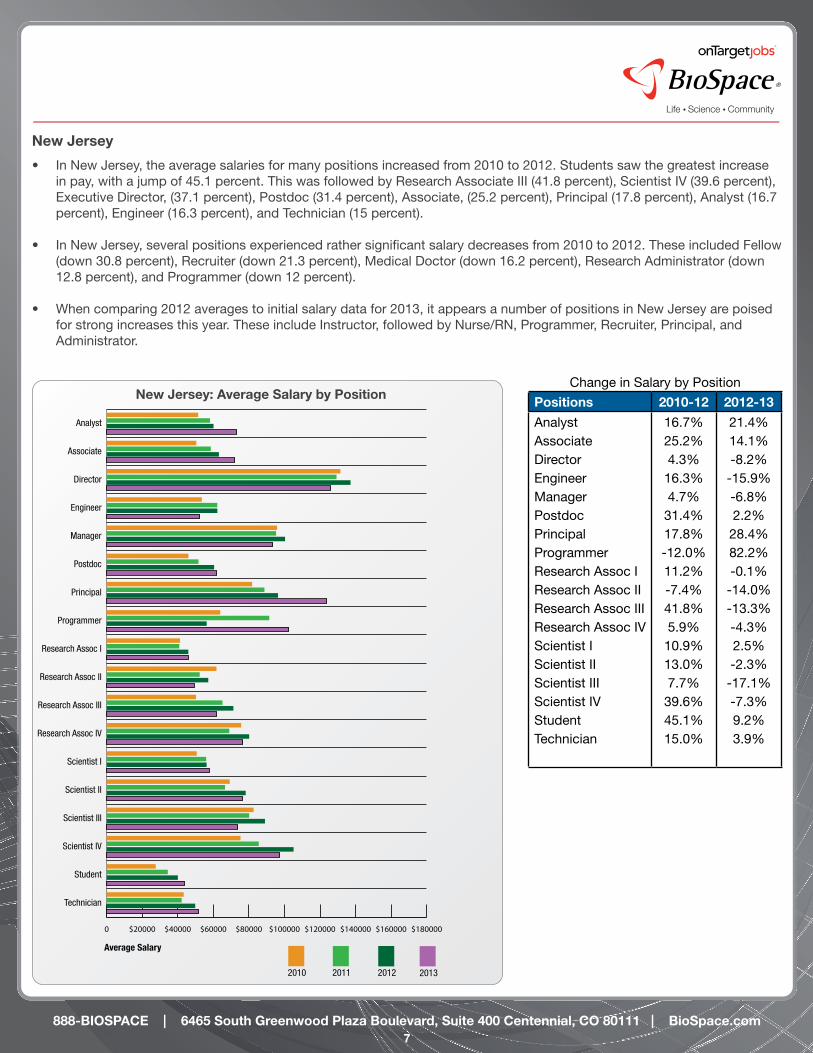
New Jersey
• In New Jersey, the average salaries for many positions increased from 2010 to 2012. Students saw the greatest increase in pay, with a jump of 45.1 percent. This was followed by Research Associate III (41.8 percent), Scientist IV (39.6 percent), Executive Director, (37.1 percent), Postdoc (31.4 percent), Associate, (25.2 percent), Principal (17.8 percent), Analyst (16.7 percent), Engineer (16.3 percent), and Technician (15 percent).
• In New Jersey, several positions experienced rather significant salary decreases from 2010 to 2012. These included Fellow (down 30.8 percent), Recruiter (down 21.3 percent), Medical Doctor (down 16.2 percent), Research Administrator (down 12.8 percent), and Programmer (down 12 percent).
• When comparing 2012 averages to initial salary data for 2013, it appears a number of positions in New Jersey are poised for strong increases this year. These include Instructor, followed by Nurse/RN, Programmer, Recruiter, Principal, and Administrator.
0 $20000 $40000 $60000 $80000 $100000 $120000 $140000 $160000 $180000
Technician
Student
Scientist IV
Scientist III
Scientist II
Scientist I
Research Assoc IV
Research Assoc III
Research Assoc II
Research Assoc I
Programmer
Principal
Postdoc
Manager
Engineer
Director
Associate
Analyst
2010 2011 2012 2013
Average Salary
Positions 2010-12 2012-13
AnalystAssociateDirectorEngineerManagerPostdocPrincipalProgrammerResearch Assoc IResearch Assoc IIResearch Assoc IIIResearch Assoc IVScientist IScientist IIScientist IIIScientist IVStudentTechnician
16.7%25.2%4.3%16.3%4.7%31.4%17.8%-12.0%11.2%-7.4%41.8%5.9%10.9%13.0%7.7%39.6%45.1%15.0%
21.4%14.1%-8.2%
-15.9%-6.8%2.2%
28.4%82.2%-0.1%
-14.0%-13.3%-4.3%2.5%-2.3%
-17.1%-7.3%9.2%3.9%
New Jersey: Average Salary by PositionChange in Salary by Position
8888-BIOSPACE | 6465 South Greenwood Plaza Boulevard, Suite 400 Centennial, CO 80111 | BioSpace.com
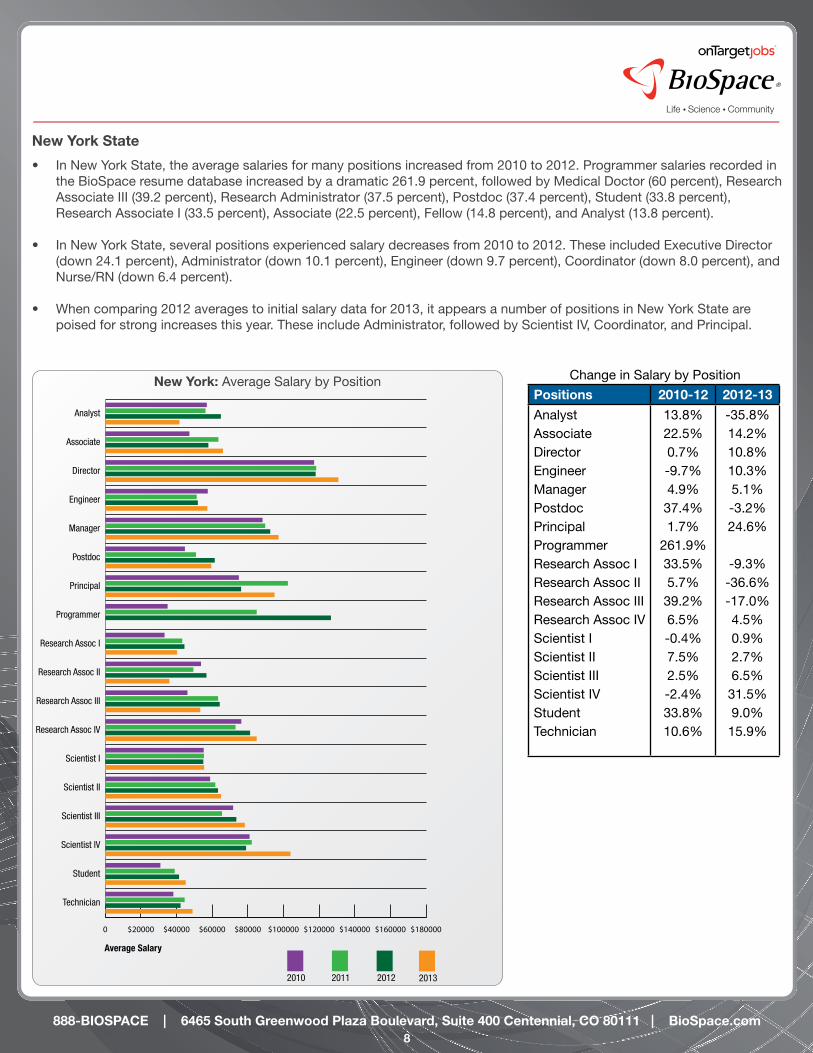
New York State
• In New York State, the average salaries for many positions increased from 2010 to 2012. Programmer salaries recorded in the BioSpace resume database increased by a dramatic 261.9 percent, followed by Medical Doctor (60 percent), Research Associate III (39.2 percent), Research Administrator (37.5 percent), Postdoc (37.4 percent), Student (33.8 percent), Research Associate I (33.5 percent), Associate (22.5 percent), Fellow (14.8 percent), and Analyst (13.8 percent).
• In New York State, several positions experienced salary decreases from 2010 to 2012. These included Executive Director (down 24.1 percent), Administrator (down 10.1 percent), Engineer (down 9.7 percent), Coordinator (down 8.0 percent), and Nurse/RN (down 6.4 percent).
• When comparing 2012 averages to initial salary data for 2013, it appears a number of positions in New York State are poised for strong increases this year. These include Administrator, followed by Scientist IV, Coordinator, and Principal.
0 $20000 $40000 $60000 $80000 $100000 $120000 $140000 $160000 $180000
Technician
Student
Scientist IV
Scientist III
Scientist II
Scientist I
Research Assoc IV
Research Assoc III
Research Assoc II
Research Assoc I
Programmer
Principal
Postdoc
Manager
Engineer
Director
Associate
Analyst
2010 2011 2012 2013
Average Salary
Positions 2010-12 2012-13
AnalystAssociateDirectorEngineerManagerPostdocPrincipalProgrammerResearch Assoc IResearch Assoc IIResearch Assoc IIIResearch Assoc IVScientist IScientist IIScientist IIIScientist IVStudentTechnician
13.8%22.5%0.7%-9.7%4.9%37.4%1.7%
261.9%33.5%5.7%39.2%6.5%-0.4%7.5%2.5%-2.4%33.8%10.6%
-35.8%14.2%10.8%10.3%5.1%-3.2%24.6%
-9.3%-36.6%-17.0%4.5%0.9%2.7%6.5%
31.5%9.0%
15.9%
New York: Average Salary by Position Change in Salary by Position
9888-BIOSPACE | 6465 South Greenwood Plaza Boulevard, Suite 400 Centennial, CO 80111 | BioSpace.com
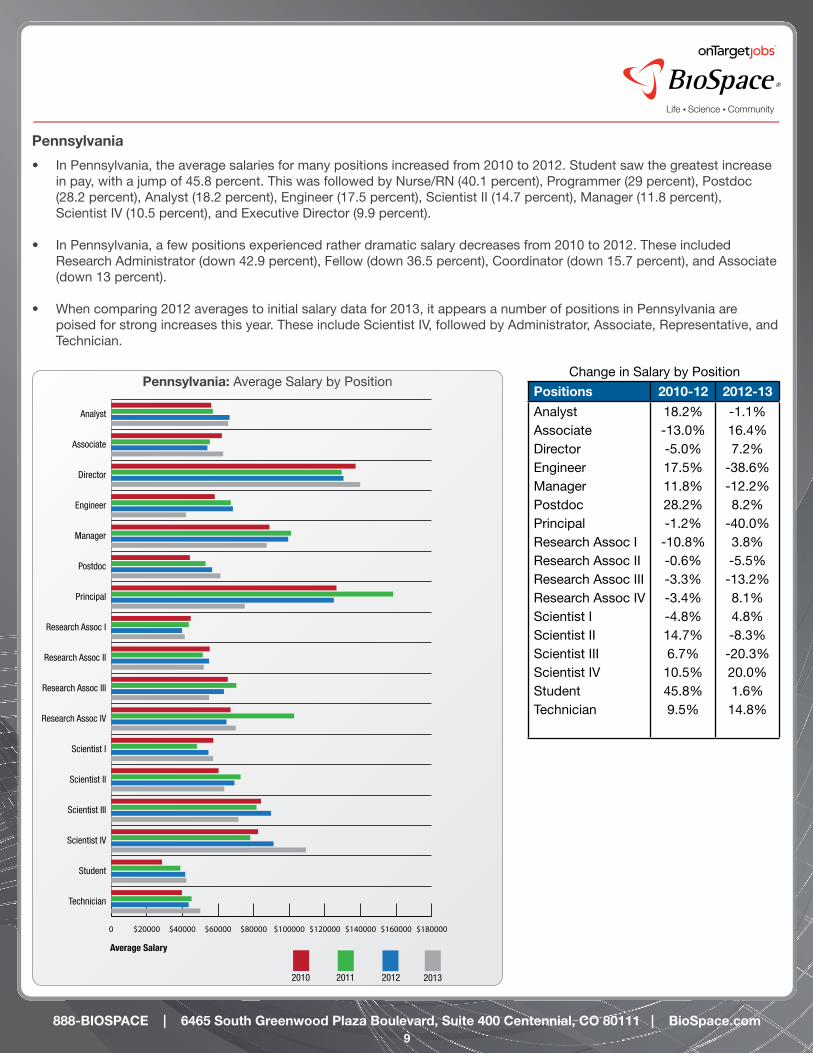
Pennsylvania
• In Pennsylvania, the average salaries for many positions increased from 2010 to 2012. Student saw the greatest increase in pay, with a jump of 45.8 percent. This was followed by Nurse/RN (40.1 percent), Programmer (29 percent), Postdoc (28.2 percent), Analyst (18.2 percent), Engineer (17.5 percent), Scientist II (14.7 percent), Manager (11.8 percent), Scientist IV (10.5 percent), and Executive Director (9.9 percent).
• In Pennsylvania, a few positions experienced rather dramatic salary decreases from 2010 to 2012. These included Research Administrator (down 42.9 percent), Fellow (down 36.5 percent), Coordinator (down 15.7 percent), and Associate (down 13 percent).
• When comparing 2012 averages to initial salary data for 2013, it appears a number of positions in Pennsylvania are poised for strong increases this year. These include Scientist IV, followed by Administrator, Associate, Representative, and Technician.
0 $20000 $40000 $60000 $80000 $100000 $120000 $140000 $160000 $180000
Technician
Student
Scientist IV
Scientist III
Scientist II
Scientist I
Research Assoc IV
Research Assoc III
Research Assoc II
Research Assoc I
Principal
Postdoc
Manager
Engineer
Director
Associate
Analyst
2010 2011 2012 2013
Average Salary
Positions 2010-12 2012-13
AnalystAssociateDirectorEngineerManagerPostdocPrincipalResearch Assoc IResearch Assoc IIResearch Assoc IIIResearch Assoc IVScientist IScientist IIScientist IIIScientist IVStudentTechnician
18.2%-13.0%-5.0%17.5%11.8%28.2%-1.2%-10.8%-0.6%-3.3%-3.4%-4.8%14.7%6.7%10.5%45.8%9.5%
-1.1%16.4%7.2%
-38.6%-12.2%8.2%
-40.0%3.8%-5.5%
-13.2%8.1%4.8%-8.3%
-20.3%20.0%1.6%
14.8%
Pennsylvania: Average Salary by PositionChange in Salary by Position
10888-BIOSPACE | 6465 South Greenwood Plaza Boulevard, Suite 400 Centennial, CO 80111 | BioSpace.com
• In 2013, a pharmaceutical or life sciences professional with under one year of experience will find the most generous salary in New York State, where the average is $47,966. For professionals with two to four years of experience, the highest average salary can be found in New Jersey, where the average is $55,000.
• In 2013, professionals with five to nine years of experience will find the highest average salary in Pennsylvania ($72,674), while those with 10 to 14 years of experience will find the best wages in Connecticut ($106,250).
• Professionals with 15 or more years of experience appear to earn the most, on average, in Connecticut as well ($120,400).
0
20000
40000
60000
80000
100000
120000
140000
160000
180000
200000
2013
2012
2011
2010
15 or more years10 to 14 years5 to 9 years2 to 4 yearsUnder one year
0
20000
40000
60000
80000
100000
120000
140000
160000
180000
200000
2013
2012
2011
2010
15 or more years10 to 14 years5 to 9 years2 to 4 yearsUnder one year0
20000
40000
60000
80000
100000
120000
140000
160000
180000
200000
2013
2012
2011
2010
15 or more years10 to 14 years5 to 9 years2 to 4 yearsUnder one year
0
20000
40000
60000
80000
100000
120000
140000
160000
180000
200000
2013
2012
2011
2010
15 or more years10 to 14 years5 to 9 years2 to 4 yearsUnder one year
Connecticut: Salary by Experience
New Jersey: Salary by Experience
Pennsylvania: Salary by Experience
New York: Salary by Experience
Salary by Experience
11888-BIOSPACE | 6465 South Greenwood Plaza Boulevard, Suite 400 Centennial, CO 80111 | BioSpace.com
2010 2011 2012 2013 TOTAL24% 23% 22% 26% 23%
new york
2010 2011 2012 2013 TOTAL6% 8% 6% 6% 7%
CONNECTICUT
2010 2011 2012 2013 TOTAL26% 24% 25% 23% 25%
PENNSYLVANIA
2010 2011 2012 2013 TOTAL44% 45% 47% 45% 45%
new JERSEY
Distibution of Job Seekersby State in Pharm Country
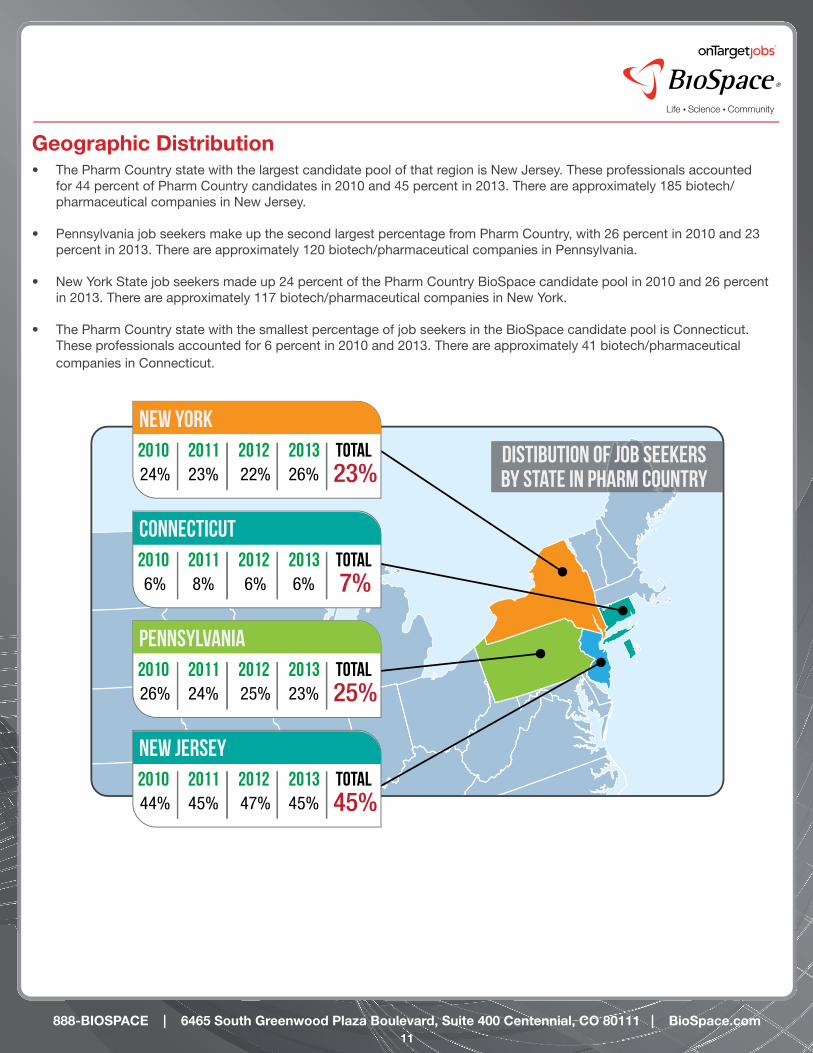
Geographic Distribution• The Pharm Country state with the largest candidate pool of that region is New Jersey. These professionals accounted
for 44 percent of Pharm Country candidates in 2010 and 45 percent in 2013. There are approximately 185 biotech/pharmaceutical companies in New Jersey.
• Pennsylvania job seekers make up the second largest percentage from Pharm Country, with 26 percent in 2010 and 23 percent in 2013. There are approximately 120 biotech/pharmaceutical companies in Pennsylvania.
• New York State job seekers made up 24 percent of the Pharm Country BioSpace candidate pool in 2010 and 26 percent in 2013. There are approximately 117 biotech/pharmaceutical companies in New York.
• The Pharm Country state with the smallest percentage of job seekers in the BioSpace candidate pool is Connecticut. These professionals accounted for 6 percent in 2010 and 2013. There are approximately 41 biotech/pharmaceutical companies in Connecticut.
12888-BIOSPACE | 6465 South Greenwood Plaza Boulevard, Suite 400 Centennial, CO 80111 | BioSpace.com
Key Takeaways• Pharm Country was third on BioSpace.com’s list of top hiring locations in 2012. However, if it continues to trend as it has
in the first quarter of 2013, it has the potential to move into the number two position this year. New Jersey, in particular, has a wealth of life science jobs, accounting for 8.6 percent of all BioSpace.com employer job postings.
• While only 1.8 percent of BioSpace.com employer job postings are located in Connecticut, competition is also less fierce with only 16 applies per position. The average salary for biopharma professionals is highest in this Pharm Country state, which may indicate that employers are finding it necessary to pay more to attract the best talent.
• Scientist positions accounted for many of the top employer job postings in the Pharm Country region in 2012. Of course, these also tend to be some of the most competitive jobs, with as many as 308 applies per posting for entry level positions.
• Statistician positions were among the least competitive jobs in Pharm Country, receiving fewer than 10 applies per posting. New university students with a penchant for mathematics and interest in the biopharma industry may want to consider statistics as a course of study.
• In fact, many of the most competitive jobs in the biopharma industry fall into the category of general expertise (including Scientist, Chemist, and Assistant), while the least competitive (including Statistician, GMP Officer, and Pharmacokineticist) require greater specialization. For this reason, students and seasoned professionals may want to develop a specific expertise rather than stay at the general science, research, chemistry, or biology level.
• Salaries in Pharm Country have increased from 2010 to 2013, significantly in some cases. Connecticut in particular has seen substantial growth in average salary, though wages have made little progress in Pennsylvania, the only Pharm Country state that did not outpace inflation.
• Analyst, Postdoc, and Student positions had significant salary increases from 2010 to 2012 throughout Pharm Country. However, this trend is unlikely to continue in 2013. Grants from the National Science Foundation (NSF) and National Institutes of Health typically (NIH) fund many of these jobs, and the sequester that went into effect in March has reduced the budgets of these government agencies. In fact, the NSF, which funds about 20 percent of all federally funded basic research at American colleges and universities, anticipates awarding 1,000 fewer research grants this year 8. The NIH will likely have to cut grant volume as well, as they face $2.5 billion in budget reductions 9.
• The dramatic increase in New York Programmer salaries from 2010 to 2012 demonstrates the value of employees who have expertise in IT disciplines, particularly programming, to companies in the biopharma industry.
Keyword FindingsConnecticut
• For 2012, the top 10 terms searched on the BioSpace.com website by Connecticut users were Scientist, Regulatory Affairs, Immunology, Clinical Research, Chemistry/Chemist, Operations, Marketing, Research, Organic Synthesis, and Molecular Genetics.
• The top billing of “Scientist” makes sense, as Research Scientist, Lab Scientist, Bioanalytical Scientist, Associate Scientist, and Senior Scientist were the top five most competitive jobs.
• We’ve seen a few changes in popular search terms in the first quarter of 2013. Research is now number one,
followed by Scientist. Research Associate is number three, which did not appear on the 2012 list at all. Quality Assurance, also absent from popular terms in 2012, is now number six.
• Regulatory Affairs dropped out of the top ten in 2013, despite its number two position in 2012.
13888-BIOSPACE | 6465 South Greenwood Plaza Boulevard, Suite 400 Centennial, CO 80111 | BioSpace.com
• These changes may indicate a growing interest in the areas of research and quality assurance and a shift away from the field of regulatory affairs. Life sciences professionals should be wary of this, as positions in general science and research tend to be much more competitive, in terms of number of applications per job posting, than those requiring greater specialization.
New Jersey
• For 2012, the top 10 terms searched on the BioSpace.com website by New Jersey users were Scientist, Director, Regulatory Affairs, Business Development, Research Associate, Medical Affairs, Chemistry/Chemist, Quality Assurance, Marketing, and Vivo.
• The top billing of “Scientist” again makes sense, as Senior Scientist, Principal Scientist, Entry Level Scientist, and Scientist II were among New Jersey’s most plentiful positions. Entry Level Scientist, Scientist I and Principal Scientist were also among the most competitive.
• Notable changes in first quarter 2013 include the appearance of Immunology in the number two spot and Molecular Biology at number four.
• Regulatory Affairs fell to number 10 in 2013 from number three in 2012. Medical Affairs, in the number six spot in 2012, fell off the list entirely.
• These changes may indicate a growing interest in the areas of immunology and molecular biology and shifts away from the fields of regulatory and medical affairs. Once again, life sciences professionals should be wary of this, as positions in general science and research tend to be much more competitive, in terms of number of applications per job posting, than those requiring greater specialization.
New York State
• For 2012, the top 10 terms searched on the BioSpace.com website by New York State users were Scientist, Research Associate, Clinical Research, Sales, Chemistry/Chemist, Marketing, Regulatory Affairs, Director, Research Scientist, and Immunology.
• Once again, the fact that Scientist received top billing is not surprising. Positions frequently posted by employers in 2012 included Senior Scientist, Research Scientist, and Associate Scientist. These positions were also the most competitive.
• Notable changes in first quarter 2013 include Clinical Research’s drop from number three in 2012 off the top keyword list in 2013. Regulatory affairs, at number seven last year, also fell from the list.
• Manufacturing and Medicinal Scientist, which did not make an appearance in 2012, are number five and number seven in 2013 respectively.
• These changes may indicate a growing interest in the areas of manufacturing and medicine as well as a shift away from the field of regulatory affairs. New York State has a high concentration of universities and research hospitals as well as numerous hospitals and clinics conducting clinical trials, so the absence of Clinical Research as a keyword may indicate that these professionals are being more sought out and searching less.
14888-BIOSPACE | 6465 South Greenwood Plaza Boulevard, Suite 400 Centennial, CO 80111 | BioSpace.com
Pennsylvania
• For 2012, the top ten terms searched on the BioSpace.com website by Pennsylvania users were Regulatory Affairs, Sales, Business Development, Marketing, Scientist, Research Associate, Chemistry/Chemist, Research, Director, and Immunology.
• Marketing Specialist, Junior Scientist, Senior Scientist, Analytical Chemist, Principal Scientist, and Associate Scientist were among employers’ most frequently posted positions. In addition, Marketing Specialist, Junior Scientist, Analytical Chemist and Associate Scientist were four of the most competitive.
• Notable changes in first quarter 2013 include Science Policy’s appearance at number three as well as the descent of Regulatory Affairs from number one to number eight.
• Sales also fell in 2013, from number two to the number nine position. Marketing, which had been number four in 2012, did not make the list at all.
• These changes may indicate a growing interest in the area of science policy as well as a shift away from regulatory affairs, sales, and marketing.
Life Sciences Hotbed CampaignsFor 25 years, the BioSpace community has put emphasis on the thriving clusters of the life science industry, helping to attract investment, talent, and additional resources to nine geographic areas. Each campaign includes a BioSpace Hotbed Map, an iconic image of an area that displays the logos and buildings of participating organizations. The map is enhanced through the integration of many functional components including a regional Hotbed homepage on the BioSpace website. To give a comprehensive overview of a community, each campaign includes biotechnology and pharmaceutical companies, industry service and supply companies, research institutes, non-profit organizations, and universities. For more information on map inclusion on the Pharm Country campaign or any of the other maps, contact us today.
Additional Resources
• (1), (2) http://fromhopetocures.com/sites/default/files/Pharma_Chart_Grid_R07.pdf
http://www.bls.gov/opub/mlr/2012/01/art4full.pdf
• (3), (4) http://www.phrma.org/media/releases/new-research-demonstrates-biopharmaceutical-sector%E2%80%99s-impact-us-economy-jobs
• (5) http://www.phrma.org/media/releases/biologics-research-promises-bolster-future-medicine
• (6) http://blog.pharmexec.com/2013/01/03/2012-us-drug-approvals-best-in-16-years-but-will-the-good- times-last/
• (7) http://www.xconomy.com/new-york/2012/12/28/the-year-in-new-york-biotech-still-trying-to-make-it-here/
• (8) http://www.livescience.com/27538-how-sequester-will-affect-science.html
• (9) http://news.sciencemag.org/scienceinsider/2012/09/sequestration-would-cut-us-scien.html

15888-BIOSPACE | 6465 South Greenwood Plaza Boulevard, Suite 400 Centennial, CO 80111 | BioSpace.com
About this ReportData was collected from the BioSpace.com online database of job openings and candidate pool. Job posting data was collected from the BioSpace database and is comprised of approximately 32,000 biotech, pharmaceutical, and medical device job openings placed by 1,400 life sciences and biotech organizations. These organizations range from privately funded to public enterprise companies. Salary data was collected from approximately 40,000 New York, New Jersey, Pennsylvania and Connecticut user profiles in the BioSpace Resume Database. For more information or questions on breakdown by demographic please email [email protected].