Embed Size (px)
Citation preview

1
AGENDA PUBLIC HEALTH ADVISORY BOARD Accountability Metrics Subcommittee
October 27, 2016 2:00-3:00 pm Conference line: (888) 251-2909 Access code: 8975738 Webinar link: https://attendee.gotowebinar.com/register/2820001412106401025
Meeting Objectives · Learn about the University of Washington’s Public Health Activities and Services Tracking (PHAST)
measures and discuss applicability to the work of the Accountability Metrics Subcommittee · Plan for November 15th two-hour meeting
PHAB members: Muriel DeLaVergne-Brown, Eva Rippeteau, Eli Schwarz, Teri Thalhofer, Jennifer Vines
2:00-2:05 pm Welcome and introductions · Review and approve September 22
minutes All
2:05-2:40 pm Public Health Activity and Services
Tracking (PHAST) measures
· Learn about the PHAST measure set
history and purpose · Discuss applicability of measures to the
work of the Accountability Metrics
Subcommittee
Greg Whitman, University of Washington
2:40-2:50 pm Next steps for future meeting · Agree on prep work for the Nov. 15th
two-hour meeting and identify meeting
objectives
All
2:50-3:00 pm Public comment
3:00 pm Adjourn

1
PUBLIC HEALTH ADVISORY BOARD DRAFT Accountability Metrics Subcommittee Meeting M inutes
October 27 2016 2:00 – 3:00pm PHAB Subcommittee members in attendance: Teri Thalofer, Eli Schwarz, Jennifer Vines PHAB Subcommittee members absent: Muriel DeLaVergne-Brown, Eva Rippeteau
OHA staff: Sara Beaudrault, Myde Boles, Rebecca Pawlak, Angela Rowland
Members of the public : None
Welcome and introductions
The September 22 draft meeting minutes were unanimously approved by the subcommittee.
Public Health Activities & Services Tracking (PHAST ) measures
Greg Whitman from the University of Washington provided an overview of the PHAST measures and their history. The beginning measure set started with the MPROVE measures. The purpose is to identify high value public health service measures across jurisdictions and collect the data. They were sorted in three core public health domains, CD, EH Protection, and Chronic Disease Prevention. Eli asked if there are any national groups working with this criteria, Greg stated there is a crosswalk included. In May 2015 the MPROVE measures evolved to correct errors, provide clarity, and add responsibility questions. Jennifer Vines these are process outcomes are there any cause and effect outcomes. Behavior change but not comparable data on the activities. This is where we would like to head with the subcommittee. Did work on existing data and did some matching of health department matched the data with health outcomes to demonstrate the local public health contribution of services. Data was very limited. Jen says to be careful with cause and effect.
2
Eli mentioned there is no way to use standardized instrumentation to collect data at a county level. Healthy People 2020 is a great target to aim for. People and dollars vs people that give immunizations themselves. Betty says there are measures in the PHAST data that shows which departments are giving the shots. Becky can share this to the group as soon as its published. How it relates to FPHS. November 15th 2 hour meeting send out materials ahead of time to work through homework for decisions to put forward. Can we work from the PHAST measures? Prioritize on EH and CD. Could also look at state health profile indicators. Subcommittee business Crosswalk between the PHAST and measures we already went through. Try for an in-person meeting at PSOB. Teri, Eli, Eva, and Jen should be in-person. Has anyone been exposed to these instruments. Teri stated that its based on imm rates, already provide to the state through contract. Materials out in next week or so. Public comment No public testimony.
Adjournment
The meeting was adjourned.
Oregon Public Health Advisory Board – Accountability Metrics Subcommittee
Measure criteria questions
June, 2016
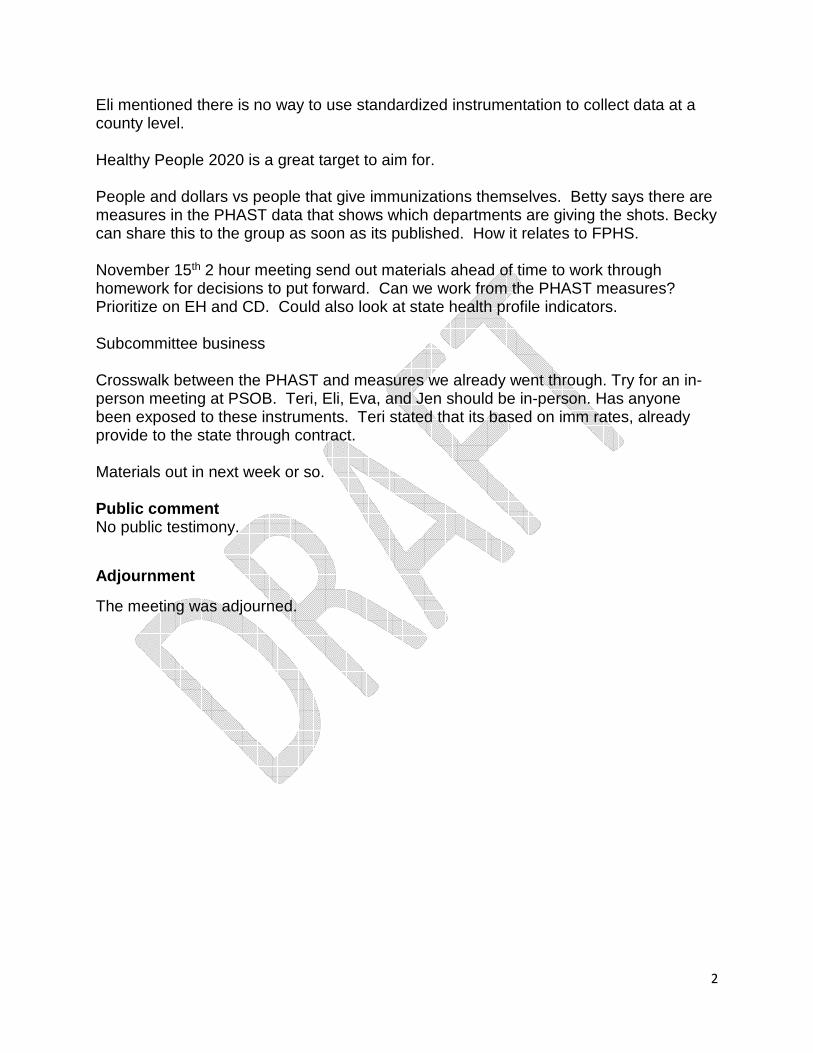
1. At what level should measures be selected?
a. Outcome: impacts of the public health system’s activities on health
b. Process: activities the public health system does
2. How should the measures be framed?
a. Foundational programs
b. Foundational capabilities
3. What principles should be applied to measure selection? (adapted from coordinated care
organization measurement principles)
Core principles
a. Promotes health equity
b. Respectful of local priorities
c. Transformative potential
d. Consistency with state and national quality measures, with room for innovation
e. Feasibility of measurement
Additional considerations:
f. Consumer engagement
g. Relevance
h. Attainability
i. Accuracy
j. Reasonable accountability
k. Range/diversity of measures
4. How should measures be applied to state and local public health authorities?
a. Individual performance targets based on the jurisdiction with incremental improvement
over time for all
b. Core measure set for the state with locally selected measures derived from community
health improvement plan priorities
10/28/2016
1
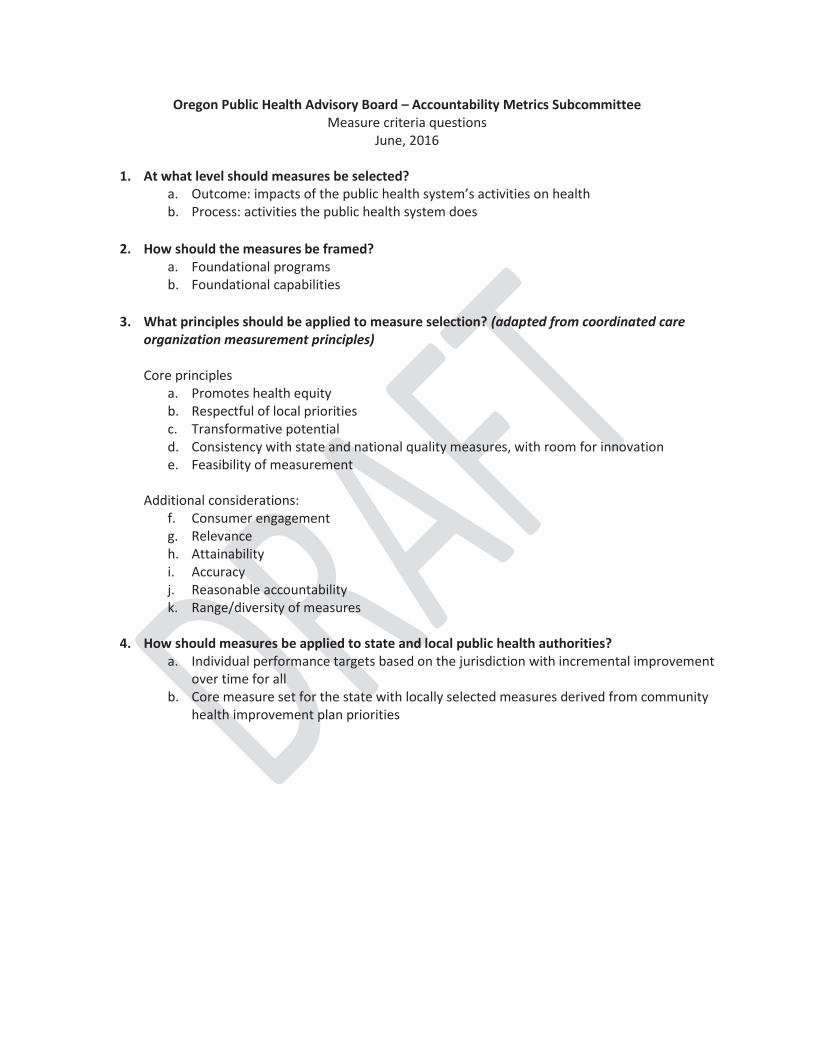
PHAST Measures: Standardized Metrics for Local Public Health
and Beyond
Greg Whitman
University of Washington
School of Nursing
The Problem
10/28/2016
2
A Solution http://phastdata.org/measureshttp://phastdata.org/measureshttp://phastdata.org/measureshttp://phastdata.org/measures
2012
10/28/2016
3
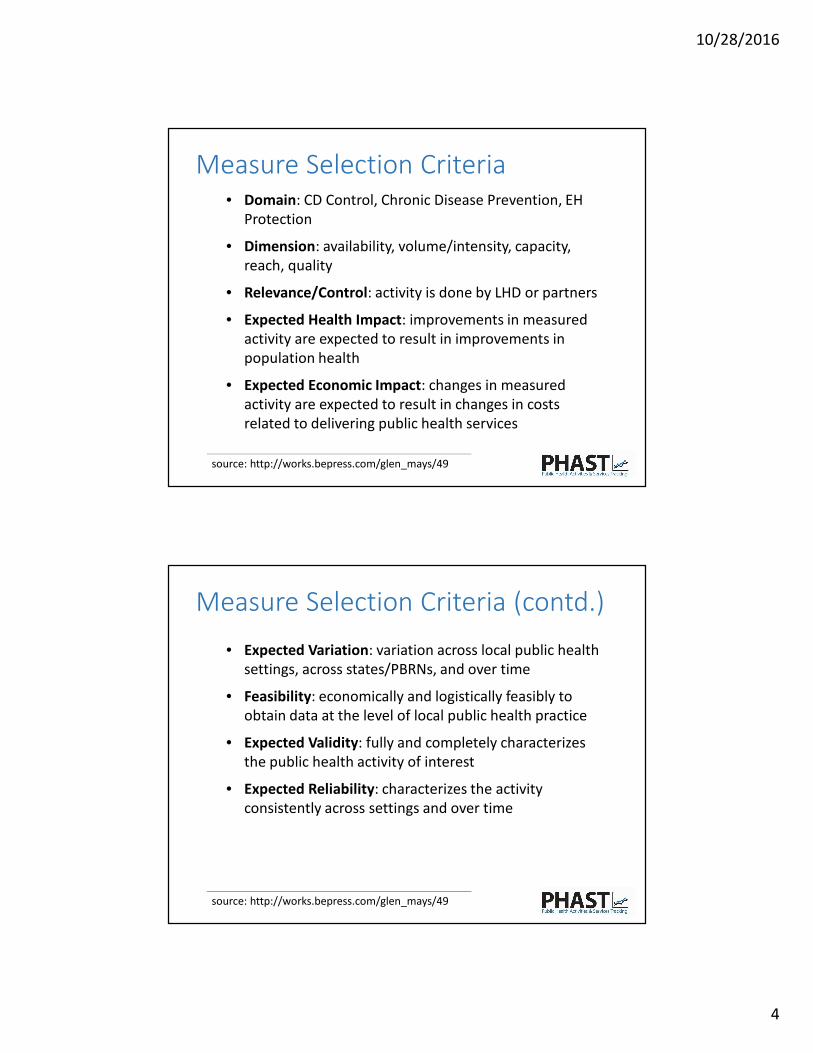
Origin of PHAST Measures
Multi-Network Practice and Outcome Variation
Examination (MPROVE) Study
• Launched in May 2012
• Glen Mays, PI (U of KY National Coordinating Center)
• 6 participating PH Practice-Based Research Networks:
WA, CO, MN, TN, NJ, FL
• Co-investigators at each network = one practitioner,
one researcher
• Identify service delivery measures for selected, high-
value public health services, to be collected
consistently across local jurisdictions
MPROVE Measure Selection Process
• Call for measures to identify inventory of candidate
measures
• Literature review to identify candidate measures
• Delphi expert rating of measures based on selection
criteria
• Discussion and modification of ratings
• Final selection of “core” measures
• Development of measure specifications
• Final approval of measure specifications
source: http://works.bepress.com/glen_mays/147
10/28/2016
4
Measure Selection Criteria• Domain: CD Control, Chronic Disease Prevention, EH
Protection
• Dimension: availability, volume/intensity, capacity,
reach, quality
• Relevance/Control: activity is done by LHD or partners
• Expected Health Impact: improvements in measured
activity are expected to result in improvements in
population health
• Expected Economic Impact: changes in measured
activity are expected to result in changes in costs
related to delivering public health services
source: http://works.bepress.com/glen_mays/49
Measure Selection Criteria (contd.)
• Expected Variation: variation across local public health
settings, across states/PBRNs, and over time
• Feasibility: economically and logistically feasibly to
obtain data at the level of local public health practice
• Expected Validity: fully and completely characterizes
the public health activity of interest
• Expected Reliability: characterizes the activity
consistently across settings and over time
source: http://works.bepress.com/glen_mays/49
10/28/2016
5
Communicable disease control (14 measures)– Immunization
– Enteric disease control
– STI control
– Tuberculosis control
Chronic disease prevention (8 measures)– Tobacco prevention
– Obesity prevention
Environmental health protection (5 measures)– Lead exposure protection
– Food safety protection
Final MPROVE Measures
2015
10/28/2016
6
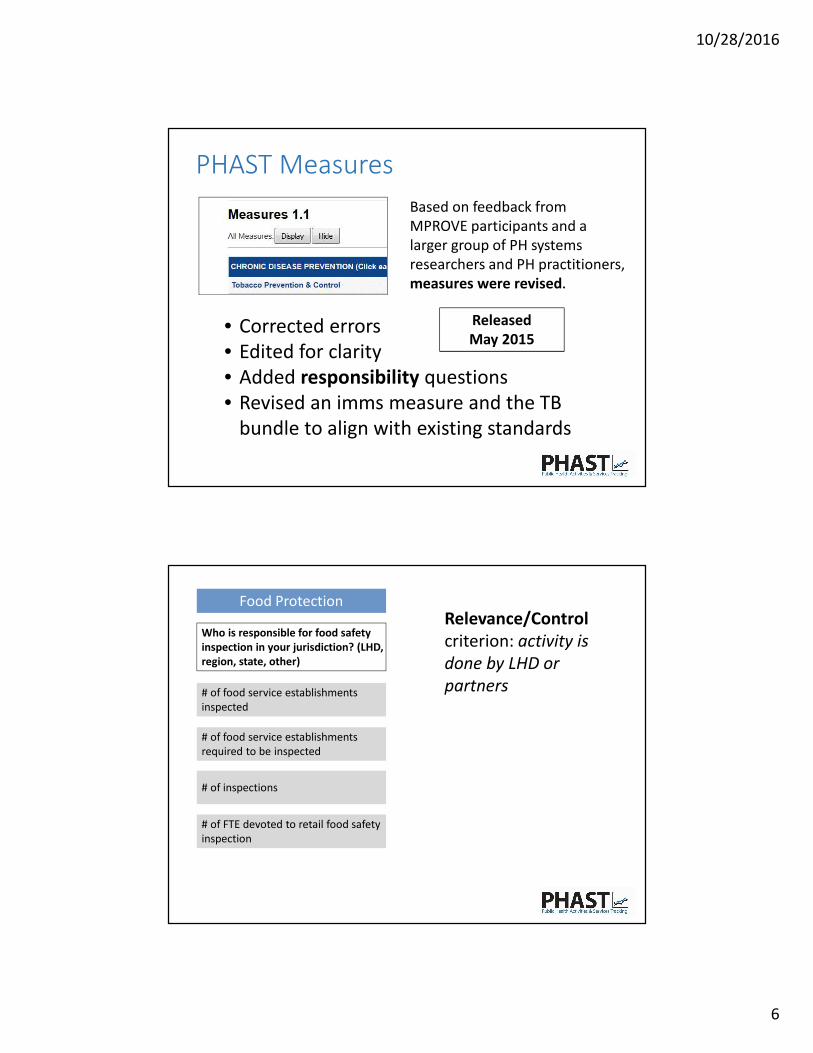
PHAST Measures
Based on feedback from
MPROVE participants and a
larger group of PH systems
researchers and PH practitioners,
measures were revised.
• Corrected errors
• Edited for clarity
• Added responsibility questions
• Revised an imms measure and the TB
bundle to align with existing standards
Released
May 2015
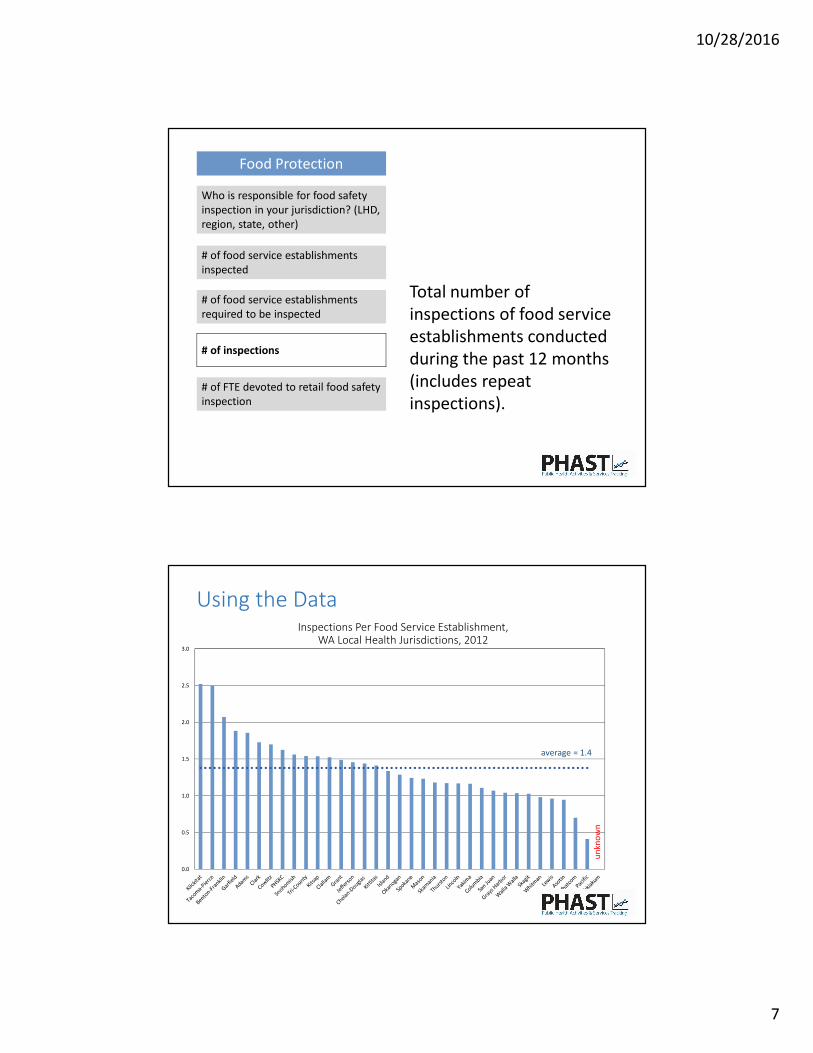
Food Protection
Who is responsible for food safety
inspection in your jurisdiction? (LHD,
region, state, other)
# of food service establishments
inspected
# of food service establishments
required to be inspected
# of inspections
# of FTE devoted to retail food safety
inspection
Relevance/Control
criterion: activity is
done by LHD or
partners
10/28/2016
7
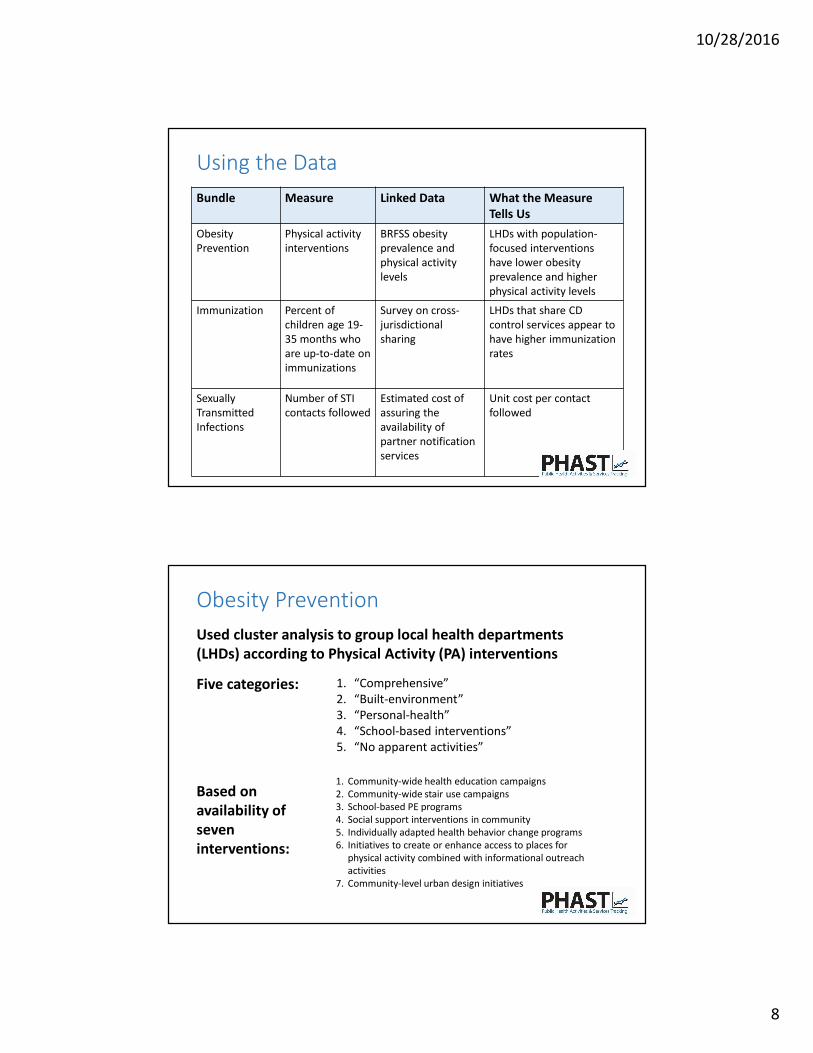
Food Protection
Who is responsible for food safety
inspection in your jurisdiction? (LHD,
region, state, other)
# of food service establishments
inspected
# of food service establishments
required to be inspected
# of inspections
# of FTE devoted to retail food safety
inspection
Total number of
inspections of food service
establishments conducted
during the past 12 months
(includes repeat
inspections).
0.0
0.5
1.0
1.5
2.0
2.5
3.0
average = 1.4
Inspections Per Food Service Establishment, WA Local Health Jurisdictions, 2012
un
kno
wn
Using the Data
10/28/2016
8
Using the Data
Bundle Measure Linked Data What the Measure
Tells Us
Obesity
Prevention
Physical activity
interventions
BRFSS obesity
prevalence and
physical activity
levels
LHDs with population-
focused interventions
have lower obesity
prevalence and higher
physical activity levels
Immunization Percent of
children age 19-
35 months who
are up-to-date on
immunizations
Survey on cross-
jurisdictional
sharing
LHDs that share CD
control services appear to
have higher immunization
rates
Sexually
Transmitted
Infections
Number of STI
contacts followed
Estimated cost of
assuring the
availability of
partner notification
services
Unit cost per contact
followed
Used cluster analysis to group local health departments
(LHDs) according to Physical Activity (PA) interventions
Five categories:
Obesity Prevention
1. Community-wide health education campaigns
2. Community-wide stair use campaigns
3. School-based PE programs
4. Social support interventions in community
5. Individually adapted health behavior change programs
6. Initiatives to create or enhance access to places for
physical activity combined with informational outreach
activities
7. Community-level urban design initiatives
Based on
availability of
seven
interventions:
1. “Comprehensive”
2. “Built-environment”
3. “Personal-health”
4. “School-based interventions”
5. “No apparent activities”
10/28/2016
9
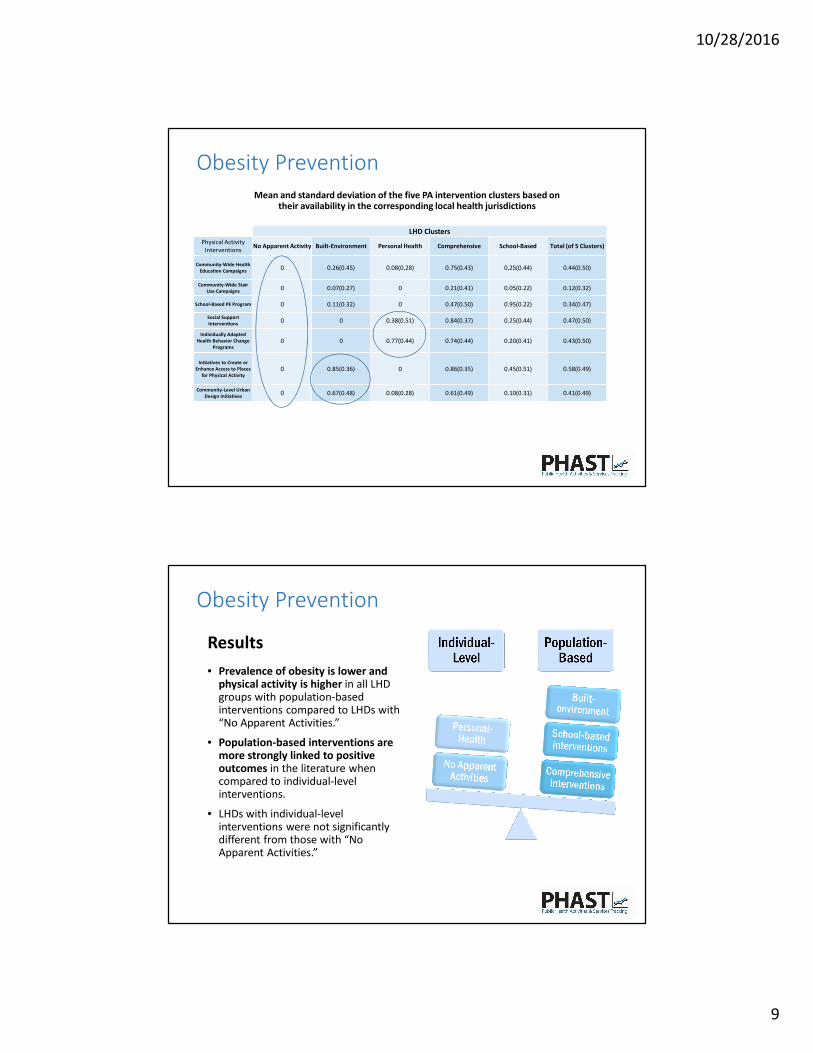
Mean and standard deviation of the five PA intervention clusters based on their availability in the corresponding local health jurisdictions
LHD Clusters
Physical Activity
InterventionsNo Apparent Activity Built-Environment Personal Health Comprehensive School-Based Total (of 5 Clusters)
Community-Wide Health
Education Campaigns0 0.26(0.45) 0.08(0.28) 0.75(0.43) 0.25(0.44) 0.44(0.50)
Community-Wide Stair
Use Campaigns0 0.07(0.27) 0 0.21(0.41) 0.05(0.22) 0.12(0.32)
School-Based PE Program 0 0.11(0.32) 0 0.47(0.50) 0.95(0.22) 0.34(0.47)
Social Support
Interventions0 0 0.38(0.51) 0.84(0.37) 0.25(0.44) 0.47(0.50)
Individually Adapted
Health Behavior Change
Programs0 0 0.77(0.44) 0.74(0.44) 0.20(0.41) 0.43(0.50)
Initiatives to Create or
Enhance Access to Places
for Physical Activity0 0.85(0.36) 0 0.86(0.35) 0.45(0.51) 0.58(0.49)
Community-Level Urban
Design Initiatives0 0.67(0.48) 0.08(0.28) 0.61(0.49) 0.10(0.31) 0.41(0.49)
Obesity Prevention
Results
• Prevalence of obesity is lower and physical activity is higher in all LHD groups with population-based interventions compared to LHDs with “No Apparent Activities.”
• Population-based interventions are more strongly linked to positive outcomes in the literature when compared to individual-level interventions.
• LHDs with individual-level interventions were not significantly different from those with “No Apparent Activities.”
Obesity Prevention
10/28/2016
10
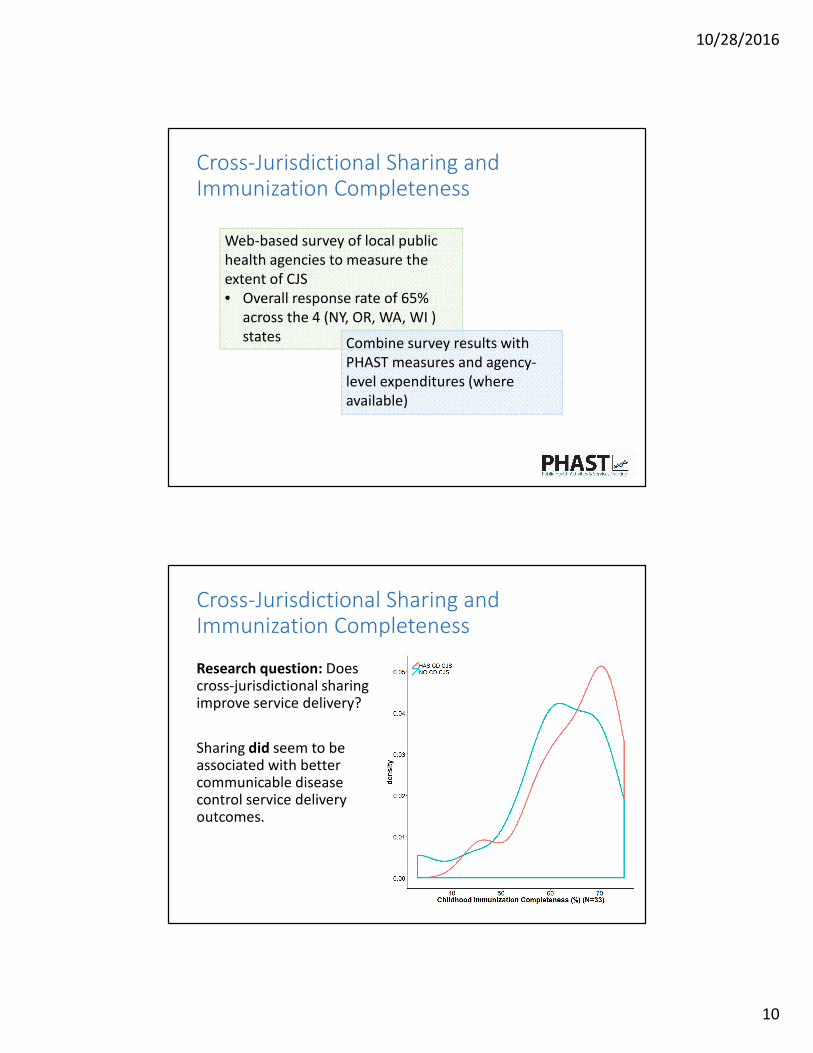
Cross-Jurisdictional Sharing and Immunization Completeness
Web-based survey of local public
health agencies to measure the
extent of CJS
• Overall response rate of 65%
across the 4 (NY, OR, WA, WI )
states Combine survey results with
PHAST measures and agency-
level expenditures (where
available)
Research question: Does cross-jurisdictional sharing improve service delivery?
Sharing did seem to be associated with better communicable disease control service delivery outcomes.
Cross-Jurisdictional Sharing and Immunization Completeness
10/28/2016
11
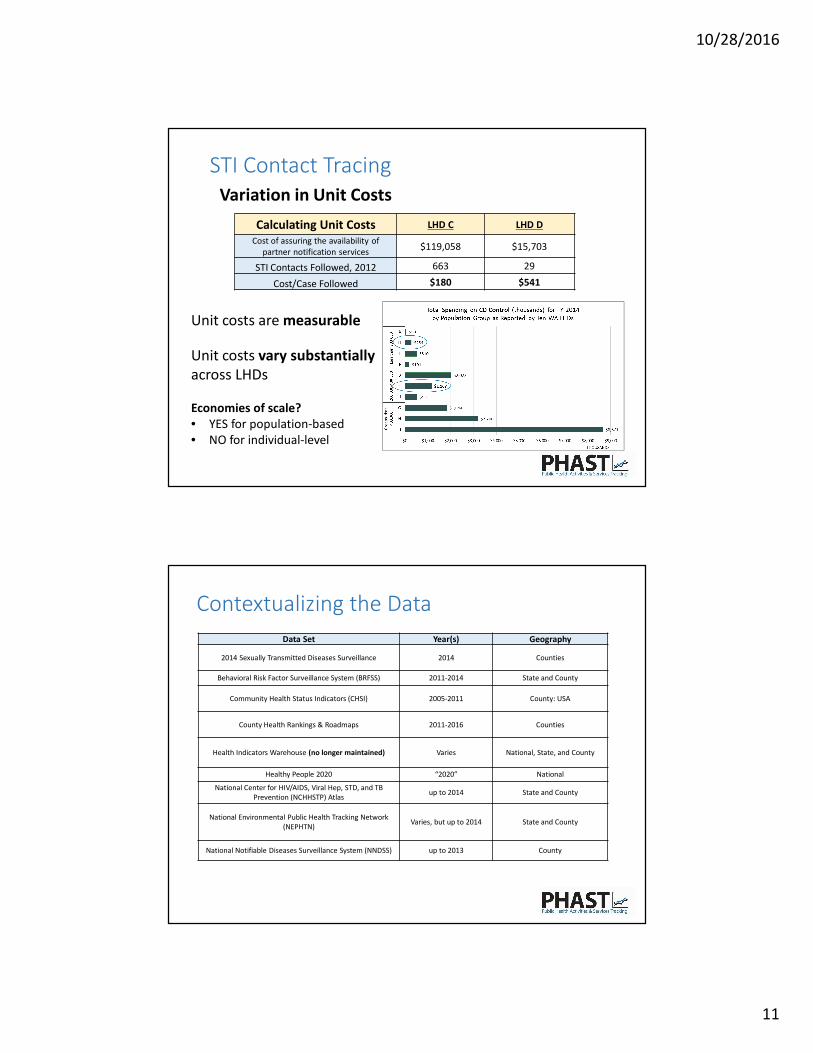
STI Contact Tracing
Variation in Unit Costs
Calculating Unit Costs LHD C LHD D
Cost of assuring the availability of
partner notification services$119,058 $15,703
STI Contacts Followed, 2012 663 29
Cost/Case Followed $180 $541
Unit costs are measurable
Unit costs vary substantially
across LHDs
Economies of scale?
• YES for population-based
• NO for individual-level
Contextualizing the Data
Data Set Year(s) Geography
2014 Sexually Transmitted Diseases Surveillance 2014 Counties
Behavioral Risk Factor Surveillance System (BRFSS) 2011-2014 State and County
Community Health Status Indicators (CHSI) 2005-2011 County: USA
County Health Rankings & Roadmaps 2011-2016 Counties
Health Indicators Warehouse (no longer maintained) Varies National, State, and County
Healthy People 2020 “2020” National
National Center for HIV/AIDS, Viral Hep, STD, and TB
Prevention (NCHHSTP) Atlasup to 2014 State and County
National Environmental Public Health Tracking Network
(NEPHTN)Varies, but up to 2014 State and County
National Notifiable Diseases Surveillance System (NNDSS) up to 2013 County
10/28/2016
12
More Information
WebsiteWebsiteWebsiteWebsite http://phastdata.org
EmailEmailEmailEmail [email protected]
University of Kentucky
From the SelectedWorks of Glen Mays
��##���'*�$��(��������
��#��*!%�����)+(�)�&���+�#!�����#* � �#!,�(.���)+#*)�&���� �#' !��+(,�.��&(�* ���������*+�.�#�%���.)� University of Kentucky
�,�!#��#���*� /'���-&(")���'(�))��&$��#�%�$�.)���
Contents 10/1/2012
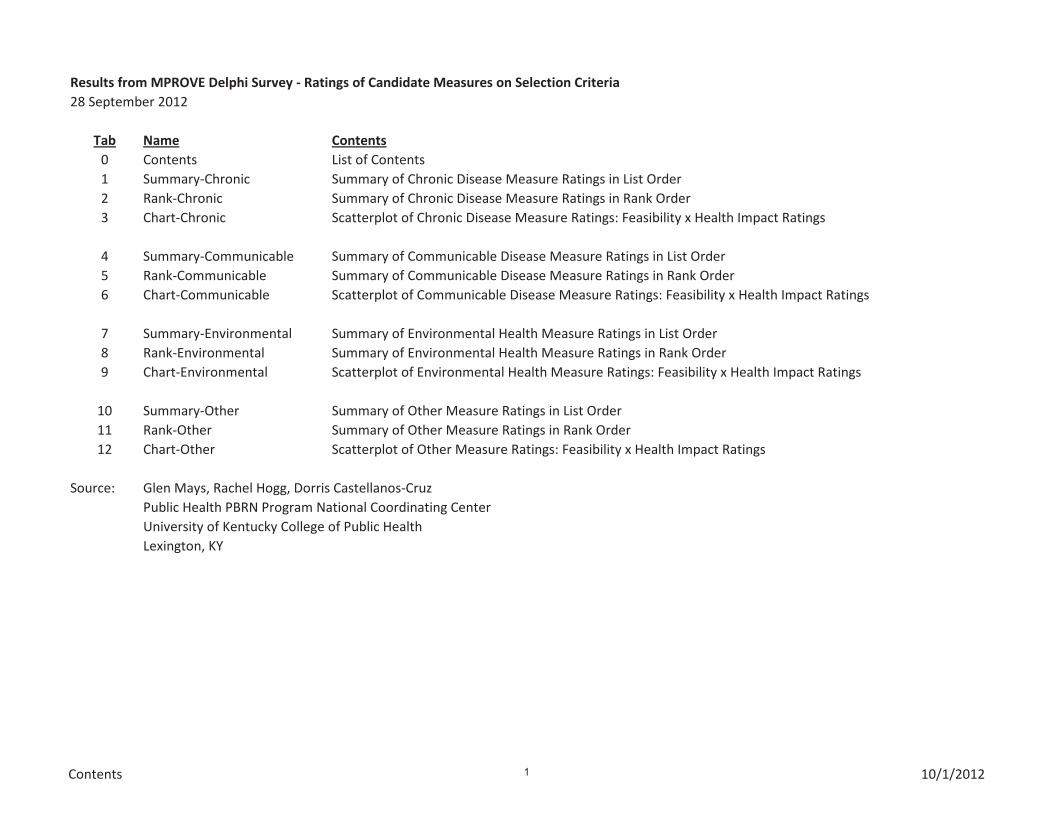
Results from MPROVE Delphi Survey - Ratings of Candidate Measures on Selection Criteria
28 September 2012
Tab Name Contents
0 Contents List of Contents
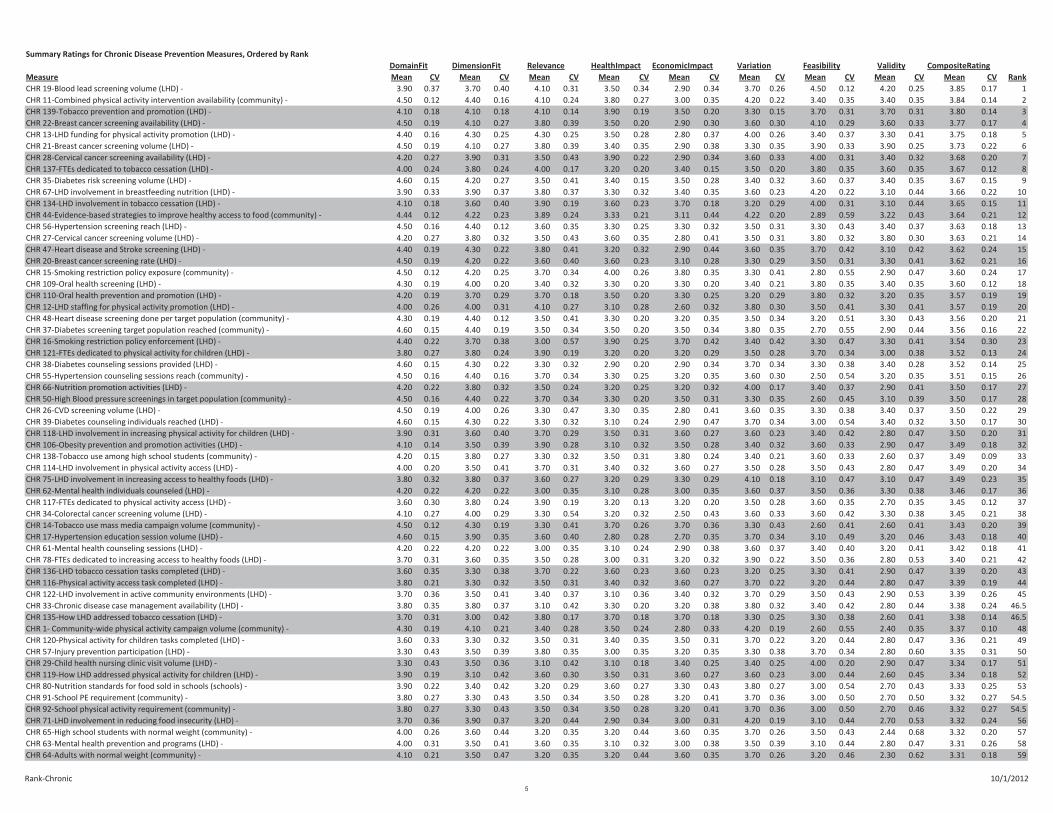
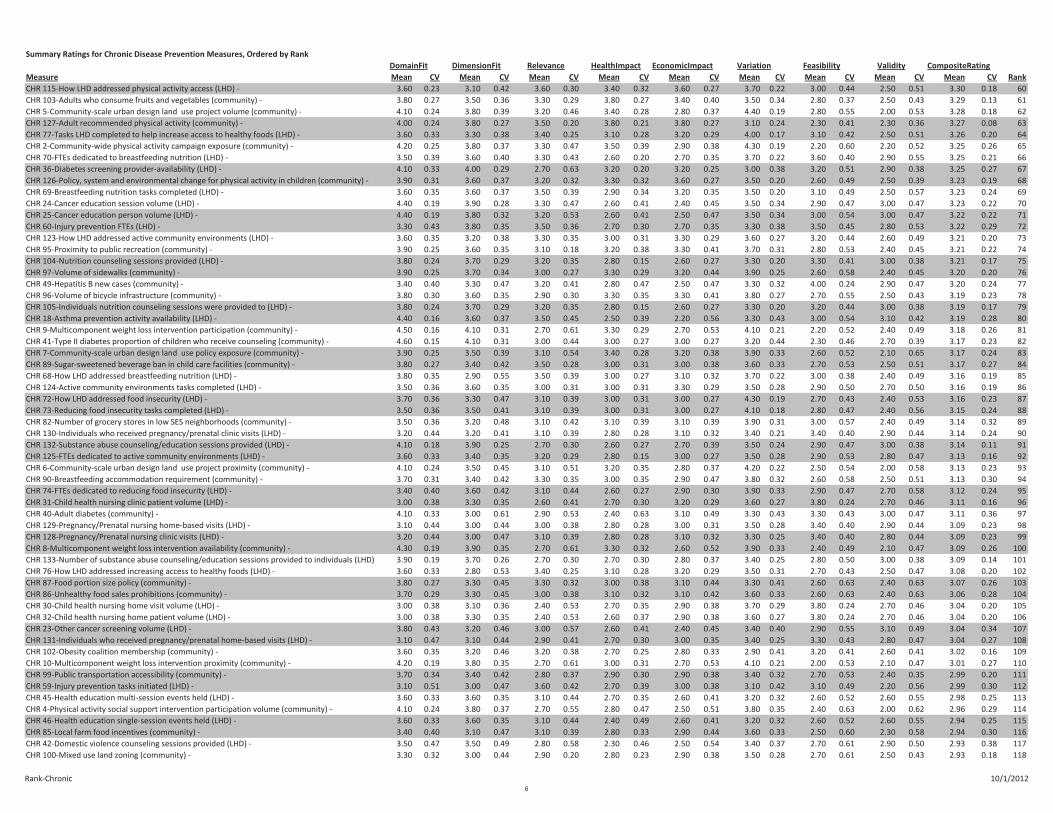
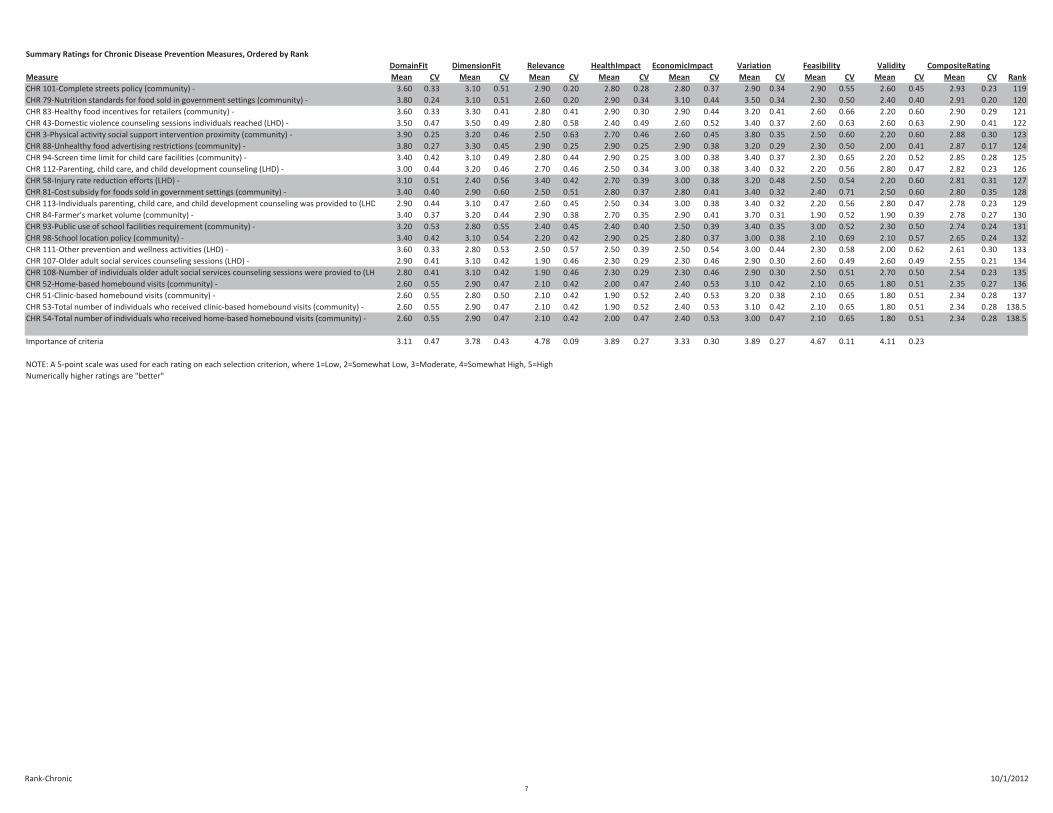
1 Summary-Chronic Summary of Chronic Disease Measure Ratings in List Order
2 Rank-Chronic Summary of Chronic Disease Measure Ratings in Rank Order
3 Chart-Chronic Scatterplot of Chronic Disease Measure Ratings: Feasibility x Health Impact Ratings
4 Summary-Communicable Summary of Communicable Disease Measure Ratings in List Order
5 Rank-Communicable Summary of Communicable Disease Measure Ratings in Rank Order
6 Chart-Communicable Scatterplot of Communicable Disease Measure Ratings: Feasibility x Health Impact Ratings
7 Summary-Environmental Summary of Environmental Health Measure Ratings in List Order
8 Rank-Environmental Summary of Environmental Health Measure Ratings in Rank Order
9 Chart-Environmental Scatterplot of Environmental Health Measure Ratings: Feasibility x Health Impact Ratings
10 Summary-Other Summary of Other Measure Ratings in List Order
11 Rank-Other Summary of Other Measure Ratings in Rank Order
12 Chart-Other Scatterplot of Other Measure Ratings: Feasibility x Health Impact Ratings
Source: Glen Mays, Rachel Hogg, Dorris Castellanos-Cruz
Public Health PBRN Program National Coordinating Center
University of Kentucky College of Public Health
Lexington, KY
Summary-Chronic 10/1/2012
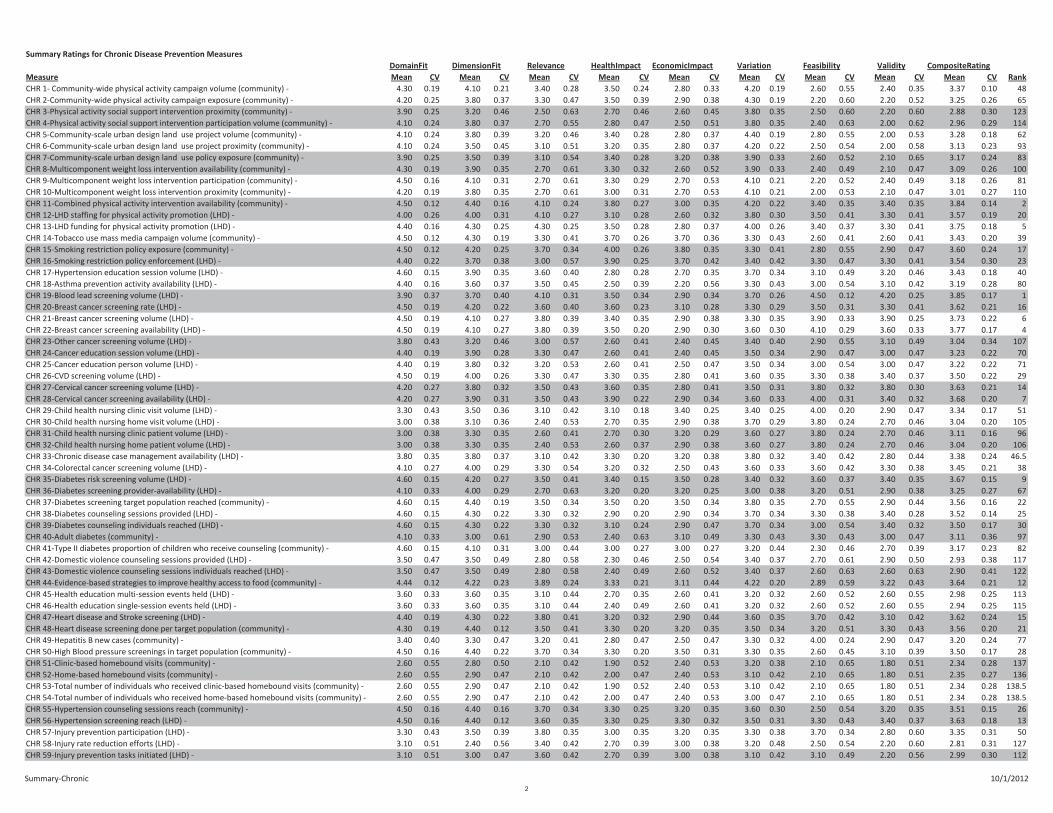
Summary Ratings for Chronic Disease Prevention Measures
CompositeRating
Measure Mean CV Mean CV Mean CV Mean CV Mean CV Mean CV Mean CV Mean CV Mean CV Rank
CHR 1- Community-wide physical activity campaign volume (community) - 4.30 0.19 4.10 0.21 3.40 0.28 3.50 0.24 2.80 0.33 4.20 0.19 2.60 0.55 2.40 0.35 3.37 0.10 48
CHR 2-Community-wide physical activity campaign exposure (community) - 4.20 0.25 3.80 0.37 3.30 0.47 3.50 0.39 2.90 0.38 4.30 0.19 2.20 0.60 2.20 0.52 3.25 0.26 65
CHR 3-Physical activity social support intervention proximity (community) - 3.90 0.25 3.20 0.46 2.50 0.63 2.70 0.46 2.60 0.45 3.80 0.35 2.50 0.60 2.20 0.60 2.88 0.30 123
CHR 4-Physical activity social support intervention participation volume (community) - 4.10 0.24 3.80 0.37 2.70 0.55 2.80 0.47 2.50 0.51 3.80 0.35 2.40 0.63 2.00 0.62 2.96 0.29 114
CHR 5-Community-scale urban design land use project volume (community) - 4.10 0.24 3.80 0.39 3.20 0.46 3.40 0.28 2.80 0.37 4.40 0.19 2.80 0.55 2.00 0.53 3.28 0.18 62
CHR 6-Community-scale urban design land use project proximity (community) - 4.10 0.24 3.50 0.45 3.10 0.51 3.20 0.35 2.80 0.37 4.20 0.22 2.50 0.54 2.00 0.58 3.13 0.23 93
CHR 7-Community-scale urban design land use policy exposure (community) - 3.90 0.25 3.50 0.39 3.10 0.54 3.40 0.28 3.20 0.38 3.90 0.33 2.60 0.52 2.10 0.65 3.17 0.24 83
CHR 8-Multicomponent weight loss intervention availability (community) - 4.30 0.19 3.90 0.35 2.70 0.61 3.30 0.32 2.60 0.52 3.90 0.33 2.40 0.49 2.10 0.47 3.09 0.26 100
CHR 9-Multicomponent weight loss intervention participation (community) - 4.50 0.16 4.10 0.31 2.70 0.61 3.30 0.29 2.70 0.53 4.10 0.21 2.20 0.52 2.40 0.49 3.18 0.26 81
CHR 10-Multicomponent weight loss intervention proximity (community) - 4.20 0.19 3.80 0.35 2.70 0.61 3.00 0.31 2.70 0.53 4.10 0.21 2.00 0.53 2.10 0.47 3.01 0.27 110
CHR 11-Combined physical activity intervention availability (community) - 4.50 0.12 4.40 0.16 4.10 0.24 3.80 0.27 3.00 0.35 4.20 0.22 3.40 0.35 3.40 0.35 3.84 0.14 2
CHR 12-LHD staffing for physical activity promotion (LHD) - 4.00 0.26 4.00 0.31 4.10 0.27 3.10 0.28 2.60 0.32 3.80 0.30 3.50 0.41 3.30 0.41 3.57 0.19 20
CHR 13-LHD funding for physical activity promotion (LHD) - 4.40 0.16 4.30 0.25 4.30 0.25 3.50 0.28 2.80 0.37 4.00 0.26 3.40 0.37 3.30 0.41 3.75 0.18 5
CHR 14-Tobacco use mass media campaign volume (community) - 4.50 0.12 4.30 0.19 3.30 0.41 3.70 0.26 3.70 0.36 3.30 0.43 2.60 0.41 2.60 0.41 3.43 0.20 39
CHR 15-Smoking restriction policy exposure (community) - 4.50 0.12 4.20 0.25 3.70 0.34 4.00 0.26 3.80 0.35 3.30 0.41 2.80 0.55 2.90 0.47 3.60 0.24 17
CHR 16-Smoking restriction policy enforcement (LHD) - 4.40 0.22 3.70 0.38 3.00 0.57 3.90 0.25 3.70 0.42 3.40 0.42 3.30 0.47 3.30 0.41 3.54 0.30 23
CHR 17-Hypertension education session volume (LHD) - 4.60 0.15 3.90 0.35 3.60 0.40 2.80 0.28 2.70 0.35 3.70 0.34 3.10 0.49 3.20 0.46 3.43 0.18 40
CHR 18-Asthma prevention activity availability (LHD) - 4.40 0.16 3.60 0.37 3.50 0.45 2.50 0.39 2.20 0.56 3.30 0.43 3.00 0.54 3.10 0.42 3.19 0.28 80
CHR 19-Blood lead screening volume (LHD) - 3.90 0.37 3.70 0.40 4.10 0.31 3.50 0.34 2.90 0.34 3.70 0.26 4.50 0.12 4.20 0.25 3.85 0.17 1
CHR 20-Breast cancer screening rate (LHD) - 4.50 0.19 4.20 0.22 3.60 0.40 3.60 0.23 3.10 0.28 3.30 0.29 3.50 0.31 3.30 0.41 3.62 0.21 16
CHR 21-Breast cancer screening volume (LHD) - 4.50 0.19 4.10 0.27 3.80 0.39 3.40 0.35 2.90 0.38 3.30 0.35 3.90 0.33 3.90 0.25 3.73 0.22 6
CHR 22-Breast cancer screening availability (LHD) - 4.50 0.19 4.10 0.27 3.80 0.39 3.50 0.20 2.90 0.30 3.60 0.30 4.10 0.29 3.60 0.33 3.77 0.17 4
CHR 23-Other cancer screening volume (LHD) - 3.80 0.43 3.20 0.46 3.00 0.57 2.60 0.41 2.40 0.45 3.40 0.40 2.90 0.55 3.10 0.49 3.04 0.34 107
CHR 24-Cancer education session volume (LHD) - 4.40 0.19 3.90 0.28 3.30 0.47 2.60 0.41 2.40 0.45 3.50 0.34 2.90 0.47 3.00 0.47 3.23 0.22 70
CHR 25-Cancer education person volume (LHD) - 4.40 0.19 3.80 0.32 3.20 0.53 2.60 0.41 2.50 0.47 3.50 0.34 3.00 0.54 3.00 0.47 3.22 0.22 71
CHR 26-CVD screening volume (LHD) - 4.50 0.19 4.00 0.26 3.30 0.47 3.30 0.35 2.80 0.41 3.60 0.35 3.30 0.38 3.40 0.37 3.50 0.22 29
CHR 27-Cervical cancer screening volume (LHD) - 4.20 0.27 3.80 0.32 3.50 0.43 3.60 0.35 2.80 0.41 3.50 0.31 3.80 0.32 3.80 0.30 3.63 0.21 14
CHR 28-Cervical cancer screening availability (LHD) - 4.20 0.27 3.90 0.31 3.50 0.43 3.90 0.22 2.90 0.34 3.60 0.33 4.00 0.31 3.40 0.32 3.68 0.20 7
CHR 29-Child health nursing clinic visit volume (LHD) - 3.30 0.43 3.50 0.36 3.10 0.42 3.10 0.18 3.40 0.25 3.40 0.25 4.00 0.20 2.90 0.47 3.34 0.17 51
CHR 30-Child health nursing home visit volume (LHD) - 3.00 0.38 3.10 0.36 2.40 0.53 2.70 0.35 2.90 0.38 3.70 0.29 3.80 0.24 2.70 0.46 3.04 0.20 105
CHR 31-Child health nursing clinic patient volume (LHD) - 3.00 0.38 3.30 0.35 2.60 0.41 2.70 0.30 3.20 0.29 3.60 0.27 3.80 0.24 2.70 0.46 3.11 0.16 96
CHR 32-Child health nursing home patient volume (LHD) - 3.00 0.38 3.30 0.35 2.40 0.53 2.60 0.37 2.90 0.38 3.60 0.27 3.80 0.24 2.70 0.46 3.04 0.20 106
CHR 33-Chronic disease case management availability (LHD) - 3.80 0.35 3.80 0.37 3.10 0.42 3.30 0.20 3.20 0.38 3.80 0.32 3.40 0.42 2.80 0.44 3.38 0.24 46.5
CHR 34-Colorectal cancer screening volume (LHD) - 4.10 0.27 4.00 0.29 3.30 0.54 3.20 0.32 2.50 0.43 3.60 0.33 3.60 0.42 3.30 0.38 3.45 0.21 38
CHR 35-Diabetes risk screening volume (LHD) - 4.60 0.15 4.20 0.27 3.50 0.41 3.40 0.15 3.50 0.28 3.40 0.32 3.60 0.37 3.40 0.35 3.67 0.15 9
CHR 36-Diabetes screening provider-availability (LHD) - 4.10 0.33 4.00 0.29 2.70 0.63 3.20 0.20 3.20 0.25 3.00 0.38 3.20 0.51 2.90 0.38 3.25 0.27 67
CHR 37-Diabetes screening target population reached (community) - 4.60 0.15 4.40 0.19 3.50 0.34 3.50 0.20 3.50 0.34 3.80 0.35 2.70 0.55 2.90 0.44 3.56 0.16 22
CHR 38-Diabetes counseling sessions provided (LHD) - 4.60 0.15 4.30 0.22 3.30 0.32 2.90 0.20 2.90 0.34 3.70 0.34 3.30 0.38 3.40 0.28 3.52 0.14 25
CHR 39-Diabetes counseling individuals reached (LHD) - 4.60 0.15 4.30 0.22 3.30 0.32 3.10 0.24 2.90 0.47 3.70 0.34 3.00 0.54 3.40 0.32 3.50 0.17 30
CHR 40-Adult diabetes (community) - 4.10 0.33 3.00 0.61 2.90 0.53 2.40 0.63 3.10 0.49 3.30 0.43 3.30 0.43 3.00 0.47 3.11 0.36 97
CHR 41-Type II diabetes proportion of children who receive counseling (community) - 4.60 0.15 4.10 0.31 3.00 0.44 3.00 0.27 3.00 0.27 3.20 0.44 2.30 0.46 2.70 0.39 3.17 0.23 82
CHR 42-Domestic violence counseling sessions provided (LHD) - 3.50 0.47 3.50 0.49 2.80 0.58 2.30 0.46 2.50 0.54 3.40 0.37 2.70 0.61 2.90 0.50 2.93 0.38 117
CHR 43-Domestic violence counseling sessions individuals reached (LHD) - 3.50 0.47 3.50 0.49 2.80 0.58 2.40 0.49 2.60 0.52 3.40 0.37 2.60 0.63 2.60 0.63 2.90 0.41 122
CHR 44-Evidence-based strategies to improve healthy access to food (community) - 4.44 0.12 4.22 0.23 3.89 0.24 3.33 0.21 3.11 0.44 4.22 0.20 2.89 0.59 3.22 0.43 3.64 0.21 12
CHR 45-Health education multi-session events held (LHD) - 3.60 0.33 3.60 0.35 3.10 0.44 2.70 0.35 2.60 0.41 3.20 0.32 2.60 0.52 2.60 0.55 2.98 0.25 113
CHR 46-Health education single-session events held (LHD) - 3.60 0.33 3.60 0.35 3.10 0.44 2.40 0.49 2.60 0.41 3.20 0.32 2.60 0.52 2.60 0.55 2.94 0.25 115
CHR 47-Heart disease and Stroke screening (LHD) - 4.40 0.19 4.30 0.22 3.80 0.41 3.20 0.32 2.90 0.44 3.60 0.35 3.70 0.42 3.10 0.42 3.62 0.24 15
CHR 48-Heart disease screening done per target population (community) - 4.30 0.19 4.40 0.12 3.50 0.41 3.30 0.20 3.20 0.35 3.50 0.34 3.20 0.51 3.30 0.43 3.56 0.20 21
CHR 49-Hepatitis B new cases (community) - 3.40 0.40 3.30 0.47 3.20 0.41 2.80 0.47 2.50 0.47 3.30 0.32 4.00 0.24 2.90 0.47 3.20 0.24 77
CHR 50-High Blood pressure screenings in target population (community) - 4.50 0.16 4.40 0.22 3.70 0.34 3.30 0.20 3.50 0.31 3.30 0.35 2.60 0.45 3.10 0.39 3.50 0.17 28
CHR 51-Clinic-based homebound visits (community) - 2.60 0.55 2.80 0.50 2.10 0.42 1.90 0.52 2.40 0.53 3.20 0.38 2.10 0.65 1.80 0.51 2.34 0.28 137
CHR 52-Home-based homebound visits (community) - 2.60 0.55 2.90 0.47 2.10 0.42 2.00 0.47 2.40 0.53 3.10 0.42 2.10 0.65 1.80 0.51 2.35 0.27 136
CHR 53-Total number of individuals who received clinic-based homebound visits (community) - 2.60 0.55 2.90 0.47 2.10 0.42 1.90 0.52 2.40 0.53 3.10 0.42 2.10 0.65 1.80 0.51 2.34 0.28 138.5
CHR 54-Total number of individuals who received home-based homebound visits (community) - 2.60 0.55 2.90 0.47 2.10 0.42 2.00 0.47 2.40 0.53 3.00 0.47 2.10 0.65 1.80 0.51 2.34 0.28 138.5
CHR 55-Hypertension counseling sessions reach (community) - 4.50 0.16 4.40 0.16 3.70 0.34 3.30 0.25 3.20 0.35 3.60 0.30 2.50 0.54 3.20 0.35 3.51 0.15 26
CHR 56-Hypertension screening reach (LHD) - 4.50 0.16 4.40 0.12 3.60 0.35 3.30 0.25 3.30 0.32 3.50 0.31 3.30 0.43 3.40 0.37 3.63 0.18 13
CHR 57-Injury prevention participation (LHD) - 3.30 0.43 3.50 0.39 3.80 0.35 3.00 0.35 3.20 0.35 3.30 0.38 3.70 0.34 2.80 0.60 3.35 0.31 50
CHR 58-Injury rate reduction efforts (LHD) - 3.10 0.51 2.40 0.56 3.40 0.42 2.70 0.39 3.00 0.38 3.20 0.48 2.50 0.54 2.20 0.60 2.81 0.31 127
CHR 59-Injury prevention tasks initiated (LHD) - 3.10 0.51 3.00 0.47 3.60 0.42 2.70 0.39 3.00 0.38 3.10 0.42 3.10 0.49 2.20 0.56 2.99 0.30 112
Feasibility ValidityDomainFit DimensionFit Relevance HealthImpact EconomicImpact Variation
Summary-Chronic 10/1/2012
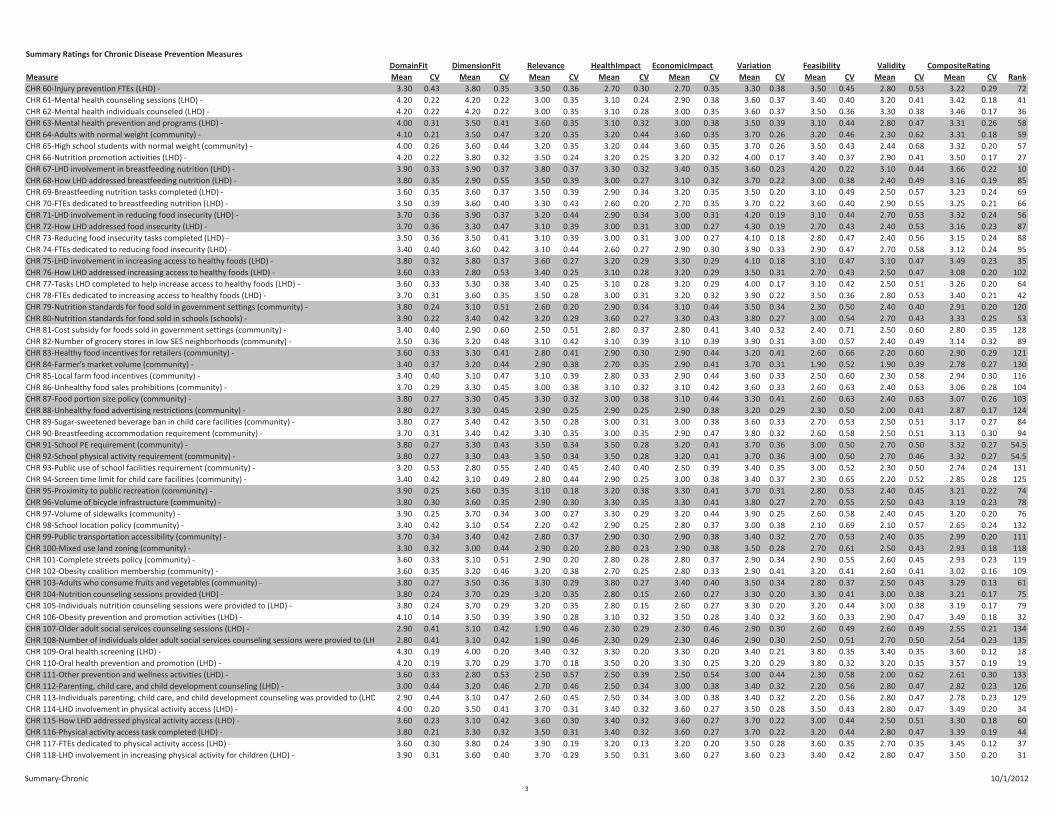
Summary Ratings for Chronic Disease Prevention Measures
CompositeRating
Measure Mean CV Mean CV Mean CV Mean CV Mean CV Mean CV Mean CV Mean CV Mean CV Rank
Feasibility ValidityDomainFit DimensionFit Relevance HealthImpact EconomicImpact Variation
CHR 60-Injury prevention FTEs (LHD) - 3.30 0.43 3.80 0.35 3.50 0.36 2.70 0.30 2.70 0.35 3.30 0.38 3.50 0.45 2.80 0.53 3.22 0.29 72
CHR 61-Mental health counseling sessions (LHD) - 4.20 0.22 4.20 0.22 3.00 0.35 3.10 0.24 2.90 0.38 3.60 0.37 3.40 0.40 3.20 0.41 3.42 0.18 41
CHR 62-Mental health individuals counseled (LHD) - 4.20 0.22 4.20 0.22 3.00 0.35 3.10 0.28 3.00 0.35 3.60 0.37 3.50 0.36 3.30 0.38 3.46 0.17 36
CHR 63-Mental health prevention and programs (LHD) - 4.00 0.31 3.50 0.41 3.60 0.35 3.10 0.32 3.00 0.38 3.50 0.39 3.10 0.44 2.80 0.47 3.31 0.26 58
CHR 64-Adults with normal weight (community) - 4.10 0.21 3.50 0.47 3.20 0.35 3.20 0.44 3.60 0.35 3.70 0.26 3.20 0.46 2.30 0.62 3.31 0.18 59
CHR 65-High school students with normal weight (community) - 4.00 0.26 3.60 0.44 3.20 0.35 3.20 0.44 3.60 0.35 3.70 0.26 3.50 0.43 2.44 0.68 3.32 0.20 57
CHR 66-Nutrition promotion activities (LHD) - 4.20 0.22 3.80 0.32 3.50 0.24 3.20 0.25 3.20 0.32 4.00 0.17 3.40 0.37 2.90 0.41 3.50 0.17 27
CHR 67-LHD involvement in breastfeeding nutrition (LHD) - 3.90 0.33 3.90 0.37 3.80 0.37 3.30 0.32 3.40 0.35 3.60 0.23 4.20 0.22 3.10 0.44 3.66 0.22 10
CHR 68-How LHD addressed breastfeeding nutrition (LHD) - 3.80 0.35 2.90 0.55 3.50 0.39 3.00 0.27 3.10 0.32 3.70 0.22 3.00 0.38 2.40 0.49 3.16 0.19 85
CHR 69-Breastfeeding nutrition tasks completed (LHD) - 3.60 0.35 3.60 0.37 3.50 0.39 2.90 0.34 3.20 0.35 3.50 0.20 3.10 0.49 2.50 0.57 3.23 0.24 69
CHR 70-FTEs dedicated to breastfeeding nutrition (LHD) - 3.50 0.39 3.60 0.40 3.30 0.43 2.60 0.20 2.70 0.35 3.70 0.22 3.60 0.40 2.90 0.55 3.25 0.21 66
CHR 71-LHD involvement in reducing food insecurity (LHD) - 3.70 0.36 3.90 0.37 3.20 0.44 2.90 0.34 3.00 0.31 4.20 0.19 3.10 0.44 2.70 0.53 3.32 0.24 56
CHR 72-How LHD addressed food insecurity (LHD) - 3.70 0.36 3.30 0.47 3.10 0.39 3.00 0.31 3.00 0.27 4.30 0.19 2.70 0.43 2.40 0.53 3.16 0.23 87
CHR 73-Reducing food insecurity tasks completed (LHD) - 3.50 0.36 3.50 0.41 3.10 0.39 3.00 0.31 3.00 0.27 4.10 0.18 2.80 0.47 2.40 0.56 3.15 0.24 88
CHR 74-FTEs dedicated to reducing food insecurity (LHD) - 3.40 0.40 3.60 0.42 3.10 0.44 2.60 0.27 2.90 0.30 3.90 0.33 2.90 0.47 2.70 0.58 3.12 0.24 95
CHR 75-LHD involvement in increasing access to healthy foods (LHD) - 3.80 0.32 3.80 0.37 3.60 0.27 3.20 0.29 3.30 0.29 4.10 0.18 3.10 0.47 3.10 0.47 3.49 0.23 35
CHR 76-How LHD addressed increasing access to healthy foods (LHD) - 3.60 0.33 2.80 0.53 3.40 0.25 3.10 0.28 3.20 0.29 3.50 0.31 2.70 0.43 2.50 0.47 3.08 0.20 102
CHR 77-Tasks LHD completed to help increase access to healthy foods (LHD) - 3.60 0.33 3.30 0.38 3.40 0.25 3.10 0.28 3.20 0.29 4.00 0.17 3.10 0.42 2.50 0.51 3.26 0.20 64
CHR 78-FTEs dedicated to increasing access to healthy foods (LHD) - 3.70 0.31 3.60 0.35 3.50 0.28 3.00 0.31 3.20 0.32 3.90 0.22 3.50 0.36 2.80 0.53 3.40 0.21 42
CHR 79-Nutrition standards for food sold in government settings (community) - 3.80 0.24 3.10 0.51 2.60 0.20 2.90 0.34 3.10 0.44 3.50 0.34 2.30 0.50 2.40 0.40 2.91 0.20 120
CHR 80-Nutrition standards for food sold in schools (schools) - 3.90 0.22 3.40 0.42 3.20 0.29 3.60 0.27 3.30 0.43 3.80 0.27 3.00 0.54 2.70 0.43 3.33 0.25 53
CHR 81-Cost subsidy for foods sold in government settings (community) - 3.40 0.40 2.90 0.60 2.50 0.51 2.80 0.37 2.80 0.41 3.40 0.32 2.40 0.71 2.50 0.60 2.80 0.35 128
CHR 82-Number of grocery stores in low SES neighborhoods (community) - 3.50 0.36 3.20 0.48 3.10 0.42 3.10 0.39 3.10 0.39 3.90 0.31 3.00 0.57 2.40 0.49 3.14 0.32 89
CHR 83-Healthy food incentives for retailers (community) - 3.60 0.33 3.30 0.41 2.80 0.41 2.90 0.30 2.90 0.44 3.20 0.41 2.60 0.66 2.20 0.60 2.90 0.29 121
CHR 84-Farmer's market volume (community) - 3.40 0.37 3.20 0.44 2.90 0.38 2.70 0.35 2.90 0.41 3.70 0.31 1.90 0.52 1.90 0.39 2.78 0.27 130
CHR 85-Local farm food incentives (community) - 3.40 0.40 3.10 0.47 3.10 0.39 2.80 0.33 2.90 0.44 3.60 0.33 2.50 0.60 2.30 0.58 2.94 0.30 116
CHR 86-Unhealthy food sales prohibitions (community) - 3.70 0.29 3.30 0.45 3.00 0.38 3.10 0.32 3.10 0.42 3.60 0.33 2.60 0.63 2.40 0.63 3.06 0.28 104
CHR 87-Food portion size policy (community) - 3.80 0.27 3.30 0.45 3.30 0.32 3.00 0.38 3.10 0.44 3.30 0.41 2.60 0.63 2.40 0.63 3.07 0.26 103
CHR 88-Unhealthy food advertising restrictions (community) - 3.80 0.27 3.30 0.45 2.90 0.25 2.90 0.25 2.90 0.38 3.20 0.29 2.30 0.50 2.00 0.41 2.87 0.17 124
CHR 89-Sugar-sweetened beverage ban in child care facilities (community) - 3.80 0.27 3.40 0.42 3.50 0.28 3.00 0.31 3.00 0.38 3.60 0.33 2.70 0.53 2.50 0.51 3.17 0.27 84
CHR 90-Breastfeeding accommodation requirement (community) - 3.70 0.31 3.40 0.42 3.30 0.35 3.00 0.35 2.90 0.47 3.80 0.32 2.60 0.58 2.50 0.51 3.13 0.30 94
CHR 91-School PE requirement (community) - 3.80 0.27 3.30 0.43 3.50 0.34 3.50 0.28 3.20 0.41 3.70 0.36 3.00 0.50 2.70 0.50 3.32 0.27 54.5
CHR 92-School physical activity requirement (community) - 3.80 0.27 3.30 0.43 3.50 0.34 3.50 0.28 3.20 0.41 3.70 0.36 3.00 0.50 2.70 0.46 3.32 0.27 54.5
CHR 93-Public use of school facilities requirement (community) - 3.20 0.53 2.80 0.55 2.40 0.45 2.40 0.40 2.50 0.39 3.40 0.35 3.00 0.52 2.30 0.50 2.74 0.24 131
CHR 94-Screen time limit for child care facilities (community) - 3.40 0.42 3.10 0.49 2.80 0.44 2.90 0.25 3.00 0.38 3.40 0.37 2.30 0.65 2.20 0.52 2.85 0.28 125
CHR 95-Proximity to public recreation (community) - 3.90 0.25 3.60 0.35 3.10 0.18 3.20 0.38 3.30 0.41 3.70 0.31 2.80 0.53 2.40 0.45 3.21 0.22 74
CHR 96-Volume of bicycle infrastructure (community) - 3.80 0.30 3.60 0.35 2.90 0.30 3.30 0.35 3.30 0.41 3.80 0.27 2.70 0.55 2.50 0.43 3.19 0.23 78
CHR 97-Volume of sidewalks (community) - 3.90 0.25 3.70 0.34 3.00 0.27 3.30 0.29 3.20 0.44 3.90 0.25 2.60 0.58 2.40 0.45 3.20 0.20 76
CHR 98-School location policy (community) - 3.40 0.42 3.10 0.54 2.20 0.42 2.90 0.25 2.80 0.37 3.00 0.38 2.10 0.69 2.10 0.57 2.65 0.24 132
CHR 99-Public transportation accessibility (community) - 3.70 0.34 3.40 0.42 2.80 0.37 2.90 0.30 2.90 0.38 3.40 0.32 2.70 0.53 2.40 0.35 2.99 0.20 111
CHR 100-Mixed use land zoning (community) - 3.30 0.32 3.00 0.44 2.90 0.20 2.80 0.23 2.90 0.38 3.50 0.28 2.70 0.61 2.50 0.43 2.93 0.18 118
CHR 101-Complete streets policy (community) - 3.60 0.33 3.10 0.51 2.90 0.20 2.80 0.28 2.80 0.37 2.90 0.34 2.90 0.55 2.60 0.45 2.93 0.23 119
CHR 102-Obesity coalition membership (community) - 3.60 0.35 3.20 0.46 3.20 0.38 2.70 0.25 2.80 0.33 2.90 0.41 3.20 0.41 2.60 0.41 3.02 0.16 109
CHR 103-Adults who consume fruits and vegetables (community) - 3.80 0.27 3.50 0.36 3.30 0.29 3.80 0.27 3.40 0.40 3.50 0.34 2.80 0.37 2.50 0.43 3.29 0.13 61
CHR 104-Nutrition counseling sessions provided (LHD) - 3.80 0.24 3.70 0.29 3.20 0.35 2.80 0.15 2.60 0.27 3.30 0.20 3.30 0.41 3.00 0.38 3.21 0.17 75
CHR 105-Individuals nutrition counseling sessions were provided to (LHD) - 3.80 0.24 3.70 0.29 3.20 0.35 2.80 0.15 2.60 0.27 3.30 0.20 3.20 0.44 3.00 0.38 3.19 0.17 79
CHR 106-Obesity prevention and promotion activities (LHD) - 4.10 0.14 3.50 0.39 3.90 0.28 3.10 0.32 3.50 0.28 3.40 0.32 3.60 0.33 2.90 0.47 3.49 0.18 32
CHR 107-Older adult social services counseling sessions (LHD) - 2.90 0.41 3.10 0.42 1.90 0.46 2.30 0.29 2.30 0.46 2.90 0.30 2.60 0.49 2.60 0.49 2.55 0.21 134
CHR 108-Number of individuals older adult social services counseling sessions were provied to (LH 2.80 0.41 3.10 0.42 1.90 0.46 2.30 0.29 2.30 0.46 2.90 0.30 2.50 0.51 2.70 0.50 2.54 0.23 135
CHR 109-Oral health screening (LHD) - 4.30 0.19 4.00 0.20 3.40 0.32 3.30 0.20 3.30 0.20 3.40 0.21 3.80 0.35 3.40 0.35 3.60 0.12 18
CHR 110-Oral health prevention and promotion (LHD) - 4.20 0.19 3.70 0.29 3.70 0.18 3.50 0.20 3.30 0.25 3.20 0.29 3.80 0.32 3.20 0.35 3.57 0.19 19
CHR 111-Other prevention and wellness activities (LHD) - 3.60 0.33 2.80 0.53 2.50 0.57 2.50 0.39 2.50 0.54 3.00 0.44 2.30 0.58 2.00 0.62 2.61 0.30 133
CHR 112-Parenting, child care, and child development counseling (LHD) - 3.00 0.44 3.20 0.46 2.70 0.46 2.50 0.34 3.00 0.38 3.40 0.32 2.20 0.56 2.80 0.47 2.82 0.23 126
CHR 113-Individuals parenting, child care, and child development counseling was provided to (LHD 2.90 0.44 3.10 0.47 2.60 0.45 2.50 0.34 3.00 0.38 3.40 0.32 2.20 0.56 2.80 0.47 2.78 0.23 129
CHR 114-LHD involvement in physical activity access (LHD) - 4.00 0.20 3.50 0.41 3.70 0.31 3.40 0.32 3.60 0.27 3.50 0.28 3.50 0.43 2.80 0.47 3.49 0.20 34
CHR 115-How LHD addressed physical activity access (LHD) - 3.60 0.23 3.10 0.42 3.60 0.30 3.40 0.32 3.60 0.27 3.70 0.22 3.00 0.44 2.50 0.51 3.30 0.18 60
CHR 116-Physical activity access task completed (LHD) - 3.80 0.21 3.30 0.32 3.50 0.31 3.40 0.32 3.60 0.27 3.70 0.22 3.20 0.44 2.80 0.47 3.39 0.19 44
CHR 117-FTEs dedicated to physical activity access (LHD) - 3.60 0.30 3.80 0.24 3.90 0.19 3.20 0.13 3.20 0.20 3.50 0.28 3.60 0.35 2.70 0.35 3.45 0.12 37
CHR 118-LHD involvement in increasing physical activity for children (LHD) - 3.90 0.31 3.60 0.40 3.70 0.29 3.50 0.31 3.60 0.27 3.60 0.23 3.40 0.42 2.80 0.47 3.50 0.20 31
Summary-Chronic 10/1/2012
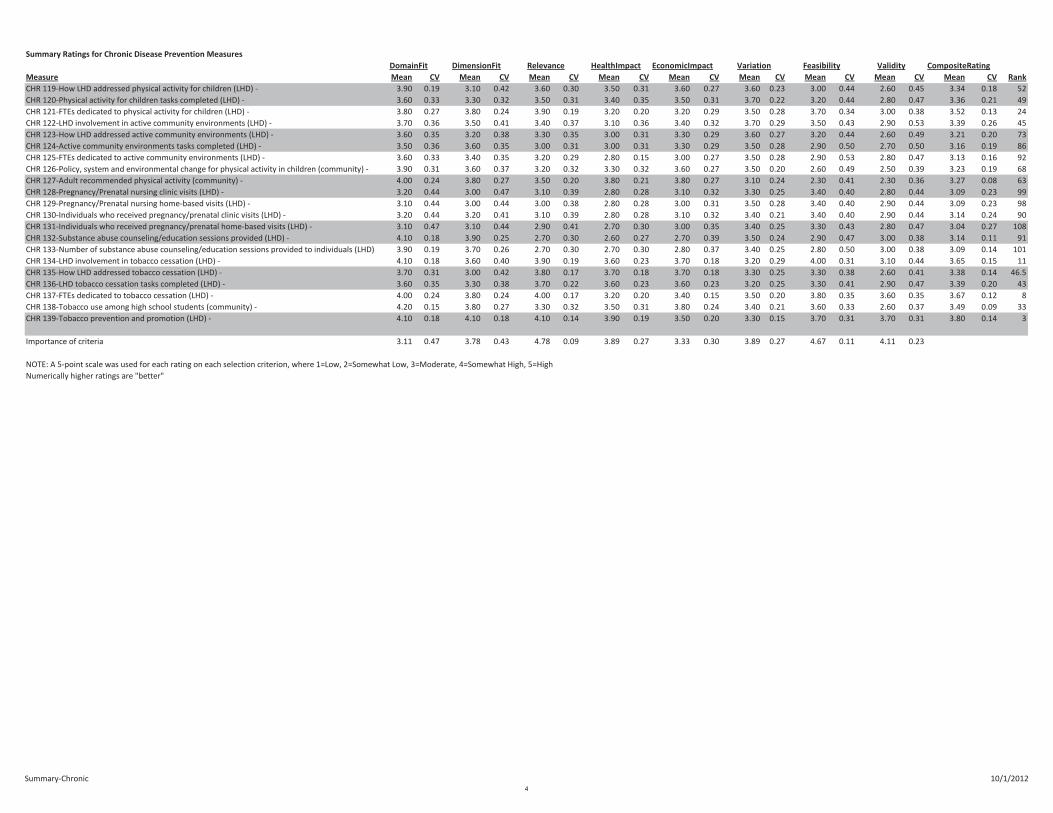
Summary Ratings for Chronic Disease Prevention Measures
CompositeRating
Measure Mean CV Mean CV Mean CV Mean CV Mean CV Mean CV Mean CV Mean CV Mean CV Rank
Feasibility ValidityDomainFit DimensionFit Relevance HealthImpact EconomicImpact Variation
CHR 119-How LHD addressed physical activity for children (LHD) - 3.90 0.19 3.10 0.42 3.60 0.30 3.50 0.31 3.60 0.27 3.60 0.23 3.00 0.44 2.60 0.45 3.34 0.18 52
CHR 120-Physical activity for children tasks completed (LHD) - 3.60 0.33 3.30 0.32 3.50 0.31 3.40 0.35 3.50 0.31 3.70 0.22 3.20 0.44 2.80 0.47 3.36 0.21 49
CHR 121-FTEs dedicated to physical activity for children (LHD) - 3.80 0.27 3.80 0.24 3.90 0.19 3.20 0.20 3.20 0.29 3.50 0.28 3.70 0.34 3.00 0.38 3.52 0.13 24
CHR 122-LHD involvement in active community environments (LHD) - 3.70 0.36 3.50 0.41 3.40 0.37 3.10 0.36 3.40 0.32 3.70 0.29 3.50 0.43 2.90 0.53 3.39 0.26 45
CHR 123-How LHD addressed active community environments (LHD) - 3.60 0.35 3.20 0.38 3.30 0.35 3.00 0.31 3.30 0.29 3.60 0.27 3.20 0.44 2.60 0.49 3.21 0.20 73
CHR 124-Active community environments tasks completed (LHD) - 3.50 0.36 3.60 0.35 3.00 0.31 3.00 0.31 3.30 0.29 3.50 0.28 2.90 0.50 2.70 0.50 3.16 0.19 86
CHR 125-FTEs dedicated to active community environments (LHD) - 3.60 0.33 3.40 0.35 3.20 0.29 2.80 0.15 3.00 0.27 3.50 0.28 2.90 0.53 2.80 0.47 3.13 0.16 92
CHR 126-Policy, system and environmental change for physical activity in children (community) - 3.90 0.31 3.60 0.37 3.20 0.32 3.30 0.32 3.60 0.27 3.50 0.20 2.60 0.49 2.50 0.39 3.23 0.19 68
CHR 127-Adult recommended physical activity (community) - 4.00 0.24 3.80 0.27 3.50 0.20 3.80 0.21 3.80 0.27 3.10 0.24 2.30 0.41 2.30 0.36 3.27 0.08 63
CHR 128-Pregnancy/Prenatal nursing clinic visits (LHD) - 3.20 0.44 3.00 0.47 3.10 0.39 2.80 0.28 3.10 0.32 3.30 0.25 3.40 0.40 2.80 0.44 3.09 0.23 99
CHR 129-Pregnancy/Prenatal nursing home-based visits (LHD) - 3.10 0.44 3.00 0.44 3.00 0.38 2.80 0.28 3.00 0.31 3.50 0.28 3.40 0.40 2.90 0.44 3.09 0.23 98
CHR 130-Individuals who received pregnancy/prenatal clinic visits (LHD) - 3.20 0.44 3.20 0.41 3.10 0.39 2.80 0.28 3.10 0.32 3.40 0.21 3.40 0.40 2.90 0.44 3.14 0.24 90
CHR 131-Individuals who received pregnancy/prenatal home-based visits (LHD) - 3.10 0.47 3.10 0.44 2.90 0.41 2.70 0.30 3.00 0.35 3.40 0.25 3.30 0.43 2.80 0.47 3.04 0.27 108
CHR 132-Substance abuse counseling/education sessions provided (LHD) - 4.10 0.18 3.90 0.25 2.70 0.30 2.60 0.27 2.70 0.39 3.50 0.24 2.90 0.47 3.00 0.38 3.14 0.11 91
CHR 133-Number of substance abuse counseling/education sessions provided to individuals (LHD) 3.90 0.19 3.70 0.26 2.70 0.30 2.70 0.30 2.80 0.37 3.40 0.25 2.80 0.50 3.00 0.38 3.09 0.14 101
CHR 134-LHD involvement in tobacco cessation (LHD) - 4.10 0.18 3.60 0.40 3.90 0.19 3.60 0.23 3.70 0.18 3.20 0.29 4.00 0.31 3.10 0.44 3.65 0.15 11
CHR 135-How LHD addressed tobacco cessation (LHD) - 3.70 0.31 3.00 0.42 3.80 0.17 3.70 0.18 3.70 0.18 3.30 0.25 3.30 0.38 2.60 0.41 3.38 0.14 46.5
CHR 136-LHD tobacco cessation tasks completed (LHD) - 3.60 0.35 3.30 0.38 3.70 0.22 3.60 0.23 3.60 0.23 3.20 0.25 3.30 0.41 2.90 0.47 3.39 0.20 43
CHR 137-FTEs dedicated to tobacco cessation (LHD) - 4.00 0.24 3.80 0.24 4.00 0.17 3.20 0.20 3.40 0.15 3.50 0.20 3.80 0.35 3.60 0.35 3.67 0.12 8
CHR 138-Tobacco use among high school students (community) - 4.20 0.15 3.80 0.27 3.30 0.32 3.50 0.31 3.80 0.24 3.40 0.21 3.60 0.33 2.60 0.37 3.49 0.09 33
CHR 139-Tobacco prevention and promotion (LHD) - 4.10 0.18 4.10 0.18 4.10 0.14 3.90 0.19 3.50 0.20 3.30 0.15 3.70 0.31 3.70 0.31 3.80 0.14 3
Importance of criteria 3.11 0.47 3.78 0.43 4.78 0.09 3.89 0.27 3.33 0.30 3.89 0.27 4.67 0.11 4.11 0.23
NOTE: A 5-point scale was used for each rating on each selection criterion, where 1=Low, 2=Somewhat Low, 3=Moderate, 4=Somewhat High, 5=High
Numerically higher ratings are "better"
Rank-Chronic 10/1/2012
Summary Ratings for Chronic Disease Prevention Measures, Ordered by Rank
CompositeRating
Measure Mean CV Mean CV Mean CV Mean CV Mean CV Mean CV Mean CV Mean CV Mean CV Rank
CHR 19-Blood lead screening volume (LHD) - 3.90 0.37 3.70 0.40 4.10 0.31 3.50 0.34 2.90 0.34 3.70 0.26 4.50 0.12 4.20 0.25 3.85 0.17 1
CHR 11-Combined physical activity intervention availability (community) - 4.50 0.12 4.40 0.16 4.10 0.24 3.80 0.27 3.00 0.35 4.20 0.22 3.40 0.35 3.40 0.35 3.84 0.14 2
CHR 139-Tobacco prevention and promotion (LHD) - 4.10 0.18 4.10 0.18 4.10 0.14 3.90 0.19 3.50 0.20 3.30 0.15 3.70 0.31 3.70 0.31 3.80 0.14 3
CHR 22-Breast cancer screening availability (LHD) - 4.50 0.19 4.10 0.27 3.80 0.39 3.50 0.20 2.90 0.30 3.60 0.30 4.10 0.29 3.60 0.33 3.77 0.17 4
CHR 13-LHD funding for physical activity promotion (LHD) - 4.40 0.16 4.30 0.25 4.30 0.25 3.50 0.28 2.80 0.37 4.00 0.26 3.40 0.37 3.30 0.41 3.75 0.18 5
CHR 21-Breast cancer screening volume (LHD) - 4.50 0.19 4.10 0.27 3.80 0.39 3.40 0.35 2.90 0.38 3.30 0.35 3.90 0.33 3.90 0.25 3.73 0.22 6
CHR 28-Cervical cancer screening availability (LHD) - 4.20 0.27 3.90 0.31 3.50 0.43 3.90 0.22 2.90 0.34 3.60 0.33 4.00 0.31 3.40 0.32 3.68 0.20 7
CHR 137-FTEs dedicated to tobacco cessation (LHD) - 4.00 0.24 3.80 0.24 4.00 0.17 3.20 0.20 3.40 0.15 3.50 0.20 3.80 0.35 3.60 0.35 3.67 0.12 8
CHR 35-Diabetes risk screening volume (LHD) - 4.60 0.15 4.20 0.27 3.50 0.41 3.40 0.15 3.50 0.28 3.40 0.32 3.60 0.37 3.40 0.35 3.67 0.15 9
CHR 67-LHD involvement in breastfeeding nutrition (LHD) - 3.90 0.33 3.90 0.37 3.80 0.37 3.30 0.32 3.40 0.35 3.60 0.23 4.20 0.22 3.10 0.44 3.66 0.22 10
CHR 134-LHD involvement in tobacco cessation (LHD) - 4.10 0.18 3.60 0.40 3.90 0.19 3.60 0.23 3.70 0.18 3.20 0.29 4.00 0.31 3.10 0.44 3.65 0.15 11
CHR 44-Evidence-based strategies to improve healthy access to food (community) - 4.44 0.12 4.22 0.23 3.89 0.24 3.33 0.21 3.11 0.44 4.22 0.20 2.89 0.59 3.22 0.43 3.64 0.21 12
CHR 56-Hypertension screening reach (LHD) - 4.50 0.16 4.40 0.12 3.60 0.35 3.30 0.25 3.30 0.32 3.50 0.31 3.30 0.43 3.40 0.37 3.63 0.18 13
CHR 27-Cervical cancer screening volume (LHD) - 4.20 0.27 3.80 0.32 3.50 0.43 3.60 0.35 2.80 0.41 3.50 0.31 3.80 0.32 3.80 0.30 3.63 0.21 14
CHR 47-Heart disease and Stroke screening (LHD) - 4.40 0.19 4.30 0.22 3.80 0.41 3.20 0.32 2.90 0.44 3.60 0.35 3.70 0.42 3.10 0.42 3.62 0.24 15
CHR 20-Breast cancer screening rate (LHD) - 4.50 0.19 4.20 0.22 3.60 0.40 3.60 0.23 3.10 0.28 3.30 0.29 3.50 0.31 3.30 0.41 3.62 0.21 16
CHR 15-Smoking restriction policy exposure (community) - 4.50 0.12 4.20 0.25 3.70 0.34 4.00 0.26 3.80 0.35 3.30 0.41 2.80 0.55 2.90 0.47 3.60 0.24 17
CHR 109-Oral health screening (LHD) - 4.30 0.19 4.00 0.20 3.40 0.32 3.30 0.20 3.30 0.20 3.40 0.21 3.80 0.35 3.40 0.35 3.60 0.12 18
CHR 110-Oral health prevention and promotion (LHD) - 4.20 0.19 3.70 0.29 3.70 0.18 3.50 0.20 3.30 0.25 3.20 0.29 3.80 0.32 3.20 0.35 3.57 0.19 19
CHR 12-LHD staffing for physical activity promotion (LHD) - 4.00 0.26 4.00 0.31 4.10 0.27 3.10 0.28 2.60 0.32 3.80 0.30 3.50 0.41 3.30 0.41 3.57 0.19 20
CHR 48-Heart disease screening done per target population (community) - 4.30 0.19 4.40 0.12 3.50 0.41 3.30 0.20 3.20 0.35 3.50 0.34 3.20 0.51 3.30 0.43 3.56 0.20 21
CHR 37-Diabetes screening target population reached (community) - 4.60 0.15 4.40 0.19 3.50 0.34 3.50 0.20 3.50 0.34 3.80 0.35 2.70 0.55 2.90 0.44 3.56 0.16 22
CHR 16-Smoking restriction policy enforcement (LHD) - 4.40 0.22 3.70 0.38 3.00 0.57 3.90 0.25 3.70 0.42 3.40 0.42 3.30 0.47 3.30 0.41 3.54 0.30 23
CHR 121-FTEs dedicated to physical activity for children (LHD) - 3.80 0.27 3.80 0.24 3.90 0.19 3.20 0.20 3.20 0.29 3.50 0.28 3.70 0.34 3.00 0.38 3.52 0.13 24
CHR 38-Diabetes counseling sessions provided (LHD) - 4.60 0.15 4.30 0.22 3.30 0.32 2.90 0.20 2.90 0.34 3.70 0.34 3.30 0.38 3.40 0.28 3.52 0.14 25
CHR 55-Hypertension counseling sessions reach (community) - 4.50 0.16 4.40 0.16 3.70 0.34 3.30 0.25 3.20 0.35 3.60 0.30 2.50 0.54 3.20 0.35 3.51 0.15 26
CHR 66-Nutrition promotion activities (LHD) - 4.20 0.22 3.80 0.32 3.50 0.24 3.20 0.25 3.20 0.32 4.00 0.17 3.40 0.37 2.90 0.41 3.50 0.17 27
CHR 50-High Blood pressure screenings in target population (community) - 4.50 0.16 4.40 0.22 3.70 0.34 3.30 0.20 3.50 0.31 3.30 0.35 2.60 0.45 3.10 0.39 3.50 0.17 28
CHR 26-CVD screening volume (LHD) - 4.50 0.19 4.00 0.26 3.30 0.47 3.30 0.35 2.80 0.41 3.60 0.35 3.30 0.38 3.40 0.37 3.50 0.22 29
CHR 39-Diabetes counseling individuals reached (LHD) - 4.60 0.15 4.30 0.22 3.30 0.32 3.10 0.24 2.90 0.47 3.70 0.34 3.00 0.54 3.40 0.32 3.50 0.17 30
CHR 118-LHD involvement in increasing physical activity for children (LHD) - 3.90 0.31 3.60 0.40 3.70 0.29 3.50 0.31 3.60 0.27 3.60 0.23 3.40 0.42 2.80 0.47 3.50 0.20 31
CHR 106-Obesity prevention and promotion activities (LHD) - 4.10 0.14 3.50 0.39 3.90 0.28 3.10 0.32 3.50 0.28 3.40 0.32 3.60 0.33 2.90 0.47 3.49 0.18 32
CHR 138-Tobacco use among high school students (community) - 4.20 0.15 3.80 0.27 3.30 0.32 3.50 0.31 3.80 0.24 3.40 0.21 3.60 0.33 2.60 0.37 3.49 0.09 33
CHR 114-LHD involvement in physical activity access (LHD) - 4.00 0.20 3.50 0.41 3.70 0.31 3.40 0.32 3.60 0.27 3.50 0.28 3.50 0.43 2.80 0.47 3.49 0.20 34
CHR 75-LHD involvement in increasing access to healthy foods (LHD) - 3.80 0.32 3.80 0.37 3.60 0.27 3.20 0.29 3.30 0.29 4.10 0.18 3.10 0.47 3.10 0.47 3.49 0.23 35
CHR 62-Mental health individuals counseled (LHD) - 4.20 0.22 4.20 0.22 3.00 0.35 3.10 0.28 3.00 0.35 3.60 0.37 3.50 0.36 3.30 0.38 3.46 0.17 36
CHR 117-FTEs dedicated to physical activity access (LHD) - 3.60 0.30 3.80 0.24 3.90 0.19 3.20 0.13 3.20 0.20 3.50 0.28 3.60 0.35 2.70 0.35 3.45 0.12 37
CHR 34-Colorectal cancer screening volume (LHD) - 4.10 0.27 4.00 0.29 3.30 0.54 3.20 0.32 2.50 0.43 3.60 0.33 3.60 0.42 3.30 0.38 3.45 0.21 38
CHR 14-Tobacco use mass media campaign volume (community) - 4.50 0.12 4.30 0.19 3.30 0.41 3.70 0.26 3.70 0.36 3.30 0.43 2.60 0.41 2.60 0.41 3.43 0.20 39
CHR 17-Hypertension education session volume (LHD) - 4.60 0.15 3.90 0.35 3.60 0.40 2.80 0.28 2.70 0.35 3.70 0.34 3.10 0.49 3.20 0.46 3.43 0.18 40
CHR 61-Mental health counseling sessions (LHD) - 4.20 0.22 4.20 0.22 3.00 0.35 3.10 0.24 2.90 0.38 3.60 0.37 3.40 0.40 3.20 0.41 3.42 0.18 41
CHR 78-FTEs dedicated to increasing access to healthy foods (LHD) - 3.70 0.31 3.60 0.35 3.50 0.28 3.00 0.31 3.20 0.32 3.90 0.22 3.50 0.36 2.80 0.53 3.40 0.21 42
CHR 136-LHD tobacco cessation tasks completed (LHD) - 3.60 0.35 3.30 0.38 3.70 0.22 3.60 0.23 3.60 0.23 3.20 0.25 3.30 0.41 2.90 0.47 3.39 0.20 43
CHR 116-Physical activity access task completed (LHD) - 3.80 0.21 3.30 0.32 3.50 0.31 3.40 0.32 3.60 0.27 3.70 0.22 3.20 0.44 2.80 0.47 3.39 0.19 44
CHR 122-LHD involvement in active community environments (LHD) - 3.70 0.36 3.50 0.41 3.40 0.37 3.10 0.36 3.40 0.32 3.70 0.29 3.50 0.43 2.90 0.53 3.39 0.26 45
CHR 33-Chronic disease case management availability (LHD) - 3.80 0.35 3.80 0.37 3.10 0.42 3.30 0.20 3.20 0.38 3.80 0.32 3.40 0.42 2.80 0.44 3.38 0.24 46.5
CHR 135-How LHD addressed tobacco cessation (LHD) - 3.70 0.31 3.00 0.42 3.80 0.17 3.70 0.18 3.70 0.18 3.30 0.25 3.30 0.38 2.60 0.41 3.38 0.14 46.5
CHR 1- Community-wide physical activity campaign volume (community) - 4.30 0.19 4.10 0.21 3.40 0.28 3.50 0.24 2.80 0.33 4.20 0.19 2.60 0.55 2.40 0.35 3.37 0.10 48
CHR 120-Physical activity for children tasks completed (LHD) - 3.60 0.33 3.30 0.32 3.50 0.31 3.40 0.35 3.50 0.31 3.70 0.22 3.20 0.44 2.80 0.47 3.36 0.21 49
CHR 57-Injury prevention participation (LHD) - 3.30 0.43 3.50 0.39 3.80 0.35 3.00 0.35 3.20 0.35 3.30 0.38 3.70 0.34 2.80 0.60 3.35 0.31 50
CHR 29-Child health nursing clinic visit volume (LHD) - 3.30 0.43 3.50 0.36 3.10 0.42 3.10 0.18 3.40 0.25 3.40 0.25 4.00 0.20 2.90 0.47 3.34 0.17 51
CHR 119-How LHD addressed physical activity for children (LHD) - 3.90 0.19 3.10 0.42 3.60 0.30 3.50 0.31 3.60 0.27 3.60 0.23 3.00 0.44 2.60 0.45 3.34 0.18 52
CHR 80-Nutrition standards for food sold in schools (schools) - 3.90 0.22 3.40 0.42 3.20 0.29 3.60 0.27 3.30 0.43 3.80 0.27 3.00 0.54 2.70 0.43 3.33 0.25 53
CHR 91-School PE requirement (community) - 3.80 0.27 3.30 0.43 3.50 0.34 3.50 0.28 3.20 0.41 3.70 0.36 3.00 0.50 2.70 0.50 3.32 0.27 54.5
CHR 92-School physical activity requirement (community) - 3.80 0.27 3.30 0.43 3.50 0.34 3.50 0.28 3.20 0.41 3.70 0.36 3.00 0.50 2.70 0.46 3.32 0.27 54.5
CHR 71-LHD involvement in reducing food insecurity (LHD) - 3.70 0.36 3.90 0.37 3.20 0.44 2.90 0.34 3.00 0.31 4.20 0.19 3.10 0.44 2.70 0.53 3.32 0.24 56
CHR 65-High school students with normal weight (community) - 4.00 0.26 3.60 0.44 3.20 0.35 3.20 0.44 3.60 0.35 3.70 0.26 3.50 0.43 2.44 0.68 3.32 0.20 57
CHR 63-Mental health prevention and programs (LHD) - 4.00 0.31 3.50 0.41 3.60 0.35 3.10 0.32 3.00 0.38 3.50 0.39 3.10 0.44 2.80 0.47 3.31 0.26 58
CHR 64-Adults with normal weight (community) - 4.10 0.21 3.50 0.47 3.20 0.35 3.20 0.44 3.60 0.35 3.70 0.26 3.20 0.46 2.30 0.62 3.31 0.18 59
Feasibility ValidityDomainFit DimensionFit Relevance HealthImpact EconomicImpact Variation
Rank-Chronic 10/1/2012
Summary Ratings for Chronic Disease Prevention Measures, Ordered by Rank
CompositeRating
Measure Mean CV Mean CV Mean CV Mean CV Mean CV Mean CV Mean CV Mean CV Mean CV Rank
Feasibility ValidityDomainFit DimensionFit Relevance HealthImpact EconomicImpact Variation
CHR 115-How LHD addressed physical activity access (LHD) - 3.60 0.23 3.10 0.42 3.60 0.30 3.40 0.32 3.60 0.27 3.70 0.22 3.00 0.44 2.50 0.51 3.30 0.18 60
CHR 103-Adults who consume fruits and vegetables (community) - 3.80 0.27 3.50 0.36 3.30 0.29 3.80 0.27 3.40 0.40 3.50 0.34 2.80 0.37 2.50 0.43 3.29 0.13 61
CHR 5-Community-scale urban design land use project volume (community) - 4.10 0.24 3.80 0.39 3.20 0.46 3.40 0.28 2.80 0.37 4.40 0.19 2.80 0.55 2.00 0.53 3.28 0.18 62
CHR 127-Adult recommended physical activity (community) - 4.00 0.24 3.80 0.27 3.50 0.20 3.80 0.21 3.80 0.27 3.10 0.24 2.30 0.41 2.30 0.36 3.27 0.08 63
CHR 77-Tasks LHD completed to help increase access to healthy foods (LHD) - 3.60 0.33 3.30 0.38 3.40 0.25 3.10 0.28 3.20 0.29 4.00 0.17 3.10 0.42 2.50 0.51 3.26 0.20 64
CHR 2-Community-wide physical activity campaign exposure (community) - 4.20 0.25 3.80 0.37 3.30 0.47 3.50 0.39 2.90 0.38 4.30 0.19 2.20 0.60 2.20 0.52 3.25 0.26 65
CHR 70-FTEs dedicated to breastfeeding nutrition (LHD) - 3.50 0.39 3.60 0.40 3.30 0.43 2.60 0.20 2.70 0.35 3.70 0.22 3.60 0.40 2.90 0.55 3.25 0.21 66
CHR 36-Diabetes screening provider-availability (LHD) - 4.10 0.33 4.00 0.29 2.70 0.63 3.20 0.20 3.20 0.25 3.00 0.38 3.20 0.51 2.90 0.38 3.25 0.27 67
CHR 126-Policy, system and environmental change for physical activity in children (community) - 3.90 0.31 3.60 0.37 3.20 0.32 3.30 0.32 3.60 0.27 3.50 0.20 2.60 0.49 2.50 0.39 3.23 0.19 68
CHR 69-Breastfeeding nutrition tasks completed (LHD) - 3.60 0.35 3.60 0.37 3.50 0.39 2.90 0.34 3.20 0.35 3.50 0.20 3.10 0.49 2.50 0.57 3.23 0.24 69
CHR 24-Cancer education session volume (LHD) - 4.40 0.19 3.90 0.28 3.30 0.47 2.60 0.41 2.40 0.45 3.50 0.34 2.90 0.47 3.00 0.47 3.23 0.22 70
CHR 25-Cancer education person volume (LHD) - 4.40 0.19 3.80 0.32 3.20 0.53 2.60 0.41 2.50 0.47 3.50 0.34 3.00 0.54 3.00 0.47 3.22 0.22 71
CHR 60-Injury prevention FTEs (LHD) - 3.30 0.43 3.80 0.35 3.50 0.36 2.70 0.30 2.70 0.35 3.30 0.38 3.50 0.45 2.80 0.53 3.22 0.29 72
CHR 123-How LHD addressed active community environments (LHD) - 3.60 0.35 3.20 0.38 3.30 0.35 3.00 0.31 3.30 0.29 3.60 0.27 3.20 0.44 2.60 0.49 3.21 0.20 73
CHR 95-Proximity to public recreation (community) - 3.90 0.25 3.60 0.35 3.10 0.18 3.20 0.38 3.30 0.41 3.70 0.31 2.80 0.53 2.40 0.45 3.21 0.22 74
CHR 104-Nutrition counseling sessions provided (LHD) - 3.80 0.24 3.70 0.29 3.20 0.35 2.80 0.15 2.60 0.27 3.30 0.20 3.30 0.41 3.00 0.38 3.21 0.17 75
CHR 97-Volume of sidewalks (community) - 3.90 0.25 3.70 0.34 3.00 0.27 3.30 0.29 3.20 0.44 3.90 0.25 2.60 0.58 2.40 0.45 3.20 0.20 76
CHR 49-Hepatitis B new cases (community) - 3.40 0.40 3.30 0.47 3.20 0.41 2.80 0.47 2.50 0.47 3.30 0.32 4.00 0.24 2.90 0.47 3.20 0.24 77
CHR 96-Volume of bicycle infrastructure (community) - 3.80 0.30 3.60 0.35 2.90 0.30 3.30 0.35 3.30 0.41 3.80 0.27 2.70 0.55 2.50 0.43 3.19 0.23 78
CHR 105-Individuals nutrition counseling sessions were provided to (LHD) - 3.80 0.24 3.70 0.29 3.20 0.35 2.80 0.15 2.60 0.27 3.30 0.20 3.20 0.44 3.00 0.38 3.19 0.17 79
CHR 18-Asthma prevention activity availability (LHD) - 4.40 0.16 3.60 0.37 3.50 0.45 2.50 0.39 2.20 0.56 3.30 0.43 3.00 0.54 3.10 0.42 3.19 0.28 80
CHR 9-Multicomponent weight loss intervention participation (community) - 4.50 0.16 4.10 0.31 2.70 0.61 3.30 0.29 2.70 0.53 4.10 0.21 2.20 0.52 2.40 0.49 3.18 0.26 81
CHR 41-Type II diabetes proportion of children who receive counseling (community) - 4.60 0.15 4.10 0.31 3.00 0.44 3.00 0.27 3.00 0.27 3.20 0.44 2.30 0.46 2.70 0.39 3.17 0.23 82
CHR 7-Community-scale urban design land use policy exposure (community) - 3.90 0.25 3.50 0.39 3.10 0.54 3.40 0.28 3.20 0.38 3.90 0.33 2.60 0.52 2.10 0.65 3.17 0.24 83
CHR 89-Sugar-sweetened beverage ban in child care facilities (community) - 3.80 0.27 3.40 0.42 3.50 0.28 3.00 0.31 3.00 0.38 3.60 0.33 2.70 0.53 2.50 0.51 3.17 0.27 84
CHR 68-How LHD addressed breastfeeding nutrition (LHD) - 3.80 0.35 2.90 0.55 3.50 0.39 3.00 0.27 3.10 0.32 3.70 0.22 3.00 0.38 2.40 0.49 3.16 0.19 85
CHR 124-Active community environments tasks completed (LHD) - 3.50 0.36 3.60 0.35 3.00 0.31 3.00 0.31 3.30 0.29 3.50 0.28 2.90 0.50 2.70 0.50 3.16 0.19 86
CHR 72-How LHD addressed food insecurity (LHD) - 3.70 0.36 3.30 0.47 3.10 0.39 3.00 0.31 3.00 0.27 4.30 0.19 2.70 0.43 2.40 0.53 3.16 0.23 87
CHR 73-Reducing food insecurity tasks completed (LHD) - 3.50 0.36 3.50 0.41 3.10 0.39 3.00 0.31 3.00 0.27 4.10 0.18 2.80 0.47 2.40 0.56 3.15 0.24 88
CHR 82-Number of grocery stores in low SES neighborhoods (community) - 3.50 0.36 3.20 0.48 3.10 0.42 3.10 0.39 3.10 0.39 3.90 0.31 3.00 0.57 2.40 0.49 3.14 0.32 89
CHR 130-Individuals who received pregnancy/prenatal clinic visits (LHD) - 3.20 0.44 3.20 0.41 3.10 0.39 2.80 0.28 3.10 0.32 3.40 0.21 3.40 0.40 2.90 0.44 3.14 0.24 90
CHR 132-Substance abuse counseling/education sessions provided (LHD) - 4.10 0.18 3.90 0.25 2.70 0.30 2.60 0.27 2.70 0.39 3.50 0.24 2.90 0.47 3.00 0.38 3.14 0.11 91
CHR 125-FTEs dedicated to active community environments (LHD) - 3.60 0.33 3.40 0.35 3.20 0.29 2.80 0.15 3.00 0.27 3.50 0.28 2.90 0.53 2.80 0.47 3.13 0.16 92
CHR 6-Community-scale urban design land use project proximity (community) - 4.10 0.24 3.50 0.45 3.10 0.51 3.20 0.35 2.80 0.37 4.20 0.22 2.50 0.54 2.00 0.58 3.13 0.23 93
CHR 90-Breastfeeding accommodation requirement (community) - 3.70 0.31 3.40 0.42 3.30 0.35 3.00 0.35 2.90 0.47 3.80 0.32 2.60 0.58 2.50 0.51 3.13 0.30 94
CHR 74-FTEs dedicated to reducing food insecurity (LHD) - 3.40 0.40 3.60 0.42 3.10 0.44 2.60 0.27 2.90 0.30 3.90 0.33 2.90 0.47 2.70 0.58 3.12 0.24 95
CHR 31-Child health nursing clinic patient volume (LHD) - 3.00 0.38 3.30 0.35 2.60 0.41 2.70 0.30 3.20 0.29 3.60 0.27 3.80 0.24 2.70 0.46 3.11 0.16 96
CHR 40-Adult diabetes (community) - 4.10 0.33 3.00 0.61 2.90 0.53 2.40 0.63 3.10 0.49 3.30 0.43 3.30 0.43 3.00 0.47 3.11 0.36 97
CHR 129-Pregnancy/Prenatal nursing home-based visits (LHD) - 3.10 0.44 3.00 0.44 3.00 0.38 2.80 0.28 3.00 0.31 3.50 0.28 3.40 0.40 2.90 0.44 3.09 0.23 98
CHR 128-Pregnancy/Prenatal nursing clinic visits (LHD) - 3.20 0.44 3.00 0.47 3.10 0.39 2.80 0.28 3.10 0.32 3.30 0.25 3.40 0.40 2.80 0.44 3.09 0.23 99
CHR 8-Multicomponent weight loss intervention availability (community) - 4.30 0.19 3.90 0.35 2.70 0.61 3.30 0.32 2.60 0.52 3.90 0.33 2.40 0.49 2.10 0.47 3.09 0.26 100
CHR 133-Number of substance abuse counseling/education sessions provided to individuals (LHD) 3.90 0.19 3.70 0.26 2.70 0.30 2.70 0.30 2.80 0.37 3.40 0.25 2.80 0.50 3.00 0.38 3.09 0.14 101
CHR 76-How LHD addressed increasing access to healthy foods (LHD) - 3.60 0.33 2.80 0.53 3.40 0.25 3.10 0.28 3.20 0.29 3.50 0.31 2.70 0.43 2.50 0.47 3.08 0.20 102
CHR 87-Food portion size policy (community) - 3.80 0.27 3.30 0.45 3.30 0.32 3.00 0.38 3.10 0.44 3.30 0.41 2.60 0.63 2.40 0.63 3.07 0.26 103
CHR 86-Unhealthy food sales prohibitions (community) - 3.70 0.29 3.30 0.45 3.00 0.38 3.10 0.32 3.10 0.42 3.60 0.33 2.60 0.63 2.40 0.63 3.06 0.28 104
CHR 30-Child health nursing home visit volume (LHD) - 3.00 0.38 3.10 0.36 2.40 0.53 2.70 0.35 2.90 0.38 3.70 0.29 3.80 0.24 2.70 0.46 3.04 0.20 105
CHR 32-Child health nursing home patient volume (LHD) - 3.00 0.38 3.30 0.35 2.40 0.53 2.60 0.37 2.90 0.38 3.60 0.27 3.80 0.24 2.70 0.46 3.04 0.20 106
CHR 23-Other cancer screening volume (LHD) - 3.80 0.43 3.20 0.46 3.00 0.57 2.60 0.41 2.40 0.45 3.40 0.40 2.90 0.55 3.10 0.49 3.04 0.34 107
CHR 131-Individuals who received pregnancy/prenatal home-based visits (LHD) - 3.10 0.47 3.10 0.44 2.90 0.41 2.70 0.30 3.00 0.35 3.40 0.25 3.30 0.43 2.80 0.47 3.04 0.27 108
CHR 102-Obesity coalition membership (community) - 3.60 0.35 3.20 0.46 3.20 0.38 2.70 0.25 2.80 0.33 2.90 0.41 3.20 0.41 2.60 0.41 3.02 0.16 109
CHR 10-Multicomponent weight loss intervention proximity (community) - 4.20 0.19 3.80 0.35 2.70 0.61 3.00 0.31 2.70 0.53 4.10 0.21 2.00 0.53 2.10 0.47 3.01 0.27 110
CHR 99-Public transportation accessibility (community) - 3.70 0.34 3.40 0.42 2.80 0.37 2.90 0.30 2.90 0.38 3.40 0.32 2.70 0.53 2.40 0.35 2.99 0.20 111
CHR 59-Injury prevention tasks initiated (LHD) - 3.10 0.51 3.00 0.47 3.60 0.42 2.70 0.39 3.00 0.38 3.10 0.42 3.10 0.49 2.20 0.56 2.99 0.30 112
CHR 45-Health education multi-session events held (LHD) - 3.60 0.33 3.60 0.35 3.10 0.44 2.70 0.35 2.60 0.41 3.20 0.32 2.60 0.52 2.60 0.55 2.98 0.25 113
CHR 4-Physical activity social support intervention participation volume (community) - 4.10 0.24 3.80 0.37 2.70 0.55 2.80 0.47 2.50 0.51 3.80 0.35 2.40 0.63 2.00 0.62 2.96 0.29 114
CHR 46-Health education single-session events held (LHD) - 3.60 0.33 3.60 0.35 3.10 0.44 2.40 0.49 2.60 0.41 3.20 0.32 2.60 0.52 2.60 0.55 2.94 0.25 115
CHR 85-Local farm food incentives (community) - 3.40 0.40 3.10 0.47 3.10 0.39 2.80 0.33 2.90 0.44 3.60 0.33 2.50 0.60 2.30 0.58 2.94 0.30 116
CHR 42-Domestic violence counseling sessions provided (LHD) - 3.50 0.47 3.50 0.49 2.80 0.58 2.30 0.46 2.50 0.54 3.40 0.37 2.70 0.61 2.90 0.50 2.93 0.38 117
CHR 100-Mixed use land zoning (community) - 3.30 0.32 3.00 0.44 2.90 0.20 2.80 0.23 2.90 0.38 3.50 0.28 2.70 0.61 2.50 0.43 2.93 0.18 118
Rank-Chronic 10/1/2012
Summary Ratings for Chronic Disease Prevention Measures, Ordered by Rank
CompositeRating
Measure Mean CV Mean CV Mean CV Mean CV Mean CV Mean CV Mean CV Mean CV Mean CV Rank
Feasibility ValidityDomainFit DimensionFit Relevance HealthImpact EconomicImpact Variation
CHR 101-Complete streets policy (community) - 3.60 0.33 3.10 0.51 2.90 0.20 2.80 0.28 2.80 0.37 2.90 0.34 2.90 0.55 2.60 0.45 2.93 0.23 119
CHR 79-Nutrition standards for food sold in government settings (community) - 3.80 0.24 3.10 0.51 2.60 0.20 2.90 0.34 3.10 0.44 3.50 0.34 2.30 0.50 2.40 0.40 2.91 0.20 120
CHR 83-Healthy food incentives for retailers (community) - 3.60 0.33 3.30 0.41 2.80 0.41 2.90 0.30 2.90 0.44 3.20 0.41 2.60 0.66 2.20 0.60 2.90 0.29 121
CHR 43-Domestic violence counseling sessions individuals reached (LHD) - 3.50 0.47 3.50 0.49 2.80 0.58 2.40 0.49 2.60 0.52 3.40 0.37 2.60 0.63 2.60 0.63 2.90 0.41 122
CHR 3-Physical activity social support intervention proximity (community) - 3.90 0.25 3.20 0.46 2.50 0.63 2.70 0.46 2.60 0.45 3.80 0.35 2.50 0.60 2.20 0.60 2.88 0.30 123
CHR 88-Unhealthy food advertising restrictions (community) - 3.80 0.27 3.30 0.45 2.90 0.25 2.90 0.25 2.90 0.38 3.20 0.29 2.30 0.50 2.00 0.41 2.87 0.17 124
CHR 94-Screen time limit for child care facilities (community) - 3.40 0.42 3.10 0.49 2.80 0.44 2.90 0.25 3.00 0.38 3.40 0.37 2.30 0.65 2.20 0.52 2.85 0.28 125
CHR 112-Parenting, child care, and child development counseling (LHD) - 3.00 0.44 3.20 0.46 2.70 0.46 2.50 0.34 3.00 0.38 3.40 0.32 2.20 0.56 2.80 0.47 2.82 0.23 126
CHR 58-Injury rate reduction efforts (LHD) - 3.10 0.51 2.40 0.56 3.40 0.42 2.70 0.39 3.00 0.38 3.20 0.48 2.50 0.54 2.20 0.60 2.81 0.31 127
CHR 81-Cost subsidy for foods sold in government settings (community) - 3.40 0.40 2.90 0.60 2.50 0.51 2.80 0.37 2.80 0.41 3.40 0.32 2.40 0.71 2.50 0.60 2.80 0.35 128
CHR 113-Individuals parenting, child care, and child development counseling was provided to (LHD 2.90 0.44 3.10 0.47 2.60 0.45 2.50 0.34 3.00 0.38 3.40 0.32 2.20 0.56 2.80 0.47 2.78 0.23 129
CHR 84-Farmer's market volume (community) - 3.40 0.37 3.20 0.44 2.90 0.38 2.70 0.35 2.90 0.41 3.70 0.31 1.90 0.52 1.90 0.39 2.78 0.27 130
CHR 93-Public use of school facilities requirement (community) - 3.20 0.53 2.80 0.55 2.40 0.45 2.40 0.40 2.50 0.39 3.40 0.35 3.00 0.52 2.30 0.50 2.74 0.24 131
CHR 98-School location policy (community) - 3.40 0.42 3.10 0.54 2.20 0.42 2.90 0.25 2.80 0.37 3.00 0.38 2.10 0.69 2.10 0.57 2.65 0.24 132
CHR 111-Other prevention and wellness activities (LHD) - 3.60 0.33 2.80 0.53 2.50 0.57 2.50 0.39 2.50 0.54 3.00 0.44 2.30 0.58 2.00 0.62 2.61 0.30 133
CHR 107-Older adult social services counseling sessions (LHD) - 2.90 0.41 3.10 0.42 1.90 0.46 2.30 0.29 2.30 0.46 2.90 0.30 2.60 0.49 2.60 0.49 2.55 0.21 134
CHR 108-Number of individuals older adult social services counseling sessions were provied to (LH 2.80 0.41 3.10 0.42 1.90 0.46 2.30 0.29 2.30 0.46 2.90 0.30 2.50 0.51 2.70 0.50 2.54 0.23 135
CHR 52-Home-based homebound visits (community) - 2.60 0.55 2.90 0.47 2.10 0.42 2.00 0.47 2.40 0.53 3.10 0.42 2.10 0.65 1.80 0.51 2.35 0.27 136
CHR 51-Clinic-based homebound visits (community) - 2.60 0.55 2.80 0.50 2.10 0.42 1.90 0.52 2.40 0.53 3.20 0.38 2.10 0.65 1.80 0.51 2.34 0.28 137
CHR 53-Total number of individuals who received clinic-based homebound visits (community) - 2.60 0.55 2.90 0.47 2.10 0.42 1.90 0.52 2.40 0.53 3.10 0.42 2.10 0.65 1.80 0.51 2.34 0.28 138.5
CHR 54-Total number of individuals who received home-based homebound visits (community) - 2.60 0.55 2.90 0.47 2.10 0.42 2.00 0.47 2.40 0.53 3.00 0.47 2.10 0.65 1.80 0.51 2.34 0.28 138.5
Importance of criteria 3.11 0.47 3.78 0.43 4.78 0.09 3.89 0.27 3.33 0.30 3.89 0.27 4.67 0.11 4.11 0.23
NOTE: A 5-point scale was used for each rating on each selection criterion, where 1=Low, 2=Somewhat Low, 3=Moderate, 4=Somewhat High, 5=High
Numerically higher ratings are "better"
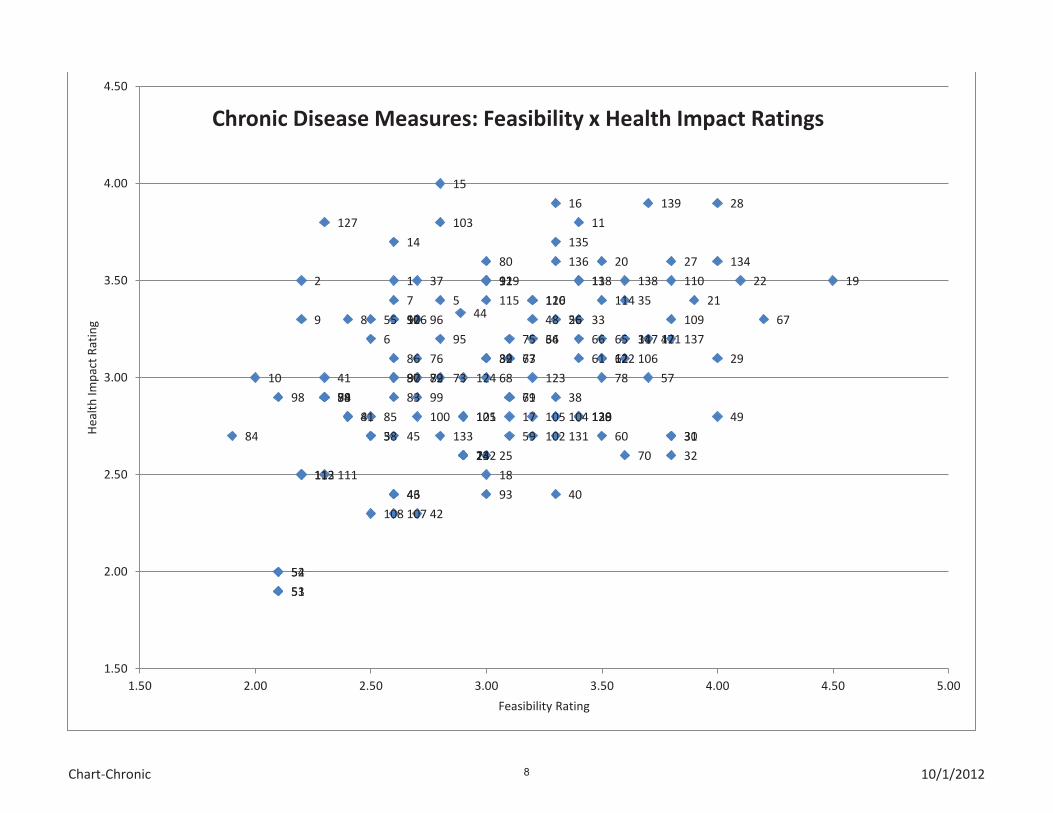
Chart-Chronic 10/1/2012
1 2
3
4
5
6
7
8 9
10
11
12
13
14
15
16
17
18
19
20
21
22
23 24 25
26
27
28
29
30 31
32
33
34
35
36
37
38
39
40
41
42
43
44
45
46
47
48
49
50
51
52
53
54
55 56
57
58 59 60
61 62 63
64 65 66
67
68
69
70
71
72 73
74
75
76 77
78
79
80
81
82
83
84
85
86
87
88
89 90
91 92
93
94
95
96 97
98 99
100 101
102
103
104 105
106
107 108
109
110
111 112 113
114 115 116
117
118 119
120
121
122
123 124
125
126
127
128 129 130
131
132
133
134
135
136
137
138
139
1.50
2.00
2.50
3.00
3.50
4.00
4.50
1.50 2.00 2.50 3.00 3.50 4.00 4.50 5.00
He
alt
h I
mp
act
Ra
tin
g
Feasibility Rating
Chronic Disease Measures: Feasibility x Health Impact Ratings
Summary-Communicable 10/1/2012
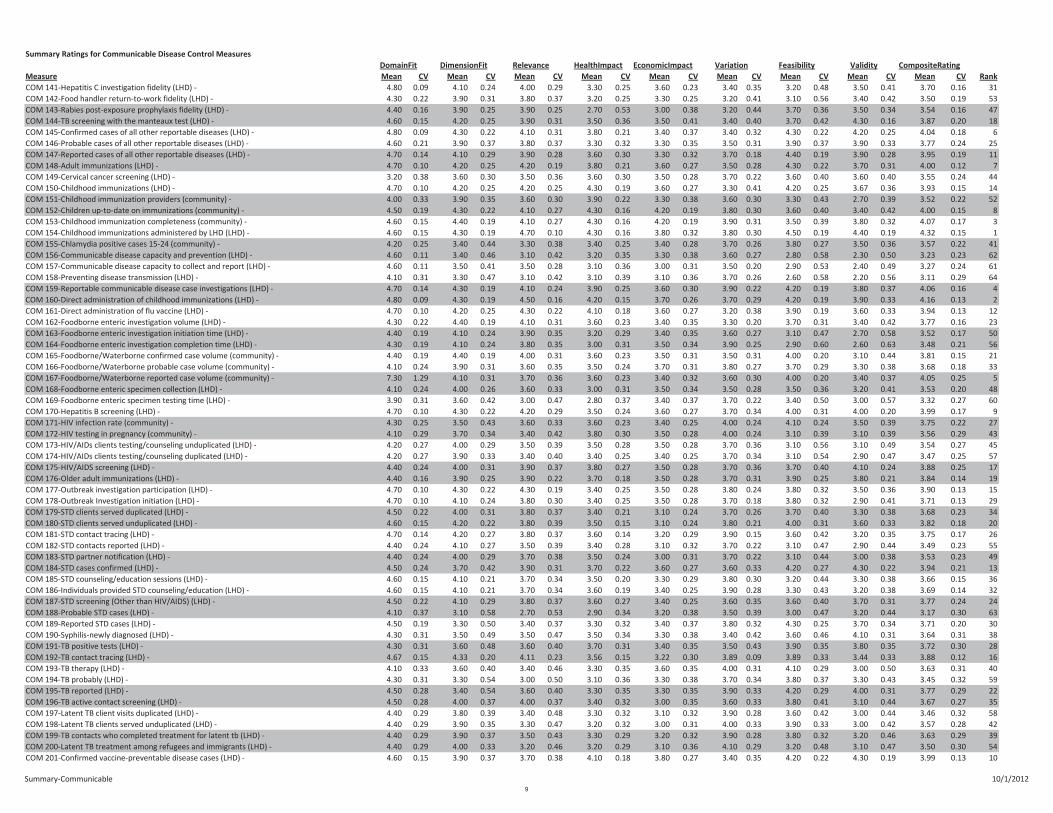
Summary Ratings for Communicable Disease Control Measures
CompositeRating
Measure Mean CV Mean CV Mean CV Mean CV Mean CV Mean CV Mean CV Mean CV Mean CV Rank
COM 141-Hepatitis C investigation fidelity (LHD) - 4.80 0.09 4.10 0.24 4.00 0.29 3.30 0.25 3.60 0.23 3.40 0.35 3.20 0.48 3.50 0.41 3.70 0.16 31
COM 142-Food handler return-to-work fidelity (LHD) - 4.30 0.22 3.90 0.31 3.80 0.37 3.20 0.25 3.30 0.25 3.20 0.41 3.10 0.56 3.40 0.42 3.50 0.19 53
COM 143-Rabies post-exposure prophylaxis fidelity (LHD) - 4.40 0.16 3.90 0.25 3.90 0.25 2.70 0.53 3.00 0.38 3.20 0.44 3.70 0.36 3.50 0.34 3.54 0.16 47
COM 144-TB screening with the manteaux test (LHD) - 4.60 0.15 4.20 0.25 3.90 0.31 3.50 0.36 3.50 0.41 3.40 0.40 3.70 0.42 4.30 0.16 3.87 0.20 18
COM 145-Confirmed cases of all other reportable diseases (LHD) - 4.80 0.09 4.30 0.22 4.10 0.31 3.80 0.21 3.40 0.37 3.40 0.32 4.30 0.22 4.20 0.25 4.04 0.18 6
COM 146-Probable cases of all other reportable diseases (LHD) - 4.60 0.21 3.90 0.37 3.80 0.37 3.30 0.32 3.30 0.35 3.50 0.31 3.90 0.37 3.90 0.33 3.77 0.24 25
COM 147-Reported cases of all other reportable diseases (LHD) - 4.70 0.14 4.10 0.29 3.90 0.28 3.60 0.30 3.30 0.32 3.70 0.18 4.40 0.19 3.90 0.28 3.95 0.19 11
COM 148-Adult immunizations (LHD) - 4.70 0.10 4.20 0.25 4.20 0.19 3.80 0.21 3.60 0.27 3.50 0.28 4.30 0.22 3.70 0.31 4.00 0.12 7
COM 149-Cervical cancer screening (LHD) - 3.20 0.38 3.60 0.30 3.50 0.36 3.60 0.30 3.50 0.28 3.70 0.22 3.60 0.40 3.60 0.40 3.55 0.24 44
COM 150-Childhood immunizations (LHD) - 4.70 0.10 4.20 0.25 4.20 0.25 4.30 0.19 3.60 0.27 3.30 0.41 4.20 0.25 3.67 0.36 3.93 0.15 14
COM 151-Childhood immunization providers (community) - 4.00 0.33 3.90 0.35 3.60 0.30 3.90 0.22 3.30 0.38 3.60 0.30 3.30 0.43 2.70 0.39 3.52 0.22 52
COM 152-Children up-to-date on immunizations (community) - 4.50 0.19 4.30 0.22 4.10 0.27 4.30 0.16 4.20 0.19 3.80 0.30 3.60 0.40 3.40 0.42 4.00 0.15 8
COM 153-Childhood immunization completeness (community) - 4.60 0.15 4.40 0.19 4.10 0.27 4.30 0.16 4.20 0.19 3.90 0.31 3.50 0.39 3.80 0.32 4.07 0.17 3
COM 154-Childhood immunizations administered by LHD (LHD) - 4.60 0.15 4.30 0.19 4.70 0.10 4.30 0.16 3.80 0.32 3.80 0.30 4.50 0.19 4.40 0.19 4.32 0.15 1
COM 155-Chlamydia positive cases 15-24 (community) - 4.20 0.25 3.40 0.44 3.30 0.38 3.40 0.25 3.40 0.28 3.70 0.26 3.80 0.27 3.50 0.36 3.57 0.22 41
COM 156-Communicable disease capacity and prevention (LHD) - 4.60 0.11 3.40 0.46 3.10 0.42 3.20 0.35 3.30 0.38 3.60 0.27 2.80 0.58 2.30 0.50 3.23 0.23 62
COM 157-Communicable disease capacity to collect and report (LHD) - 4.60 0.11 3.50 0.41 3.50 0.28 3.10 0.36 3.00 0.31 3.50 0.20 2.90 0.53 2.40 0.49 3.27 0.24 61
COM 158-Preventing disease transmission (LHD) - 4.10 0.31 3.30 0.47 3.10 0.42 3.10 0.39 3.10 0.36 3.70 0.26 2.60 0.58 2.20 0.56 3.11 0.29 64
COM 159-Reportable communicable disease case investigations (LHD) - 4.70 0.14 4.30 0.19 4.10 0.24 3.90 0.25 3.60 0.30 3.90 0.22 4.20 0.19 3.80 0.37 4.06 0.16 4
COM 160-Direct administration of childhood immunizations (LHD) - 4.80 0.09 4.30 0.19 4.50 0.16 4.20 0.15 3.70 0.26 3.70 0.29 4.20 0.19 3.90 0.33 4.16 0.13 2
COM 161-Direct administration of flu vaccine (LHD) - 4.70 0.10 4.20 0.25 4.30 0.22 4.10 0.18 3.60 0.27 3.20 0.38 3.90 0.19 3.60 0.33 3.94 0.13 12
COM 162-Foodborne enteric investigation volume (LHD) - 4.30 0.22 4.40 0.19 4.10 0.31 3.60 0.23 3.40 0.35 3.30 0.20 3.70 0.31 3.40 0.42 3.77 0.16 23
COM 163-Foodborne enteric investigation initiation time (LHD) - 4.40 0.19 4.10 0.24 3.90 0.35 3.20 0.29 3.40 0.35 3.60 0.27 3.10 0.47 2.70 0.58 3.52 0.17 50
COM 164-Foodborne enteric investigation completion time (LHD) - 4.30 0.19 4.10 0.24 3.80 0.35 3.00 0.31 3.50 0.34 3.90 0.25 2.90 0.60 2.60 0.63 3.48 0.21 56
COM 165-Foodborne/Waterborne confirmed case volume (community) - 4.40 0.19 4.40 0.19 4.00 0.31 3.60 0.23 3.50 0.31 3.50 0.31 4.00 0.20 3.10 0.44 3.81 0.15 21
COM 166-Foodborne/Waterborne probable case volume (community) - 4.10 0.24 3.90 0.31 3.60 0.35 3.50 0.24 3.70 0.31 3.80 0.27 3.70 0.29 3.30 0.38 3.68 0.18 33
COM 167-Foodborne/Waterborne reported case volume (community) - 7.30 1.29 4.10 0.31 3.70 0.36 3.60 0.23 3.40 0.32 3.60 0.30 4.00 0.20 3.40 0.37 4.05 0.25 5
COM 168-Foodborne enteric specimen collection (LHD) - 4.10 0.24 4.00 0.26 3.60 0.33 3.00 0.31 3.50 0.34 3.50 0.28 3.50 0.36 3.20 0.41 3.53 0.20 48
COM 169-Foodborne enteric specimen testing time (LHD) - 3.90 0.31 3.60 0.42 3.00 0.47 2.80 0.37 3.40 0.37 3.70 0.22 3.40 0.50 3.00 0.57 3.32 0.27 60
COM 170-Hepatitis B screening (LHD) - 4.70 0.10 4.30 0.22 4.20 0.29 3.50 0.24 3.60 0.27 3.70 0.34 4.00 0.31 4.00 0.20 3.99 0.17 9
COM 171-HIV infection rate (community) - 4.30 0.25 3.50 0.43 3.60 0.33 3.60 0.23 3.40 0.25 4.00 0.24 4.10 0.24 3.50 0.39 3.75 0.22 27
COM 172-HIV testing in pregnancy (community) - 4.10 0.29 3.70 0.34 3.40 0.42 3.80 0.30 3.50 0.28 4.00 0.24 3.10 0.39 3.10 0.39 3.56 0.29 43
COM 173-HIV/AIDs clients testing/counseling unduplicated (LHD) - 4.20 0.27 4.00 0.29 3.50 0.39 3.50 0.28 3.50 0.28 3.70 0.36 3.10 0.56 3.10 0.49 3.54 0.27 45
COM 174-HIV/AIDs clients testing/counseling duplicated (LHD) - 4.20 0.27 3.90 0.33 3.40 0.40 3.40 0.25 3.40 0.25 3.70 0.34 3.10 0.54 2.90 0.47 3.47 0.25 57
COM 175-HIV/AIDS screening (LHD) - 4.40 0.24 4.00 0.31 3.90 0.37 3.80 0.27 3.50 0.28 3.70 0.36 3.70 0.40 4.10 0.24 3.88 0.25 17
COM 176-Older adult immunizations (LHD) - 4.40 0.16 3.90 0.25 3.90 0.22 3.70 0.18 3.50 0.28 3.70 0.31 3.90 0.25 3.80 0.21 3.84 0.14 19
COM 177-Outbreak investigation participation (LHD) - 4.70 0.10 4.30 0.22 4.30 0.19 3.40 0.25 3.50 0.28 3.80 0.24 3.80 0.32 3.50 0.36 3.90 0.13 15
COM 178-Outbreak Investigation initiation (LHD) - 4.70 0.10 4.10 0.24 3.80 0.30 3.40 0.25 3.50 0.28 3.70 0.18 3.80 0.32 2.90 0.41 3.71 0.13 29
COM 179-STD clients served duplicated (LHD) - 4.50 0.22 4.00 0.31 3.80 0.37 3.40 0.21 3.10 0.24 3.70 0.26 3.70 0.40 3.30 0.38 3.68 0.23 34
COM 180-STD clients served unduplicated (LHD) - 4.60 0.15 4.20 0.22 3.80 0.39 3.50 0.15 3.10 0.24 3.80 0.21 4.00 0.31 3.60 0.33 3.82 0.18 20
COM 181-STD contact tracing (LHD) - 4.70 0.14 4.20 0.27 3.80 0.37 3.60 0.14 3.20 0.29 3.90 0.15 3.60 0.42 3.20 0.35 3.75 0.17 26
COM 182-STD contacts reported (LHD) - 4.40 0.24 4.10 0.27 3.50 0.39 3.40 0.28 3.10 0.32 3.70 0.22 3.10 0.47 2.90 0.44 3.49 0.23 55
COM 183-STD partner notification (LHD) - 4.40 0.24 4.00 0.29 3.70 0.38 3.50 0.24 3.00 0.31 3.70 0.22 3.10 0.44 3.00 0.38 3.53 0.23 49
COM 184-STD cases confirmed (LHD) - 4.50 0.24 3.70 0.42 3.90 0.31 3.70 0.22 3.60 0.27 3.60 0.33 4.20 0.27 4.30 0.22 3.94 0.21 13
COM 185-STD counseling/education sessions (LHD) - 4.60 0.15 4.10 0.21 3.70 0.34 3.50 0.20 3.30 0.29 3.80 0.30 3.20 0.44 3.30 0.38 3.66 0.15 36
COM 186-Individuals provided STD counseling/education (LHD) - 4.60 0.15 4.10 0.21 3.70 0.34 3.60 0.19 3.40 0.25 3.90 0.28 3.30 0.43 3.20 0.38 3.69 0.14 32
COM 187-STD screening (Other than HIV/AIDS) (LHD) - 4.50 0.22 4.10 0.29 3.80 0.37 3.60 0.27 3.40 0.25 3.60 0.35 3.60 0.40 3.70 0.31 3.77 0.24 24
COM 188-Probable STD cases (LHD) - 4.10 0.37 3.10 0.58 2.70 0.53 2.90 0.34 3.20 0.38 3.50 0.39 3.00 0.47 3.20 0.44 3.17 0.30 63
COM 189-Reported STD cases (LHD) - 4.50 0.19 3.30 0.50 3.40 0.37 3.30 0.32 3.40 0.37 3.80 0.32 4.30 0.25 3.70 0.34 3.71 0.20 30
COM 190-Syphilis-newly diagnosed (LHD) - 4.30 0.31 3.50 0.49 3.50 0.47 3.50 0.34 3.30 0.38 3.40 0.42 3.60 0.46 4.10 0.31 3.64 0.31 38
COM 191-TB positive tests (LHD) - 4.30 0.31 3.60 0.48 3.60 0.40 3.70 0.31 3.40 0.35 3.50 0.43 3.90 0.35 3.80 0.35 3.72 0.30 28
COM 192-TB contact tracing (LHD) - 4.67 0.15 4.33 0.20 4.11 0.23 3.56 0.15 3.22 0.30 3.89 0.09 3.89 0.33 3.44 0.33 3.88 0.12 16
COM 193-TB therapy (LHD) - 4.10 0.33 3.60 0.40 3.40 0.46 3.30 0.35 3.60 0.35 4.00 0.31 4.10 0.29 3.00 0.50 3.63 0.31 40
COM 194-TB probably (LHD) - 4.30 0.31 3.30 0.54 3.00 0.50 3.10 0.36 3.30 0.38 3.70 0.34 3.80 0.37 3.30 0.43 3.45 0.32 59
COM 195-TB reported (LHD) - 4.50 0.28 3.40 0.54 3.60 0.40 3.30 0.35 3.30 0.35 3.90 0.33 4.20 0.29 4.00 0.31 3.77 0.29 22
COM 196-TB active contact screening (LHD) - 4.50 0.28 4.00 0.37 4.00 0.37 3.40 0.32 3.00 0.35 3.60 0.33 3.80 0.41 3.10 0.44 3.67 0.27 35
COM 197-Latent TB client visits duplicated (LHD) - 4.40 0.29 3.80 0.39 3.40 0.48 3.30 0.32 3.10 0.32 3.90 0.28 3.60 0.42 3.00 0.44 3.46 0.32 58
COM 198-Latent TB clients served unduplicated (LHD) - 4.40 0.29 3.90 0.35 3.30 0.47 3.20 0.32 3.00 0.31 4.00 0.33 3.90 0.33 3.00 0.42 3.57 0.28 42
COM 199-TB contacts who completed treatment for latent tb (LHD) - 4.40 0.29 3.90 0.37 3.50 0.43 3.30 0.29 3.20 0.32 3.90 0.28 3.80 0.32 3.20 0.46 3.63 0.29 39
COM 200-Latent TB treatment among refugees and immigrants (LHD) - 4.40 0.29 4.00 0.33 3.20 0.46 3.20 0.29 3.10 0.36 4.10 0.29 3.20 0.48 3.10 0.47 3.50 0.30 54
COM 201-Confirmed vaccine-preventable disease cases (LHD) - 4.60 0.15 3.90 0.37 3.70 0.38 4.10 0.18 3.80 0.27 3.40 0.35 4.20 0.22 4.30 0.19 3.99 0.13 10
Feasibility ValidityDomainFit DimensionFit Relevance HealthImpact EconomicImpact Variation
Summary-Communicable 10/1/2012
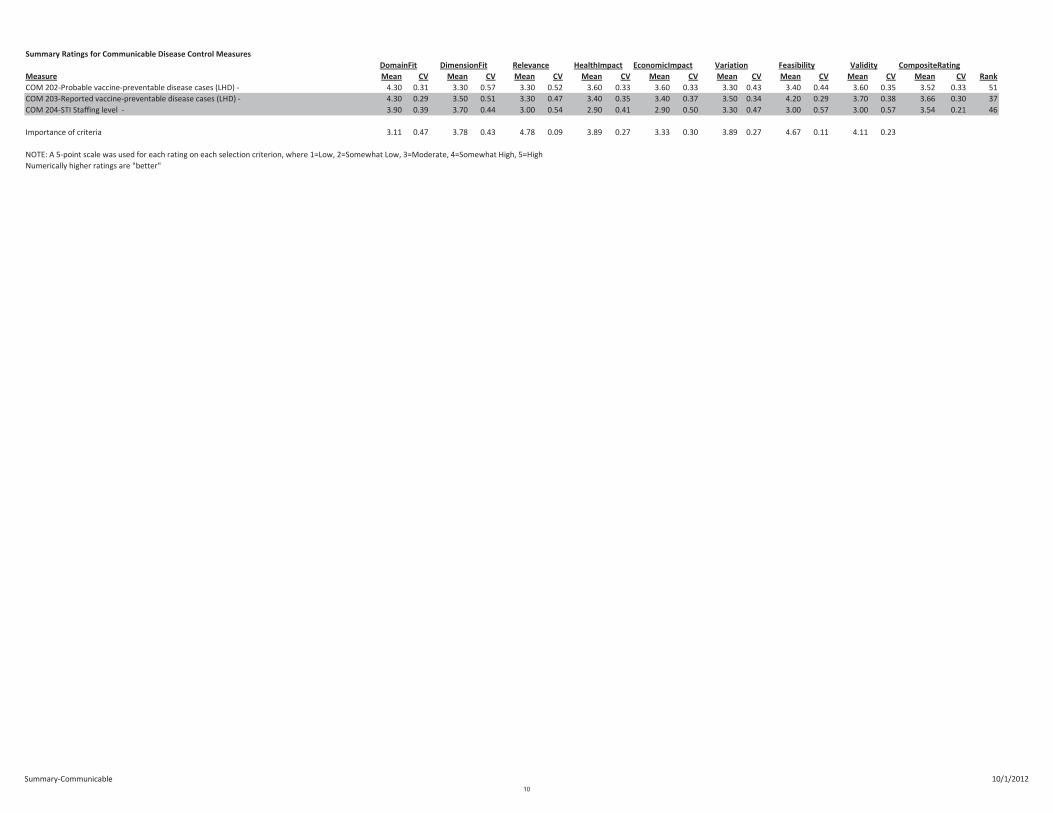
Summary Ratings for Communicable Disease Control Measures
CompositeRating
Measure Mean CV Mean CV Mean CV Mean CV Mean CV Mean CV Mean CV Mean CV Mean CV Rank
Feasibility ValidityDomainFit DimensionFit Relevance HealthImpact EconomicImpact Variation
COM 202-Probable vaccine-preventable disease cases (LHD) - 4.30 0.31 3.30 0.57 3.30 0.52 3.60 0.33 3.60 0.33 3.30 0.43 3.40 0.44 3.60 0.35 3.52 0.33 51
COM 203-Reported vaccine-preventable disease cases (LHD) - 4.30 0.29 3.50 0.51 3.30 0.47 3.40 0.35 3.40 0.37 3.50 0.34 4.20 0.29 3.70 0.38 3.66 0.30 37
COM 204-STI Staffing level - 3.90 0.39 3.70 0.44 3.00 0.54 2.90 0.41 2.90 0.50 3.30 0.47 3.00 0.57 3.00 0.57 3.54 0.21 46
Importance of criteria 3.11 0.47 3.78 0.43 4.78 0.09 3.89 0.27 3.33 0.30 3.89 0.27 4.67 0.11 4.11 0.23
NOTE: A 5-point scale was used for each rating on each selection criterion, where 1=Low, 2=Somewhat Low, 3=Moderate, 4=Somewhat High, 5=High
Numerically higher ratings are "better"
Rank-Communicable 10/1/2012
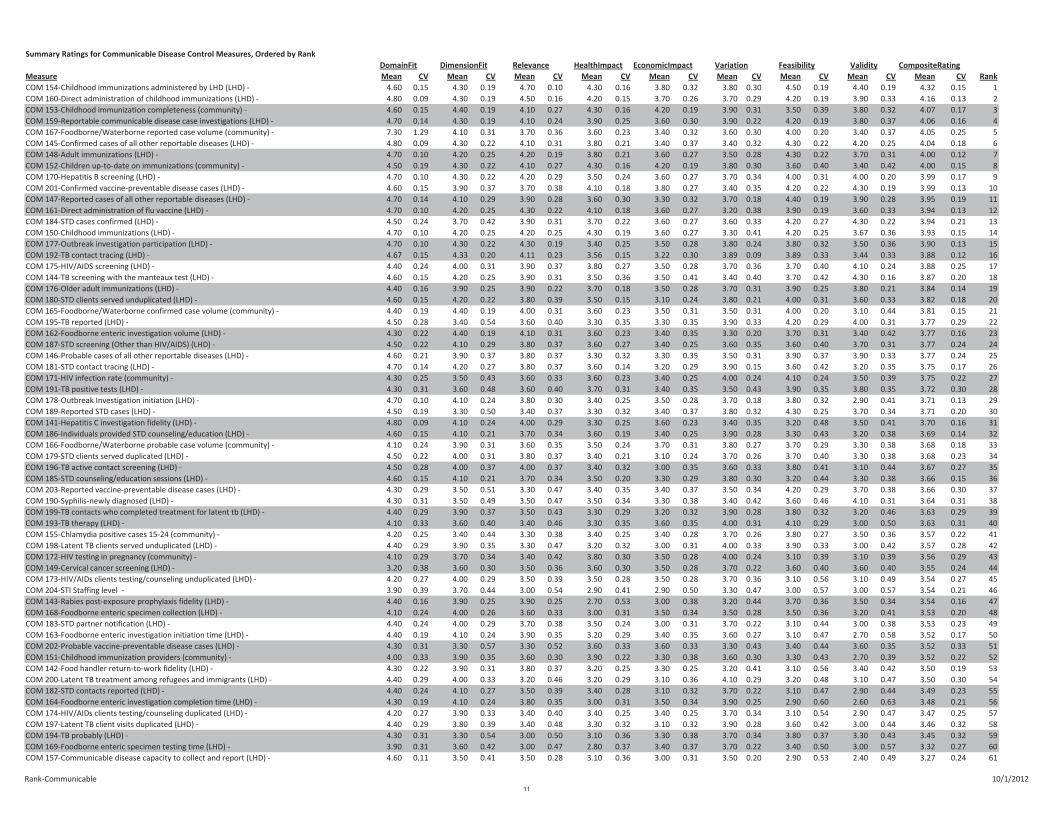
Summary Ratings for Communicable Disease Control Measures, Ordered by Rank
CompositeRating
Measure Mean CV Mean CV Mean CV Mean CV Mean CV Mean CV Mean CV Mean CV Mean CV Rank
COM 154-Childhood immunizations administered by LHD (LHD) - 4.60 0.15 4.30 0.19 4.70 0.10 4.30 0.16 3.80 0.32 3.80 0.30 4.50 0.19 4.40 0.19 4.32 0.15 1
COM 160-Direct administration of childhood immunizations (LHD) - 4.80 0.09 4.30 0.19 4.50 0.16 4.20 0.15 3.70 0.26 3.70 0.29 4.20 0.19 3.90 0.33 4.16 0.13 2
COM 153-Childhood immunization completeness (community) - 4.60 0.15 4.40 0.19 4.10 0.27 4.30 0.16 4.20 0.19 3.90 0.31 3.50 0.39 3.80 0.32 4.07 0.17 3
COM 159-Reportable communicable disease case investigations (LHD) - 4.70 0.14 4.30 0.19 4.10 0.24 3.90 0.25 3.60 0.30 3.90 0.22 4.20 0.19 3.80 0.37 4.06 0.16 4
COM 167-Foodborne/Waterborne reported case volume (community) - 7.30 1.29 4.10 0.31 3.70 0.36 3.60 0.23 3.40 0.32 3.60 0.30 4.00 0.20 3.40 0.37 4.05 0.25 5
COM 145-Confirmed cases of all other reportable diseases (LHD) - 4.80 0.09 4.30 0.22 4.10 0.31 3.80 0.21 3.40 0.37 3.40 0.32 4.30 0.22 4.20 0.25 4.04 0.18 6
COM 148-Adult immunizations (LHD) - 4.70 0.10 4.20 0.25 4.20 0.19 3.80 0.21 3.60 0.27 3.50 0.28 4.30 0.22 3.70 0.31 4.00 0.12 7
COM 152-Children up-to-date on immunizations (community) - 4.50 0.19 4.30 0.22 4.10 0.27 4.30 0.16 4.20 0.19 3.80 0.30 3.60 0.40 3.40 0.42 4.00 0.15 8
COM 170-Hepatitis B screening (LHD) - 4.70 0.10 4.30 0.22 4.20 0.29 3.50 0.24 3.60 0.27 3.70 0.34 4.00 0.31 4.00 0.20 3.99 0.17 9
COM 201-Confirmed vaccine-preventable disease cases (LHD) - 4.60 0.15 3.90 0.37 3.70 0.38 4.10 0.18 3.80 0.27 3.40 0.35 4.20 0.22 4.30 0.19 3.99 0.13 10
COM 147-Reported cases of all other reportable diseases (LHD) - 4.70 0.14 4.10 0.29 3.90 0.28 3.60 0.30 3.30 0.32 3.70 0.18 4.40 0.19 3.90 0.28 3.95 0.19 11
COM 161-Direct administration of flu vaccine (LHD) - 4.70 0.10 4.20 0.25 4.30 0.22 4.10 0.18 3.60 0.27 3.20 0.38 3.90 0.19 3.60 0.33 3.94 0.13 12
COM 184-STD cases confirmed (LHD) - 4.50 0.24 3.70 0.42 3.90 0.31 3.70 0.22 3.60 0.27 3.60 0.33 4.20 0.27 4.30 0.22 3.94 0.21 13
COM 150-Childhood immunizations (LHD) - 4.70 0.10 4.20 0.25 4.20 0.25 4.30 0.19 3.60 0.27 3.30 0.41 4.20 0.25 3.67 0.36 3.93 0.15 14
COM 177-Outbreak investigation participation (LHD) - 4.70 0.10 4.30 0.22 4.30 0.19 3.40 0.25 3.50 0.28 3.80 0.24 3.80 0.32 3.50 0.36 3.90 0.13 15
COM 192-TB contact tracing (LHD) - 4.67 0.15 4.33 0.20 4.11 0.23 3.56 0.15 3.22 0.30 3.89 0.09 3.89 0.33 3.44 0.33 3.88 0.12 16
COM 175-HIV/AIDS screening (LHD) - 4.40 0.24 4.00 0.31 3.90 0.37 3.80 0.27 3.50 0.28 3.70 0.36 3.70 0.40 4.10 0.24 3.88 0.25 17
COM 144-TB screening with the manteaux test (LHD) - 4.60 0.15 4.20 0.25 3.90 0.31 3.50 0.36 3.50 0.41 3.40 0.40 3.70 0.42 4.30 0.16 3.87 0.20 18
COM 176-Older adult immunizations (LHD) - 4.40 0.16 3.90 0.25 3.90 0.22 3.70 0.18 3.50 0.28 3.70 0.31 3.90 0.25 3.80 0.21 3.84 0.14 19
COM 180-STD clients served unduplicated (LHD) - 4.60 0.15 4.20 0.22 3.80 0.39 3.50 0.15 3.10 0.24 3.80 0.21 4.00 0.31 3.60 0.33 3.82 0.18 20
COM 165-Foodborne/Waterborne confirmed case volume (community) - 4.40 0.19 4.40 0.19 4.00 0.31 3.60 0.23 3.50 0.31 3.50 0.31 4.00 0.20 3.10 0.44 3.81 0.15 21
COM 195-TB reported (LHD) - 4.50 0.28 3.40 0.54 3.60 0.40 3.30 0.35 3.30 0.35 3.90 0.33 4.20 0.29 4.00 0.31 3.77 0.29 22
COM 162-Foodborne enteric investigation volume (LHD) - 4.30 0.22 4.40 0.19 4.10 0.31 3.60 0.23 3.40 0.35 3.30 0.20 3.70 0.31 3.40 0.42 3.77 0.16 23
COM 187-STD screening (Other than HIV/AIDS) (LHD) - 4.50 0.22 4.10 0.29 3.80 0.37 3.60 0.27 3.40 0.25 3.60 0.35 3.60 0.40 3.70 0.31 3.77 0.24 24
COM 146-Probable cases of all other reportable diseases (LHD) - 4.60 0.21 3.90 0.37 3.80 0.37 3.30 0.32 3.30 0.35 3.50 0.31 3.90 0.37 3.90 0.33 3.77 0.24 25
COM 181-STD contact tracing (LHD) - 4.70 0.14 4.20 0.27 3.80 0.37 3.60 0.14 3.20 0.29 3.90 0.15 3.60 0.42 3.20 0.35 3.75 0.17 26
COM 171-HIV infection rate (community) - 4.30 0.25 3.50 0.43 3.60 0.33 3.60 0.23 3.40 0.25 4.00 0.24 4.10 0.24 3.50 0.39 3.75 0.22 27
COM 191-TB positive tests (LHD) - 4.30 0.31 3.60 0.48 3.60 0.40 3.70 0.31 3.40 0.35 3.50 0.43 3.90 0.35 3.80 0.35 3.72 0.30 28
COM 178-Outbreak Investigation initiation (LHD) - 4.70 0.10 4.10 0.24 3.80 0.30 3.40 0.25 3.50 0.28 3.70 0.18 3.80 0.32 2.90 0.41 3.71 0.13 29
COM 189-Reported STD cases (LHD) - 4.50 0.19 3.30 0.50 3.40 0.37 3.30 0.32 3.40 0.37 3.80 0.32 4.30 0.25 3.70 0.34 3.71 0.20 30
COM 141-Hepatitis C investigation fidelity (LHD) - 4.80 0.09 4.10 0.24 4.00 0.29 3.30 0.25 3.60 0.23 3.40 0.35 3.20 0.48 3.50 0.41 3.70 0.16 31
COM 186-Individuals provided STD counseling/education (LHD) - 4.60 0.15 4.10 0.21 3.70 0.34 3.60 0.19 3.40 0.25 3.90 0.28 3.30 0.43 3.20 0.38 3.69 0.14 32
COM 166-Foodborne/Waterborne probable case volume (community) - 4.10 0.24 3.90 0.31 3.60 0.35 3.50 0.24 3.70 0.31 3.80 0.27 3.70 0.29 3.30 0.38 3.68 0.18 33
COM 179-STD clients served duplicated (LHD) - 4.50 0.22 4.00 0.31 3.80 0.37 3.40 0.21 3.10 0.24 3.70 0.26 3.70 0.40 3.30 0.38 3.68 0.23 34
COM 196-TB active contact screening (LHD) - 4.50 0.28 4.00 0.37 4.00 0.37 3.40 0.32 3.00 0.35 3.60 0.33 3.80 0.41 3.10 0.44 3.67 0.27 35
COM 185-STD counseling/education sessions (LHD) - 4.60 0.15 4.10 0.21 3.70 0.34 3.50 0.20 3.30 0.29 3.80 0.30 3.20 0.44 3.30 0.38 3.66 0.15 36
COM 203-Reported vaccine-preventable disease cases (LHD) - 4.30 0.29 3.50 0.51 3.30 0.47 3.40 0.35 3.40 0.37 3.50 0.34 4.20 0.29 3.70 0.38 3.66 0.30 37
COM 190-Syphilis-newly diagnosed (LHD) - 4.30 0.31 3.50 0.49 3.50 0.47 3.50 0.34 3.30 0.38 3.40 0.42 3.60 0.46 4.10 0.31 3.64 0.31 38
COM 199-TB contacts who completed treatment for latent tb (LHD) - 4.40 0.29 3.90 0.37 3.50 0.43 3.30 0.29 3.20 0.32 3.90 0.28 3.80 0.32 3.20 0.46 3.63 0.29 39
COM 193-TB therapy (LHD) - 4.10 0.33 3.60 0.40 3.40 0.46 3.30 0.35 3.60 0.35 4.00 0.31 4.10 0.29 3.00 0.50 3.63 0.31 40
COM 155-Chlamydia positive cases 15-24 (community) - 4.20 0.25 3.40 0.44 3.30 0.38 3.40 0.25 3.40 0.28 3.70 0.26 3.80 0.27 3.50 0.36 3.57 0.22 41
COM 198-Latent TB clients served unduplicated (LHD) - 4.40 0.29 3.90 0.35 3.30 0.47 3.20 0.32 3.00 0.31 4.00 0.33 3.90 0.33 3.00 0.42 3.57 0.28 42
COM 172-HIV testing in pregnancy (community) - 4.10 0.29 3.70 0.34 3.40 0.42 3.80 0.30 3.50 0.28 4.00 0.24 3.10 0.39 3.10 0.39 3.56 0.29 43
COM 149-Cervical cancer screening (LHD) - 3.20 0.38 3.60 0.30 3.50 0.36 3.60 0.30 3.50 0.28 3.70 0.22 3.60 0.40 3.60 0.40 3.55 0.24 44
COM 173-HIV/AIDs clients testing/counseling unduplicated (LHD) - 4.20 0.27 4.00 0.29 3.50 0.39 3.50 0.28 3.50 0.28 3.70 0.36 3.10 0.56 3.10 0.49 3.54 0.27 45
COM 204-STI Staffing level - 3.90 0.39 3.70 0.44 3.00 0.54 2.90 0.41 2.90 0.50 3.30 0.47 3.00 0.57 3.00 0.57 3.54 0.21 46
COM 143-Rabies post-exposure prophylaxis fidelity (LHD) - 4.40 0.16 3.90 0.25 3.90 0.25 2.70 0.53 3.00 0.38 3.20 0.44 3.70 0.36 3.50 0.34 3.54 0.16 47
COM 168-Foodborne enteric specimen collection (LHD) - 4.10 0.24 4.00 0.26 3.60 0.33 3.00 0.31 3.50 0.34 3.50 0.28 3.50 0.36 3.20 0.41 3.53 0.20 48
COM 183-STD partner notification (LHD) - 4.40 0.24 4.00 0.29 3.70 0.38 3.50 0.24 3.00 0.31 3.70 0.22 3.10 0.44 3.00 0.38 3.53 0.23 49
COM 163-Foodborne enteric investigation initiation time (LHD) - 4.40 0.19 4.10 0.24 3.90 0.35 3.20 0.29 3.40 0.35 3.60 0.27 3.10 0.47 2.70 0.58 3.52 0.17 50
COM 202-Probable vaccine-preventable disease cases (LHD) - 4.30 0.31 3.30 0.57 3.30 0.52 3.60 0.33 3.60 0.33 3.30 0.43 3.40 0.44 3.60 0.35 3.52 0.33 51
COM 151-Childhood immunization providers (community) - 4.00 0.33 3.90 0.35 3.60 0.30 3.90 0.22 3.30 0.38 3.60 0.30 3.30 0.43 2.70 0.39 3.52 0.22 52
COM 142-Food handler return-to-work fidelity (LHD) - 4.30 0.22 3.90 0.31 3.80 0.37 3.20 0.25 3.30 0.25 3.20 0.41 3.10 0.56 3.40 0.42 3.50 0.19 53
COM 200-Latent TB treatment among refugees and immigrants (LHD) - 4.40 0.29 4.00 0.33 3.20 0.46 3.20 0.29 3.10 0.36 4.10 0.29 3.20 0.48 3.10 0.47 3.50 0.30 54
COM 182-STD contacts reported (LHD) - 4.40 0.24 4.10 0.27 3.50 0.39 3.40 0.28 3.10 0.32 3.70 0.22 3.10 0.47 2.90 0.44 3.49 0.23 55
COM 164-Foodborne enteric investigation completion time (LHD) - 4.30 0.19 4.10 0.24 3.80 0.35 3.00 0.31 3.50 0.34 3.90 0.25 2.90 0.60 2.60 0.63 3.48 0.21 56
COM 174-HIV/AIDs clients testing/counseling duplicated (LHD) - 4.20 0.27 3.90 0.33 3.40 0.40 3.40 0.25 3.40 0.25 3.70 0.34 3.10 0.54 2.90 0.47 3.47 0.25 57
COM 197-Latent TB client visits duplicated (LHD) - 4.40 0.29 3.80 0.39 3.40 0.48 3.30 0.32 3.10 0.32 3.90 0.28 3.60 0.42 3.00 0.44 3.46 0.32 58
COM 194-TB probably (LHD) - 4.30 0.31 3.30 0.54 3.00 0.50 3.10 0.36 3.30 0.38 3.70 0.34 3.80 0.37 3.30 0.43 3.45 0.32 59
COM 169-Foodborne enteric specimen testing time (LHD) - 3.90 0.31 3.60 0.42 3.00 0.47 2.80 0.37 3.40 0.37 3.70 0.22 3.40 0.50 3.00 0.57 3.32 0.27 60
COM 157-Communicable disease capacity to collect and report (LHD) - 4.60 0.11 3.50 0.41 3.50 0.28 3.10 0.36 3.00 0.31 3.50 0.20 2.90 0.53 2.40 0.49 3.27 0.24 61
Feasibility ValidityDomainFit DimensionFit Relevance HealthImpact EconomicImpact Variation
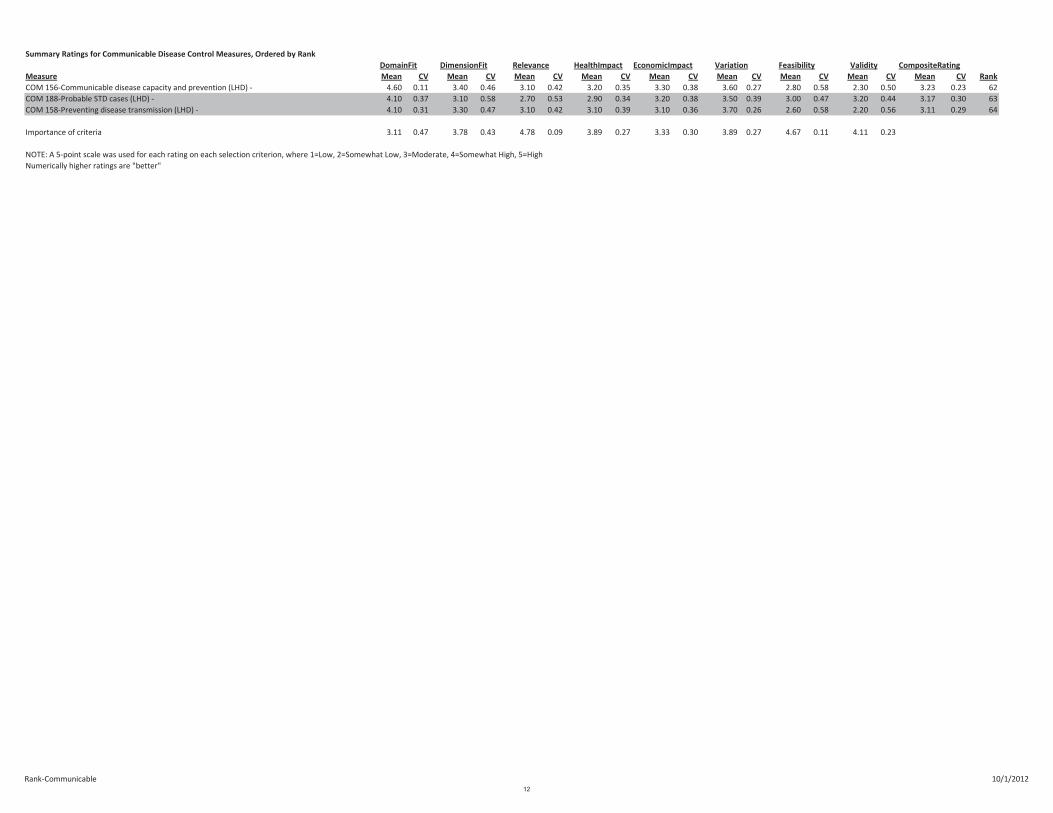
Rank-Communicable 10/1/2012
Summary Ratings for Communicable Disease Control Measures, Ordered by Rank
CompositeRating
Measure Mean CV Mean CV Mean CV Mean CV Mean CV Mean CV Mean CV Mean CV Mean CV Rank
Feasibility ValidityDomainFit DimensionFit Relevance HealthImpact EconomicImpact Variation
COM 156-Communicable disease capacity and prevention (LHD) - 4.60 0.11 3.40 0.46 3.10 0.42 3.20 0.35 3.30 0.38 3.60 0.27 2.80 0.58 2.30 0.50 3.23 0.23 62
COM 188-Probable STD cases (LHD) - 4.10 0.37 3.10 0.58 2.70 0.53 2.90 0.34 3.20 0.38 3.50 0.39 3.00 0.47 3.20 0.44 3.17 0.30 63
COM 158-Preventing disease transmission (LHD) - 4.10 0.31 3.30 0.47 3.10 0.42 3.10 0.39 3.10 0.36 3.70 0.26 2.60 0.58 2.20 0.56 3.11 0.29 64
Importance of criteria 3.11 0.47 3.78 0.43 4.78 0.09 3.89 0.27 3.33 0.30 3.89 0.27 4.67 0.11 4.11 0.23
NOTE: A 5-point scale was used for each rating on each selection criterion, where 1=Low, 2=Somewhat Low, 3=Moderate, 4=Somewhat High, 5=High
Numerically higher ratings are "better"
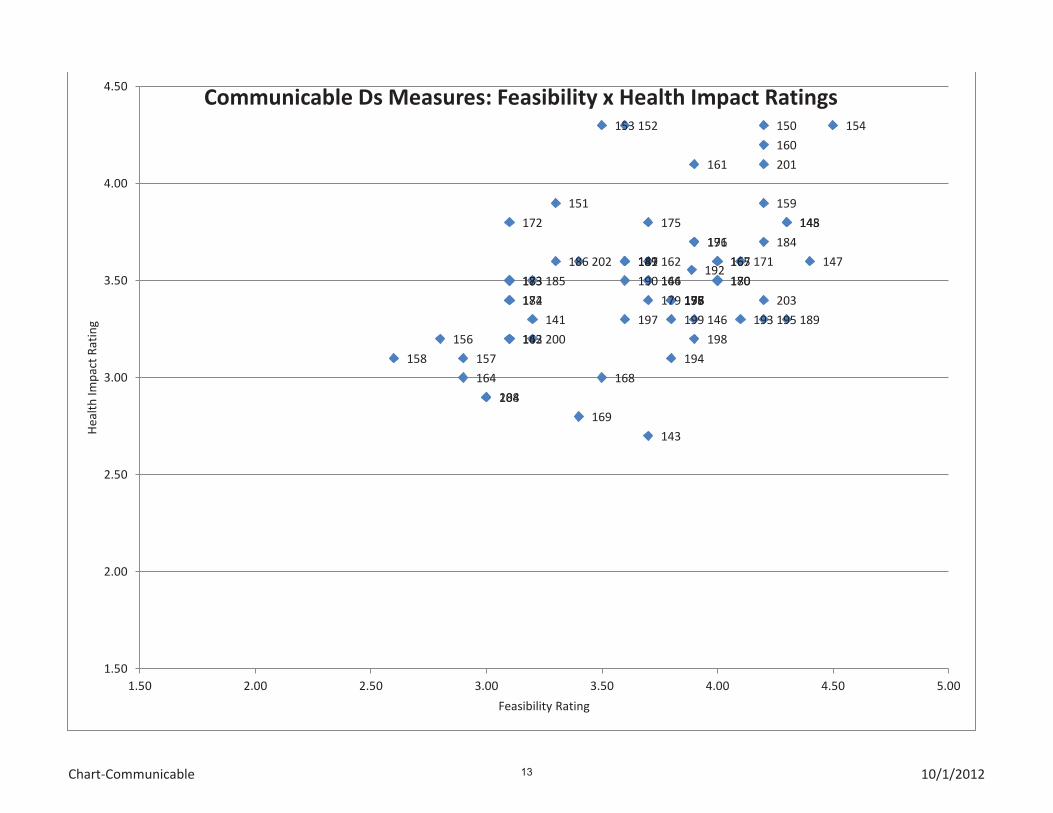
Chart-Communicable 10/1/2012
141
142
143
144
145
146
147
148
149
150
151
152 153 154
155
156
157 158
159
160
161
162
163
164
165
166
167
168
169
170
171
172
173
174
175
176
177 178 179
180
181
182
183
184
185
186 187
188
189
190
191
192
193
194
195
196
197
198
199
200
201
202
203
204
1.50
2.00
2.50
3.00
3.50
4.00
4.50
1.50 2.00 2.50 3.00 3.50 4.00 4.50 5.00
He
alt
h I
mp
act
Ra
tin
g
Feasibility Rating
Communicable Ds Measures: Feasibility x Health Impact Ratings
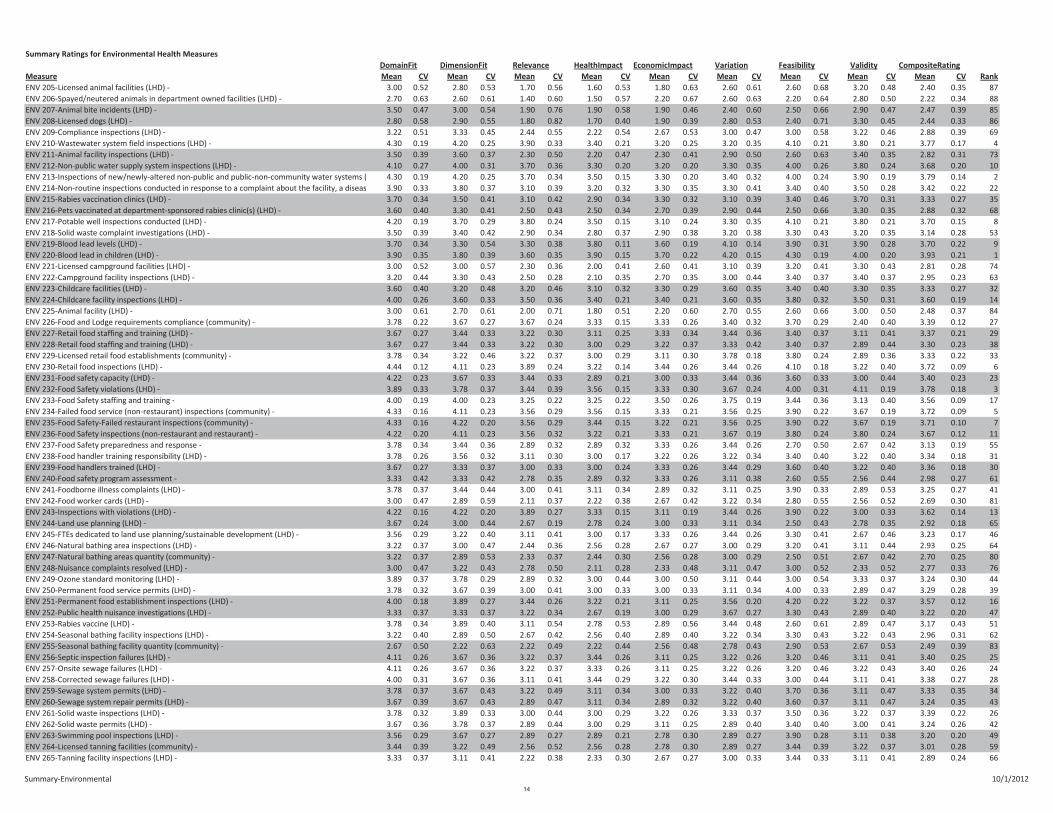
Summary-Environmental 10/1/2012
Summary Ratings for Environmental Health Measures
CompositeRating
Measure Mean CV Mean CV Mean CV Mean CV Mean CV Mean CV Mean CV Mean CV Mean CV Rank
ENV 205-Licensed animal facilities (LHD) - 3.00 0.52 2.80 0.53 1.70 0.56 1.60 0.53 1.80 0.63 2.60 0.61 2.60 0.68 3.20 0.48 2.40 0.35 87
ENV 206-Spayed/neutered animals in department owned facilities (LHD) - 2.70 0.63 2.60 0.61 1.40 0.60 1.50 0.57 2.20 0.67 2.60 0.63 2.20 0.64 2.80 0.50 2.22 0.34 88
ENV 207-Animal bite incidents (LHD) - 3.50 0.47 3.00 0.54 1.90 0.76 1.90 0.58 1.90 0.46 2.40 0.60 2.50 0.66 2.90 0.47 2.47 0.39 85
ENV 208-Licensed dogs (LHD) - 2.80 0.58 2.90 0.55 1.80 0.82 1.70 0.40 1.90 0.39 2.80 0.53 2.40 0.71 3.30 0.45 2.44 0.33 86
ENV 209-Compliance inspections (LHD) - 3.22 0.51 3.33 0.45 2.44 0.55 2.22 0.54 2.67 0.53 3.00 0.47 3.00 0.58 3.22 0.46 2.88 0.39 69
ENV 210-Wastewater system field inspections (LHD) - 4.30 0.19 4.20 0.25 3.90 0.33 3.40 0.21 3.20 0.25 3.20 0.35 4.10 0.21 3.80 0.21 3.77 0.17 4
ENV 211-Animal facility inspections (LHD) - 3.50 0.39 3.60 0.37 2.30 0.50 2.20 0.47 2.30 0.41 2.90 0.50 2.60 0.63 3.40 0.35 2.82 0.31 73
ENV 212-Non-public water supply system inspections (LHD) - 4.10 0.27 4.00 0.31 3.70 0.36 3.30 0.20 3.20 0.20 3.30 0.35 4.00 0.26 3.80 0.24 3.68 0.20 10
ENV 213-Inspections of new/newly-altered non-public and public-non-community water systems ( 4.30 0.19 4.20 0.25 3.70 0.34 3.50 0.15 3.30 0.20 3.40 0.32 4.00 0.24 3.90 0.19 3.79 0.14 2
ENV 214-Non-routine inspections conducted in response to a complaint about the facility, a diseas 3.90 0.33 3.80 0.37 3.10 0.39 3.20 0.32 3.30 0.35 3.30 0.41 3.40 0.40 3.50 0.28 3.42 0.22 22
ENV 215-Rabies vaccination clinics (LHD) - 3.70 0.34 3.50 0.41 3.10 0.42 2.90 0.34 3.30 0.32 3.10 0.39 3.40 0.46 3.70 0.31 3.33 0.27 35
ENV 216-Pets vaccinated at department-sponsored rabies clinic(s) (LHD) - 3.60 0.40 3.30 0.41 2.50 0.43 2.50 0.34 2.70 0.39 2.90 0.44 2.50 0.66 3.30 0.35 2.88 0.32 68
ENV 217-Potable well inspections conducted (LHD) - 4.20 0.19 3.70 0.29 3.80 0.24 3.50 0.15 3.10 0.24 3.30 0.35 4.10 0.21 3.80 0.21 3.70 0.15 8
ENV 218-Solid waste complaint investigations (LHD) - 3.50 0.39 3.40 0.42 2.90 0.34 2.80 0.37 2.90 0.38 3.20 0.38 3.30 0.43 3.20 0.35 3.14 0.28 53
ENV 219-Blood lead levels (LHD) - 3.70 0.34 3.30 0.54 3.30 0.38 3.80 0.11 3.60 0.19 4.10 0.14 3.90 0.31 3.90 0.28 3.70 0.22 9
ENV 220-Blood lead in children (LHD) - 3.90 0.35 3.80 0.39 3.60 0.35 3.90 0.15 3.70 0.22 4.20 0.15 4.30 0.19 4.00 0.20 3.93 0.21 1
ENV 221-Licensed campground facilities (LHD) - 3.00 0.52 3.00 0.57 2.30 0.36 2.00 0.41 2.60 0.41 3.10 0.39 3.20 0.41 3.30 0.43 2.81 0.28 74
ENV 222-Campground facility inspections (LHD) - 3.20 0.44 3.30 0.43 2.50 0.28 2.10 0.35 2.70 0.35 3.00 0.44 3.40 0.37 3.40 0.37 2.95 0.23 63
ENV 223-Childcare facilities (LHD) - 3.60 0.40 3.20 0.48 3.20 0.46 3.10 0.32 3.30 0.29 3.60 0.35 3.40 0.40 3.30 0.35 3.33 0.27 32
ENV 224-Childcare facility inspections (LHD) - 4.00 0.26 3.60 0.33 3.50 0.36 3.40 0.21 3.40 0.21 3.60 0.35 3.80 0.32 3.50 0.31 3.60 0.19 14
ENV 225-Animal facility (LHD) - 3.00 0.61 2.70 0.61 2.00 0.71 1.80 0.51 2.20 0.60 2.70 0.55 2.60 0.66 3.00 0.50 2.48 0.37 84
ENV 226-Food and Lodge requirements compliance (community) - 3.78 0.22 3.67 0.27 3.67 0.24 3.33 0.15 3.33 0.26 3.40 0.32 3.70 0.29 2.40 0.40 3.39 0.12 27
ENV 227-Retail food staffing and training (LHD) - 3.67 0.27 3.44 0.33 3.22 0.30 3.11 0.25 3.33 0.34 3.44 0.36 3.40 0.37 3.11 0.41 3.37 0.21 29
ENV 228-Retail food staffing and training (LHD) - 3.67 0.27 3.44 0.33 3.22 0.30 3.00 0.29 3.22 0.37 3.33 0.42 3.40 0.37 2.89 0.44 3.30 0.23 38
ENV 229-Licensed retail food establishments (community) - 3.78 0.34 3.22 0.46 3.22 0.37 3.00 0.29 3.11 0.30 3.78 0.18 3.80 0.24 2.89 0.36 3.33 0.22 33
ENV 230-Retail food inspections (LHD) - 4.44 0.12 4.11 0.23 3.89 0.24 3.22 0.14 3.44 0.26 3.44 0.26 4.10 0.18 3.22 0.40 3.72 0.09 6
ENV 231-Food safety capacity (LHD) - 4.22 0.23 3.67 0.33 3.44 0.33 2.89 0.21 3.00 0.33 3.44 0.36 3.60 0.33 3.00 0.44 3.40 0.23 23
ENV 232-Food Safety violations (LHD) - 3.89 0.33 3.78 0.37 3.44 0.39 3.56 0.15 3.33 0.30 3.67 0.24 4.00 0.31 4.11 0.19 3.78 0.18 3
ENV 233-Food Safety staffing and training - 4.00 0.19 4.00 0.23 3.25 0.22 3.25 0.22 3.50 0.26 3.75 0.19 3.44 0.36 3.13 0.40 3.56 0.09 17
ENV 234-Failed food service (non-restaurant) inspections (community) - 4.33 0.16 4.11 0.23 3.56 0.29 3.56 0.15 3.33 0.21 3.56 0.25 3.90 0.22 3.67 0.19 3.72 0.09 5
ENV 235-Food Safety-Failed restaurant inspections (community) - 4.33 0.16 4.22 0.20 3.56 0.29 3.44 0.15 3.22 0.21 3.56 0.25 3.90 0.22 3.67 0.19 3.71 0.10 7
ENV 236-Food Safety inspections (non-restaurant and restaurant) - 4.22 0.20 4.11 0.23 3.56 0.32 3.22 0.21 3.33 0.21 3.67 0.19 3.80 0.24 3.80 0.24 3.67 0.12 11
ENV 237-Food Safety preparedness and response - 3.78 0.34 3.44 0.36 2.89 0.32 2.89 0.32 3.33 0.26 3.44 0.26 2.70 0.50 2.67 0.42 3.13 0.19 55
ENV 238-Food handler training responsibility (LHD) - 3.78 0.26 3.56 0.32 3.11 0.30 3.00 0.17 3.22 0.26 3.22 0.34 3.40 0.40 3.22 0.40 3.34 0.18 31
ENV 239-Food handlers trained (LHD) - 3.67 0.27 3.33 0.37 3.00 0.33 3.00 0.24 3.33 0.26 3.44 0.29 3.60 0.40 3.22 0.40 3.36 0.18 30
ENV 240-Food safety program assessment - 3.33 0.42 3.33 0.42 2.78 0.35 2.89 0.32 3.33 0.26 3.11 0.38 2.60 0.55 2.56 0.44 2.98 0.27 61
ENV 241-Foodborne illness complaints (LHD) - 3.78 0.37 3.44 0.44 3.00 0.41 3.11 0.34 2.89 0.32 3.11 0.25 3.90 0.33 2.89 0.53 3.25 0.27 41
ENV 242-Food worker cards (LHD) - 3.00 0.47 2.89 0.59 2.11 0.37 2.22 0.38 2.67 0.42 3.22 0.34 2.80 0.55 2.56 0.52 2.69 0.30 81
ENV 243-Inspections with violations (LHD) - 4.22 0.16 4.22 0.20 3.89 0.27 3.33 0.15 3.11 0.19 3.44 0.26 3.90 0.22 3.00 0.33 3.62 0.14 13
ENV 244-Land use planning (LHD) - 3.67 0.24 3.00 0.44 2.67 0.19 2.78 0.24 3.00 0.33 3.11 0.34 2.50 0.43 2.78 0.35 2.92 0.18 65
ENV 245-FTEs dedicated to land use planning/sustainable development (LHD) - 3.56 0.29 3.22 0.40 3.11 0.41 3.00 0.17 3.33 0.26 3.44 0.26 3.30 0.41 2.67 0.46 3.23 0.17 46
ENV 246-Natural bathing area inspections (LHD) - 3.22 0.37 3.00 0.47 2.44 0.36 2.56 0.28 2.67 0.27 3.00 0.29 3.20 0.41 3.11 0.44 2.93 0.25 64
ENV 247-Natural bathing areas quantity (community) - 3.22 0.37 2.89 0.53 2.33 0.37 2.44 0.30 2.56 0.28 3.00 0.29 2.50 0.51 2.67 0.42 2.70 0.25 80
ENV 248-Nuisance complaints resolved (LHD) - 3.00 0.47 3.22 0.43 2.78 0.50 2.11 0.28 2.33 0.48 3.11 0.47 3.00 0.52 2.33 0.52 2.77 0.33 76
ENV 249-Ozone standard monitoring (LHD) - 3.89 0.37 3.78 0.29 2.89 0.32 3.00 0.44 3.00 0.50 3.11 0.44 3.00 0.54 3.33 0.37 3.24 0.30 44
ENV 250-Permanent food service permits (LHD) - 3.78 0.32 3.67 0.39 3.00 0.41 3.00 0.33 3.00 0.33 3.11 0.34 4.00 0.33 2.89 0.47 3.29 0.28 39
ENV 251-Permanent food establishment inspections (LHD) - 4.00 0.18 3.89 0.27 3.44 0.26 3.22 0.21 3.11 0.25 3.56 0.20 4.20 0.22 3.22 0.37 3.57 0.12 16
ENV 252-Public health nuisance investigations (LHD) - 3.33 0.37 3.33 0.37 3.22 0.34 2.67 0.19 3.00 0.29 3.67 0.27 3.30 0.43 2.89 0.40 3.22 0.20 47
ENV 253-Rabies vaccine (LHD) - 3.78 0.34 3.89 0.40 3.11 0.54 2.78 0.53 2.89 0.56 3.44 0.48 2.60 0.61 2.89 0.47 3.17 0.43 51
ENV 254-Seasonal bathing facility inspections (LHD) - 3.22 0.40 2.89 0.50 2.67 0.42 2.56 0.40 2.89 0.40 3.22 0.34 3.30 0.43 3.22 0.43 2.96 0.31 62
ENV 255-Seasonal bathing facility quantity (community) - 2.67 0.50 2.22 0.63 2.22 0.49 2.22 0.44 2.56 0.48 2.78 0.43 2.90 0.53 2.67 0.53 2.49 0.39 83
ENV 256-Septic inspection failures (LHD) - 4.11 0.26 3.67 0.36 3.22 0.37 3.44 0.26 3.11 0.25 3.22 0.26 3.20 0.46 3.11 0.41 3.40 0.25 25
ENV 257-Onsite sewage failures (LHD) - 4.11 0.26 3.67 0.36 3.22 0.37 3.33 0.26 3.11 0.25 3.22 0.26 3.20 0.46 3.22 0.43 3.40 0.26 24
ENV 258-Corrected sewage failures (LHD) - 4.00 0.31 3.67 0.36 3.11 0.41 3.44 0.29 3.22 0.30 3.44 0.33 3.00 0.44 3.11 0.41 3.38 0.27 28
ENV 259-Sewage system permits (LHD) - 3.78 0.37 3.67 0.43 3.22 0.49 3.11 0.34 3.00 0.33 3.22 0.40 3.70 0.36 3.11 0.47 3.33 0.35 34
ENV 260-Sewage system repair permits (LHD) - 3.67 0.39 3.67 0.43 2.89 0.47 3.11 0.34 2.89 0.32 3.22 0.40 3.60 0.37 3.11 0.47 3.24 0.35 43
ENV 261-Solid waste inspections (LHD) - 3.78 0.32 3.89 0.33 3.00 0.44 3.00 0.29 3.22 0.26 3.33 0.37 3.50 0.36 3.22 0.37 3.39 0.22 26
ENV 262-Solid waste permits (LHD) - 3.67 0.36 3.78 0.37 2.89 0.44 3.00 0.29 3.11 0.25 2.89 0.40 3.40 0.40 3.00 0.41 3.24 0.26 42
ENV 263-Swimming pool inspections (LHD) - 3.56 0.29 3.67 0.27 2.89 0.27 2.89 0.21 2.78 0.30 2.89 0.27 3.90 0.28 3.11 0.38 3.20 0.20 49
ENV 264-Licensed tanning facilities (community) - 3.44 0.39 3.22 0.49 2.56 0.52 2.56 0.28 2.78 0.30 2.89 0.27 3.44 0.39 3.22 0.37 3.01 0.28 59
ENV 265-Tanning facility inspections (LHD) - 3.33 0.37 3.11 0.41 2.22 0.38 2.33 0.30 2.67 0.27 3.00 0.33 3.44 0.33 3.11 0.41 2.89 0.24 66
Feasibility ValidityDomainFit DimensionFit Relevance HealthImpact EconomicImpact Variation
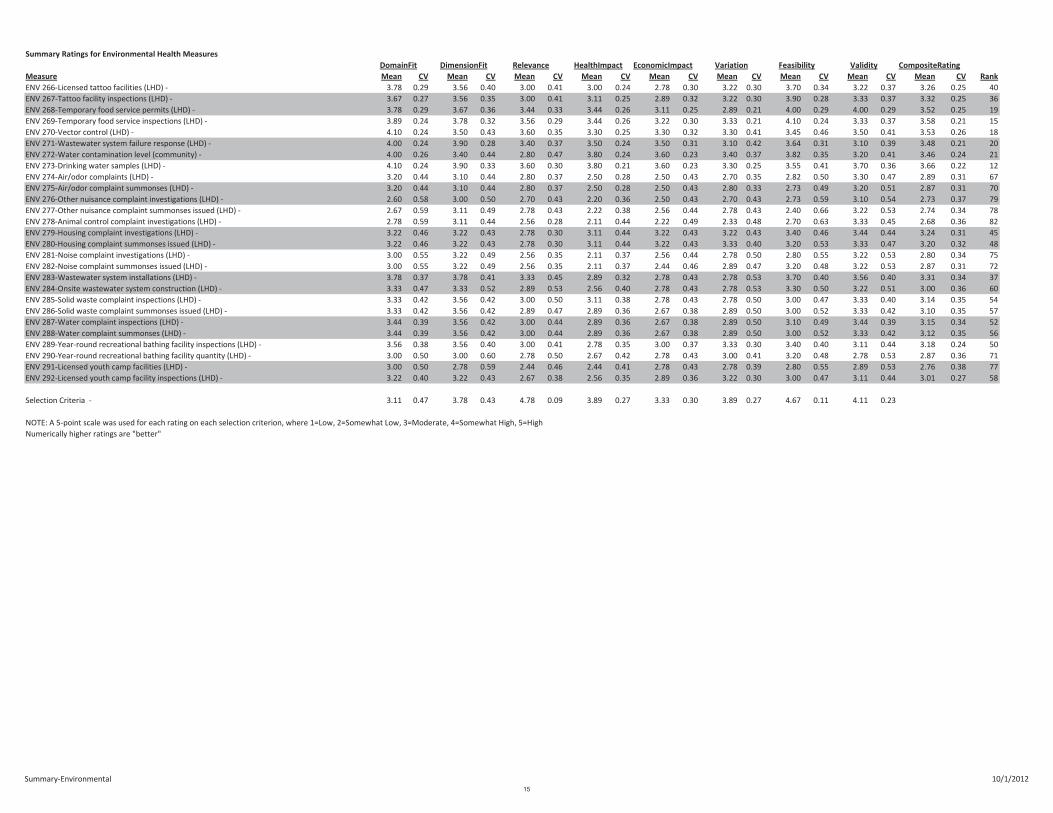
Summary-Environmental 10/1/2012
Summary Ratings for Environmental Health Measures
CompositeRating
Measure Mean CV Mean CV Mean CV Mean CV Mean CV Mean CV Mean CV Mean CV Mean CV Rank
Feasibility ValidityDomainFit DimensionFit Relevance HealthImpact EconomicImpact Variation
ENV 266-Licensed tattoo facilities (LHD) - 3.78 0.29 3.56 0.40 3.00 0.41 3.00 0.24 2.78 0.30 3.22 0.30 3.70 0.34 3.22 0.37 3.26 0.25 40
ENV 267-Tattoo facility inspections (LHD) - 3.67 0.27 3.56 0.35 3.00 0.41 3.11 0.25 2.89 0.32 3.22 0.30 3.90 0.28 3.33 0.37 3.32 0.25 36
ENV 268-Temporary food service permits (LHD) - 3.78 0.29 3.67 0.36 3.44 0.33 3.44 0.26 3.11 0.25 2.89 0.21 4.00 0.29 4.00 0.29 3.52 0.25 19
ENV 269-Temporary food service inspections (LHD) - 3.89 0.24 3.78 0.32 3.56 0.29 3.44 0.26 3.22 0.30 3.33 0.21 4.10 0.24 3.33 0.37 3.58 0.21 15
ENV 270-Vector control (LHD) - 4.10 0.24 3.50 0.43 3.60 0.35 3.30 0.25 3.30 0.32 3.30 0.41 3.45 0.46 3.50 0.41 3.53 0.26 18
ENV 271-Wastewater system failure response (LHD) - 4.00 0.24 3.90 0.28 3.40 0.37 3.50 0.24 3.50 0.31 3.10 0.42 3.64 0.31 3.10 0.39 3.48 0.21 20
ENV 272-Water contamination level (community) - 4.00 0.26 3.40 0.44 2.80 0.47 3.80 0.24 3.60 0.23 3.40 0.37 3.82 0.35 3.20 0.41 3.46 0.24 21
ENV 273-Drinking water samples (LHD) - 4.10 0.24 3.90 0.33 3.60 0.30 3.80 0.21 3.60 0.23 3.30 0.25 3.55 0.41 3.70 0.36 3.66 0.22 12
ENV 274-Air/odor complaints (LHD) - 3.20 0.44 3.10 0.44 2.80 0.37 2.50 0.28 2.50 0.43 2.70 0.35 2.82 0.50 3.30 0.47 2.89 0.31 67
ENV 275-Air/odor complaint summonses (LHD) - 3.20 0.44 3.10 0.44 2.80 0.37 2.50 0.28 2.50 0.43 2.80 0.33 2.73 0.49 3.20 0.51 2.87 0.31 70
ENV 276-Other nuisance complaint investigations (LHD) - 2.60 0.58 3.00 0.50 2.70 0.43 2.20 0.36 2.50 0.43 2.70 0.43 2.73 0.59 3.10 0.54 2.73 0.37 79
ENV 277-Other nuisance complaint summonses issued (LHD) - 2.67 0.59 3.11 0.49 2.78 0.43 2.22 0.38 2.56 0.44 2.78 0.43 2.40 0.66 3.22 0.53 2.74 0.34 78
ENV 278-Animal control complaint investigations (LHD) - 2.78 0.59 3.11 0.44 2.56 0.28 2.11 0.44 2.22 0.49 2.33 0.48 2.70 0.63 3.33 0.45 2.68 0.36 82
ENV 279-Housing complaint investigations (LHD) - 3.22 0.46 3.22 0.43 2.78 0.30 3.11 0.44 3.22 0.43 3.22 0.43 3.40 0.46 3.44 0.44 3.24 0.31 45
ENV 280-Housing complaint summonses issued (LHD) - 3.22 0.46 3.22 0.43 2.78 0.30 3.11 0.44 3.22 0.43 3.33 0.40 3.20 0.53 3.33 0.47 3.20 0.32 48
ENV 281-Noise complaint investigations (LHD) - 3.00 0.55 3.22 0.49 2.56 0.35 2.11 0.37 2.56 0.44 2.78 0.50 2.80 0.55 3.22 0.53 2.80 0.34 75
ENV 282-Noise complaint summonses issued (LHD) - 3.00 0.55 3.22 0.49 2.56 0.35 2.11 0.37 2.44 0.46 2.89 0.47 3.20 0.48 3.22 0.53 2.87 0.31 72
ENV 283-Wastewater system installations (LHD) - 3.78 0.37 3.78 0.41 3.33 0.45 2.89 0.32 2.78 0.43 2.78 0.53 3.70 0.40 3.56 0.40 3.31 0.34 37
ENV 284-Onsite wastewater system construction (LHD) - 3.33 0.47 3.33 0.52 2.89 0.53 2.56 0.40 2.78 0.43 2.78 0.53 3.30 0.50 3.22 0.51 3.00 0.36 60
ENV 285-Solid waste complaint inspections (LHD) - 3.33 0.42 3.56 0.42 3.00 0.50 3.11 0.38 2.78 0.43 2.78 0.50 3.00 0.47 3.33 0.40 3.14 0.35 54
ENV 286-Solid waste complaint summonses issued (LHD) - 3.33 0.42 3.56 0.42 2.89 0.47 2.89 0.36 2.67 0.38 2.89 0.50 3.00 0.52 3.33 0.42 3.10 0.35 57
ENV 287-Water complaint inspections (LHD) - 3.44 0.39 3.56 0.42 3.00 0.44 2.89 0.36 2.67 0.38 2.89 0.50 3.10 0.49 3.44 0.39 3.15 0.34 52
ENV 288-Water complaint summonses (LHD) - 3.44 0.39 3.56 0.42 3.00 0.44 2.89 0.36 2.67 0.38 2.89 0.50 3.00 0.52 3.33 0.42 3.12 0.35 56
ENV 289-Year-round recreational bathing facility inspections (LHD) - 3.56 0.38 3.56 0.40 3.00 0.41 2.78 0.35 3.00 0.37 3.33 0.30 3.40 0.40 3.11 0.44 3.18 0.24 50
ENV 290-Year-round recreational bathing facility quantity (LHD) - 3.00 0.50 3.00 0.60 2.78 0.50 2.67 0.42 2.78 0.43 3.00 0.41 3.20 0.48 2.78 0.53 2.87 0.36 71
ENV 291-Licensed youth camp facilities (LHD) - 3.00 0.50 2.78 0.59 2.44 0.46 2.44 0.41 2.78 0.43 2.78 0.39 2.80 0.55 2.89 0.53 2.76 0.38 77
ENV 292-Licensed youth camp facility inspections (LHD) - 3.22 0.40 3.22 0.43 2.67 0.38 2.56 0.35 2.89 0.36 3.22 0.30 3.00 0.47 3.11 0.44 3.01 0.27 58
Selection Criteria - 3.11 0.47 3.78 0.43 4.78 0.09 3.89 0.27 3.33 0.30 3.89 0.27 4.67 0.11 4.11 0.23
NOTE: A 5-point scale was used for each rating on each selection criterion, where 1=Low, 2=Somewhat Low, 3=Moderate, 4=Somewhat High, 5=High
Numerically higher ratings are "better"
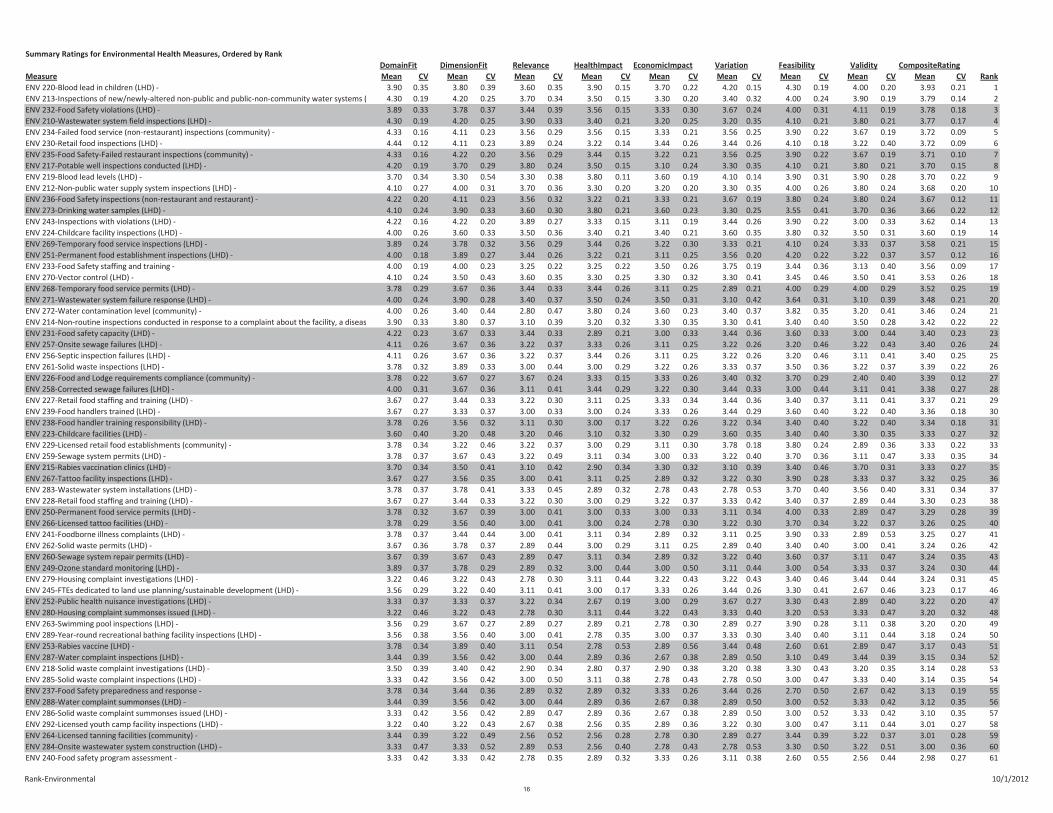
Rank-Environmental 10/1/2012
Summary Ratings for Environmental Health Measures, Ordered by Rank
CompositeRating
Measure Mean CV Mean CV Mean CV Mean CV Mean CV Mean CV Mean CV Mean CV Mean CV Rank
ENV 220-Blood lead in children (LHD) - 3.90 0.35 3.80 0.39 3.60 0.35 3.90 0.15 3.70 0.22 4.20 0.15 4.30 0.19 4.00 0.20 3.93 0.21 1
ENV 213-Inspections of new/newly-altered non-public and public-non-community water systems ( 4.30 0.19 4.20 0.25 3.70 0.34 3.50 0.15 3.30 0.20 3.40 0.32 4.00 0.24 3.90 0.19 3.79 0.14 2
ENV 232-Food Safety violations (LHD) - 3.89 0.33 3.78 0.37 3.44 0.39 3.56 0.15 3.33 0.30 3.67 0.24 4.00 0.31 4.11 0.19 3.78 0.18 3
ENV 210-Wastewater system field inspections (LHD) - 4.30 0.19 4.20 0.25 3.90 0.33 3.40 0.21 3.20 0.25 3.20 0.35 4.10 0.21 3.80 0.21 3.77 0.17 4
ENV 234-Failed food service (non-restaurant) inspections (community) - 4.33 0.16 4.11 0.23 3.56 0.29 3.56 0.15 3.33 0.21 3.56 0.25 3.90 0.22 3.67 0.19 3.72 0.09 5
ENV 230-Retail food inspections (LHD) - 4.44 0.12 4.11 0.23 3.89 0.24 3.22 0.14 3.44 0.26 3.44 0.26 4.10 0.18 3.22 0.40 3.72 0.09 6
ENV 235-Food Safety-Failed restaurant inspections (community) - 4.33 0.16 4.22 0.20 3.56 0.29 3.44 0.15 3.22 0.21 3.56 0.25 3.90 0.22 3.67 0.19 3.71 0.10 7
ENV 217-Potable well inspections conducted (LHD) - 4.20 0.19 3.70 0.29 3.80 0.24 3.50 0.15 3.10 0.24 3.30 0.35 4.10 0.21 3.80 0.21 3.70 0.15 8
ENV 219-Blood lead levels (LHD) - 3.70 0.34 3.30 0.54 3.30 0.38 3.80 0.11 3.60 0.19 4.10 0.14 3.90 0.31 3.90 0.28 3.70 0.22 9
ENV 212-Non-public water supply system inspections (LHD) - 4.10 0.27 4.00 0.31 3.70 0.36 3.30 0.20 3.20 0.20 3.30 0.35 4.00 0.26 3.80 0.24 3.68 0.20 10
ENV 236-Food Safety inspections (non-restaurant and restaurant) - 4.22 0.20 4.11 0.23 3.56 0.32 3.22 0.21 3.33 0.21 3.67 0.19 3.80 0.24 3.80 0.24 3.67 0.12 11
ENV 273-Drinking water samples (LHD) - 4.10 0.24 3.90 0.33 3.60 0.30 3.80 0.21 3.60 0.23 3.30 0.25 3.55 0.41 3.70 0.36 3.66 0.22 12
ENV 243-Inspections with violations (LHD) - 4.22 0.16 4.22 0.20 3.89 0.27 3.33 0.15 3.11 0.19 3.44 0.26 3.90 0.22 3.00 0.33 3.62 0.14 13
ENV 224-Childcare facility inspections (LHD) - 4.00 0.26 3.60 0.33 3.50 0.36 3.40 0.21 3.40 0.21 3.60 0.35 3.80 0.32 3.50 0.31 3.60 0.19 14
ENV 269-Temporary food service inspections (LHD) - 3.89 0.24 3.78 0.32 3.56 0.29 3.44 0.26 3.22 0.30 3.33 0.21 4.10 0.24 3.33 0.37 3.58 0.21 15
ENV 251-Permanent food establishment inspections (LHD) - 4.00 0.18 3.89 0.27 3.44 0.26 3.22 0.21 3.11 0.25 3.56 0.20 4.20 0.22 3.22 0.37 3.57 0.12 16
ENV 233-Food Safety staffing and training - 4.00 0.19 4.00 0.23 3.25 0.22 3.25 0.22 3.50 0.26 3.75 0.19 3.44 0.36 3.13 0.40 3.56 0.09 17
ENV 270-Vector control (LHD) - 4.10 0.24 3.50 0.43 3.60 0.35 3.30 0.25 3.30 0.32 3.30 0.41 3.45 0.46 3.50 0.41 3.53 0.26 18
ENV 268-Temporary food service permits (LHD) - 3.78 0.29 3.67 0.36 3.44 0.33 3.44 0.26 3.11 0.25 2.89 0.21 4.00 0.29 4.00 0.29 3.52 0.25 19
ENV 271-Wastewater system failure response (LHD) - 4.00 0.24 3.90 0.28 3.40 0.37 3.50 0.24 3.50 0.31 3.10 0.42 3.64 0.31 3.10 0.39 3.48 0.21 20
ENV 272-Water contamination level (community) - 4.00 0.26 3.40 0.44 2.80 0.47 3.80 0.24 3.60 0.23 3.40 0.37 3.82 0.35 3.20 0.41 3.46 0.24 21
ENV 214-Non-routine inspections conducted in response to a complaint about the facility, a diseas 3.90 0.33 3.80 0.37 3.10 0.39 3.20 0.32 3.30 0.35 3.30 0.41 3.40 0.40 3.50 0.28 3.42 0.22 22
ENV 231-Food safety capacity (LHD) - 4.22 0.23 3.67 0.33 3.44 0.33 2.89 0.21 3.00 0.33 3.44 0.36 3.60 0.33 3.00 0.44 3.40 0.23 23
ENV 257-Onsite sewage failures (LHD) - 4.11 0.26 3.67 0.36 3.22 0.37 3.33 0.26 3.11 0.25 3.22 0.26 3.20 0.46 3.22 0.43 3.40 0.26 24
ENV 256-Septic inspection failures (LHD) - 4.11 0.26 3.67 0.36 3.22 0.37 3.44 0.26 3.11 0.25 3.22 0.26 3.20 0.46 3.11 0.41 3.40 0.25 25
ENV 261-Solid waste inspections (LHD) - 3.78 0.32 3.89 0.33 3.00 0.44 3.00 0.29 3.22 0.26 3.33 0.37 3.50 0.36 3.22 0.37 3.39 0.22 26
ENV 226-Food and Lodge requirements compliance (community) - 3.78 0.22 3.67 0.27 3.67 0.24 3.33 0.15 3.33 0.26 3.40 0.32 3.70 0.29 2.40 0.40 3.39 0.12 27
ENV 258-Corrected sewage failures (LHD) - 4.00 0.31 3.67 0.36 3.11 0.41 3.44 0.29 3.22 0.30 3.44 0.33 3.00 0.44 3.11 0.41 3.38 0.27 28
ENV 227-Retail food staffing and training (LHD) - 3.67 0.27 3.44 0.33 3.22 0.30 3.11 0.25 3.33 0.34 3.44 0.36 3.40 0.37 3.11 0.41 3.37 0.21 29
ENV 239-Food handlers trained (LHD) - 3.67 0.27 3.33 0.37 3.00 0.33 3.00 0.24 3.33 0.26 3.44 0.29 3.60 0.40 3.22 0.40 3.36 0.18 30
ENV 238-Food handler training responsibility (LHD) - 3.78 0.26 3.56 0.32 3.11 0.30 3.00 0.17 3.22 0.26 3.22 0.34 3.40 0.40 3.22 0.40 3.34 0.18 31
ENV 223-Childcare facilities (LHD) - 3.60 0.40 3.20 0.48 3.20 0.46 3.10 0.32 3.30 0.29 3.60 0.35 3.40 0.40 3.30 0.35 3.33 0.27 32
ENV 229-Licensed retail food establishments (community) - 3.78 0.34 3.22 0.46 3.22 0.37 3.00 0.29 3.11 0.30 3.78 0.18 3.80 0.24 2.89 0.36 3.33 0.22 33
ENV 259-Sewage system permits (LHD) - 3.78 0.37 3.67 0.43 3.22 0.49 3.11 0.34 3.00 0.33 3.22 0.40 3.70 0.36 3.11 0.47 3.33 0.35 34
ENV 215-Rabies vaccination clinics (LHD) - 3.70 0.34 3.50 0.41 3.10 0.42 2.90 0.34 3.30 0.32 3.10 0.39 3.40 0.46 3.70 0.31 3.33 0.27 35
ENV 267-Tattoo facility inspections (LHD) - 3.67 0.27 3.56 0.35 3.00 0.41 3.11 0.25 2.89 0.32 3.22 0.30 3.90 0.28 3.33 0.37 3.32 0.25 36
ENV 283-Wastewater system installations (LHD) - 3.78 0.37 3.78 0.41 3.33 0.45 2.89 0.32 2.78 0.43 2.78 0.53 3.70 0.40 3.56 0.40 3.31 0.34 37
ENV 228-Retail food staffing and training (LHD) - 3.67 0.27 3.44 0.33 3.22 0.30 3.00 0.29 3.22 0.37 3.33 0.42 3.40 0.37 2.89 0.44 3.30 0.23 38
ENV 250-Permanent food service permits (LHD) - 3.78 0.32 3.67 0.39 3.00 0.41 3.00 0.33 3.00 0.33 3.11 0.34 4.00 0.33 2.89 0.47 3.29 0.28 39
ENV 266-Licensed tattoo facilities (LHD) - 3.78 0.29 3.56 0.40 3.00 0.41 3.00 0.24 2.78 0.30 3.22 0.30 3.70 0.34 3.22 0.37 3.26 0.25 40
ENV 241-Foodborne illness complaints (LHD) - 3.78 0.37 3.44 0.44 3.00 0.41 3.11 0.34 2.89 0.32 3.11 0.25 3.90 0.33 2.89 0.53 3.25 0.27 41
ENV 262-Solid waste permits (LHD) - 3.67 0.36 3.78 0.37 2.89 0.44 3.00 0.29 3.11 0.25 2.89 0.40 3.40 0.40 3.00 0.41 3.24 0.26 42
ENV 260-Sewage system repair permits (LHD) - 3.67 0.39 3.67 0.43 2.89 0.47 3.11 0.34 2.89 0.32 3.22 0.40 3.60 0.37 3.11 0.47 3.24 0.35 43
ENV 249-Ozone standard monitoring (LHD) - 3.89 0.37 3.78 0.29 2.89 0.32 3.00 0.44 3.00 0.50 3.11 0.44 3.00 0.54 3.33 0.37 3.24 0.30 44
ENV 279-Housing complaint investigations (LHD) - 3.22 0.46 3.22 0.43 2.78 0.30 3.11 0.44 3.22 0.43 3.22 0.43 3.40 0.46 3.44 0.44 3.24 0.31 45
ENV 245-FTEs dedicated to land use planning/sustainable development (LHD) - 3.56 0.29 3.22 0.40 3.11 0.41 3.00 0.17 3.33 0.26 3.44 0.26 3.30 0.41 2.67 0.46 3.23 0.17 46
ENV 252-Public health nuisance investigations (LHD) - 3.33 0.37 3.33 0.37 3.22 0.34 2.67 0.19 3.00 0.29 3.67 0.27 3.30 0.43 2.89 0.40 3.22 0.20 47
ENV 280-Housing complaint summonses issued (LHD) - 3.22 0.46 3.22 0.43 2.78 0.30 3.11 0.44 3.22 0.43 3.33 0.40 3.20 0.53 3.33 0.47 3.20 0.32 48
ENV 263-Swimming pool inspections (LHD) - 3.56 0.29 3.67 0.27 2.89 0.27 2.89 0.21 2.78 0.30 2.89 0.27 3.90 0.28 3.11 0.38 3.20 0.20 49
ENV 289-Year-round recreational bathing facility inspections (LHD) - 3.56 0.38 3.56 0.40 3.00 0.41 2.78 0.35 3.00 0.37 3.33 0.30 3.40 0.40 3.11 0.44 3.18 0.24 50
ENV 253-Rabies vaccine (LHD) - 3.78 0.34 3.89 0.40 3.11 0.54 2.78 0.53 2.89 0.56 3.44 0.48 2.60 0.61 2.89 0.47 3.17 0.43 51
ENV 287-Water complaint inspections (LHD) - 3.44 0.39 3.56 0.42 3.00 0.44 2.89 0.36 2.67 0.38 2.89 0.50 3.10 0.49 3.44 0.39 3.15 0.34 52
ENV 218-Solid waste complaint investigations (LHD) - 3.50 0.39 3.40 0.42 2.90 0.34 2.80 0.37 2.90 0.38 3.20 0.38 3.30 0.43 3.20 0.35 3.14 0.28 53
ENV 285-Solid waste complaint inspections (LHD) - 3.33 0.42 3.56 0.42 3.00 0.50 3.11 0.38 2.78 0.43 2.78 0.50 3.00 0.47 3.33 0.40 3.14 0.35 54
ENV 237-Food Safety preparedness and response - 3.78 0.34 3.44 0.36 2.89 0.32 2.89 0.32 3.33 0.26 3.44 0.26 2.70 0.50 2.67 0.42 3.13 0.19 55
ENV 288-Water complaint summonses (LHD) - 3.44 0.39 3.56 0.42 3.00 0.44 2.89 0.36 2.67 0.38 2.89 0.50 3.00 0.52 3.33 0.42 3.12 0.35 56
ENV 286-Solid waste complaint summonses issued (LHD) - 3.33 0.42 3.56 0.42 2.89 0.47 2.89 0.36 2.67 0.38 2.89 0.50 3.00 0.52 3.33 0.42 3.10 0.35 57
ENV 292-Licensed youth camp facility inspections (LHD) - 3.22 0.40 3.22 0.43 2.67 0.38 2.56 0.35 2.89 0.36 3.22 0.30 3.00 0.47 3.11 0.44 3.01 0.27 58
ENV 264-Licensed tanning facilities (community) - 3.44 0.39 3.22 0.49 2.56 0.52 2.56 0.28 2.78 0.30 2.89 0.27 3.44 0.39 3.22 0.37 3.01 0.28 59
ENV 284-Onsite wastewater system construction (LHD) - 3.33 0.47 3.33 0.52 2.89 0.53 2.56 0.40 2.78 0.43 2.78 0.53 3.30 0.50 3.22 0.51 3.00 0.36 60
ENV 240-Food safety program assessment - 3.33 0.42 3.33 0.42 2.78 0.35 2.89 0.32 3.33 0.26 3.11 0.38 2.60 0.55 2.56 0.44 2.98 0.27 61
Feasibility ValidityDomainFit DimensionFit Relevance HealthImpact EconomicImpact Variation
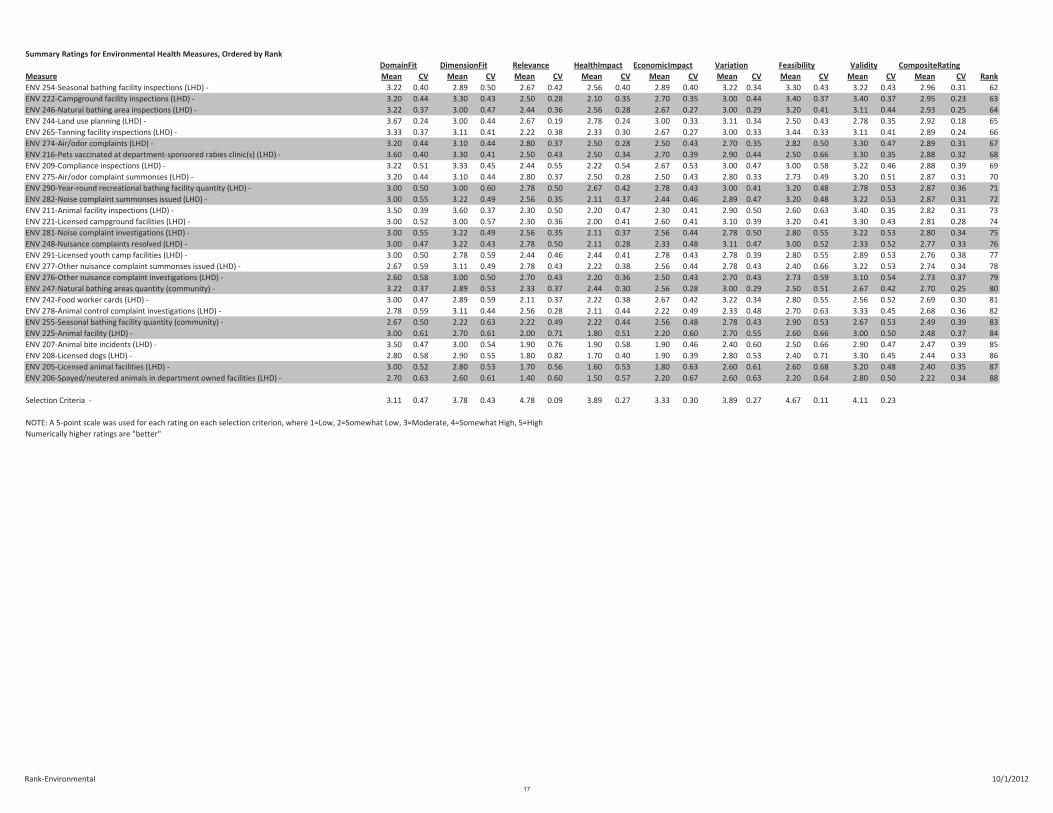
Rank-Environmental 10/1/2012
Summary Ratings for Environmental Health Measures, Ordered by Rank
CompositeRating
Measure Mean CV Mean CV Mean CV Mean CV Mean CV Mean CV Mean CV Mean CV Mean CV Rank
Feasibility ValidityDomainFit DimensionFit Relevance HealthImpact EconomicImpact Variation
ENV 254-Seasonal bathing facility inspections (LHD) - 3.22 0.40 2.89 0.50 2.67 0.42 2.56 0.40 2.89 0.40 3.22 0.34 3.30 0.43 3.22 0.43 2.96 0.31 62
ENV 222-Campground facility inspections (LHD) - 3.20 0.44 3.30 0.43 2.50 0.28 2.10 0.35 2.70 0.35 3.00 0.44 3.40 0.37 3.40 0.37 2.95 0.23 63
ENV 246-Natural bathing area inspections (LHD) - 3.22 0.37 3.00 0.47 2.44 0.36 2.56 0.28 2.67 0.27 3.00 0.29 3.20 0.41 3.11 0.44 2.93 0.25 64
ENV 244-Land use planning (LHD) - 3.67 0.24 3.00 0.44 2.67 0.19 2.78 0.24 3.00 0.33 3.11 0.34 2.50 0.43 2.78 0.35 2.92 0.18 65
ENV 265-Tanning facility inspections (LHD) - 3.33 0.37 3.11 0.41 2.22 0.38 2.33 0.30 2.67 0.27 3.00 0.33 3.44 0.33 3.11 0.41 2.89 0.24 66
ENV 274-Air/odor complaints (LHD) - 3.20 0.44 3.10 0.44 2.80 0.37 2.50 0.28 2.50 0.43 2.70 0.35 2.82 0.50 3.30 0.47 2.89 0.31 67
ENV 216-Pets vaccinated at department-sponsored rabies clinic(s) (LHD) - 3.60 0.40 3.30 0.41 2.50 0.43 2.50 0.34 2.70 0.39 2.90 0.44 2.50 0.66 3.30 0.35 2.88 0.32 68
ENV 209-Compliance inspections (LHD) - 3.22 0.51 3.33 0.45 2.44 0.55 2.22 0.54 2.67 0.53 3.00 0.47 3.00 0.58 3.22 0.46 2.88 0.39 69
ENV 275-Air/odor complaint summonses (LHD) - 3.20 0.44 3.10 0.44 2.80 0.37 2.50 0.28 2.50 0.43 2.80 0.33 2.73 0.49 3.20 0.51 2.87 0.31 70
ENV 290-Year-round recreational bathing facility quantity (LHD) - 3.00 0.50 3.00 0.60 2.78 0.50 2.67 0.42 2.78 0.43 3.00 0.41 3.20 0.48 2.78 0.53 2.87 0.36 71
ENV 282-Noise complaint summonses issued (LHD) - 3.00 0.55 3.22 0.49 2.56 0.35 2.11 0.37 2.44 0.46 2.89 0.47 3.20 0.48 3.22 0.53 2.87 0.31 72
ENV 211-Animal facility inspections (LHD) - 3.50 0.39 3.60 0.37 2.30 0.50 2.20 0.47 2.30 0.41 2.90 0.50 2.60 0.63 3.40 0.35 2.82 0.31 73
ENV 221-Licensed campground facilities (LHD) - 3.00 0.52 3.00 0.57 2.30 0.36 2.00 0.41 2.60 0.41 3.10 0.39 3.20 0.41 3.30 0.43 2.81 0.28 74
ENV 281-Noise complaint investigations (LHD) - 3.00 0.55 3.22 0.49 2.56 0.35 2.11 0.37 2.56 0.44 2.78 0.50 2.80 0.55 3.22 0.53 2.80 0.34 75
ENV 248-Nuisance complaints resolved (LHD) - 3.00 0.47 3.22 0.43 2.78 0.50 2.11 0.28 2.33 0.48 3.11 0.47 3.00 0.52 2.33 0.52 2.77 0.33 76
ENV 291-Licensed youth camp facilities (LHD) - 3.00 0.50 2.78 0.59 2.44 0.46 2.44 0.41 2.78 0.43 2.78 0.39 2.80 0.55 2.89 0.53 2.76 0.38 77
ENV 277-Other nuisance complaint summonses issued (LHD) - 2.67 0.59 3.11 0.49 2.78 0.43 2.22 0.38 2.56 0.44 2.78 0.43 2.40 0.66 3.22 0.53 2.74 0.34 78
ENV 276-Other nuisance complaint investigations (LHD) - 2.60 0.58 3.00 0.50 2.70 0.43 2.20 0.36 2.50 0.43 2.70 0.43 2.73 0.59 3.10 0.54 2.73 0.37 79
ENV 247-Natural bathing areas quantity (community) - 3.22 0.37 2.89 0.53 2.33 0.37 2.44 0.30 2.56 0.28 3.00 0.29 2.50 0.51 2.67 0.42 2.70 0.25 80
ENV 242-Food worker cards (LHD) - 3.00 0.47 2.89 0.59 2.11 0.37 2.22 0.38 2.67 0.42 3.22 0.34 2.80 0.55 2.56 0.52 2.69 0.30 81
ENV 278-Animal control complaint investigations (LHD) - 2.78 0.59 3.11 0.44 2.56 0.28 2.11 0.44 2.22 0.49 2.33 0.48 2.70 0.63 3.33 0.45 2.68 0.36 82
ENV 255-Seasonal bathing facility quantity (community) - 2.67 0.50 2.22 0.63 2.22 0.49 2.22 0.44 2.56 0.48 2.78 0.43 2.90 0.53 2.67 0.53 2.49 0.39 83
ENV 225-Animal facility (LHD) - 3.00 0.61 2.70 0.61 2.00 0.71 1.80 0.51 2.20 0.60 2.70 0.55 2.60 0.66 3.00 0.50 2.48 0.37 84
ENV 207-Animal bite incidents (LHD) - 3.50 0.47 3.00 0.54 1.90 0.76 1.90 0.58 1.90 0.46 2.40 0.60 2.50 0.66 2.90 0.47 2.47 0.39 85
ENV 208-Licensed dogs (LHD) - 2.80 0.58 2.90 0.55 1.80 0.82 1.70 0.40 1.90 0.39 2.80 0.53 2.40 0.71 3.30 0.45 2.44 0.33 86
ENV 205-Licensed animal facilities (LHD) - 3.00 0.52 2.80 0.53 1.70 0.56 1.60 0.53 1.80 0.63 2.60 0.61 2.60 0.68 3.20 0.48 2.40 0.35 87
ENV 206-Spayed/neutered animals in department owned facilities (LHD) - 2.70 0.63 2.60 0.61 1.40 0.60 1.50 0.57 2.20 0.67 2.60 0.63 2.20 0.64 2.80 0.50 2.22 0.34 88
Selection Criteria - 3.11 0.47 3.78 0.43 4.78 0.09 3.89 0.27 3.33 0.30 3.89 0.27 4.67 0.11 4.11 0.23
NOTE: A 5-point scale was used for each rating on each selection criterion, where 1=Low, 2=Somewhat Low, 3=Moderate, 4=Somewhat High, 5=High
Numerically higher ratings are "better"
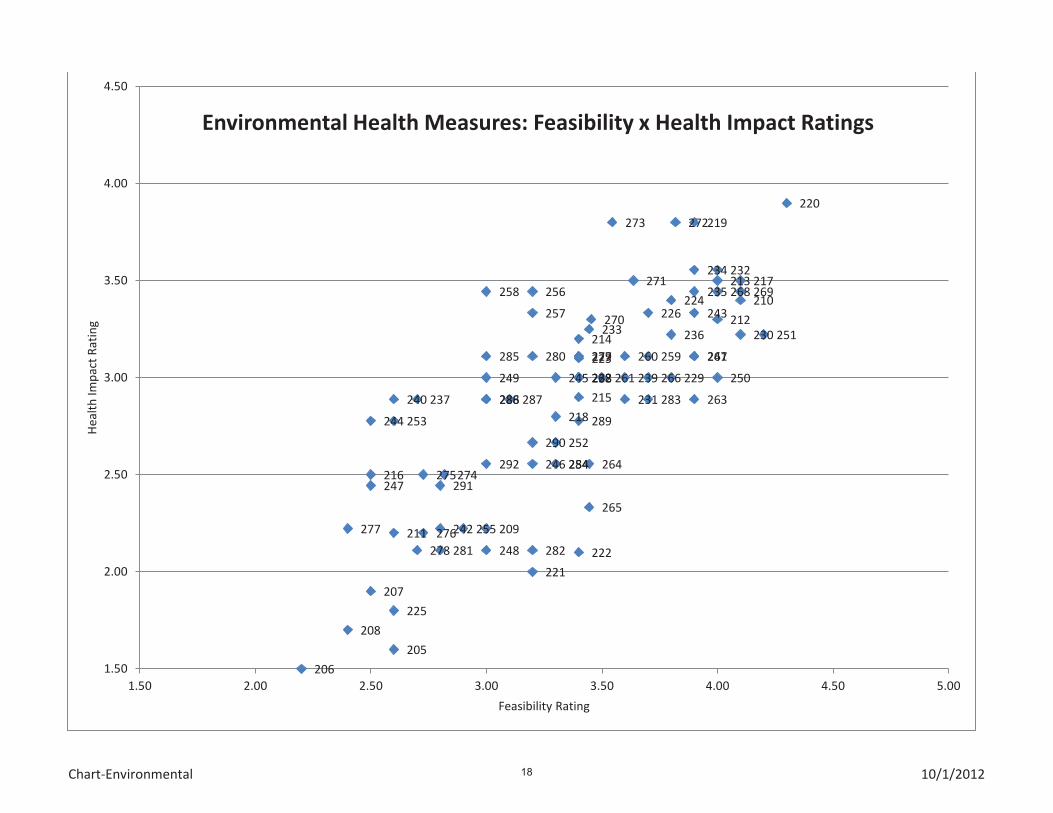
Chart-Environmental 10/1/2012
205
206
207
208
209
210
211
212
213
214
215
216
217
218
219
220
221
222
223
224
225
226
227
228 229
230
231
232
233
234
235
236
237
238 239
240
241
242
243
244
245
246
247
248
249 250
251
252
253
254
255
256
257
258
259 260
261 262
263
264
265
266
267
268 269
270
271
272 273
274 275
276 277
278
279 280
281 282
283
284
285
286 287 288
289
290
291
292
1.50
2.00
2.50
3.00
3.50
4.00
4.50
1.50 2.00 2.50 3.00 3.50 4.00 4.50 5.00
He
alt
h I
mp
act
Ra
tin
g
Feasibility Rating
Environmental Health Measures: Feasibility x Health Impact Ratings
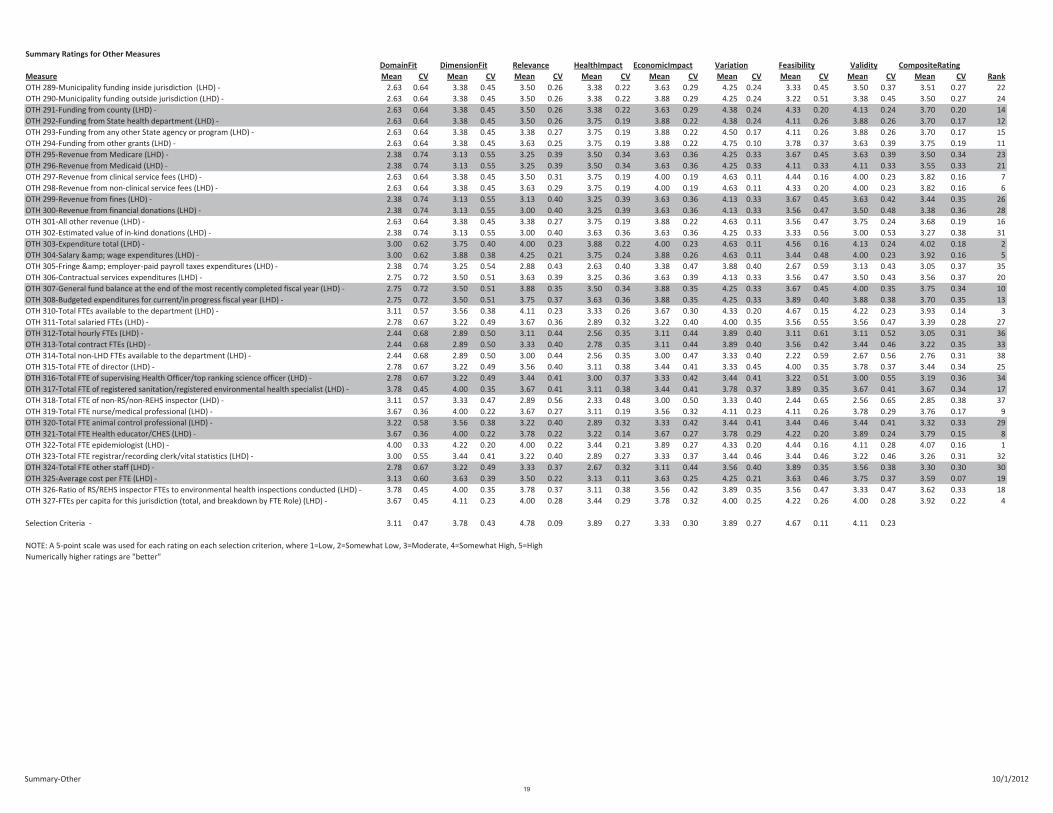
Summary-Other 10/1/2012
Summary Ratings for Other Measures
CompositeRating
Measure Mean CV Mean CV Mean CV Mean CV Mean CV Mean CV Mean CV Mean CV Mean CV Rank
OTH 289-Municipality funding inside jurisdiction (LHD) - 2.63 0.64 3.38 0.45 3.50 0.26 3.38 0.22 3.63 0.29 4.25 0.24 3.33 0.45 3.50 0.37 3.51 0.27 22
OTH 290-Municipality funding outside jurisdiction (LHD) - 2.63 0.64 3.38 0.45 3.50 0.26 3.38 0.22 3.88 0.29 4.25 0.24 3.22 0.51 3.38 0.45 3.50 0.27 24
OTH 291-Funding from county (LHD) - 2.63 0.64 3.38 0.45 3.50 0.26 3.38 0.22 3.63 0.29 4.38 0.24 4.33 0.20 4.13 0.24 3.70 0.20 14
OTH 292-Funding from State health department (LHD) - 2.63 0.64 3.38 0.45 3.50 0.26 3.75 0.19 3.88 0.22 4.38 0.24 4.11 0.26 3.88 0.26 3.70 0.17 12
OTH 293-Funding from any other State agency or program (LHD) - 2.63 0.64 3.38 0.45 3.38 0.27 3.75 0.19 3.88 0.22 4.50 0.17 4.11 0.26 3.88 0.26 3.70 0.17 15
OTH 294-Funding from other grants (LHD) - 2.63 0.64 3.38 0.45 3.63 0.25 3.75 0.19 3.88 0.22 4.75 0.10 3.78 0.37 3.63 0.39 3.75 0.19 11
OTH 295-Revenue from Medicare (LHD) - 2.38 0.74 3.13 0.55 3.25 0.39 3.50 0.34 3.63 0.36 4.25 0.33 3.67 0.45 3.63 0.39 3.50 0.34 23
OTH 296-Revenue from Medicaid (LHD) - 2.38 0.74 3.13 0.55 3.25 0.39 3.50 0.34 3.63 0.36 4.25 0.33 4.11 0.33 4.11 0.33 3.55 0.33 21
OTH 297-Revenue from clinical service fees (LHD) - 2.63 0.64 3.38 0.45 3.50 0.31 3.75 0.19 4.00 0.19 4.63 0.11 4.44 0.16 4.00 0.23 3.82 0.16 7
OTH 298-Revenue from non-clinical service fees (LHD) - 2.63 0.64 3.38 0.45 3.63 0.29 3.75 0.19 4.00 0.19 4.63 0.11 4.33 0.20 4.00 0.23 3.82 0.16 6
OTH 299-Revenue from fines (LHD) - 2.38 0.74 3.13 0.55 3.13 0.40 3.25 0.39 3.63 0.36 4.13 0.33 3.67 0.45 3.63 0.42 3.44 0.35 26
OTH 300-Revenue from financial donations (LHD) - 2.38 0.74 3.13 0.55 3.00 0.40 3.25 0.39 3.63 0.36 4.13 0.33 3.56 0.47 3.50 0.48 3.38 0.36 28
OTH 301-All other revenue (LHD) - 2.63 0.64 3.38 0.45 3.38 0.27 3.75 0.19 3.88 0.22 4.63 0.11 3.56 0.47 3.75 0.24 3.68 0.19 16
OTH 302-Estimated value of in-kind donations (LHD) - 2.38 0.74 3.13 0.55 3.00 0.40 3.63 0.36 3.63 0.36 4.25 0.33 3.33 0.56 3.00 0.53 3.27 0.38 31
OTH 303-Expenditure total (LHD) - 3.00 0.62 3.75 0.40 4.00 0.23 3.88 0.22 4.00 0.23 4.63 0.11 4.56 0.16 4.13 0.24 4.02 0.18 2
OTH 304-Salary & wage expenditures (LHD) - 3.00 0.62 3.88 0.38 4.25 0.21 3.75 0.24 3.88 0.26 4.63 0.11 3.44 0.48 4.00 0.23 3.92 0.16 5
OTH 305-Fringe & employer-paid payroll taxes expenditures (LHD) - 2.38 0.74 3.25 0.54 2.88 0.43 2.63 0.40 3.38 0.47 3.88 0.40 2.67 0.59 3.13 0.43 3.05 0.37 35
OTH 306-Contractual services expenditures (LHD) - 2.75 0.72 3.50 0.51 3.63 0.39 3.25 0.36 3.63 0.39 4.13 0.33 3.56 0.47 3.50 0.43 3.56 0.37 20
OTH 307-General fund balance at the end of the most recently completed fiscal year (LHD) - 2.75 0.72 3.50 0.51 3.88 0.35 3.50 0.34 3.88 0.35 4.25 0.33 3.67 0.45 4.00 0.35 3.75 0.34 10
OTH 308-Budgeted expenditures for current/in progress fiscal year (LHD) - 2.75 0.72 3.50 0.51 3.75 0.37 3.63 0.36 3.88 0.35 4.25 0.33 3.89 0.40 3.88 0.38 3.70 0.35 13
OTH 310-Total FTEs available to the department (LHD) - 3.11 0.57 3.56 0.38 4.11 0.23 3.33 0.26 3.67 0.30 4.33 0.20 4.67 0.15 4.22 0.23 3.93 0.14 3
OTH 311-Total salaried FTEs (LHD) - 2.78 0.67 3.22 0.49 3.67 0.36 2.89 0.32 3.22 0.40 4.00 0.35 3.56 0.55 3.56 0.47 3.39 0.28 27
OTH 312-Total hourly FTEs (LHD) - 2.44 0.68 2.89 0.50 3.11 0.44 2.56 0.35 3.11 0.44 3.89 0.40 3.11 0.61 3.11 0.52 3.05 0.31 36
OTH 313-Total contract FTEs (LHD) - 2.44 0.68 2.89 0.50 3.33 0.40 2.78 0.35 3.11 0.44 3.89 0.40 3.56 0.42 3.44 0.46 3.22 0.35 33
OTH 314-Total non-LHD FTEs available to the department (LHD) - 2.44 0.68 2.89 0.50 3.00 0.44 2.56 0.35 3.00 0.47 3.33 0.40 2.22 0.59 2.67 0.56 2.76 0.31 38
OTH 315-Total FTE of director (LHD) - 2.78 0.67 3.22 0.49 3.56 0.40 3.11 0.38 3.44 0.41 3.33 0.45 4.00 0.35 3.78 0.37 3.44 0.34 25
OTH 316-Total FTE of supervising Health Officer/top ranking science officer (LHD) - 2.78 0.67 3.22 0.49 3.44 0.41 3.00 0.37 3.33 0.42 3.44 0.41 3.22 0.51 3.00 0.55 3.19 0.36 34
OTH 317-Total FTE of registered sanitation/registered environmental health specialist (LHD) - 3.78 0.45 4.00 0.35 3.67 0.41 3.11 0.38 3.44 0.41 3.78 0.37 3.89 0.35 3.67 0.41 3.67 0.34 17
OTH 318-Total FTE of non-RS/non-REHS inspector (LHD) - 3.11 0.57 3.33 0.47 2.89 0.56 2.33 0.48 3.00 0.50 3.33 0.40 2.44 0.65 2.56 0.65 2.85 0.38 37
OTH 319-Total FTE nurse/medical professional (LHD) - 3.67 0.36 4.00 0.22 3.67 0.27 3.11 0.19 3.56 0.32 4.11 0.23 4.11 0.26 3.78 0.29 3.76 0.17 9
OTH 320-Total FTE animal control professional (LHD) - 3.22 0.58 3.56 0.38 3.22 0.40 2.89 0.32 3.33 0.42 3.44 0.41 3.44 0.46 3.44 0.41 3.32 0.33 29
OTH 321-Total FTE Health educator/CHES (LHD) - 3.67 0.36 4.00 0.22 3.78 0.22 3.22 0.14 3.67 0.27 3.78 0.29 4.22 0.20 3.89 0.24 3.79 0.15 8
OTH 322-Total FTE epidemiologist (LHD) - 4.00 0.33 4.22 0.20 4.00 0.22 3.44 0.21 3.89 0.27 4.33 0.20 4.44 0.16 4.11 0.28 4.07 0.16 1
OTH 323-Total FTE registrar/recording clerk/vital statistics (LHD) - 3.00 0.55 3.44 0.41 3.22 0.40 2.89 0.27 3.33 0.37 3.44 0.46 3.44 0.46 3.22 0.46 3.26 0.31 32
OTH 324-Total FTE other staff (LHD) - 2.78 0.67 3.22 0.49 3.33 0.37 2.67 0.32 3.11 0.44 3.56 0.40 3.89 0.35 3.56 0.38 3.30 0.30 30
OTH 325-Average cost per FTE (LHD) - 3.13 0.60 3.63 0.39 3.50 0.22 3.13 0.11 3.63 0.25 4.25 0.21 3.63 0.46 3.75 0.37 3.59 0.07 19
OTH 326-Ratio of RS/REHS inspector FTEs to environmental health inspections conducted (LHD) - 3.78 0.45 4.00 0.35 3.78 0.37 3.11 0.38 3.56 0.42 3.89 0.35 3.56 0.47 3.33 0.47 3.62 0.33 18
OTH 327-FTEs per capita for this jurisdiction (total, and breakdown by FTE Role) (LHD) - 3.67 0.45 4.11 0.23 4.00 0.28 3.44 0.29 3.78 0.32 4.00 0.25 4.22 0.26 4.00 0.28 3.92 0.22 4
Selection Criteria - 3.11 0.47 3.78 0.43 4.78 0.09 3.89 0.27 3.33 0.30 3.89 0.27 4.67 0.11 4.11 0.23
NOTE: A 5-point scale was used for each rating on each selection criterion, where 1=Low, 2=Somewhat Low, 3=Moderate, 4=Somewhat High, 5=High
Numerically higher ratings are "better"
Feasibility ValidityDomainFit DimensionFit Relevance HealthImpact EconomicImpact Variation
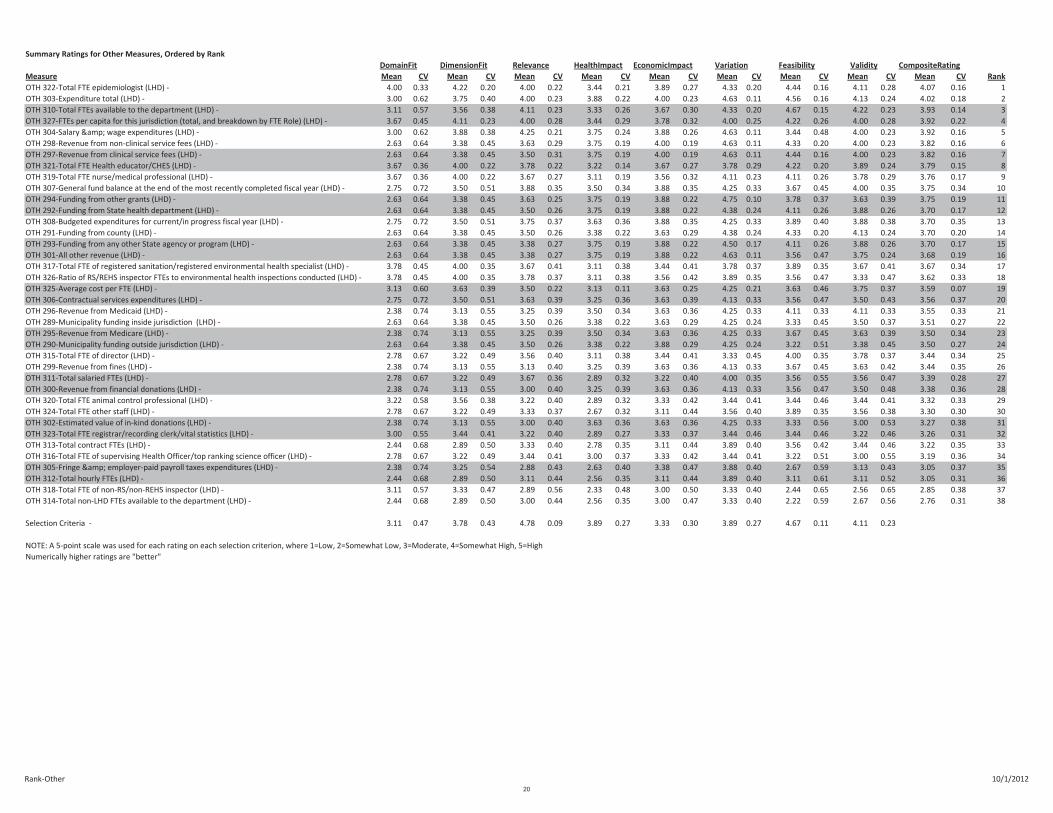
Rank-Other 10/1/2012
Summary Ratings for Other Measures, Ordered by Rank
CompositeRating
Measure Mean CV Mean CV Mean CV Mean CV Mean CV Mean CV Mean CV Mean CV Mean CV Rank
OTH 322-Total FTE epidemiologist (LHD) - 4.00 0.33 4.22 0.20 4.00 0.22 3.44 0.21 3.89 0.27 4.33 0.20 4.44 0.16 4.11 0.28 4.07 0.16 1
OTH 303-Expenditure total (LHD) - 3.00 0.62 3.75 0.40 4.00 0.23 3.88 0.22 4.00 0.23 4.63 0.11 4.56 0.16 4.13 0.24 4.02 0.18 2
OTH 310-Total FTEs available to the department (LHD) - 3.11 0.57 3.56 0.38 4.11 0.23 3.33 0.26 3.67 0.30 4.33 0.20 4.67 0.15 4.22 0.23 3.93 0.14 3
OTH 327-FTEs per capita for this jurisdiction (total, and breakdown by FTE Role) (LHD) - 3.67 0.45 4.11 0.23 4.00 0.28 3.44 0.29 3.78 0.32 4.00 0.25 4.22 0.26 4.00 0.28 3.92 0.22 4
OTH 304-Salary & wage expenditures (LHD) - 3.00 0.62 3.88 0.38 4.25 0.21 3.75 0.24 3.88 0.26 4.63 0.11 3.44 0.48 4.00 0.23 3.92 0.16 5
OTH 298-Revenue from non-clinical service fees (LHD) - 2.63 0.64 3.38 0.45 3.63 0.29 3.75 0.19 4.00 0.19 4.63 0.11 4.33 0.20 4.00 0.23 3.82 0.16 6
OTH 297-Revenue from clinical service fees (LHD) - 2.63 0.64 3.38 0.45 3.50 0.31 3.75 0.19 4.00 0.19 4.63 0.11 4.44 0.16 4.00 0.23 3.82 0.16 7
OTH 321-Total FTE Health educator/CHES (LHD) - 3.67 0.36 4.00 0.22 3.78 0.22 3.22 0.14 3.67 0.27 3.78 0.29 4.22 0.20 3.89 0.24 3.79 0.15 8
OTH 319-Total FTE nurse/medical professional (LHD) - 3.67 0.36 4.00 0.22 3.67 0.27 3.11 0.19 3.56 0.32 4.11 0.23 4.11 0.26 3.78 0.29 3.76 0.17 9
OTH 307-General fund balance at the end of the most recently completed fiscal year (LHD) - 2.75 0.72 3.50 0.51 3.88 0.35 3.50 0.34 3.88 0.35 4.25 0.33 3.67 0.45 4.00 0.35 3.75 0.34 10
OTH 294-Funding from other grants (LHD) - 2.63 0.64 3.38 0.45 3.63 0.25 3.75 0.19 3.88 0.22 4.75 0.10 3.78 0.37 3.63 0.39 3.75 0.19 11
OTH 292-Funding from State health department (LHD) - 2.63 0.64 3.38 0.45 3.50 0.26 3.75 0.19 3.88 0.22 4.38 0.24 4.11 0.26 3.88 0.26 3.70 0.17 12
OTH 308-Budgeted expenditures for current/in progress fiscal year (LHD) - 2.75 0.72 3.50 0.51 3.75 0.37 3.63 0.36 3.88 0.35 4.25 0.33 3.89 0.40 3.88 0.38 3.70 0.35 13
OTH 291-Funding from county (LHD) - 2.63 0.64 3.38 0.45 3.50 0.26 3.38 0.22 3.63 0.29 4.38 0.24 4.33 0.20 4.13 0.24 3.70 0.20 14
OTH 293-Funding from any other State agency or program (LHD) - 2.63 0.64 3.38 0.45 3.38 0.27 3.75 0.19 3.88 0.22 4.50 0.17 4.11 0.26 3.88 0.26 3.70 0.17 15
OTH 301-All other revenue (LHD) - 2.63 0.64 3.38 0.45 3.38 0.27 3.75 0.19 3.88 0.22 4.63 0.11 3.56 0.47 3.75 0.24 3.68 0.19 16
OTH 317-Total FTE of registered sanitation/registered environmental health specialist (LHD) - 3.78 0.45 4.00 0.35 3.67 0.41 3.11 0.38 3.44 0.41 3.78 0.37 3.89 0.35 3.67 0.41 3.67 0.34 17
OTH 326-Ratio of RS/REHS inspector FTEs to environmental health inspections conducted (LHD) - 3.78 0.45 4.00 0.35 3.78 0.37 3.11 0.38 3.56 0.42 3.89 0.35 3.56 0.47 3.33 0.47 3.62 0.33 18
OTH 325-Average cost per FTE (LHD) - 3.13 0.60 3.63 0.39 3.50 0.22 3.13 0.11 3.63 0.25 4.25 0.21 3.63 0.46 3.75 0.37 3.59 0.07 19
OTH 306-Contractual services expenditures (LHD) - 2.75 0.72 3.50 0.51 3.63 0.39 3.25 0.36 3.63 0.39 4.13 0.33 3.56 0.47 3.50 0.43 3.56 0.37 20
OTH 296-Revenue from Medicaid (LHD) - 2.38 0.74 3.13 0.55 3.25 0.39 3.50 0.34 3.63 0.36 4.25 0.33 4.11 0.33 4.11 0.33 3.55 0.33 21
OTH 289-Municipality funding inside jurisdiction (LHD) - 2.63 0.64 3.38 0.45 3.50 0.26 3.38 0.22 3.63 0.29 4.25 0.24 3.33 0.45 3.50 0.37 3.51 0.27 22
OTH 295-Revenue from Medicare (LHD) - 2.38 0.74 3.13 0.55 3.25 0.39 3.50 0.34 3.63 0.36 4.25 0.33 3.67 0.45 3.63 0.39 3.50 0.34 23
OTH 290-Municipality funding outside jurisdiction (LHD) - 2.63 0.64 3.38 0.45 3.50 0.26 3.38 0.22 3.88 0.29 4.25 0.24 3.22 0.51 3.38 0.45 3.50 0.27 24
OTH 315-Total FTE of director (LHD) - 2.78 0.67 3.22 0.49 3.56 0.40 3.11 0.38 3.44 0.41 3.33 0.45 4.00 0.35 3.78 0.37 3.44 0.34 25
OTH 299-Revenue from fines (LHD) - 2.38 0.74 3.13 0.55 3.13 0.40 3.25 0.39 3.63 0.36 4.13 0.33 3.67 0.45 3.63 0.42 3.44 0.35 26
OTH 311-Total salaried FTEs (LHD) - 2.78 0.67 3.22 0.49 3.67 0.36 2.89 0.32 3.22 0.40 4.00 0.35 3.56 0.55 3.56 0.47 3.39 0.28 27
OTH 300-Revenue from financial donations (LHD) - 2.38 0.74 3.13 0.55 3.00 0.40 3.25 0.39 3.63 0.36 4.13 0.33 3.56 0.47 3.50 0.48 3.38 0.36 28
OTH 320-Total FTE animal control professional (LHD) - 3.22 0.58 3.56 0.38 3.22 0.40 2.89 0.32 3.33 0.42 3.44 0.41 3.44 0.46 3.44 0.41 3.32 0.33 29
OTH 324-Total FTE other staff (LHD) - 2.78 0.67 3.22 0.49 3.33 0.37 2.67 0.32 3.11 0.44 3.56 0.40 3.89 0.35 3.56 0.38 3.30 0.30 30
OTH 302-Estimated value of in-kind donations (LHD) - 2.38 0.74 3.13 0.55 3.00 0.40 3.63 0.36 3.63 0.36 4.25 0.33 3.33 0.56 3.00 0.53 3.27 0.38 31
OTH 323-Total FTE registrar/recording clerk/vital statistics (LHD) - 3.00 0.55 3.44 0.41 3.22 0.40 2.89 0.27 3.33 0.37 3.44 0.46 3.44 0.46 3.22 0.46 3.26 0.31 32
OTH 313-Total contract FTEs (LHD) - 2.44 0.68 2.89 0.50 3.33 0.40 2.78 0.35 3.11 0.44 3.89 0.40 3.56 0.42 3.44 0.46 3.22 0.35 33
OTH 316-Total FTE of supervising Health Officer/top ranking science officer (LHD) - 2.78 0.67 3.22 0.49 3.44 0.41 3.00 0.37 3.33 0.42 3.44 0.41 3.22 0.51 3.00 0.55 3.19 0.36 34
OTH 305-Fringe & employer-paid payroll taxes expenditures (LHD) - 2.38 0.74 3.25 0.54 2.88 0.43 2.63 0.40 3.38 0.47 3.88 0.40 2.67 0.59 3.13 0.43 3.05 0.37 35
OTH 312-Total hourly FTEs (LHD) - 2.44 0.68 2.89 0.50 3.11 0.44 2.56 0.35 3.11 0.44 3.89 0.40 3.11 0.61 3.11 0.52 3.05 0.31 36
OTH 318-Total FTE of non-RS/non-REHS inspector (LHD) - 3.11 0.57 3.33 0.47 2.89 0.56 2.33 0.48 3.00 0.50 3.33 0.40 2.44 0.65 2.56 0.65 2.85 0.38 37
OTH 314-Total non-LHD FTEs available to the department (LHD) - 2.44 0.68 2.89 0.50 3.00 0.44 2.56 0.35 3.00 0.47 3.33 0.40 2.22 0.59 2.67 0.56 2.76 0.31 38
Selection Criteria - 3.11 0.47 3.78 0.43 4.78 0.09 3.89 0.27 3.33 0.30 3.89 0.27 4.67 0.11 4.11 0.23
NOTE: A 5-point scale was used for each rating on each selection criterion, where 1=Low, 2=Somewhat Low, 3=Moderate, 4=Somewhat High, 5=High
Numerically higher ratings are "better"
Feasibility ValidityDomainFit DimensionFit Relevance HealthImpact EconomicImpact Variation
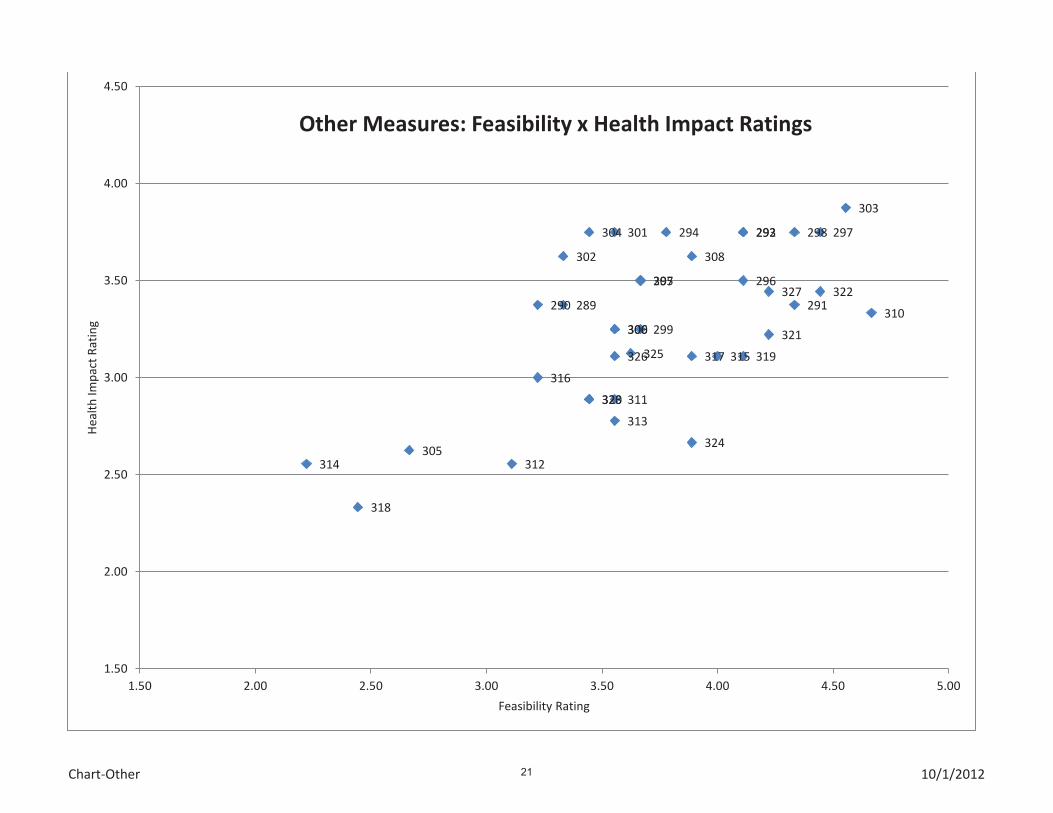
Chart-Other 10/1/2012
289 290 291
292 293 294
295 296
297 298
299 300
301
302
303
304
305
306
307
308
310
311
312
313
314
315
316
317
318
319
320
321
322
323
324
325 326
327
1.50
2.00
2.50
3.00
3.50
4.00
4.50
1.50 2.00 2.50 3.00 3.50 4.00 4.50 5.00
He
alt
h I
mp
act
Ra
tin
g
Feasibility Rating
Other Measures: Feasibility x Health Impact Ratings
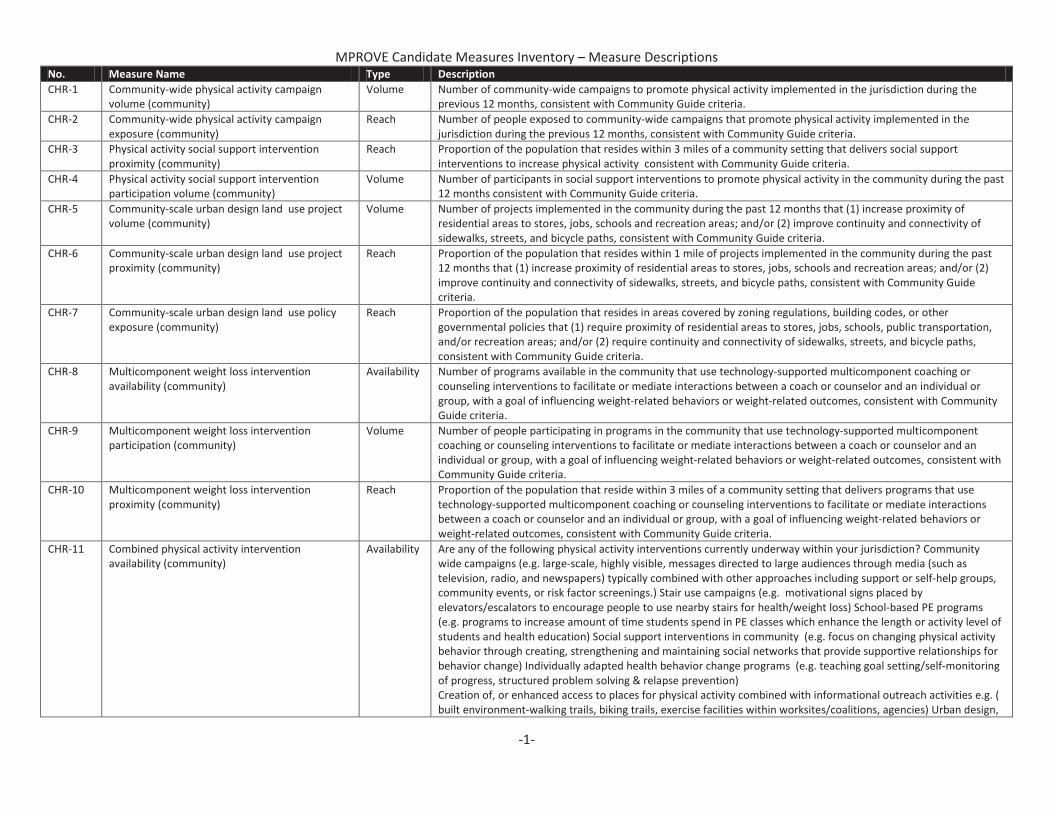
MPROVE Candidate Measures Inventory – Measure Descriptions
-1-
No. Measure Name Type Description
CHR-1 Community-wide physical activity campaign
volume (community)
Volume Number of community-wide campaigns to promote physical activity implemented in the jurisdiction during the
previous 12 months, consistent with Community Guide criteria.
CHR-2 Community-wide physical activity campaign
exposure (community)
Reach Number of people exposed to community-wide campaigns that promote physical activity implemented in the
jurisdiction during the previous 12 months, consistent with Community Guide criteria.
CHR-3 Physical activity social support intervention
proximity (community)
Reach Proportion of the population that resides within 3 miles of a community setting that delivers social support
interventions to increase physical activity consistent with Community Guide criteria.
CHR-4 Physical activity social support intervention
participation volume (community)
Volume Number of participants in social support interventions to promote physical activity in the community during the past
12 months consistent with Community Guide criteria.
CHR-5 Community-scale urban design land use project
volume (community)
Volume Number of projects implemented in the community during the past 12 months that (1) increase proximity of
residential areas to stores, jobs, schools and recreation areas; and/or (2) improve continuity and connectivity of
sidewalks, streets, and bicycle paths, consistent with Community Guide criteria.
CHR-6 Community-scale urban design land use project
proximity (community)
Reach Proportion of the population that resides within 1 mile of projects implemented in the community during the past
12 months that (1) increase proximity of residential areas to stores, jobs, schools and recreation areas; and/or (2)
improve continuity and connectivity of sidewalks, streets, and bicycle paths, consistent with Community Guide
criteria.
CHR-7 Community-scale urban design land use policy
exposure (community)
Reach Proportion of the population that resides in areas covered by zoning regulations, building codes, or other
governmental policies that (1) require proximity of residential areas to stores, jobs, schools, public transportation,
and/or recreation areas; and/or (2) require continuity and connectivity of sidewalks, streets, and bicycle paths,
consistent with Community Guide criteria.
CHR-8 Multicomponent weight loss intervention
availability (community)
Availability Number of programs available in the community that use technology-supported multicomponent coaching or
counseling interventions to facilitate or mediate interactions between a coach or counselor and an individual or
group, with a goal of influencing weight-related behaviors or weight-related outcomes, consistent with Community
Guide criteria.
CHR-9 Multicomponent weight loss intervention
participation (community)
Volume Number of people participating in programs in the community that use technology-supported multicomponent
coaching or counseling interventions to facilitate or mediate interactions between a coach or counselor and an
individual or group, with a goal of influencing weight-related behaviors or weight-related outcomes, consistent with
Community Guide criteria.
CHR-10 Multicomponent weight loss intervention
proximity (community)
Reach Proportion of the population that reside within 3 miles of a community setting that delivers programs that use
technology-supported multicomponent coaching or counseling interventions to facilitate or mediate interactions
between a coach or counselor and an individual or group, with a goal of influencing weight-related behaviors or
weight-related outcomes, consistent with Community Guide criteria.
CHR-11 Combined physical activity intervention
availability (community)
Availability Are any of the following physical activity interventions currently underway within your jurisdiction? Community
wide campaigns (e.g. large-scale, highly visible, messages directed to large audiences through media (such as
television, radio, and newspapers) typically combined with other approaches including support or self-help groups,
community events, or risk factor screenings.) Stair use campaigns (e.g. motivational signs placed by
elevators/escalators to encourage people to use nearby stairs for health/weight loss) School-based PE programs
(e.g. programs to increase amount of time students spend in PE classes which enhance the length or activity level of
students and health education) Social support interventions in community (e.g. focus on changing physical activity
behavior through creating, strengthening and maintaining social networks that provide supportive relationships for
behavior change) Individually adapted health behavior change programs (e.g. teaching goal setting/self-monitoring
of progress, structured problem solving & relapse prevention)
Creation of, or enhanced access to places for physical activity combined with informational outreach activities e.g. (
built environment-walking trails, biking trails, exercise facilities within worksites/coalitions, agencies) Urban design,
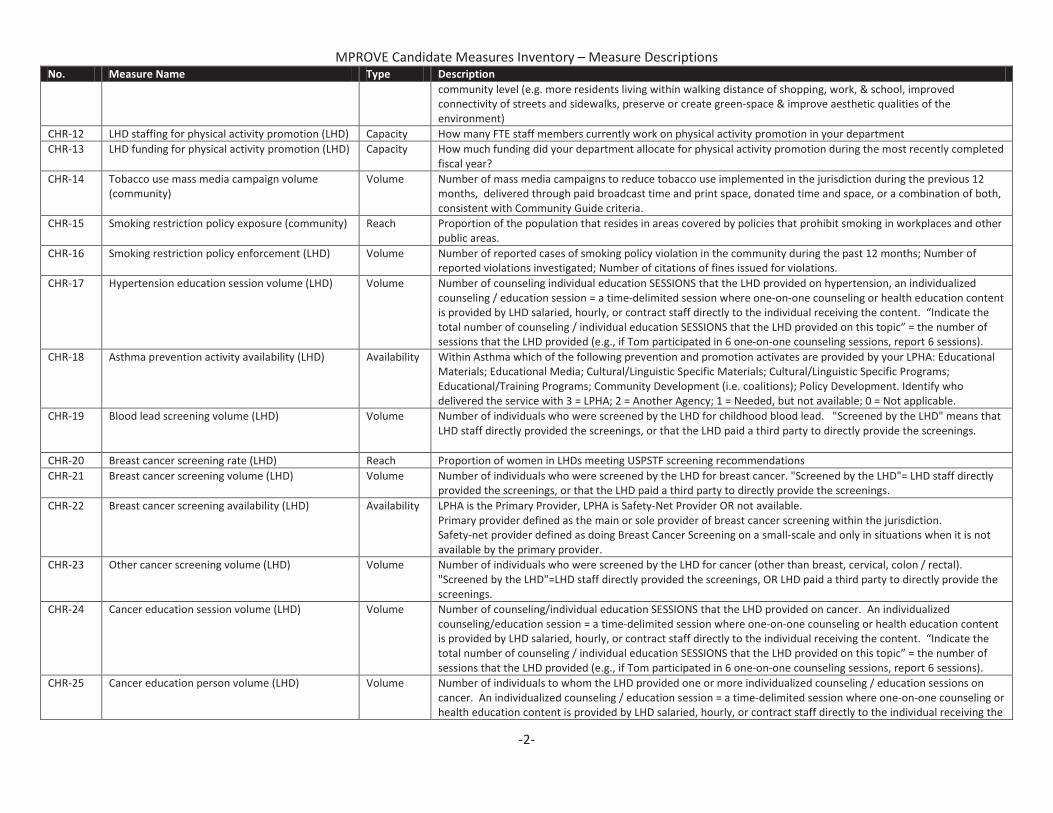
MPROVE Candidate Measures Inventory – Measure Descriptions
-2-
No. Measure Name Type Description
community level (e.g. more residents living within walking distance of shopping, work, & school, improved
connectivity of streets and sidewalks, preserve or create green-space & improve aesthetic qualities of the
environment)
CHR-12 LHD staffing for physical activity promotion (LHD) Capacity How many FTE staff members currently work on physical activity promotion in your department
CHR-13 LHD funding for physical activity promotion (LHD) Capacity How much funding did your department allocate for physical activity promotion during the most recently completed
fiscal year?
CHR-14 Tobacco use mass media campaign volume
(community)
Volume Number of mass media campaigns to reduce tobacco use implemented in the jurisdiction during the previous 12
months, delivered through paid broadcast time and print space, donated time and space, or a combination of both,
consistent with Community Guide criteria.
CHR-15 Smoking restriction policy exposure (community) Reach Proportion of the population that resides in areas covered by policies that prohibit smoking in workplaces and other
public areas.
CHR-16 Smoking restriction policy enforcement (LHD) Volume Number of reported cases of smoking policy violation in the community during the past 12 months; Number of
reported violations investigated; Number of citations of fines issued for violations.
CHR-17 Hypertension education session volume (LHD) Volume Number of counseling individual education SESSIONS that the LHD provided on hypertension, an individualized
counseling / education session = a time-delimited session where one-on-one counseling or health education content
is provided by LHD salaried, hourly, or contract staff directly to the individual receiving the content. “Indicate the
total number of counseling / individual education SESSIONS that the LHD provided on this topic” = the number of
sessions that the LHD provided (e.g., if Tom participated in 6 one-on-one counseling sessions, report 6 sessions).
CHR-18 Asthma prevention activity availability (LHD) Availability Within Asthma which of the following prevention and promotion activates are provided by your LPHA: Educational
Materials; Educational Media; Cultural/Linguistic Specific Materials; Cultural/Linguistic Specific Programs;
Educational/Training Programs; Community Development (i.e. coalitions); Policy Development. Identify who
delivered the service with 3 = LPHA; 2 = Another Agency; 1 = Needed, but not available; 0 = Not applicable.
CHR-19 Blood lead screening volume (LHD) Volume Number of individuals who were screened by the LHD for childhood blood lead. "Screened by the LHD" means that
LHD staff directly provided the screenings, or that the LHD paid a third party to directly provide the screenings.
CHR-20 Breast cancer screening rate (LHD) Reach Proportion of women in LHDs meeting USPSTF screening recommendations
CHR-21 Breast cancer screening volume (LHD) Volume Number of individuals who were screened by the LHD for breast cancer. "Screened by the LHD"= LHD staff directly
provided the screenings, or that the LHD paid a third party to directly provide the screenings.
CHR-22 Breast cancer screening availability (LHD) Availability LPHA is the Primary Provider, LPHA is Safety-Net Provider OR not available.
Primary provider defined as the main or sole provider of breast cancer screening within the jurisdiction.
Safety-net provider defined as doing Breast Cancer Screening on a small-scale and only in situations when it is not
available by the primary provider.
CHR-23 Other cancer screening volume (LHD) Volume Number of individuals who were screened by the LHD for cancer (other than breast, cervical, colon / rectal).
"Screened by the LHD"=LHD staff directly provided the screenings, OR LHD paid a third party to directly provide the
screenings.
CHR-24 Cancer education session volume (LHD) Volume Number of counseling/individual education SESSIONS that the LHD provided on cancer. An individualized
counseling/education session = a time-delimited session where one-on-one counseling or health education content
is provided by LHD salaried, hourly, or contract staff directly to the individual receiving the content. “Indicate the
total number of counseling / individual education SESSIONS that the LHD provided on this topic” = the number of
sessions that the LHD provided (e.g., if Tom participated in 6 one-on-one counseling sessions, report 6 sessions).
CHR-25 Cancer education person volume (LHD) Volume Number of individuals to whom the LHD provided one or more individualized counseling / education sessions on
cancer. An individualized counseling / education session = a time-delimited session where one-on-one counseling or
health education content is provided by LHD salaried, hourly, or contract staff directly to the individual receiving the
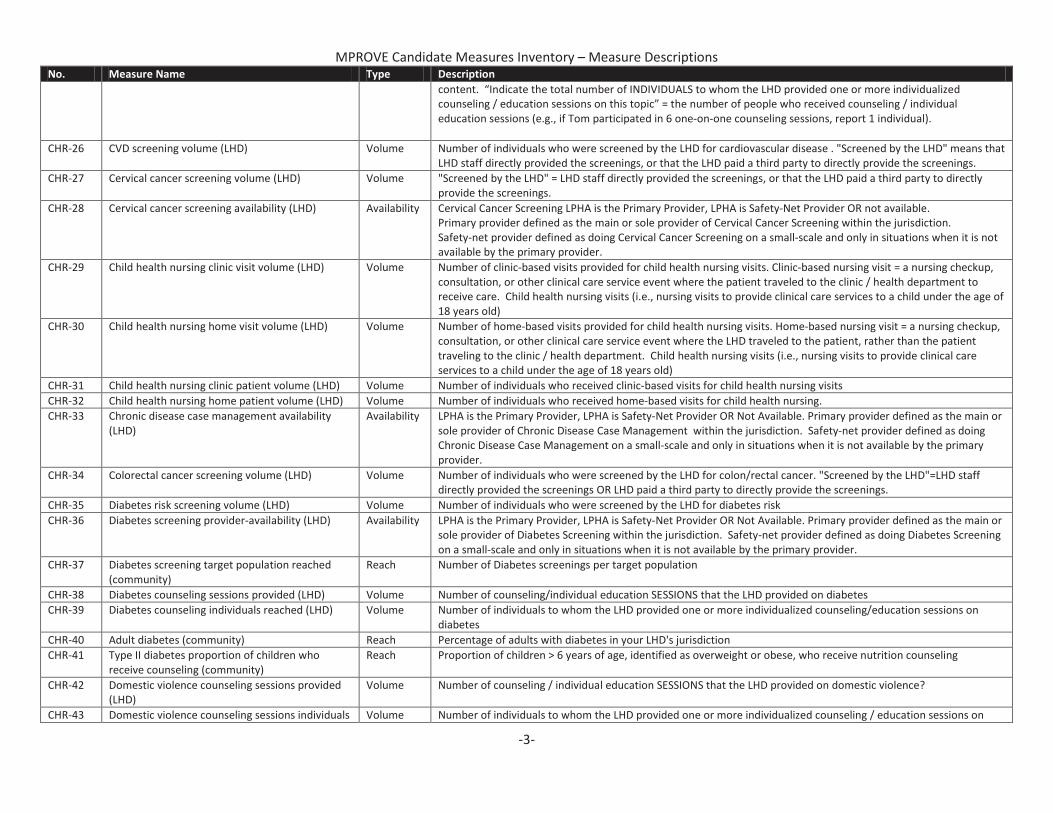
MPROVE Candidate Measures Inventory – Measure Descriptions
-3-
No. Measure Name Type Description
content. “Indicate the total number of INDIVIDUALS to whom the LHD provided one or more individualized
counseling / education sessions on this topic” = the number of people who received counseling / individual
education sessions (e.g., if Tom participated in 6 one-on-one counseling sessions, report 1 individual).
CHR-26 CVD screening volume (LHD) Volume Number of individuals who were screened by the LHD for cardiovascular disease . "Screened by the LHD" means that
LHD staff directly provided the screenings, or that the LHD paid a third party to directly provide the screenings.
CHR-27 Cervical cancer screening volume (LHD) Volume "Screened by the LHD" = LHD staff directly provided the screenings, or that the LHD paid a third party to directly
provide the screenings.
CHR-28 Cervical cancer screening availability (LHD) Availability Cervical Cancer Screening LPHA is the Primary Provider, LPHA is Safety-Net Provider OR not available.
Primary provider defined as the main or sole provider of Cervical Cancer Screening within the jurisdiction.
Safety-net provider defined as doing Cervical Cancer Screening on a small-scale and only in situations when it is not
available by the primary provider.
CHR-29 Child health nursing clinic visit volume (LHD) Volume Number of clinic-based visits provided for child health nursing visits. Clinic-based nursing visit = a nursing checkup,
consultation, or other clinical care service event where the patient traveled to the clinic / health department to
receive care. Child health nursing visits (i.e., nursing visits to provide clinical care services to a child under the age of
18 years old)
CHR-30 Child health nursing home visit volume (LHD) Volume Number of home-based visits provided for child health nursing visits. Home-based nursing visit = a nursing checkup,
consultation, or other clinical care service event where the LHD traveled to the patient, rather than the patient
traveling to the clinic / health department. Child health nursing visits (i.e., nursing visits to provide clinical care
services to a child under the age of 18 years old)
CHR-31 Child health nursing clinic patient volume (LHD) Volume Number of individuals who received clinic-based visits for child health nursing visits
CHR-32 Child health nursing home patient volume (LHD) Volume Number of individuals who received home-based visits for child health nursing.
CHR-33 Chronic disease case management availability
(LHD)
Availability LPHA is the Primary Provider, LPHA is Safety-Net Provider OR Not Available. Primary provider defined as the main or
sole provider of Chronic Disease Case Management within the jurisdiction. Safety-net provider defined as doing
Chronic Disease Case Management on a small-scale and only in situations when it is not available by the primary
provider.
CHR-34 Colorectal cancer screening volume (LHD) Volume Number of individuals who were screened by the LHD for colon/rectal cancer. "Screened by the LHD"=LHD staff
directly provided the screenings OR LHD paid a third party to directly provide the screenings.
CHR-35 Diabetes risk screening volume (LHD) Volume Number of individuals who were screened by the LHD for diabetes risk
CHR-36 Diabetes screening provider-availability (LHD) Availability LPHA is the Primary Provider, LPHA is Safety-Net Provider OR Not Available. Primary provider defined as the main or
sole provider of Diabetes Screening within the jurisdiction. Safety-net provider defined as doing Diabetes Screening
on a small-scale and only in situations when it is not available by the primary provider.
CHR-37 Diabetes screening target population reached
(community)
Reach Number of Diabetes screenings per target population
CHR-38 Diabetes counseling sessions provided (LHD) Volume Number of counseling/individual education SESSIONS that the LHD provided on diabetes
CHR-39 Diabetes counseling individuals reached (LHD) Volume Number of individuals to whom the LHD provided one or more individualized counseling/education sessions on
diabetes
CHR-40 Adult diabetes (community) Reach Percentage of adults with diabetes in your LHD's jurisdiction
CHR-41 Type II diabetes proportion of children who
receive counseling (community)
Reach Proportion of children > 6 years of age, identified as overweight or obese, who receive nutrition counseling
CHR-42 Domestic violence counseling sessions provided
(LHD)
Volume Number of counseling / individual education SESSIONS that the LHD provided on domestic violence?
CHR-43 Domestic violence counseling sessions individuals Volume Number of individuals to whom the LHD provided one or more individualized counseling / education sessions on
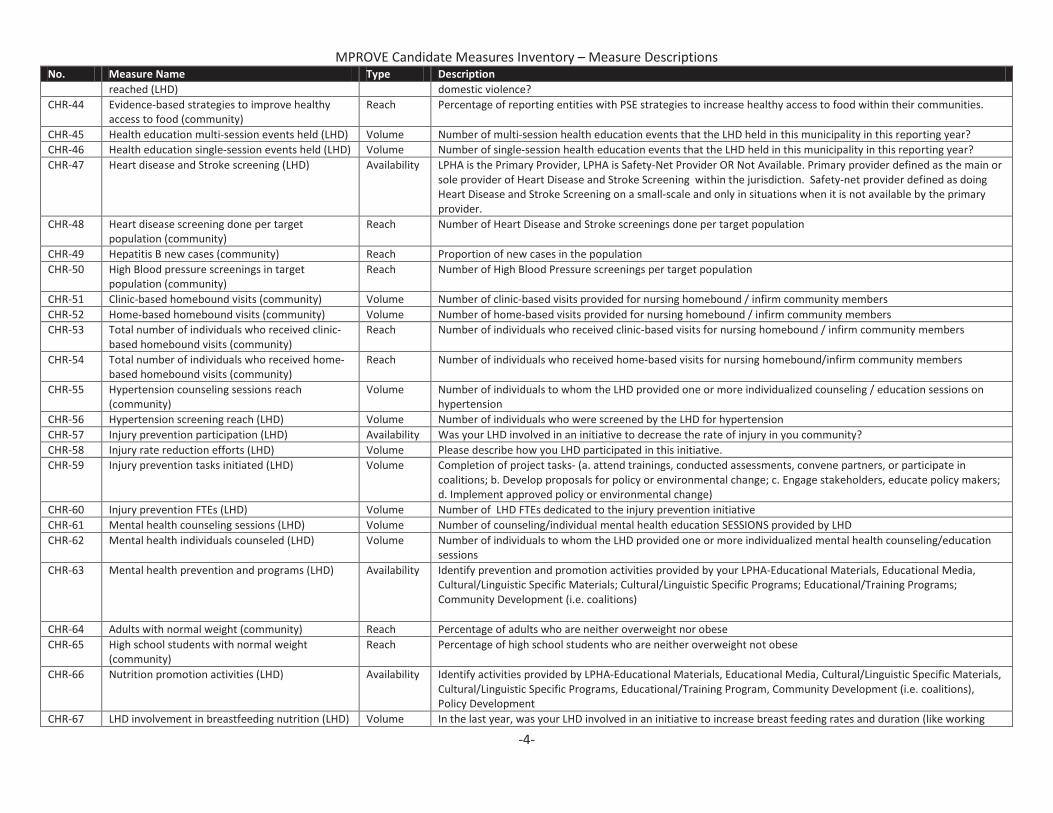
MPROVE Candidate Measures Inventory – Measure Descriptions
-4-
No. Measure Name Type Description
reached (LHD) domestic violence?
CHR-44 Evidence-based strategies to improve healthy
access to food (community)
Reach Percentage of reporting entities with PSE strategies to increase healthy access to food within their communities.
CHR-45 Health education multi-session events held (LHD) Volume Number of multi-session health education events that the LHD held in this municipality in this reporting year?
CHR-46 Health education single-session events held (LHD) Volume Number of single-session health education events that the LHD held in this municipality in this reporting year?
CHR-47 Heart disease and Stroke screening (LHD) Availability LPHA is the Primary Provider, LPHA is Safety-Net Provider OR Not Available. Primary provider defined as the main or
sole provider of Heart Disease and Stroke Screening within the jurisdiction. Safety-net provider defined as doing
Heart Disease and Stroke Screening on a small-scale and only in situations when it is not available by the primary
provider.
CHR-48 Heart disease screening done per target
population (community)
Reach Number of Heart Disease and Stroke screenings done per target population
CHR-49 Hepatitis B new cases (community) Reach Proportion of new cases in the population
CHR-50 High Blood pressure screenings in target
population (community)
Reach Number of High Blood Pressure screenings per target population
CHR-51 Clinic-based homebound visits (community) Volume Number of clinic-based visits provided for nursing homebound / infirm community members
CHR-52 Home-based homebound visits (community) Volume Number of home-based visits provided for nursing homebound / infirm community members
CHR-53 Total number of individuals who received clinic-
based homebound visits (community)
Reach Number of individuals who received clinic-based visits for nursing homebound / infirm community members
CHR-54 Total number of individuals who received home-
based homebound visits (community)
Reach Number of individuals who received home-based visits for nursing homebound/infirm community members
CHR-55 Hypertension counseling sessions reach
(community)
Volume Number of individuals to whom the LHD provided one or more individualized counseling / education sessions on
hypertension
CHR-56 Hypertension screening reach (LHD) Volume Number of individuals who were screened by the LHD for hypertension
CHR-57 Injury prevention participation (LHD) Availability Was your LHD involved in an initiative to decrease the rate of injury in you community?
CHR-58 Injury rate reduction efforts (LHD) Volume Please describe how you LHD participated in this initiative.
CHR-59 Injury prevention tasks initiated (LHD) Volume Completion of project tasks- (a. attend trainings, conducted assessments, convene partners, or participate in
coalitions; b. Develop proposals for policy or environmental change; c. Engage stakeholders, educate policy makers;
d. Implement approved policy or environmental change)
CHR-60 Injury prevention FTEs (LHD) Volume Number of LHD FTEs dedicated to the injury prevention initiative
CHR-61 Mental health counseling sessions (LHD) Volume Number of counseling/individual mental health education SESSIONS provided by LHD
CHR-62 Mental health individuals counseled (LHD) Volume Number of individuals to whom the LHD provided one or more individualized mental health counseling/education
sessions
CHR-63 Mental health prevention and programs (LHD) Availability Identify prevention and promotion activities provided by your LPHA-Educational Materials, Educational Media,
Cultural/Linguistic Specific Materials; Cultural/Linguistic Specific Programs; Educational/Training Programs;
Community Development (i.e. coalitions)
CHR-64 Adults with normal weight (community) Reach Percentage of adults who are neither overweight nor obese
CHR-65 High school students with normal weight
(community)
Reach Percentage of high school students who are neither overweight not obese
CHR-66 Nutrition promotion activities (LHD) Availability Identify activities provided by LPHA-Educational Materials, Educational Media, Cultural/Linguistic Specific Materials,
Cultural/Linguistic Specific Programs, Educational/Training Program, Community Development (i.e. coalitions),
Policy Development
CHR-67 LHD involvement in breastfeeding nutrition (LHD) Volume In the last year, was your LHD involved in an initiative to increase breast feeding rates and duration (like working
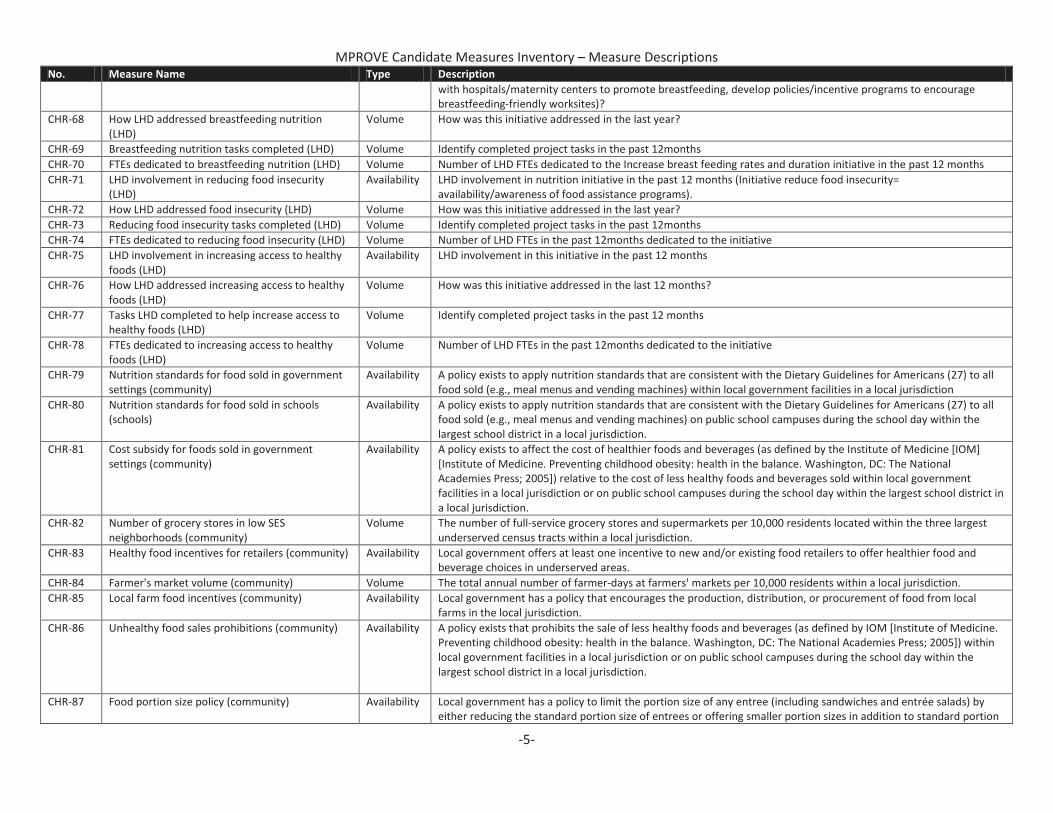
MPROVE Candidate Measures Inventory – Measure Descriptions
-5-
No. Measure Name Type Description
with hospitals/maternity centers to promote breastfeeding, develop policies/incentive programs to encourage
breastfeeding-friendly worksites)?
CHR-68 How LHD addressed breastfeeding nutrition
(LHD)
Volume How was this initiative addressed in the last year?
CHR-69 Breastfeeding nutrition tasks completed (LHD) Volume Identify completed project tasks in the past 12months
CHR-70 FTEs dedicated to breastfeeding nutrition (LHD) Volume Number of LHD FTEs dedicated to the Increase breast feeding rates and duration initiative in the past 12 months
CHR-71 LHD involvement in reducing food insecurity
(LHD)
Availability LHD involvement in nutrition initiative in the past 12 months (Initiative reduce food insecurity=
availability/awareness of food assistance programs).
CHR-72 How LHD addressed food insecurity (LHD) Volume How was this initiative addressed in the last year?
CHR-73 Reducing food insecurity tasks completed (LHD) Volume Identify completed project tasks in the past 12months
CHR-74 FTEs dedicated to reducing food insecurity (LHD) Volume Number of LHD FTEs in the past 12months dedicated to the initiative
CHR-75 LHD involvement in increasing access to healthy
foods (LHD)
Availability LHD involvement in this initiative in the past 12 months
CHR-76 How LHD addressed increasing access to healthy
foods (LHD)
Volume How was this initiative addressed in the last 12 months?
CHR-77 Tasks LHD completed to help increase access to
healthy foods (LHD)
Volume Identify completed project tasks in the past 12 months
CHR-78 FTEs dedicated to increasing access to healthy
foods (LHD)
Volume Number of LHD FTEs in the past 12months dedicated to the initiative
CHR-79 Nutrition standards for food sold in government
settings (community)
Availability A policy exists to apply nutrition standards that are consistent with the Dietary Guidelines for Americans (27) to all
food sold (e.g., meal menus and vending machines) within local government facilities in a local jurisdiction
CHR-80 Nutrition standards for food sold in schools
(schools)
Availability A policy exists to apply nutrition standards that are consistent with the Dietary Guidelines for Americans (27) to all
food sold (e.g., meal menus and vending machines) on public school campuses during the school day within the
largest school district in a local jurisdiction.
CHR-81 Cost subsidy for foods sold in government
settings (community)
Availability A policy exists to affect the cost of healthier foods and beverages (as defined by the Institute of Medicine [IOM]
[Institute of Medicine. Preventing childhood obesity: health in the balance. Washington, DC: The National
Academies Press; 2005]) relative to the cost of less healthy foods and beverages sold within local government
facilities in a local jurisdiction or on public school campuses during the school day within the largest school district in
a local jurisdiction.
CHR-82 Number of grocery stores in low SES
neighborhoods (community)
Volume The number of full-service grocery stores and supermarkets per 10,000 residents located within the three largest
underserved census tracts within a local jurisdiction.
CHR-83 Healthy food incentives for retailers (community) Availability Local government offers at least one incentive to new and/or existing food retailers to offer healthier food and
beverage choices in underserved areas.
CHR-84 Farmer's market volume (community) Volume The total annual number of farmer-days at farmers' markets per 10,000 residents within a local jurisdiction.
CHR-85 Local farm food incentives (community) Availability Local government has a policy that encourages the production, distribution, or procurement of food from local
farms in the local jurisdiction.
CHR-86 Unhealthy food sales prohibitions (community) Availability A policy exists that prohibits the sale of less healthy foods and beverages (as defined by IOM [Institute of Medicine.
Preventing childhood obesity: health in the balance. Washington, DC: The National Academies Press; 2005]) within
local government facilities in a local jurisdiction or on public school campuses during the school day within the
largest school district in a local jurisdiction.
CHR-87 Food portion size policy (community) Availability Local government has a policy to limit the portion size of any entree (including sandwiches and entrée salads) by
either reducing the standard portion size of entrees or offering smaller portion sizes in addition to standard portion
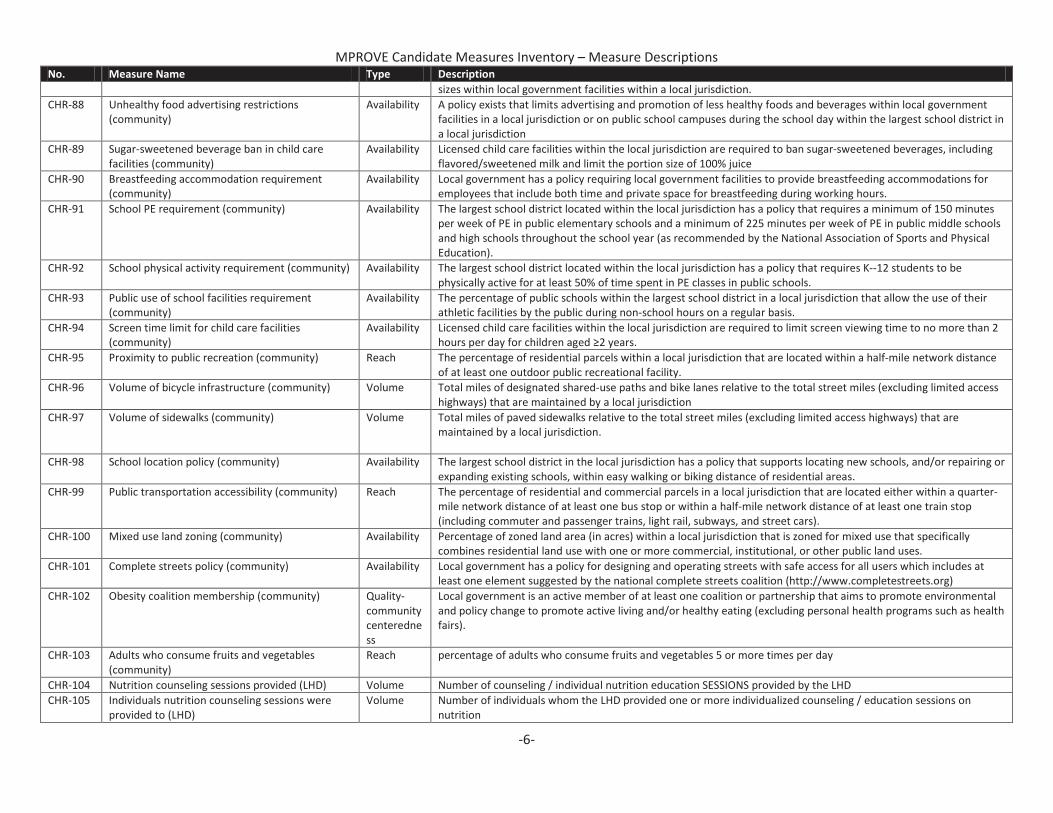
MPROVE Candidate Measures Inventory – Measure Descriptions
-6-
No. Measure Name Type Description
sizes within local government facilities within a local jurisdiction.
CHR-88 Unhealthy food advertising restrictions
(community)
Availability A policy exists that limits advertising and promotion of less healthy foods and beverages within local government
facilities in a local jurisdiction or on public school campuses during the school day within the largest school district in
a local jurisdiction
CHR-89 Sugar-sweetened beverage ban in child care
facilities (community)
Availability Licensed child care facilities within the local jurisdiction are required to ban sugar-sweetened beverages, including
flavored/sweetened milk and limit the portion size of 100% juice
CHR-90 Breastfeeding accommodation requirement
(community)
Availability Local government has a policy requiring local government facilities to provide breastfeeding accommodations for
employees that include both time and private space for breastfeeding during working hours.
CHR-91 School PE requirement (community) Availability The largest school district located within the local jurisdiction has a policy that requires a minimum of 150 minutes
per week of PE in public elementary schools and a minimum of 225 minutes per week of PE in public middle schools
and high schools throughout the school year (as recommended by the National Association of Sports and Physical
Education).
CHR-92 School physical activity requirement (community) Availability The largest school district located within the local jurisdiction has a policy that requires K--12 students to be
physically active for at least 50% of time spent in PE classes in public schools.
CHR-93 Public use of school facilities requirement
(community)
Availability The percentage of public schools within the largest school district in a local jurisdiction that allow the use of their
athletic facilities by the public during non-school hours on a regular basis.
CHR-94 Screen time limit for child care facilities
(community)
Availability Licensed child care facilities within the local jurisdiction are required to limit screen viewing time to no more than 2
hours per day for children age
CHR-95 Proximity to public recreation (community) Reach The percentage of residential parcels within a local jurisdiction that are located within a half-mile network distance
of at least one outdoor public recreational facility.
CHR-96 Volume of bicycle infrastructure (community) Volume Total miles of designated shared-use paths and bike lanes relative to the total street miles (excluding limited access
highways) that are maintained by a local jurisdiction
CHR-97 Volume of sidewalks (community) Volume Total miles of paved sidewalks relative to the total street miles (excluding limited access highways) that are
maintained by a local jurisdiction.
CHR-98 School location policy (community) Availability The largest school district in the local jurisdiction has a policy that supports locating new schools, and/or repairing or
expanding existing schools, within easy walking or biking distance of residential areas.
CHR-99 Public transportation accessibility (community) Reach The percentage of residential and commercial parcels in a local jurisdiction that are located either within a quarter-
mile network distance of at least one bus stop or within a half-mile network distance of at least one train stop
(including commuter and passenger trains, light rail, subways, and street cars).
CHR-100 Mixed use land zoning (community) Availability Percentage of zoned land area (in acres) within a local jurisdiction that is zoned for mixed use that specifically
combines residential land use with one or more commercial, institutional, or other public land uses.
CHR-101 Complete streets policy (community) Availability Local government has a policy for designing and operating streets with safe access for all users which includes at
least one element suggested by the national complete streets coalition (http://www.completestreets.org)
CHR-102 Obesity coalition membership (community) Quality-
community
centeredne
ss
Local government is an active member of at least one coalition or partnership that aims to promote environmental
and policy change to promote active living and/or healthy eating (excluding personal health programs such as health
fairs).
CHR-103 Adults who consume fruits and vegetables
(community)
Reach percentage of adults who consume fruits and vegetables 5 or more times per day
CHR-104 Nutrition counseling sessions provided (LHD) Volume Number of counseling / individual nutrition education SESSIONS provided by the LHD
CHR-105 Individuals nutrition counseling sessions were
provided to (LHD)
Volume Number of individuals whom the LHD provided one or more individualized counseling / education sessions on
nutrition
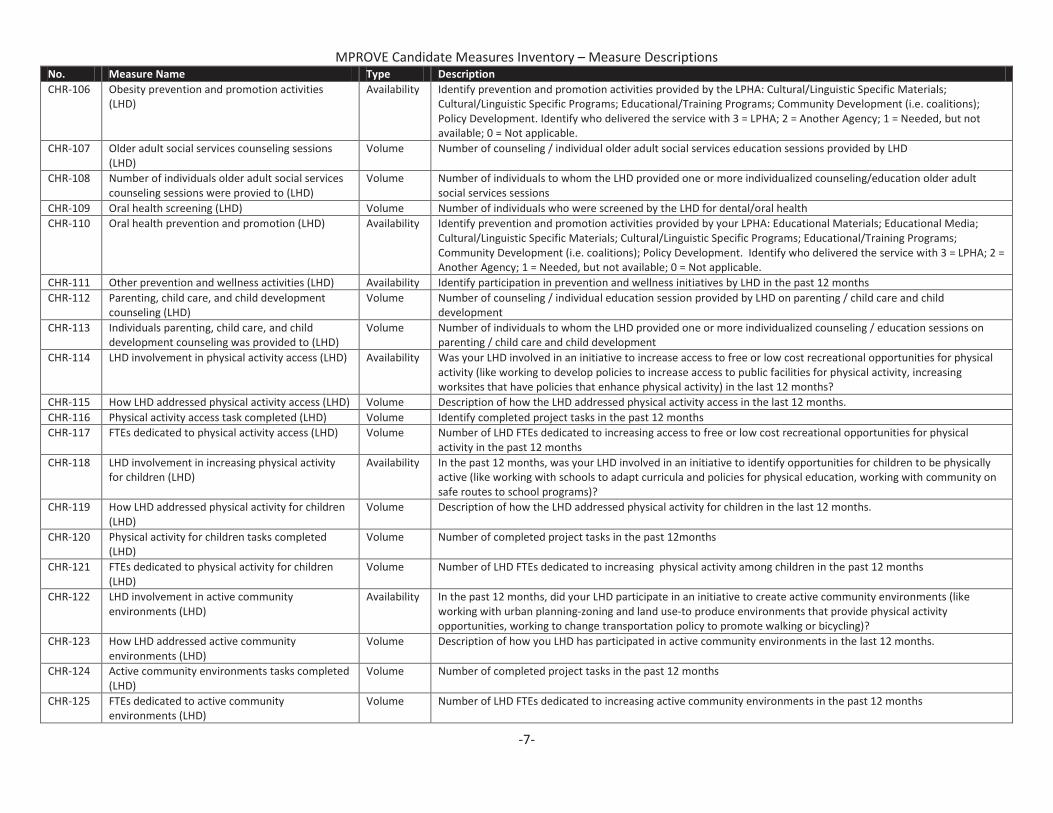
MPROVE Candidate Measures Inventory – Measure Descriptions
-7-
No. Measure Name Type Description
CHR-106 Obesity prevention and promotion activities
(LHD)
Availability Identify prevention and promotion activities provided by the LPHA: Cultural/Linguistic Specific Materials;
Cultural/Linguistic Specific Programs; Educational/Training Programs; Community Development (i.e. coalitions);
Policy Development. Identify who delivered the service with 3 = LPHA; 2 = Another Agency; 1 = Needed, but not
available; 0 = Not applicable.
CHR-107 Older adult social services counseling sessions
(LHD)
Volume Number of counseling / individual older adult social services education sessions provided by LHD
CHR-108 Number of individuals older adult social services
counseling sessions were provied to (LHD)
Volume Number of individuals to whom the LHD provided one or more individualized counseling/education older adult
social services sessions
CHR-109 Oral health screening (LHD) Volume Number of individuals who were screened by the LHD for dental/oral health
CHR-110 Oral health prevention and promotion (LHD) Availability Identify prevention and promotion activities provided by your LPHA: Educational Materials; Educational Media;
Cultural/Linguistic Specific Materials; Cultural/Linguistic Specific Programs; Educational/Training Programs;
Community Development (i.e. coalitions); Policy Development. Identify who delivered the service with 3 = LPHA; 2 =
Another Agency; 1 = Needed, but not available; 0 = Not applicable.
CHR-111 Other prevention and wellness activities (LHD) Availability Identify participation in prevention and wellness initiatives by LHD in the past 12 months
CHR-112 Parenting, child care, and child development
counseling (LHD)
Volume Number of counseling / individual education session provided by LHD on parenting / child care and child
development
CHR-113 Individuals parenting, child care, and child
development counseling was provided to (LHD)
Volume Number of individuals to whom the LHD provided one or more individualized counseling / education sessions on
parenting / child care and child development
CHR-114 LHD involvement in physical activity access (LHD) Availability Was your LHD involved in an initiative to increase access to free or low cost recreational opportunities for physical
activity (like working to develop policies to increase access to public facilities for physical activity, increasing
worksites that have policies that enhance physical activity) in the last 12 months?
CHR-115 How LHD addressed physical activity access (LHD) Volume Description of how the LHD addressed physical activity access in the last 12 months.
CHR-116 Physical activity access task completed (LHD) Volume Identify completed project tasks in the past 12 months
CHR-117 FTEs dedicated to physical activity access (LHD) Volume Number of LHD FTEs dedicated to increasing access to free or low cost recreational opportunities for physical
activity in the past 12 months
CHR-118 LHD involvement in increasing physical activity
for children (LHD)
Availability In the past 12 months, was your LHD involved in an initiative to identify opportunities for children to be physically
active (like working with schools to adapt curricula and policies for physical education, working with community on
safe routes to school programs)?
CHR-119 How LHD addressed physical activity for children
(LHD)
Volume Description of how the LHD addressed physical activity for children in the last 12 months.
CHR-120 Physical activity for children tasks completed
(LHD)
Volume Number of completed project tasks in the past 12months
CHR-121 FTEs dedicated to physical activity for children
(LHD)
Volume Number of LHD FTEs dedicated to increasing physical activity among children in the past 12 months
CHR-122 LHD involvement in active community
environments (LHD)
Availability In the past 12 months, did your LHD participate in an initiative to create active community environments (like
working with urban planning-zoning and land use-to produce environments that provide physical activity
opportunities, working to change transportation policy to promote walking or bicycling)?
CHR-123 How LHD addressed active community
environments (LHD)
Volume Description of how you LHD has participated in active community environments in the last 12 months.
CHR-124 Active community environments tasks completed
(LHD)
Volume Number of completed project tasks in the past 12 months
CHR-125 FTEs dedicated to active community
environments (LHD)
Volume Number of LHD FTEs dedicated to increasing active community environments in the past 12 months
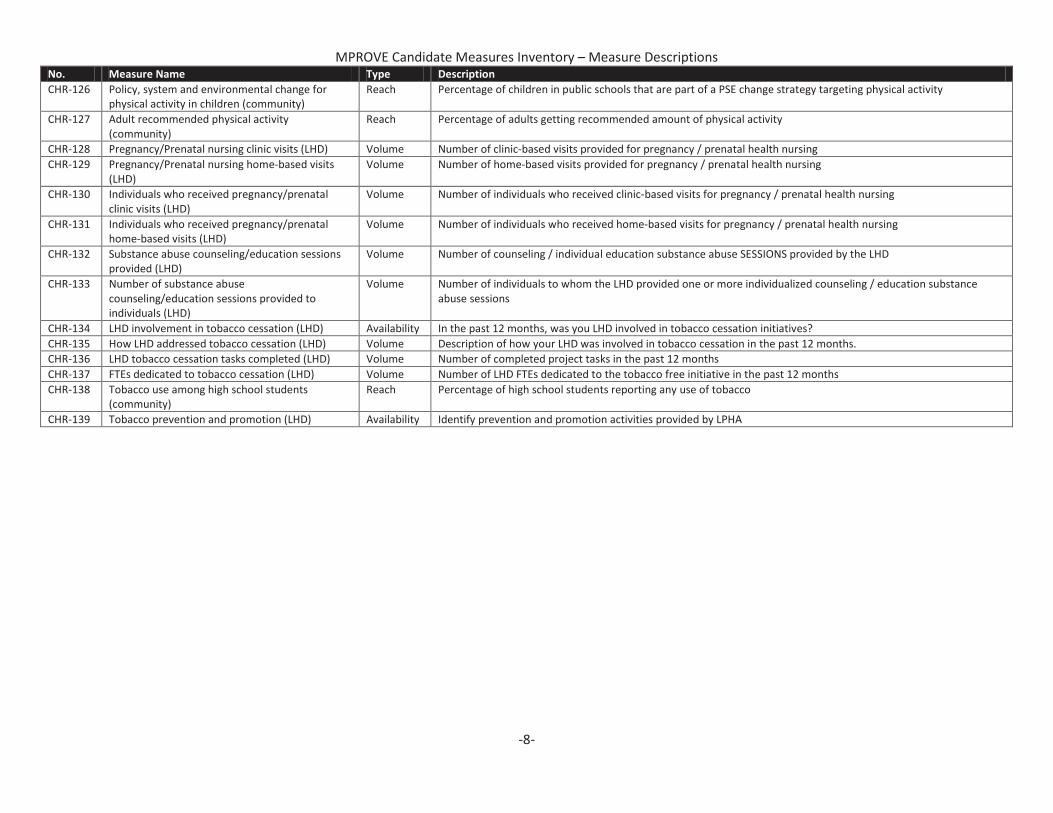
MPROVE Candidate Measures Inventory – Measure Descriptions
-8-
No. Measure Name Type Description
CHR-126 Policy, system and environmental change for
physical activity in children (community)
Reach Percentage of children in public schools that are part of a PSE change strategy targeting physical activity
CHR-127 Adult recommended physical activity
(community)
Reach Percentage of adults getting recommended amount of physical activity
CHR-128 Pregnancy/Prenatal nursing clinic visits (LHD) Volume Number of clinic-based visits provided for pregnancy / prenatal health nursing
CHR-129 Pregnancy/Prenatal nursing home-based visits
(LHD)
Volume Number of home-based visits provided for pregnancy / prenatal health nursing
CHR-130 Individuals who received pregnancy/prenatal
clinic visits (LHD)
Volume Number of individuals who received clinic-based visits for pregnancy / prenatal health nursing
CHR-131 Individuals who received pregnancy/prenatal
home-based visits (LHD)
Volume Number of individuals who received home-based visits for pregnancy / prenatal health nursing
CHR-132 Substance abuse counseling/education sessions
provided (LHD)
Volume Number of counseling / individual education substance abuse SESSIONS provided by the LHD
CHR-133 Number of substance abuse
counseling/education sessions provided to
individuals (LHD)
Volume Number of individuals to whom the LHD provided one or more individualized counseling / education substance
abuse sessions
CHR-134 LHD involvement in tobacco cessation (LHD) Availability In the past 12 months, was you LHD involved in tobacco cessation initiatives?
CHR-135 How LHD addressed tobacco cessation (LHD) Volume Description of how your LHD was involved in tobacco cessation in the past 12 months.
CHR-136 LHD tobacco cessation tasks completed (LHD) Volume Number of completed project tasks in the past 12 months
CHR-137 FTEs dedicated to tobacco cessation (LHD) Volume Number of LHD FTEs dedicated to the tobacco free initiative in the past 12 months
CHR-138 Tobacco use among high school students
(community)
Reach Percentage of high school students reporting any use of tobacco
CHR-139 Tobacco prevention and promotion (LHD) Availability Identify prevention and promotion activities provided by LPHA
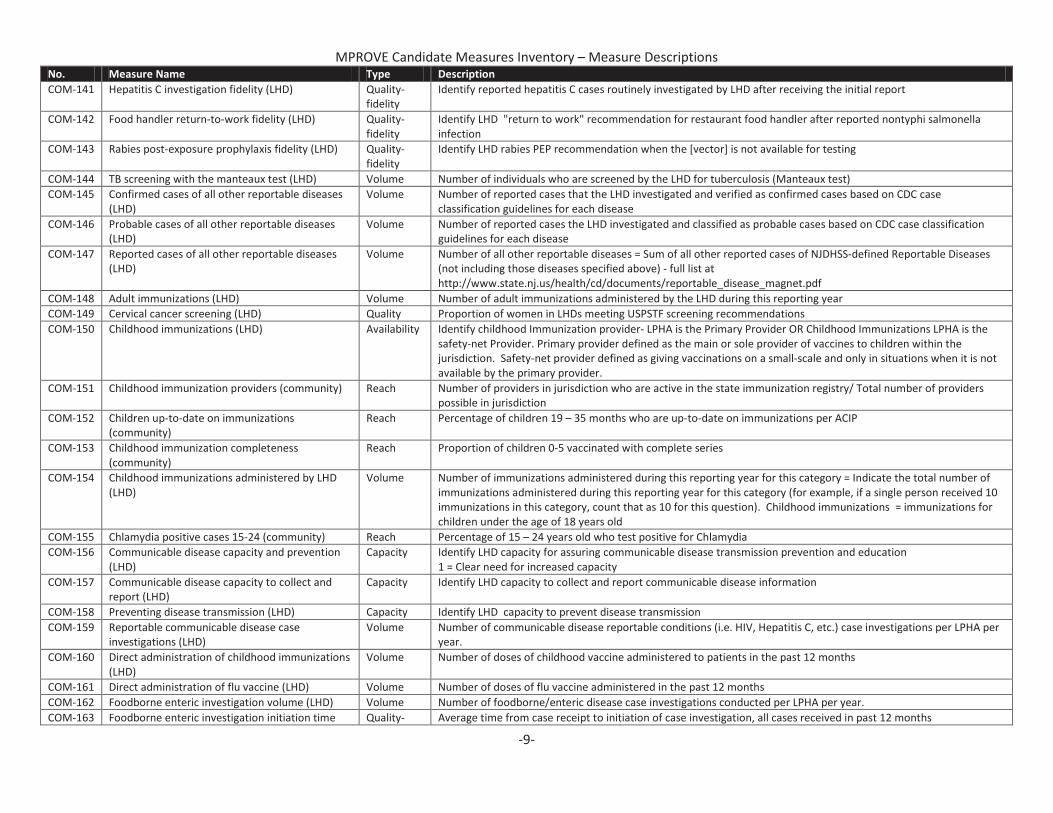
MPROVE Candidate Measures Inventory – Measure Descriptions
-9-
No. Measure Name Type Description
COM-141 Hepatitis C investigation fidelity (LHD) Quality-
fidelity
Identify reported hepatitis C cases routinely investigated by LHD after receiving the initial report
COM-142 Food handler return-to-work fidelity (LHD) Quality-
fidelity
Identify LHD "return to work" recommendation for restaurant food handler after reported nontyphi salmonella
infection
COM-143 Rabies post-exposure prophylaxis fidelity (LHD) Quality-
fidelity
Identify LHD rabies PEP recommendation when the [vector] is not available for testing
COM-144 TB screening with the manteaux test (LHD) Volume Number of individuals who are screened by the LHD for tuberculosis (Manteaux test)
COM-145 Confirmed cases of all other reportable diseases
(LHD)
Volume Number of reported cases that the LHD investigated and verified as confirmed cases based on CDC case
classification guidelines for each disease
COM-146 Probable cases of all other reportable diseases
(LHD)
Volume Number of reported cases the LHD investigated and classified as probable cases based on CDC case classification
guidelines for each disease
COM-147 Reported cases of all other reportable diseases
(LHD)
Volume Number of all other reportable diseases = Sum of all other reported cases of NJDHSS-defined Reportable Diseases
(not including those diseases specified above) - full list at
http://www.state.nj.us/health/cd/documents/reportable_disease_magnet.pdf
COM-148 Adult immunizations (LHD) Volume Number of adult immunizations administered by the LHD during this reporting year
COM-149 Cervical cancer screening (LHD) Quality Proportion of women in LHDs meeting USPSTF screening recommendations
COM-150 Childhood immunizations (LHD) Availability Identify childhood Immunization provider- LPHA is the Primary Provider OR Childhood Immunizations LPHA is the
safety-net Provider. Primary provider defined as the main or sole provider of vaccines to children within the
jurisdiction. Safety-net provider defined as giving vaccinations on a small-scale and only in situations when it is not
available by the primary provider.
COM-151 Childhood immunization providers (community) Reach Number of providers in jurisdiction who are active in the state immunization registry/ Total number of providers
possible in jurisdiction
COM-152 Children up-to-date on immunizations
(community)
Reach Percentage of children 19 – 35 months who are up-to-date on immunizations per ACIP
COM-153 Childhood immunization completeness
(community)
Reach Proportion of children 0-5 vaccinated with complete series
COM-154 Childhood immunizations administered by LHD
(LHD)
Volume Number of immunizations administered during this reporting year for this category = Indicate the total number of
immunizations administered during this reporting year for this category (for example, if a single person received 10
immunizations in this category, count that as 10 for this question). Childhood immunizations = immunizations for
children under the age of 18 years old
COM-155 Chlamydia positive cases 15-24 (community) Reach Percentage of 15 – 24 years old who test positive for Chlamydia
COM-156 Communicable disease capacity and prevention
(LHD)
Capacity Identify LHD capacity for assuring communicable disease transmission prevention and education
1 = Clear need for increased capacity
COM-157 Communicable disease capacity to collect and
report (LHD)
Capacity Identify LHD capacity to collect and report communicable disease information
COM-158 Preventing disease transmission (LHD) Capacity Identify LHD capacity to prevent disease transmission
COM-159 Reportable communicable disease case
investigations (LHD)
Volume Number of communicable disease reportable conditions (i.e. HIV, Hepatitis C, etc.) case investigations per LPHA per
year.
COM-160 Direct administration of childhood immunizations
(LHD)
Volume Number of doses of childhood vaccine administered to patients in the past 12 months
COM-161 Direct administration of flu vaccine (LHD) Volume Number of doses of flu vaccine administered in the past 12 months
COM-162 Foodborne enteric investigation volume (LHD) Volume Number of foodborne/enteric disease case investigations conducted per LPHA per year.
COM-163 Foodborne enteric investigation initiation time Quality- Average time from case receipt to initiation of case investigation, all cases received in past 12 months
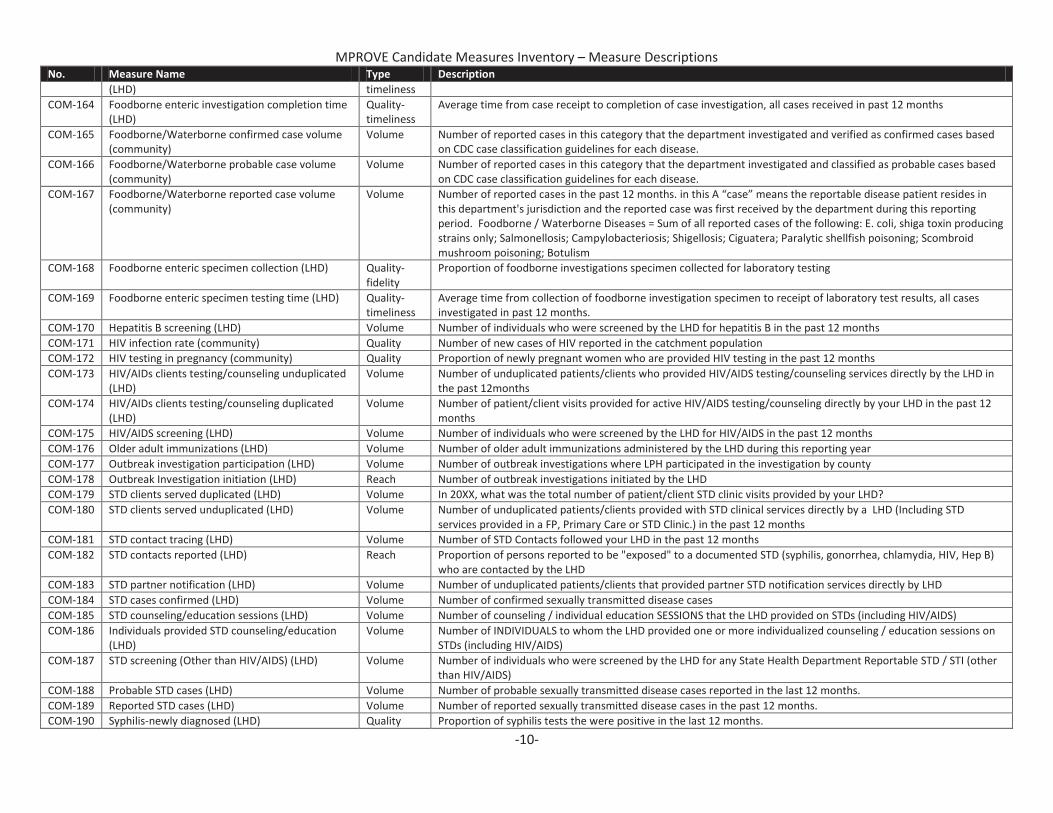
MPROVE Candidate Measures Inventory – Measure Descriptions
-10-
No. Measure Name Type Description
(LHD) timeliness
COM-164 Foodborne enteric investigation completion time
(LHD)
Quality-
timeliness
Average time from case receipt to completion of case investigation, all cases received in past 12 months
COM-165 Foodborne/Waterborne confirmed case volume
(community)
Volume Number of reported cases in this category that the department investigated and verified as confirmed cases based
on CDC case classification guidelines for each disease.
COM-166 Foodborne/Waterborne probable case volume
(community)
Volume Number of reported cases in this category that the department investigated and classified as probable cases based
on CDC case classification guidelines for each disease.
COM-167 Foodborne/Waterborne reported case volume
(community)
Volume Number of reported cases in the past 12 months. in this A “case” means the reportable disease patient resides in
this department's jurisdiction and the reported case was first received by the department during this reporting
period. Foodborne / Waterborne Diseases = Sum of all reported cases of the following: E. coli, shiga toxin producing
strains only; Salmonellosis; Campylobacteriosis; Shigellosis; Ciguatera; Paralytic shellfish poisoning; Scombroid
mushroom poisoning; Botulism
COM-168 Foodborne enteric specimen collection (LHD) Quality-
fidelity
Proportion of foodborne investigations specimen collected for laboratory testing
COM-169 Foodborne enteric specimen testing time (LHD) Quality-
timeliness
Average time from collection of foodborne investigation specimen to receipt of laboratory test results, all cases
investigated in past 12 months.
COM-170 Hepatitis B screening (LHD) Volume Number of individuals who were screened by the LHD for hepatitis B in the past 12 months
COM-171 HIV infection rate (community) Quality Number of new cases of HIV reported in the catchment population
COM-172 HIV testing in pregnancy (community) Quality Proportion of newly pregnant women who are provided HIV testing in the past 12 months
COM-173 HIV/AIDs clients testing/counseling unduplicated
(LHD)
Volume Number of unduplicated patients/clients who provided HIV/AIDS testing/counseling services directly by the LHD in
the past 12months
COM-174 HIV/AIDs clients testing/counseling duplicated
(LHD)
Volume Number of patient/client visits provided for active HIV/AIDS testing/counseling directly by your LHD in the past 12
months
COM-175 HIV/AIDS screening (LHD) Volume Number of individuals who were screened by the LHD for HIV/AIDS in the past 12 months
COM-176 Older adult immunizations (LHD) Volume Number of older adult immunizations administered by the LHD during this reporting year
COM-177 Outbreak investigation participation (LHD) Volume Number of outbreak investigations where LPH participated in the investigation by county
COM-178 Outbreak Investigation initiation (LHD) Reach Number of outbreak investigations initiated by the LHD
COM-179 STD clients served duplicated (LHD) Volume In 20XX, what was the total number of patient/client STD clinic visits provided by your LHD?
COM-180 STD clients served unduplicated (LHD) Volume Number of unduplicated patients/clients provided with STD clinical services directly by a LHD (Including STD
services provided in a FP, Primary Care or STD Clinic.) in the past 12 months
COM-181 STD contact tracing (LHD) Volume Number of STD Contacts followed your LHD in the past 12 months
COM-182 STD contacts reported (LHD) Reach Proportion of persons reported to be "exposed" to a documented STD (syphilis, gonorrhea, chlamydia, HIV, Hep B)
who are contacted by the LHD
COM-183 STD partner notification (LHD) Volume Number of unduplicated patients/clients that provided partner STD notification services directly by LHD
COM-184 STD cases confirmed (LHD) Volume Number of confirmed sexually transmitted disease cases
COM-185 STD counseling/education sessions (LHD) Volume Number of counseling / individual education SESSIONS that the LHD provided on STDs (including HIV/AIDS)
COM-186 Individuals provided STD counseling/education
(LHD)
Volume Number of INDIVIDUALS to whom the LHD provided one or more individualized counseling / education sessions on
STDs (including HIV/AIDS)
COM-187 STD screening (Other than HIV/AIDS) (LHD) Volume Number of individuals who were screened by the LHD for any State Health Department Reportable STD / STI (other
than HIV/AIDS)
COM-188 Probable STD cases (LHD) Volume Number of probable sexually transmitted disease cases reported in the last 12 months.
COM-189 Reported STD cases (LHD) Volume Number of reported sexually transmitted disease cases in the past 12 months.
COM-190 Syphilis-newly diagnosed (LHD) Quality Proportion of syphilis tests the were positive in the last 12 months.
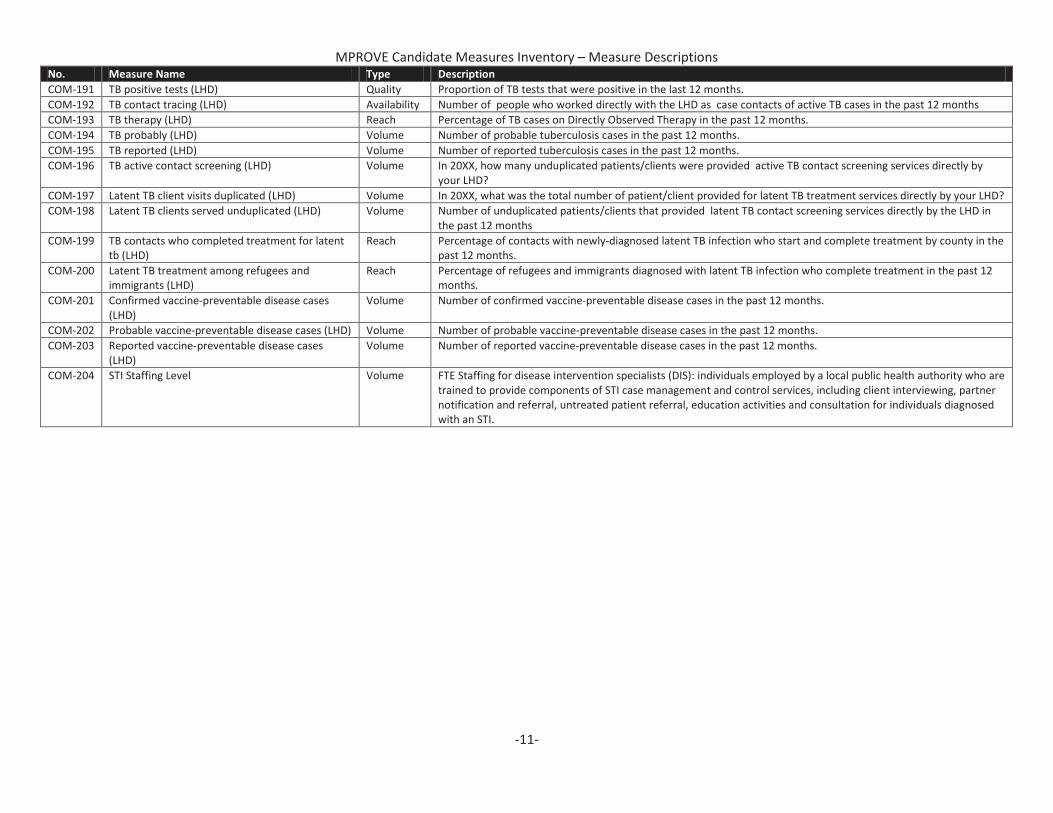
MPROVE Candidate Measures Inventory – Measure Descriptions
-11-
No. Measure Name Type Description
COM-191 TB positive tests (LHD) Quality Proportion of TB tests that were positive in the last 12 months.
COM-192 TB contact tracing (LHD) Availability Number of people who worked directly with the LHD as case contacts of active TB cases in the past 12 months
COM-193 TB therapy (LHD) Reach Percentage of TB cases on Directly Observed Therapy in the past 12 months.
COM-194 TB probably (LHD) Volume Number of probable tuberculosis cases in the past 12 months.
COM-195 TB reported (LHD) Volume Number of reported tuberculosis cases in the past 12 months.
COM-196 TB active contact screening (LHD) Volume In 20XX, how many unduplicated patients/clients were provided active TB contact screening services directly by
your LHD?
COM-197 Latent TB client visits duplicated (LHD) Volume In 20XX, what was the total number of patient/client provided for latent TB treatment services directly by your LHD?
COM-198 Latent TB clients served unduplicated (LHD) Volume Number of unduplicated patients/clients that provided latent TB contact screening services directly by the LHD in
the past 12 months
COM-199 TB contacts who completed treatment for latent
tb (LHD)
Reach Percentage of contacts with newly-diagnosed latent TB infection who start and complete treatment by county in the
past 12 months.
COM-200 Latent TB treatment among refugees and
immigrants (LHD)
Reach Percentage of refugees and immigrants diagnosed with latent TB infection who complete treatment in the past 12
months.
COM-201 Confirmed vaccine-preventable disease cases
(LHD)
Volume Number of confirmed vaccine-preventable disease cases in the past 12 months.
COM-202 Probable vaccine-preventable disease cases (LHD) Volume Number of probable vaccine-preventable disease cases in the past 12 months.
COM-203 Reported vaccine-preventable disease cases
(LHD)
Volume Number of reported vaccine-preventable disease cases in the past 12 months.
COM-204 STI Staffing Level Volume FTE Staffing for disease intervention specialists (DIS): individuals employed by a local public health authority who are
trained to provide components of STI case management and control services, including client interviewing, partner
notification and referral, untreated patient referral, education activities and consultation for individuals diagnosed
with an STI.
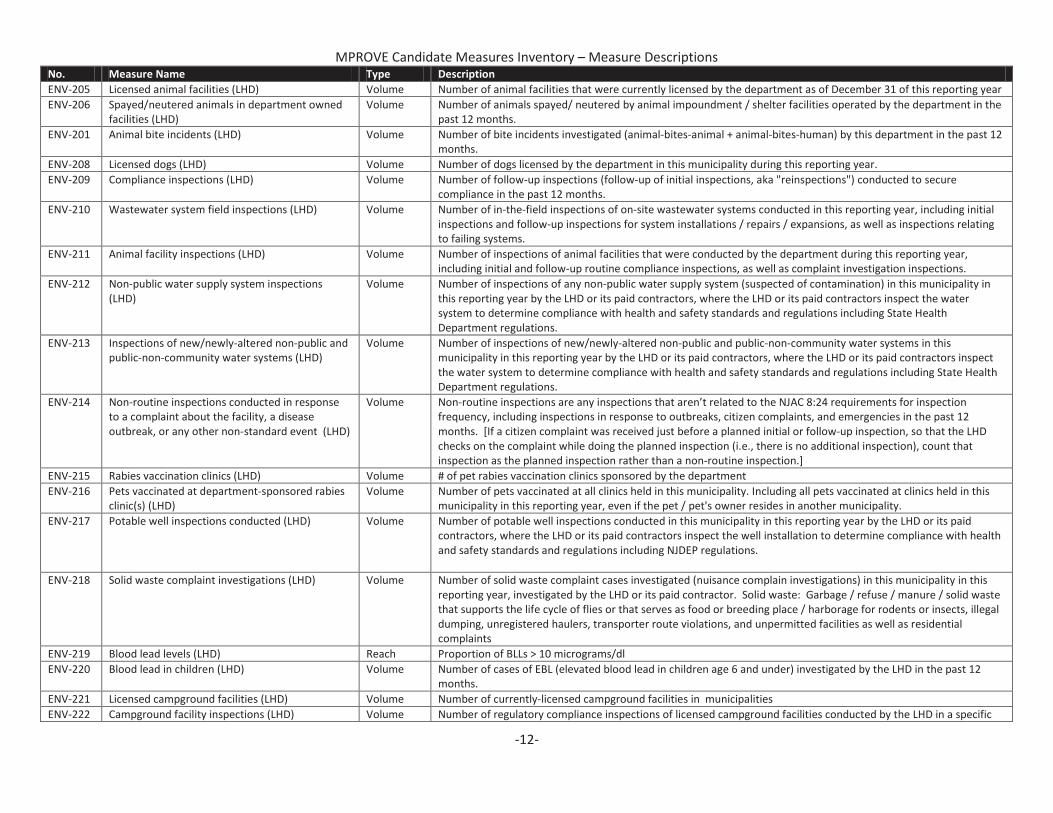
MPROVE Candidate Measures Inventory – Measure Descriptions
-12-
No. Measure Name Type Description
ENV-205 Licensed animal facilities (LHD) Volume Number of animal facilities that were currently licensed by the department as of December 31 of this reporting year
ENV-206 Spayed/neutered animals in department owned
facilities (LHD)
Volume Number of animals spayed/ neutered by animal impoundment / shelter facilities operated by the department in the
past 12 months.
ENV-201 Animal bite incidents (LHD) Volume Number of bite incidents investigated (animal-bites-animal + animal-bites-human) by this department in the past 12
months.
ENV-208 Licensed dogs (LHD) Volume Number of dogs licensed by the department in this municipality during this reporting year.
ENV-209 Compliance inspections (LHD) Volume Number of follow-up inspections (follow-up of initial inspections, aka "reinspections") conducted to secure
compliance in the past 12 months.
ENV-210 Wastewater system field inspections (LHD) Volume Number of in-the-field inspections of on-site wastewater systems conducted in this reporting year, including initial
inspections and follow-up inspections for system installations / repairs / expansions, as well as inspections relating
to failing systems.
ENV-211 Animal facility inspections (LHD) Volume Number of inspections of animal facilities that were conducted by the department during this reporting year,
including initial and follow-up routine compliance inspections, as well as complaint investigation inspections.
ENV-212 Non-public water supply system inspections
(LHD)
Volume Number of inspections of any non-public water supply system (suspected of contamination) in this municipality in
this reporting year by the LHD or its paid contractors, where the LHD or its paid contractors inspect the water
system to determine compliance with health and safety standards and regulations including State Health
Department regulations.
ENV-213 Inspections of new/newly-altered non-public and
public-non-community water systems (LHD)
Volume Number of inspections of new/newly-altered non-public and public-non-community water systems in this
municipality in this reporting year by the LHD or its paid contractors, where the LHD or its paid contractors inspect
the water system to determine compliance with health and safety standards and regulations including State Health
Department regulations.
ENV-214 Non-routine inspections conducted in response
to a complaint about the facility, a disease
outbreak, or any other non-standard event (LHD)
Volume Non-routine inspections are any inspections that aren’t related to the NJAC 8:24 requirements for inspection
frequency, including inspections in response to outbreaks, citizen complaints, and emergencies in the past 12
months. [If a citizen complaint was received just before a planned initial or follow-up inspection, so that the LHD
checks on the complaint while doing the planned inspection (i.e., there is no additional inspection), count that
inspection as the planned inspection rather than a non-routine inspection.]
ENV-215 Rabies vaccination clinics (LHD) Volume # of pet rabies vaccination clinics sponsored by the department
ENV-216 Pets vaccinated at department-sponsored rabies
clinic(s) (LHD)
Volume Number of pets vaccinated at all clinics held in this municipality. Including all pets vaccinated at clinics held in this
municipality in this reporting year, even if the pet / pet's owner resides in another municipality.
ENV-217 Potable well inspections conducted (LHD) Volume Number of potable well inspections conducted in this municipality in this reporting year by the LHD or its paid
contractors, where the LHD or its paid contractors inspect the well installation to determine compliance with health
and safety standards and regulations including NJDEP regulations.
ENV-218 Solid waste complaint investigations (LHD) Volume Number of solid waste complaint cases investigated (nuisance complain investigations) in this municipality in this
reporting year, investigated by the LHD or its paid contractor. Solid waste: Garbage / refuse / manure / solid waste
that supports the life cycle of flies or that serves as food or breeding place / harborage for rodents or insects, illegal
dumping, unregistered haulers, transporter route violations, and unpermitted facilities as well as residential
complaints
ENV-219 Blood lead levels (LHD) Reach Proportion of BLLs > 10 micrograms/dl
ENV-220 Blood lead in children (LHD) Volume Number of cases of EBL (elevated blood lead in children age 6 and under) investigated by the LHD in the past 12
months.
ENV-221 Licensed campground facilities (LHD) Volume Number of currently-licensed campground facilities in municipalities
ENV-222 Campground facility inspections (LHD) Volume Number of regulatory compliance inspections of licensed campground facilities conducted by the LHD in a specific
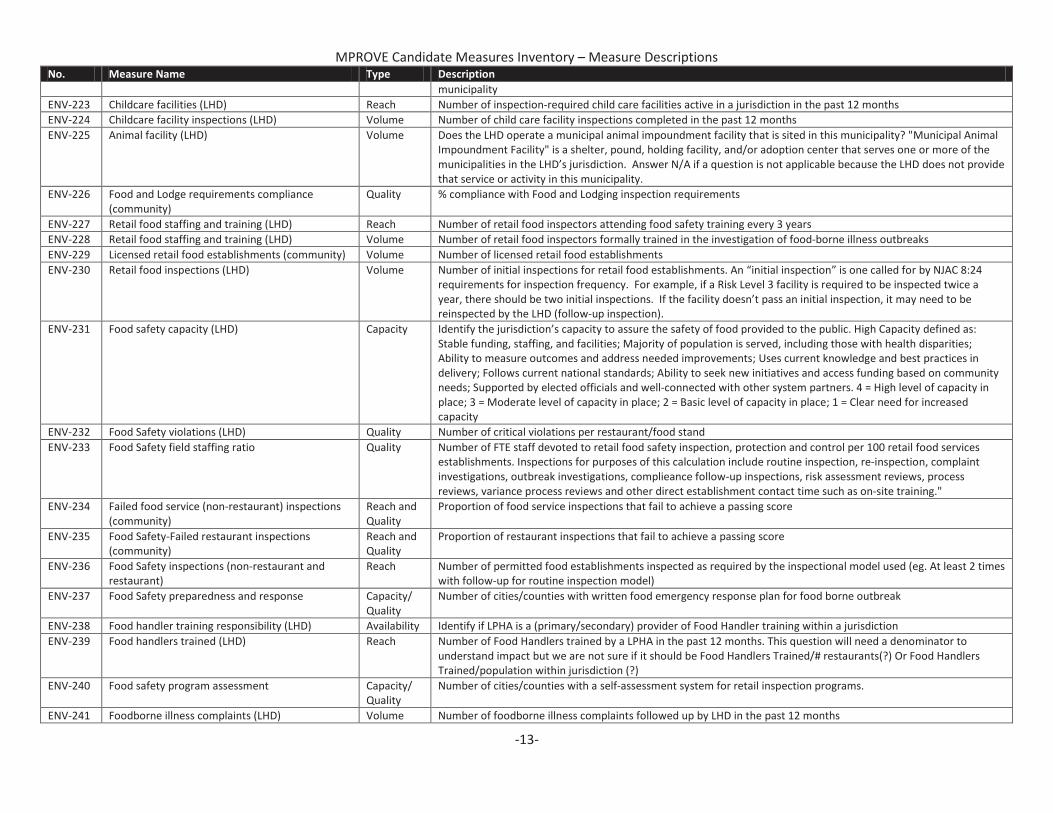
MPROVE Candidate Measures Inventory – Measure Descriptions
-13-
No. Measure Name Type Description
municipality
ENV-223 Childcare facilities (LHD) Reach Number of inspection-required child care facilities active in a jurisdiction in the past 12 months
ENV-224 Childcare facility inspections (LHD) Volume Number of child care facility inspections completed in the past 12 months
ENV-225 Animal facility (LHD) Volume Does the LHD operate a municipal animal impoundment facility that is sited in this municipality? "Municipal Animal
Impoundment Facility" is a shelter, pound, holding facility, and/or adoption center that serves one or more of the
municipalities in the LHD’s jurisdiction. Answer N/A if a question is not applicable because the LHD does not provide
that service or activity in this municipality.
ENV-226 Food and Lodge requirements compliance
(community)
Quality % compliance with Food and Lodging inspection requirements
ENV-227 Retail food staffing and training (LHD) Reach Number of retail food inspectors attending food safety training every 3 years
ENV-228 Retail food staffing and training (LHD) Volume Number of retail food inspectors formally trained in the investigation of food-borne illness outbreaks
ENV-229 Licensed retail food establishments (community) Volume Number of licensed retail food establishments
ENV-230 Retail food inspections (LHD) Volume Number of initial inspections for retail food establishments. An “initial inspection” is one called for by NJAC 8:24
requirements for inspection frequency. For example, if a Risk Level 3 facility is required to be inspected twice a
year, there should be two initial inspections. If the facility doesn’t pass an initial inspection, it may need to be
reinspected by the LHD (follow-up inspection).
ENV-231 Food safety capacity (LHD) Capacity Identify the jurisdiction’s capacity to assure the safety of food provided to the public. High Capacity defined as:
Stable funding, staffing, and facilities; Majority of population is served, including those with health disparities;
Ability to measure outcomes and address needed improvements; Uses current knowledge and best practices in
delivery; Follows current national standards; Ability to seek new initiatives and access funding based on community
needs; Supported by elected officials and well-connected with other system partners. 4 = High level of capacity in
place; 3 = Moderate level of capacity in place; 2 = Basic level of capacity in place; 1 = Clear need for increased
capacity
ENV-232 Food Safety violations (LHD) Quality Number of critical violations per restaurant/food stand
ENV-233 Food Safety field staffing ratio Quality Number of FTE staff devoted to retail food safety inspection, protection and control per 100 retail food services
establishments. Inspections for purposes of this calculation include routine inspection, re-inspection, complaint
investigations, outbreak investigations, complieance follow-up inspections, risk assessment reviews, process
reviews, variance process reviews and other direct establishment contact time such as on-site training."
ENV-234 Failed food service (non-restaurant) inspections
(community)
Reach and
Quality
Proportion of food service inspections that fail to achieve a passing score
ENV-235 Food Safety-Failed restaurant inspections
(community)
Reach and
Quality
Proportion of restaurant inspections that fail to achieve a passing score
ENV-236 Food Safety inspections (non-restaurant and
restaurant)
Reach Number of permitted food establishments inspected as required by the inspectional model used (eg. At least 2 times
with follow-up for routine inspection model)
ENV-237 Food Safety preparedness and response Capacity/
Quality
Number of cities/counties with written food emergency response plan for food borne outbreak
ENV-238 Food handler training responsibility (LHD) Availability Identify if LPHA is a (primary/secondary) provider of Food Handler training within a jurisdiction
ENV-239 Food handlers trained (LHD) Reach Number of Food Handlers trained by a LPHA in the past 12 months. This question will need a denominator to
understand impact but we are not sure if it should be Food Handlers Trained/# restaurants(?) Or Food Handlers
Trained/population within jurisdiction (?)
ENV-240 Food safety program assessment Capacity/
Quality
Number of cities/counties with a self-assessment system for retail inspection programs.
ENV-241 Foodborne illness complaints (LHD) Volume Number of foodborne illness complaints followed up by LHD in the past 12 months
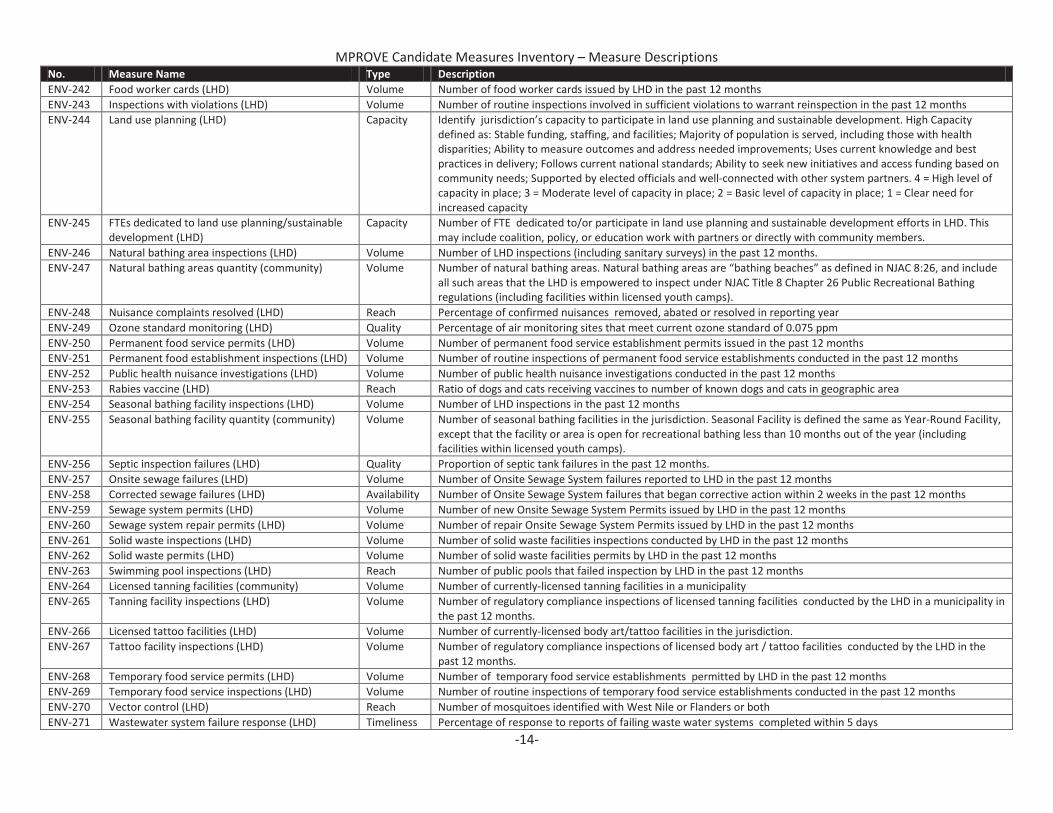
MPROVE Candidate Measures Inventory – Measure Descriptions
-14-
No. Measure Name Type Description
ENV-242 Food worker cards (LHD) Volume Number of food worker cards issued by LHD in the past 12 months
ENV-243 Inspections with violations (LHD) Volume Number of routine inspections involved in sufficient violations to warrant reinspection in the past 12 months
ENV-244 Land use planning (LHD) Capacity Identify jurisdiction’s capacity to participate in land use planning and sustainable development. High Capacity
defined as: Stable funding, staffing, and facilities; Majority of population is served, including those with health
disparities; Ability to measure outcomes and address needed improvements; Uses current knowledge and best
practices in delivery; Follows current national standards; Ability to seek new initiatives and access funding based on
community needs; Supported by elected officials and well-connected with other system partners. 4 = High level of
capacity in place; 3 = Moderate level of capacity in place; 2 = Basic level of capacity in place; 1 = Clear need for
increased capacity
ENV-245 FTEs dedicated to land use planning/sustainable
development (LHD)
Capacity Number of FTE dedicated to/or participate in land use planning and sustainable development efforts in LHD. This
may include coalition, policy, or education work with partners or directly with community members.
ENV-246 Natural bathing area inspections (LHD) Volume Number of LHD inspections (including sanitary surveys) in the past 12 months.
ENV-247 Natural bathing areas quantity (community) Volume Number of natural bathing areas. Natural bathing areas are “bathing beaches” as defined in NJAC 8:26, and include
all such areas that the LHD is empowered to inspect under NJAC Title 8 Chapter 26 Public Recreational Bathing
regulations (including facilities within licensed youth camps).
ENV-248 Nuisance complaints resolved (LHD) Reach Percentage of confirmed nuisances removed, abated or resolved in reporting year
ENV-249 Ozone standard monitoring (LHD) Quality Percentage of air monitoring sites that meet current ozone standard of 0.075 ppm
ENV-250 Permanent food service permits (LHD) Volume Number of permanent food service establishment permits issued in the past 12 months
ENV-251 Permanent food establishment inspections (LHD) Volume Number of routine inspections of permanent food service establishments conducted in the past 12 months
ENV-252 Public health nuisance investigations (LHD) Volume Number of public health nuisance investigations conducted in the past 12 months
ENV-253 Rabies vaccine (LHD) Reach Ratio of dogs and cats receiving vaccines to number of known dogs and cats in geographic area
ENV-254 Seasonal bathing facility inspections (LHD) Volume Number of LHD inspections in the past 12 months
ENV-255 Seasonal bathing facility quantity (community) Volume Number of seasonal bathing facilities in the jurisdiction. Seasonal Facility is defined the same as Year-Round Facility,
except that the facility or area is open for recreational bathing less than 10 months out of the year (including
facilities within licensed youth camps).
ENV-256 Septic inspection failures (LHD) Quality Proportion of septic tank failures in the past 12 months.
ENV-257 Onsite sewage failures (LHD) Volume Number of Onsite Sewage System failures reported to LHD in the past 12 months
ENV-258 Corrected sewage failures (LHD) Availability Number of Onsite Sewage System failures that began corrective action within 2 weeks in the past 12 months
ENV-259 Sewage system permits (LHD) Volume Number of new Onsite Sewage System Permits issued by LHD in the past 12 months
ENV-260 Sewage system repair permits (LHD) Volume Number of repair Onsite Sewage System Permits issued by LHD in the past 12 months
ENV-261 Solid waste inspections (LHD) Volume Number of solid waste facilities inspections conducted by LHD in the past 12 months
ENV-262 Solid waste permits (LHD) Volume Number of solid waste facilities permits by LHD in the past 12 months
ENV-263 Swimming pool inspections (LHD) Reach Number of public pools that failed inspection by LHD in the past 12 months
ENV-264 Licensed tanning facilities (community) Volume Number of currently-licensed tanning facilities in a municipality
ENV-265 Tanning facility inspections (LHD) Volume Number of regulatory compliance inspections of licensed tanning facilities conducted by the LHD in a municipality in
the past 12 months.
ENV-266 Licensed tattoo facilities (LHD) Volume Number of currently-licensed body art/tattoo facilities in the jurisdiction.
ENV-267 Tattoo facility inspections (LHD) Volume Number of regulatory compliance inspections of licensed body art / tattoo facilities conducted by the LHD in the
past 12 months.
ENV-268 Temporary food service permits (LHD) Volume Number of temporary food service establishments permitted by LHD in the past 12 months
ENV-269 Temporary food service inspections (LHD) Volume Number of routine inspections of temporary food service establishments conducted in the past 12 months
ENV-270 Vector control (LHD) Reach Number of mosquitoes identified with West Nile or Flanders or both
ENV-271 Wastewater system failure response (LHD) Timeliness Percentage of response to reports of failing waste water systems completed within 5 days
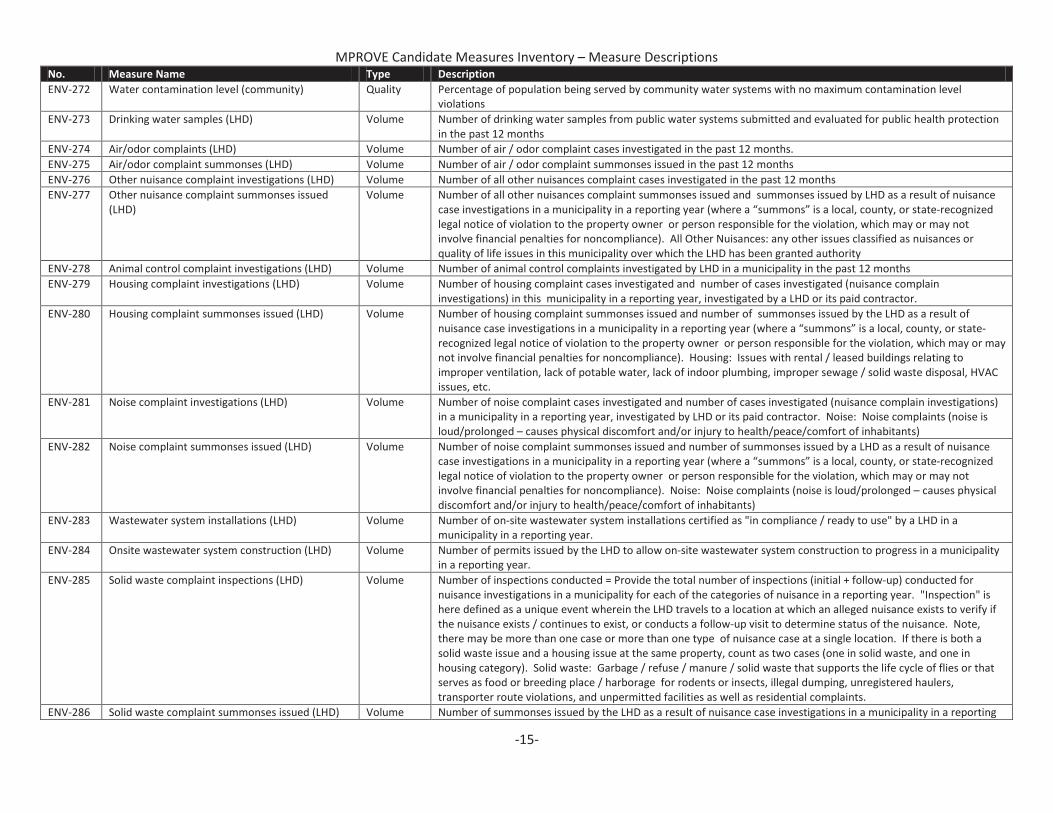
MPROVE Candidate Measures Inventory – Measure Descriptions
-15-
No. Measure Name Type Description
ENV-272 Water contamination level (community) Quality Percentage of population being served by community water systems with no maximum contamination level
violations
ENV-273 Drinking water samples (LHD) Volume Number of drinking water samples from public water systems submitted and evaluated for public health protection
in the past 12 months
ENV-274 Air/odor complaints (LHD) Volume Number of air / odor complaint cases investigated in the past 12 months.
ENV-275 Air/odor complaint summonses (LHD) Volume Number of air / odor complaint summonses issued in the past 12 months
ENV-276 Other nuisance complaint investigations (LHD) Volume Number of all other nuisances complaint cases investigated in the past 12 months
ENV-277 Other nuisance complaint summonses issued
(LHD)
Volume Number of all other nuisances complaint summonses issued and summonses issued by LHD as a result of nuisance
case investigations in a municipality in a reporting year (where a “summons” is a local, county, or state-recognized
legal notice of violation to the property owner or person responsible for the violation, which may or may not
involve financial penalties for noncompliance). All Other Nuisances: any other issues classified as nuisances or
quality of life issues in this municipality over which the LHD has been granted authority
ENV-278 Animal control complaint investigations (LHD) Volume Number of animal control complaints investigated by LHD in a municipality in the past 12 months
ENV-279 Housing complaint investigations (LHD) Volume Number of housing complaint cases investigated and number of cases investigated (nuisance complain
investigations) in this municipality in a reporting year, investigated by a LHD or its paid contractor.
ENV-280 Housing complaint summonses issued (LHD) Volume Number of housing complaint summonses issued and number of summonses issued by the LHD as a result of
nuisance case investigations in a municipality in a reporting year (where a “summons” is a local, county, or state-
recognized legal notice of violation to the property owner or person responsible for the violation, which may or may
not involve financial penalties for noncompliance). Housing: Issues with rental / leased buildings relating to
improper ventilation, lack of potable water, lack of indoor plumbing, improper sewage / solid waste disposal, HVAC
issues, etc.
ENV-281 Noise complaint investigations (LHD) Volume Number of noise complaint cases investigated and number of cases investigated (nuisance complain investigations)
in a municipality in a reporting year, investigated by LHD or its paid contractor. Noise: Noise complaints (noise is
loud/prolonged – causes physical discomfort and/or injury to health/peace/comfort of inhabitants)
ENV-282 Noise complaint summonses issued (LHD) Volume Number of noise complaint summonses issued and number of summonses issued by a LHD as a result of nuisance
case investigations in a municipality in a reporting year (where a “summons” is a local, county, or state-recognized
legal notice of violation to the property owner or person responsible for the violation, which may or may not
involve financial penalties for noncompliance). Noise: Noise complaints (noise is loud/prolonged – causes physical
discomfort and/or injury to health/peace/comfort of inhabitants)
ENV-283 Wastewater system installations (LHD) Volume Number of on-site wastewater system installations certified as "in compliance / ready to use" by a LHD in a
municipality in a reporting year.
ENV-284 Onsite wastewater system construction (LHD) Volume Number of permits issued by the LHD to allow on-site wastewater system construction to progress in a municipality
in a reporting year.
ENV-285 Solid waste complaint inspections (LHD) Volume Number of inspections conducted = Provide the total number of inspections (initial + follow-up) conducted for
nuisance investigations in a municipality for each of the categories of nuisance in a reporting year. "Inspection" is
here defined as a unique event wherein the LHD travels to a location at which an alleged nuisance exists to verify if
the nuisance exists / continues to exist, or conducts a follow-up visit to determine status of the nuisance. Note,
there may be more than one case or more than one type of nuisance case at a single location. If there is both a
solid waste issue and a housing issue at the same property, count as two cases (one in solid waste, and one in
housing category). Solid waste: Garbage / refuse / manure / solid waste that supports the life cycle of flies or that
serves as food or breeding place / harborage for rodents or insects, illegal dumping, unregistered haulers,
transporter route violations, and unpermitted facilities as well as residential complaints.
ENV-286 Solid waste complaint summonses issued (LHD) Volume Number of summonses issued by the LHD as a result of nuisance case investigations in a municipality in a reporting
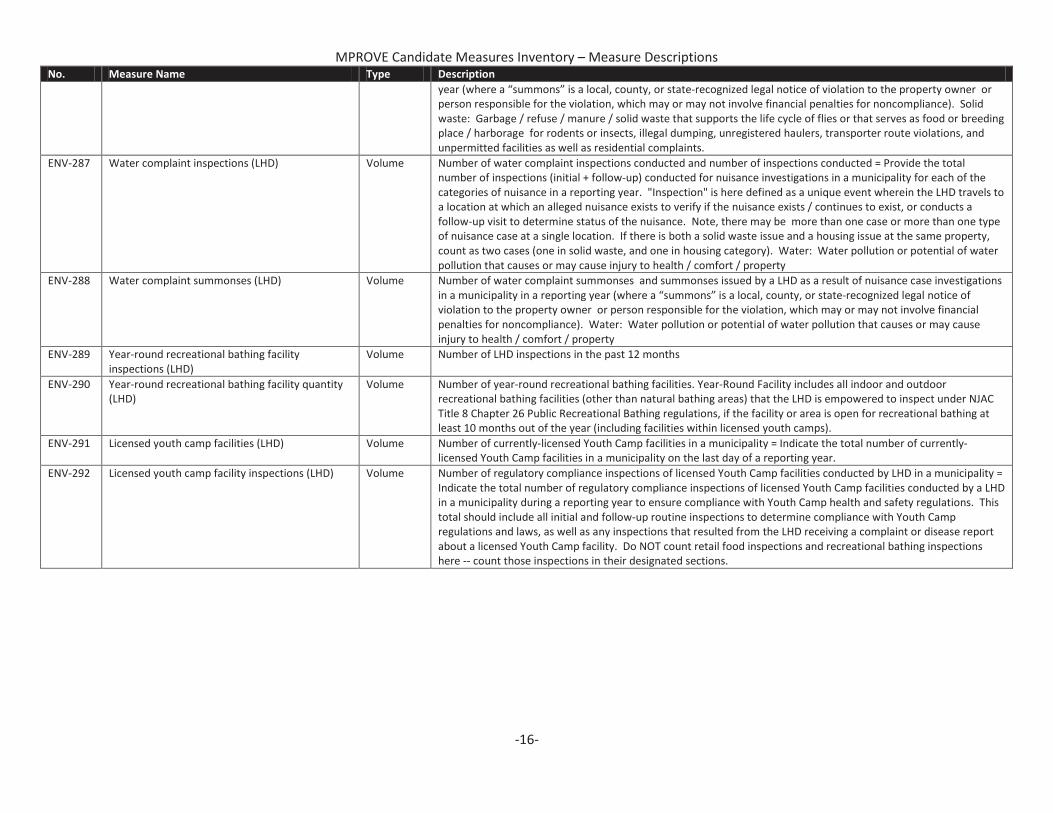
MPROVE Candidate Measures Inventory – Measure Descriptions
-16-
No. Measure Name Type Description
year (where a “summons” is a local, county, or state-recognized legal notice of violation to the property owner or
person responsible for the violation, which may or may not involve financial penalties for noncompliance). Solid
waste: Garbage / refuse / manure / solid waste that supports the life cycle of flies or that serves as food or breeding
place / harborage for rodents or insects, illegal dumping, unregistered haulers, transporter route violations, and
unpermitted facilities as well as residential complaints.
ENV-287 Water complaint inspections (LHD) Volume Number of water complaint inspections conducted and number of inspections conducted = Provide the total
number of inspections (initial + follow-up) conducted for nuisance investigations in a municipality for each of the
categories of nuisance in a reporting year. "Inspection" is here defined as a unique event wherein the LHD travels to
a location at which an alleged nuisance exists to verify if the nuisance exists / continues to exist, or conducts a
follow-up visit to determine status of the nuisance. Note, there may be more than one case or more than one type
of nuisance case at a single location. If there is both a solid waste issue and a housing issue at the same property,
count as two cases (one in solid waste, and one in housing category). Water: Water pollution or potential of water
pollution that causes or may cause injury to health / comfort / property
ENV-288 Water complaint summonses (LHD) Volume Number of water complaint summonses and summonses issued by a LHD as a result of nuisance case investigations
in a municipality in a reporting year (where a “summons” is a local, county, or state-recognized legal notice of
violation to the property owner or person responsible for the violation, which may or may not involve financial
penalties for noncompliance). Water: Water pollution or potential of water pollution that causes or may cause
injury to health / comfort / property
ENV-289 Year-round recreational bathing facility
inspections (LHD)
Volume Number of LHD inspections in the past 12 months
ENV-290 Year-round recreational bathing facility quantity
(LHD)
Volume Number of year-round recreational bathing facilities. Year-Round Facility includes all indoor and outdoor
recreational bathing facilities (other than natural bathing areas) that the LHD is empowered to inspect under NJAC
Title 8 Chapter 26 Public Recreational Bathing regulations, if the facility or area is open for recreational bathing at
least 10 months out of the year (including facilities within licensed youth camps).
ENV-291 Licensed youth camp facilities (LHD) Volume Number of currently-licensed Youth Camp facilities in a municipality = Indicate the total number of currently-
licensed Youth Camp facilities in a municipality on the last day of a reporting year.
ENV-292 Licensed youth camp facility inspections (LHD) Volume Number of regulatory compliance inspections of licensed Youth Camp facilities conducted by LHD in a municipality =
Indicate the total number of regulatory compliance inspections of licensed Youth Camp facilities conducted by a LHD
in a municipality during a reporting year to ensure compliance with Youth Camp health and safety regulations. This
total should include all initial and follow-up routine inspections to determine compliance with Youth Camp
regulations and laws, as well as any inspections that resulted from the LHD receiving a complaint or disease report
about a licensed Youth Camp facility. Do NOT count retail food inspections and recreational bathing inspections
here -- count those inspections in their designated sections.
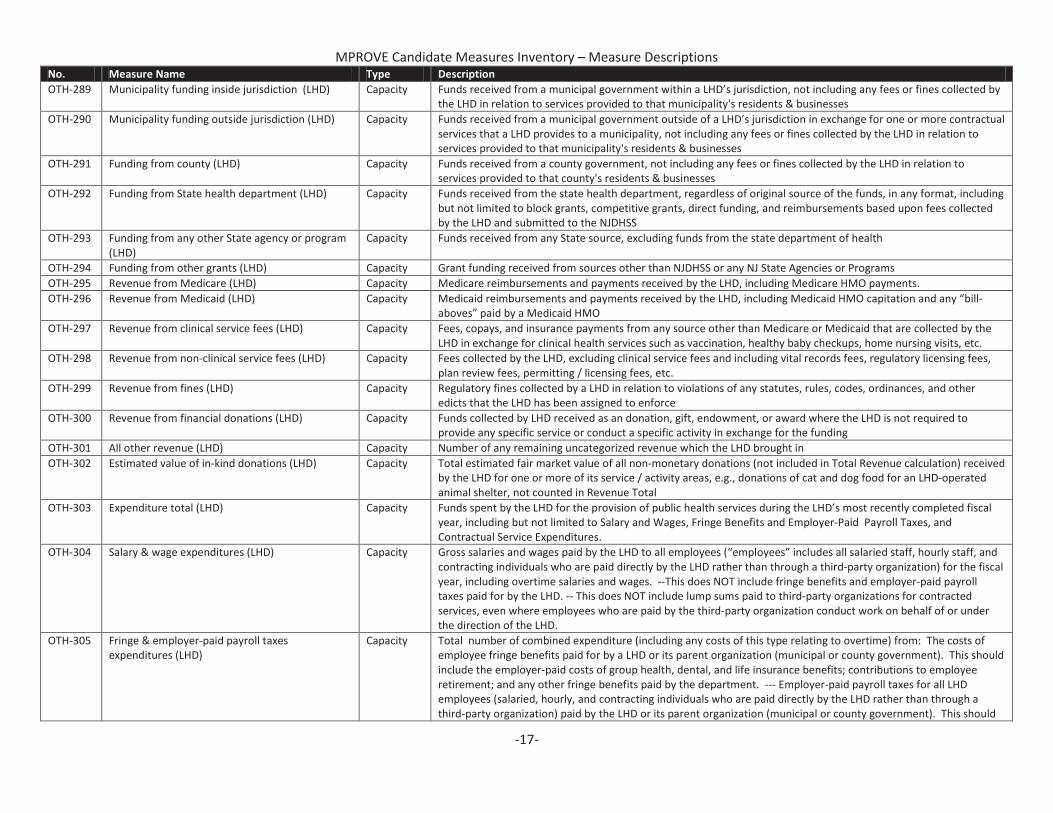
MPROVE Candidate Measures Inventory – Measure Descriptions
-17-
No. Measure Name Type Description
OTH-289 Municipality funding inside jurisdiction (LHD) Capacity Funds received from a municipal government within a LHD’s jurisdiction, not including any fees or fines collected by
the LHD in relation to services provided to that municipality's residents & businesses
OTH-290 Municipality funding outside jurisdiction (LHD) Capacity Funds received from a municipal government outside of a LHD’s jurisdiction in exchange for one or more contractual
services that a LHD provides to a municipality, not including any fees or fines collected by the LHD in relation to
services provided to that municipality's residents & businesses
OTH-291 Funding from county (LHD) Capacity Funds received from a county government, not including any fees or fines collected by the LHD in relation to
services provided to that county's residents & businesses
OTH-292 Funding from State health department (LHD) Capacity Funds received from the state health department, regardless of original source of the funds, in any format, including
but not limited to block grants, competitive grants, direct funding, and reimbursements based upon fees collected
by the LHD and submitted to the NJDHSS
OTH-293 Funding from any other State agency or program
(LHD)
Capacity Funds received from any State source, excluding funds from the state department of health
OTH-294 Funding from other grants (LHD) Capacity Grant funding received from sources other than NJDHSS or any NJ State Agencies or Programs
OTH-295 Revenue from Medicare (LHD) Capacity Medicare reimbursements and payments received by the LHD, including Medicare HMO payments.
OTH-296 Revenue from Medicaid (LHD) Capacity Medicaid reimbursements and payments received by the LHD, including Medicaid HMO capitation and any “bill-
aboves” paid by a Medicaid HMO
OTH-297 Revenue from clinical service fees (LHD) Capacity Fees, copays, and insurance payments from any source other than Medicare or Medicaid that are collected by the
LHD in exchange for clinical health services such as vaccination, healthy baby checkups, home nursing visits, etc.
OTH-298 Revenue from non-clinical service fees (LHD) Capacity Fees collected by the LHD, excluding clinical service fees and including vital records fees, regulatory licensing fees,
plan review fees, permitting / licensing fees, etc.
OTH-299 Revenue from fines (LHD) Capacity Regulatory fines collected by a LHD in relation to violations of any statutes, rules, codes, ordinances, and other
edicts that the LHD has been assigned to enforce
OTH-300 Revenue from financial donations (LHD) Capacity Funds collected by LHD received as an donation, gift, endowment, or award where the LHD is not required to
provide any specific service or conduct a specific activity in exchange for the funding
OTH-301 All other revenue (LHD) Capacity Number of any remaining uncategorized revenue which the LHD brought in
OTH-302 Estimated value of in-kind donations (LHD) Capacity Total estimated fair market value of all non-monetary donations (not included in Total Revenue calculation) received
by the LHD for one or more of its service / activity areas, e.g., donations of cat and dog food for an LHD-operated
animal shelter, not counted in Revenue Total
OTH-303 Expenditure total (LHD) Capacity Funds spent by the LHD for the provision of public health services during the LHD’s most recently completed fiscal
year, including but not limited to Salary and Wages, Fringe Benefits and Employer-Paid Payroll Taxes, and
Contractual Service Expenditures.
OTH-304 Salary & wage expenditures (LHD) Capacity Gross salaries and wages paid by the LHD to all employees (“employees” includes all salaried staff, hourly staff, and
contracting individuals who are paid directly by the LHD rather than through a third-party organization) for the fiscal
year, including overtime salaries and wages. --This does NOT include fringe benefits and employer-paid payroll
taxes paid for by the LHD. -- This does NOT include lump sums paid to third-party organizations for contracted
services, even where employees who are paid by the third-party organization conduct work on behalf of or under
the direction of the LHD.
OTH-305 Fringe & employer-paid payroll taxes
expenditures (LHD)
Capacity Total number of combined expenditure (including any costs of this type relating to overtime) from: The costs of
employee fringe benefits paid for by a LHD or its parent organization (municipal or county government). This should
include the employer-paid costs of group health, dental, and life insurance benefits; contributions to employee
retirement; and any other fringe benefits paid by the department. --- Employer-paid payroll taxes for all LHD
employees (salaried, hourly, and contracting individuals who are paid directly by the LHD rather than through a
third-party organization) paid by the LHD or its parent organization (municipal or county government). This should
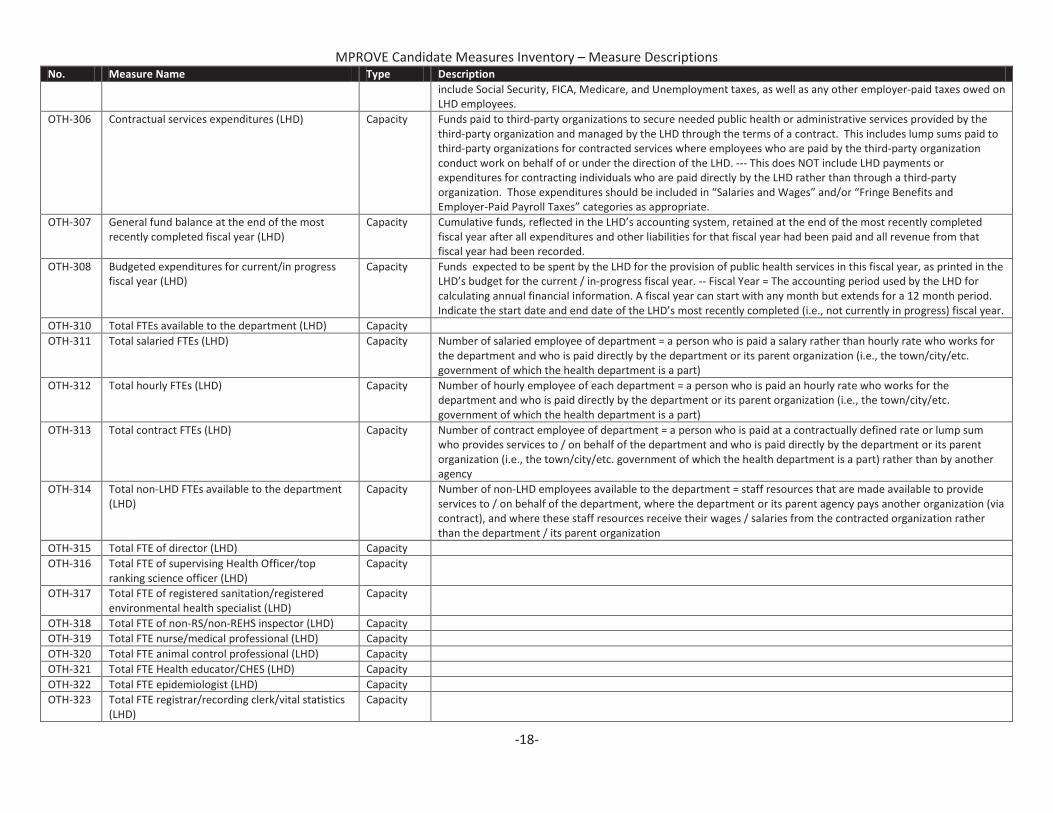
MPROVE Candidate Measures Inventory – Measure Descriptions
-18-
No. Measure Name Type Description
include Social Security, FICA, Medicare, and Unemployment taxes, as well as any other employer-paid taxes owed on
LHD employees.
OTH-306 Contractual services expenditures (LHD) Capacity Funds paid to third-party organizations to secure needed public health or administrative services provided by the
third-party organization and managed by the LHD through the terms of a contract. This includes lump sums paid to
third-party organizations for contracted services where employees who are paid by the third-party organization
conduct work on behalf of or under the direction of the LHD. --- This does NOT include LHD payments or
expenditures for contracting individuals who are paid directly by the LHD rather than through a third-party
organization. Those expenditures should be included in “Salaries and Wages” and/or “Fringe Benefits and
Employer-Paid Payroll Taxes” categories as appropriate.
OTH-307 General fund balance at the end of the most
recently completed fiscal year (LHD)
Capacity Cumulative funds, reflected in the LHD’s accounting system, retained at the end of the most recently completed
fiscal year after all expenditures and other liabilities for that fiscal year had been paid and all revenue from that
fiscal year had been recorded.
OTH-308 Budgeted expenditures for current/in progress
fiscal year (LHD)
Capacity Funds expected to be spent by the LHD for the provision of public health services in this fiscal year, as printed in the
LHD’s budget for the current / in-progress fiscal year. -- Fiscal Year = The accounting period used by the LHD for
calculating annual financial information. A fiscal year can start with any month but extends for a 12 month period.
Indicate the start date and end date of the LHD’s most recently completed (i.e., not currently in progress) fiscal year.
OTH-310 Total FTEs available to the department (LHD) Capacity
OTH-311 Total salaried FTEs (LHD) Capacity Number of salaried employee of department = a person who is paid a salary rather than hourly rate who works for
the department and who is paid directly by the department or its parent organization (i.e., the town/city/etc.
government of which the health department is a part)
OTH-312 Total hourly FTEs (LHD) Capacity Number of hourly employee of each department = a person who is paid an hourly rate who works for the
department and who is paid directly by the department or its parent organization (i.e., the town/city/etc.
government of which the health department is a part)
OTH-313 Total contract FTEs (LHD) Capacity Number of contract employee of department = a person who is paid at a contractually defined rate or lump sum
who provides services to / on behalf of the department and who is paid directly by the department or its parent
organization (i.e., the town/city/etc. government of which the health department is a part) rather than by another
agency
OTH-314 Total non-LHD FTEs available to the department
(LHD)
Capacity Number of non-LHD employees available to the department = staff resources that are made available to provide
services to / on behalf of the department, where the department or its parent agency pays another organization (via
contract), and where these staff resources receive their wages / salaries from the contracted organization rather
than the department / its parent organization
OTH-315 Total FTE of director (LHD) Capacity
OTH-316 Total FTE of supervising Health Officer/top
ranking science officer (LHD)
Capacity
OTH-317 Total FTE of registered sanitation/registered
environmental health specialist (LHD)
Capacity
OTH-318 Total FTE of non-RS/non-REHS inspector (LHD) Capacity
OTH-319 Total FTE nurse/medical professional (LHD) Capacity
OTH-320 Total FTE animal control professional (LHD) Capacity
OTH-321 Total FTE Health educator/CHES (LHD) Capacity
OTH-322 Total FTE epidemiologist (LHD) Capacity
OTH-323 Total FTE registrar/recording clerk/vital statistics
(LHD)
Capacity
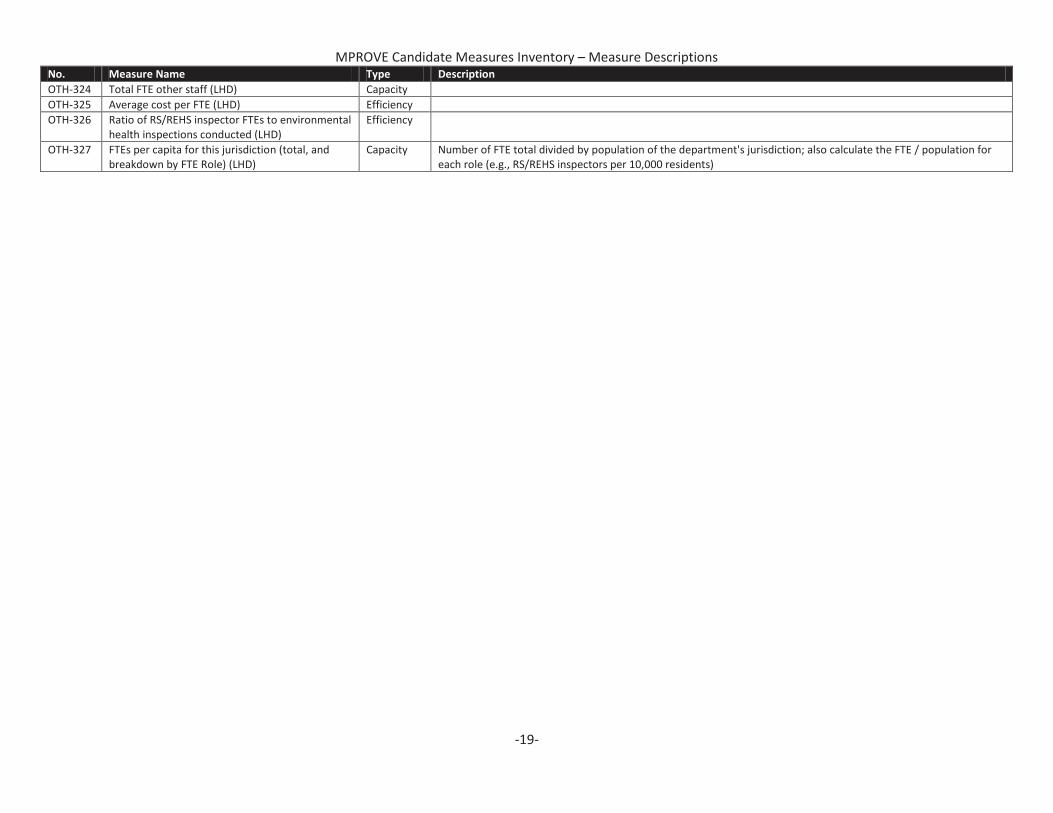
MPROVE Candidate Measures Inventory – Measure Descriptions
-19-
No. Measure Name Type Description
OTH-324 Total FTE other staff (LHD) Capacity
OTH-325 Average cost per FTE (LHD) Efficiency
OTH-326 Ratio of RS/REHS inspector FTEs to environmental
health inspections conducted (LHD)
Efficiency
OTH-327 FTEs per capita for this jurisdiction (total, and
breakdown by FTE Role) (LHD)
Capacity Number of FTE total divided by population of the department's jurisdiction; also calculate the FTE / population for
each role (e.g., RS/REHS inspectors per 10,000 residents)
-1-
Selection Criteria for Public Health Service Delivery Measures
Multi-Network Practice and Outcome Variation Examination Study (MPROVE)
Draft 07 May 2012
Domains of Measurement: MPROVE seeks to measure public health service delivery at the
local level in three core domains of activity: communicable disease control; chronic disease
prevention; and environmental health protection
Dimensions of Measurement: MPROVE seeks to measure key dimensions of service delivery for
selected public health activities delivered at the local level. These dimensions may include
availability, volume/intensity, capacity, reach, and/or quality of service delivery. Dimensions of
quality may include appropriateness, effectiveness/fidelity, timeliness, community
centeredness, efficiency, and equity. See below for further descriptions of these measurement
dimensions.
Draft Selection Criteria for Candidate Measures
(1) Domain: Degree to which the measure falls within one of the three core domains of activity
for this study: communicable disease control; chronic disease prevention; environmental
health protection
(2) Dimension: Degree to which the measure addresses one or more of the key dimensions of
service delivery for this study: availability, volume/intensity, capacity, reach, and/or quality.
(3) Relevance/Control: Degree to which the measure reflects an activity that local public health
agencies and/or their partners have the authority (law) and organizational responsibility
(mission) to implement
(4) Expected Health Impact: Degree to which improvements in the measured activity are
expected to result in improvements in population health. Following Siu et al.,1 this criterion
can be calculated based on: (a) proportion of the population currently exposed to the risk
factor addressed by the measured activity [risk exposure]; (b) proportion of the exposed
population that is expected to be reached by the measured activity [reach]; (c) the relative
risk of the health outcome comparing the exposed to the unexposed target population
[preventable fraction]; and (d) relative risk of the health outcome comparing the population
reached by the measured activity to the population not reached [efficacy].
(5) Expected Economic Impact: Degree to which changes in the measured activity are expected
to result in changes in the cost of delivering public health services, changes in the cost of
delivering other health care or social services (spill over), and/or other changes in the direct
and indirect costs of preventable illness/injury/disability.
-2-
(6) Expected Variation: Degree to which the measured activity is expected to vary across local
public health settings, vary across states/PBRN networks, and vary over time.
(7) Feasibility: Degree to which it is economically and logistically feasible to obtain the data
needed to construct the measure at the level of the local public health practice setting1 for
all/most/many practice settings in each participating PBRN.
(8) Expected Validity: Degree to which the measure fully and completely characterizes the
public health activity of interest.
(9) Expected Reliability: Degree to which the measure characterizes the activity consistently
across different local public health settings and over time
Measurement Dimensions for Local Public Health Service Delivery
Availability/scope: this dimension consists of a range of dichotomous measures that indicate
whether or not specific services and activities are produced or performed by the public health
agency or delivery system. Examples include the service delivery variables used in the NACCHO
Profile of Local Health Departments.
Volume/intensity: this dimension consists of measures that count the absolute or relative
frequency of service delivery over a given period of time, such as the amount of vaccinations
dispensed or the proportion of restaurants inspected.
Capacity: this dimension often is operationalized as a measure of staffing level in a particular
service line, and could be expressed as ratio of staffing to size of target population or risk (e.g.
sanitarians per 1000 septic tanks, food safety inspectors per 1000 licensed food vendors).
Reach: these measures typically require a denominator so as to indicate the percent of the
target population reached by the service. These measures can be constructed by using volume
as the numerator and the relevant population size as denominator, such as the proportion of
smokers in a community reached by tobacco cessation services. Such measures provide an
assessment of the extent to which activities are implemented at a sufficient scale and targeted
appropriately to the population groups most at risk.
Quality: The Institute of Medicine defined quality in health care as “the degree to which health
services for individuals and populations increase the likelihood of desired health outcomes and
are consistent with current professional knowledge,” and identified six important dimensions of
health care quality that included safety, effectiveness, timeliness, patient centeredness,
efficiency, and equity.2
The Public Health Quality Forum of the U.S. Department of Health and
Human Services recently identified priority areas for quality improvement in public health
1 Local practice setting may be defined as a local public health agency, a jurisdiction or area served by a local public
health agency, or a relevant sub-division of such an area.
-3-
practice based on these constructs (see table below for cross-walk of MPROVE measure
dimensions with HHS Public Health Quality Aims).3 Key measures of quality in public health
include:
Appropriateness: Does the public health agency and/or system act based on objectively
measured health needs and risk profiles of the population served? What is the degree
of concordance between a community’s documented health needs/risks and the scope
of public health activities performed by the public health agency or the system as a
whole?
Effectiveness/Fidelity: Does the public health agency and/or system implement its
activities based on available scientific knowledge and fidelity to evidence-based
guidelines? To what extent are programs and services concordant with evidence-based
guidelines and professional consensus standards?8
Timeliness: Are public health activities implemented at the appropriate points in time
to maximize health protection and minimize the risk of disease transmission or injury?
Community Centeredness/Engagement: To what extent are relevant stakeholders
engaged in planning, priority-setting, selection, and implementation of public health
activities undertaken by the public health agency and/or system? To what extent are
public health activities tailored appropriately to at-risk population groups based on the
groups’ values, preferences, needs, knowledge, skills, and resources?
Efficiency: To what extent are public health activities implemented in ways that
optimize the use of financial and human resources? To what extent do implementation
processes avoid waste and delays in service? To what extent do the benefits of public
health activities justify their costs?
Equity: Are there disparities in the reach of public health activities to different
population sub-groups defined by personal characteristics such as race, ethnicity,
geography, or socio-economic status? Are there disparities in effectiveness, timeliness,
community-centeredness, and/or efficiency?
-4-
Cross-Walk of MPROVE Measurement Dimensions with HHS Public Health Quality Aims
*See Reference #3
References
1. AL Siu, EA McGlynn, H Morgenstern, MH Beers, DM Carlisle, EB Keeler, J Beloff, K Curtin, J
Leaning, BC Perry Choosing quality of care measures based on the expected impact of
improved care on health. Health Services Research 1992; 27(5): 619–650. (This is the
selection method used by HEDIS, RAND, and many other quality measurement and
improvement applications in the health care field).
2. Institute of Medicine. Crossing the Quality Chasm: A New Health System for the 21st
Century. Washington, DC: National Academies Press; 2001.
3. Office of the Assistant Secretary for Health, U.S. Department of Health and Human Services.
Priority Areas for the Improvement of Quality in Public Health. The Public Health Quality
Forum. Washington, D.C.: U.S. Department of Health and Human Services; 2010.
HHS Quality Aims* MPROVE Measurement Dimensions
Population-centered Community-centered
Equitable Equity
Proactive Timeliness
Health-promoting Effectiveness/fidelity
Risk-reducing Effectiveness/fidelity
Vigilant Appropriateness
Effective Effectiveness/fidelity
Efficient Efficiency