Embed Size (px)
Citation preview

pH-Lemon, a Fluorescent Protein-Based pH Reporter for AcidicCompartmentsSandra Burgstaller,*,† Helmut Bischof,*,† Thomas Gensch,‡ Sarah Stryeck,† Benjamin Gottschalk,†
Jeta Ramadani-Muja,† Emrah Eroglu,† Rene Rost,† Sabine Balfanz,‡ Arnd Baumann,‡
Markus Waldeck-Weiermair,*,† Jesse C. Hay,†,§ Tobias Madl,†,∥ Wolfgang F. Graier,*,†,∥
and Roland Malli*,†,∥
†Molecular Biology and Biochemistry, Gottfried Schatz Research Center, Medical University of Graz, Neue Stiftingtalstraße 6/6,8010 Graz, Austria‡Institute of Complex Systems, Zellulare Biophysik (ICS-4), Forschungszentrum Julich, 52428 Julich, Germany§Division of Biological Sciences and Center for Structural and Functional Neuroscience, The University of Montana, 32 CampusDrive, HS410, Missoula 59812-4824, Montana United States∥BioTechMed Graz, Mozartgasse 12/II, 8010 Graz, Austria
*S Supporting Information
ABSTRACT: Distinct subcellular pH levels, especially inlysosomes and endosomes, are essential for the degradation,modification, sorting, accumulation, and secretion of macro-molecules. Here, we engineered a novel genetically encoded pHprobe by fusing the pH-stable cyan fluorescent protein (FP)variant, mTurquoise2, to the highly pH-sensitive enhanced yellowfluorescent protein, EYFP. This approach yielded a ratiometricbiosensorreferred to as pH-Lemonoptimized for live imagingof distinct pH conditions within acidic cellular compartments.Protonation of pH-Lemon under acidic conditions significantlydecreases the yellow fluorescence while the cyan fluorescenceincreases due to reduced Forster resonance energy transfer(FRET) efficiency. Because of its freely reversible and ratiometricresponses, pH-Lemon represents a fluorescent biosensor for pH dynamics. pH-Lemon also shows a sizable pH-dependentfluorescence lifetime change that can be used in fluorescence lifetime imaging microscopy as an alternative observation methodfor the study of pH in acidic cellular compartments. Fusion of pH-Lemon to the protein microtubule-associated protein 1A/1B-light chain 3B (LC3B), a specific marker of autophagic membranes, resulted in its targeting within autolysosomes of HeLa cells.Moreover, fusion of pH-Lemon to a glycophosphatidylinositol (GPI) anchor allowed us to monitor the entire luminal space ofthe secretory pathway and the exoplasmic leaflet of the plasma membrane. Utilizing this new pH probe, we revealed neutral andacidic vesicles and substructures inside cells, highlighting compartments of distinct pH throughout the endomembrane system.These data demonstrate, that this novel pH sensor, pH-Lemon, is very suitable for the study of local pH dynamics of subcellularmicrostructures in living cells.
KEYWORDS: array confocal laser scanning microscopy, FLIM, fluorescence microscopy, FRET, genetically encoded probes,Golgi apparatus, GPI-anchor, pH
Even small pH changes impact protein structures toregulate diverse molecular processes such as enzymatic
activities,1 transporters,2,3 ion channels,4−6 and transcription,7
which eventually determine cell functions. While mostbiological processes operate optimally at a narrow pH rangebetween pH 7.2 and pH 7.4,8,9 some require an alkaline oreven acidic environment.10,11 For the decomposition ofpathogens,12 self-digestion in the course of autophagy, aswell as protein processing in the endomembrane system,13 allcells contain highly acidic compartments such as lysosomesand endosomal vesicles with assumed pH values between pH4.0 and pH 6.0, respectively.14−16 Vacuolar-type H+-ATPases17
(V-ATPases) pump H+ across biomembranes of thesecompartments to acidify their lumens. A loss of these H+
gradients is associated with severe dysfunctions.18 Given theimportance of acidic cellular organelles,19−21 the developmentand optimization of pH probes for real-time visualization ofpH dynamics is an active research area.22 Several organic smallmolecule fluorophores have been developed to label acidic
Received: December 14, 2018Accepted: March 13, 2019Published: March 13, 2019
Article
pubs.acs.org/acssensorsCite This: ACS Sens. 2019, 4, 883−891
© 2019 American Chemical Society 883 DOI: 10.1021/acssensors.8b01599ACS Sens. 2019, 4, 883−891
This is an open access article published under a Creative Commons Attribution (CC-BY)License, which permits unrestricted use, distribution and reproduction in any medium,provided the author and source are cited.
Dow
nloa
ded
via
FOR
SCH
UN
GZ
EN
TR
UM
JU
EL
ICH
on
Apr
il 29
, 201
9 at
13:
53:0
0 (U
TC
).
See
http
s://p
ubs.
acs.
org/
shar
ingg
uide
lines
for
opt
ions
on
how
to le
gitim
atel
y sh
are
publ
ishe
d ar
ticle
s.
vesicles within cells.23−25 However, most of these compoundsmight be cytotoxic and alter the metabolic activity of cells.25
Moreover, these dyes are released from vesicles upondeprotonation, thus hampering quantification of actual pHlevels and dynamics.25 A more elegant way to assess(sub)cellular pH levels is the application of nontoxicgenetically encoded fluorescent biosensors.26,27 The first FP-based pH biosensor was developed by introducing site specificmutations to a GFP variant which increased its natural pHsensitivity.26 Miesenbock and colleagues invented andsuccessfully applied these “pHlourins”26 to visualize local pHchanges within vesicles during secretion and synaptic trans-mission. These pH-sensors, however, are best suited for pHmeasurements near neutral pH and have very low sensitivity atand below pH 6.0. Another informative type of geneticallyencoded fluorescent pH sensors is Cy11.5 and pHlameleons.27
These biosensors consist of the enhanced cyan FP (ECFP)28
with sizable fluorescence at acidic pH directly fused to a yellowFP variant (YFP).29 The pHlameleons are ratiometric FRET-based pH probes that have been characterized in detail asrecombinant probes in vitro.27 Cytosolic pHlamelons were alsocharacterized for both ratiometric and lifetime pH imaging inlive CHO, PC12, and MCF7 cells. Furthermore, the probeswere used to quantify small cytosolic pH changes in responseto N-dodecyl (C12) imidazole, a lysosomotropic detergent.However, pHlameleons have yet not been targeted to cellularorganelles such as mitochondria, endosomes, or lysosomes.27
Worth noting, a pHlameleon-like FRET-based pH-sensorfamily, FluBpH, has been introduced recently, where a flavin-binding fluorescent protein (FbFP) replaces ECFP as a donor,thus eliminating the problem of the pH-dependence of ECFPfluorescence at pH values below 6.5.30 In this study, we usedthe pHlameleon principle to design a FRET-based pHbiosensor using one of the most pH stable cyan FP variants,mTurquoise2,31 fused to the highly pH sensitive EYFP.29 Wenamed this pHlameleon variant pH-Lemon and tested itsapplicability for imaging the pH of acidic vesicles by fusing it toLC3B or targeting it to the secretory pathway. Theseapproaches demonstrated the suitability of pH-Lemon todetect and study neutral as well as acidic vesicles in intact livingcells under various conditions using high-resolution fluores-cence microscopy.
■ EXPERIMENTAL SECTIONBuffers and Solutions. Materials used for cell culture were
purchased from Greiner Bio-One (Kremsmunster, Austria). Re-striction enzymes, chemically competent 10-beta Escherichia coli (E.coli) cells for cloning and chemically competent BL21 (DE3) E. colicells for protein expression were obtained from New England Biolabs(Ipswich, MA, USA). Agar−Agar Kobe I, CaCl2, D-Glucose, HEPES,KCl, MgCl2, NaCl, NaOH, Triton X-100, Trypton/Pepton, and Yeastextract were purchased from Carl Roth (Graz, Austria). Agarose wasobtained from VWR International (Vienna, Austria). Lysis buffer (inmM): 100 Na2HPO4, 200 NaCl, 10 imidazole, 250 units of BenzonaseNuclease, and bacterial Protease Inhibitor Cocktail, pH 8.0. Bufferformulations were as follows: Washing buffer (in mM): 100Na2HPO4, 200 NaCl, 40 Imidazole, pH 8.0. Purification buffer (inmM): 100 Na2HPO4, 200 NaCl, 200 imidazole, pH 8.0. Elution buffer(in mM): 10 HEPES, 0.05% Triton X-100, pH 7.3 with N-Methyl-D-glucamin (NMDG). Characterization of pH-Lemon in vitro wasperformed using elution buffers with different pH values adjusted,either with HCl or with NMDG. MES was used for the adjustment ofpH values below 5.5 and MOPS was used for pH values above 9.0.The physiological buffer used for fluorescence microscopy experi-ments contained (in mM): 138 NaCl, 5 KCl, 2 CaCl2,1 MgCl2, 10 D-
glucose, pH adjusted to 7.4 with NaOH (referred to as “2Ca”). EC50values in situ were determined using a physiological buffer withdifferent pH, containing either (in mM) 10 MES (for adjustment ofpH < 5.5), 10 HEPES (pH 5.5−9.0) or 10 MOPS (pH > 9.0); pHwas adjusted using HCl or NaOH. For calcium measurements, cellswere equilibrated and incubated in EHL-buffer (in mM): 2 CaCl2,135 NaCl, 1 MgCl, 5 KCl, 10 Hepes, 2.6 NaHCO3, 0.44 KH2PO4,0.34 Na2HPO4, 1× amino acids, 1× vitamins, 10 glucose, and 2 L-glutamine with a pH of 7.45. For wide-field imaging of calciumsignals, the physiological buffer was modified (in mM): 138 NaCl, 5KCl, 0.1 EGTA, 1 MgCl2, 10 D-glucose, pH adjusted to 7.4 withNaOH (referred to as “EGTA” in wide-field measurements).Adenosine 5′-triphosphate disodium salt (ATP) was purchasedfrom Carl Roth (Graz, Austria). Neutralization buffer was composedof “2Ca”-buffer with 0.5% NaN3 (Sigma-Aldrich, Vienna, Austria) and50 mM NH4Cl (Sigma-Aldrich, Vienna, Austria), pH adjusted to 9.0.Bafilomycin-A was purchased from Sigma-Aldrich.
Cloning. The cloning of differently targeted pH-probes wasperformed using standard cloning protocols provided by themanufacturer. Primers and cloning steps are described in more detailin the SI (page S-2).
Cell Culture and Transfection. HeLa and HEK-293 cells werecultured in DMEM containing 10% FCS, 100 U mL−1 penicillin, 100μg mL−1 streptomycin, and 2.5 μg mL−1 Fungizone (Thermo FisherScientific). For the cultivation of INS-1 832/13 (INS-1) cells, GibcoRPMI 1640 media (ThermoFisher) was used. All cell types werecultivated in a humidified incubator (37 °C, 5% CO2). To transfectHeLa cells, PolyJet (SignaGen Laboratories, Rockville, USA) wasused as transfection reagent 48 h prior to measurements according tomanufacturer’s protocol. For transfection of INS-1 and HEK-293cells, TransFast transfection reagent (Promega, Madison, USA) wasused. Transfections using TransFast were performed using 1.5 μgplasmid DNA and 2.5 μL TransFast per milliliter. After 4 h, mediawas replaced with fresh DMEM or Gibco RPMI 1640 media. HEK-293 cells for FLIM imaging were transfected using a modifiedcalcium-phosphate method (for more details see SI page S-2).
Recombinant Protein Expression and Purification. Proteinexpression was induced by adding 1 mM β-D-1-thiogalactopyranoside(IPTG) at an OD600 of 0.8. Cell pellets were resuspended in 20 mLlysis buffer, followed by sonication (QSONICA Ultrasonic Processor;12 min, 50% amplitude, 1 s on/off) for cell lysis. Centrifugation at12 000 rpm for 45 min at 4 °C (Sorvall LYNX 6000) and filtration(0.45 μm cellulose acetate syringe filters) was used to clear the lysates.5 mL HisTrap columns (GE Healthcare, Vienna, Austria) forimmobilized metal affinity chromatography on an AKTA pure system(GE Healthcare, Vienna, Austria) were used to purify the proteins.HisTrap columns were equilibrated using lysis buffer. Cleared E. colilysates were applied to the columns at a flow rate of 2 mL min−1 andcontaminants were removed using washing buffer. Finally, proteinswere eluted with purification buffer. Proteins were further purified atroom temperature using size exclusion columns (10/300 200 pg, GEHealthcare) on an AKTA pure system (GE Healthcare) with SECbuffer. Finally, protein concentration was calculated using absorbanceat 280 nm, determined by NanoDrop 1000 UV/vis spectrometer(Thermo Fisher Scientific, Vienna, Austria).
Characterization of Recombinant pH-Lemon Variants. Thepurified proteins were analyzed using the CLARIOstar plate reader(BMG Labtech, Ortenberg, Germany). All proteins were used at afinal concentration of 200 nM. To generate the EC50 curve and testthe temperature dependency of the recombinant proteins in vitro,samples were analyzed using FRET (excitation at 430 nm ± 10 nm,emission at 475 nm ± 10 nm/dichroic mirror: 452.5 nm and emissionat 525 nm ± 10 nm/476.2 nm) and single fluorescent proteinfluorimetry (excitation at 430 nm ± 10 nm and 480 nm ± 10 nm,emissions at 475 nm ± 10 nm/452.5 and 525 nm ± 10 nm/501.2nm). FRET-spectra scans were performed using an excitation of 413.4nm ± 8 nm and emission was observed sequentially from 450 to 550nm, where the center wavelength of a 5 nm broad spectral observationwindow was shifted with a step width of 1 nm. Gain was set to 2000.EYFP spectra were generated using excitation at 480 nm ± 8 nm and
ACS Sensors Article
DOI: 10.1021/acssensors.8b01599ACS Sens. 2019, 4, 883−891
884
emission from 510 to 580 nm where the center wavelength of a 5 nmbroad spectral observation window was shifted with a step width of 1nm. Spectra were normalized for area under the curve.Live Cell Imaging. Wide-field live cell imaging was performed at
an inverted and advanced fluorescent microscope using a 40× or a100× magnification objective (EC Plan-NEO FLUAR 40×; alphaPlan FLUAR 100×, Zeiss, Gottingen, Germany) with a motorizedsample stage (TILL Photonics, Grafelfing, Germany). The micro-scope was equipped with the charge-coupled device camera AVTStingray 25 F145B (Allied Vision Technologies, Stadtroda,Germany). Prior to the measurements cells were equilibrated instorage buffer for 30 min. During the experiment, buffers wereexchanged using a flow chamber, connected to a gravity-basedperfusion system (NGFI, Graz, Austria) and a vacuum pump
(Chemistry diaphragm pump ME 1c, Vacuubrand, Wertheim,Germany). FRET imaging was performed using excitation at 430nm and emissions at 475 and 525 nm. For single fluorescent proteinfluorimetry, CFP and YFP were excited at 430 and 500 nm,respectively. Emissions were collected at 475 and 525 nm. Thesoftware Live acquisition 2 (TILL Photonics) was used foracquisition. High resolution imaging was performed using aNipkow-disk-based array confocal laser scanning microscope(ACLSM). The ACLSM consisted of a Zeiss Axiovert 200 M(Zeiss Microsystems, Jena, Germany) with a 100× objective (α Plan-Fluar 100×/1.45 oil objective, Zeiss Microsystems, Jena, Germany),equipped with VoxCell Scan (VisiTech, Sunderland, UK), and an aircooled argon ion laser system (series 543, CVI Melles Griot, CA,USA). The fluorescent proteins were illuminated sequentially using
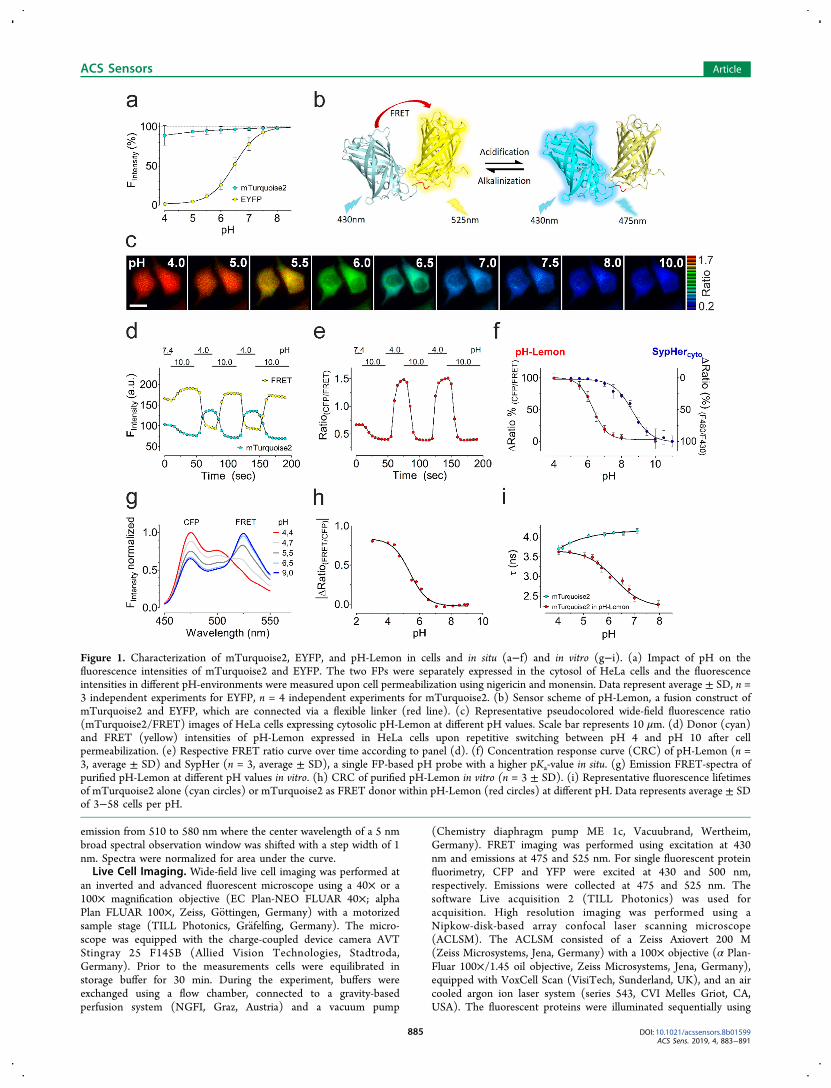
Figure 1. Characterization of mTurquoise2, EYFP, and pH-Lemon in cells and in situ (a−f) and in vitro (g−i). (a) Impact of pH on thefluorescence intensities of mTurquoise2 and EYFP. The two FPs were separately expressed in the cytosol of HeLa cells and the fluorescenceintensities in different pH-environments were measured upon cell permeabilization using nigericin and monensin. Data represent average ± SD, n =3 independent experiments for EYFP, n = 4 independent experiments for mTurquoise2. (b) Sensor scheme of pH-Lemon, a fusion construct ofmTurquoise2 and EYFP, which are connected via a flexible linker (red line). (c) Representative pseudocolored wide-field fluorescence ratio(mTurquoise2/FRET) images of HeLa cells expressing cytosolic pH-Lemon at different pH values. Scale bar represents 10 μm. (d) Donor (cyan)and FRET (yellow) intensities of pH-Lemon expressed in HeLa cells upon repetitive switching between pH 4 and pH 10 after cellpermeabilization. (e) Respective FRET ratio curve over time according to panel (d). (f) Concentration response curve (CRC) of pH-Lemon (n =3, average ± SD) and SypHer (n = 3, average ± SD), a single FP-based pH probe with a higher pKa-value in situ. (g) Emission FRET-spectra ofpurified pH-Lemon at different pH values in vitro. (h) CRC of purified pH-Lemon in vitro (n = 3 ± SD). (i) Representative fluorescence lifetimesof mTurquoise2 alone (cyan circles) or mTurquoise2 as FRET donor within pH-Lemon (red circles) at different pH. Data represents average ± SDof 3−58 cells per pH.
ACS Sensors Article
DOI: 10.1021/acssensors.8b01599ACS Sens. 2019, 4, 883−891
885
415 nm (CFP) and 510 nm (YFP) laser light. Emissions werecollected at 475 and 525 nm using a CCD camera (CoolSnap HQ2,Photometrics, Tucson, Arizona, USA) and a binning of 2. For bufferexchange a gravity-based perfusion system (NGFI, Graz, Austria) wasused. For cytosolic Ca2+ measurements cells were excited at 340 and380 nm and emission of Fura-2 was collected at 510 nm.Fluorescence Lifetime Imaging Microscopy in Situ. Fluo-
resence lifetime imaging (FLIM) was performed on an uprightfluorescence microscope (A1MP; Nikon, Amsterdam, The Nether-lands) equipped with a water immersion objective (25×; NA1.1; WD2 mm; Nikon). Two-photon excitation of the pH-Lemon donor mT2was achieved by a train of 100 fs light pulses (λexc = 880 nm; 80 MHz;Mai Tai DeepSee HP, Newport Spectra Physics; Irvine, CA).Fluorescence was detected with a GaAsP hybrid photodetector(HPM-100−40; Becker & Hickl, Berlin, Germany) after passing abandpass filter at 445 ± 45 nm (445BP90, Omega Optical,Brattleboro, VT, USA). Fluorescence intensity decays were generatedin every pixel of the image using multidimensional time-correlatedsingle photon counting (TCSPC) employing TCSPC electronics(SPC-152; Becker & Hickl). FLIM images were generated usingSPCImage 6.1 (Becker & Hickl) by plotting the amplitude weightedaverage fluorescence lifetime tau_ave as color-coded value. tau_meanwas obtained from iterative least-squares minimizing based fittingroutine of a biexponential fitting function which was reconvolutedwith the instrument response function to describe the time course ofthe pixel fluorescence intensity decays properly.Fluorescence Lifetime Imaging Spectroscopy in Vitro.
Fluorescence lifetimes of purified pH-Lemon expressed in E. coliwere also determined from time-resolved fluorescence measurementsusing a time-resolved fluorescence spectrophotometer (Fluotime 100;Picoquant; Berlin; Germany) based on a PicoHarp300 unit (TCSPC-based), with a pulsed diode laser (LDHC440; λexc = 440 nm; 50 pspulse width; 20 MHz repetition frequency) as excitation source and aphotomultiplier for single photon detection. Donor and acceptoremission of pH-Lemon was selected at 475 and 530 nm, respectively,by applying a monochromator.Calibration of pH-Lemon - cyto. HeLa cells were permeabilized
using 5 μM nigericin (Tocris, Abingdon, United Kingdom) and 10μM monensin (Sigma-Aldrich, Vienna, Austria). The intracellular pHwas adjusted via perfusion of an extracellular experimental buffer withdistinct pH values.Calibration of pH-Lemon - GPI. HeLa cells were perfused with
an extracellular buffer with pH 4.0 and 10.0 representing theminimum and maximum of the sensor. Respective maximal andminimal ratio signals of the cell surface of single cells were used todefine pH values according to the formula shown in SI on page S-2.Starvation of Cells. For autophagy induction, cells were washed
with PBS twice to remove the nutrients and starved for at least 1 h innutrient free salt-buffer solution (“2Ca-buffer”).Neutralization of Endosomal Vesicles. Vesicles were either
neutralized using incubation with neutralization buffer (see Buffersand Solutions) for 5 min or preincubation with 0.5 μM bafilomycin-Ain DMEM for 70 min at 37 °C (for the subsequent experiments, Baf-A was present in every buffer).Co-Localization of pH-Lemon with mCherry-Golgi-7. Cells
were cotransfected with pH-Lemon and mCherry-Golgi-7, which wasa gift from Michael Davidson (Addgene plasmid # 55167). For cellfixation, HeLa cells were washed 3 times with PBS, followed by 10min incubation at room temperature with 3.7% paraformaldehyde(PFA). After 3 additional washing steps, cells were kept in PBS forimaging.Cytosolic Ca2+ Measurements. For the measurement of
cytosolic Ca2+ levels, HeLa cells were washed 3 times with EHL-buffer and then loaded with 3.3 μM Fura-2 AM in EHL-buffer for 45min. After washing several times with EHL-buffer, cells weremeasured using wide-field microscopy. 100 μM ATP was used asan IP3-generating agonist in “2 Ca”- or “EGTA”- buffer for Ca2+
mobilization.
Acidic Compartment Staining. LysoTracker Red DND-99(ThermoFisher, Vienna, Austria) was used for 30 min at 37 °C at afinal concentration of 75 nM.
Data Analysis. Obtained data were analyzed using Excel(Microsoft), MetaMorph (Molecular devices), and GraphPad Prism5 Software (GraphPad Software, Inc., La Jolla, CA, USA).Pseudocolored ratio images were generated using MetaMorphsoftware. Ratio scale was set as demonstrated in the figures. Fordata visualization, CorelDraw was used. Images generated usingACLSM were adjusted in light and contrast (+40/+40%). For thecalculation of the EC50 values, the FRET (or YFP) fluorescence wasdivided by the mTurquoise2 fluorescence (Figure 1h,i, Figure S1c,and Figure 2b). Since 100% of the EYFP fluorescence were quenchedat a pH of 4.0, dividing FRET/mTurquoise2 avoided a mathemati-cally incorrect division by 0.
■ RESULTS AND DISCUSSIONBased on the principle of pHlameleon,27 we generated a novelbiosensor that builds on the pH stable mTurquoise231 and thehighly pH sensitive EYFP29 (Figure 1a,b and SI Figure S-1a).The fluorescence of mTurquoise2 remained stable over aconsiderable range of pH values (Figure 1a). The pH-sensitiveEYFP, however, already displayed high pH sensitivity and,thus, a significant loss of fluorescence intensity of 50% at pH6.3. Moreover, at pH 4.0, the fluorescence intensity of EYFPwas almost quenched up to 100% (Figure 1a). Since the newsensor is based on the bright yellow pH sensitive EYFP, wenamed it pH-Lemon. Analogously to the pHlameleonprinciple,27 pH-Lemon represents a ratiometric pH sensor,that consists of two, via a flexible GGGGS linker, closely fused,differently colored FPs to yield high FRET ratio signals atneutral to alkaline pH values (Figure 1b). Due to the pHsensitivity of the FRET acceptor, we expected the FRET ratiosignal of pH-Lemon to decrease upon acidification (Figure1b). Investigation of cells expressing pH-Lemon that weretreated with nigericin and monensin and exposed toextracellular solutions of different pH allowed the observation
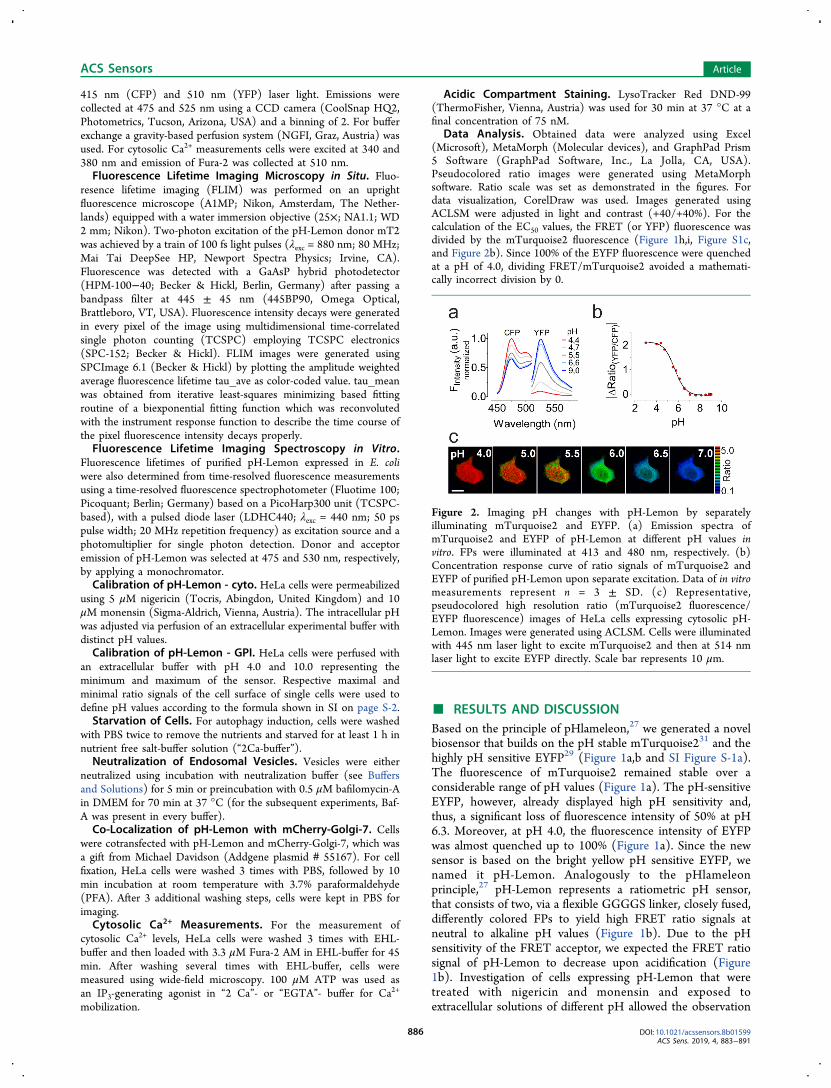
Figure 2. Imaging pH changes with pH-Lemon by separatelyilluminating mTurquoise2 and EYFP. (a) Emission spectra ofmTurquoise2 and EYFP of pH-Lemon at different pH values invitro. FPs were illuminated at 413 and 480 nm, respectively. (b)Concentration response curve of ratio signals of mTurquoise2 andEYFP of purified pH-Lemon upon separate excitation. Data of in vitromeasurements represent n = 3 ± SD. (c) Representative,pseudocolored high resolution ratio (mTurquoise2 fluorescence/EYFP fluorescence) images of HeLa cells expressing cytosolic pH-Lemon. Images were generated using ACLSM. Cells were illuminatedwith 445 nm laser light to excite mTurquoise2 and then at 514 nmlaser light to excite EYFP directly. Scale bar represents 10 μm.
ACS Sensors Article
DOI: 10.1021/acssensors.8b01599ACS Sens. 2019, 4, 883−891
886

of large pH-dependent, ratiometric changes of the FRET-ratio(Figure 1c−e). The half maximal effective concentration(EC50) of the pH dependent changes in FRET ratios was 6.3(6.27−6.35) in situ (Figure 1f and Figure S-1b). Compared toSypHer (Figure 1f), another genetically encoded pH biosensor,pH-Lemon displayed a significantly higher sensitivity through-out the neutral-to-acidic pH range. It was demonstrated earlierthat mTurquoise2 is suitable as a FRET-donor for multipleacceptors. Since mTurquoise2 has an extremely low pKa and ahigher brightness, as well as higher lifetime compared to othercyan FPs, the use of mTurquoise2 seems highly advanta-geous.28,31,32 However, the pH-sensitivity of pH-Lemon andpHlameleons might further be adjusted by mutations orexchanging the FRET-acceptor, EYFP, for another FP variant.For further characterization in vitro on a plate reader we
purified bacterially expressed pH-Lemon. Figure 1g shows theemission spectra of purified pH-Lemon at different pH valuesupon excitation of the FRET donor, i.e., mTurquoise2. In linewith our findings in intact cells, acidification reduced the FRETsignal and consequently increased mTurquoise2 fluorescenceof pH-Lemon (Figure 1g,h). The EC50 of the recombinantconstruct was 5.4 (5.3−5.46) (Figure 1h). The higher pKa
values in situ might be due to the intracellular, protein-richenvironment, or limited H+ cell-permeability. The strong pHsensitivity of the purified pH-Lemon remained unaffected byincreasing the temperature up to 45 °C (Figure S-1c), pointingto the temperature stability of the probe. As depicted in Figure1b, in pH-Lemon, the C-terminus of mTurquoise2 was fusedto the N-terminus of EYFP via a small, flexible linker to yieldhigh FRET. To verify whether the sequential order of the FPshas an impact on the FRET efficiency we constructed ananalogous construct in which the N-terminus of mTurquoise2was fused to the C-terminus of EYFP (Figure S-1d). Thisapproach increased the dynamic range (Figure S-1d and e),with an EC50 of 6.2 (6.18−6.32) (Figure S-1f). Next we testedwhether an additional mTurquoise2 on the C-terminus ofmTurquoise2-EYFP to yield a triple FP sensor (Figure S-1g)would further increase the dynamic range. Unexpectedly, theFRET signal of this construct was very low (Figure S-1h).Fluorescence lifetime imaging microscopy (FLIM) of HEK-293 cells expressing mTurquoise2 or pH-Lemon confirmed thepH stability of mTurquoise2, the functionality and the highdynamic range of the pH probe (Figure 1i).
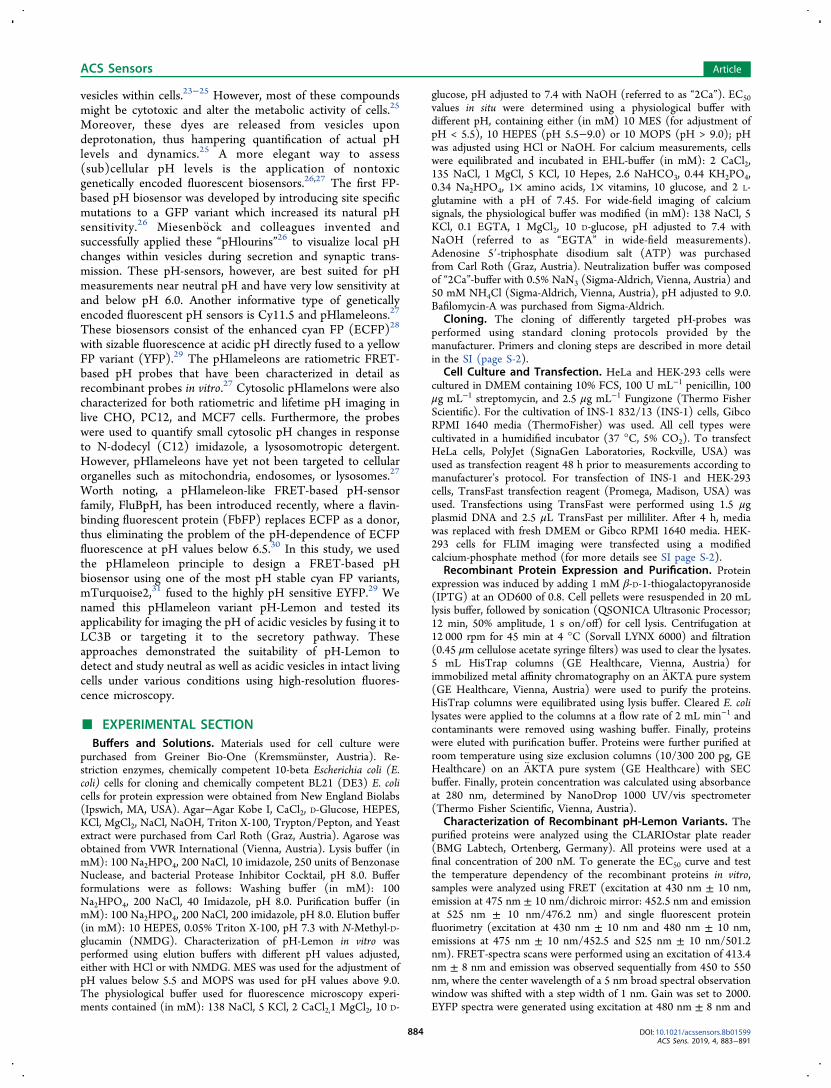
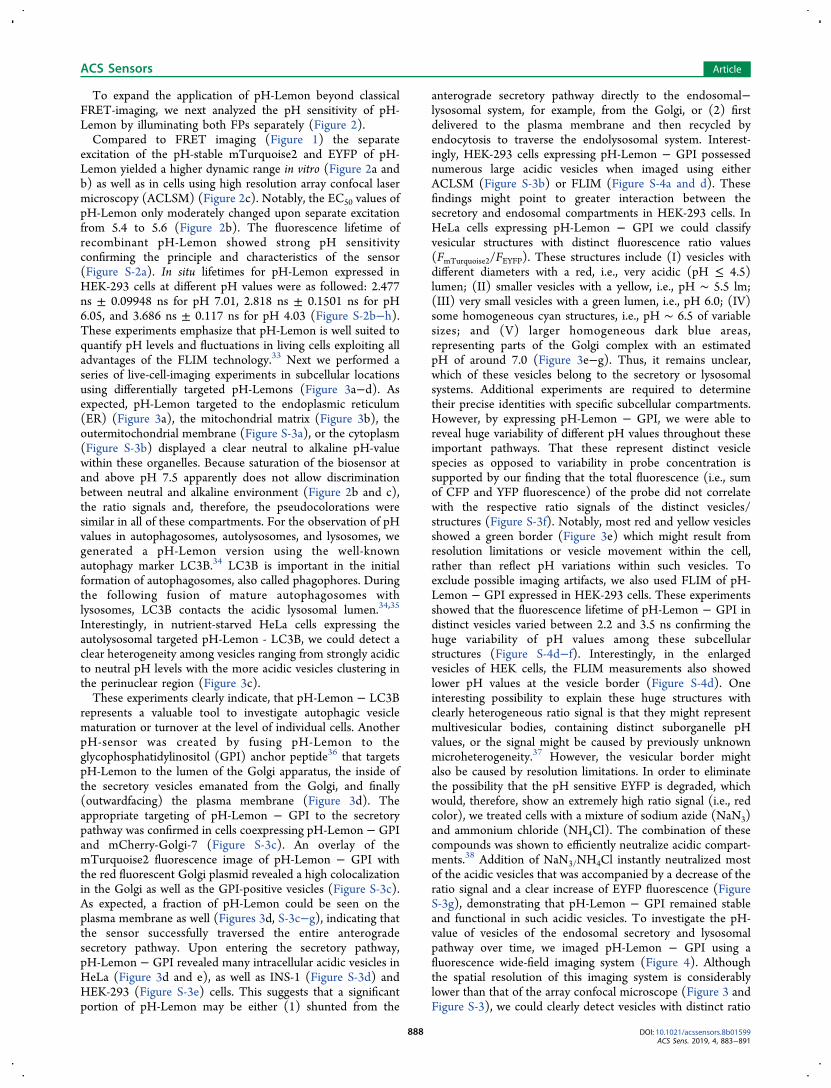
Figure 3. High-resolution imaging (ACLSM) of organelle targeted pH-Lemon. Representative pseudocolor ratio image (FmTurquoise2/FEYFP) of HeLacells expressing pH-Lemon targeted into (a) the ER lumen, (b) the mitochondrial matrix, (c) fused to LC3B to target pH-Lemon toautophagosomes and autophagolysosomes, or (d) a GPI-anchor. Scale bar represents 10 μm. (e) Zoom images of pH-Lemon − GPI revealing thedifferent colored vesicles with distinct ratio values, i.e., pH levels. Scale bar in upper panel represents 1 μm, in lower panel 10 μm. (f) X−Y plotshowing the number of intracellular structures with defined ratio values, i.e., pH levels per z-plane of individual HeLa cells (small dots, n = 10 cells).Large dots represent average ± SEM. Connections by thin lines represent 1 cell. (g) Comparison of the vesicle area (in pixel) of different coloredvesicles. Data represents median ± interquartile ranges, n = 10 cells, 1550 vesicles were analyzed in total.
ACS Sensors Article
DOI: 10.1021/acssensors.8b01599ACS Sens. 2019, 4, 883−891
887
To expand the application of pH-Lemon beyond classicalFRET-imaging, we next analyzed the pH sensitivity of pH-Lemon by illuminating both FPs separately (Figure 2).Compared to FRET imaging (Figure 1) the separate
excitation of the pH-stable mTurquoise2 and EYFP of pH-Lemon yielded a higher dynamic range in vitro (Figure 2a andb) as well as in cells using high resolution array confocal lasermicroscopy (ACLSM) (Figure 2c). Notably, the EC50 values ofpH-Lemon only moderately changed upon separate excitationfrom 5.4 to 5.6 (Figure 2b). The fluorescence lifetime ofrecombinant pH-Lemon showed strong pH sensitivityconfirming the principle and characteristics of the sensor(Figure S-2a). In situ lifetimes for pH-Lemon expressed inHEK-293 cells at different pH values were as followed: 2.477ns ± 0.09948 ns for pH 7.01, 2.818 ns ± 0.1501 ns for pH6.05, and 3.686 ns ± 0.117 ns for pH 4.03 (Figure S-2b−h).These experiments emphasize that pH-Lemon is well suited toquantify pH levels and fluctuations in living cells exploiting alladvantages of the FLIM technology.33 Next we performed aseries of live-cell-imaging experiments in subcellular locationsusing differentially targeted pH-Lemons (Figure 3a−d). Asexpected, pH-Lemon targeted to the endoplasmic reticulum(ER) (Figure 3a), the mitochondrial matrix (Figure 3b), theoutermitochondrial membrane (Figure S-3a), or the cytoplasm(Figure S-3b) displayed a clear neutral to alkaline pH-valuewithin these organelles. Because saturation of the biosensor atand above pH 7.5 apparently does not allow discriminationbetween neutral and alkaline environment (Figure 2b and c),the ratio signals and, therefore, the pseudocolorations weresimilar in all of these compartments. For the observation of pHvalues in autophagosomes, autolysosomes, and lysosomes, wegenerated a pH-Lemon version using the well-knownautophagy marker LC3B.34 LC3B is important in the initialformation of autophagosomes, also called phagophores. Duringthe following fusion of mature autophagosomes withlysosomes, LC3B contacts the acidic lysosomal lumen.34,35
Interestingly, in nutrient-starved HeLa cells expressing theautolysosomal targeted pH-Lemon - LC3B, we could detect aclear heterogeneity among vesicles ranging from strongly acidicto neutral pH levels with the more acidic vesicles clustering inthe perinuclear region (Figure 3c).These experiments clearly indicate, that pH-Lemon − LC3B
represents a valuable tool to investigate autophagic vesiclematuration or turnover at the level of individual cells. AnotherpH-sensor was created by fusing pH-Lemon to theglycophosphatidylinositol (GPI) anchor peptide36 that targetspH-Lemon to the lumen of the Golgi apparatus, the inside ofthe secretory vesicles emanated from the Golgi, and finally(outwardfacing) the plasma membrane (Figure 3d). Theappropriate targeting of pH-Lemon − GPI to the secretorypathway was confirmed in cells coexpressing pH-Lemon − GPIand mCherry-Golgi-7 (Figure S-3c). An overlay of themTurquoise2 fluorescence image of pH-Lemon − GPI withthe red fluorescent Golgi plasmid revealed a high colocalizationin the Golgi as well as the GPI-positive vesicles (Figure S-3c).As expected, a fraction of pH-Lemon could be seen on theplasma membrane as well (Figures 3d, S-3c−g), indicating thatthe sensor successfully traversed the entire anterogradesecretory pathway. Upon entering the secretory pathway,pH-Lemon − GPI revealed many intracellular acidic vesicles inHeLa (Figure 3d and e), as well as INS-1 (Figure S-3d) andHEK-293 (Figure S-3e) cells. This suggests that a significantportion of pH-Lemon may be either (1) shunted from the
anterograde secretory pathway directly to the endosomal−lysosomal system, for example, from the Golgi, or (2) firstdelivered to the plasma membrane and then recycled byendocytosis to traverse the endolysosomal system. Interest-ingly, HEK-293 cells expressing pH-Lemon − GPI possessednumerous large acidic vesicles when imaged using eitherACLSM (Figure S-3b) or FLIM (Figure S-4a and d). Thesefindings might point to greater interaction between thesecretory and endosomal compartments in HEK-293 cells. InHeLa cells expressing pH-Lemon − GPI we could classifyvesicular structures with distinct fluorescence ratio values(FmTurquoise2/FEYFP). These structures include (I) vesicles withdifferent diameters with a red, i.e., very acidic (pH ≤ 4.5)lumen; (II) smaller vesicles with a yellow, i.e., pH ∼ 5.5 lm;(III) very small vesicles with a green lumen, i.e., pH 6.0; (IV)some homogeneous cyan structures, i.e., pH ∼ 6.5 of variablesizes; and (V) larger homogeneous dark blue areas,representing parts of the Golgi complex with an estimatedpH of around 7.0 (Figure 3e−g). Thus, it remains unclear,which of these vesicles belong to the secretory or lysosomalsystems. Additional experiments are required to determinetheir precise identities with specific subcellular compartments.However, by expressing pH-Lemon − GPI, we were able toreveal huge variability of different pH values throughout theseimportant pathways. That these represent distinct vesiclespecies as opposed to variability in probe concentration issupported by our finding that the total fluorescence (i.e., sumof CFP and YFP fluorescence) of the probe did not correlatewith the respective ratio signals of the distinct vesicles/structures (Figure S-3f). Notably, most red and yellow vesiclesshowed a green border (Figure 3e) which might result fromresolution limitations or vesicle movement within the cell,rather than reflect pH variations within such vesicles. Toexclude possible imaging artifacts, we also used FLIM of pH-Lemon − GPI expressed in HEK-293 cells. These experimentsshowed that the fluorescence lifetime of pH-Lemon − GPI indistinct vesicles varied between 2.2 and 3.5 ns confirming thehuge variability of pH values among these subcellularstructures (Figure S-4d−f). Interestingly, in the enlargedvesicles of HEK cells, the FLIM measurements also showedlower pH values at the vesicle border (Figure S-4d). Oneinteresting possibility to explain these huge structures withclearly heterogeneous ratio signal is that they might representmultivesicular bodies, containing distinct suborganelle pHvalues, or the signal might be caused by previously unknownmicroheterogeneity.37 However, the vesicular border mightalso be caused by resolution limitations. In order to eliminatethe possibility that the pH sensitive EYFP is degraded, whichwould, therefore, show an extremely high ratio signal (i.e., redcolor), we treated cells with a mixture of sodium azide (NaN3)and ammonium chloride (NH4Cl). The combination of thesecompounds was shown to efficiently neutralize acidic compart-ments.38 Addition of NaN3/NH4Cl instantly neutralized mostof the acidic vesicles that was accompanied by a decrease of theratio signal and a clear increase of EYFP fluorescence (FigureS-3g), demonstrating that pH-Lemon − GPI remained stableand functional in such acidic vesicles. To investigate the pH-value of vesicles of the endosomal secretory and lysosomalpathway over time, we imaged pH-Lemon − GPI using afluorescence wide-field imaging system (Figure 4). Althoughthe spatial resolution of this imaging system is considerablylower than that of the array confocal microscope (Figure 3 andFigure S-3), we could clearly detect vesicles with distinct ratio
ACS Sensors Article
DOI: 10.1021/acssensors.8b01599ACS Sens. 2019, 4, 883−891
888
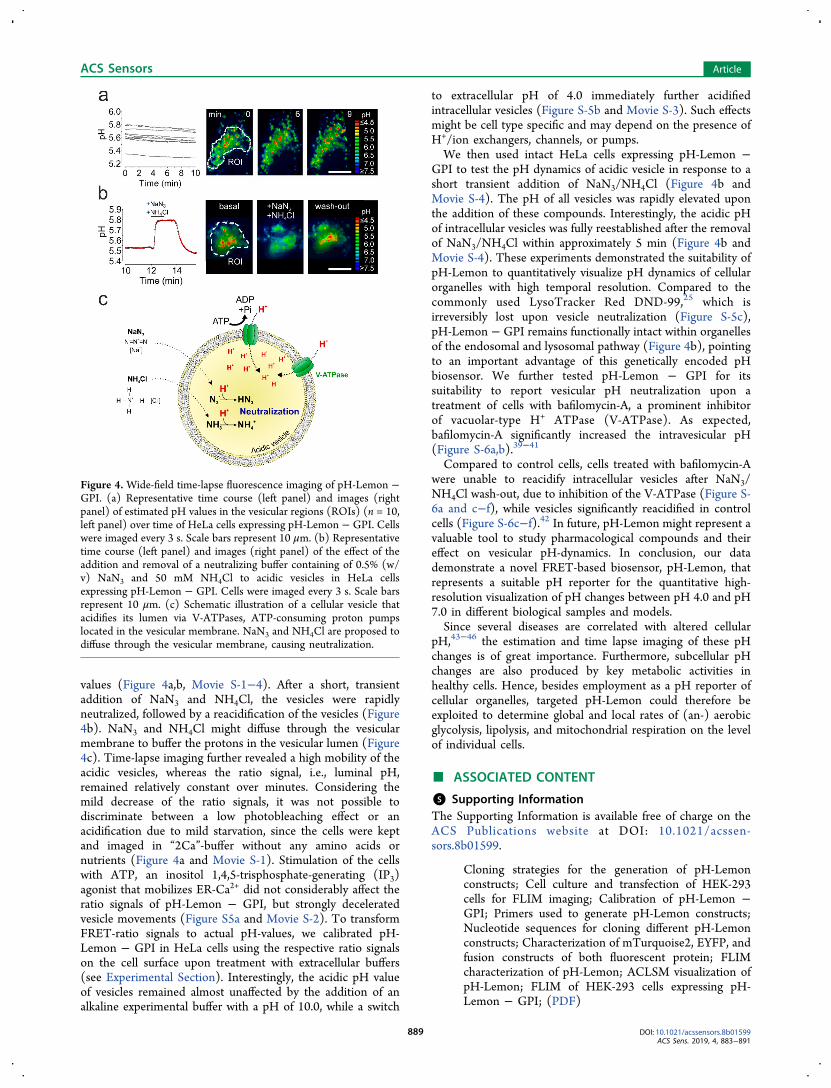
values (Figure 4a,b, Movie S-1−4). After a short, transientaddition of NaN3 and NH4Cl, the vesicles were rapidlyneutralized, followed by a reacidification of the vesicles (Figure4b). NaN3 and NH4Cl might diffuse through the vesicularmembrane to buffer the protons in the vesicular lumen (Figure4c). Time-lapse imaging further revealed a high mobility of theacidic vesicles, whereas the ratio signal, i.e., luminal pH,remained relatively constant over minutes. Considering themild decrease of the ratio signals, it was not possible todiscriminate between a low photobleaching effect or anacidification due to mild starvation, since the cells were keptand imaged in “2Ca”-buffer without any amino acids ornutrients (Figure 4a and Movie S-1). Stimulation of the cellswith ATP, an inositol 1,4,5-trisphosphate-generating (IP3)agonist that mobilizes ER-Ca2+ did not considerably affect theratio signals of pH-Lemon − GPI, but strongly deceleratedvesicle movements (Figure S5a and Movie S-2). To transformFRET-ratio signals to actual pH-values, we calibrated pH-Lemon − GPI in HeLa cells using the respective ratio signalson the cell surface upon treatment with extracellular buffers(see Experimental Section). Interestingly, the acidic pH valueof vesicles remained almost unaffected by the addition of analkaline experimental buffer with a pH of 10.0, while a switch
to extracellular pH of 4.0 immediately further acidifiedintracellular vesicles (Figure S-5b and Movie S-3). Such effectsmight be cell type specific and may depend on the presence ofH+/ion exchangers, channels, or pumps.We then used intact HeLa cells expressing pH-Lemon −
GPI to test the pH dynamics of acidic vesicle in response to ashort transient addition of NaN3/NH4Cl (Figure 4b andMovie S-4). The pH of all vesicles was rapidly elevated uponthe addition of these compounds. Interestingly, the acidic pHof intracellular vesicles was fully reestablished after the removalof NaN3/NH4Cl within approximately 5 min (Figure 4b andMovie S-4). These experiments demonstrated the suitability ofpH-Lemon to quantitatively visualize pH dynamics of cellularorganelles with high temporal resolution. Compared to thecommonly used LysoTracker Red DND-99,25 which isirreversibly lost upon vesicle neutralization (Figure S-5c),pH-Lemon − GPI remains functionally intact within organellesof the endosomal and lysosomal pathway (Figure 4b), pointingto an important advantage of this genetically encoded pHbiosensor. We further tested pH-Lemon − GPI for itssuitability to report vesicular pH neutralization upon atreatment of cells with bafilomycin-A, a prominent inhibitorof vacuolar-type H+ ATPase (V-ATPase). As expected,bafilomycin-A significantly increased the intravesicular pH(Figure S-6a,b).39−41
Compared to control cells, cells treated with bafilomycin-Awere unable to reacidify intracellular vesicles after NaN3/NH4Cl wash-out, due to inhibition of the V-ATPase (Figure S-6a and c−f), while vesicles significantly reacidified in controlcells (Figure S-6c−f).42 In future, pH-Lemon might represent avaluable tool to study pharmacological compounds and theireffect on vesicular pH-dynamics. In conclusion, our datademonstrate a novel FRET-based biosensor, pH-Lemon, thatrepresents a suitable pH reporter for the quantitative high-resolution visualization of pH changes between pH 4.0 and pH7.0 in different biological samples and models.Since several diseases are correlated with altered cellular
pH,43−46 the estimation and time lapse imaging of these pHchanges is of great importance. Furthermore, subcellular pHchanges are also produced by key metabolic activities inhealthy cells. Hence, besides employment as a pH reporter ofcellular organelles, targeted pH-Lemon could therefore beexploited to determine global and local rates of (an-) aerobicglycolysis, lipolysis, and mitochondrial respiration on the levelof individual cells.
■ ASSOCIATED CONTENT
*S Supporting InformationThe Supporting Information is available free of charge on theACS Publications website at DOI: 10.1021/acssen-sors.8b01599.
Cloning strategies for the generation of pH-Lemonconstructs; Cell culture and transfection of HEK-293cells for FLIM imaging; Calibration of pH-Lemon −GPI; Primers used to generate pH-Lemon constructs;Nucleotide sequences for cloning different pH-Lemonconstructs; Characterization of mTurquoise2, EYFP, andfusion constructs of both fluorescent protein; FLIMcharacterization of pH-Lemon; ACLSM visualization ofpH-Lemon; FLIM of HEK-293 cells expressing pH-Lemon − GPI; (PDF)
Figure 4. Wide-field time-lapse fluorescence imaging of pH-Lemon −GPI. (a) Representative time course (left panel) and images (rightpanel) of estimated pH values in the vesicular regions (ROIs) (n = 10,left panel) over time of HeLa cells expressing pH-Lemon − GPI. Cellswere imaged every 3 s. Scale bars represent 10 μm. (b) Representativetime course (left panel) and images (right panel) of the effect of theaddition and removal of a neutralizing buffer containing of 0.5% (w/v) NaN3 and 50 mM NH4Cl to acidic vesicles in HeLa cellsexpressing pH-Lemon − GPI. Cells were imaged every 3 s. Scale barsrepresent 10 μm. (c) Schematic illustration of a cellular vesicle thatacidifies its lumen via V-ATPases, ATP-consuming proton pumpslocated in the vesicular membrane. NaN3 and NH4Cl are proposed todiffuse through the vesicular membrane, causing neutralization.
ACS Sensors Article
DOI: 10.1021/acssensors.8b01599ACS Sens. 2019, 4, 883−891
889
Movie S-1: Real-time imaging of pH-Lemon − GPI inHeLa cells over 10 min (AVI)Movie S-2: Elevated cytosolic Ca2+ levels due to additionof an IP3-generating agonist in pH-Lemon − GPIexpressing HeLa cells (AVI)Movie S-3: Effects of extracellular, nonpermeabilizingbuffer change on the vesicular pH of GPI vesicles (AVI)Movie S-4: Addition of sodium azide and ammoniumchloride to neutralize acidic vesicles in HeLa cells (AVI)
■ AUTHOR INFORMATIONCorresponding Authors*E-mail: [email protected] (S. B.).*E-mail: [email protected] (H. B.).*E-mail: [email protected] (M. W.-W.).*E-mail: [email protected] (W. F. G.).*E-mail: [email protected] (R. M.).ORCIDRoland Malli: 0000-0001-6327-8729Author ContributionsS. Bu. designed and cloned the pH-Lemon constructs,performed experiments, analyzed all data and wrote themanuscript. H.B., B.G., and J.R.-M. assisted in data analysis;E.E., M.W.-W., and J.C.H. contributed to the experimentaldesign; S.S. and T.M. performed protein expression andpurification; T.G. S. Ba. and A.B. performed FLIM experi-ments; R.R. assisted with cell culture; W.F.G. together withR.M. supervised the project and wrote the manuscript.NotesThe authors declare no competing financial interest.
■ ACKNOWLEDGMENTSWe thank C.B. Newgard, Department of Pharmacology andCancer Biology, Duke University School of Medicine, USA, forproviding us with INS-1 832/13 cells. We thank MichaelDavidson (National High Magnetic Field Laboratory, Florida,USA) for mCherry-Golgi-7. The authors further acknowledgeSandra Blass and Anna Schreilechner for the excellent technicalsupport and the scientific advisory board of Next GenerationFluorescence Imaging (NGFI) GmbH (http://www.ngfi.eu/),a spin-off company of the Medical University of Graz. Theresearch was funded by the Ph.D. program Molecular Medicine(MOLMED) of the Medical University of Graz, by NikonAustria within the Nikon-Center of Excellence, Graz, theAustrian Science Fund (FWF) projects I3716−B27 andP28529−B27 to R.M., the doctoral program Metabolic andCardiovascular Disease (DK-W1226), and P27070 to W.F.G.The Nikon Center of Excellence, Graz, is supported by theAustrian infrastructure program 2013/2014, Nikon AustriaInc., and BioTechMed, Graz. This work was partly supportedby the President’s International Fellowship Initiative of CAS(No. 2015VBB045), the National Natural Science Foundationof China (No. 31450110423), the Austrian Science Fund(FWF: P28854 and I3792), the Austrian Research PromotionAgency (FFG: 864690), the Integrative Metabolism ResearchCenter Graz, the Austrian infrastructure program 2016/2017,BioTechMed/Graz, and the OMICS center Graz to T. M.
■ REFERENCES(1) Alberty, R. A Kinetic effects of the ionization of groups in theenzyme molecule. J. Cell. Comp. Physiol. 1956, 47, 245−281.
(2) Tamai, I.; Yabuuchi, H.; Nezu, J.; Sai, Y.; Oku, A.; Shimane, M.;Tsuji, A. Cloning and characterization of a novel human pH-dependent organic cation transporter, OCTN1. FEBS Lett. 1997, 419,107−111.(3) Eriksen, J.; Chang, R.; McGregor, M.; Silm, K.; Suzuki, T.;Edwards, R. H. Protons Regulate Vesicular Glutamate Transportersthrough an Allosteric Mechanism. Neuron 2016, 90, 768−780.(4) Coulter, K. L.; Perier, F.; Radeke, C. M.; Vandenberg, C. A.Identification and molecular localization of a pH-sensing domain forthe inward rectifier potassium channel HIR. Neuron 1995, 15, 1157−1168.(5) Han, J.-E.; Cho, J.-H.; Choi, I.-S.; Kim, D.-Y.; Jang, I.-S. Effectsof acidic pH on voltage-gated ion channels in rat trigeminalmesencephalic nucleus neurons. Korean J. Physiol. Pharmacol. 2017,21, 215−223.(6) Vullo, S.; Bonifacio, G.; Roy, S.; Johner, N.; Berneche, S.;Kellenberger, S. Conformational dynamics and role of the acidicpocket in ASIC pH-dependent gating. Proc. Natl. Acad. Sci. U. S. A.2017, 114, 3768−3773.(7) Mikles, D. C.; Bhat, V.; Schuchardt, B. J.; Deegan, B. J.; Seldeen,K. L.; McDonald, C. B.; Farooq, A. pH modulates the binding of earlygrowth response protein 1 transcription factor to DNA. FEBS J. 2013,280, 3669−3684.(8) Madshus, I. H. Regulation of intracellular pH in eukaryotic cells.Biochem. J. 1988, 250, 1−8.(9) Dechant, R.; Peter, M. Cytosolic pH: A conserved regulator ofcell growth? Molecular & Cellular Oncology 2014, 1, e969643.(10) Santo-Domingo, J.; Demaurex, N. Perspectives on: SGPsymposium on mitochondrial physiology and medicine: therenaissance of mitochondrial pH. J. Gen. Physiol. 2012, 139, 415−423.(11) Hu, Y.-B.; Dammer, E. B.; Ren, R.-J.; Wang, G. The endosomal-lysosomal system: from acidification and cargo sorting to neuro-degeneration. Transl. Neurodegener. 2015, 4, 18.(12) Wileman, T. Autophagy as a defence against intracellularpathogens. Essays Biochem. 2013, 55, 153−163.(13) Schmidt, W. K.; Moore, H. P. Ionic milieu controls thecompartment-specific activation of pro-opiomelanocortin processingin AtT-20 cells. Mol. Biol. Cell 1995, 6, 1271−1285.(14) Huotari, J.; Helenius, A. Endosome maturation. EMBO J. 2011,30, 3481−3500.(15) DiCiccio, J. E.; Steinberg, B. E. Lysosomal pH and analysis ofthe counter ion pathways that support acidification. J. Gen. Physiol.2011, 137, 385−390.(16) Johnson, D. E.; Ostrowski, P.; Jaumouille, V.; Grinstein, S. Theposition of lysosomes within the cell determines their luminal pH. J.Cell Biol. 2016, 212, 677−692.(17) Breton, S.; Brown, D. Regulation of luminal acidification by theV-ATPase. Physiology 2013, 28, 318−329.(18) Perez-Sayans. Role of V-ATPases in solid tumors: Importanceof the subunit C (Review). Int. J. Oncol. 2009, 34, 1 DOI: 10.3892/ijo_00000280.(19) Hu, Y.-B.; Dammer, E. B.; Ren, R.-J.; Wang, G. The endosomal-lysosomal system: from acidification and cargo sorting to neuro-degeneration. Transl. Neurodegener. 2015, 4, 1 DOI: 10.1186/s40035-015-0041-1.(20) Mauvezin, C.; Nagy, P.; Juhasz, G.; Neufeld, T. P.Autophagosome-lysosome fusion is independent of V-ATPase-mediated acidification. Nat. Commun. 2015, 6, 7007.(21) Mindell, J. A. Lysosomal acidification mechanisms. Annu. Rev.Physiol. 2012, 74, 69−86.(22) Hou, J.-T.; Ren, W. X.; Li, K.; Seo, J.; Sharma, A.; Yu, X.-Q.;Kim, J. S. Fluorescent bioimaging of pH: from design to applications.Chem. Soc. Rev. 2017, 46, 2076−2090.(23) Han, J.; Burgess, K. Fluorescent indicators for intracellular pH.Chem. Rev. 2010, 110, 2709−2728.(24) Fernandez, A.; Vendrell, M. Smart fluorescent probes forimaging macrophage activity. Chem. Soc. Rev. 2016, 45, 1182−1196.(25) Pierzyn ska-Mach, A.; Janowski, P. A.; Dobrucki, J. W.Evaluation of acridine orange, LysoTracker Red, and quinacrine as
ACS Sensors Article
DOI: 10.1021/acssensors.8b01599ACS Sens. 2019, 4, 883−891
890

fluorescent probes for long-term tracking of acidic vesicles. Cytometry,Part A 2014, 85, 729−737.(26) Miesenbock, G.; de Angelis, D. A.; Rothman, J. E. Visualizingsecretion and synaptic transmission with pH-sensitive greenfluorescent proteins. Nature 1998, 394, 192−195.(27) Esposito, A.; Gralle, M.; Dani, M. A. C.; Lange, D.; Wouters, F.S. pHlameleons: a family of FRET-based protein sensors forquantitative pH imaging. Biochemistry 2008, 47, 13115−13126.(28) Rizzo, M. A.; Springer, G. H.; Granada, B.; Piston, D. W. Animproved cyan fluorescent protein variant useful for FRET. Nat.Biotechnol. 2004, 22, 445−449.(29) Kremers, G.-J.; Goedhart, J.; van Munster, E. B.; Gadella, T. W.J. Cyan and yellow super fluorescent proteins with improvedbrightness, protein folding, and FRET Forster radius. Biochemistry2006, 45, 6570−6580.(30) Rupprecht, C.; Wingen, M.; Potzkei, J.; Gensch, T.; Jaeger, K.-E.; Drepper, T. A novel FbFP-based biosensor toolbox for sensitive invivo determination of intracellular pH. J. Biotechnol. 2017, 258, 25−32.(31) Goedhart, J.; von Stetten, D.; Noirclerc-Savoye, M.;Lelimousin, M.; Joosen, L.; Hink, M. A.; van Weeren, L.; Gadella,T. W.J.; Royant, A. Structure-guided evolution of cyan fluorescentproteins towards a quantum yield of 93%. Nat. Commun. 2012, 3, 751.(32) Heim, R.; Prasher, D. C.; Tsien, R. Y. Wavelength mutationsand posttranslational autoxidation of green fluorescent protein. Proc.Natl. Acad. Sci. U. S. A. 1994, 91, 12501−12504.(33) Becker, W. Fluorescence lifetime imaging−techniques andapplications. J. Microsc. 2012, 247, 119−136.(34) Klionsky, D. J.; Abdelmohsen, K.; Abe, A.; Abedin, M. J.;Abeliovich, H.; Acevedo Arozena, A.; Adachi, H.; Adams, C. M.;Adams, P. D.; Adeli, K. Guidelines for the use and interpretation ofassays for monitoring autophagy (3rd edition). Autophagy 2016, 12,1−222.(35) Nakamura, S.; Yoshimori, T. New insights into autophago-some-lysosome fusion. J. Cell Sci. 2017, 130, 1209−1216.(36) Zurzolo, C.; Simons, K. Glycosylphosphatidylinositol-anchoredproteins: Membrane organization and transport. Biochim. Biophys.Acta, Biomembr. 2016, 1858, 632−639.(37) Piper, R. C.; Katzmann, D. J. Biogenesis and Function ofMultivesicular Bodies. Annu. Rev. Cell Dev. Biol. 2007, 23, 519−547.(38) Marchetti, A.; Lelong, E.; Cosson, P. A measure of endosomalpH by flow cytometry in Dictyostelium. BMC Res. Notes 2009, 2, 7.(39) Yoshimori, T.; Yamamoto, A.; Moriyama, Y.; Futai, M.;Tashiro, Y. Bafilomycin A1, a specific inhibitor of vacuolar-type H(+)-ATPase, inhibits acidification and protein degradation in lysosomes ofcultured cells. J. Biol. Chem. 1991, 266, 17707−17712.(40) Lafourcade, C.; Sobo, K.; Kieffer-Jaquinod, S.; Garin, J.; van derGoot, F. G. Regulation of the V-ATPase along the Endocytic PathwayOccurs through Reversible Subunit Association and MembraneLocalization. PLoS One 2008, 3, e2758.(41) Maxson, M. E.; Grinstein, S. The vacuolar-type H+-ATPase at aglance - more than a proton pump. J. Cell Sci. 2014, 127, 4987−4993.(42) Wang, D.; Hiesinger, P. R. The vesicular ATPase: a missing linkbetween acidification and exocytosis. J. Cell Biol. 2013, 203, 171−173.(43) Davies, T. A.; Fine, R. E.; Johnson, R. J.; Levesque, C. A.;Rathbun, W. H.; Seetoo, K. F.; Smith, S. J.; Strohmeier, G.; Volicer,L.; Delva, L. Non-age related differences in thrombin responses byplatelets from male patients with advanced Alzheimer’s disease.Biochem. Biophys. Res. Commun. 1993, 194, 537−543.(44) Gennari, F. J. Pathophysiology of metabolic alkalosis: a newclassification based on the centrality of stimulated collecting duct iontransport. Am. J. Kidney Dis. 2011, 58, 626−636.(45) Swietach, P.; Vaughan-Jones, R. D.; Harris, A. L.; Hulikova, A.The chemistry, physiology and pathology of pH in cancer. Philos.Trans. R. Soc., B 2014, 369, 20130099.(46) Maxfield, F. R. Role of endosomes and lysosomes in humandisease. Cold Spring Harbor Perspect. Biol. 2014, 6, a016931.
ACS Sensors Article
DOI: 10.1021/acssensors.8b01599ACS Sens. 2019, 4, 883−891
891