Embed Size (px)
Citation preview
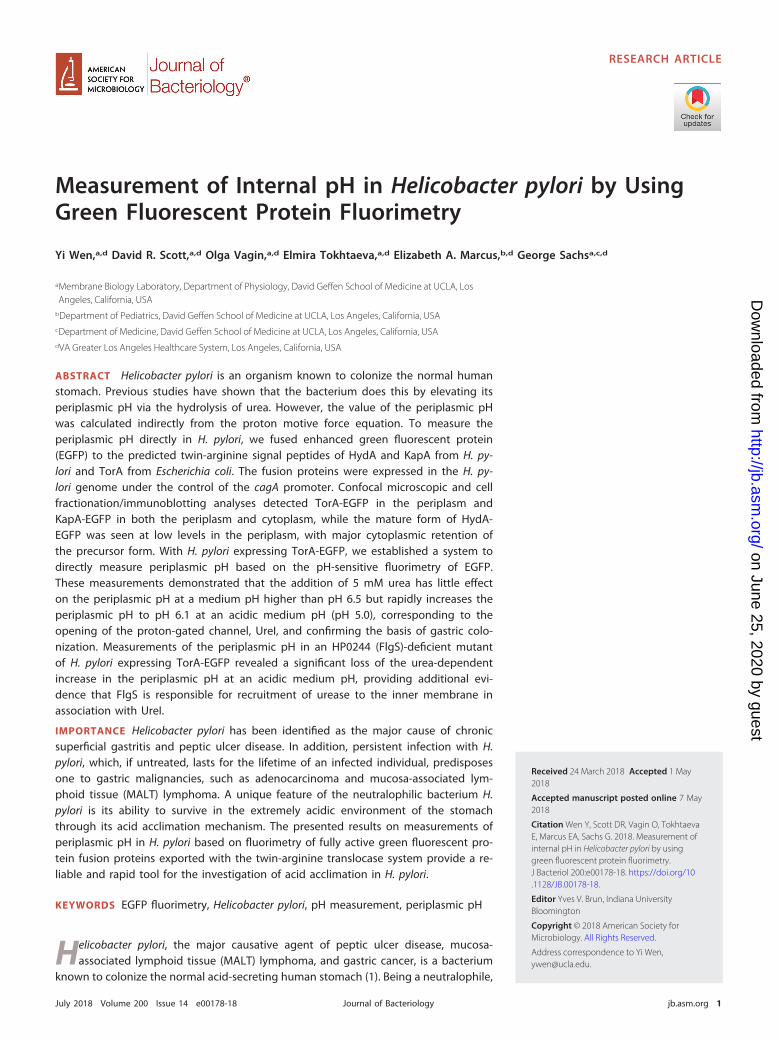
Measurement of Internal pH in Helicobacter pylori by UsingGreen Fluorescent Protein Fluorimetry
Yi Wen,a,d David R. Scott,a,d Olga Vagin,a,d Elmira Tokhtaeva,a,d Elizabeth A. Marcus,b,d George Sachsa,c,d
aMembrane Biology Laboratory, Department of Physiology, David Geffen School of Medicine at UCLA, LosAngeles, California, USA
bDepartment of Pediatrics, David Geffen School of Medicine at UCLA, Los Angeles, California, USAcDepartment of Medicine, David Geffen School of Medicine at UCLA, Los Angeles, California, USAdVA Greater Los Angeles Healthcare System, Los Angeles, California, USA
ABSTRACT Helicobacter pylori is an organism known to colonize the normal humanstomach. Previous studies have shown that the bacterium does this by elevating itsperiplasmic pH via the hydrolysis of urea. However, the value of the periplasmic pHwas calculated indirectly from the proton motive force equation. To measure theperiplasmic pH directly in H. pylori, we fused enhanced green fluorescent protein(EGFP) to the predicted twin-arginine signal peptides of HydA and KapA from H. py-lori and TorA from Escherichia coli. The fusion proteins were expressed in the H. py-lori genome under the control of the cagA promoter. Confocal microscopic and cellfractionation/immunoblotting analyses detected TorA-EGFP in the periplasm andKapA-EGFP in both the periplasm and cytoplasm, while the mature form of HydA-EGFP was seen at low levels in the periplasm, with major cytoplasmic retention ofthe precursor form. With H. pylori expressing TorA-EGFP, we established a system todirectly measure periplasmic pH based on the pH-sensitive fluorimetry of EGFP.These measurements demonstrated that the addition of 5 mM urea has little effecton the periplasmic pH at a medium pH higher than pH 6.5 but rapidly increases theperiplasmic pH to pH 6.1 at an acidic medium pH (pH 5.0), corresponding to theopening of the proton-gated channel, UreI, and confirming the basis of gastric colo-nization. Measurements of the periplasmic pH in an HP0244 (FlgS)-deficient mutantof H. pylori expressing TorA-EGFP revealed a significant loss of the urea-dependentincrease in the periplasmic pH at an acidic medium pH, providing additional evi-dence that FlgS is responsible for recruitment of urease to the inner membrane inassociation with UreI.
IMPORTANCE Helicobacter pylori has been identified as the major cause of chronicsuperficial gastritis and peptic ulcer disease. In addition, persistent infection with H.pylori, which, if untreated, lasts for the lifetime of an infected individual, predisposesone to gastric malignancies, such as adenocarcinoma and mucosa-associated lym-phoid tissue (MALT) lymphoma. A unique feature of the neutralophilic bacterium H.pylori is its ability to survive in the extremely acidic environment of the stomachthrough its acid acclimation mechanism. The presented results on measurements ofperiplasmic pH in H. pylori based on fluorimetry of fully active green fluorescent pro-tein fusion proteins exported with the twin-arginine translocase system provide a re-liable and rapid tool for the investigation of acid acclimation in H. pylori.
KEYWORDS EGFP fluorimetry, Helicobacter pylori, pH measurement, periplasmic pH
Helicobacter pylori, the major causative agent of peptic ulcer disease, mucosa-associated lymphoid tissue (MALT) lymphoma, and gastric cancer, is a bacterium
known to colonize the normal acid-secreting human stomach (1). Being a neutralophile,
Received 24 March 2018 Accepted 1 May2018
Accepted manuscript posted online 7 May2018
Citation Wen Y, Scott DR, Vagin O, TokhtaevaE, Marcus EA, Sachs G. 2018. Measurement ofinternal pH in Helicobacter pylori by usinggreen fluorescent protein fluorimetry.J Bacteriol 200:e00178-18. https://doi.org/10.1128/JB.00178-18.
Editor Yves V. Brun, Indiana UniversityBloomington
Copyright © 2018 American Society forMicrobiology. All Rights Reserved.
Address correspondence to Yi Wen,[email protected].
RESEARCH ARTICLE
crossm
July 2018 Volume 200 Issue 14 e00178-18 jb.asm.org 1Journal of Bacteriology
on June 25, 2020 by guesthttp://jb.asm
.org/D
ownloaded from
H. pylori has evolved a unique strategy to combat gastric acidity, known as acidacclimation, which is the ability to buffer its periplasm to pH �6.1 in strongly acidicmedia (2). By buffering the periplasm to near neutrality, the organism is able toeffectively maintain its cytoplasmic pH within a range compatible with not only survivalbut also bacterial replication. The mechanism of acid acclimation relies on the highlyexpressed neutral-pH-optimum cytoplasmic urease (3), a proton-gated urea channel(UreI) (4–6), and a pair of carbonic anhydrases, one expressed in the cytoplasm and oneexpressed in the periplasm (7, 8). With acidification, UreI is activated, allowing urea tomove into the cytoplasm, where it is hydrolyzed by UreI-associated urease at themembrane. Urea hydrolysis produces 2NH3 and H2CO3, and subsequently, H2CO3 isconverted to CO2 by cytoplasmic �-carbonic anhydrase (�-CA). Since it is a gas, CO2
exits rapidly into the periplasm. Protons entering the cytoplasm are neutralized by NH3,forming NH4
�. In addition, NH3 effluxes into the periplasm, neutralizing enteringprotons, and CO2 is converted to HCO3
� by a periplasmic membrane-anchored�-carbonic anhydrase. Hence, NH3 in the periplasm consumes both the enteringprotons and the protons produced by the action of �-carbonic anhydrase on CO2 andHCO3
� and buffers the periplasmic space to near neutrality.H. pylori has at least 2 two-component system histidine kinases that sense the pH
changes in the periplasm and cytoplasm and regulate the acid-induced transcription ofgenes responsible for acid acclimation. The two-component system HP0165-HP0166(ArsSR) provides one of the signaling pathways to regulate the pH-responsive tran-scriptional control of the urease gene cluster and of other genes involved in acidacclimation (9–13). The sensor histidine kinase HP0165 (ArsS) has two transmembranedomains, putting its histidine-rich input domain in the periplasm, where the pHchanges can be sensed. The other histidine kinase that is required for pH homoeostasis,HP0244 (FlgS), appears to be the only sensor protein that has no transmembranedomain in H. pylori, indicating its location in cytoplasm and a possible role in respond-ing to changes in the cytoplasmic pH. The response regulator for the acid response isyet to be identified, although FlgS belongs to the FlgRS two-component system, whichregulates flagellar gene expression via HP0703 (FlgR), which is not implicated in theresponse to acidity. FlgS regulates several pH acclimation genes overlapping ArsS atextreme acidity (14, 15).
At acidic pH, membrane assembly of active urease takes place for the recruitmentof urease to the inner membrane along with the nickel insertion proteins, which allowsthe activation of urease at the membrane in the vicinity of UreI (16, 17). The membraneassociation of urease activity provides localized increases in levels of NH3, NH4
�, andH2CO3. Our previous studies demonstrated that the cytoplasmic histidine kinase FlgS isrequired for the pH-regulated membrane assembly of urease with UreI and its metab-olites CO2, NH3, and NH4
� (14). The assembly of a pH-regulatory complex of activeurease with UreI provides an advantage for periplasmic buffering because of theimmediate access of urea to the urease.
The measurement of cytoplasmic and periplasmic pH is an important parameter forfurther studies of H. pylori acid acclimation. There are various techniques available tomeasure intracellular pH in bacteria, including microelectrodes (18), radiolabeledmembrane-permeant probes (19), nuclear magnetic resonance (NMR) spectroscopy(20), and pH-sensitive fluorescent probes (21, 22). The measurement of cytoplasmic pHin H. pylori has been facilitated by the use of the trapped fluorescent indicator methodwith 2=,7=-bis(2-carboxyethyl)-5(6)-carboxyfluorescein (BCECF) (23–25). Measurement ofthe cytoplasmic pH and membrane potential using fluorescent probes under condi-tions of fixed medium acidity (24) between pH 3.0 and 6.0 in the presence of urea hasprovided critical information in deriving the mechanism of acid acclimation. Usingthe proton motive force (PMF) equation (PMF � �61ΔpH � Δ�, where ΔpH and Δ�
are the differences in pH and membrane potential across the inner membrane sepa-rating the cytoplasm from the periplasm, respectively) (26), the periplasmic pH wascalculated to be �6.1 (24). Since the periplasmic pH was calculated rather than directlymeasured, we sought to develop a method to directly measure the periplasmic pH.
Wen et al. Journal of Bacteriology
July 2018 Volume 200 Issue 14 e00178-18 jb.asm.org 2
on June 25, 2020 by guesthttp://jb.asm
.org/D
ownloaded from
Green fluorescent proteins (GFPs), as targeted pH indicators, have unique advan-tages over other pH-sensitive probes because they provide the ability to measure pHat specific intracellular sites with little background signal and no indicator leakage andwithout the toxicities associated with chemical indicators and invasive loading proce-dures (27). As a heterologous protein, the expression of GFP in the cytoplasm ofEscherichia coli was first demonstrated in 1994 (28). However, the periplasmic expres-sion of GFP fusion proteins was unsuccessful with Sec-targeting signal peptides, asfunctional GFP could not be detected in the periplasm (29). The inability to exportfunctional GFP into the periplasm with the Sec system is due to the misfolding andimproper chromophore formation of GFP in the periplasm (30), since the Sec systemcan transport only unfolded, nascent proteins that fold after they cross the membrane(31). This problem was solved by using the signal sequence of the twin-argininetranslocation (Tat) pathway (TorA-GFP), which can export folded proteins intoperiplasm (32).
Recent studies have characterized the Tat system in H. pylori (33). Analysis of H. pylorigenome sequences revealed the presence of single copies of tatA, tatB, and tatC, whichare required for a fully functional Tat system (34, 35), sharing relatively strong similaritywith the well-characterized E. coli Tat system. However, H. pylori has a different genomicorganization and is missing the tatE ortholog. While the Tat system appears to beessential in H. pylori (33), searching the substrate proteins of the Tat system in H. pyloribased on the presence of the twin-arginine (RR) conserved (S/T)RRXFLK motif in theirsignal sequence with Tat prediction programs (36–38) revealed that only four H. pyloriproteins appear to be exported by the Tat system: the hydrogenase small-subunitprotein (HydA), the catalase-associated protein (KapA), the biotin sulfoxide reductase(BisC), and the ubiquinol cytochrome oxidoreductase Rieske protein (FbcF) (33).
The aim of this study was to establish a system that can rapidly and reliably measurethe periplasmic pH in H. pylori based on pH-sensitive fluorimetry of enhanced GFP(EGFP) expressed in the periplasmic compartment. Here, we report that with theTorA-RR signal peptide, EGFP retains proper folding and pH sensitivity and is targetedto the periplasm of H. pylori. Our initial experiments with this system have confirmedthe effects of urea on the acid response in live H. pylori bacteria by directly measuringperiplasmic pH. By integrating the PcagA-TorA-EGFP construct into an HP0244 (FlgS)-deficient mutant, we were able to measure the periplasmic pH after the addition of 5mM urea to the medium at pH 5.0 and found a significant loss of urea-dependentperiplasmic pH restoration in the FlgS-deficient mutant. The pH increased from 4.8 to5.1, in contrast to the elevation to pH 6.1 found in the wild-type strain, providingadditional evidence that FlgS is responsible for the recruitment of urease to the innermembrane in association with the urea channel, UreI. The ability to directly measureboth cytoplasmic and periplasmic pH expands the experimental approach to pHregulation in H. pylori.
RESULTSEGFP expression in H. pylori with different twin-arginine signal peptides. We
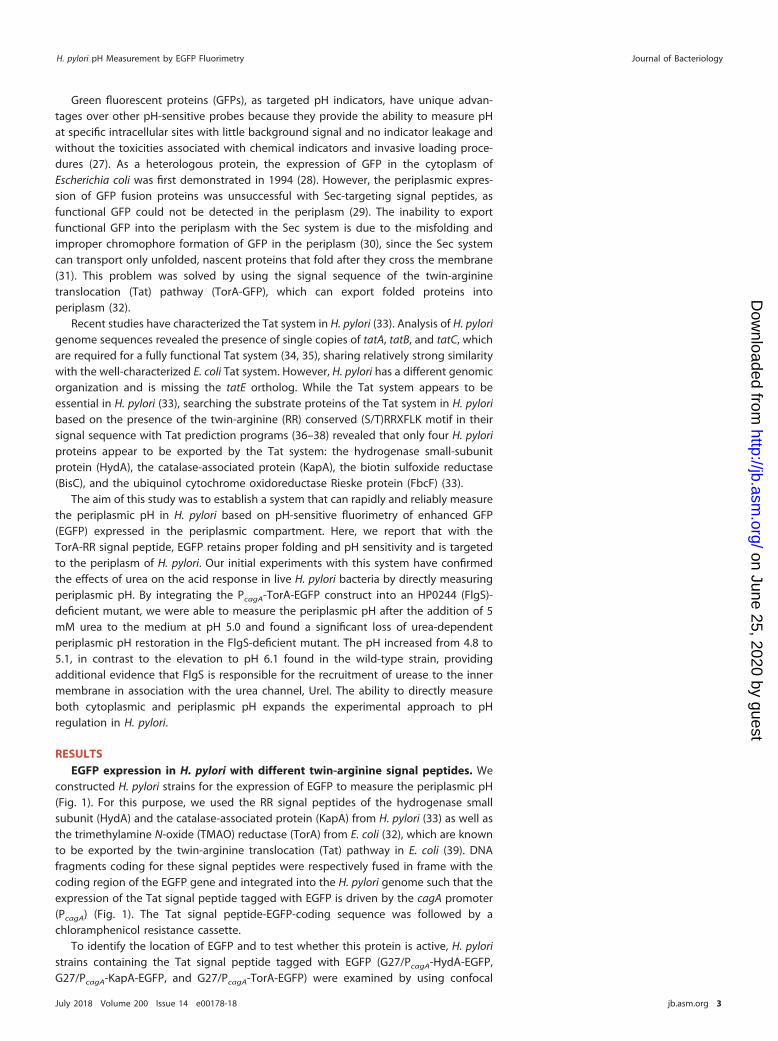
constructed H. pylori strains for the expression of EGFP to measure the periplasmic pH(Fig. 1). For this purpose, we used the RR signal peptides of the hydrogenase smallsubunit (HydA) and the catalase-associated protein (KapA) from H. pylori (33) as well asthe trimethylamine N-oxide (TMAO) reductase (TorA) from E. coli (32), which are knownto be exported by the twin-arginine translocation (Tat) pathway in E. coli (39). DNAfragments coding for these signal peptides were respectively fused in frame with thecoding region of the EGFP gene and integrated into the H. pylori genome such that theexpression of the Tat signal peptide tagged with EGFP is driven by the cagA promoter(PcagA) (Fig. 1). The Tat signal peptide-EGFP-coding sequence was followed by achloramphenicol resistance cassette.
To identify the location of EGFP and to test whether this protein is active, H. pyloristrains containing the Tat signal peptide tagged with EGFP (G27/PcagA-HydA-EGFP,G27/PcagA-KapA-EGFP, and G27/PcagA-TorA-EGFP) were examined by using confocal
H. pylori pH Measurement by EGFP Fluorimetry Journal of Bacteriology
July 2018 Volume 200 Issue 14 e00178-18 jb.asm.org 3
on June 25, 2020 by guesthttp://jb.asm
.org/D
ownloaded from
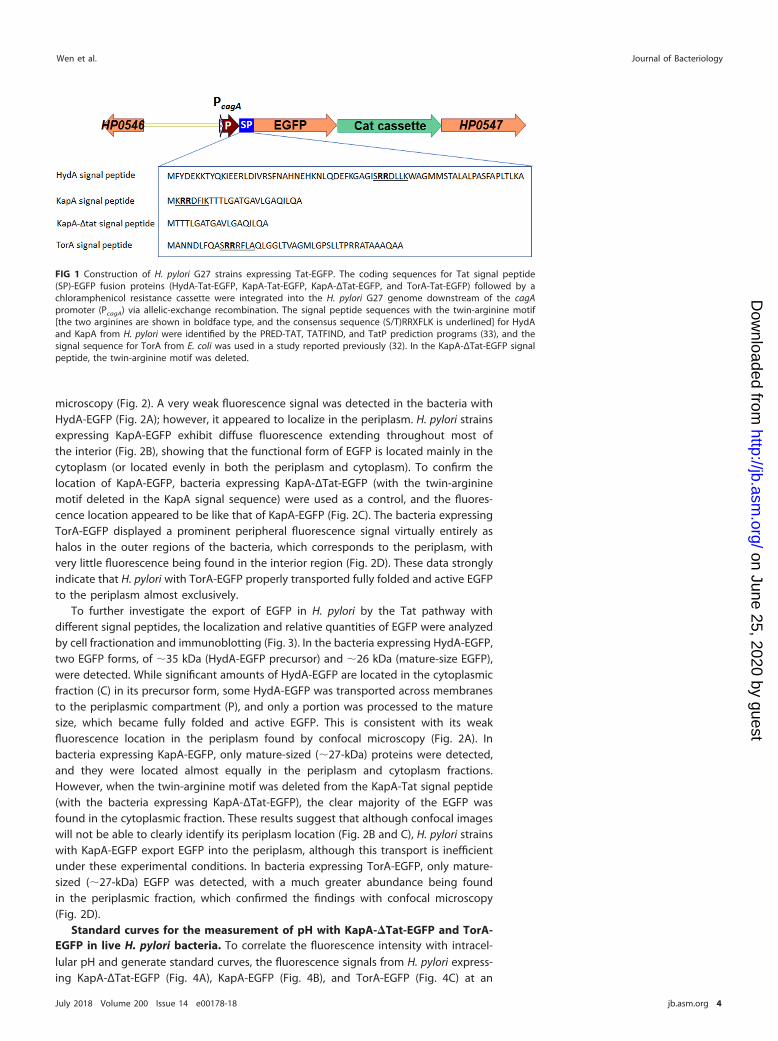
microscopy (Fig. 2). A very weak fluorescence signal was detected in the bacteria withHydA-EGFP (Fig. 2A); however, it appeared to localize in the periplasm. H. pylori strainsexpressing KapA-EGFP exhibit diffuse fluorescence extending throughout most ofthe interior (Fig. 2B), showing that the functional form of EGFP is located mainly in thecytoplasm (or located evenly in both the periplasm and cytoplasm). To confirm thelocation of KapA-EGFP, bacteria expressing KapA-ΔTat-EGFP (with the twin-argininemotif deleted in the KapA signal sequence) were used as a control, and the fluores-cence location appeared to be like that of KapA-EGFP (Fig. 2C). The bacteria expressingTorA-EGFP displayed a prominent peripheral fluorescence signal virtually entirely ashalos in the outer regions of the bacteria, which corresponds to the periplasm, withvery little fluorescence being found in the interior region (Fig. 2D). These data stronglyindicate that H. pylori with TorA-EGFP properly transported fully folded and active EGFPto the periplasm almost exclusively.
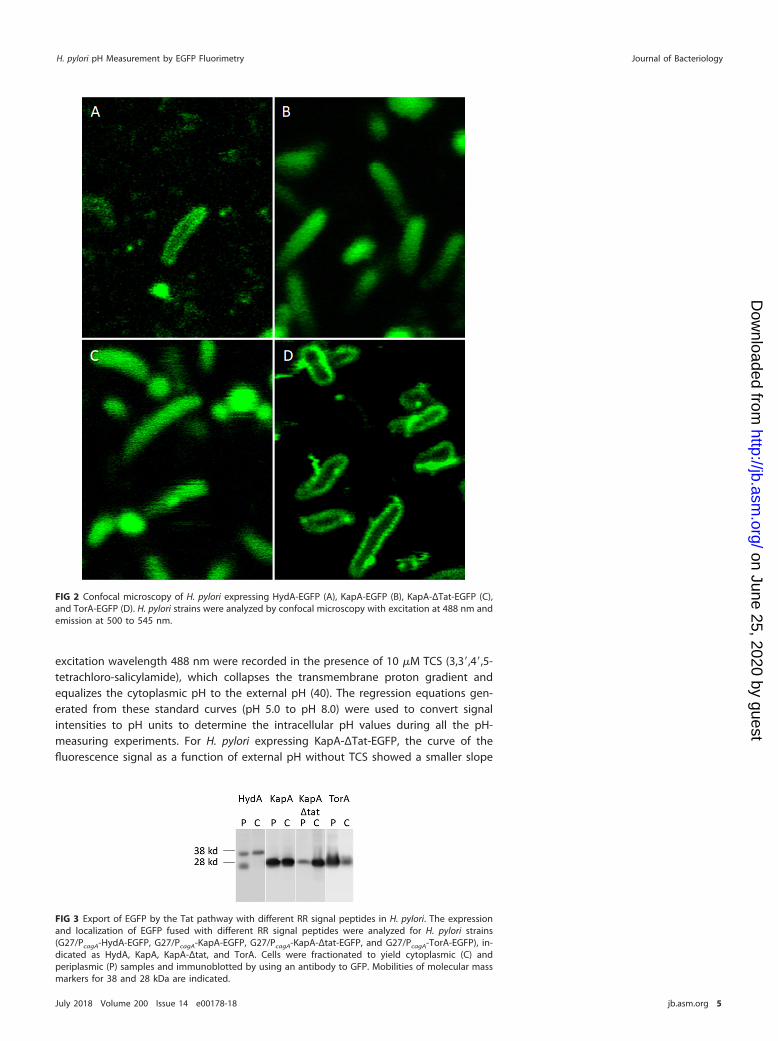
To further investigate the export of EGFP in H. pylori by the Tat pathway withdifferent signal peptides, the localization and relative quantities of EGFP were analyzedby cell fractionation and immunoblotting (Fig. 3). In the bacteria expressing HydA-EGFP,two EGFP forms, of �35 kDa (HydA-EGFP precursor) and �26 kDa (mature-size EGFP),were detected. While significant amounts of HydA-EGFP are located in the cytoplasmicfraction (C) in its precursor form, some HydA-EGFP was transported across membranesto the periplasmic compartment (P), and only a portion was processed to the maturesize, which became fully folded and active EGFP. This is consistent with its weakfluorescence location in the periplasm found by confocal microscopy (Fig. 2A). Inbacteria expressing KapA-EGFP, only mature-sized (�27-kDa) proteins were detected,and they were located almost equally in the periplasm and cytoplasm fractions.However, when the twin-arginine motif was deleted from the KapA-Tat signal peptide(with the bacteria expressing KapA-ΔTat-EGFP), the clear majority of the EGFP wasfound in the cytoplasmic fraction. These results suggest that although confocal imageswill not be able to clearly identify its periplasm location (Fig. 2B and C), H. pylori strainswith KapA-EGFP export EGFP into the periplasm, although this transport is inefficientunder these experimental conditions. In bacteria expressing TorA-EGFP, only mature-sized (�27-kDa) EGFP was detected, with a much greater abundance being foundin the periplasmic fraction, which confirmed the findings with confocal microscopy(Fig. 2D).
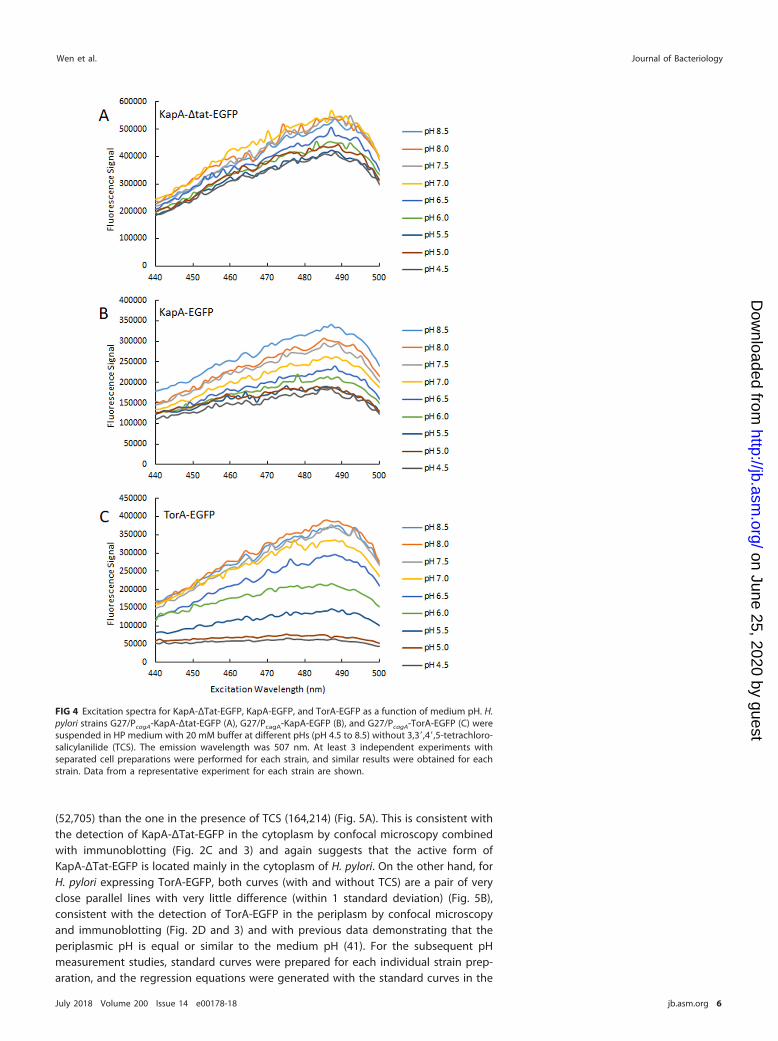
Standard curves for the measurement of pH with KapA-�Tat-EGFP and TorA-EGFP in live H. pylori bacteria. To correlate the fluorescence intensity with intracel-lular pH and generate standard curves, the fluorescence signals from H. pylori express-ing KapA-ΔTat-EGFP (Fig. 4A), KapA-EGFP (Fig. 4B), and TorA-EGFP (Fig. 4C) at an
FIG 1 Construction of H. pylori G27 strains expressing Tat-EGFP. The coding sequences for Tat signal peptide(SP)-EGFP fusion proteins (HydA-Tat-EGFP, KapA-Tat-EGFP, KapA-ΔTat-EGFP, and TorA-Tat-EGFP) followed by achloramphenicol resistance cassette were integrated into the H. pylori G27 genome downstream of the cagApromoter (PcagA) via allelic-exchange recombination. The signal peptide sequences with the twin-arginine motif[the two arginines are shown in boldface type, and the consensus sequence (S/T)RRXFLK is underlined] for HydAand KapA from H. pylori were identified by the PRED-TAT, TATFIND, and TatP prediction programs (33), and thesignal sequence for TorA from E. coli was used in a study reported previously (32). In the KapA-ΔTat-EGFP signalpeptide, the twin-arginine motif was deleted.
Wen et al. Journal of Bacteriology
July 2018 Volume 200 Issue 14 e00178-18 jb.asm.org 4
on June 25, 2020 by guesthttp://jb.asm
.org/D
ownloaded from
excitation wavelength 488 nm were recorded in the presence of 10 �M TCS (3,3=,4=,5-tetrachloro-salicylamide), which collapses the transmembrane proton gradient andequalizes the cytoplasmic pH to the external pH (40). The regression equations gen-erated from these standard curves (pH 5.0 to pH 8.0) were used to convert signalintensities to pH units to determine the intracellular pH values during all the pH-measuring experiments. For H. pylori expressing KapA-ΔTat-EGFP, the curve of thefluorescence signal as a function of external pH without TCS showed a smaller slope
FIG 2 Confocal microscopy of H. pylori expressing HydA-EGFP (A), KapA-EGFP (B), KapA-ΔTat-EGFP (C),and TorA-EGFP (D). H. pylori strains were analyzed by confocal microscopy with excitation at 488 nm andemission at 500 to 545 nm.
FIG 3 Export of EGFP by the Tat pathway with different RR signal peptides in H. pylori. The expressionand localization of EGFP fused with different RR signal peptides were analyzed for H. pylori strains(G27/PcagA-HydA-EGFP, G27/PcagA-KapA-EGFP, G27/PcagA-KapA-Δtat-EGFP, and G27/PcagA-TorA-EGFP), in-dicated as HydA, KapA, KapA-Δtat, and TorA. Cells were fractionated to yield cytoplasmic (C) andperiplasmic (P) samples and immunoblotted by using an antibody to GFP. Mobilities of molecular massmarkers for 38 and 28 kDa are indicated.
H. pylori pH Measurement by EGFP Fluorimetry Journal of Bacteriology
July 2018 Volume 200 Issue 14 e00178-18 jb.asm.org 5
on June 25, 2020 by guesthttp://jb.asm
.org/D
ownloaded from
(52,705) than the one in the presence of TCS (164,214) (Fig. 5A). This is consistent withthe detection of KapA-ΔTat-EGFP in the cytoplasm by confocal microscopy combinedwith immunoblotting (Fig. 2C and 3) and again suggests that the active form ofKapA-ΔTat-EGFP is located mainly in the cytoplasm of H. pylori. On the other hand, forH. pylori expressing TorA-EGFP, both curves (with and without TCS) are a pair of veryclose parallel lines with very little difference (within 1 standard deviation) (Fig. 5B),consistent with the detection of TorA-EGFP in the periplasm by confocal microscopyand immunoblotting (Fig. 2D and 3) and with previous data demonstrating that theperiplasmic pH is equal or similar to the medium pH (41). For the subsequent pHmeasurement studies, standard curves were prepared for each individual strain prep-aration, and the regression equations were generated with the standard curves in the
FIG 4 Excitation spectra for KapA-ΔTat-EGFP, KapA-EGFP, and TorA-EGFP as a function of medium pH. H.pylori strains G27/PcagA-KapA-Δtat-EGFP (A), G27/PcagA-KapA-EGFP (B), and G27/PcagA-TorA-EGFP (C) weresuspended in HP medium with 20 mM buffer at different pHs (pH 4.5 to 8.5) without 3,3=,4=,5-tetrachloro-salicylanilide (TCS). The emission wavelength was 507 nm. At least 3 independent experiments withseparated cell preparations were performed for each strain, and similar results were obtained for eachstrain. Data from a representative experiment for each strain are shown.
Wen et al. Journal of Bacteriology
July 2018 Volume 200 Issue 14 e00178-18 jb.asm.org 6
on June 25, 2020 by guesthttp://jb.asm
.org/D
ownloaded from
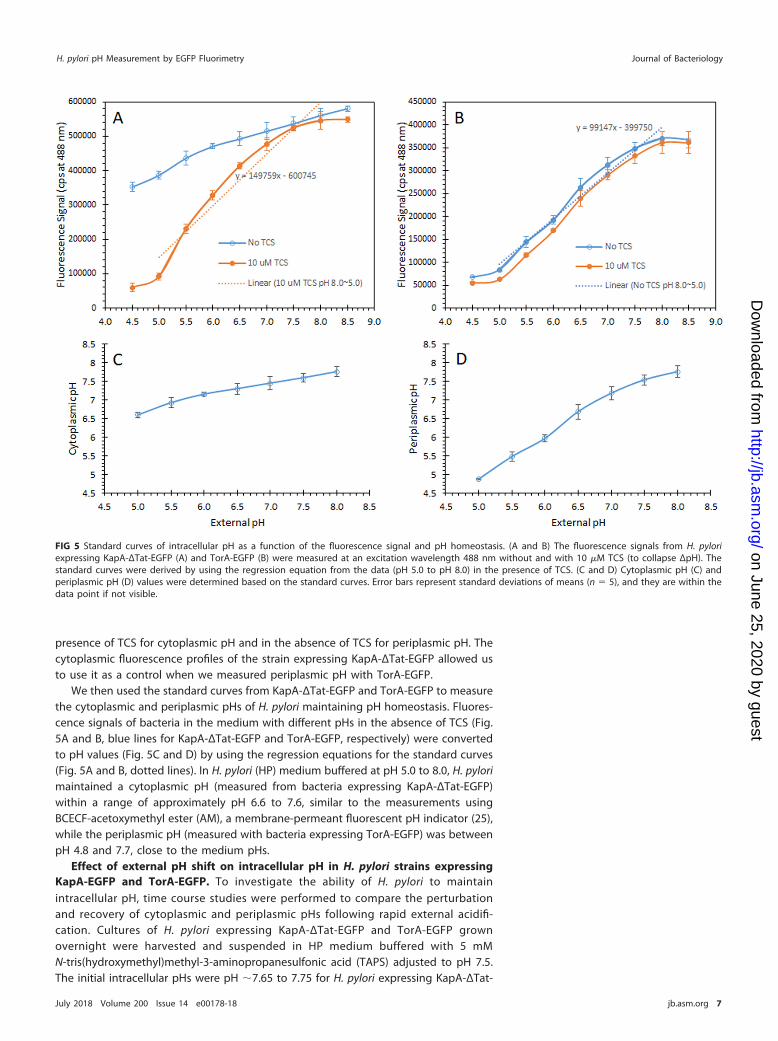
presence of TCS for cytoplasmic pH and in the absence of TCS for periplasmic pH. Thecytoplasmic fluorescence profiles of the strain expressing KapA-ΔTat-EGFP allowed usto use it as a control when we measured periplasmic pH with TorA-EGFP.
We then used the standard curves from KapA-ΔTat-EGFP and TorA-EGFP to measurethe cytoplasmic and periplasmic pHs of H. pylori maintaining pH homeostasis. Fluores-cence signals of bacteria in the medium with different pHs in the absence of TCS (Fig.5A and B, blue lines for KapA-ΔTat-EGFP and TorA-EGFP, respectively) were convertedto pH values (Fig. 5C and D) by using the regression equations for the standard curves(Fig. 5A and B, dotted lines). In H. pylori (HP) medium buffered at pH 5.0 to 8.0, H. pylorimaintained a cytoplasmic pH (measured from bacteria expressing KapA-ΔTat-EGFP)within a range of approximately pH 6.6 to 7.6, similar to the measurements usingBCECF-acetoxymethyl ester (AM), a membrane-permeant fluorescent pH indicator (25),while the periplasmic pH (measured with bacteria expressing TorA-EGFP) was betweenpH 4.8 and 7.7, close to the medium pHs.
Effect of external pH shift on intracellular pH in H. pylori strains expressingKapA-EGFP and TorA-EGFP. To investigate the ability of H. pylori to maintainintracellular pH, time course studies were performed to compare the perturbationand recovery of cytoplasmic and periplasmic pHs following rapid external acidifi-cation. Cultures of H. pylori expressing KapA-ΔTat-EGFP and TorA-EGFP grownovernight were harvested and suspended in HP medium buffered with 5 mMN-tris(hydroxymethyl)methyl-3-aminopropanesulfonic acid (TAPS) adjusted to pH 7.5.The initial intracellular pHs were pH �7.65 to 7.75 for H. pylori expressing KapA-ΔTat-
FIG 5 Standard curves of intracellular pH as a function of the fluorescence signal and pH homeostasis. (A and B) The fluorescence signals from H. pyloriexpressing KapA-ΔTat-EGFP (A) and TorA-EGFP (B) were measured at an excitation wavelength 488 nm without and with 10 �M TCS (to collapse ΔpH). Thestandard curves were derived by using the regression equation from the data (pH 5.0 to pH 8.0) in the presence of TCS. (C and D) Cytoplasmic pH (C) andperiplasmic pH (D) values were determined based on the standard curves. Error bars represent standard deviations of means (n � 5), and they are within thedata point if not visible.
H. pylori pH Measurement by EGFP Fluorimetry Journal of Bacteriology
July 2018 Volume 200 Issue 14 e00178-18 jb.asm.org 7
on June 25, 2020 by guesthttp://jb.asm
.org/D
ownloaded from
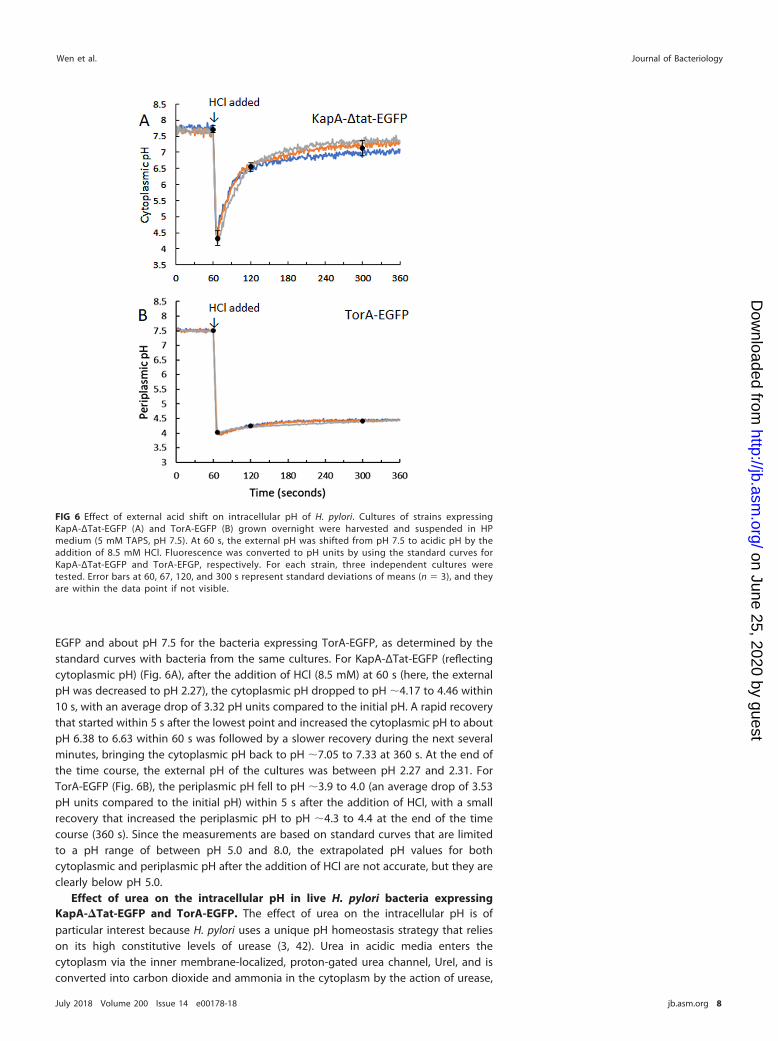
EGFP and about pH 7.5 for the bacteria expressing TorA-EGFP, as determined by thestandard curves with bacteria from the same cultures. For KapA-ΔTat-EGFP (reflectingcytoplasmic pH) (Fig. 6A), after the addition of HCl (8.5 mM) at 60 s (here, the externalpH was decreased to pH 2.27), the cytoplasmic pH dropped to pH �4.17 to 4.46 within10 s, with an average drop of 3.32 pH units compared to the initial pH. A rapid recoverythat started within 5 s after the lowest point and increased the cytoplasmic pH to aboutpH 6.38 to 6.63 within 60 s was followed by a slower recovery during the next severalminutes, bringing the cytoplasmic pH back to pH �7.05 to 7.33 at 360 s. At the end ofthe time course, the external pH of the cultures was between pH 2.27 and 2.31. ForTorA-EGFP (Fig. 6B), the periplasmic pH fell to pH �3.9 to 4.0 (an average drop of 3.53pH units compared to the initial pH) within 5 s after the addition of HCl, with a smallrecovery that increased the periplasmic pH to pH �4.3 to 4.4 at the end of the timecourse (360 s). Since the measurements are based on standard curves that are limitedto a pH range of between pH 5.0 and 8.0, the extrapolated pH values for bothcytoplasmic and periplasmic pH after the addition of HCl are not accurate, but they areclearly below pH 5.0.
Effect of urea on the intracellular pH in live H. pylori bacteria expressingKapA-�Tat-EGFP and TorA-EGFP. The effect of urea on the intracellular pH is ofparticular interest because H. pylori uses a unique pH homeostasis strategy that relieson its high constitutive levels of urease (3, 42). Urea in acidic media enters thecytoplasm via the inner membrane-localized, proton-gated urea channel, UreI, and isconverted into carbon dioxide and ammonia in the cytoplasm by the action of urease,
FIG 6 Effect of external acid shift on intracellular pH of H. pylori. Cultures of strains expressingKapA-ΔTat-EGFP (A) and TorA-EGFP (B) grown overnight were harvested and suspended in HPmedium (5 mM TAPS, pH 7.5). At 60 s, the external pH was shifted from pH 7.5 to acidic pH by theaddition of 8.5 mM HCl. Fluorescence was converted to pH units by using the standard curves forKapA-ΔTat-EGFP and TorA-EFGP, respectively. For each strain, three independent cultures weretested. Error bars at 60, 67, 120, and 300 s represent standard deviations of means (n � 3), and theyare within the data point if not visible.
Wen et al. Journal of Bacteriology
July 2018 Volume 200 Issue 14 e00178-18 jb.asm.org 8
on June 25, 2020 by guesthttp://jb.asm
.org/D
ownloaded from
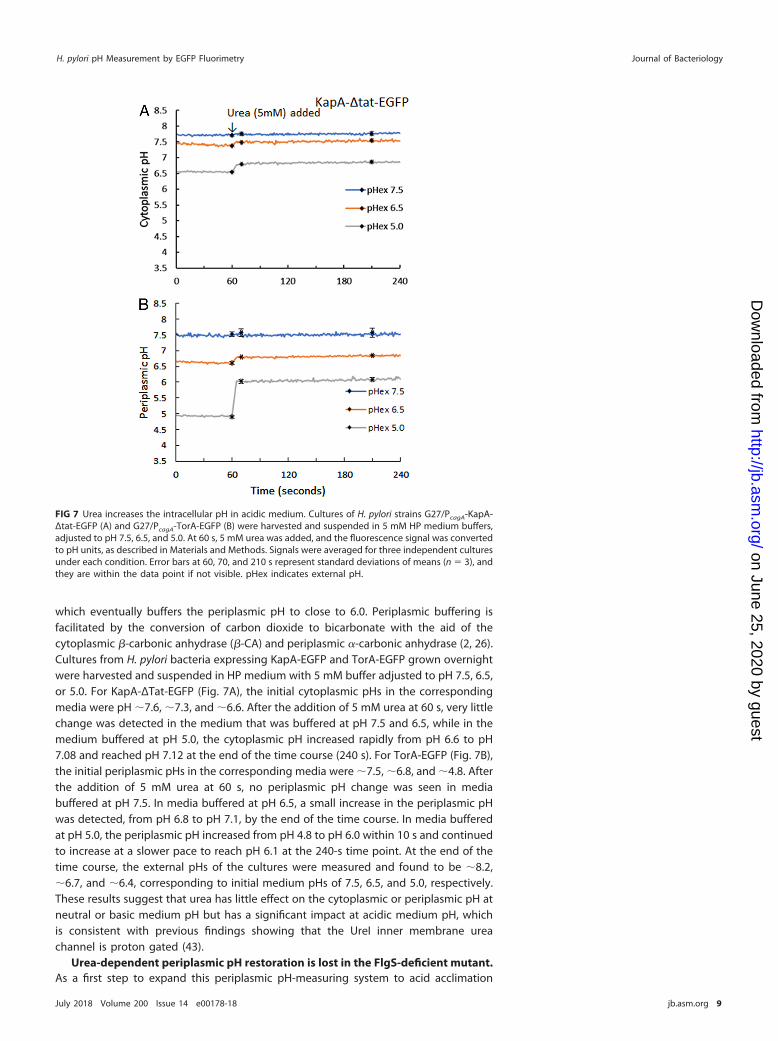
which eventually buffers the periplasmic pH to close to 6.0. Periplasmic buffering isfacilitated by the conversion of carbon dioxide to bicarbonate with the aid of thecytoplasmic �-carbonic anhydrase (�-CA) and periplasmic �-carbonic anhydrase (2, 26).Cultures from H. pylori bacteria expressing KapA-EGFP and TorA-EGFP grown overnightwere harvested and suspended in HP medium with 5 mM buffer adjusted to pH 7.5, 6.5,or 5.0. For KapA-ΔTat-EGFP (Fig. 7A), the initial cytoplasmic pHs in the correspondingmedia were pH �7.6, �7.3, and �6.6. After the addition of 5 mM urea at 60 s, very littlechange was detected in the medium that was buffered at pH 7.5 and 6.5, while in themedium buffered at pH 5.0, the cytoplasmic pH increased rapidly from pH 6.6 to pH7.08 and reached pH 7.12 at the end of the time course (240 s). For TorA-EGFP (Fig. 7B),the initial periplasmic pHs in the corresponding media were �7.5, �6.8, and �4.8. Afterthe addition of 5 mM urea at 60 s, no periplasmic pH change was seen in mediabuffered at pH 7.5. In media buffered at pH 6.5, a small increase in the periplasmic pHwas detected, from pH 6.8 to pH 7.1, by the end of the time course. In media bufferedat pH 5.0, the periplasmic pH increased from pH 4.8 to pH 6.0 within 10 s and continuedto increase at a slower pace to reach pH 6.1 at the 240-s time point. At the end of thetime course, the external pHs of the cultures were measured and found to be �8.2,�6.7, and �6.4, corresponding to initial medium pHs of 7.5, 6.5, and 5.0, respectively.These results suggest that urea has little effect on the cytoplasmic or periplasmic pH atneutral or basic medium pH but has a significant impact at acidic medium pH, whichis consistent with previous findings showing that the UreI inner membrane ureachannel is proton gated (43).
Urea-dependent periplasmic pH restoration is lost in the FlgS-deficient mutant.As a first step to expand this periplasmic pH-measuring system to acid acclimation
FIG 7 Urea increases the intracellular pH in acidic medium. Cultures of H. pylori strains G27/PcagA-KapA-Δtat-EGFP (A) and G27/PcagA-TorA-EGFP (B) were harvested and suspended in 5 mM HP medium buffers,adjusted to pH 7.5, 6.5, and 5.0. At 60 s, 5 mM urea was added, and the fluorescence signal was convertedto pH units, as described in Materials and Methods. Signals were averaged for three independent culturesunder each condition. Error bars at 60, 70, and 210 s represent standard deviations of means (n � 3), andthey are within the data point if not visible. pHex indicates external pH.
H. pylori pH Measurement by EGFP Fluorimetry Journal of Bacteriology
July 2018 Volume 200 Issue 14 e00178-18 jb.asm.org 9
on June 25, 2020 by guesthttp://jb.asm
.org/D
ownloaded from
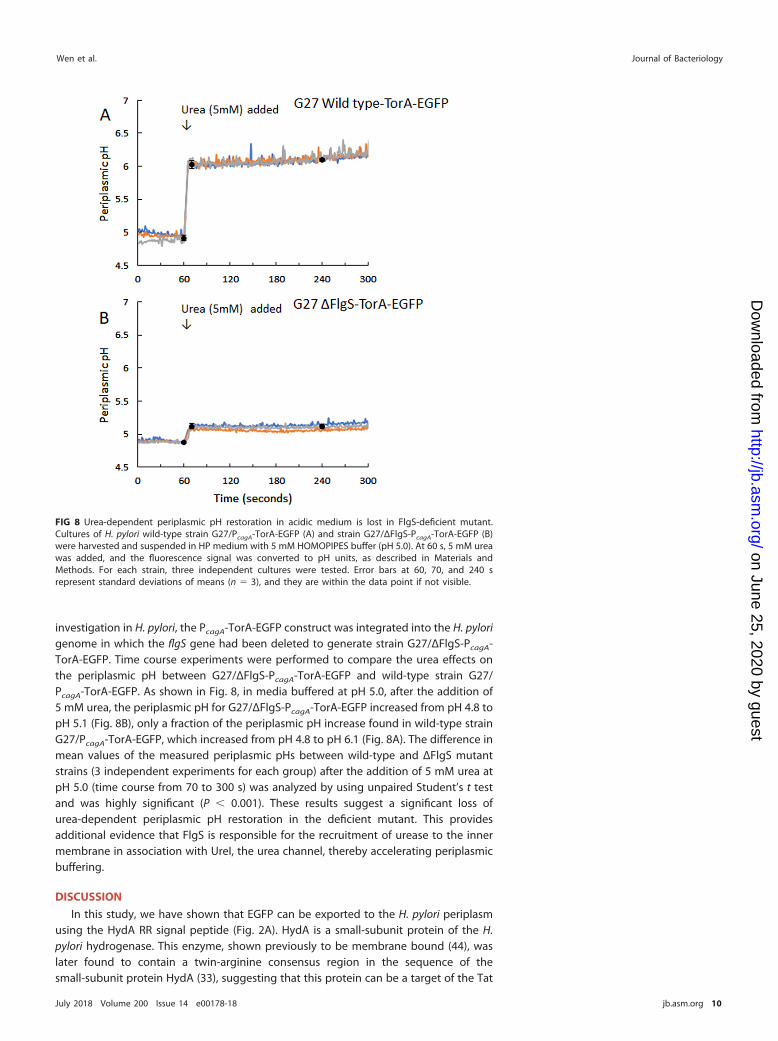
investigation in H. pylori, the PcagA-TorA-EGFP construct was integrated into the H. pylorigenome in which the flgS gene had been deleted to generate strain G27/ΔFlgS-PcagA-TorA-EGFP. Time course experiments were performed to compare the urea effects onthe periplasmic pH between G27/ΔFlgS-PcagA-TorA-EGFP and wild-type strain G27/PcagA-TorA-EGFP. As shown in Fig. 8, in media buffered at pH 5.0, after the addition of5 mM urea, the periplasmic pH for G27/ΔFlgS-PcagA-TorA-EGFP increased from pH 4.8 topH 5.1 (Fig. 8B), only a fraction of the periplasmic pH increase found in wild-type strainG27/PcagA-TorA-EGFP, which increased from pH 4.8 to pH 6.1 (Fig. 8A). The difference inmean values of the measured periplasmic pHs between wild-type and ΔFlgS mutantstrains (3 independent experiments for each group) after the addition of 5 mM urea atpH 5.0 (time course from 70 to 300 s) was analyzed by using unpaired Student’s t testand was highly significant (P � 0.001). These results suggest a significant loss ofurea-dependent periplasmic pH restoration in the deficient mutant. This providesadditional evidence that FlgS is responsible for the recruitment of urease to the innermembrane in association with UreI, the urea channel, thereby accelerating periplasmicbuffering.
DISCUSSION
In this study, we have shown that EGFP can be exported to the H. pylori periplasmusing the HydA RR signal peptide (Fig. 2A). HydA is a small-subunit protein of the H.pylori hydrogenase. This enzyme, shown previously to be membrane bound (44), waslater found to contain a twin-arginine consensus region in the sequence of thesmall-subunit protein HydA (33), suggesting that this protein can be a target of the Tat
FIG 8 Urea-dependent periplasmic pH restoration in acidic medium is lost in FlgS-deficient mutant.Cultures of H. pylori wild-type strain G27/PcagA-TorA-EGFP (A) and strain G27/ΔFlgS-PcagA-TorA-EGFP (B)were harvested and suspended in HP medium with 5 mM HOMOPIPES buffer (pH 5.0). At 60 s, 5 mM ureawas added, and the fluorescence signal was converted to pH units, as described in Materials andMethods. For each strain, three independent cultures were tested. Error bars at 60, 70, and 240 srepresent standard deviations of means (n � 3), and they are within the data point if not visible.
Wen et al. Journal of Bacteriology
July 2018 Volume 200 Issue 14 e00178-18 jb.asm.org 10
on June 25, 2020 by guesthttp://jb.asm
.org/D
ownloaded from
system. Our results for the first time provide direct experimental evidence that thehydrogenase small-subunit protein HydA is exported to the periplasm via a Tat systemin H. pylori. However, cell fractionation with immunoblotting studies (Fig. 3) revealedthat there are significant amounts of HydA-EGFP retained in the cytoplasm in theprecursor form that will not generate any fluorescence signal, and only about 50% ofthe HydA-EGFP that was transported across membranes to the periplasm was pro-cessed to the mature form, which became the fully folded and active EGFP. Therefore,the fluorescence signal is not strong enough to use HydA-EGFP as a tool to measureperiplasmic pH.
The catalase-associated protein (KapA; HP0874) possessing a predicted signal se-quence with a Tat motif (33, 44) is believed to be responsible for the translocation ofcatalase (KatA; HP0875) to the periplasmic side of the membrane (45). Although theconfocal images showed that the fluorescence signal for KapA-EGFP is distributedevenly throughout the bacteria, which is very similar to that of KapA-ΔTat-EGFP (withthe twin-arginine motif deleted in the KapA signal sequence, supposedly located in thecytoplasm) (Fig. 2B and C), the data with fractionation and immunoblotting (Fig. 3)demonstrated that the mature form of KapA-EGFP is located almost equally in theperiplasm and cytoplasm, whereas with the bacteria expressing KapA-ΔTat-EGFP, mostof the mature form of the proteins was found in the cytoplasmic fraction. Therefore, thedata presented here indicate that the H. pylori KapA signal peptide enables EGFPtransport to periplasm, although it is not fully efficient under these experimentalconditions.
With the TorA-RR signal peptide from trimethylamine N-oxide (TMAO) reductases ofE. coli, which has been shown to be translocated by the Tat system (34), H. pylori iscapable of exporting EGFP to the periplasm in a fully folded and active form (Fig. 2Cand 3). Our initial attempts to export a functional form of EGFP into the periplasm witha signal peptide from H. pylori �-carbonic anhydrase, which is believed to be a Secsystem for translocation, were unsuccessful (our unpublished results). This confirmsthat the Sec pathway is incapable of exporting folded functional proteins such as GFP(which is known to be stably folded) (29). Previous studies (32, 46, 47) have shown thatGFP, a heterologous protein, can be translocated in an active form across the cytoplas-mic membrane by the Tat system in E. coli with the TorA-RR signal peptide by using thepBAD24 vector containing the arabinose-inducible PBAD promoter (22). In the presenceof arabinose to induce TorA-GFP expression, the export system was ineffective, retain-ing GFP in the cytoplasm. The change in growth conditions by the removal of arabinoseafter a 2-h induction promoted a massive increase in the export efficiency, resulting inthe majority of the GFP being transferred into the periplasm (46). We integrated theTorA-EGFP fusion open reading frame (ORF) into the cag locus of the H. pylori genome.The expression of TorA-EGFP under the control of the cagA promoter PcagA appears tobe compatible with the Tat translocation system in H. pylori, and this experimentalsystem eliminated the arabinose-adding/removing process. To our knowledge, thisstudy shows for the first time that EGFP was successfully exported in an active form bythe Tat system in H. pylori.
Previous studies used fluorimetry of TorA-GFPmut3* (22) to measure the intracellularpH of E. coli, which allowed the assessment of the cellular rate of pH change in responseto a rapid shift in the pH of the external medium. After the addition of HCl (8.5 mM) tomedium buffered at pH 7.5, both cytoplasmic and periplasmic pHs fell to below pH 6.0within 10 to 20 s. While the cytoplasmic pH began to recover within 4 s, the periplasmicpH showed minimal recovery. In these studies with H. pylori, similar results (Fig. 6A andB) were observed for both cytoplasmic and periplasmic pHs in the absence of urea,except that the addition of HCl caused much larger drops in both cytoplasmic andperiplasmic pHs (to around pH 4.0). These differences may be due to the differentbuffers used in these studies. They may also reflect different pH homeostasis mecha-nisms in E. coli and H. pylori.
H. pylori survives gastric acidity by expressing urease at a level higher than that ofany other known microbe (3, 23). Previous studies measuring H. pylori transmembrane
H. pylori pH Measurement by EGFP Fluorimetry Journal of Bacteriology
July 2018 Volume 200 Issue 14 e00178-18 jb.asm.org 11
on June 25, 2020 by guesthttp://jb.asm
.org/D
ownloaded from
potential and internal pH with BCECF-AM at medium pHs of 3.0, 4.0, and 6.0 in thepresence of urea demonstrated that cytoplasmic urease can compensate for mediumacidity by the hydrolysis of urea when the external pH is decreased to �6.0 (24). When5 mM urea was added, while the membrane potential was elevated to about �105 mV,there was a rapid rise of the measured internal pH that then declined to a steady stateat all acidic medium pH levels. This steady state provided a calculated internal pH valueof 6.2, although this was never directly measured. We assumed that this was theperiplasmic pH, since we could calculate the proton motive force across the innermembrane (24). The use of free BCECF showed that the periplasmic pH was elevated bythe addition of urea at various medium pH values, but it was not possible to directlymeasure the pH in the periplasm with this method (48). In this study, we are now ableto directly measure periplasmic pH with TorA-EGFP expressed in H. pylori and provethat 5 mM urea has little effect on periplasmic pH at a medium pH of �6.5 but increasesthe periplasmic pH rapidly to pH 6.2 at acidic medium pH, corresponding to theopening of UreI (Fig. 7). The ability to maintain the periplasmic pH at about pH 6.2 islikely to be essential for gastric acid survival and colonization. These results areconsistent with the deduced periplasmic pH based on the measurement of membranepotential and calculation of the proton motive force equation and suggest that we havedeveloped a reliable tool for the direct and rapid investigation of acid acclimation in H.pylori.
To colonize at the highly variable pH of the stomach, H. pylori expresses two pHsensor histidine kinases. ArsS responds to a moderate fall in the periplasmic pH, andFlgS responds to cytoplasmic acidification (15). Our previous studies have shown thatthe acid activation of FlgS leads to the recruitment of the urease structural subunitsUreA and UreB and the Ni2� insertion protein UreE to UreI at the inner membrane,resulting in the activation of urease activity (14). The deletion of FlgS abolishes ureaseactivation and membrane assembly (14), leading to impaired cytoplasmic and periplas-mic pH homeostasis and a loss of acid survival (15). In the present study, to furtherdetermine the role of FlgS in periplasmic pH homeostasis, we used a PcagA-TorA-EGFPperiplasmic pH-measuring system to investigate the changes in periplasmic pH in anFlgS-deficient mutant. At pH 5.0, unlike the wild-type strain, the FlgS-deficient mutantwas unable to restore periplasmic pH to 6.1 with the addition of 5 mM urea (with onlya fraction of the periplasmic pH increase found for the wild-type strain) (Fig. 8),providing additional evidence that HP0244 is required for the recruitment of urease tothe inner membrane in association with UreI, the urea channel. The association of theurease complex with UreI results in the transport of NH3, NH4
�, and CO2 through UreIinto the periplasm to maintain periplasmic pH homeostasis. Therefore, the FlgS-dependent assembly of a pH-regulatory complex of active urease with UreI offers anadvantage for periplasmic buffering, conferring acid resistance and facilitating gastriccolonization by H. pylori.
MATERIALS AND METHODSBacterial strains and culture conditions. H. pylori strain G27 (49) was the parental strain. The strains
expressing EGFP under the control of the cagA promoter (G27/PcagA-HydA-EGFP, G27/PcagA-KapA-EGFP,G27/PcagA-KapA-Δtat-EGFP, and G27/PcagA-TorA-EGFP) were constructed by allelic exchange using achloramphenicol resistance cassette, as described below. Bacteria were grown under microaerobicconditions (5% O2, 10% CO2, 85% N2) on either tryptic soy agar (TSA) plates supplemented with 5% sheepblood (Becton Dickinson) or brain heart infusion (BHI) agar plates supplemented with 7% horse serum(Gibco BRL-Life Technologies Inc.) and 0.25% yeast extract (Difco Laboratories). All bacteria were grownin media in the presence of Dent selective supplement (Oxoid Limited), and the strains expressing EGFPwere always grown in the presence of 10 �g/ml chloramphenicol (Sigma Chemical Co.).
For intracellular pH measurements, cultures grown overnight were harvested from BHI agar platesand resuspended to optical density at 600 nm (OD600) values of 0.4 for strain G27/PcagA-KapA-EGFP, 0.1for strain G27/PcagA-KapA-Δtat-EGFP, and 0.25 for strains G27/PcagA-TorA-EGFP and G27/ΔFlgS-PcagA-TorA-EGFP in HP medium (140 mM Na2Cl, 5 mM KCl, 1.3 mM CaCl2, 0.5 mM MgSO4, 10 mM glucose, 1 mMglutamine) buffered with a 5 to 20 mM concentration (depending on the experiment) of the appropriatebuffer [pH 4.5 to 5.0, homopiperazine-N,N=-bis-2-(ethanesulfonic acid) (HOMOPIPES); pH 5.5 to 6.0,2-(N-morpholino)ethanesulfonic acid (MES); pH 6.5 to 7.0, 3-(N-morpholino)propanesulfonic acid (MOPS);pH 7.5 to 8.5, N-tris(hydroxymethyl)methyl-3-aminopropanesulfonic acid (TAPS)]. With these cell densi-ties, each strain provides a fluorescence signal intensity that is high enough to be detectable and avoids
Wen et al. Journal of Bacteriology
July 2018 Volume 200 Issue 14 e00178-18 jb.asm.org 12
on June 25, 2020 by guesthttp://jb.asm
.org/D
ownloaded from
the scattering of the excitation or emission beam from the concentrated sample, which reduces theapparent signal intensity.
Construction of H. pylori strains expressing Tat-EGFP under the control of the cagA promoterPcagA. Plasmids for the integration of EGFP attached with one of the three Tat signal peptides (HydA andKapA from H. pylori and TorA from E. coli) into the cag locus of H. pylori G27 were constructed by usinga Genesmart seamless cloning and assembly kit (Invitrogen by Life Technologies), as follows (Fig. 1). A1,421-bp DNA fragment containing a 216-bp sequence encoding amino acids 1 to 72 of CagC (HP0545),a 348-bp sequence encoding the complete CagB (HP0546) protein, and an 833-bp intergenic sequencebetween the cagB and cagA genes were amplified from chromosomal DNA of H. pylori 26695 with primerpair HP0545-5P(400-430)-KpnI/HP0547-3P(1785-1860). PCR performed with primer pair HP0547-5P(1808-1828)/HP0547-3P(1542-1569)-SacI generated a 731-bp fragment encoding amino acids 1 to 243 of CagA(HP0547). A 920-bp chloramphenicol resistance cassette was amplified from pBC SK� with primers Ch-5and Ch-3. A 717-bp fragment encoding EGFP, a GFPmut1 variant (50) which contains the double-amino-acid replacement of Phe-64 to Leu and Ser-65 to Thr, was amplified from pEGFP-C1 (BD Biosciences-Clontech) with primer pair EGFP-5/EGFP-3. For the fragments encoding Tat signal peptides, PCR per-formed with primer pairs HydA-F/HydA-R, KapA-F/KapA-R, and KapA-Δtat-F/KapA-R, using chromosomalDNA of H. pylori G27 as a template, yielded a 256-bp fragment for the HydA signal peptide, a 121-bpfragment for the KapA signal peptide, and a 100-bp fragment for the KapA signal peptide with itstwin-arginine motif deleted, and a 176-bp fragment for the TorA signal peptide was amplified withprimer pair TorA-F/TorA-R (32) from chromosomal DNA of E. coli Top10. The primers used for generatinginserts were designed to have each DNA fragment share 15-bp-end-terminal homology with the adjacentfragment (including the cloning vector pBluescript). The seamless cloning and assembly reactions with5 inserts and a KpnI/SacI-linearized pBluescript vector resulted in four constructs containing a Tat signalpeptide (HydA, KapA, KapA-ΔTat, or TorA) fused with an EGFP-chloramphenicol resistance cassetteflanked by cagC-cagB-PcagA upstream and cagA downstream, which was cloned into the KpnI/SacI sitesof the pBluescript vector. All the primer sequences are listed in Table 1. The plasmid constructs carryinga Tat signal peptide tagged with EGFP and a chloramphenicol resistance cassette were introduced intoH. pylori strain G27 by natural transformation. For the strain that targets EGFP to the periplasm of theFlgS-deficient mutant, the construct containing TorA-EGFP was transformed into G27/ΔFlgS::Km (15). Theresulting strains (G27/PcagA-HydA-EGFP, G27/PcagA-KapA-EGFP, G27/PcagA-KapA-Δtat-EGFP, G27/PcagA-TorA-EGFP, and G27/ΔFlgS-PcagA-TorA-EGFP) had the Tat-EGFP fusion ORF integrated into the cag locusof H. pylori G27 or G27/ΔFlgS and directly under the control of the cagA promoter PcagA. Thechloramphenicol-resistant transformants were confirmed by PCR analysis for the correct integration ofthe Tat-EGFP ORF and the chloramphenicol resistance cassette in the genomic cag locus of H. pylori.
Cell fractionations and immunoblotting. Periplasm and cytoplasm fractions were prepared byusing methods described previously by Thomas et al. (32). Cultures grown overnight were harvestedfrom 2 to 3 BHI agar plates by centrifugation at 4,000 � g for 10 min at 4°C. The pellets were resuspendedin 1 ml of phosphate-buffered saline (PBS). After washing twice with 1 ml of PBS and twice with 300 �lof 25 mM Tris-HCl (pH 7.4), the cell pellet was resuspended in 100 �l of buffer containing 25 mM Tris-HCl(pH 7.4)–20% sucrose–1 mM EDTA and incubated at room temperature for 10 min. After centrifugationat 4,000 � g for 10 min at room temperature, cells were resuspended in 100 �l of ice-cold 5 mM MgSO4
and incubated on ice for 20 min to generate spheroplasts. The periplasm fraction (retained in thesupernatant) and spheroplasts (pellets) were separated by centrifugation at 10,300 � g for 5 min at 4°C.Spheroplasts were resuspended in 100 �l of ice-cold 5 mM MgSO4 and lysed by sonication, and intactspheroplasts and cellular debris were removed by centrifugation at 10,300 � g for 5 min at 4°C. Thecytoplasm fraction (retained in the supernatant) was collected after centrifugation at 250,000 � g for
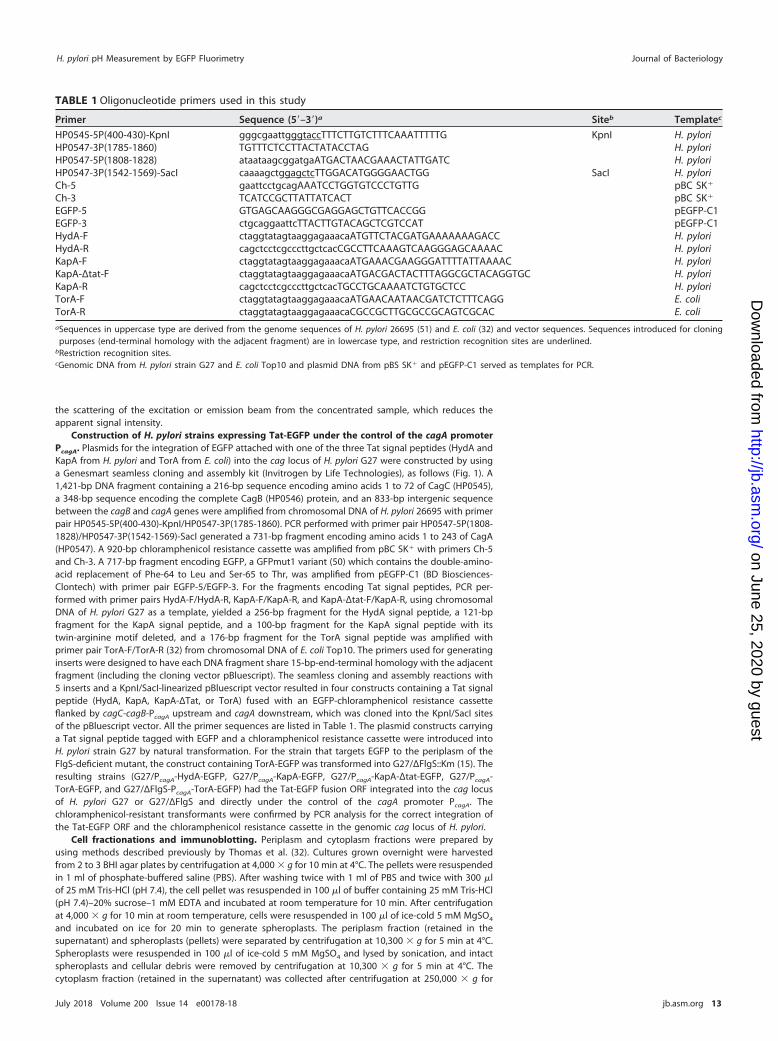
TABLE 1 Oligonucleotide primers used in this study
Primer Sequence (5=–3=)a Siteb Templatec
HP0545-5P(400-430)-KpnI gggcgaattgggtaccTTTCTTGTCTTTCAAATTTTTG KpnI H. pyloriHP0547-3P(1785-1860) TGTTTCTCCTTACTATACCTAG H. pyloriHP0547-5P(1808-1828) ataataagcggatgaATGACTAACGAAACTATTGATC H. pyloriHP0547-3P(1542-1569)-SacI caaaagctggagctcTTGGACATGGGGAACTGG SacI H. pyloriCh-5 gaattcctgcagAAATCCTGGTGTCCCTGTTG pBC SK�
Ch-3 TCATCCGCTTATTATCACT pBC SK�
EGFP-5 GTGAGCAAGGGCGAGGAGCTGTTCACCGG pEGFP-C1EGFP-3 ctgcaggaattcTTACTTGTACAGCTCGTCCAT pEGFP-C1HydA-F ctaggtatagtaaggagaaacaATGTTCTACGATGAAAAAAAGACC H. pyloriHydA-R cagctcctcgcccttgctcacCGCCTTCAAAGTCAAGGGAGCAAAAC H. pyloriKapA-F ctaggtatagtaaggagaaacaATGAAACGAAGGGATTTTATTAAAAC H. pyloriKapA-Δtat-F ctaggtatagtaaggagaaacaATGACGACTACTTTAGGCGCTACAGGTGC H. pyloriKapA-R cagctcctcgcccttgctcacTGCCTGCAAAATCTGTGCTCC H. pyloriTorA-F ctaggtatagtaaggagaaacaATGAACAATAACGATCTCTTTCAGG E. coliTorA-R ctaggtatagtaaggagaaacaCGCCGCTTGCGCCGCAGTCGCAC E. coliaSequences in uppercase type are derived from the genome sequences of H. pylori 26695 (51) and E. coli (32) and vector sequences. Sequences introduced for cloningpurposes (end-terminal homology with the adjacent fragment) are in lowercase type, and restriction recognition sites are underlined.
bRestriction recognition sites.cGenomic DNA from H. pylori strain G27 and E. coli Top10 and plasmid DNA from pBS SK� and pEGFP-C1 served as templates for PCR.
H. pylori pH Measurement by EGFP Fluorimetry Journal of Bacteriology
July 2018 Volume 200 Issue 14 e00178-18 jb.asm.org 13
on June 25, 2020 by guesthttp://jb.asm
.org/D
ownloaded from
30 min at 4°C. The protein concentration was determined by using a Pierce bicinchoninic acid (BCA)protein assay kit (Thermo Scientific). Twenty micrograms of protein for each fraction sample wasseparated on 4 to 12% NuPAGE gels (Life Technologies) and immunoblotted with anti-GFP antibody(Roche).
Fluorescent imaging analysis. H. pylori strains G27/PcagA-HydA-EGFP, G27/PcagA-KapA-EGFP, G27/PcagA-KapA-Δtat-EGFP, and G27/PcagA-TorA-EGFP were grown microaerobically at 37°C on BHI agar platessupplemented with 7% horse serum and 0.25% yeast extract in the presence of 10 �g/ml chloramphen-icol. After incubation overnight, bacteria were harvested, washed, and resuspended in fresh BHI medium.These bacteria were loaded onto polylysine-coated glass-bottom microwell dishes (MatTek Corporation)and incubated at 37°C for 10 min to allow the bacteria to settle and adhere to the bottom, followed bygentle washing with fresh HP medium to remove the floating bacteria. Confocal microscopy images wereacquired by using a Zeiss LSM 510 confocal laser scanning microscope (Carl Zeiss MicroImaging GmbH,Germany). For EGFP fluorescence detection, excitation was set at 488 nm, and emission was filteredthrough a green band-pass filter transmitting at between 500 and 545 nm.
Intracellular pH measurement with a fluorimetry assay. For fluorescence spectroscopy, methodsdescribed previously (22) were used, with some modifications. Briefly, 3-ml bacterial suspension aliquotswere placed into a fluorimeter cuvette under constant stirring at 37°C and measured with a Fluorolog-3spectrofluorimeter (Horiba Jobin Yvon). Excitation spectra were collected at 440 to 500 nm by using anemission wavelength of 507 nm. Blank scans of wild-type H. pylori G27 suspensions were used to subtractthe nonspecific background signal. Spectra were recorded for three biological replicates at each pH. EGFPexcitation was measured at 488 nm, with an emission wavelength of 507 nm. Standard curves for pH asa function of the fluorescence intensity were generated for each strain expressing EGFP (G27/PcagA-KapA-EGFP, G27/PcagA-KapA-Δtat-EGFP, and G27/PcagA-TorA-EGFP) for each individual experiment at pH 4.5, 5.0,5.5, 6.0, 6.5, 7.0, 7.5, 8.0, and 8.5 with the addition of 10 �M TCS (3,3=,4=,5-tetrachloro-salicylanilide), whichcollapses the transmembrane ΔpH. For each strain, a regression equation was applied to the standardcurve and used to convert time course signal intensities (at an excitation wavelength of 488 nm) to pHunits. For time course experiments, continuous fluorescence intensities were recorded every 1 s for aninitial 60 s of acquisition before the addition of aliquots of reagents and then for the remaining 3 to 5min after the addition of the reagents.
ACKNOWLEDGMENTSThis work was supported in part by NIH grants DK46917, DK53462, and DK58333 to
G.S.; HL113350 to O.V.; and K08DK100661 and R03DK110579 to E.A.M. and by the UCLAChildren’s Discovery and Innovation Institute (E.A.M.). This work was also supportedwith resources and the use of facilities at West Los Angeles Veterans AdministrationMedical Center.
We declare no competing or financial interests.
REFERENCES1. Marshall BJ, Warren JR. 1984. Unidentified curved bacilli in the stomach
of patients with gastritis and peptic ulceration. Lancet i:1311–1315.2. Sachs G, Weeks DL, Wen Y, Marcus EA, Scott DR, Melchers K. 2005. Acid
acclimation by Helicobacter pylori. Physiology 20:429 – 438. https://doi.org/10.1152/physiol.00032.2005.
3. Mobley HL, Island MD, Hausinger RP. 1995. Molecular biology of micro-bial ureases. Microbiol Rev 59:451– 480.
4. Rektorschek M, Buhmann A, Weeks D, Schwan D, Bensch KW, EskandariS, Scott D, Sachs G, Melchers K. 2000. Acid resistance of Helicobacterpylori depends on the UreI membrane protein and an inner membraneproton barrier. Mol Microbiol 36:141–152. https://doi.org/10.1046/j.1365-2958.2000.01835.x.
5. Scott DR, Marcus EA, Weeks DL, Lee A, Melchers K, Sachs G. 2000.Expression of the Helicobacter pylori ureI gene is required for acidic pHactivation of cytoplasmic urease. Infect Immun 68:470 – 477. https://doi.org/10.1128/IAI.68.2.470-477.2000.
6. Weeks DL, Eskandari S, Scott DR, Sachs G. 2000. A H�-gated ureachannel: the link between Helicobacter pylori urease and gastric coloni-zation. Science 287:482– 485. https://doi.org/10.1126/science.287.5452.482.
7. Marcus EA, Moshfegh AP, Sachs G, Scott DR. 2005. The periplasmicalpha-carbonic anhydrase activity of Helicobacter pylori is essential foracid acclimation. J Bacteriol 187:729 –738. https://doi.org/10.1128/JB.187.2.729-738.2005.
8. Smith KS, Ferry JG. 2000. Prokaryotic carbonic anhydrases. FEMS MicrobiolRev 24:335–366. https://doi.org/10.1111/j.1574-6976.2000.tb00546.x.
9. Pflock M, Finsterer N, Joseph B, Mollenkopf H, Meyer TF, Beier D. 2006.Characterization of the ArsRS regulon of Helicobacter pylori, involved in
acid adaptation. J Bacteriol 188:3449 –3462. https://doi.org/10.1128/JB.188.10.3449-3462.2006.
10. Pflock M, Kennard S, Delany I, Scarlato V, Beier D. 2005. Acid-inducedactivation of the urease promoters is mediated directly by the ArsRStwo-component system of Helicobacter pylori. Infect Immun 73:6437– 6445. https://doi.org/10.1128/IAI.73.10.6437-6445.2005.
11. Pflock M, Kennard S, Finsterer N, Beier D. 2006. Acid-responsive generegulation in the human pathogen Helicobacter pylori. J Biotechnol126:52– 60. https://doi.org/10.1016/j.jbiotec.2006.03.045.
12. Wen Y, Feng J, Scott DR, Marcus EA, Sachs G. 2006. Involvement of theHP0165-HP0166 two-component system in expression of some acidic-pH-upregulated genes of Helicobacter pylori. J Bacteriol 188:1750 –1761.https://doi.org/10.1128/JB.188.5.1750-1761.2006.
13. Wen Y, Feng J, Scott DR, Marcus EA, Sachs G. 2007. HP0165-HP0166two-component system (ArsRS) regulates the acid-induced expression ofHP1186 alpha-carbonic anhydrase in Helicobacter pylori by activating thepH-dependent promoter. J Bacteriol 189:2426 –2434. https://doi.org/10.1128/JB.01492-06.
14. Scott DR, Marcus EA, Wen Y, Singh S, Feng J, Sachs G. 2010. Cytoplasmichistidine kinase (HP0244)-regulated assembly of urease with UreI, achannel for urea and its metabolites, CO2, NH3, and NH4
�, is necessaryfor acid survival of Helicobacter pylori. J Bacteriol 192:94 –103. https://doi.org/10.1128/JB.00848-09.
15. Wen Y, Feng J, Scott DR, Marcus EA, Sachs G. 2009. The pH-responsiveregulon of HP0244 (FlgS), the cytoplasmic histidine kinase of Helicobac-ter pylori. J Bacteriol 191:449 – 460. https://doi.org/10.1128/JB.01219-08.
16. Hong W, Sano K, Morimatsu S, Scott DR, Weeks DL, Sachs G, Goto T,Mohan S, Harada F, Nakajima N, Nakano T. 2003. Medium pH-dependent
Wen et al. Journal of Bacteriology
July 2018 Volume 200 Issue 14 e00178-18 jb.asm.org 14
on June 25, 2020 by guesthttp://jb.asm
.org/D
ownloaded from
redistribution of the urease of Helicobacter pylori. J Med Microbiol52:211–216. https://doi.org/10.1099/jmm.0.05072-0.
17. Scott DR, Marcus EA, Weeks DL, Sachs G. 2002. Mechanisms of acidresistance due to the urease system of Helicobacter pylori. Gastroenter-ology 123:187–195. https://doi.org/10.1053/gast.2002.34218.
18. Okada Y, Inouye A. 1976. pH-sensitive glass microelectrodes and intra-cellular pH measurements. Biophys Struct Mech 2:21–30. https://doi.org/10.1007/BF00535650.
19. Zilberstein D, Agmon V, Schuldiner S, Padan E. 1984. Escherichia coliintracellular pH, membrane potential, and cell growth. J Bacteriol 158:246 –252.
20. Slonczewski JL, MacNab RM, Alger JR, Castle AM. 1982. Effects of pH andrepellent tactic stimuli on protein methylation levels in Escherichia coli.J Bacteriol 152:384 –399.
21. Olsen KN, Budde BB, Siegumfeldt H, Rechinger KB, Jakobsen M, IngmerH. 2002. Noninvasive measurement of bacterial intracellular pH on asingle-cell level with green fluorescent protein and fluorescence ratioimaging microscopy. Appl Environ Microbiol 68:4145– 4147. https://doi.org/10.1128/AEM.68.8.4145-4147.2002.
22. Wilks JC, Slonczewski JL. 2007. pH of the cytoplasm and periplasm ofEscherichia coli: rapid measurement by green fluorescent protein fluo-rimetry. J Bacteriol 189:5601–5607. https://doi.org/10.1128/JB.00615-07.
23. Meyer-Rosberg K, Scott DR, Rex D, Melchers K, Sachs G. 1996. The effectof environmental pH on the proton motive force of Helicobacter pylori.Gastroenterology 111:886 –900. https://doi.org/10.1016/S0016-5085(96)70056-2.
24. Scott DR, Weeks D, Hong C, Postius S, Melchers K, Sachs G. 1998. The roleof internal urease in acid resistance of Helicobacter pylori. Gastroenter-ology 114:58 –70. https://doi.org/10.1016/S0016-5085(98)70633-X.
25. Wen Y, Marcus EA, Matrubutham U, Gleeson MA, Scott DR, Sachs G.2003. Acid-adaptive genes of Helicobacter pylori. Infect Immun 71:5921–5939. https://doi.org/10.1128/IAI.71.10.5921-5939.2003.
26. Sachs G, Kraut JA, Wen Y, Feng J, Scott DR. 2006. Urea transport inbacteria: acid acclimation by gastric Helicobacter spp. J Membr Biol212:71– 82. https://doi.org/10.1007/s00232-006-0867-7.
27. Kneen M, Farinas J, Li Y, Verkman AS. 1998. Green fluorescent protein asa noninvasive intracellular pH indicator. Biophys J 74:1591–1599. https://doi.org/10.1016/S0006-3495(98)77870-1.
28. Chalfie M, Tu Y, Euskirchen G, Ward WW, Prasher DC. 1994. Greenfluorescent protein as a marker for gene expression. Science 263:802– 805. https://doi.org/10.1126/science.8303295.
29. Feilmeier BJ, Iseminger G, Schroeder D, Webber H, Phillips GJ. 2000.Green fluorescent protein functions as a reporter for protein localizationin Escherichia coli. J Bacteriol 182:4068 – 4076. https://doi.org/10.1128/JB.182.14.4068-4076.2000.
30. Craggs TD. 2009. Green fluorescent protein: structure, folding and chro-mophore maturation. Chem Soc Rev 38:2865–2875. https://doi.org/10.1039/b903641p.
31. Wickner W, Schekman R. 2005. Protein translocation across biologicalmembranes. Science 310:1452–1456. https://doi.org/10.1126/science.1113752.
32. Thomas JD, Daniel RA, Errington J, Robinson C. 2001. Export of activegreen fluorescent protein to the periplasm by the twin-arginine trans-locase (Tat) pathway in Escherichia coli. Mol Microbiol 39:47–53. https://doi.org/10.1046/j.1365-2958.2001.02253.x.
33. Benoit SL, Maier RJ. 2014. Twin-arginine translocation system in Helico-bacter pylori: TatC, but not TatB, is essential for viability. mBio 5:e01016-13. https://doi.org/10.1128/mBio.01016-13.
34. Palmer T, Sargent F, Berks BC. 2005. Export of complex cofactor-containing proteins by the bacterial Tat pathway. Trends Microbiol13:175–180. https://doi.org/10.1016/j.tim.2005.02.002.
35. Robinson C, Matos CF, Beck D, Ren C, Lawrence J, Vasisht N, Mendel S.2011. Transport and proofreading of proteins by the twin-arginine trans-location (Tat) system in bacteria. Biochim Biophys Acta 1808:876 – 884.https://doi.org/10.1016/j.bbamem.2010.11.023.
36. Bagos PG, Nikolaou EP, Liakopoulos TD, Tsirigos KD. 2010. Combined
prediction of Tat and Sec signal peptides with hidden Markov models.Bioinformatics 26:2811–2817. https://doi.org/10.1093/bioinformatics/btq530.
37. Bendtsen JD, Nielsen H, Widdick D, Palmer T, Brunak S. 2005. Predictionof twin-arginine signal peptides. BMC Bioinformatics 6:167. https://doi.org/10.1186/1471-2105-6-167.
38. Rose RW, Bruser T, Kissinger JC, Pohlschroder M. 2002. Adaptation ofprotein secretion to extremely high-salt conditions by extensive use ofthe twin-arginine translocation pathway. Mol Microbiol 45:943–950.https://doi.org/10.1046/j.1365-2958.2002.03090.x.
39. Sargent F, Bogsch EG, Stanley NR, Wexler M, Robinson C, Berks BC,Palmer T. 1998. Overlapping functions of components of a bacterialSec-independent protein export pathway. EMBO J 17:3640 –3650.https://doi.org/10.1093/emboj/17.13.3640.
40. Pavlasova E, Harold FM. 1969. Energy coupling in the transport ofbeta-galactosides by Escherichia coli: effect of proton conductors. JBacteriol 98:198 –204.
41. Nikaido H. 2003. Molecular basis of bacterial outer membrane permea-bility revisited. Microbiol Mol Biol Rev 67:593– 656. https://doi.org/10.1128/MMBR.67.4.593-656.2003.
42. van Vliet AH, Kuipers EJ, Waidner B, Davies BJ, de Vries N, Penn CW,Vandenbroucke-Grauls CM, Kist M, Bereswill S, Kusters JG. 2001. Nickel-responsive induction of urease expression in Helicobacter pylori is me-diated at the transcriptional level. Infect Immun 69:4891– 4897. https://doi.org/10.1128/IAI.69.8.4891-4897.2001.
43. Weeks DL, Gushansky G, Scott DR, Sachs G. 2004. Mechanism of protongating of a urea channel. J Biol Chem 279:9944 –9950. https://doi.org/10.1074/jbc.M312680200.
44. Maier RJ, Fu C, Gilbert J, Moshiri F, Olson J, Plaut AG. 1996. Hydrogenuptake hydrogenase in Helicobacter pylori. FEMS Microbiol Lett 141:71–76. https://doi.org/10.1111/j.1574-6968.1996.tb08365.x.
45. Harris AG, Hazell SL. 2003. Localisation of Helicobacter pylori catalase inboth the periplasm and cytoplasm, and its dependence on the twin-arginine target protein, KapA, for activity. FEMS Microbiol Lett 229:283–289. https://doi.org/10.1016/S0378-1097(03)00850-4.
46. Barrett CM, Ray N, Thomas JD, Robinson C, Bolhuis A. 2003. Quantitativeexport of a reporter protein, GFP, by the twin-arginine translocationpathway in Escherichia coli. Biochem Biophys Res Commun 304:279 –284.https://doi.org/10.1016/S0006-291X(03)00583-7.
47. Santini CL, Bernadac A, Zhang M, Chanal A, Ize B, Blanco C, Wu LF. 2001.Translocation of jellyfish green fluorescent protein via the Tat system ofEscherichia coli and change of its periplasmic localization in response toosmotic up-shock. J Biol Chem 276:8159 – 8164. https://doi.org/10.1074/jbc.C000833200.
48. Athmann C, Zeng N, Kang T, Marcus EA, Scott DR, Rektorschek M,Buhmann A, Melchers K, Sachs G. 2000. Local pH elevation mediated bythe intrabacterial urease of Helicobacter pylori cocultured with gastriccells. J Clin Invest 106:339 –347. https://doi.org/10.1172/JCI9351.
49. Covacci A, Censini S, Bugnoli M, Petracca R, Burroni D, Macchia G,Massone A, Papini E, Xiang Z, Figura N. 1993. Molecular characterizationof the 128-kDa immunodominant antigen of Helicobacter pylori associ-ated with cytotoxicity and duodenal ulcer. Proc Natl Acad Sci U S A90:5791–5795.
50. Cormack BP, Valdivia RH, Falkow S. 1996. FACS-optimized mutants of thegreen fluorescent protein (GFP). Gene 173:33–38. https://doi.org/10.1016/0378-1119(95)00685-0.
51. Tomb JF, White O, Kerlavage AR, Clayton RA, Sutton GG, FleischmannRD, Ketchum KA, Klenk HP, Gill S, Dougherty BA, Nelson K, QuackenbushJ, Zhou L, Kirkness EF, Peterson S, Loftus B, Richardson D, Dodson R,Khalak HG, Glodek A, McKenney K, Fitzegerald LM, Lee N, Adams MD,Hickey EK, Berg DE, Gocayne JD, Utterback TR, Peterson JD, Kelley JM,Cotton MD, Weidman JM, Fujii C, Bowman C, Watthey L, Wallin E, HayesWS, Borodovsky M, Karp PD, Smith HO, Fraser CM, Venter JC. 1997. Thecomplete genome sequence of the gastric pathogen Helicobacter pylori.Nature 388:539 –547. https://doi.org/10.1038/41483.
H. pylori pH Measurement by EGFP Fluorimetry Journal of Bacteriology
July 2018 Volume 200 Issue 14 e00178-18 jb.asm.org 15
on June 25, 2020 by guesthttp://jb.asm
.org/D
ownloaded from