Embed Size (px)
Citation preview


PGi Fast Facts
PGi — The Meetings Experts
Testimonial
Collaboration Products
iMeet® - www.imeet.com
GlobalMeet® - www.globalmeet.com
NYSE
Type
Founded
Headquarters
Revenue
No. Employees
Global Reach
PGI
Public
1991
Atlanta, Georgia, USA
$473.8 M (2011)
1,700
25 Countries
Management Team
Boland T. Jones Founder, Chairman and Chief Executive Officer
Theodore P. Schrafft President
David E. Trine Chief Financial Officer
David M. Guthrie
Chief Technology Officer
Erik Petrik
Chief Creative Officer and Executive Producer, PGi Studios
John D. Stone EVP, European Operations
J. Scott Tapp EVP, Sales and Marketing
Dennis Choo
Managing Director, Asia Pacific
www.pgi.com
Media Relations
Investor Relations
Kim Casey
Sean O’Brien
404. 564.6633
404.262.8462
©1999-2012 PGi, Inc. All Rights Reserved. 3280 Peachtree Road NE. Suite 1000. Atlanta, GA 30305 USA
PGi in Focus
PGi Facts
> We have connected more than 725 million people inover 165 million meetings in the last five years alone.
> Our products meet the needs of every type of user, in any industry, with any type of meeting.
> We serve more than 35,000 customers and 75% of theFortune 100™.
Sean O’Brien EVP, Strategy and Communications
>
>
PGi is a global leader in virtual meetings. For 20 years, we have innovated technologies that help people meet and collaborate in more enjoyable and productive ways.
Every month, our award-winning audio, web and video conferencing products bring over 17 million people together in nearly 4 million meetings, helping many of the smallest and largest businesses around the world be more efficient, mobile and green.
Connect with Us
Cloud-based video conferencing solution that lets you meet face-to-face with up to 15 people online – anytime, anywhere.
Easy-to-use audio and web conferencing brought together for powerful,cost-effective meetings with up to 125 participants.
ubeTYou
www.facebook.com/PGiFans
www.twitter.com/PGiMeetTweet
www.youtube.com/PGiPremiereGlobal
Michele Dobnikar EVP, Customer Care and SMB Base Management
Scott Askins Leonard SVP of Legal, General Counsel and Secretary
Our virtual meeting solutions are globallyavailable and scalable for any business need.
>
“Frost & Sullivan views PGi as a key provider and leader in conferencing services and real-time virtual group meetings. The company has established a strong customer base and is building the next generation of online meetings that are focused on making user experiences simpler and more intuitive.”
- Roopam Jain, Principal Analyst, Frost & Sullivan


UNITED STATES SECURITIES AND EXCHANGE COMMISSION
WASHINGTON, D.C. 20549
FORM 10-K
[X] ANNUAL REPORT PURSUANT TO SECTION 13 OR 15(d) OF THE SECURITIES EXCHANGE ACT OF 1934 FOR THE FISCAL YEAR ENDED DECEMBER 31, 2011. [ ] TRANSITION REPORT PURSUANT TO SECTION 13 OR 15(d) OF THE SECURITIES EXCHANGE ACT OF 1934 For the transition period from ____________________ to ____________________
Commission file number: 001-13577
PREMIERE GLOBAL SERVICES, INC. (Exact name of registrant as specified in its charter)
Georgia 59-3074176
(State or other jurisdiction of incorporation or organization) (I.R.S. Employer Identification No.)
3280 Peachtree Road, N.E., The Terminus Building, Suite 1000, Atlanta, Georgia 30305 (Address of Principal Executive Office)
(Registrant's telephone number, including area code): (404) 262-8400
Securities registered pursuant to Section 12(b) of the Act: Common Stock, Par Value $0.01 Per Share New York Stock Exchange
(Title of each class) (Name of each exchange on which registered) Securities registered pursuant to Section 12(g) of the Act:
None (Title of class)
Indicate by check mark if the registrant is a well-known seasoned issuer, as defined in Rule 405 of the Securities Act. [ ] Yes [X] No
Indicate by check mark if the registrant is not required to file reports pursuant to Section 13 or Section 15(d) of the Act. [ ] Yes [X] No
Indicate by check mark whether the registrant (1) has filed all reports required to be filed by Section 13 or 15(d) of the Securities Exchange Act of 1934 during the preceding 12 months (or for such shorter period that the registrant was required to file such reports), and (2) has been subject to such filing requirements for the past 90 days. Yes [X] No [ ]
Indicate by check mark whether the registrant has submitted electronically and posted on its corporate website, if any, every Interactive Data File required to be submitted and posted pursuant to Rule 405 of Regulation S-T (§232.405 of this chapter) during the preceding 12 months (or for such shorter period that the registrant was required to submit and post such files). Yes [ X ] No [ ]
Indicate by check mark if disclosure of delinquent filers pursuant to Item 405 of Regulation S-K (§229.405 of this chapter) is not contained herein, and will not be contained, to the best of registrant's knowledge, in definitive proxy or information statements incorporated by reference in Part III of this Form 10-K or any amendment to this Form 10-K. [ ]
Indicate by check mark whether the registrant is a large accelerated filer, an accelerated filer, a non-accelerated filer or a smaller reporting company. See the definitions of “large accelerated filer,” “accelerated filer” and “smaller reporting company” in Rule 12b-2 of the Exchange Act (Check one): Large accelerated filer [ ] Accelerated filer [X] Non-accelerated filer [ ] Smaller reporting company [ ]
(Do not check if a smaller reporting company) Indicate by check mark whether the registrant is a shell company (as defined in Rule 12b-2 of the Act). Yes [ ] No [X]
The aggregate market value of the voting and non-voting common equity held by nonaffiliates computed by reference to the price at which the common equity was last sold, or the average bid and asked price of such common equity, as of June 30, 2011 as reported by the New York Stock Exchange was $371,930,635.
As of March 5, 2012, 50,163,231 shares of the registrant's common stock were outstanding.
DOCUMENTS INCORPORATED BY REFERENCE Portions of the registrant’s proxy statement for its 2012 annual meeting of shareholders are incorporated by reference in Part III of this Form 10-K.

i
FORWARD-LOOKING STATEMENTS
When used in this annual report on Form 10-K and elsewhere by us or by management from time to time, the words “believes,” “anticipates,” “expects,” “will,” “may,” “should,” “intends,” “plans,” “estimates,” “predicts,” “potential,” “continue” and similar expressions are intended to identify forward-looking statements concerning our operations, economic performance and financial condition. For those statements, we claim the protection of the safe harbor for forward-looking statements contained in the Private Securities Litigation Reform Act of 1995. These statements are based on a number of assumptions and estimates that are inherently subject to significant risks and uncertainties, many of which are beyond our control and reflect future business decisions which are subject to change. A variety of factors could cause actual results to differ materially from those anticipated in our forward-looking statements, including, but not limited to, the following factors:
• Competitive pressures, including pricing pressures;
• Technological changes and the development of alternatives to our services;
• Market acceptance of our new cloud-based, virtual meeting services, including our iMeet® and GlobalMeet® services;
• Our ability to attract new customers and to retain and further penetrate our existing customers;
• Risks associated with challenging global economic conditions;
• Price increases from our telecommunications service providers;
• Service interruptions and network downtime;
• Technological obsolescence and our ability to upgrade our equipment or increase our network
capacity;
• Concerns regarding the security of transactions;
• Future write-downs of goodwill or other intangible assets;
• Greater than anticipated tax liabilities;
• Restructuring and cost reduction initiatives and the market reaction thereto;
• Our level of indebtedness;
• Risks associated with acquisitions and divestitures;
• The impact of the sale of our PGiSend business;
• Our ability to protect our intellectual property rights, including possible adverse results of litigation or infringement claims;
• Regulatory or legislative changes, including further government regulations applicable to traditional
telecommunications service providers and data privacy;
• Risks associated with international operations and market expansion, including fluctuations in foreign currency exchange rates;
• Factors described under the caption Item 1A. “Risk Factors” in this annual report; and

ii
• Factors described from time to time in our press releases, reports and other filings made with the Securities and Exchange Commission.
We caution that these factors are not exclusive. Consequently, all of the forward-looking statements made
in this annual report and in other documents filed with the Securities and Exchange Commission, or SEC, are qualified by these cautionary statements. Readers are cautioned not to place undue reliance on these forward-looking statements, which speak only as of the date of this annual report. We undertake no obligation to publicly release the results of any revisions to these forward-looking statements that may be made to reflect events or circumstances after the date of this annual report, or the date of the statement, if a different date.

iii
INDEX Page Part I Item 1. Business 1 Item 1A. Risk Factors 6 Item 1B. Unresolved Staff Comments 17 Item 2. Properties 18 Item 3. Legal Proceedings 18 Item 4. Mine Safety Disclosures 18 Part II Item 5. Market for Registrant's Common Equity, Related Stockholder Matters and Issuer Purchases of Equity Securities
19
Item 6. Selected Financial Data 21 Item 7. Management's Discussion and Analysis of Financial Condition and Results of Operations 22 Item 7A. Quantitative and Qualitative Disclosures About Market Risk 38 Item 8. Financial Statements and Supplementary Data 39 Item 9. Changes in and Disagreements with Accountants on Accounting and Financial Disclosure 70 Item 9A. Controls and Procedures 70 Item 9B. Other Information 72 Part III Item 10. Directors, Executive Officers and Corporate Governance 72 Item 11. Executive Compensation 72 Item 12. Security Ownership of Certain Beneficial Owners and Management and Related Stockholder Matters
72
Item 13. Certain Relationships and Related Transactions and Director Independence 72 Item 14. Principal Accountant Fees and Services 72 Part IV Item 15. Exhibits and Financial Statement Schedules 73 Signatures

1
PART I Item 1. Business Overview
Premiere Global Services, Inc., or PGi, has been a global leader in virtual meetings for 20 years. Our
cloud-based solutions deliver multi-point, real-time virtual collaboration using video, voice and file sharing technologies. PGi solutions are available via desktops, tablets or mobile devices, helping businesses worldwide be more productive, mobile and “green.” PGi has a global presence in 25 countries and an established base of more than 35,000 enterprise customers, including 75% of the Fortune 100™. In the last five years, we have hosted more than 725 million people from 137 countries in over 165 million meetings.
PGi goes to market with three primary solutions. Our iMeet® next-generation online meeting solution combines secure, web-based video conferencing, audio conferencing, social networking and file sharing. Our GlobalMeet® solution integrates web conferencing and audio conferencing into one complete solution for easy, cost-effective meetings. Our ReadyConference® audio conferencing solution suite includes automated conferencing, global conferencing with approximately 140 access points and operator-assisted event conferencing. We also offer a suite of mobile applications that extends our solutions to tablets and other mobile devices.
We offer our virtual meeting solutions in the cloud, with a software as a service, or SaaS, model, eliminating the burden of up-front capital investment and the complexity associated with purchasing and installing hardware and desktop software solutions. Further, our SaaS model lets customers avoid the headcount and ongoing operating costs required to support internal solutions, the expense of platform upgrades and the business risk of technology obsolescence.
We host our solutions on our secure, enterprise-class platforms that are located around the world in our server and network operations centers and in third-party colocation facilities. This integrated network of cloud-based platforms supports our proprietary software and a variety of leading third-party applications.
PGi solutions are available online at www.pgi.com, www.imeet.com and www.globalmeet.com, through our mobile applications for the iPhone, iPad, BlackBerry and other mobile devices, and through access points embedded in third-party applications. We offer open-standards access to our platforms and technologies to enable our customers and strategic partners to integrate our capabilities.
We market our solutions globally through a multi-channel sales approach that includes direct sales, channel resellers, strategic technology partners, web-based sales and direct telesales.
We were incorporated in Florida in 1991 and reincorporated in Georgia in 1995. As of December 31, 2011, we had approximately 1,700 employees conducting business within our three operating segments, which include North America, Europe and Asia Pacific. See Note 19 to our consolidated financial statements for the year ended December 31, 2011, included in this annual report, for information concerning operations in our segments. Industry Background
Based on the 2011 Worldwide Collaboration Services Market Forecast study by Wainhouse Research, LLC, the global collaboration and conferencing market is projected to grow at a compound annual growth rate of approximately 5% to $8 billion by 2015.
Collaboration has become a mission-critical backbone of modern business, as even the most basic tasks rely on the ability of individuals to communicate and share information in a cost-effective, real-time and productive manner. We believe companies are increasingly relying on collaboration technologies because of the growing cost and inconvenience of business travel, the increasingly mobile workforce, environmental concerns and the desire to improve corporate efficiency and productivity to remain competitive.
Helping companies and individuals meet in better, more enjoyable and productive ways is at the core of our focus and expertise at PGi. With two decades of experience in virtual meetings, we have generated meaningful revenue growth, garnered a world-class customer base of leading companies in nearly every industry and region of the world, increased our market share and helped lead and expand the industry through our product innovation. We

2
believe that these strengths, combined with our longstanding history of delivering results to our customers, provide us with a significant competitive advantage in the market.
Today, the way in which people meet and collaborate is changing, supported by significant advances in communication technologies and evolving user habits and expectations. We believe the market is moving toward next-generation, virtual meeting technologies that leverage cloud-based software, the web, social media platforms, desktop video and mobile computing to deliver a more robust, engaging and meaningful collaborative experience.
Our strategy is to lead the industry in this transition by leveraging our competitive strengths and continuing to deliver innovative solutions that incorporate new technologies and embrace users’ changing preferences for how they want to meet, collaborate and connect. Further, we believe our ongoing enhancements to our iMeet and GlobalMeet solutions will greatly expand the addressable market for our services into rapidly growing areas like desktop video conferencing, visual audio conferencing, mobile collaboration, social media, live event streaming and file sharing. Solutions
Our virtual meeting solutions enable multiple people, regardless of their physical location, to easily collaborate via video, web and/or audio conferencing technologies. Our solutions are used for all forms of meetings, from large events, such as investor relations presentations and training sessions, to smaller meetings, such as sales planning, project management and ad hoc meetings. We design our solutions with the intent of making them more simple, personal and mobile to enable people to meet in more meaningful ways, anytime, anywhere. By utilizing a single interface to access integrated video, web and audio conferencing services via their desktop, laptop, smartphone, tablet or landline, users don’t have to employ multiple platforms for their virtual meetings. iMeet
In January 2011, we launched our iMeet solution, which offers secure, web-based video conferencing to enable people to meet face-to-face online. Unlike traditional web conferencing services, iMeet gives users their own personal meeting room online that combines web-based video conferencing and visual audio conferencing with social networking and file sharing. iMeet was designed to bring a simple, human and intuitive experience to online meetings. iMeet enables up to 15 people to connect face-to-face online, without software downloads or incremental hardware investments beyond a standard webcam. iMeet meeting guests can connect with and learn more about each other using today’s most popular social networks, show and share presentation materials, including video presentations, and take real-time, collaborative meeting notes. Meeting guests can connect to iMeet via their desktop, tablet or mobile device, anywhere in the world. GlobalMeet
In February 2011, we launched our GlobalMeet solution, which offers integrated conference calling and web conferencing services to businesses at a competitive price. GlobalMeet was designed to simplify the user experience associated with web conferencing services and to better replicate the way people naturally meet. GlobalMeet enables up to 125 users to connect using their webcam and a traditional telephone. GlobalMeet users can schedule, start and manage audio and web conference calls from their desktop or mobile device and connects meeting participants automatically, without the need for dial-in numbers and passcodes. Users can transition from an audio conference call into a web collaboration session with the click of a button. GlobalMeet offers screen sharing, application sharing, white boarding, polling, chat and other traditional web conferencing features. ReadyConference
Our ReadyConference audio conferencing suite of enterprise-class audio conferencing services includes automated conferencing, global conferencing with approximately 140 access points and operator-assisted event conferencing. These services are available around the world and are scalable for businesses of every size. Customers
Our customer base is diverse across industry vertical, region and size of company. Our customers include leading software and technology companies, commercial and investment banks, retailers, travel and hospitality firms and healthcare companies, among others. Our customers use our solutions to reduce cost, increase efficiency,

3
enhance productivity, promote their corporate sustainability initiatives and accelerate business objectives.
Our business is affected by seasonal fluctuations in business activity, which we believe are common within our industry. For example, we typically experience lower levels of sales and usage during periods that have reduced numbers of working days. Our operating results have historically decreased during the summer months, particularly in our European operations, as well as during the Thanksgiving, December and New Year holidays. We expect our revenues during these periods will not grow at the same rates as compared with other periods of the year because of decreased use of our services by our enterprise customers. Sales and Marketing
We have a multi-channel sales approach that includes global, enterprise, small and medium business, indirect and strategic partners and online web sales:
• We sell directly to customers through our approximately 585 sales and marketing professionals worldwide;
• We sell indirectly through marketing alliances and distribution partners, including agents and resellers; • We sell indirectly through strategic technology partners that integrate and resell our services with their
own; • We sell online in an ecommerce model at our transactional websites, including www.pgi.com,
www.imeet.com and www.globalmeet.com; and • We employ print, television, radio, online and email marketing campaigns to generate increased
activity for our sales channels.
As a service organization, our customer care teams play a major role in managing customer relationships and sell additional value-added services to existing accounts. Competition
The markets for our solutions are highly competitive, rapidly evolving and subject to changing technology, shifting customer needs and introductions of new products and services. We compete for customers based on product offerings, price, customer service, quality of user experience, ease of use, reliability, global capabilities, scalability, value-added functionality, security and integration with multiple operating systems and devices.
We believe our competitive advantages in the market include:
• Our proven track record of performance and history of innovation;
• Our breadth of video, web and audio conferencing services;
• Our global reach;
• The quality, security, reliability, scalability and interoperability of our service offerings; and
• The ease of use and user experience of our virtual meeting solutions.
We compete with independent conferencing service providers like ACT Teleconferencing, Inc., Arkadin, Inc., which recently acquired the ConferencePlus conferencing services division of Westell Technologies, Inc. and Intercall, Inc., a division of West Corporation. Additionally, we compete with major telecommunications service providers around the world, such as AT&T Inc., BT Group plc., France Telecom S.A., Global Crossing Limited, Nippon Telegraph and Telephone Corporation, TELUS Corporation and Verizon Communications, Inc. We also face competition from companies that offer free conferencing services, smaller and niche providers of audio, web and video conferencing services, premise-based solution providers and internally developed solutions for companies that choose to insource these needs.

4
We also compete with services offered by business suite software providers, application service providers
and web conferencing providers, such as Adobe Connect, Cisco WebEx Meeting Center, Citrix GoToMeeting, IBM Lotus Sametime and Microsoft Lync. These providers may attempt to leverage their dominant market positions through additional technical integration or bundled offerings or through acquisitions, such as Microsoft Corporation’s acquisition of Skype Global S.à r.l. and Citrix Systems Inc.’s acquisition of Netviewer AG, to further expand their presences in the collaboration and conferencing market. In addition, we have entered into distribution and reseller arrangements with companies, including some of the companies listed above, that offer competitive collaboration and conferencing services that could choose to increase their emphasis on offerings competitive to us, cease to offer some or all of their services or our services or both.
Furthermore, we compete with services offered by consumer-oriented technology providers, such as Google+ and Google Voice, ooVoo and Skype, as well as various social networks, including Facebook and Huddle, which are beginning to offer limited real-time collaboration capabilities. We also compete with customer relationship management, or CRM, and social business platform providers, such as Salesforce.com, Inc., and Jive Software, Inc., which are integrating real-time collaboration services into their offerings. Research and Development
Designing, developing, testing, deploying and supporting innovative virtual meeting technologies allows us to better meet our customers’ needs and to differentiate and position ourselves in larger market segments. For example, during 2011, we launched our iMeet and GlobalMeet virtual meeting solutions. In addition, we released enhancements and upgrades to these solutions, including our mobile applications, dial-out capabilities and toolbars for both iMeet and GlobalMeet, enhanced softphone and “add a guest” features for iMeet and upgraded video with picture-in-picture, enhanced screen sharing and simplified recording capabilities for GlobalMeet. We also continue to expand and migrate traffic to our global platform of media servers, which enables us to smart route traffic around the world using local access points.
We devote significant resources to the innovation and development of new services, enhancements to existing services and to our websites. We employ approximately 100 research and development professionals. Our research and development expenses from continuing operations for 2011, 2010 and 2009 were $11.5 million, $14.1 million and $11.3 million, respectively. Suppliers
We purchase voice and data services pursuant to supply agreements with telecommunications service providers. Agreements with some of our telecommunications service providers contain minimum purchase requirements totaling approximately $28.5 million for 2012. Government Regulation
We are subject to various federal, state, local and international laws regulating the provision of our services. The application of these laws and regulations to our services is often unclear and sometimes may conflict. As a result, we monitor and have compliance procedures in place regarding applicable laws and regulations. Further, our customer agreements generally provide that our customers are responsible for their compliance with all applicable laws and regulations. We could, nevertheless, be subject to litigation by private parties and governmental bodies, including governmental enforcement actions, alleging a violation of such laws or regulations, which could result in damages, regulatory fines, penalties and possible other relief under such laws and regulations and the accompanying costs and uncertainties of litigation and enforcement actions. In addition, we could incur additional costs or be required to change or restrict our business practices or services in order to comply with applicable laws and regulations or if our customers seek to have us assume obligations as part of contractual negotiations.
The following is a brief description of certain laws and regulations that could impact our business and the
business of our customers. For further discussion of how these regulations may adversely impact our business, see Item 1A. Risk Factors – “Risks Related to Government Regulation.”

5
Telecommunications
We do not view our conferencing services as traditional common carrier services and instead have chosen to offer such services on a private carriage basis. To the extent that our conferencing services are provided on a private carriage basis, such services are subject to fewer obligations than apply to traditional common carrier telecommunications services. Consequently, we have not submitted to all Federal Communications Commission, or FCC, or state public service or utility commission regulations applicable to providers of traditional telecommunications services in the United States. However, we are subject to certain regulations imposed by the FCC, and we may be affected by additional regulatory decisions, trends or policies issued or implemented by regulatory authorities. For example, in June 2008, the FCC issued an order ruling that audio conferencing providers must contribute directly to the federal Universal Service Fund, or USF, on a prospective basis, based on revenues from certain teleconferencing services. In accordance with FCC rules, since August 2008, we have filed quarterly and annual reports of revenues of certain of our conferencing subsidiaries with the Universal Service Administration Company, or USAC, and we make contributions to USF and recover those contributions from our applicable conferencing customers. The FCC has not issued further guidance about how audio conferencing providers should distinguish telecommunications revenues associated with teleconferencing services from other revenues on the reports filed with USAC. In addition, telecommunications regulatory authorities may conclude our services are subject to the regulations and requirements applicable to common carrier providers of traditional telecommunications services. If an authority were to make such a determination, our costs could increase and the profitability of our business could be adversely affected.
There continues to be regulatory uncertainty as to the imposition of certain traditional common carrier regulations on voice-over-Internet-Protocol, or VoIP, services, which we use with respect to the delivery of many of our services. The adoption of, or changes in, such telecommunications laws and regulations could increase our operating costs and may affect the available delivery methods for and costs associated with our services.
Any changes to these requirements, including regulatory authorities seeking to further regulate aspects of our services under new laws and regulations, could adversely affect our business and require us to comply with laws and regulations that, in our view, are currently not applicable to us. Data Privacy
A number of legislative and regulatory proposals are under consideration and may be adopted or have already been enacted by federal and state lawmakers and regulatory bodies with respect to data protection and privacy. Many states and foreign jurisdictions have passed laws requiring notification to consumers when there is a security breach of personal data, including credit card and other personally identifiable information, and mandating certain data security standards. For example, Massachusetts and Nevada enacted data privacy requirements for entities that receive, store, maintain, process or otherwise have access to “personal information” concerning their residents in connection with the provision of goods or services.
We are also subject to data privacy and protection regulation by various international regulatory authorities.
For example, countries within the European Union have specific regulations related to sending personal information from one country to another. The EU member states adopted a safe harbor arrangement that provides that U.S. organizations can adopt procedures and can certify their compliance through notice to the U.S. Department of Commerce. Participation in the safe harbor is voluntary and indicates that the organization provides an adequate level of privacy protection and qualifies the company to receive data from EU member states. U.S. companies that avail themselves of the safe harbor arrangement are subject to oversight and possible enforcement actions by the FTC if they do not comply with the provisions of their certification. Our subsidiary, American Teleconferencing Services, Ltd., or ATS, has certified compliance with the EU safe harbor through the U.S. Department of Commerce. In addition, in January 2012, the European Commission proposed sweeping changes to its data protection rules that, if enacted, would impose more stringent operational requirements on our business and significant penalties for noncompliance. In Canada, the Personal Information and Electronic Documents Act, or PIEDA, similarly regulates the collection and use of personal data and applies broadly to U.S. companies that conduct commercial activities in Canada.
In addition, we provide services to healthcare industry customers that may be subject to the privacy and security rules under the Health Insurance Portability and Accountability Act of 1996, or HIPAA. The HIPAA privacy and security rules may apply to our services to the extent we are considered a "business associate" of one of our healthcare customers. These rules require a business associate to establish safeguards for individually

6
identifiable health information and may subject a business associate to notification requirements and civil or criminal penalties in the event of a violation.
International
As we continue to expand and localize our international activities, we may become obligated to comply with the laws of additional jurisdictions, which may be more stringent or impose more significant burdens on businesses than those in the United States. In addition, because our services are accessible worldwide over the web, foreign jurisdictions may claim that we are required to comply with more of their laws. Compliance in foreign jurisdictions may be more costly or may require us to change or restrict our business practices or services relative to those in the United States. Proprietary Rights and Technology
Our ability to compete is dependent in part upon our proprietary rights and technology. We currently have ten patents issued and 77 applications pending in the United States and internationally. We own and use a number of federally registered trademarks and pending applications for trademarks in the United States and in other countries, including Premiere Global Services & Design®, PGI & Design®, PGiConnect®, Powered by Premiere & Design®, Auditorium®, GlobalMeet®, iMeet®, iMeet (stylized)®, ReadyCast®, ReadyConference®, SaveOnConferences.com®, SoundByte®, SoundCast®, Soundpath®, VisionCast®, PGiMeetTM and iMeetLiveTM. We rely primarily on a combination of intellectual property laws and contractual provisions to protect our proprietary rights and technology. These laws and contractual provisions provide only limited protection of our proprietary rights and technology, which include confidential information and trade secrets that we attempt to protect through confidentiality and nondisclosure provisions in our agreements. We typically attempt to protect our confidential information and trade secrets through these contractual provisions for the terms of the applicable agreement and, to the extent permitted by applicable law, for some negotiated period of time following termination of the agreement.
We believe that our secure, proprietary technology platforms are a key element of our success, and we take substantial precautions to protect ourselves and our customers from events that could interrupt delivery of our services. These precautions include physical security systems, uninterruptible power supplies, on-site power generators, upgraded back-up hardware, fire protection systems and other contingency plans. In addition, some of our networks are designed so that the data on each network server is duplicated on a separate network server. Available Information
Our corporate website is www.pgi.com. Except as explicitly noted, the information on our websites are not incorporated by reference in this annual report or in any information furnished or submitted to the SEC. We make available, free of charge through our website, our annual report on Form 10-K, quarterly reports on Form 10-Q, current reports on Form 8-K and amendments to those reports filed or furnished pursuant to Section 13(a) or 15(d) of the Securities Exchange Act of 1934, as amended, as soon as practicable after such material is electronically filed with, or furnished to, the SEC. Follow the “Investor Relations” tab to “SEC Filings” to access these filings. Employees
As of December 31, 2011, we employed approximately 1,700 people worldwide. Our employees are not represented by a labor union or covered by any collective bargaining agreements. We consider our employee relations to be good. Item 1A. Risk Factors
Risks Relating to Our Business and Industry The markets for our services are intensely competitive, and we may not be able to compete successfully against existing and future competitors.
The markets for our services are intensely competitive, and we expect competition to increase in the future. For information regarding the markets in which we compete, see “Business – Competition.” Competition in web and video conferencing services continues to increase as new providers enter the marketplace and offer a broader

7
range of conferencing solutions through new technologies. Many of our current and potential competitors, such as major telecommunications, business suite, software and application service providers, have longer operating histories, greater name recognition, more robust service offerings, more comprehensive support organizations, larger customer bases and substantially greater financial, personnel, marketing, engineering, technical and other resources than we do. As a result, our competitors may be able to respond more quickly than we can to new or emerging technologies and changes in customer demands. They may also be able to devote greater resources than we can to the development, promotion and sale of their products and services. We believe that our current competitors are likely to expand their service offerings, and new competitors are likely to continue to emerge. Some of our existing and potential competitors may enter into or expand their positions in the markets in which we compete through acquisitions, strategic alliances and the development of integrated service offerings, such as Microsoft’s acquisition of Skype and Citrix’s acquisition of Netviewer. Also, we compete with companies with whom we also have distribution and reseller arrangements, as well as with internally developed solutions for companies who choose to insource these needs. As we expand our market opportunity, we also face pressures from free conferencing providers, and smaller and niche conferencing providers, as well as consumer-oriented technology providers that are attempting to enter the enterprise collaboration market and CRM and social business platform providers, which are integrating real-time collaboration services into their offerings. Increased competition could result in pricing pressure on our services and a decrease in our market share in the various markets in which we compete, either of which could hinder our ability to grow our revenues. Technological change and the development of alternatives to our services may cause us to lose market share and may hinder our ability to maintain or grow our revenues.
The market for our services is characterized by rapid technological change, frequent new service introductions and enhancements and evolving industry standards. We expect new services and enhancements to existing services to be developed and introduced that will compete with our services. Technological advances may result in the development and commercial availability of alternatives to, or new methods of, delivering our services and pricing options that could be more attractive to our customers. These developments could cause our existing services to become obsolete, result in significant pricing pressure on our services or allow our existing and potential customers to meet their own business communications needs without using our services.
We must continually introduce new services and enhancements to existing services in response to technological changes, evolving industry standards and customer demands.
Our ability to successfully develop and market such new services and enhancements depends, in part, on
our ability to:
• foresee changes in industry standards;
• anticipate and apply advances in technologies;
• enhance our software, applications, equipment, systems and networks; and
• attract and retain qualified and creative technical personnel.
We have experienced and may continue to experience difficulty integrating new technologies into our existing services and systems. The number of people using devices other than telephones and personal computers to access conferencing services has increased dramatically in the past few years. As new devices and platforms are continually being released, it is difficult to predict problems we may encounter in developing versions of our solutions for these alternative devices. For example, in 2011, we released mobile applications for our iMeet and GlobalMeet solutions and enhanced softphone features for iMeet. If we cannot successfully integrate new technologies, or fail to capture a significant share of this increasingly important portion of the market, we may not generate sufficient revenues and operational synergies may not develop. Our future success depends on market acceptance of our new services.
Market acceptance of our new services often requires that individuals and enterprises accept new ways of communicating and exchanging information. Our growth depends on the successful development and introduction of new services and enhancements to our existing services. For example, we believe that the success of our iMeet and GlobalMeet solutions will depend on customer perceptions as to the technological and operational benefits or

8
improved user experience associated with these services as compared to alternative services. A failure to achieve broad market acceptance of, or a decline in the demand for, our new services could hinder our ability to maintain and increase our revenues. We believe that broad market acceptance of our new services will depend on several factors, including:
• ease of use;
• price;
• reliability;
• accessibility to our services;
• quality of service;
• system security;
• product functionality; and
• the effectiveness of our strategic marketing and sales efforts and distribution channels.
If we do not meet these challenges, our new services may not achieve broad market acceptance or market acceptance may not occur quickly enough to justify our investment in these services. In addition, our new services and enhancements may not be as successful as our competitors’ solutions. In addition, if we are unable to develop new services and enhancements or if we experience delays or problems with their introduction we may not be able to gain market share and increase our revenues.
We believe that continuing to strengthen our current services and brand and effectively launching new services and enhancements to our existing services will require continued focus on active marketing efforts. For example, in 2011, we incurred a significant increase in selling and marketing expense, relating to the launch campaigns for the commercial releases of our new iMeet and GlobalMeet solutions. In order for our new virtual meeting solutions, iMeet and GlobalMeet, to succeed in the future, we believe we will need to market and sell to both our existing customer base as well as focusing on new market opportunities and shifting to entirely new user communities. For this shift outside the traditionally-defined collaboration market to occur, our new solutions must meet a need better than services currently offered in the market. The demand for and cost of advertising have been increasing and may continue to increase. Accordingly, we may need to spend increasing amounts of money on, and devote greater resources to, advertising, marketing and other efforts to create and maintain brand loyalty among users. Promotional efforts may not yield increased revenues, and even if they do, any increased revenues may not offset the expenses incurred in building our brand. If we fail to promote and maintain our brand, or if we incur substantial expense in an unsuccessful attempt to promote and maintain our brand, our business could be harmed. Our success depends on our ability to attract, retain and further penetrate our customers.
We must retain and continue to expand our ability to reach and penetrate our customers, by transitioning our customers from our audio conferencing services and from resold third-party web conferencing services to our new virtual meeting solutions. In addition, large global enterprise customers may request special pricing, such as bundled pricing or volume discounts, which could negatively impact our revenues and generally have longer sales cycles, which make it difficult to predict when these sales will occur. Delays in sales could cause significant variability in our revenues and operating results for any particular period. We are subject to pricing pressures for our services which could cause us to lose market share and decrease revenues and profitability.
We compete for customers based on several factors, including price. If we cannot compete based on price, we may lose market share. If we reduce our rates without increasing our volume or our market share, our revenues could decrease. For example, we have experienced declines in the average selling price per minute of our audio conferencing services and expect this trend to continue into the foreseeable future. We also offer free trials of our new virtual meeting solutions and introduced GlobalMeet at what we believe to be competitive pricing. In some

9
cases, our competitors may offer their services for free, at reduced rates or on a trial basis in order to win customers. In addition, we compete with telecommunications service providers that generally have lower voice and data costs as a result of their ownership of an underlying telecommunications network and may offer services similar to ours at reduced rates. We believe price competition could become a more significant competitive factor in the future due to competitive factors and the rapidly changing marketplace for our services. We have reduced our pricing to retain existing customers in certain circumstances and expect we may be required to further reduce our pricing in the future. If we are unable to offset any pricing declines through increased volumes or decreases in our costs, our results of operations could be adversely affected. Our customer contracts are typically not exclusive and do not contain revenue commitments.
We do not typically have long-term or exclusive contracts with our customers or revenue commitments. Historically, our customer contracts for audio conferencing generally enable customers to terminate the contract or reduce volume without penalty and are often subject to renegotiation at any time. In addition, many of our larger enterprise customers allocate their business among multiple service providers with whom we must compete. Any of these developments could result in significant customer and associated revenue loss. Continuing challenging global economic conditions could adversely affect our business and financial results.
The continued global economic downturn exacerbated by the recent European economic and financial turmoil related to sovereign debt issues in certain countries have significantly adversely affected global economic conditions. Our business trends and revenue growth continue to be affected by the challenging economic climate, higher global unemployment and lower global business activity. These difficult economic conditions and the uncertainty about future economic conditions may adversely affect our customers’ level of spending, ability to obtain financing for purchases, ability to make timely payments to us for our services and adoption of new technologies, which could require us to increase our allowance for doubtful accounts, negatively impact our days sales outstanding, lead to increased price competition and adversely affect our results of operations. Price increases from our telecommunications service providers or our inability to efficiently utilize or re-negotiate minimum purchase requirements in these agreements could decrease our profitability.
Our ability to maintain and expand our business depends, in part, on our ability to continue to obtain voice and data services on favorable terms from telecommunications service providers. The total amount of our minimum purchase requirements in 2011 was approximately $51.0 million, and we incurred telecommunications costs in excess of these minimums. Agreements with some of our telecommunications service providers contain minimum purchase requirements totaling approximately $28.5 million for 2012. In addition, certain circuits and colocation services that we purchase are subject to term requirements, including penalties for early termination. These service providers are not obligated to renew these agreements or offer the same or lower rates in the future, and these agreements may be subject to termination or modification for reasons outside of our control. Other telecommunications suppliers may provide similar services at lower prices, and we may not be able to re-negotiate our current supply agreements to achieve comparable lower rates. Such additional costs may require us to increase the prices for our services to our customers. We can give no assurance that we will be able to utilize the minimum amount of services that we are required to purchase under our telecommunications supply agreements. If we are unable to obtain telecommunications services on favorable terms or if we are required to purchase more services than we are able to utilize in the operation of our business, the costs of providing our services would likely increase, which could decrease our profitability and have a material adverse effect on our business, financial condition and results of operations. Interruption in third-party services that we use could result in service delays and disruptions, a loss of significant customers and revenues or an increase in costs.
Our ability to maintain and expand our business depends, in part, on our ability to continue to obtain telecommunications, financial systems hosting services and web-based services on favorable terms from traditional and VoIP telecommunications service providers, local exchange carriers, financial systems hosting providers and Internet service providers. We do not own a telecommunications network and host a significant portion of our financial systems through third-parties. As a result, we depend on a variety of third-party providers for voice and data services, financial systems and Internet access. We have experienced delays and disruptions in our services in the past due to service interruptions from telecommunications service providers. For example, in August 2011, we experienced a service interruption as a result of one of our primary underlying carrier’s network outage, which

10
necessitated that we transition our traffic to more expensive backup networks causing our margins to decline in that quarter. In addition, we have experienced service interruptions as a result of our expanded international coverage access points and increased traffic volumes. Any interruptions in the delivery of our services due to third-party outages could undermine confidence in our services and cause us to lose customers or harm our reputation, which would make attracting new customers more difficult. In addition, because many of our services are critical to our customers, any significant interruption in service could result in losses to customers. Although our customer contracts generally limit our liability for service failures and exclude liability for consequential damages, a court might not enforce these provisions, which could expose us to financial loss. Further, we often provide our customers with service level commitments, which if not met, may obligate us to provide service credits or other compensation to our customers or allow customers to terminate or renegotiate their contracts, which could negatively affect our results. Downtime in our network infrastructure could result in the loss of significant customers and revenues.
We currently maintain facilities with network infrastructure and telecommunications equipment in locations throughout the world. The delivery of our services is dependent, in part, upon our ability to protect the equipment and data at our facilities against damage that may be caused by fire, power loss, technical failures, unauthorized intrusion, natural disasters, sabotage and other similar events. Despite taking a variety of precautions, we have experienced downtime in our networks from time to time, and we may experience downtime in the future. For example, in 2011, we again expanded our presence in colocation facilities. While this expansion provides us with greater geographic diversity, it also can increase the complexity of managing and configuring our network. Although we believe that we take substantial precautions to protect ourselves and our customers from events that could interrupt delivery of our services, service interruptions could still occur and result in the loss of significant customers, which could cause us to lose revenues. While we maintain business interruption insurance, it may not cover all outages and we may not be able to maintain insurance for this risk in the future, or it may not continue to be available at reasonable prices. Even if we maintain insurance for this risk, it may not be sufficient to compensate us for losses that we experience due to our inability to provide services to our customers. If we fail to increase our network capacity to meet customer demands, the quality of our service offerings may suffer.
We continuously attempt to predict growth in our network usage and add capacity accordingly. If we do not accurately predict and efficiently manage growth in our network usage, the quality of our service offerings may suffer and we may lose customers. For example, during 2011, we expanded our VoIP conferencing port capacity to meet the needs of growing demand while operating at an acceptable utilization. Technological obsolescence of our equipment or systems could result in substantial capital expenditures.
Technological advances may result in the development of new or changing industry standards, which could cause our equipment or systems to become obsolete. These events could require us to invest significant capital in upgrading or replacing our equipment. For example, we have significantly increased our number of VoIP ports on a global basis. Additionally, new standards could be introduced in the future that may require us to upgrade our media servers in certain regions around the world to enable us to more effectively meet our requirements and grow our business. Security and privacy breaches of the security measures we employ to protect our customers’ confidential information may have an adverse impact on the use of our web-based services.
Despite the security measures we have taken to protect our customers’ confidential information, such as customers’ business, credit card or other personally identifiable information, transmitted over the Internet and public networks, our infrastructure is potentially vulnerable to physical or electronic break-ins, viruses or similar problems. If someone is able to circumvent our security measures, they could misappropriate our proprietary information or cause interruption in our operations. Because the techniques used to obtain unauthorized access, disable or degrade service or sabotage systems change frequently and often are not recognized until launched, we may be unable to anticipate these techniques or to implement adequate preventative measures.
Actual or perceived security breaches could damage our reputation, expose us to a risk of loss or liability and result in a loss of confidence in the security of our services that could potentially have an adverse effect on our business. We may be required to make additional significant investments in efforts to protect against and remedy

11
these types of security breaches. In addition, some of our customers are subject to varying degrees of government regulation, particularly in the insurance, healthcare and financial services industries. Increased regulation in data privacy protections and information security obligations could impose additional regulatory pressures on our customers’ businesses, and indirectly, on our operations. Some of our customers may seek to contractually impose certain data privacy and information security obligations on us and some of our customer contracts may not contractually limit our liability for the loss of confidential information. If we are unable to adequately address these concerns, our business and results of operations could suffer. Compliance with new privacy and security laws, requirements and regulations, where required or undertaken by us, may result in cost increases due to potential systems changes, the development of additional administrative processes and increased enforcement actions and fines and penalties. While we strive to comply with all applicable data protection laws and regulations as well as our own posted privacy policies, any failure or perceived failure to comply or any misappropriation, loss or other unauthorized disclosure of sensitive or confidential information may result in proceedings or actions against us by government entities or others, or could cause us to lose customers, which could potentially have an adverse effect on our business, reputation and results of operations. Our cloud-based solutions present execution and competitive risks.
Our virtual meeting solutions offered in the cloud are accessible via the web without hardware installation or software downloads present new and difficult technology challenges. These offerings depend on integration of third-party hardware, software and cloud hosting vendors working together with our products. We also expect other companies to enter into the emerging cloud computing market and to introduce their own initiatives that may compete with, or not be compatible with, our cloud initiatives. Our cloud-based solutions may not attract or generate sufficient usage or revenue to recoup our investments in them. If we are not successful in this new business model, our results of operations and financial condition may suffer. In addition, we may be subject to claims if customers experience service disruptions, breaches or other quality issues related to our cloud-based solutions. Our financial performance could cause future write-downs of goodwill or other intangible assets in future periods, which could have a material adverse effect on our results of operations.
As of December 31, 2011, we had $295.7 million of goodwill not subject to amortization and $10.9 million of other intangible assets, net of amortization, of which $9.9 million is subject to continuing amortization reflected in our consolidated financial statements. Goodwill is not subject to amortization but is subject to an annual impairment review. We are required to exercise significant judgment in identifying and assessing whether impairment indicators exist or if events or changes in circumstances have occurred, including market conditions, operating results, competition and general economic conditions. Any change in our key assumptions could result in an impairment charge that could materially adversely affect our results of operations and financial condition. We may have exposure to greater than anticipated tax liabilities.
Some of our solutions may be subject to telecommunications excise tax and sales taxes in states where we have not collected and remitted such taxes from our customers. During the years ended December 31, 2011 and 2010, we paid $0.3 million and $5.6 million related to the settlement of certain of these state excise and sales tax contingencies.
We have reserves for certain state excise and sales tax contingencies based on the likelihood of obligation. These contingencies are included in “Accrued taxes, other than income taxes” in our consolidated balance sheets. At December 31, 2011 and December 31, 2010, we had reserved $1.7 million and $1.3 million, respectively, for certain state excise and sales tax contingencies and interest. We believe we have appropriately accrued for these contingencies. In the event that actual results differ from these reserves, we may need to make adjustments, which could materially impact our financial condition and results of operations.
In addition, states may disagree with our method of assessing and remitting such taxes or additional states
may subject us to inquiries regarding such taxes. For example, in May 2009, one of our former subsidiaries, PTEKVentures.com, Inc., a Nevada corporation formally dissolved in 2002, received a notice of proposed income tax assessment from the Georgia Department of Revenue totalling approximately $22.7 million as of June 15, 2009. In February 2011, the Georgia Department of Revenue agreed to withdraw this assessment with prejudice in exchange for a reduction in our Georgia net operating loss carryforward that will have no impact on our statements of operations.

12
We generate a significant amount of revenue from outside the United States and any repatriation of funds from our foreign subsidiaries may result in higher effective tax rates. In addition, proposed changes to U.S. tax laws could significantly affect how we are taxed on foreign earnings. If passed, such legislation could have a material adverse effect on our tax expense. We may not realize the anticipated savings of our restructuring and cost reduction initiatives.
To allow us to operate more efficiently and control costs, we have incurred restructuring charges related to the consolidation and streamlining of various functions of our workforce. As part of our restructuring efforts, we incurred severance costs, lease termination costs and exit costs. We may not realize the expected benefits of these initiatives and may incur additional restructuring costs in the future. In addition, we could experience delays, business disruptions, unanticipated employee turnover and increased litigation-related costs in connection with our restructuring efforts. The complex nature of these restructuring initiatives could cause difficulties or delays in the implementation of any such initiative or the impact of the restructuring initiatives may not be immediately apparent. There can be no assurance that our estimates of the savings achievable by these initiatives will be realized, which could have an adverse impact on our financial condition or results of operations. The performance of our business depends on attracting and retaining qualified key personnel.
Our performance depends on attracting and retaining key personnel, including highly skilled executive, sales, marketing personnel, customer support, product development and other technical personnel. Failure to attract and retain key employees could have a material adverse effect on the performance of our business, our ability to successfully sell existing services, develop new services and our results of operations.
Risks Related to Ownership of Our Common Stock and Level of Indebtedness Our level of indebtedness may harm our financial condition and results of operations.
As of December 31, 2011, we had utilized approximately $198.4 million of indebtedness, including approximately $192.9 million in borrowings and $5.5 million in letters of credit outstanding under our $375.0 million credit facility, which consists of a $250.0 million revolver, a $50.0 million Term A loan and a $75.0 million accordion feature. Although at December 31, 2011, we do not have any outstanding interest rates swaps, from time to time, we may enter into interest rate swaps to reduce our exposure to market risk from changes in interest rates on interest payments associated with our credit facility.
Our level of indebtedness will have several important effects on our future operations, including, without limitation:
• A portion of our cash flows from operations will be dedicated to the payment of any interest or amortization required with respect to outstanding indebtedness;
• Increases in our outstanding indebtedness and leverage will increase our vulnerability to adverse changes in general economic and industry conditions, as well as to competitive pressure; and
• Depending on the levels of our outstanding debt, our ability to obtain additional financing for working capital, acquisitions, capital expenditures, general corporate and other purposes may be limited.
At the scheduled maturity of our credit facility in December 2016 or in the event of an acceleration of the
indebtedness under the facility following an event of default, the entire outstanding principal amount of the indebtedness under the facility, together with all other amounts payable thereunder from time to time, will become due and payable. It is possible that we may not have sufficient funds to pay such obligations in full at maturity or upon such acceleration. If we default and are not able to pay any such obligations due, our lenders have liens on substantially all of our assets and could foreclose on our assets in order to satisfy our obligations.

13
Our dependence on our subsidiaries for cash flow may negatively affect our business and our ability to meet our debt service obligations.
We conduct substantially all of our business through our subsidiaries. Our ability to pay amounts due under our indebtedness in the future will be dependent upon the ability of our subsidiaries to make cash distributions of earnings, loans or other payments to us or to ATS, the borrower under our credit facility, based on our subsidiaries’ earnings and cash flows. Our subsidiaries may not have sufficient funds or may not be able to distribute sufficient funds to us, due to tax implications or other restrictions, to enable us to service or repay such indebtedness or meet our other obligations. If our quarterly results do not meet the expectations of public market analysts and investors, our stock price may decrease.
Our quarterly revenues are difficult to forecast because the market for our services is rapidly evolving and our services are primarily usage-based and event-driven, as we have operated historically without subscription-based or license fees or minimum commitments. In addition, our introduction of new solutions and changes in our product and customer mix has affected our gross margins. Our expense levels are based, in part, on our expectations as to future revenues. If our revenue levels are below expectations, we may be unable or unwilling to reduce expenses proportionately, and our operating results would likely be adversely affected. In addition, we believe that the effects of the continued challenging global economic conditions and our PGiSend sale may make quarterly prior period comparisons difficult. As a result, we believe that period-to-period comparisons of our results of operations are not necessarily meaningful and should not be relied upon as indications of future performance. It is possible that our operating results may fail to meet the expectations of public market analysts and investors in a future quarter, which will likely cause the market price of our common stock to decline.
Our operating results have varied significantly in the past and may vary significantly in the future. Specific factors that may cause our future operating results to vary include:
• fluctuations in operating expenses;
• increased competition and pricing pressure; • the reliability and performance of our services;
• the timing of new service announcements;
• market acceptance of new and enhanced versions of our services;
• changes in regulations and legislation that may affect the competitive environment for our services;
and
• general economic and seasonal factors. Our stock has been volatile and we expect that it will continue to be volatile.
Our stock price has been volatile, and we expect it will continue to be volatile. For example, during the year ended December 31, 2011, the trading price of our common stock ranged from a high of $9.91 to a low of $5.60. The volatility of our stock price can be due to factors such as:
• fluctuating operating results;
• announcements by us or our competitors of significant technological innovations, customer contracts, acquisitions, strategic alliances, joint ventures or capital commitments; and
• changes in security analysts’ estimates of our performance or our failure to meet analysts’
expectations.

14
Many of these factors are beyond our control. Additionally, the stock market has experienced extreme price and volume fluctuations that have affected the stock price of many technology companies in ways that have often been unrelated to the operating performance of these companies. Our articles and bylaws and Georgia corporate law may inhibit a takeover which may be in the best interests of our shareholders.
There are several provisions in our articles and bylaws and under Georgia corporate law that may inhibit a takeover, even when a takeover may be in the interests of our shareholders. For example, our board of directors is empowered to issue preferred stock without shareholder action. The existence of this “blank-check” preferred stock could render more difficult or discourage an attempt to obtain control of us by means of a tender offer, merger, proxy contest or otherwise. We are also subject to provisions of the Georgia corporate law that relate to business combinations with interested shareholders, which can serve to inhibit a takeover. In addition to considering the effects of any action on us and our shareholders, our articles permit our board to consider the interests of various constituencies, including employees, customers, suppliers, creditors, communities in which we maintain offices or operations and other factors which they deem pertinent, in carrying out and discharging their duties and responsibilities and in determining what the board believes to be in our best interests.
Risks Related to Acquisitions and Divestures We face risks in connection with completed or potential acquisitions.
Our growth has been enhanced through acquisitions of businesses, products and technologies that we believe will complement our business. We regularly evaluate acquisition opportunities, frequently engage in acquisition discussions, conduct due diligence activities in connection with possible acquisitions and, if appropriate, engage in acquisition negotiations. We may not be able to successfully identify suitable acquisition candidates, complete acquisitions, integrate acquired operations into our existing operations or expand into new markets. In addition, we compete for acquisitions and expansion opportunities with companies that have substantially greater resources, and competition with these companies for acquisition targets could result in increased prices for possible targets. Acquisitions also involve numerous additional risks to us and our investors, including:
• risk in retaining key acquired management, employees and acquired customers; • difficulties in the assimilation of the operations, services and personnel of the acquired assets or
company, including the need to implement controls, procedures and policies appropriate for a publicly traded company like ours;
• outages of operations infrastructure of acquired businesses prior to transition to our infrastructure; • diversion of our management’s attention from other business concerns; • assumption of known and unknown or contingent liabilities; • adverse financial impact from the amortization of expenses related to intangible assets; • incurrence of indebtedness; • potential adverse financial impact from failure of acquisitions to meet internal revenue and earnings
expectations; • entry into markets in which we have little or no direct prior experience; and • potentially dilutive issuances of equity securities.
If we fail to adequately manage these acquisition risks, the acquisitions may not result in revenue growth,
operational synergies or service or technology enhancements, which could adversely affect our financial results. In connection with the integrations of our acquisitions, we have experienced some delays in obtaining anticipated cost

15
savings and increases in past due receivables due to delays in integrations and technology enhancements required of our infrastructure. Our ability to successfully manage the post-sale aspects of the sale of our PGiSend business could adversely affect our results of operations.
We must be able to successfully manage the post-sale aspects of our PGiSend divestiture, while at the same time delivering on our business objectives. Our results of operations could be adversely affected if we are unable to offset the loss of PGiSend revenue or earnings through growth in our virtual meeting solutions. In addition, EasyLink Services International Corporation, or EasyLink, the entity that purchased our PGiSend business, has made several indemnification claims, including the state corporate tax matter discussed in Part I Item 3.“Legal Proceedings” and Note 16, and may make additional claims. We will incur expenses to resolve such indemnification claims, which could harm our operating results. In addition, we are still completing the separation of certain integrated network and colocation facilities in our international operations in connection with our PGiSend sale. Such matters may divert management attention from our continuing operations.
Risks Related to Intellectual Property If we are unable to protect our proprietary technology and intellectual property rights, we may be unable to compete effectively or operate profitably.
To some degree, our commercial success depends on our ability to obtain, maintain and enforce intellectual property rights. We rely primarily on a combination of patents, trademarks, trade secrets, copyrights and contractual provisions to protect our proprietary technology. Our ability to continue to obtain, maintain and enforce intellectual property rights will depend upon, among other things, complex legal and factual questions, and the standards regarding the procurement and enforcement of intellectual property rights are evolving. For example, the America Invents Act of 2011 changes the way patents are sought, awarded and challenged. In addition, the laws of some foreign countries do not protect our proprietary rights to as great extent as the laws of the United States. We can offer no assurance that the protections that are in place at any given time will successfully preclude others from using similar technologies. We could incur substantial costs in enforcing our intellectual property against infringement. Even if our pending domestic and foreign patent applications should issue, the various patents may not result in a scope of protection against all competitors using similar alternative technologies. Moreover, the issuance of a patent is not conclusive as to its validity or enforceability and how much protection will be realized by any particular patent is uncertain. Claims alleging patent, copyright or trademark infringement against us, whether successful or not, could result in substantial costs.
Many patents, copyrights and trademarks have been issued in the general areas of information services, telecommunications, computer telephony and the Internet. From time to time, in the ordinary course of our business, we have received and expect to continue to receive notices, or be subject to third-party claims or proceedings, alleging that our current or future products or services infringe the patent, copyright or trademark rights or other intellectual property rights of third parties. The suppliers and vendors on which we rely may also be subject to litigation with respect to technology on which we depend and we are unable to predict whether our business would be affected by such litigation. In addition, our use of open source software in some of our products may make us vulnerable to claims that our products infringe third-party intellectual property rights. In addition, our resellers or customers may allege that we are obligated to indemnify them for similar claims made against them. We evaluate such claims when they arise to determine whether the claims are valid or infringed by our operations and whether it would be more effective to obtain a license or dispute that any infringement is occurring. We have at times in the past obtained licenses from parties claiming to hold patents that they contended were infringed by our services. For example, in June 2008, we settled a lawsuit filed by Ronald A. Katz Technology Licensing, L.P. against three conferencing service providers, including us, alleging patent infringement relating to our automated conferencing services and paid Katz for a non-exclusive, fully paid license and release pursuant to this settlement. Due to the inherent uncertainties of litigation, we are unable to predict the outcome of any infringement proceedings or claims, and an adverse outcome could have a material effect on our business, financial condition and results of operations. We ultimately may not prevail on any such claims and any claiming parties may have significantly greater resources than we have to pursue litigation of these types of claims. Furthermore, there is an increased risk that confidential information could be compromised during litigation or that public announcements of the results of

16
hearings, motions or interim proceedings would be perceived by analysts or inventors as negatively impacting our business. Any infringement claim, whether with or without merit, could:
• be time consuming and a diversion to management; • result in costly litigation; • cause delays in introducing new services or enhancements; and • result in costly royalty or licensing agreements.
If a successful claim is made against us and we fail to develop non-infringing technology, our business,
financial condition and results of operations could be materially adversely affected.
Risks Related to Government Regulation Regulatory and legislative changes may discourage our customers from using some of our services and could adversely impact our results of operations.
Regulatory and legislative changes have imposed, or could impose, additional restrictions that may impact our business, including the passage of federal, state, local and international laws, rules and regulations relating to traditional common carrier telecommunications services and to data privacy. The application of these laws and regulations to our services is often unclear and sometimes conflict. Our business is affected by regulatory decisions, trends and policies made by international, federal and state telecommunications regulatory agencies, including the FCC and state public service or utility commissions, as well as state taxing authorities. Historically, we have viewed our conferencing services as private carrier teleconferencing services and as such we have not submitted to all regulations applicable to traditional common carrier telecommunication services in the United States. However, it is possible that the FCC may require us to submit to such regulations under the Communications Act of 1934, as amended. The extent to which our services are viewed as the provision of traditional common carrier services will affect the federal regulations with which we must comply. It is possible that state regulatory authorities may also seek to require us to submit to similar regulations under various state laws and that state taxing authorities may similarly attempt to subject our conferencing solutions to their telecommunications excise tax statutes or universal service regulations and remittance requirements. We cannot predict how regulatory requirements may affect customer demand for our conferencing solutions or our existing or future competitors, as well as whether regulatory or taxing authorities will impose additional requirements, regulations, charges or taxes on the provision of certain of our services. Although we use reasonable efforts to monitor applicable regulatory requirements, if we fail to comply with any applicable government regulations, or if we were required to submit to the jurisdiction of state government authorities as providers of common carrier telecommunications services, we could become subject to additional reporting and compliance obligations and/or could be subject to litigation, fines, forfeitures, taxes, regulatory surcharge remittance requirements or other penalties arising from any noncompliance. Subjecting our services to these regulations would increase our operating costs and could have a material adverse affect on our business, financial condition and results of operations.
Many states and foreign jurisdictions have passed laws requiring notification to consumers and to organizations that provide personal information to third parties when there is a security breach of personal data, including credit card and other personally identifiable information. Regulatory authorities around the world are considering a number of legislative and regulatory proposals concerning data protection. For example, in January 2012, the European Commission proposed sweeping changes to its data protection rules that, if enacted, would impose more stringent operational requirements on our business and significant penalties for noncompliance. Failure to comply with any applicable data privacy laws could subject us to litigation, damages, fines, criminal penalties, adverse publicity and other losses that could harm our business. Further, any failure by us to protect our users’ privacy and data could result in a loss of user confidence in our services and ultimately in a loss of users, which could adversely affect our business. In addition, to the extent we may be considered a “business associate” under the HIPAA privacy and security rules, violations of these rules could subject us to criminal and civil penalties, as well as possible contractual penalties and other losses that could harm our business. Although we believe we comply with laws and regulations applicable to us, we could nevertheless be subject to litigation, fines, losses or other penalties under such laws and regulations.

17
Risks Related to International Operations and Expansion There are risks inherent in international operations that could hinder our international growth strategy.
Our ability to achieve future success will depend in part on the expansion of our international operations. For example, we recently formed subsidiaries in Brazil, China and India. Conducting our business internationally presents numerous inherent difficulties and risks that could prevent us from selling our services in other countries or hinder our expansion once we have established international operations, including, among other things, the following:
• burdensome regulatory requirements and unexpected changes in these requirements; • export restrictions and controls relating to technology; • data privacy laws that may apply to the transmission of our customers’ data to the United States; • tariffs and other trade barriers; • difficulties in staffing and managing international operations including utilizing foreign
telecommunication providers; • localization of our services, including translation into foreign languages and associated expenses; • accounting (including managing internal control over financial reporting in our non-U.S. subsidiaries),
tax and legal complexities arising from international operations; • longer accounts receivable payment cycles and collection difficulties; • political and economic instability, including terrorist activity and war; • fluctuations in currency exchange rates; • potential difficulties in transferring funds generated overseas to the United States in a tax efficient
manner; • seasonal reductions in business activity during the summer months in Europe and other parts of the
world; and • potentially adverse tax consequences.
We have experienced, and will likely continue to experience, losses from fluctuations in currency exchange rates.
A risk inherent in our international operations is the exposure to fluctuations in currency exchange rates. The recent sovereign debt crisis in Europe has caused extreme volatility in exchange rates. We currently conduct business in 25 countries and in 2011 with approximately 36% of our consolidated net revenues and 30% of our operating expenses were generated in countries outside the United States. As a result, we may experience material losses in revenues and earnings from fluctuations in foreign currencies. Weakening of foreign currencies relative to the U.S. Dollar will adversely affect the value of our foreign currency-denominated sales and earnings and could lead us to increase international pricing, which could potentially reduce demand for our products. We anticipate that such fluctuations will continue to impact our financial results. We cannot predict when this volatility will cease or the extent of its impact on our future financial results. We typically denominate foreign transactions in foreign currencies and have not engaged in hedging transactions, although we may engage in hedging transactions from time to time in the future relating to foreign currency exchange rates. Item 1B. Unresolved Staff Comments
None.

18
Item 2. Properties
Our current corporate headquarters occupy approximately 55,000 square feet of office space in Atlanta, Georgia under a lease entered into by one of our subsidiaries, which is guaranteed by us and expires in August 2018. We occupy additional space of approximately 88,000 square feet in Colorado Springs, Colorado under a lease expiring in November 2020 and approximately 88,000 square feet in Olathe, Kansas under a lease expiring in November 2018.
We have also entered into facility leases for sales offices and server equipment within and outside the United States. We believe that our current facilities and office space are sufficient to meet our present needs and do not anticipate any difficulty securing additional space, as needed, on terms acceptable to us. Item 3. Legal Proceedings State Corporate Tax Matter
On August 6, 2010, one of our former subsidiaries, Xpedite Systems, LLC, or Xpedite, which was included in the sale of our PGiSend messaging business to EasyLink completed on October 21, 2010, received a final determination from the New Jersey Division of Taxation upholding a corporate business tax audit assessment for the tax years ended December 31, 1998 through December 31, 2000 and December 31, 2002. The assessment totaled approximately $6.2 million as of August 15, 2010, including approximately $2.4 million in taxes and $3.8 million in accrued interest and penalties. The assessment relates to the sourcing of Xpedite’s receipts for purposes of determining the amount of its income that is properly attributable to, and therefore taxable by, New Jersey. We are vigorously contesting the determination and filed a timely appeal with the Tax Court of New Jersey on November 2, 2010. We believe we are adequately reserved for this matter. However, if the New Jersey Division of Taxation’s final determination is sustained, the amount assessed could result in a material adjustment to our consolidated financial statements which would impact our financial condition and results of operations. We agreed to indemnify EasyLink for this matter in connection with our PGiSend sale. Other Litigation and Claims
We are involved in other litigation matters and are subject to claims arising in the ordinary course of business that we do not believe will have a material adverse effect upon our business, financial condition or results of operations, although we can offer no assurance as to the ultimate outcome of any such matters. Item 4. Mine Safety Disclosures
Not applicable.

19
Part II Item 5. Market for Registrant's Common Equity, Related Stockholder Matters and Issuer Purchases of Equity Securities
Our common stock, $.01 par value per share, is listed on the New York Stock Exchange under the symbol “PGI”. The following table sets forth the high and low sales prices of our common stock as reported on the NYSE for the periods indicated.
2011 High Low Fourth Quarter $ 9.73 $ 5.60 Third Quarter $ 9.91 $ 6.27 Second Quarter $ 8.83 $ 7.20 First Quarter $ 7.73 $ 5.73 2010 High Low Fourth Quarter $ 7.71 $ 5.93 Third Quarter $ 7.14 $ 4.87 Second Quarter $10.34 $ 6.19 First Quarter $ 8.86 $ 7.31
The closing price of our common stock as reported on the NYSE on March 5, 2012 was $8.73. As of
March 5, 2012, there were 610 record holders of our common stock.
We have never paid cash dividends on our common stock, and the current policy of our board of directors is to retain any available earnings for use in the operation and expansion of our business. The payment of cash dividends on our common stock is unlikely in the foreseeable future. Any future determination to pay cash dividends will be at the discretion of our board and will depend upon our earnings, capital requirements, financial condition and any other factors deemed relevant by our board. Our credit facility contains customary limitations on our ability to declare cash dividends on our common stock. Issuer Purchases of Equity Securities
The following table sets forth repurchases in the fourth quarter of 2011 of our common stock:
Period
Total Number
of Shares Purchased(1)
Average
Price Paid Per Share
Total Number of Shares Purchased as Part of Publicly Announced Plans or Programs(2)
Maximum Number of Shares that May Yet Be
Purchased Under the Plans or Programs
October 1-31 , 2011 8,419 $9.06 — 4,122,536 November 1-30, 2011 115,666 $7.28 115,666 4,006,870 December 1-31, 2011 251,902 $8.01 230,518 3,776,352 Total 375,987 $7.81 346,184 3,776,352
(1) The total number of shares purchased includes shares purchased pursuant to our stock repurchase programs
described below and shares surrendered by employees to the company to satisfy tax withholding obligations in connection with the vesting of restricted stock totaling 8,419 shares and 21,384 shares for the months of October and December 2011, respectively, which do not count against shares authorized under our stock repurchase programs.
(2) In June 2006, our board of directors authorized, and we announced, a stock repurchase program under which we could purchase up to 7.0 million shares of our common stock. Through September 30, 2011, we had repurchased all 7.0 million shares pursuant to this stock repurchase program.

20
In July 2011, our board approved a new stock repurchase program authorizing the repurchase of up to 5.0 million shares of our common stock. Through December 31, 2011, we had repurchased 1,223,648 shares pursuant to our new stock repurchase program.
Stock Performance Graph
The following graph shows the cumulative total shareholder return on our common stock, the Standard & Poor's 500 Composite Stock Price Index and the S&P 500 Software & Services Index for the period beginning December 31, 2006 and ending December 31, 2011. The graph assumes an investment in our common stock, the S&P 500 and the S&P 500 Software & Services Index of $100 on December 31, 2006, and reinvestment of dividends. Total return calculations were prepared by the Research Data Group, Inc. The stock price performance in this graph is not necessarily indicative of the future performance of our common stock.
12/31/06 12/31/07 12/31/08 12/31/09 12/31/10 12/31/11 Premiere Global Services, Inc. 100.00 157.31 91.21 87.39 72.03 89.72 S&P 500 100.00 105.49 66.46 84.05 96.71 98.75 S&P 500 Software & Services Index 100.00 118.59 72.71 114.61 122.84 128.21
This performance graph shall not be deemed “filed” for purposes of Section 18 of the Securities Exchange Act of 1934, as amended or incorporated by reference into any of our filings under the Securities Act of 1933, as amended, or the Exchange Act, except as shall be expressly set forth by specific reference in such filing.
$0
$20
$40
$60
$80
$100
$120
$140
$160
$180
12/06 12/07 12/08 12/09 12/10 12/11
COMPARISON OF 5 YEAR CUMULATIVE TOTAL RETURNAmong Premiere Global Services, Inc., the S&P 500 Index, and S&P 500 Software & Services
Premiere Global Services, Inc. S&P 500 S&P 500 Software & Services

21
Item 6. Selected Financial Data
The following table contains selected consolidated financial data as of and for the years ended December 31, 2007 through December 31, 2011. Our results of operations include net revenues and associated costs for all acquisitions and exclude the effect of current and prior period discontinued operations from the effective date of each acquisition, as discussed in Item 7. “Management’s Discussion and Analysis of Financial Condition and Results of Operations.” The selected consolidated financial data should be read in conjunction with Item 7. “Management's Discussion and Analysis of Financial Condition and Results of Operations” and our consolidated financial statements and the notes hereto in Item 8. “Financial Statements and Supplementary Data” included in this annual report.
2011 2010 2009 2008 2007
Statements of Operations Data: Net revenues $473,834 $441,753 $453,962 $ 443,272 $ 358,626 Operating income 35,956 20,981 45,370 78,079 57,752 Income from continuing operations attributable to common and common equivalent shares for:
—basic earnings per share 16,888 8,966 25,758 41,383 27,784 —diluted earnings per share 16,888 8,966 25,758 41,383 27,784 Income from continuing operations per common and common equivalent shares for:
—basic (1) $ 0.34 $ 0.15 $ 0.44 $ 0.70 $ 0.44 —diluted (1) $ 0.34 $ 0.15 $ 0.43 $ 0.68 $ 0.43
Income (loss) from discontinued operations 4,456 (4,135) (12,149) (5,280) 2,658 Net income attributable to common and common equivalent shares for:
—basic earnings per share 21,434 4,831 13,609 36,103 30,442 —diluted earnings per share 21,434 4,831 13,609 36,103 30,442 Net income per common and common equivalent shares for:
—basic (1) $ 0.43 $ 0.08 $ 0.23 $ 0.61 $ 0.49 —diluted (1) $ 0.43 $ 0.08 $ 0.23 $ 0.60 $ 0.48 Shares used in computing income from continuing operations and earnings per common and common equivalent shares for:
—basic 49,619 58,009 58,823 59,356 62,654 —diluted 49,971 58,355 59,310 60,477 63,940
Balance Sheets Data (at year end): Cash and equivalents $ 32,033 $ 15,101 $ 41,402 $ 27,535 $ 18,259 Working capital 38,607 22,512 46,444 42,896 21,669 Total assets 542,821 541,657 681,539 666,137 626,608 Total debt 199,808 183,744 266,523 271,489 269,481 Total shareholders' equity 243,737 242,015 281,042 253,834 239,294
(1) Basic earnings per share is computed using the weighted-average number of shares of common stock outstanding during the period. Diluted earnings per share is computed using the weighted-average number of shares of common stock and dilutive common stock equivalents outstanding during the period from unvested restricted shares, stock options and warrants (using the treasury stock method).

22
Item 7. Management’s Discussion and Analysis of Financial Condition and Results of Operations Overview
PGi has been a global leader in virtual meetings for 20 years. Our cloud-based solutions deliver multi-point, real-time virtual collaboration using video, voice and file sharing technologies to help businesses worldwide be more productive, mobile and green. We have a global presence in 25 countries in our three segments in North America, Europe and Asia Pacific.
During 2011, we continued our strategy to transition PGi to a focused virtual meeting company with the launch of our iMeet and GlobalMeet solutions. On October 21, 2010, we completed the sale of our PGiSend business. During 2010, we classified our Maritime Notification and Reminder solutions operations as a disposal group held-for-sale, which was fully disposed of during 2011. Our continuing operations reflect only our meeting solutions. As a result and except as provided herein, the following discussion and analysis reflects our results from continuing operations.
Key highlights of our financial and strategic accomplishments for 2011 include: • Generated approximately 23.4% and 20.6% volume growth for the three and twelve months ended
December 31, 2011, respectively, compared to the same periods in 2010;
• Reported our highest revenue growth in three years, with net revenues increasing more than 7% as compared to 2010;
• Amended our bank credit facility with increased capacity, an extended term and lower pricing;
• Repurchased approximately 3.0 million shares of our common stock in the open market for
approximately $22.0 million at an average price of $7.41; and
• Established a new open market share repurchase program for up to 5.0 million shares of our common stock.
Our primary corporate objectives in 2012 are focused on continuing to:
• Increase awareness and adoption of our virtual meeting solutions, iMeet and GlobalMeet, in the
market;
• Develop and release enhancements to iMeet and GlobalMeet to increase their functionality and improve their competitive positioning; and
• Transition our customer base toward a SaaS pricing model.
We believe these strategic initiatives will increase the addressable market opportunity for PGi and our solutions.
In 2011, approximately 36% of our consolidated net revenues were generated in countries outside the United States. Because we generate a significant portion of our consolidated net revenues from our international operations, movements in foreign currency exchange rates affect our reported results. We estimate that changes in foreign currency exchange rates during 2011 favorably impacted our consolidated net revenues by approximately $8.5 million as compared to 2010.
We have historically generated net revenue growth in our meeting solutions. The average rate per minute that we charge our audio conferencing customers continues to decline while total minutes sold continues to increase. We believe that this trend is consistent with the industry, and we expect it to continue in the foreseeable future. Our business trends and revenue growth continue to be affected by the challenging economic climate, higher global unemployment and lower global business activity. Despite these economic headwinds, our consolidated net revenues increased to $473.8 million in 2011 as compared to $441.8 million in 2010, primarily due to our volume growth.

23
We have historically used our cash flows from operating activities for debt repayments, capital
expenditures, stock repurchases, acquisitions and strategic investments. As of December 31, 2011, we had utilized approximately $198.4 million of indebtedness under our credit facility. In December 2011, we amended our credit facility to increase the overall borrowing capacity to $300 million, extend the maturity of the credit facility to December 2016 and reduce the applicable interest rates across the pricing grid. See “Capital Resources” for a description of our credit facility.
In addition, we intend to continue to prudently invest in our virtual meeting solutions, specifically in technology innovation and platform development, as well as new market strategies to better meet the needs of our large, global enterprise customers and to better attract, engage and acquire small- and medium-size business customers.
The preparation of financial statements in conformity with generally accepted accounting principles in the United States, or GAAP, requires us to make estimates and assumptions that affect the reported amounts of assets and liabilities and disclosure of contingent assets and liabilities at the date of the financial statements and reported amounts of net revenues and expenses during the reporting period. Actual results could differ from the estimates. See the section in this annual report entitled “—Critical Accounting Policies.” The following discussion and analysis provides information which we believe is relevant to an assessment and understanding of our consolidated results of operations and financial condition. This discussion should be read in conjunction with our consolidated financial statements contained herein and notes thereto. All significant intercompany accounts and transactions have been eliminated in consolidation.

24
Results of Operations
The following table presents the percentage relationship of our consolidated statements of operations line items to our consolidated net revenues for the periods indicated:
Years Ended December 31, 2011 2010 2009
Net revenues 100.0% 100.0% 100.0% Operating expenses: Cost of revenues (exclusive of depreciation and amortization shown separately below)
41.3
40.5
39.4
Selling and marketing 28.3 27.6 26.1 General and administrative (exclusive of expenses shown separately below)
12.1
13.3
12.4
Research and development 2.4 3.2 2.5 Excise tax expense 0.1 0.1 — Depreciation 6.5 5.9 4.9 Amortization 1.3 1.7 2.3 Restructuring costs 0.2 2.8 2.1 Asset impairments 0.1 0.1 0.2 Net legal settlements and related expenses 0.1 0.1 0.1 Acquisition-related costs 0.0 0.1 0.1 Total operating expenses 92.4 95.3 90.0 Operating income 7.6 4.7 10.0 Other (expense) income Interest expense (2.1) (2.4) (2.5) Unrealized gain on change in fair value of interest rate swaps — 0.3 0.7 Interest income 0.0 0.0 0.1 Other, net (0.1) (0.2) 0.1 Total other (expense) (2.2) (2.4) (1.6) Income from continuing operations before income taxes 5.4 2.4 8.4 Income tax expense 1.8 0.3 2.7 Net income from continuing operations 3.6 2.0 5.7 Income (loss) from discontinued operations, net of taxes 1.0 (0.9) (2.7) Net income 4.5% 1.1% 3.0%

25
Net Revenues
The following tables present certain financial information about our segments for the periods presented (in thousands, except percentages):
The following table details the changes in net revenues from the year ended December 31, 2009 to the year
ended December 31, 2011 (in thousands):
Consolidated
North America
Europe
Asia Pacific 2009 $ 453,962 $ 313,860 $ 86,735 $ 53,367 Change in volume 54,696 41,770 11,671 1,255 Change in selling prices (71,313) (53,386) (11,746) (6,181) Impact of acquisitions 346 346 — — Impact of fluctuations in foreign currency exchange rates
4,062
1,316
(1,318)
4,064
2010 441,753 303,906 85,342 52,505 Change in volume 90,864 43,048 35,527 12,289 Change in selling prices (67,297) (31,298) (26,229) (9,770) Impact of fluctuations in foreign currency exchange rates 8,514
575
3,346
4,593
2011 $ 473,834 $ 316,231 $ 97,986 $ 59,617
All of our segments have experienced volume increases and declines in average selling prices during 2011 and 2010. This trend is primarily due to a higher mix of large volume enterprise customers and price reductions to existing customers. During 2011 and 2010, fluctuations in foreign currency exchange rates increased revenues in all of our segments, with the exception of Europe, which experienced decreased revenues in 2010 due to the impact of foreign exchange rates. Cost of Revenues Years Ended
December 31, Change from
2010 to 2011 Change from
2009 to 2010 2011 2010 2009 $ % $ % North America $ 141,669 $ 134,827 $ 132,981 6,842 5.1 1,846 1.4 Europe 30,232 23,828 26,164 6,404 26.9 (2,336) (8.9)Asia Pacific 23,921 20,044 19,772 3,877 19.3 272 1.4 Consolidated $ 195,822 $ 178,699 $ 178,917 17,123 9.6 (218) (0.1)
Years Ended
December 31, Change from
2010 to 2011 Change from
2009 to 2010 2011 2010 2009 $ % $ % Net revenues: North America $ 316,231 $ 303,906 $ 313,860 12,325 4.1 (9,954) (3.2) Europe 97,986 85,342 86,735 12,644 14.8 (1,393) (1.6) Asia Pacific 59,617 52,505 53,367 7,112 13.5 (862) (1.6) Total consolidated $ 473,834 $ 441,753 $ 453,962 32,081 7.3 (12,209) (2.7) Operating income: North America $ 1,849 $ (4,369) $ 15,885 6,218 142.3 (20,254) (127.5) Europe 26,739 20,318 19,306 6,421 31.6 1,012 5.2 Asia Pacific 7,368 5,032 10,179 2,336 46.4 (5,147) (50.6) Total operating income $ 35,956 $ 20,981 $ 45,370 14,975 71.4 (24,389) (53.8) Percent of net revenues: North America 66.7% 68.8% 69.1% Europe 20.7% 19.3% 19.1% Asia Pacific 12.6% 11.9% 11.8% Consolidated net revenues
100.0%
100.0%
100.0%

26
Years Ended December 31,
2011 2010 2009 % of Revenue
Cost of revenues: North America 44.8 44.4 42.4 Europe 30.9 27.9 30.2 Asia Pacific 40.1 38.2 37.0 Consolidated 41.3 40.5 39.4
Consolidated cost of revenues as a percentage of consolidated net revenues increased in 2011 and 2010,
primarily as a result of decreased average selling prices and revenue growth from lower margin large enterprise customers, partially offset by telecommunications cost savings in 2010. Fluctuations in foreign currency exchange rates resulted in an increase in consolidated cost of revenues of approximately $2.8 million in 2011 and an increase of approximately $1.2 million in 2010.
The increases in North America and Asia Pacific cost of revenues as a percentage of segment net revenues in 2011 and 2010, was attributable primarily to revenue growth from lower margin large enterprise customers. Fluctuations in foreign currency exchange rates resulted in an increase in North America cost of revenue of $0.2 million in 2011 and an increase in Asia Pacific cost of revenue of $1.7 million in 2011. Fluctuations in foreign currency exchange rates resulted in an increase in North America cost of revenue of $0.4 million in 2010 and an increase in Asia Pacific cost of revenue of $1.5 million in 2010.
The increase in Europe cost of revenue as a percentage of segment net revenue in 2011 was attributable primarily to increased revenues from lower margin third-party products. The decrease in Europe cost of revenue as a percentage of segment net revenue in 2010 was attributable primarily to telecommunications cost savings. Fluctuations in foreign currency exchange rates resulted in an increase in Europe cost of revenue of $0.9 million in 2011 and a decrease of $0.7 million in 2010. Selling and Marketing Expenses Years Ended
December 31, Change from
2010 to 2011 Change from
2009 to 2010 2011 2010 2009 $ % $ % North America $ 87,732 $ 78,860 $ 75,914 8,872 11.3 2,946 3.9 Europe 28,084 25,945 27,227 2,139 8.2 (1,282) (4.7) Asia Pacific 18,202 17,229 15,245 973 5.6 1,984 13.0 Consolidated $ 134,018 $ 122,034 $ 118,386 11,984 9.8 3,648 3.1
Years Ended December 31,
2011 2010 2009 % of Revenue
Selling and marketing expenses: North America 27.7 25.9 24.2 Europe 28.7 30.4 31.4 Asia Pacific 30.5 32.8 28.6 Consolidated 28.3 27.6 26.1
Selling and marketing expense in North America increased in 2011 primarily as a result of selling and
marketing initiatives to increase our brand recognition and product awareness related to our iMeet and GlobalMeet services. Selling and marketing expense in Europe and Asia Pacific increased in 2011 primarily as a result of foreign currency exchange rates. Fluctuations in foreign currency exchange rates during 2011 resulted in increased selling and marketing expenses in North America, Europe and Asia Pacific of $0.1 million, $1.2 million and $1.5 million, respectively.

27
Selling and marketing expenses in North America increased in 2010 primarily as a result of costs related to the launch of our iMeet and GlobalMeet services. Selling and marketing expenses in Europe decreased in 2010 as a result of cost savings realized through our expense structure optimization efforts. Selling and marketing expenses in Asia Pacific increased in 2010 primarily as a result of our increased selling and marketing investments made to expand our presence in this region. Fluctuations in foreign currency exchange rates during 2010 resulted in increased selling and marketing expenses in North America and Asia Pacific of $0.3 million and $1.6 million, respectively, and decreased selling and marketing expenses in Europe by $0.4 million. General and Administrative Expenses Years Ended
December 31, Change from
2010 to 2011 Change from
2009 to 2010 2011 2010 2009 $ % $ % North America $ 41,331 $ 42,385 $ 40,761 (1,054) (2.5) 1,624 4.0 Europe 8,006 9,041 9,454 (1,035) (11.4) (413) (4.4)Asia Pacific 7,839 7,150 6,071 689 9.6 1,079 17.8 Consolidated $ 57,176 $ 58,576 $ 56,286 (1,400) (2.4) 2,290 4.1
Years Ended December 31,
2011 2010 2009 % of Revenue
General and administrative expenses: North America 13.1 13.9 13.0 Europe 8.2 10.6 10.9 Asia Pacific 13.1 13.6 11.4 Consolidated 12.1 13.3 12.4
General and administrative expenses in North America decreased in 2011 primarily as a result of increased
efforts to reduce administrative costs. General and administrative expenses in Europe decreased in 2011 primarily as a result of decreased professional fees. General and administrative expenses in Asia Pacific increased in 2011 primarily as a result of fluctuations in foreign currency exchange rates. Fluctuations in foreign currency exchange rates during 2011 did not have a material impact in North America and resulted in increased general and administrative expenses in Europe and Asia Pacific of $0.3 million and $0.7 million, respectively. General and administrative expenses as a percentage of net revenues in all of our segments decreased in 2011, primarily due to the increase in revenues in each of our segments as general and administrative costs are not directly related to fluctuations in revenues.
General and administrative expenses in North America increased in 2010 primarily as a result of increased
professional fees and bad debt expense, offset in part by cost savings realized through our expense structure optimization efforts. General and administrative expenses in Europe decreased in 2010 as a result of cost savings realized through our expense structure optimization efforts, partially offset by consulting fees incurred to assist us with initiatives to decrease telecommunication costs. General and administrative expenses in Asia Pacific increased in 2010 primarily as a result of the strengthening of the Australian Dollar and the Japanese Yen against the U.S. Dollar and consulting fees incurred to assist us with initiatives to decrease telecommunication costs. Fluctuations in foreign currency exchange rates during 2010 resulted in increased general and administrative expenses in Asia Pacific of $0.7 million, decreased general and administrative expenses in Europe of $0.2 million and had minimal impact on North America general and administrative expenses. Research and Development Expenses
Consolidated research and development expenses from continuing operations decreased 18.5% to $11.5 million in 2011 from $14.1 million in 2010 and increased 25.0% in 2010 from $11.3 million in 2009. We incurred the majority of research and development expenses in North America. The decrease in consolidated research and development expenses in 2011 are primarily a result of reduced personnel related costs and differences in the nature of projects for that department. We are able to capitalize many of the costs incurred, associated with enhancements to our virtual meeting solutions, which results in a higher capitalization rate of such personnel costs for 2011. The increase in consolidated research and development expenses in 2010 is primarily associated with additional

28
resources invested in the maintenance and support of our various solutions and new product development relating primarily to our iMeet and our GlobalMeet services. Excise and Sales Tax Expense
During 2008, we recorded $2.9 million as excise and sales tax expense and $1.1 million as interest expense related to a certain state’s telecommunications excise tax statute. We finalized our agreement with that state during 2010 for tax years 2001 – 2006 with a payment of $4.7 million and recorded an additional $0.7 million as interest. In order to ensure that we are appropriately reserved for future settlements of such taxes, we also recorded an additional $0.4 million, $0.4 million and $0.0 million as excise and sales tax expense during 2011, 2010 and 2009, respectively.
Equity-Based Compensation Expense
Equity-based compensation expense for restricted stock awards is included in operating expenses. The
expense was recorded in the line items below (in thousands):
Years Ended December 31, 2011 2010 2009 Cost of revenues $ 169 $ 237 $ 364 Selling and marketing 837 1,630 2,057 Research and development 538 718 1,205 General and administrative 5,213 6,012 6,869 Equity-based compensation expense 6,757 8,597 10,495 Income tax benefits (2,365) (3,009) (3,568) Total equity-based compensation expense, net of tax $ 4,392 $ 5,588 $ 6,927 Depreciation Expense Years Ended
December 31, Change from
2010 to 2011 Change from
2009 to 2010 2011 2010 2009 $ % $ % North America $ 25,933 $ 22,040 $ 18,840 3,893 17.7 3,200 17.0Europe 2,949 2,375 1,908 574 24.2 467 24.5Asia Pacific 1,949 1,565 1,411 384 24.5 154 10.9 Consolidated $ 30,831 $ 25,980 $ 22,159 4,851 18.7 3,821 17.2
Years Ended December 31,
2011 2010 2009 % of Revenue
Depreciation expense: North America 8.2 7.3 6.0 Europe 3.0 2.8 2.2 Asia Pacific 3.3 3.0 2.6 Consolidated 6.5 5.9 4.9
Consolidated depreciation expense increased in each of 2010 and 2011 as a result of increases in our
productive asset base.

29
Amortization Expense Years Ended
December 31, Change from
2010 to 2011 Change from
2009 to 2010 2011 2010 2009 $ % $ % North America $ 4,465 $ 5,552 $ 8,648 (1,087) (19.6) (3,096) (35.8)Europe 1,640 1,560 1,633 80 5.1 (73) (4.5)Asia Pacific 260 274 236 (14) (5.1) 38 16.1 Consolidated $ 6,365 $ 7,386 $ 10,517 (1,021) (13.8) (3,131) (29.8)
Years Ended December 31,
2011 2010 2009 % of Revenue
Amortization expense: North America 1.4 1.8 2.8 Europe 1.7 1.8 1.9 Asia Pacific 0.4 0.5 0.4 Consolidated 1.3 1.7 2.3
Consolidated amortization expense decreased in each of 2011 and 2010 primarily as a result of the decrease
in North America amortization expense related to customer list and non-compete intangible assets from acquisitions made in 2004 and 2003 that have become fully amortized, partially offset by intangible amortization expense resulting from our 2009 and 2008 acquisitions. Restructuring Costs
Consolidated restructuring costs from continuing operations were $0.8 million, $12.3 million and $9.4 million in 2011, 2010 and 2009, respectively. The expenses associated with these activities are reflected in “Restructuring costs” in our consolidated statements of operations. The discussion below includes costs related to our continuing and discontinued operations. Realignment of Workforce – 2011
During 2011, we recorded restructuring expense of $1.1 million, including $0.3 million related to discontinued operations, which consisted of severance and lease termination costs in 2011, net of adjustments of ($0.7) million relating to existing reserves for prior years as detailed below. For the 2011 realignment, we recorded $1.6 million of severance costs, including $0.3 million recorded in discontinued operations, and $0.2 million of lease termination costs associated with efforts to consolidate and streamline various functions of our work force. As a result, we eliminated approximately 30 positions. On a segment basis, these restructuring costs totaled $1.1 million in North America, $0.4 million in Europe and $0.3 million in Asia Pacific. Our reserve for the 2011 restructuring costs was $0.7 million at December 31, 2011. We anticipate these severance-related costs will be paid over the next year and these lease terminations cost will be paid over the next 20 months. Realignment of Workforce – 2010
During 2010, we recorded $10.2 million of severance costs and $0.6 million of lease termination cost associated with efforts to consolidate and streamline various functions of our work force. We also recorded $1.8 million of asset impairments in connection with these restructuring efforts. In addition, we recorded $0.9 million of exit costs related to marketing efforts abandoned during the year and $0.5 million of exit costs related to the reorganization of our operating structure subsequent to our PGiSend sale as restructuring costs. As part of these consolidations, we eliminated approximately 165 positions. On a segment basis, these restructuring costs totaled $8.5 million in North America, which included the acceleration of vesting of restricted stock with a fair market value of $0.2 million in North America, $2.5 million in Europe and $1.2 million in Asia Pacific. During 2011, we adjusted our initial estimate of severance and exit costs by ($0.8) million in North America and ($0.1) million in Europe. Also during 2011, we adjusted our initially recorded lease termination costs by ($0.1) million in North America and $0.1 million in Europe. Our remaining reserve for the 2010 realignment was $0.6 million at December 31, 2011, which we anticipate will be paid over the next 15 months.
30
Realignment of Workforce – 2009
During the year ended December 31, 2009, we executed a restructuring plan to consolidate and streamline various functions of our work force. As part of these consolidations, we eliminated approximately 500 positions. During the year ended December 31, 2009, we recorded total severance and exit costs of $14.8 million, which included the acceleration of vesting of restricted stock with a fair market value of $0.2 million in North America. Additionally, during the year ended December 31, 2009, we recorded $4.4 million of lease termination costs associated with office locations in North America and Europe. On a segment basis, these restructuring costs totaled $12.0 million in North America, $6.6 million in Europe and $0.6 million in Asia Pacific. During 2011, we updated assumptions regarding lease termination costs, resulting in a $0.1 million adjustment in North America. In 2011 we also recorded $0.1 million of accretion due to the passage of time. Our reserve for the 2009 realignment was $2.4 million at December 31, 2011, comprised primarily of lease termination costs, which we anticipate will be paid over the next seven years. Net Legal Settlements and Related Expenses
Net legal settlements and related expenses were $0.4 million, $0.7 million and $0.3 million in 2011, 2010 and 2009, respectively. Net legal settlements and related expenses fluctuate year to year based on the status of various litigation matters and claims. Interest Expense
The majority of our interest expense from continuing operations is incurred in North America and was $10.0 million, $10.8 million and $11.3 million in 2011, 2010 and 2009, respectively. Interest expense decreased during 2011, primarily as a result of decreased average debt outstanding. Interest expense decreased during 2010, primarily as a result of the expiration of our final $100.0 million interest rate swap in August 2010, partially offset by increased interest rates on our refinanced credit facility, $0.2 million of debt issuance cost related to our prior credit facility written off in the second quarter of 2010 and $0.7 million of state excise and sales tax interest incurred during 2010. The weighted-average outstanding balance on our credit facility was $197.2 million, $247.9 million and $282.0 million during 2011, 2010 and 2009, respectively. The decrease in our weighted-average debt outstanding is attributable to our continued efforts to reduce our outstanding debt, including by using a portion of the proceeds from our PGiSend sale in 2010, partially offset by debt issuance costs that we incurred in connection with the refinancing of our credit facility in May 2010. Unrealized Gain on Change in Fair Value of Interest Rate Swaps
In August 2007, we entered into two $100.0 million two-year interest rate swaps at a fixed rate of 4.99%. In December 2007, we amended the life of one of the $100.0 million swaps to three years and reduced the fixed rate to 4.75%. Our $100.0 million interest rate swap, which had a fixed rate of 4.99%, expired in August 2009, and our remaining interest rate swap expired in August 2010. As of December 31, 2011, we do not have any outstanding interest rate swaps.
We did not initially designate these interest rate swaps as hedges and, as such, we did not account for them under hedge accounting. During the fourth quarter of 2008, we prospectively designated these interest rate swaps as cash flow hedges of our interest rate risk associated with our credit facility using the long-haul method of effectiveness testing. Concurrent with the refinancing of our credit facility in May 2010, we dedesignated the cash flow hedge associated with our remaining interest rate swap. Any changes in fair value prior to designation as a hedge, subsequent to dedesignation as a hedge, and any ineffectiveness while designated were recognized as “Unrealized gain on change in fair value of interest rate swaps” as a component of “Other (expense) income” in our consolidated statements of operations and amounted to a gain of $1.2 million and $3.4 million in 2010 and 2009, respectively. Other, Net
Other, net was a loss of $0.6 million, a loss of $1.1 million and a gain of $0.3 million in 2011, 2010, and 2009, respectively. Other, net was comprised primarily of foreign currency exchange gains and losses related to cash settlements of intercompany transactions and the revaluation of foreign currency denominated payables and receivables into their respective functional currency.

31
Income Taxes
Income tax expense for the years ended December 31, 2011, 2010 and 2009 from continuing operations was $8.6 million, $1.5 million, and $12.4 million, respectively. The increase in income tax expense between 2011 and 2010 was primarily related to the increase in income from continuing operations in 2011, an increase in state income tax expense in 2011 and the impact of establishing a reserve for contingencies associated with certain foreign operations in 2011. The decline in income tax expense between 2010 and 2009 was primarily related to the decrease in income from continuing operations in 2010 as well as our PGiSend sale.
As of December 31, 2011 and 2010, we had $3.4 million and $3.7 million, respectively, of unrecognized tax benefits. Upon resolution, unrecognized tax benefits of $2.5 million and $2.3 million as of December 31, 2011 and 2010, respectively, would affect our annual effective tax rate. Acquisitions
We seek to acquire complementary companies that increase our market share and provide us with additional customers, technologies, applications and sales personnel. All revenues and related costs from these transactions have been included in our consolidated financial statements as of the effective date of each acquisition.
In February 2009, we acquired certain technology assets of a provider of web collaboration services in exchange for warrants to purchase 105,000 shares of our common stock with an exercise price of $9.21 per share. These warrants were fully vested 12 months after the grant date, which expired on February 23, 2012. We allocated the $0.3 million fair value of the warrants to in-process research and development in other intangible assets. Beginning in the fourth quarter of 2010, the in-process research and development was being amortized over a 36-month useful life. We incurred transaction fees and closing costs of $0.2 million, which we expensed as incurred.
In February 2009, we acquired certain assets and assumed certain liabilities of LINK Conference Service, LLC, a U.S.-based provider of audio and web conferencing services. We paid $7.1 million in cash at closing and $0.3 million in transaction fees and closing costs, which we expensed as incurred. We funded the purchase through our credit facility and cash and equivalents on hand. We allocated $0.7 million to accounts receivable, $0.1 million to prepaid assets, $0.3 million to acquired fixed assets, $0.3 million to other acquisition liabilities, $2.4 million to identifiable customer lists and $0.1 million to non-compete agreements, with the customer lists amortized over ten years and the non-compete agreements amortized over five years. We allocated the residual $3.8 million of the purchase price to goodwill, which is subject to a periodic impairment assessment. Discontinued Operations PGiSend
On October 21, 2010, we completed the sale of our PGiSend messaging business through the sale of all of the issued and outstanding equity interests in our wholly-owned subsidiaries, Xpedite and Premiere Global Services (UK) Limited, and the sale of certain assets of Premiere Conferencing (Canada) Limited to EasyLink for an aggregate purchase price of $105.0 million. Maritime Notification and Reminder Solutions
During the year ended December 31, 2010, we classified our Maritime Notification and Reminder solutions operations as a disposal group held-for-sale. This disposal group consisted of all customers using these non-conferencing, ship-to-shore communication services targeted specifically towards shipping vessels that were resold through our Japanese subsidiary. Assets of the disposal group held for sale consisted of accounts receivable of $4.3 million, net of allowances of $0.3 million. Liabilities of the disposal group held for sale consisted of $3.1 million of accounts payable. As of December 31, 2011, this disposal was completed, and no assets or liabilities of the disposal group remain.

32
PGiMarket
On November 5, 2009, we completed the sale of our PGiMarket business. Results of operations of this business are presented as discontinued operations for all periods. In connection with this divestiture, during 2009, we recorded a non-cash charge of $7.0 million in discontinued operations to reduce the carrying value of the assets associated with this business to their estimated fair value of $1.4 million, of which $1.0 million was cash received at closing and $0.4 million was an estimate of cash to be received based on the achievement of certain revenue targets in 2010 under an earn-out provision. During 2010, we adjusted our estimate of cash to be received under the earn-out provision to $0.7 million and recorded the $0.3 million adjustment as part of net income from discontinued operations.
We allocated interest expense related to interest recognized on uncertain tax positions specific to our PGiSend discontinued operations in 2011. We allocated interest expense related to our $50.0 million Term A loan, which was required to be repaid as a result of our PGiSend sale, to discontinued operations in 2010 and 2009. The following amounts associated with our discontinued businesses have been segregated from continuing operations and are reflected as discontinued operations for 2011, 2010 and 2009 (in thousands):
Years Ended
December 31, 2011 2010 2009 Net revenue from discontinued operations $ 8,735 $ 111,830 $ 150,195 Operating income (loss) (1,768) 12,352 (6,148)Interest expense (686) (1,256) (2,143)Loss on disposal (298) (12,317) (6,972)Income tax benefit (expense) 7,298 (2,914) 3,114 Income (loss) from discontinued operations, net of taxes $ 4,546 $ (4,135) $ (12,149)
The results of discontinued operations include an income tax benefit of $7.3 million. This benefit includes approximately $6 million relating to changes in estimates of the tax provision that resulted from the finalization of the actual tax basis purchase price allocation received in the third quarter from EasyLink in connection with our PGiSend sale. Liquidity and Capital Resources Liquidity
At December 31, 2011, we had $32.0 million of cash and equivalents. We generated positive operating cash flows from each of our geographic segments for the year ended December 31, 2011. Each geographic business segment had sufficient cash flows from operations to service existing debt obligations, to fund capital expenditure requirements (which historically have been 6% to 8% of annual consolidated net revenues) and to fund research and development expenses for new services and enhancements to existing services (which historically have been 2% to 3% of annual consolidated net revenues). Assuming no material change to these costs, which we do not anticipate, we believe that we will generate adequate operating cash flows for capital expenditures and contractual commitments and to satisfy our indebtedness and fund our liquidity needs for at least the next 12 months. At December 31, 2011, we had $101.6 million of available credit on our credit facility, without regard to the uncommitted $75.0 million accordion feature. We have historically borrowed on our credit facility in order to fund stock repurchases and acquisitions.
We regularly review our capital structure and evaluate potential alternatives in light of current conditions in the capital markets. Depending upon conditions in these markets, cash flows from our segments and other factors, we may engage in other capital transactions. These capital transactions include, but are not limited to, debt or equity issuances or credit facilities with banking institutions. Cash Provided by Operating Activities
Consolidated operating cash flows from continuing operations were $58.7 million, $47.9 million and $76.1 million for the years ended December 31, 2011, 2010 and 2009, respectively. The increase in net cash provided by

33
operating activities in 2011 was primarily due to higher net income. The decrease in net cash provided by operating activities in 2010 was primarily due to lower net income. Cash (Used in) Provided by Investing Activities
Consolidated investing activities from continuing operations used cash of $29.9 million, provided cash of $17.8 million and used cash of $34.2 million for the years ended December 31, 2011, 2010 and 2009, respectively. The principal uses of cash in investing activities in 2011 included $30.1 million of capital expenditures and $1.0 million invested in a privately held conferencing company, partially offset by $1.3 million of working capital settlements related to our PGiSend sale. Cash provided by investing activities for 2010 was primarily related to our PGiSend sale, partially offset by $32.9 million of capital expenditures. The principal uses of cash in investing activities in 2009 included $26.9 million of capital expenditures and $8.4 million of cash for acquisitions, primarily related to our LINK acquisition, offset by proceeds of $1.0 million for our PGiMarket sale. Cash Used in Financing Activities
Consolidated financing activities from continuing operations used cash of $9.5 million, $102.7 million and $27.9 million for the years ended December 31, 2011, 2010 and 2009, respectively. The primary uses of cash for financing activities in 2011 included $23.9 million in treasury stock purchases and $1.5 million of debt issuance cost, partially offset by $15.2 million of net proceeds from our credit facility. The primary uses of cash for financing activities in 2010 included $61.6 million in treasury stock purchases, including an aggregate of $59.4 million for stock and transaction fees related to our tender offer and $41.8 million of net payments on our credit facility. The primary uses of cash for financing activities in 2009 included $15.6 million of net payments on our credit facility and $14.5 million in treasury stock purchases. Capital Resources
Our credit facility consists of a $250.0 million revolver, a $50.0 million Term A loan and an uncommitted
$75.0 million accordion feature. Our subsidiary, ATS, is the borrower under our credit facility, with PGi and certain of our material domestic subsidiaries guaranteeing the obligations of ATS under the credit facility, which is secured by substantially all of our assets and the assets of our material domestic subsidiaries. In addition, we have pledged as collateral all of the issued and outstanding stock of our material domestic subsidiaries and 65% of our material foreign subsidiaries. Proceeds drawn under our credit facility can be used for working capital, capital expenditures, acquisitions and other general corporate purposes. The annual interest rate applicable to borrowings under our credit facility, at our option, is (1) the base rate (the greater of either the federal funds rate plus one-half of one percent, the prime rate or one-month LIBOR plus one and one-half percent) plus an applicable percentage that varies based on our consolidated leverage ratio at quarter end, or (2) LIBOR for one, two, three, nine or twelve months adjusted for a percentage that represents the Federal Reserve Board’s reserve percentage plus an applicable percentage that varies based on our consolidated leverage ratio at quarter end. The applicable percentage for base rate loans and LIBOR loans were 1.50% and 2.50%, respectively, at December 31, 2011 under our credit facility. Our interest rate on LIBOR loans, which comprised materially all of our outstanding borrowings as of December 31, 2011, was 2.79%. In addition, we pay a commitment fee on the unused portion of our credit facility that is based on our consolidated leverage ratio at quarter end. As of December 31, 2011, the rate applied to the unused portion of our credit facility was 0.4%. Our credit facility contains customary terms and restrictive covenants, including financial covenants. At December 31, 2011, we were in compliance with the covenants under our credit facility.
At December 31, 2011, we have utilized $198.4 million of our $375.0 million credit facility, with $192.9
million in borrowings and $5.5 million in letters of credit outstanding. From time to time, we may enter into interest rate swaps to reduce our exposure to market risk from changes in interest rates on interest payments associated with our credit facility. As of December 31, 2011, we have no outstanding interest rate swaps.
At the scheduled maturity of our credit facility in December 2016, or in the event of an acceleration of the indebtedness under the credit facility following an event of default, the entire outstanding principal amount of the indebtedness under the facility, together with all other amounts payable thereunder, will become due and payable. We may not have sufficient funds to pay such obligations in full at maturity or upon such acceleration. If we default and are not able to pay any such obligations due, our lenders have liens on substantially all of our assets and could foreclose on our assets in order to satisfy our obligations.

34
As of December 31, 2011, we had $32.0 million in cash and equivalents compared to $15.1 million as of December 31, 2010. Cash balances residing outside of the United States as of December 31, 2011 were $30.6 million compared to $14.0 million as of December 31, 2010. As we generate positive cash flows from each of our geographic operating segments, we currently do not foresee a need to repatriate the cash and cash equivalents held by our foreign subsidiaries to fund domestic operations or repay domestic obligations. However, if these funds are needed for our operations in the United States, we could be required to pay additional U.S. taxes to repatriate these funds. We utilize a variety of tax planning and financing strategies with the objective of having our worldwide cash and cash equivalents available in the locations where they are needed, and, when advantageous, may access foreign cash or cash equivalents in a tax efficient manner. We receive cash for repayment of royalties and management fees charged to international locations from the United States. We record foreign currency exchange gains and losses resulting from these transactions in “Other, net” in our consolidated statements of operations. We generally consider intercompany loans with foreign subsidiaries to be permanently invested for the foreseeable future. Therefore, we record foreign currency exchange fluctuations resulting from these transactions in the cumulative translation adjustment account on our consolidated balance sheets. Based on our potential cash position and potential conditions in the capital markets, we could require repayment of these intercompany loans despite the long-term intention to hold them as permanent investments.
Off-balance Sheet Arrangements
As of December 31, 2010, we did not have any off-balance-sheet arrangements, as defined in Item 303(a)(4)(ii) of SEC Regulation S-K. Commitments and Contingencies
The following table summarizes our contractual obligations at December 31, 2011 (in thousands):
Amounts committed
2012
2013
2014
2015
2016
There- after
Contractual obligation: Current borrowings on credit facility $ 192,885 $ — $ — $ — $ — $ 192,885 $ — Operating leases 83,949 15,647 13,377 11,355 9,472 8,882 25,216 Telecommunications service agreements 28,517 28,517 —
—
— — —
Restructuring costs 4,102 2,305 542 452 287 192 324 Capital leases and interest 7,757 4,581 2,901 258 17 — — Credit facility commitment fees and interest 25,888 5,758 5,391
5,152
4,913 4,674 —
Asset retirement obligation 1,010 15 859 76 — — 60 Acquisitions 132 132 — — — — — $ 344,240 $ 56,955 $ 23,070 $ 17,293 $ 14,689 $ 206,633 $ 25,600
The table above excludes $3.4 million of uncertain tax positions because we are unable to determine when,
or if, payment of these amounts will be made. Excise and Sales Tax
Some of our solutions may be subject to telecommunications excise tax and sales taxes in states where we
have not collected and remitted such taxes from our customers. During the years ended December 31, 2011 and 2010, we paid $0.3 million and $5.6 million, respectively, of tax and interest related to the settlement of these state excise and sales tax contingencies.
We have reserves for certain state excise and sales tax contingencies based on the likelihood of obligation. These contingencies are included in “Accrued taxes, other than income taxes” in our consolidated balance sheets. At December 31, 2011 and December 31, 2010, we had reserved $1.7 million and $1.3 million, respectively, for certain state excise and sales tax contingencies and interest. We believe we have appropriately accrued for these contingencies. In the event that actual results differ from these reserves, we may need to make adjustments, which

35
could materially impact our financial condition and results of operations. In addition, states may disagree with our method of assessing and remitting such taxes or additional states may subject us to inquiries regarding such taxes. Critical Accounting Policies
“Management’s Discussion and Analysis of Financial Condition and Results of Operations” is based upon our consolidated financial statements and the notes thereto, which have been prepared in accordance with GAAP. The preparation of these financial statements requires management to make estimates and judgments that affect the reported amounts of assets and liabilities and the disclosure of contingent assets and liabilities at the date of the financial statements and the reported amounts of net revenues and expenses during the reported periods. On an ongoing basis, management evaluates its estimates and judgments, including those related to revenue recognition, allowance for uncollectible accounts, goodwill and other intangible assets, income taxes, restructuring costs, legal contingencies and derivative instruments.
Management bases its estimates and judgments on historical experience and on various other factors that are believed to be reasonable under the circumstances, the results of which form the basis for making judgments about the carrying values of assets and liabilities that are not readily apparent from other sources. Actual results may differ from those estimates.
We have identified the policies below as critical to our business and the understanding of our results of operations. For a detailed discussion on the application of these and other accounting policies, see Note 2 to our consolidated financial statements. Revenue Recognition
We recognize revenues when persuasive evidence of an arrangement exists, services have been rendered, the price to the buyer is fixed or determinable and collectability is reasonably assured. Revenues from continuing operations consist primarily of usage fees generally based on per minute, and prior to our discontinued reclassifications, per fax page or per transaction methods. To a lesser extent, we charge subscription-based and license fees and have fixed-period minimum revenue commitments. Unbilled revenue consists of earned but unbilled revenue that results from non-calendar month billing cycles and the one-month lag time in billing related to certain of our services. Deferred revenue consists of payments made by customers in advance of the time services are rendered. Should changes in conditions cause management to determine these criteria are not met for certain future transactions, revenue recognized for any reporting period could be adversely affected. Allowance for Uncollectible Accounts Receivable
Prior to the recognition of revenue, we make a decision that collectability is reasonably assured. In estimating uncollectible amounts, management considers factors such as historical and anticipated customer payment performance and industry-specific economic conditions. Significant management judgment and estimates must be made and used in connection with establishing the allowance for uncollectible accounts receivable in any accounting period. The accounts receivable balance was $72.5 million and $64.2 million, net of allowance for uncollectible accounts receivable of $0.6 million and $0.9 million, as of December 31, 2011 and 2010, respectively. If the financial condition of our customers were to deteriorate, resulting in impairment to their ability to make payments, additional allowances may be required. Goodwill and Other Intangible Assets
We evaluate intangible assets and long-lived assets for potential impairment indicators whenever events or changes in circumstances indicate that the carrying value may not be recoverable. Factors that management considers important which could trigger an impairment review include the following:
• significant decrease in the market value of an asset; • significant adverse change in physical condition or manner of use of an asset; • significant adverse change in legal factors or negative industry or economic trends;

36
• a current period operating or cash flow loss combined with a history of operating or cash flow losses or a projection or forecast that demonstrates continuing losses associated with the use of a long-lived asset;
• significant decline in our stock price for a sustained period; and • an expectation that, more likely than not, an asset will be sold or otherwise disposed of before the end
of its previously estimated useful life.
Goodwill is not subject to amortization but is subject to an annual impairment review. We completed these reviews as of December 31, 2011, 2010 and 2009. Based on our calculations this year, the fair value of each of our reporting units substantially exceeded their respective carrying values. We did not recognize an impairment of our goodwill during 2010 with our PGiSend sale, but we did dispose of goodwill associated with that business in connection with the sale. We recognized an impairment of our goodwill in 2009 associated with the sale of our PGiMarket business. See “—Discontinued Operations.”
Other intangible assets with finite lives continue to be amortized. We recognize an impairment loss when the fair value is less than the carrying value of such assets, and the carrying value of these assets is not recoverable. The impairment loss, if applicable, is calculated based on the discounted estimated future cash flows using our weighted average cost of capital compared to the carrying value of the long-lived asset. Net intangible assets and goodwill totaled $306.6 million and $313.6 million as of December 31, 2011 and 2010, respectively. Future events could cause us to conclude that the current estimates used should be changed and that goodwill and intangible assets associated with acquired businesses are impaired. Any resulting impairment loss could have a material adverse impact on our financial condition and results of operations. Income Taxes
Income taxes are determined under the asset and liability method as required by Accounting Standards Codification, or ASC, 740, “Income Taxes”. Under this method, deferred tax assets and liabilities are recognized based upon the estimated future tax consequences attributable to differences between the financial statement carrying amounts of existing assets and liabilities and their respective tax bases. Deferred tax assets and liabilities are measured using existing tax rates expected to apply to taxable income in the years in which those temporary items are expected to be recovered or settled. Valuation allowances are established when necessary to reduce deferred tax assets to the amounts more likely than not to be realized. To the extent we establish a valuation allowance or increase this allowance in a period, an expense is recorded within the income tax provision in our consolidated statements of operations.
We have established valuation allowances of $24.1 million at December 31, 2011 and $33.7 million at
December 31, 2010. Our valuation allowance at December 31, 2011 primarily relates to certain federal and state capital loss carryforwards and foreign and state net operating losses. Current evidence suggests we will not realize sufficient taxable income of the appropriate character on a jurisdictional basis within the carryforward period to allow us to realize the deferred tax benefits for which we have established a valuation allowance. Net of these valuation allowances, our deferred tax asset as of December 31, 2011 was $2.4 million and our net deferred tax liability as of December 31, 2010 was $3.0 million. We believe that we will generate sufficient taxable income in the future to realize the tax benefits related to all other deferred tax assets in our consolidated balance sheets.
We establish reserves against some or all of the tax benefits of any of our tax positions at the time we determine that the positions become uncertain. For purposes of evaluation of whether or a not a position is uncertain, we presume that the tax position will be examined by the relevant taxing authority and that the taxing authority has full knowledge of all relevant information. The total amount of unrecognized tax benefits at December 31, 2011 and 2010 was $3.4 million and $3.7 million, respectively. Upon resolution, unrecognized tax benefits of $2.5 million and $2.3 million as of December 31, 2011 and 2010, respectively, would affect our annual effective tax rate.
In the normal course of business, we are subject to inquiries and routine income tax audits from U.S. and non-U.S. tax authorities with respect to income taxes which may result in adjustments to the timing or amount of taxable income or deductions or the allocation of income among tax jurisdictions. Further, during the ordinary course of business, other facts and circumstances may impact our ability to utilize tax benefits and could also impact estimated income taxes to be paid in future periods. We believe we have appropriately accrued for tax exposures. If

37
we are required to pay an amount less than or exceeding our tax provisions for uncertain tax matters, the financial impact will be reflected in the period in which the matter is resolved or identified. In the event that actual results differ from these estimates, we may need to adjust tax accounts which could materially impact our financial condition and results of operations.
Restructuring Costs
Restructuring accruals are based on certain estimates and judgments related to severance and exit costs, contractual lease obligations and related costs. Our estimated severance costs could be impacted if actual severance payments are different from initial estimates. Contractual lease obligations could be materially affected by factors such as our ability to secure sublessees, the creditworthiness of sublessees and the success at negotiating early termination agreements with lessors. In the event that actual results differ from these estimates, we may need to establish additional restructuring accruals or reverse accrual amounts accordingly. Legal Contingencies
We are involved in certain litigation matters and are subject to claims as disclosed in Part I Item 3, “Legal Proceedings” and Note 16 to our consolidated financial statements in this annual report. We accrue an estimate for legal contingencies when we determine that it is probable that a liability has been incurred and the amount of the loss can be reasonably estimated. These estimates are developed in consultation with outside counsel handling these matters and based upon an analysis of potential results, assuming a combination of litigation and settlement strategies. Our estimates are subject to change, and we adjust the financial impact in the period in which such matters are resolved. Subsequent Events In March 2012 through the filing of this annual report, we repurchased an aggregate of 113,600 shares of our common stock in the open market pursuant to our board-approved stock repurchase program for approximately $1.0 million. New and Recently Adopted Accounting Pronouncements
In December 2011, the Financial Accounting Standards Board, or FASB, issued, Accounting Standards
Update, or ASU, No. 2011-11 “Balance Sheet (Topic 210): Disclosures about Offsetting Assets and Liabilities,” which modifies the disclosure requirements for offsetting financial instruments and derivative instruments. The update requires an entity to disclose information about offsetting and related arrangements and the effect of those arrangements on its financial position. This guidance is effective for public companies for reporting periods beginning on or after January 1, 2013. ASU No. 2011-11 is not expected to have a material impact on our consolidated financial position or results of operations.
In September 2011, the FASB issued ASU No. 2011-08 “Intangibles - Goodwill and Other (Topic 350):
Testing Goodwill for Impairment,” which modifies the process of testing goodwill for impairment. The update will allow an entity to first assess qualitative factors to determine whether it is necessary to perform the two-step quantitative goodwill impairment test. An entity would not be required to calculate the fair value of a reporting unit unless the entity determines it is more likely than not, based on a qualitative assessment, the fair value of goodwill is less than its carrying amount. The guidance also includes a number of events and circumstances to consider in conducting the qualitative assessment. This guidance is effective for public companies for fiscal years beginning on or after December 15, 2011. ASU No. 2011-08 is not expected to have a material impact on our consolidated financial position or results of operations.
In June 2011, the FASB issued ASU No. 2011-05 “Comprehensive Income (Topic 220): Presentation of Comprehensive Income,” which modifies the requirements for presenting net income and other comprehensive income and requires that all non-owner changes in shareholders’ equity be presented either in a single continuous statement of comprehensive income or in two separate but consecutive statements. The amendment requires presentation of each component of net income along with total net income, each component of other comprehensive income along with a total for other comprehensive income and a total amount for comprehensive income. In December 2011, the FASB issued Accounting Standards Update No. 2011-12 “Comprehensive Income (Topic 220): Deferral of the Effective Date for Amendments to the Presentation of Reclassifications of Items Out of Accumulated Other Comprehensive Income in Accounting Standards Update No. 2011-05,” These amendments are being made to allow the FASB time to redeliberate whether to present on the face of the financial statements the effects of

38
reclassifications out of accumulated other comprehensive income on the components of net income and other comprehensive income in all periods presented. This guidance is effective for public companies for fiscal years and interim periods beginning on or after December 15, 2011. We adopted the guidance as of December 31, 2011, and it did not have a material impact on our consolidated financial position or results of operations.
In May 2011, the FASB issued ASU No. 2011-04 “Fair Value Measurement (Topic 820): Amendments to Achieve Common Fair Value Measurement and Disclosure Requirements in U.S. GAAP and International Financial Reporting Standards,” to conform existing guidance regarding fair value measurement and disclosure between GAAP and International Financial Reporting Standards. The clarifying changes relate to the application of the highest and best use and valuation premise concepts, measuring the fair value of an instrument classified in a reporting entity’s shareholders’ equity and disclosure of quantitative information about unobservable inputs used for Level 3 fair value measurements. The amendments relate to measuring the fair value of financial instruments that are managed within a portfolio and application of premiums and discounts in a fair value measurement. The amendments also require additional disclosures concerning the valuation processes used, sensitivity of the fair value measurement to changes in unobservable inputs for those items categorized as Level 3, a reporting entity’s use of a nonfinancial asset in a way that differs from the asset’s highest and best use and the categorization by level in the fair value hierarchy for items required to be measured at fair value for disclosure purposes only. This guidance is effective for public companies for fiscal years and interim periods beginning on or after December 15, 2011. ASU No. 2011-04 is not expected to have a material impact on our consolidated financial position or results of operations.
Item 7A. Quantitative and Qualitative Disclosures About Market Risk
We are exposed to market risk from changes in interest rates and foreign currency exchange rates. We manage our exposure to these market risks through our regular operating and financing activities and the timing of intercompany payable settlements. From time to time, we may enter into interest rate swaps to reduce our exposure to market risk from changes in interest rates on interest payments associated with our credit facility. However, as of December 31, 2011, we had no outstanding swaps.
At December 31, 2011, we had borrowings of approximately $192.9 million outstanding under our credit facility that are subject to interest rate risk. Each 100 basis point increase or decrease in interest rates relative to these borrowings would impact our annual pre-tax earnings and cash flows by approximately $1.9 million based on our December 31, 2011 debt level.
We generated approximately 36% of our consolidated net revenues and 30% of our operating expenses in countries outside of the United States in 2011. Additionally, we have foreign currency denominated debt as part of our credit facility. At December 31, 2011, we had foreign debt outstanding of GBP£2.5 million. As a result, fluctuations in exchange rates impact the amount of our reported consolidated net revenues, operating income and debt. A hypothetical positive or negative change of 10% in foreign currency exchange rates would positively or negatively change our consolidated net revenues for 2011 by approximately $17.2 million, operating expenses for 2011 by approximately $13.3 million and outstanding debt by approximately $0.4 million. Our principal exposure has been related to local currency sales and operating costs in Australia, Canada, the Euro Zone, Japan, Norway and the United Kingdom. We have not used derivatives to manage foreign currency exchange risk, and we did not have any foreign currency exchange derivatives outstanding at December 31, 2011.

39
Item 8. Financial Statements and Supplementary Data Premiere Global Services, Inc. and Subsidiaries Index to Consolidated Financial Statements Page Report of Independent Registered Public Accounting Firm 40 Consolidated Balance Sheets, December 31, 2011 and 2010 41 Consolidated Statements of Operations, Years Ended December 31, 2011, 2010 and 2009 42 Consolidated Statements of Comprehensive Income, Years Ended December 31, 2011, 2010 and 2009 43 Consolidated Statements of Shareholders' Equity, Years Ended December 31, 2011, 2010 and 2009 44 Consolidated Statements of Cash Flows, Years Ended December 31, 2011, 2010 and 2009 45 Notes to Consolidated Financial Statements 46 Report of Independent Registered Public Accounting Firm on Internal Control over Financial Reporting 71

40
Report of Independent Registered Public Accounting Firm The Board of Directors and Shareholders of Premiere Global Services, Inc. We have audited the accompanying consolidated balance sheets of Premiere Global Services, Inc. and subsidiaries (the Company) as of December 31, 2011 and 2010, and the related consolidated statements of operations, comprehensive income, shareholders' equity, and cash flows for each of the three years in the period ended December 31, 2011. These financial statements are the responsibility of the Company's management. Our responsibility is to express an opinion on these financial statements based on our audits. We conducted our audits in accordance with the standards of the Public Company Accounting Oversight Board (United States). Those standards require that we plan and perform the audit to obtain reasonable assurance about whether the financial statements are free of material misstatement. An audit includes examining, on a test basis, evidence supporting the amounts and disclosures in the financial statements. An audit also includes assessing the accounting principles used and significant estimates made by management, as well as evaluating the overall financial statement presentation. We believe that our audits provide a reasonable basis for our opinion. In our opinion, the financial statements referred to above present fairly, in all material respects, the consolidated financial position of Premiere Global Services, Inc. and subsidiaries at December 31, 2011 and 2010, and the consolidated results of their operations and their cash flows for each of the three years in the period ended December 31, 2011, in conformity with U.S. generally accepted accounting principles. We also have audited, in accordance with the standards of the Public Company Accounting Oversight Board (United States), Premiere Global Services, Inc. and subsidiaries’ internal control over financial reporting as of December 31, 2011, based on criteria established in Internal Control-Integrated Framework issued by the Committee of Sponsoring Organizations of the Treadway Commission and our report dated March 12, 2012 expressed an unqualified opinion thereon.
/s/ Ernst & Young LLP
Atlanta, Georgia March 12, 2012

41
PREMIERE GLOBAL SERVICES, INC. AND SUBSIDIARIES CONSOLIDATED BALANCE SHEETS
December 31, (in thousands, except share data)
ASSETS 2011 2010
CURRENT ASSETS Cash and equivalents $ 32,033 $ 15,101 Accounts receivable (less allowances of $613 and $930, respectively) 72,518 64,243 Prepaid expenses and other current assets 13,906 19,941 Income taxes receivable 1,739 2,870 Deferred income taxes, net 1,090 5,337 Assets of a disposal group held for sale — 4,319 Total current assets 121,286 111,811 PROPERTY AND EQUIPMENT, NET 103,449 107,238 OTHER ASSETS Goodwill 295,690 296,681 Intangibles, net of amortization 10,906 16,967 Deferred income taxes, net 3,474 1,442
Other assets 8,016 7,518 Total assets $ 542,821 $ 541,657
LIABILITIES AND SHAREHOLDERS' EQUITY CURRENT LIABILITIES Accounts payable $ 42,589 $ 42,282 Income taxes payable 962 768 Accrued taxes, other than income taxes 3,611 4,671 Accrued expenses 28,999 27,585 Current maturities of long-term debt and capital lease obligations 3,845 3,577 Accrued restructuring costs 2,287 7,273 Liabilities of a disposal group held for sale — 3,143 Deferred income taxes, net 386 — Total current liabilities 82,679 89,299 LONG-TERM LIABILITIES Long-term debt and capital lease obligations 195,963 180,167 Accrued restructuring costs 1,410 2,321 Accrued expenses 17,249 18,032 Deferred income taxes, net 1,783 9,823 Total long-term liabilities 216,405 210,343 COMMITMENTS AND CONTINGENCIES (Notes 11 and 16) SHAREHOLDERS' EQUITY Common stock, $.01 par value; 150,000,000 shares authorized, 50,144,703 and 52,253,125 shares issued and outstanding, respectively
501 523
Additional paid-in capital 475,013 491,833 Accumulated other comprehensive gain 10,809 13,679 Accumulated deficit (242,586) (264,020) Total shareholders’ equity 243,737 242,015 Total liabilities and shareholders’ equity $ 542,821 $ 541,657
Accompanying notes are integral to these consolidated financial statements.

42
PREMIERE GLOBAL SERVICES, INC. AND SUBSIDIARIES CONSOLIDATED STATEMENTS OF OPERATIONS
Years Ended December 31, (in thousands, except per share data)
2011 2010 2009
Net revenues $ 473,834 $ 441,753 $ 453,962 Operating expenses Cost of revenues (exclusive of depreciation and amortization
shown separately below) 195,822 178,699 178,917 Selling and marketing 134,018 122,034 118,386 General and administrative (exclusive of expenses shown separately below) 57,176 58,576 56,286
Research and development 11,521 14,136 11,307 Excise and sales tax expense 352 439 — Depreciation 30,831 25,980 22,159 Amortization 6,365 7,386 10,517 Restructuring costs 847 12,257 9,427 Asset impairments 456 290 684 Net legal settlements and related expenses 399 659 297 Acquisition-related costs 91 316 612 Total operating expenses 437,878 420,772 408,592 Operating income 35,956 20,981 45,370 Other (expense) income Interest expense (9,954) (10,785) (11,308) Unrealized gain on change in fair value of interest rate swaps — 1,228 3,366 Interest income 46 157 419 Other, net (574) (1,075) 311 Total other expense (10,482) (10,475) (7,212) Income from continuing operations before income taxes 25,474 10,506 38,158 Income tax expense 8,586 1,540 12,400 Net income from continuing operations 16,888 8,966 25,758 Income (loss) from discontinued operations, net of taxes 4,546 (4,135) (12,149) Net income $ 21,434 $ 4,831 $ 13,609 BASIC WEIGHTED-AVERAGE SHARES OUTSTANDING 49,619 58,009 58,823 Basic net income (loss) per share Continuing operations $ 0.34 $ 0.15 $ 0.44 Discontinued operations 0.09 (0.07) (0.21) Net income per share $ 0.43 $ 0.08 $ 0.23 DILUTED WEIGHTED-AVERAGE SHARES OUTSTANDING 49,971 58,355 59,310 Diluted net income (loss) per share Continuing operations $ 0.34 $ 0.15 $ 0.43 Discontinued operations 0.09 (0.07) (0.20) Net income per share $ 0.43 $ 0.08 $ 0.23
Accompanying notes are integral to these consolidated financial statements.

43
PREMIERE GLOBAL SERVICES, INC. AND SUBSIDIARIES CONSOLIDATED STATEMENTS OF COMPREHENSIVE INCOME
Years Ended December 31 (in thousands)
2011 2010 2009
Net income $ 21,434 $ 4,831 $ 13,609 Other comprehensive income (loss): Change in unrealized gain, derivatives
(net of tax of $0, $847 and $540, respectively) — 1,009 1,574 Write-off of cumulative translation adjustments, net of tax — 4,676 — Translation adjustments (2,870) 1,777 12,955 Total other comprehensive (loss) income (2,870) 7,462 14,529 Comprehensive income $ 18,564 $ 12,293 $ 28,138
Accompanying notes are integral to these consolidated financial statements.
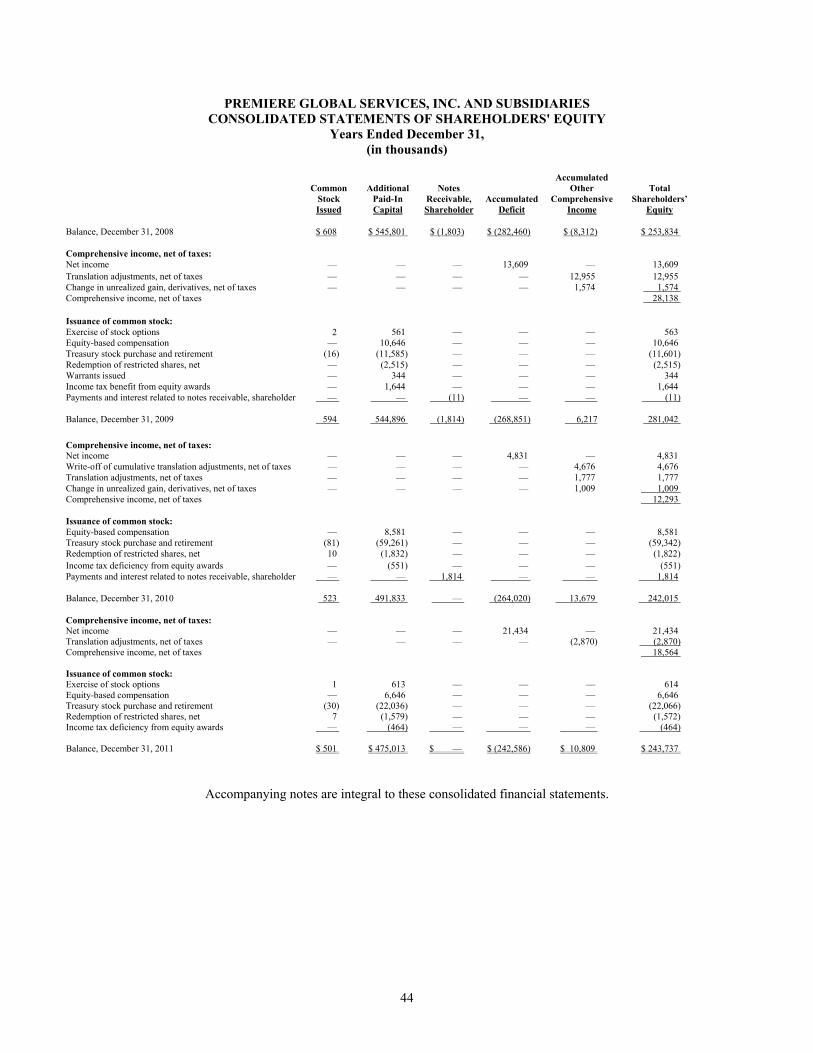
44
PREMIERE GLOBAL SERVICES, INC. AND SUBSIDIARIES CONSOLIDATED STATEMENTS OF SHAREHOLDERS' EQUITY
Years Ended December 31, (in thousands)
Common Stock Issued
Additional
Paid-In Capital
Notes
Receivable, Shareholder
AccumulatedDeficit
Accumulated Other
Comprehensive Income
Total
Shareholders’ Equity
Balance, December 31, 2008 $ 608 $ 545,801 $ (1,803) $ (282,460) $ (8,312) $ 253,834 Comprehensive income, net of taxes: Net income — — — 13,609 — 13,609 Translation adjustments, net of taxes — — — — 12,955 12,955 Change in unrealized gain, derivatives, net of taxes — — — — 1,574 1,574 Comprehensive income, net of taxes 28,138 Issuance of common stock: Exercise of stock options 2 561 — — — 563 Equity-based compensation — 10,646 — — — 10,646 Treasury stock purchase and retirement (16) (11,585) — — — (11,601) Redemption of restricted shares, net — (2,515) — — — (2,515) Warrants issued — 344 — — — 344 Income tax benefit from equity awards — 1,644 — — — 1,644 Payments and interest related to notes receivable, shareholder — — (11) — — (11) Balance, December 31, 2009 594 544,896 (1,814) (268,851) 6,217 281,042 Comprehensive income, net of taxes: Net income — — — 4,831 — 4,831 Write-off of cumulative translation adjustments, net of taxes — — — — 4,676 4,676 Translation adjustments, net of taxes — — — — 1,777 1,777 Change in unrealized gain, derivatives, net of taxes — — — — 1,009 1,009 Comprehensive income, net of taxes 12,293 Issuance of common stock: Equity-based compensation — 8,581 — — — 8,581 Treasury stock purchase and retirement (81) (59,261) — — — (59,342) Redemption of restricted shares, net 10 (1,832) — — — (1,822) Income tax deficiency from equity awards — (551) — — — (551) Payments and interest related to notes receivable, shareholder — — 1,814 — — 1,814 Balance, December 31, 2010 523 491,833 — (264,020) 13,679 242,015 Comprehensive income, net of taxes: Net income — — — 21,434 — 21,434 Translation adjustments, net of taxes — — — — (2,870) (2,870) Comprehensive income, net of taxes 18,564 Issuance of common stock: Exercise of stock options 1 613 — — — 614 Equity-based compensation — 6,646 — — — 6,646 Treasury stock purchase and retirement (30) (22,036) — — — (22,066) Redemption of restricted shares, net 7 (1,579) — — — (1,572) Income tax deficiency from equity awards — (464) — — — (464) Balance, December 31, 2011 $ 501 $ 475,013 $ — $ (242,586) $ 10,809 $ 243,737
Accompanying notes are integral to these consolidated financial statements.

45
PREMIERE GLOBAL SERVICES, INC. AND SUBSIDIARIES CONSOLIDATED STATEMENTS OF CASH FLOWS
Years Ended December 31, (in thousands)
2011 2010 2009
CASH FLOWS FROM OPERATING ACTIVITIES Net income $ 21,434 $ 4,831 $ 13,609 (Income) loss from discontinued operations, net of taxes (4,546) 4,135 12,149 Income from continuing operations 16,888 8,966 25,758 Adjustments to reconcile net income to net cash provided by operating activities: Depreciation 30,831 25,980 22,159 Amortization 6,365 7,386 10,517 Amortization of debt issuance costs 926 917 614
Write-off of unamortized debt issuance costs 743 161 — Net legal settlements and related expenses 399 659 297 Payments for legal settlements and related expenses (246) (417) (132)
Deferred income taxes, net of effect of acquisitions 2,814 (3,448) 1,180 Restructuring costs 847 12,257 9,427 Payments for restructuring costs (6,779) (9,537) (4,326) Asset impairments 456 290 684 Equity-based compensation 6,757 8,597 10,495 Excess tax benefits from share-based payment arrangements — — (1,716)
Unrealized gain on change in fair value of interest rate swaps — (1,228) (3,366) Provision for doubtful accounts 626 855 209 Changes in assets and liabilities, net of effect of acquisitions: Accounts receivable, net (8,937) 1,493 4,493 Other assets and liabilities 4,342 (5,752) 8,389 Accounts payable and accrued expenses 2,697 738 (8,555) Net cash provided by operating activities from continuing operations 58,729 47,917 76,127 Net cash (used in) provided by operating activities from discontinued operations (792) 17,901 13,275 Net cash provided by operating activities 57,937 65,818 89,402 CASH FLOWS FROM INVESTING ACTIVITIES Capital expenditures (30,100) (32,868) (26,856) Other investing activities (427) 10 101 Business disposition 1,902 51,281 1,000 Business acquisitions, net of cash acquired (1,282) (591) (8,421) Net cash (used in) provided by investing activities from continuing operations (29,907) 17,832 (34,176) Net cash used in investing activities from discontinued operations (276) (6,009) (14,577) Net cash (used in) provided by investing activities (30,183) 11,823 (48,753) CASH FLOWS FROM FINANCING ACTIVITIES Principal payments under borrowing arrangements (70,793) (200,586) (201,657) Proceeds from borrowing arrangements 85,971 158,756 186,019 Payment of debt issuance costs (1,469) (1,165) (147) Repayment of shareholder notes — 1,904 93 Excess tax benefits from share-based payment arrangements — — 1,716 Purchase of treasury stock, at cost (23,852) (61,603) (14,491) Exercise of stock options 614 — 563 Net cash used in financing activities from continuing operations (9,529) (102,694) (27,904) Net cash used in financing activities from discontinued operations (140) (90) (108) Net cash used in financing activities (9,669) (102,784) (28,012) Effect of exchange rate changes on cash and equivalents (1,153) (1,158) 1,230 NET INCREASE (DECREASE) IN CASH AND EQUIVALENTS 16,932 (26,301) 13,867 CASH AND EQUIVALENTS, beginning of period 15,101 41,402 27,535 CASH AND EQUIVALENTS, end of period $ 32,033 $ 15,101 $ 41,402
Accompanying notes are integral to these consolidated financial statements.

PREMIERE GLOBAL SERVICES, INC. AND SUBSIDIARIES NOTES TO CONSOLIDATED FINANCIAL STATEMENTS
46
1. THE COMPANY AND ITS BUSINESS
PGi has been a global leader in virtual meetings for 20 years. Our cloud-based solutions deliver multi-point, real-time virtual collaboration using video, voice and file sharing technologies to help businesses worldwide to be more productive, mobile and green. We have a global presence in 25 countries in our three segments in North America, Europe and Asia Pacific. 2. SIGNIFICANT ACCOUNTING POLICIES Accounting Estimates
Preparation of financial statements in conformity with GAAP requires management to make estimates and assumptions that affect the reported amounts of assets and liabilities and disclosures of contingent assets and liabilities at the date of the financial statements and reported amounts of net revenues and expenses during the reporting period. Financial statement line items that include significant estimates consist of goodwill, net intangibles, accrued restructuring costs, tax accounts, certain accrued liabilities and the allowance for uncollectible accounts receivable. Changes in the facts or circumstances underlying these estimates could result in material changes, and actual results could differ from those estimates. These changes in estimates are recognized in the period they are realized. Principles of Consolidation and Basis of Presentation
The financial statements include our accounts consolidated with our wholly-owned subsidiaries. All significant intercompany accounts and transactions have been eliminated in consolidation. Unless otherwise stated, current and prior period results in our consolidated statements of operations and cash flows and these notes reflect our results from continuing operations and exclude the effect of current and prior period discontinued operations. See Note 5 to our consolidated financial statements. Certain prior year amounts have been reclassified to conform to current year presentation. Cash and Equivalents and Restricted Cash
Cash and equivalents include cash on hand and highly liquid investments with a maturity at date of purchase of three months or less. Cash balances that are legally restricted as to usage or withdrawal are separately included in “Prepaid expenses and other current assets” on our consolidated balance sheets. At December 31, 2011, we had $0.4 million of restricted cash. At December 31, 2010, we did not have any restricted cash. Accounts Receivable and Allowance for Doubtful Accounts
Included in accounts receivable at December 31, 2011 and 2010 was earned but unbilled revenue of approximately $6.6 million and $6.5 million, respectively, which results from non-calendar month billing cycles and the one-month lag in billing of certain of our services. Earned but unbilled revenue is billed within 30 days. Provision for doubtful accounts was approximately $0.6 million, $0.9 million and $0.2 million in 2011, 2010 and 2009, respectively. Write-offs against the allowance for doubtful accounts were $0.9 million, $1.0 million and $0.5 million in 2011, 2010 and 2009, respectively. Our allowance for doubtful accounts represents reserves for receivables that reduce accounts receivable to amounts expected to be collected. Allowance for doubtful accounts was approximately $0.6 million, $0.9 million and $1.0 million as of December 31, 2011, 2010 and 2009, respectively. Management uses significant judgment in estimating uncollectible amounts. In estimating uncollectible amounts, management considers factors such as historical and anticipated customer payment performance and industry-specific economic conditions. Using these factors, management assigns reserves for uncollectible amounts by accounts receivable aging categories to specific customer accounts. Property and Equipment
Property and equipment are recorded at cost. Depreciation is recorded under the straight-line method over the estimated useful lives of the assets, commencing when the assets are placed in service. The estimated useful lives are five to seven years for furniture and fixtures, two to five years for software and three to ten years for

PREMIERE GLOBAL SERVICES, INC. AND SUBSIDIARIES NOTES TO CONSOLIDATED FINANCIAL STATEMENTS
47
computer servers and Internet and telecommunications equipment. The cost of installation of equipment is capitalized, as applicable. Amortization of assets recorded under capital leases is included in depreciation. Assets recorded under capital leases and leasehold improvements are depreciated over the shorter of their useful lives or the term of the related lease. Research and Development
Research and development expenses primarily related to developing new services, features and enhancements to existing services that do not qualify for capitalization are expensed as incurred. Software Development Costs
We capitalize certain costs incurred to develop software features sold as part of our service offerings as part of “Property and Equipment, Net” on our consolidated balance sheets. For the years ended December 31, 2011, 2010 and 2009, we capitalized approximately $15.3 million, $16.4 million and $15.3 million, respectively, of these costs. We amortize these capitalized costs on a straight-line basis over the estimated life of the related software, not to exceed five years. Depreciation expense recorded for developed software for the years ended December 31, 2011, 2010, and 2009, was approximately $10.2 million, $6.1 million and $4.2 million, respectively. Goodwill
Goodwill is subject to a periodic impairment assessment by applying a fair value-based test using a two-step method. The first step is to identify potential goodwill impairment by comparing the estimated fair value of the reporting unit to their carrying amounts. The second step measures the amount of the impairment based upon a comparison of “implied fair value” of goodwill with its carrying amount. Based on our calculations this year, the fair value of each of our reporting units substantially exceeded their respective carrying values. Therefore we do not believe that any of our reporting units are at risk of failing step one of the goodwill impairment test. We have adopted December 31 of a given calendar year as our valuation date and have evaluated goodwill as of December 31, 2011, 2010 and 2009, with no impairments identified. We disposed of $59.1 million of goodwill as part of our PGiSend sale in 2010. Valuation of Long-Lived Assets
We evaluate the carrying values of long-lived assets when significant adverse changes in the economic value of these assets require an analysis, including property and equipment and other intangible assets. A long-lived asset is considered impaired when its fair value is less than its carrying value. In that event, a loss is calculated based on the amount the carrying value exceeds the future cash flows, as calculated under the best-estimate approach, of such asset. We believe that long-lived assets in our consolidated balance sheets are appropriately valued. Asset impairments were $0.5 million, $0.3 million and $0.7 million during 2011, 2010 and 2009, respectively, and are recognized as “Asset impairments” in our consolidated statements of operations. Cost Method Investments
During June 2011, we invested approximately $1.0 million in a privately held conferencing company. The investment is accounted for under the cost method and is periodically assessed for other-than-temporary impairment using financial results, economic data and other quantitative and qualitative factors deemed applicable. In the event an other-than-temporary impairment occurs, an impairment loss equal to the difference between the cost basis and the fair value will be recognized. The cost of this investment is carried on our consolidated balance sheet at December 31, 2011 as a component of “Other assets”. Revenue Recognition
We recognize revenues when persuasive evidence of an arrangement exists, services have been rendered, the price to the buyer is fixed or determinable and collectability is reasonably assured. Revenues consist primarily of usage fees generally based on per minute and, prior to reclassifying our discontinued businesses as discontinued operations, per fax page or per transaction methods. To a lesser extent, we charge subscription-based and license fees and fixed-period minimum revenue commitments. Unbilled revenue consists of revenue that is earned but has

PREMIERE GLOBAL SERVICES, INC. AND SUBSIDIARIES NOTES TO CONSOLIDATED FINANCIAL STATEMENTS
48
not been billed, which results from non-calendar month billing cycles and the one-month lag time in billing related to certain of our services. Deferred revenue consists of payments made by customers in advance of the time services are rendered. Incremental direct costs incurred related to deferred revenue are deferred over the life of the contract and are recorded in “Prepaid expenses and other current assets” in our consolidated balance sheets. USF Charges
In accordance with FCC rules, we are required to contribute to the federal Universal Service Fund, or USF, for some of our solutions, which we recover from our applicable customers and remit to the USAC. We present the USF charges that we collect and remit on a net basis, with charges to our customers netted against the cost we remit. Foreign Currency Translation
The assets and liabilities of subsidiaries with a functional currency other than the U.S. Dollar are translated at rates of exchange existing at our consolidated balance sheet dates. Revenues and expenses are translated at average rates of exchange prevailing during the year. The resulting translation adjustments are recorded in the “Accumulated other comprehensive gain (loss)” component of shareholders’ equity. In addition, intercompany loans with foreign subsidiaries generally are considered to be permanently invested for the foreseeable future. Therefore, all foreign currency exchange gains and losses related to these permanently invested balances are recorded in the “Accumulated other comprehensive gain (loss)” component of shareholders’ equity in our consolidated balance sheets. During 2010, we wrote-off $4.7 million of “Accumulated other comprehensive gain (loss)” as part of loss on disposal in discontinued operations, which represents the historical “Accumulated other comprehensive gain (loss)” for our discontinued businesses. Treasury Stock
All treasury stock transactions are recorded at cost. During the year ended December 31, 2011, we repurchased approximately 3.0 million shares of our common stock in the open market for approximately $22.0 million. During the year ended December 31, 2010, we repurchased approximately 8.1 million shares of our common stock through a cash self-tender offer for approximately $58.8 million and incurred costs associated with the tender offer of approximately $0.6 million, including legal and dealer-manager fees, that were recorded to the “Additional paid-in capital” component of shareholders’ equity in our consolidated balance sheet.
During the years ended December 31, 2011 and 2010, we redeemed 208,944 and 252,655 shares, respectively, of our common stock to satisfy certain of our employees’ tax withholdings due upon the vesting of their restricted stock grants and remitted approximately $1.8 million and $2.3 million, respectively, in taxes on our employees’ behalf.
We retire all shares of treasury stock repurchased.
Preferred Stock
We have 5.0 million shares of authorized $0.01 par value preferred stock, none of which are issued or outstanding. Under the terms of our amended and restated articles of incorporation, our board of directors is empowered to issue preferred stock without shareholder action. Comprehensive Income (Loss)
Comprehensive income (loss) represents the change in equity of a business during a period, except for investments by owners and distributions to owners. Comprehensive income for the years ended December 31, 2011, 2010 and 2009 was $18.6 million, $12.3 million and $28.1 million, respectively. The primary differences between net income, as reported, and comprehensive income are foreign currency translation adjustments, net of taxes, the write off of cumulative translation adjustments related to our PGiSend sale and changes in unrealized gain (loss), derivatives, net of taxes.

PREMIERE GLOBAL SERVICES, INC. AND SUBSIDIARIES NOTES TO CONSOLIDATED FINANCIAL STATEMENTS
49
Income Taxes
Income taxes are determined under the asset and liability method as required by ASC 740, “Income Taxes”. Under this method, deferred tax assets and liabilities are recognized based upon the estimated future tax consequences attributable to differences between the financial statement carrying amounts of existing assets and liabilities and their respective tax bases. Deferred tax assets and liabilities are measured using existing tax rates expected to apply to taxable income in the years in which those temporary items are expected to be recovered or settled. Valuation allowances are established when necessary to reduce deferred tax assets to the amounts more likely than not to be realized. To the extent we establish a valuation allowance or increase this allowance in a period, an expense is recorded within the income tax provision in our consolidated statements of operations. Under current accounting principles, the impact of an uncertain income tax position on the income tax return must be recognized at the largest amount that is more likely than not to be sustained upon audit by the relevant taxing authority.
Restructuring Costs
Restructuring reserves are based on certain estimates and judgments related to severance and exit costs, contractual obligations and related costs and are recorded as “Restructuring costs” in our consolidated statements of operations. See Note 3 to our consolidated financial statements for additional information and related disclosures regarding our restructuring costs. Advertising Costs
We expense production costs associated with an advertisement the first time the advertising takes place. All other advertising-related costs are expensed as incurred. We expense the cost of running an advertisement at the time it airs. Total advertising expense in 2011, 2010 and 2009 was $16.9 million, $10.2 million and $4.8 million, respectively. As of December 31, 2011 and 2010, we had $0.0 million and $1.0 million of prepaid advertising, respectively. Legal Contingencies
We are involved from time to time in certain legal matters and subject to other claims as disclosed in Note 16. We accrue an estimate for legal contingencies when we determine that it is probable that a liability has been incurred and the amount of the loss can be reasonably estimated. These estimates are developed in consultation with outside counsel handling these matters and based upon an analysis of potential results, assuming a combination of litigation and settlement strategies. New and Recently Adopted Accounting Pronouncements
In December 2011, the FASB issued ASU No. 2011-11 “Balance Sheet (Topic 210): Disclosures about
Offsetting Assets and Liabilities,” which modifies the disclosure requirements for offsetting financial instruments and derivative instruments. The update requires an entity to disclose information about offsetting and related arrangements and the effect of those arrangements on its financial position. This guidance is effective for public companies for reporting periods beginning on or after January 1, 2013. ASU No. 2011-11 is not expected to have a material impact on our consolidated financial position or results of operations.
In September 2011, the FASB issued ASU No. 2011-08 “Intangibles - Goodwill and Other (Topic 350):
Testing Goodwill for Impairment,” which modifies the process of testing goodwill for impairment. The update will allow an entity to first assess qualitative factors to determine whether it is necessary to perform the two-step quantitative goodwill impairment test. An entity would not be required to calculate the fair value of a reporting unit unless the entity determines it is more likely than not, based on a qualitative assessment, the fair value of goodwill is less than its carrying amount. The guidance also includes a number of events and circumstances to consider in conducting the qualitative assessment. This guidance is effective for public companies for fiscal years beginning on or after December 15, 2011. ASU No. 2011-08 is not expected to have a material impact on our consolidated financial position or results of operations.

PREMIERE GLOBAL SERVICES, INC. AND SUBSIDIARIES NOTES TO CONSOLIDATED FINANCIAL STATEMENTS
50
In June 2011, the FASB issued ASU No. 2011-05 “Comprehensive Income (Topic 220): Presentation of Comprehensive Income,” which modifies the requirements for presenting net income and other comprehensive income and requires that all non-owner changes in shareholders’ equity be presented either in a single continuous statement of comprehensive income or in two separate but consecutive statements. The amendment requires presentation of each component of net income along with total net income, each component of other comprehensive income along with a total for other comprehensive income and a total amount for comprehensive income. In December 2011, the FASB issued Accounting Standards Update No. 2011-12 “Comprehensive Income (Topic 220): Deferral of the Effective Date for Amendments to the Presentation of Reclassifications of Items Out of Accumulated Other Comprehensive Income in Accounting Standards Update No. 2011-05,” These amendments are being made to allow the FASB time to redeliberate whether to present on the face of the financial statements the effects of reclassifications out of accumulated other comprehensive income on the components of net income and other comprehensive income in all periods presented. This guidance is effective for public companies for fiscal years and interim periods beginning on or after December 15, 2011. We adopted the guidance as of December 31, 2011, and it did not have a material impact on our consolidated financial position or results of operations.
In May 2011, the FASB issued ASU No. 2011-04 “Fair Value Measurement (Topic 820): Amendments to Achieve Common Fair Value Measurement and Disclosure Requirements in U.S. GAAP and International Financial Reporting Standards,” to conform existing guidance regarding fair value measurement and disclosure between GAAP and International Financial Reporting Standards. The clarifying changes relate to the application of the highest and best use and valuation premise concepts, measuring the fair value of an instrument classified in a reporting entity’s shareholders’ equity and disclosure of quantitative information about unobservable inputs used for Level 3 fair value measurements. The amendments relate to measuring the fair value of financial instruments that are managed within a portfolio and application of premiums and discounts in a fair value measurement. The amendments also require additional disclosures concerning the valuation processes used, sensitivity of the fair value measurement to changes in unobservable inputs for those items categorized as Level 3, a reporting entity’s use of a nonfinancial asset in a way that differs from the asset’s highest and best use and the categorization by level in the fair value hierarchy for items required to be measured at fair value for disclosure purposes only. This guidance is effective for public companies for fiscal years and interim periods beginning on or after December 15, 2011. ASU No. 2011-04 is not expected to have a material impact on our consolidated financial position or results of operations. 3. RESTRUCTURING COSTS
Below is a reconciliation of the beginning and ending liability balances related to our restructuring efforts for the years ended 2011, 2010 and 2009. Provision for restructuring costs from continuing operations were $0.8 million, $12.3 million and $9.4 million in 2011, 2010 and 2009, respectively. The expenses associated with these activities are reflected in “Restructuring costs” in our consolidated statements of operations. Cash payments for restructuring costs from continuing operations were $6.8 million, $9.5 million and $4.3 million in 2011, 2010 and 2009, respectively. The components included in the reconciliation of the liability balances include costs related to our continuing and discontinued operations (in thousands):
Balance at December 31,
2008
Provisions Cash
payments Equity
released Non-cash
Balance at December 31,
2009 Accrued restructuring costs: Severance and exit costs $ 270 $ 14,776 $ (9,519) $ (164) $ 129 $ 5,492 Contractual obligations 1,583 7,623 (1,548) — 7 7,665 Total restructuring costs $ 1,853 $ 22,399 $ (11,067) $ (164) $ 136 $ 13,157
Balance at December 31,
2009
Provisions Cash
payments Equity
released Non-cash
Balance at December 31,
2010 Accrued restructuring costs: Severance and exit costs $ 5,492 $ 11,432 $ (10,534) $ (248) $ (345) $ 5,797 Contractual obligations 7,665 2,103 (2,580) — (3,391) 3,797 Total restructuring costs $ 13,157 $ 13,535 $ (13,114) $ (248) $ (3,736) $ 9,594

PREMIERE GLOBAL SERVICES, INC. AND SUBSIDIARIES NOTES TO CONSOLIDATED FINANCIAL STATEMENTS
51
Balance at December 31,
2010
Provisions Cash
payments Equity
released Non-cash
Balance at December 31,
2011 Accrued restructuring costs: Severance and exit costs $ 5,797 $ 731 $ (5,116) $ — $ (402) $ 1,010 Contractual obligations 3,797 379 (1,662) — 173 2,687 Total restructuring costs $ 9,594 $ 1,110 $ (6,778) $ — $ (229) $ 3,697 Realignment of Workforce – 2011
During 2011, we recorded restructuring expense of $1.1 million, including $0.3 million related to discontinued operations, which consisted of severance and lease termination costs in 2011, net of adjustments of ($0.7) million relating to existing reserves for prior years as detailed below. For the 2011 realignment, we recorded $1.6 million of severance costs, including $0.3 million recorded in discontinued operations, and $0.2 million of lease termination costs associated with efforts to consolidate and streamline various functions of our work force. As a result, we eliminated approximately 30 positions. On a segment basis, these restructuring costs totaled $1.1 million in North America, $0.4 million in Europe and $0.3 million in Asia Pacific. Our reserve for the 2011 restructuring costs was $0.7 million at December 31, 2011. We anticipate these severance-related costs will be paid over the next year and these lease terminations cost will be paid over the next 20 months. Realignment of Workforce – 2010
During 2010, we recorded $10.2 million of severance costs and $0.6 million of lease termination cost associated with efforts to consolidate and streamline various functions of our work force. We also recorded $1.8 million of asset impairments in connection with these restructuring efforts. In addition, we recorded $0.9 million of exit costs related to marketing efforts abandoned during the year and $0.5 million of exit costs related to the reorganization of our operating structure subsequent to our PGiSend sale as restructuring costs. As part of these consolidations, we eliminated approximately 165 positions. On a segment basis, these restructuring costs totaled $8.5 million in North America, which included the acceleration of vesting of restricted stock with a fair market value of $0.2 million in North America, $2.5 million in Europe and $1.2 million in Asia Pacific. During 2011, we adjusted our initial estimate of severance and exit costs by ($0.8) million in North America and ($0.1) million in Europe. Also during 2011, we adjusted our initially recorded lease termination costs by ($0.1) million in North America and $0.1 million in Europe. Our remaining reserve for the 2010 realignment was $0.6 million at December 31, 2011, which we anticipate will be paid over the next 15 months.
Realignment of Workforce – 2009
During the year ended December 31, 2009, we executed a restructuring plan to consolidate and streamline various functions of our work force. As part of these consolidations, we eliminated approximately 500 positions. During the year ended December 31, 2009, we recorded total severance and exit costs of $14.8 million, which included the acceleration of vesting of restricted stock with a fair market value of $0.2 million in North America. Additionally, during the year ended December 31, 2009, we recorded $4.4 million of lease termination costs associated with office locations in North America and Europe. On a segment basis, these restructuring costs totaled $12.0 million in North America, $6.6 million in Europe and $0.6 million in Asia Pacific. During 2011, we updated assumptions regarding lease termination costs, resulting in a $0.1 million adjustment in North America. In 2011 we also recorded $0.1 million of accretion due to the passage of time. Our reserve for the 2009 realignment was $2.4 million at December 31, 2011, comprised primarily of lease termination costs, which we anticipate will be paid over the next seven years. 4. ACQUISITIONS
We seek to acquire complementary companies that increase our market share and provide us with additional customers, technologies, applications and sales personnel. All revenues and related costs from these transactions have been included in our consolidated financial statements as of the effective date of each acquisition.

PREMIERE GLOBAL SERVICES, INC. AND SUBSIDIARIES NOTES TO CONSOLIDATED FINANCIAL STATEMENTS
52
In February 2009, we acquired certain technology assets of a provider of web collaboration services in exchange for warrants to purchase 105,000 shares of our common stock with an exercise price of $9.21 per share. These warrants were fully vested 12 months after the grant date, which expired on February 23, 2012. We allocated the $0.3 million fair value of the warrants to in-process research and development in other intangible assets. Beginning in the fourth quarter of 2010, the in-process research and development was being amortized over a 36-month useful life. We incurred transaction fees and closing costs of $0.2 million, which we expensed as incurred.
In February 2009, we acquired certain assets and assumed certain liabilities of LINK. We paid $7.1 million in cash at closing and $0.3 million in transaction fees and closing costs, which we expensed as incurred. We funded the purchase through our credit facility and cash and equivalents on hand. We allocated $0.7 million to accounts receivable, $0.1 million to prepaid assets, $0.3 million to acquired fixed assets, $0.3 million to other acquisition liabilities, $2.4 million to identifiable customer lists and $0.1 million to non-compete agreements, with the customer lists amortized over ten years and the non-compete agreements amortized over five years. We allocated the residual $3.8 million of the purchase price to goodwill, which is subject to a periodic impairment assessment. 5. DISCONTINUED OPERATIONS PGiSend
On October 21, 2010, we completed the sale of our PGiSend messaging business through the sale of all of the issued and outstanding equity interests in our wholly-owned subsidiaries, Xpedite and Premiere Global Services (UK) Limited, and the sale of certain assets of Premiere Conferencing (Canada) Limited to EasyLink for an aggregate purchase price of $105.0 million. Maritime Notification and Reminder Solutions
During the year ended December 31, 2010, we classified our Maritime Notification and Reminder solutions operations as a disposal group held-for-sale. This disposal group consisted of all customers using these non-conferencing, ship-to-shore communication services targeted specifically towards shipping vessels that were resold through our Japanese subsidiary. Assets of the disposal group held for sale consisted of accounts receivable of $4.3 million, net of allowances of $0.3 million. Liabilities of the disposal group held for sale consisted of $3.1 million of accounts payable. As of December 31, 2011, this disposal was completed and no assets or liabilities of the disposal group remain. PGiMarket
On November 5, 2009, we completed the sale of our PGiMarket business. Results of operations of this business are presented as discontinued operations for all periods. In connection with this divestiture, during 2009, we recorded a non-cash charge of $7.0 million in discontinued operations to reduce the carrying value of the assets associated with this business to their estimated fair value of $1.4 million, of which $1.0 million was cash received at closing and $0.4 million was an estimate of cash to be received based on the achievement of certain revenue targets in 2010 under an earn-out provision. During 2010, we adjusted our estimate of cash to be received under the earn-out provision to $0.7 million and recorded the $0.3 million adjustment as part of net income from discontinued operations.

PREMIERE GLOBAL SERVICES, INC. AND SUBSIDIARIES NOTES TO CONSOLIDATED FINANCIAL STATEMENTS
53
We allocated interest expense related to interest recognized on uncertain tax positions specific to our PGiSend discontinued operations in 2011. We allocated interest expense related to our $50.0 million Term A loan, which was required to be repaid as a result of our PGiSend sale, to discontinued operations in 2010 and 2009. The following amounts associated with our discontinued businesses have been segregated from continuing operations and are reflected as discontinued operations for 2011, 2010 and 2009 (in thousands):
Years Ended December 31,
2011 2010 2009 Net revenue from discontinued operations $ 8,735 $ 111,830 $ 150,195 Operating income (loss) (1,768) 12,352 (6,148)Interest expense (686) (1,256) (2,143)Loss on disposal (298) (12,317) (6,972)Income tax benefit (expense) 7,298 (2,914) 3,114 Income (loss) from discontinued operations, net of taxes $ 4,546 $ (4,135) $ (12,149)
The results of discontinued operations include an income tax benefit of $7.3 million. This benefit includes approximately $6 million relating to changes in estimates of the tax provision that resulted from the finalization of the actual tax basis purchase price allocation received in the third quarter from EasyLink in connection with our PGiSend sale. 6. PROPERTY AND EQUIPMENT, NET
Property and equipment at December 31, 2011 and 2010 is as follows (in thousands): 2011 2010 Operations equipment $ 76,678 $ 72,971 Furniture and fixtures 8,370 8,258 Office equipment 2,471 2,508 Leasehold improvements 31,746 30,761 Capitalized software 79,592 66,889 Construction in progress 11,808 10,436 Building 1,556 1,561 212,221 193,384 Less accumulated depreciation and amortization (108,772) (86,146) Property and equipment, net $ 103,449 $ 107,238
Assets under capital leases are included in property and equipment categories above. Total assets under capital leases at December 31, 2011 and 2010 are as follows (in thousands):
2011 2010 Capital leases $ 17,095 $ 20,264 Less accumulated depreciation (7,198) (7,625) Assets under capital lease, net $ 9,897 $ 12,639

PREMIERE GLOBAL SERVICES, INC. AND SUBSIDIARIES NOTES TO CONSOLIDATED FINANCIAL STATEMENTS
54
7. GOODWILL AND INTANGIBLE ASSETS
Goodwill by reportable business segment at December 31, 2011, 2010 and 2009 (in thousands):
North
America Europe Asia
Pacific
Total Gross value at December 31, 2009 $ 397,763 $ 44,585 $ 4,684 $ 447,032 Accumulated impairment losses (92,423) — — (92,423)
Carrying value at December 31, 2009 305,340 44,585 4,684
354,609 Disposal of PGiSend goodwill (34,430) (24,706) — (59,136)Adjustments 1,124 (545) 629 1,208
Carrying value at December 31, 2010 272,034 19,334 5,313
296,681 Adjustments (504) (478) (9) (991)
Carrying value at December 31, 2011 $ 271,530 $ 18,856 $ 5,304
$ 295,690
Goodwill is not subject to amortization but is subject to periodic reviews for impairment. Adjustments to the goodwill carrying value since December 31, 2009 are primarily due to foreign currency fluctuations against the U.S. Dollar. The disposal of goodwill in 2010 was associated with our PGiSend sale. Other Intangible Assets
Summarized below are the carrying values and accumulated amortization by intangible asset class at December 31, 2011 and 2010 (in thousands):
2011 2010 Gross
carrying value
Accumulated amortization
Net carrying
value
Gross carrying
value Accumulated amortization
Net carrying
valueOther Intangible assets: Customer lists $ 65,566 $ (57,682) $ 7,884 $ 67,386 $ (54,307) $ 13,079 Non-compete agreements 5,701 (5,063) 638 5,825 (4,494) 1,331 Developed technology 1,000 (1,000) — 1,000 (1,000) — Other 2,889 (505) 2,384 2,637 (80) 2,557 Total other intangible assets $ 75,156 $ (64,250) $ 10,906 $ 76,848 $ (59,881) $ 16,967
Other intangible assets include $9.9 million of net intangible assets at December 31, 2011 that are subject to amortization. Other intangible assets that are subject to amortization are amortized over an estimated useful life between one and ten years. Other intangible assets with indefinite lives that are not subject to amortization include $0.4 million of domain names and $0.6 million of trademarks. During 2010, we disposed of an aggregate of $104.7 million of intangibles and $104.4 million of accumulated amortization for intangibles that were no longer in service, primarily due to our PGiSend sale. Amortization expense related to our other intangible assets for the full year 2011 was approximately $6.4 million. Estimated amortization expense for the next five years is as follows (in thousands):
Year
Estimated amortization
expense
2012 $ 3,808 2013 $ 1,491 2014 $ 1,109 2015 $ 1,105 2016 $ 845

PREMIERE GLOBAL SERVICES, INC. AND SUBSIDIARIES NOTES TO CONSOLIDATED FINANCIAL STATEMENTS
55
8. INDEBTEDNESS
Long-term debt and capital lease obligations at December 31, 2011 and 2010 are as follows (in thousands):
December 31,
2011 December 31,
2010 Borrowings on credit facility $ 192,885 $ 173,338 Capital lease obligations 6,923 10,406 Subtotal 199,808 183,744 Less current portion (3,845) (3,577) Total long-term debt and capital lease obligations $ 195,963 $ 180,167
The fair value of our long-term debt and capital lease obligations approximated carrying value at December 31, 2011 and 2010. Fair value is determined using current interest rates offered to us on debt of the same remaining maturity and characteristics, including credit quality.
Future minimum lease payments under capital leases consist of the following at December 31, 2011 (in thousands):
2012 $ 4,581 2013 2,901 2014 258 2015 17 Total minimum lease payments 7,757 Less amounts representing interest (834) Present value of minimum lease payments 6,923 Less current portion (3,845) $ 3,078
Our credit facility consists of a $250.0 million revolver, a $50.0 million Term A loan and an uncommitted $75.0 million accordion feature. Our subsidiary, ATS, is the borrower under our credit facility, with PGi and certain of our material domestic subsidiaries guaranteeing the obligations of ATS under the credit facility, which is secured by substantially all of our assets and the assets of our material domestic subsidiaries. In addition, we have pledged as collateral all of the issued and outstanding stock of our material domestic subsidiaries and 65% of our material foreign subsidiaries. Proceeds drawn under our credit facility can be used for working capital, capital expenditures, acquisitions and other general corporate purposes. The annual interest rate applicable to borrowings under our credit facility, at our option, is (1) the base rate (the greater of either the federal funds rate plus one-half of one percent, the prime rate or one-month LIBOR plus one and one-half percent) plus an applicable percentage that varies based on our consolidated leverage ratio at quarter end, or (2) LIBOR for one, two, three, nine or twelve months adjusted for a percentage that represents the Federal Reserve Board’s reserve percentage plus an applicable percentage that varies based on our consolidated leverage ratio at quarter end. The applicable percentage for base rate loans and LIBOR loans were 1.50% and 2.50%, respectively, at December 31, 2011 under our credit facility. Our interest rate on LIBOR loans, which comprised materially all of our outstanding borrowings as of December 31, 2011, was 2.79%. In addition, we pay a commitment fee on the unused portion of our credit facility that is based on our consolidated leverage ratio at quarter end. As of December 31, 2011, the rate applied to the unused portion of our credit facility was 0.4%. Our credit facility contains customary terms and restrictive covenants, including financial covenants.
At December 31, 2011, we were in compliance with the covenants under our credit facility. At December
31, 2011, we had $192.9 million of borrowings and $5.5 million in letters of credit outstanding under our credit facility.
In August 2007, we entered into two $100.0 million two-year interest rate swaps at a fixed rate of 4.99%. In December 2007, we amended the life of one of the $100.0 million swaps to three years and reduced the fixed rate to 4.75%. Our $100.0 million interest rate swap, which had a fixed rate of 4.99%, expired in August 2009, and our
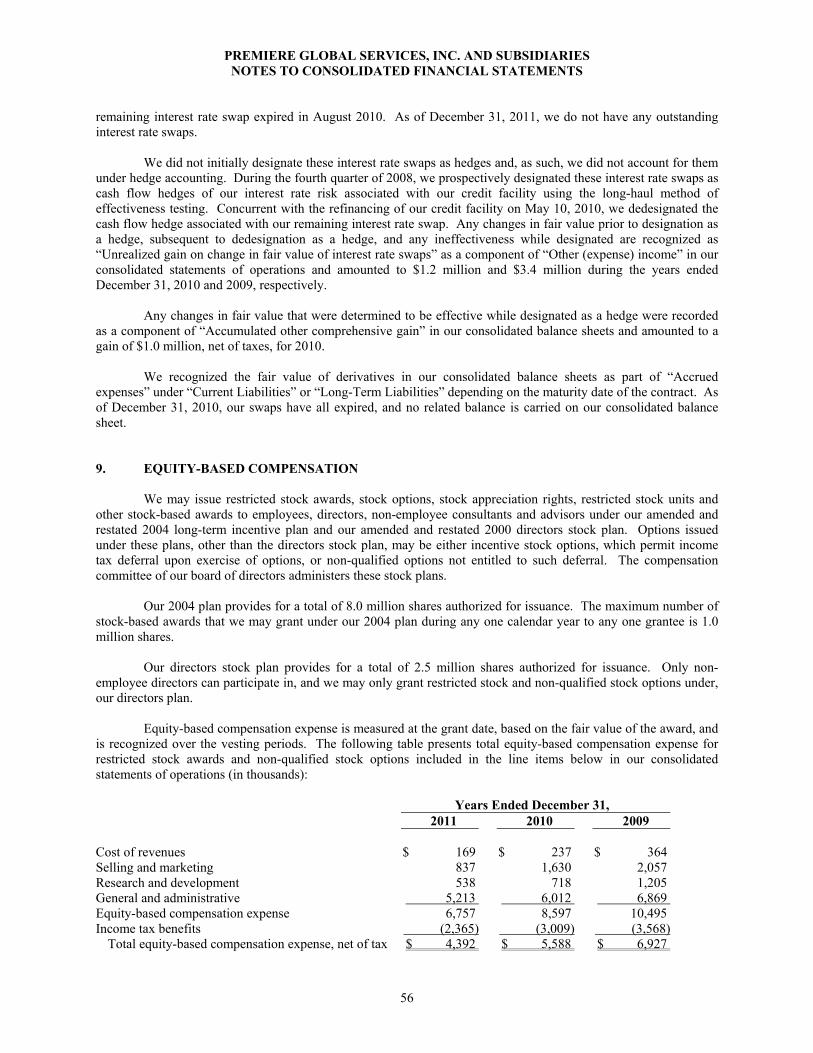
PREMIERE GLOBAL SERVICES, INC. AND SUBSIDIARIES NOTES TO CONSOLIDATED FINANCIAL STATEMENTS
56
remaining interest rate swap expired in August 2010. As of December 31, 2011, we do not have any outstanding interest rate swaps.
We did not initially designate these interest rate swaps as hedges and, as such, we did not account for them under hedge accounting. During the fourth quarter of 2008, we prospectively designated these interest rate swaps as cash flow hedges of our interest rate risk associated with our credit facility using the long-haul method of effectiveness testing. Concurrent with the refinancing of our credit facility on May 10, 2010, we dedesignated the cash flow hedge associated with our remaining interest rate swap. Any changes in fair value prior to designation as a hedge, subsequent to dedesignation as a hedge, and any ineffectiveness while designated are recognized as “Unrealized gain on change in fair value of interest rate swaps” as a component of “Other (expense) income” in our consolidated statements of operations and amounted to $1.2 million and $3.4 million during the years ended December 31, 2010 and 2009, respectively.
Any changes in fair value that were determined to be effective while designated as a hedge were recorded as a component of “Accumulated other comprehensive gain” in our consolidated balance sheets and amounted to a gain of $1.0 million, net of taxes, for 2010.
We recognized the fair value of derivatives in our consolidated balance sheets as part of “Accrued
expenses” under “Current Liabilities” or “Long-Term Liabilities” depending on the maturity date of the contract. As of December 31, 2010, our swaps have all expired, and no related balance is carried on our consolidated balance sheet. 9. EQUITY-BASED COMPENSATION
We may issue restricted stock awards, stock options, stock appreciation rights, restricted stock units and other stock-based awards to employees, directors, non-employee consultants and advisors under our amended and restated 2004 long-term incentive plan and our amended and restated 2000 directors stock plan. Options issued under these plans, other than the directors stock plan, may be either incentive stock options, which permit income tax deferral upon exercise of options, or non-qualified options not entitled to such deferral. The compensation committee of our board of directors administers these stock plans.
Our 2004 plan provides for a total of 8.0 million shares authorized for issuance. The maximum number of stock-based awards that we may grant under our 2004 plan during any one calendar year to any one grantee is 1.0 million shares.
Our directors stock plan provides for a total of 2.5 million shares authorized for issuance. Only non-employee directors can participate in, and we may only grant restricted stock and non-qualified stock options under, our directors plan.
Equity-based compensation expense is measured at the grant date, based on the fair value of the award, and is recognized over the vesting periods. The following table presents total equity-based compensation expense for restricted stock awards and non-qualified stock options included in the line items below in our consolidated statements of operations (in thousands): Years Ended December 31, 2011 2010 2009 Cost of revenues $ 169 $ 237 $ 364 Selling and marketing 837 1,630 2,057 Research and development 538 718 1,205 General and administrative 5,213 6,012 6,869 Equity-based compensation expense 6,757 8,597 10,495 Income tax benefits (2,365) (3,009) (3,568) Total equity-based compensation expense, net of tax $ 4,392 $ 5,588 $ 6,927

PREMIERE GLOBAL SERVICES, INC. AND SUBSIDIARIES NOTES TO CONSOLIDATED FINANCIAL STATEMENTS
57
Restricted Stock
The fair value of restricted stock awards is the market value of the stock on the date of grant. The effect of vesting conditions that apply only during the requisite service period is reflected by recognizing compensation cost only for the restricted stock awards for which the requisite service is rendered. As a result, we are required to estimate an expected forfeiture rate, as well as the probability that performance conditions that affect the vesting of certain stock-based awards will be achieved, and only recognize expense for those shares expected to vest. We estimate that forfeiture rate based on historical experience of our stock-based awards that are granted, exercised and cancelled. If our actual forfeiture rate is materially different from our estimate, the stock-based compensation expense could be significantly different from what we have recorded in the current period. Our estimated forfeiture rate for restricted stock awards is 3.0%.
The following table summarizes the activity of our unvested restricted stock awards under our stock plans for the year ended December 31, 2011:
Shares
Weighted-average
grant date fair value
Unvested at December 31, 2010 1,474,834 $ 8.74 Granted 1,071,670 7.92 Vested/released (730,784) 8.92 Forfeited (72,800) 9.32 Unvested at December 31, 2011 1,742,920 $ 8.14
The weighted-average grant date fair value of restricted stock awards granted during the years ended December 31, 2011, 2010 and 2009, was $7.92, $7.50 and $9.70, respectively. The aggregate fair value of restricted stock vested during the years ended December 31, 2011, 2010 and 2009, was $5.5 million, $6.8 million and $9.0 million, respectively. As of December 31, 2011, we had $10.8 million of unvested restricted stock, which we will record in our consolidated statements of operations over a weighted-average recognition period of approximately two years. Stock Options
The fair value of stock options is estimated at the date of grant with the Black-Scholes option pricing model using various assumptions such as expected life, volatility, risk-free interest rate, dividend yield and forfeiture rates. The expected life of stock-based awards granted represents the period of time that they are expected to be outstanding and is estimated using historical data. Using the Black-Scholes option valuation model, we estimate the volatility of our common stock at the date of grant based on the historical volatility of our common stock. We base the risk-free interest rate used in the Black-Scholes option valuation model on the implied yield currently available on U.S. Treasury zero-coupon issues with an equivalent remaining term equal to the expected life of the award. We have not paid any cash dividends on our common stock, and we do not anticipate paying any cash dividends in the foreseeable future. Consequently, we used an expected dividend yield of zero in the Black-Scholes option valuation model. Finally, we use historical data to estimate pre-vesting option forfeitures. Stock-based compensation is recorded for only those awards that are expected to vest. No stock options have been issued since the year ended December 31, 2005.
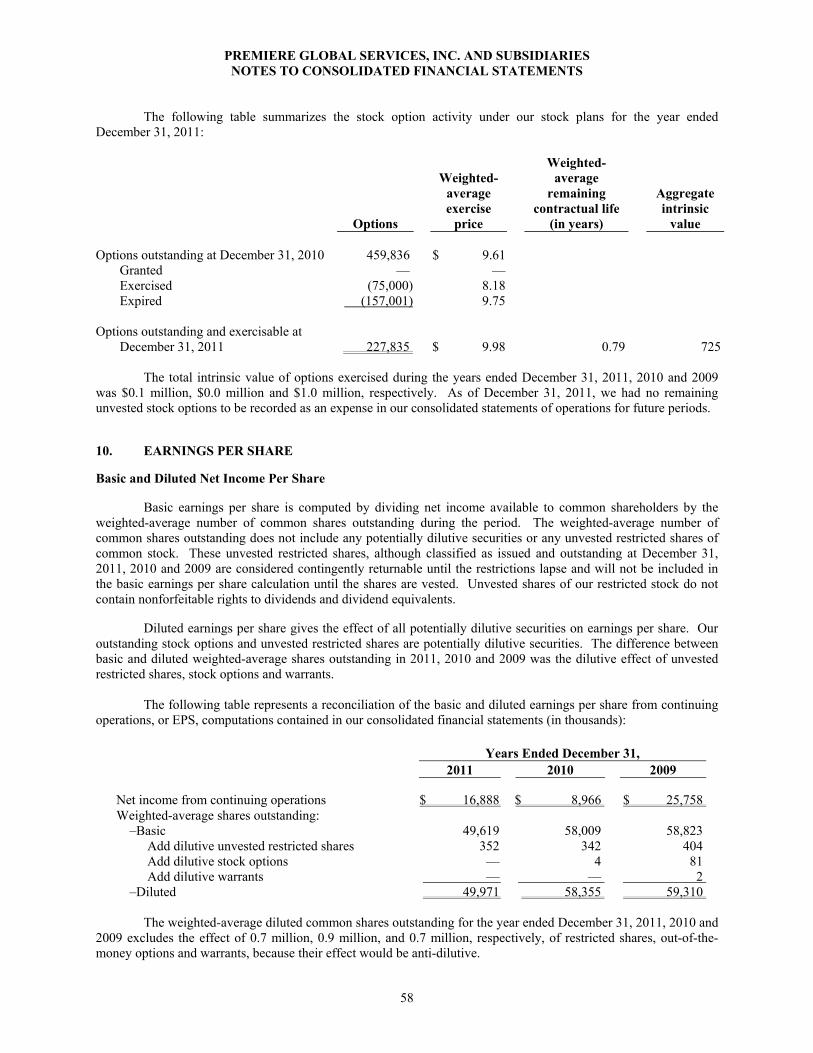
PREMIERE GLOBAL SERVICES, INC. AND SUBSIDIARIES NOTES TO CONSOLIDATED FINANCIAL STATEMENTS
58
The following table summarizes the stock option activity under our stock plans for the year ended December 31, 2011:
Options
Weighted-
average exercise
price
Weighted-average
remaining contractual life
(in years)
Aggregate intrinsic
value Options outstanding at December 31, 2010 459,836 $ 9.61 Granted — — Exercised (75,000) 8.18 Expired (157,001) 9.75 Options outstanding and exercisable at
December 31, 2011 227,835
$ 9.98
0.79
725 The total intrinsic value of options exercised during the years ended December 31, 2011, 2010 and 2009
was $0.1 million, $0.0 million and $1.0 million, respectively. As of December 31, 2011, we had no remaining unvested stock options to be recorded as an expense in our consolidated statements of operations for future periods. 10. EARNINGS PER SHARE Basic and Diluted Net Income Per Share
Basic earnings per share is computed by dividing net income available to common shareholders by the weighted-average number of common shares outstanding during the period. The weighted-average number of common shares outstanding does not include any potentially dilutive securities or any unvested restricted shares of common stock. These unvested restricted shares, although classified as issued and outstanding at December 31, 2011, 2010 and 2009 are considered contingently returnable until the restrictions lapse and will not be included in the basic earnings per share calculation until the shares are vested. Unvested shares of our restricted stock do not contain nonforfeitable rights to dividends and dividend equivalents.
Diluted earnings per share gives the effect of all potentially dilutive securities on earnings per share. Our outstanding stock options and unvested restricted shares are potentially dilutive securities. The difference between basic and diluted weighted-average shares outstanding in 2011, 2010 and 2009 was the dilutive effect of unvested restricted shares, stock options and warrants.
The following table represents a reconciliation of the basic and diluted earnings per share from continuing operations, or EPS, computations contained in our consolidated financial statements (in thousands):
Years Ended December 31,
2011 2010 2009
Net income from continuing operations $ 16,888 $ 8,966 $ 25,758 Weighted-average shares outstanding:
–Basic 49,619 58,009 58,823 Add dilutive unvested restricted shares 352 342 404 Add dilutive stock options — 4 81 Add dilutive warrants — — 2
–Diluted 49,971 58,355 59,310
The weighted-average diluted common shares outstanding for the year ended December 31, 2011, 2010 and 2009 excludes the effect of 0.7 million, 0.9 million, and 0.7 million, respectively, of restricted shares, out-of-the-money options and warrants, because their effect would be anti-dilutive.

PREMIERE GLOBAL SERVICES, INC. AND SUBSIDIARIES NOTES TO CONSOLIDATED FINANCIAL STATEMENTS
59
11. PREPAID EXPENSES AND OTHER CURRENT ASSETS AND ACCRUED EXPENSES Prepaid Expenses and Other Current Assets
Prepaid expenses and other current assets at December 31, 2011 and 2010 are as follows (in thousands): 2011 2010 Prepaid expenses $ 2,482 $ 5,288 Due from EasyLink 233 3,607 Account receivable, other 433 3,218 Prepaid direct costs 5,060 2,506 Rebates receivable 587 1,721 Prepaid software license 833 870 Prepaid software and hardware maintenance cost 937 828 Other 3,341 1,903 $ 13,906 $ 19,941 Accrued Expenses
Accrued expenses at December 31, 2011 and 2010 are as follows (in thousands):
2011
2010
Accrued wages and wage related taxes $ 9,047 $ 9,214 Accrued sales commissions 4,357 4,236 Employee benefits 945 935 Accrued professional fees 1,768 2,343 Deferred revenue 8,218 4,873 Due to EasyLink 457 2,633 Deferred rent 1,497 1,356 Other 2,710 1,995 $ 28,999 $ 27,585 Excise and Sales Tax
Some of our solutions may be subject to telecommunications excise tax and sales taxes in states where we
have not collected and remitted such taxes from our customers. During the years ended December 31, 2011 and 2010, we paid $0.3 million and $5.6 million, respectively, of tax and interest related to the settlement of these state excise and sales tax contingencies.
We have reserves for certain state excise and sales tax contingencies based on the likelihood of obligation.
These contingencies are included in “Accrued taxes, other than income taxes” in our consolidated balance sheets. At December 31, 2011 and December 31, 2010, we had reserved $1.7 million and $1.3 million, respectively, for certain state excise and sales tax contingencies and interest. We believe we have appropriately accrued for these contingencies. In the event that actual results differ from these reserves, we may need to make adjustments, which could materially impact our financial condition and results of operations. In addition, states may disagree with our method of assessing and remitting such taxes or additional states may subject us to inquiries regarding such taxes.
12. FAIR VALUE MEASUREMENTS
The fair value amounts for cash and equivalents, accounts receivable, net, accounts payable and accrued expenses approximate carrying amounts due to the short maturities of these instruments. The estimated fair value of our long-term debt and capital lease obligations at December 31, 2011 and December 31, 2010 was based on

PREMIERE GLOBAL SERVICES, INC. AND SUBSIDIARIES NOTES TO CONSOLIDATED FINANCIAL STATEMENTS
60
expected future payments discounted using current interest rates offered to us on debt of the same remaining maturity and characteristics, including credit quality, and did not vary materially from carrying value.
Fair value is defined as an exit price representing the amount that would be received to sell an asset or paid to transfer a liability at the measurement date in an orderly transaction between market participants. As such, fair value is a market-based measurement that should be determined based on assumptions that market participants would use in pricing an asset or liability. ASC 820, “Fair Value Measurements and Disclosures,” establishes a three-tier fair value hierarchy as a basis for such assumptions which prioritizes the inputs used in measuring fair value as follows:
• Level 1 – Quoted prices in active markets for identical assets or liabilities;
• Level 2 – Inputs other than quoted prices included within Level 1 that are observable for the asset or
liability, either directly or indirectly; and
• Level 3 – Unobservable inputs for the asset or liability in which there is little or no market data. Recurring Fair Value Measurement
For the years ended December 31, 2011 and 2010, we have no assets and liabilities that are recorded at fair value on a recurring basis. As of December 31, 2010, our interest rate swaps have all expired, and no balance is carried on our consolidated balance sheet.
Non-recurring Fair Value Measurement
We are required to record certain assets and liabilities at fair value on a nonrecurring basis. Generally, assets and liabilities recorded at fair value on a nonrecurring basis are the result of impairment charges.
During the year ended December 31, 2010, we measured certain non-financial assets at fair value due to impairment made necessary by market conditions. The following table depicts the non-recurring fair value measurements discussed below by asset category and the level within the fair value hierarchy in which the related assumptions were derived (in thousands):
December 31, 2010 Fair
Value Level 1 Level 2 Level 3 Total
Losses Land, building and improvements $ 1,893 $ — $ 1,893 $ — $ 322
Total $ 1,893 $ — $ 1,893 $ — $ 322
During the year ended December 31, 2010, we wrote down one of our facilities in Europe with a carrying amount of $2.2 million, including land, building and improvements, to its fair value of $1.9 million, based on quoted prices for similar assets in the market. 13. DERIVATIVE INSTRUMENTS
We have used derivative instruments from time to time to manage risks related to interest rates. During the years ended December 31, 2010 and 2009, our derivative instruments were limited to interest rate swaps. We are exposed to one-month LIBOR interest rate risk on our credit facility. In August 2007, we entered into two $100.0 million pay fixed, receive floating interest rate swaps to hedge the variability in our cash flows associated with changes in one-month LIBOR interest rates. One of these interest rate swaps expired in August 2009 and the other expired in August 2010, so there is no associated asset or liability on our consolidated balance sheet as of December 31, 2011 or 2010.

PREMIERE GLOBAL SERVICES, INC. AND SUBSIDIARIES NOTES TO CONSOLIDATED FINANCIAL STATEMENTS
61
Cash-Flow Hedges
For a derivative instrument designated as a cash-flow hedge, the effective portion of the derivative’s gain (loss) is initially reported as a component of other comprehensive income and is subsequently recognized in earnings in the same period or periods during which the hedged exposure is recognized in earnings. Gains and losses on the derivative representing hedge ineffectiveness are recognized in current earnings. Monthly settlements with the counterparties are recognized in the same line item, “Interest expense,” as the interest costs associated with our credit facility. Accordingly, cash settlements are included in operating cash flows and were $0.0 million, $3.0 million and $7.5 million for the years ended December 31, 2011, 2010 and 2009, respectively. Concurrent with the refinancing of our credit facility in May 2010, we dedesignated the cash flow hedge associated with our remaining interest rate swap, which expired in August 2010.
During the years ended December 31, 2011, 2010 and 2009, we recognized the following gains and interest expense related to interest rate swaps (in thousands): 2011 2010 2009 Effective portion: Gain recognized in other comprehensive income, net of tax
effect of $0.0 million, $0.5 million and $0.8 million in 2011, 2010 and 2009, respectively $ —
$ 1,009
$ 1,574 Ineffective portion: Unrealized gain on change in fair value of interest rate swaps recognized in other expense $ —
$ 1,228
$ 3,366
Interest expense related to monthly cash settlements: Interest expense $ — $ (2,828) $ (7,323)
For further disclosure on our policy for accounting for derivatives and hedges, see Note 8.
14. EMPLOYEE BENEFIT PLANS
We sponsor a defined contribution plan covering substantially all of our U.S. employees. We also sponsor similar voluntary contribution arrangements for certain of our employees outside the United States that meet applicable eligibility requirements. Although we may make discretionary contributions for the benefit of employees under these plans, such matching contributions were suspended for the entire years ended December 31, 2011 and 2010 and the last nine months of the year ended December 31, 2009. In 2011, 2010 and 2009, amounts expensed related to these plans were approximately $2.0 million, $1.9 million and $2.4 million, respectively. 15. RELATED-PARTY TRANSACTIONS Notes receivable, shareholder
We made loans in prior years to our chief executive officer and to a limited partnership in which he has an indirect interest, pursuant to extensions of credit agreed to by us prior to July 30, 2002. These loans were made pursuant to his then current employment agreement for the exercise price of certain stock options and the taxes related thereto. Each of these loans was evidenced by a recourse promissory note bearing interest at the applicable federal rate and secured by the common stock purchased. These loans matured on October 31, 2010. As of December 31, 2010, all of these loans have been paid off.
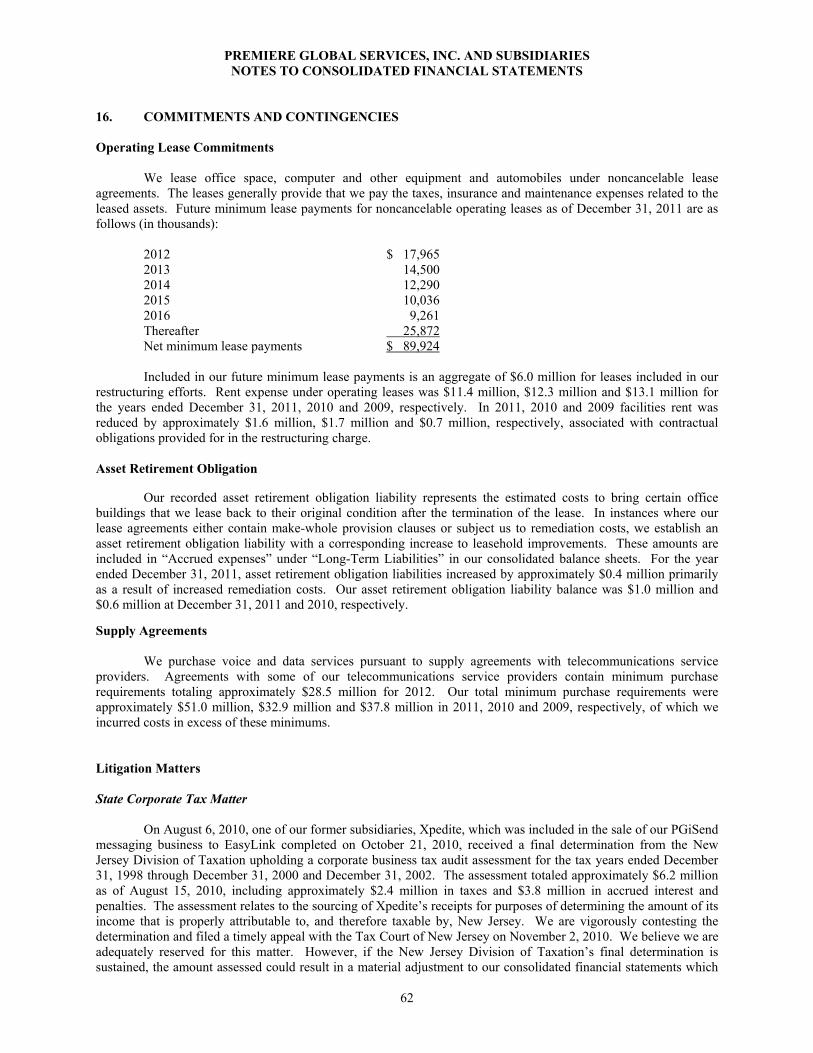
PREMIERE GLOBAL SERVICES, INC. AND SUBSIDIARIES NOTES TO CONSOLIDATED FINANCIAL STATEMENTS
62
16. COMMITMENTS AND CONTINGENCIES Operating Lease Commitments
We lease office space, computer and other equipment and automobiles under noncancelable lease agreements. The leases generally provide that we pay the taxes, insurance and maintenance expenses related to the leased assets. Future minimum lease payments for noncancelable operating leases as of December 31, 2011 are as follows (in thousands):
2012 $ 17,965 2013 14,500 2014 12,290 2015 10,036 2016 9,261 Thereafter 25,872 Net minimum lease payments $ 89,924
Included in our future minimum lease payments is an aggregate of $6.0 million for leases included in our
restructuring efforts. Rent expense under operating leases was $11.4 million, $12.3 million and $13.1 million for the years ended December 31, 2011, 2010 and 2009, respectively. In 2011, 2010 and 2009 facilities rent was reduced by approximately $1.6 million, $1.7 million and $0.7 million, respectively, associated with contractual obligations provided for in the restructuring charge. Asset Retirement Obligation
Our recorded asset retirement obligation liability represents the estimated costs to bring certain office buildings that we lease back to their original condition after the termination of the lease. In instances where our lease agreements either contain make-whole provision clauses or subject us to remediation costs, we establish an asset retirement obligation liability with a corresponding increase to leasehold improvements. These amounts are included in “Accrued expenses” under “Long-Term Liabilities” in our consolidated balance sheets. For the year ended December 31, 2011, asset retirement obligation liabilities increased by approximately $0.4 million primarily as a result of increased remediation costs. Our asset retirement obligation liability balance was $1.0 million and $0.6 million at December 31, 2011 and 2010, respectively.
Supply Agreements
We purchase voice and data services pursuant to supply agreements with telecommunications service providers. Agreements with some of our telecommunications service providers contain minimum purchase requirements totaling approximately $28.5 million for 2012. Our total minimum purchase requirements were approximately $51.0 million, $32.9 million and $37.8 million in 2011, 2010 and 2009, respectively, of which we incurred costs in excess of these minimums. Litigation Matters State Corporate Tax Matter
On August 6, 2010, one of our former subsidiaries, Xpedite, which was included in the sale of our PGiSend messaging business to EasyLink completed on October 21, 2010, received a final determination from the New Jersey Division of Taxation upholding a corporate business tax audit assessment for the tax years ended December 31, 1998 through December 31, 2000 and December 31, 2002. The assessment totaled approximately $6.2 million as of August 15, 2010, including approximately $2.4 million in taxes and $3.8 million in accrued interest and penalties. The assessment relates to the sourcing of Xpedite’s receipts for purposes of determining the amount of its income that is properly attributable to, and therefore taxable by, New Jersey. We are vigorously contesting the determination and filed a timely appeal with the Tax Court of New Jersey on November 2, 2010. We believe we are adequately reserved for this matter. However, if the New Jersey Division of Taxation’s final determination is sustained, the amount assessed could result in a material adjustment to our consolidated financial statements which

PREMIERE GLOBAL SERVICES, INC. AND SUBSIDIARIES NOTES TO CONSOLIDATED FINANCIAL STATEMENTS
63
would impact our financial condition and results of operations. We agreed to indemnify EasyLink for this matter in connection with our PGiSend sale. Other Litigation and Claims
We are involved in other litigation matters and are subject to claims that we do not believe will have a material adverse effect upon our business, financial condition or results of operations, although we can offer no assurance as to the ultimate outcome of any such matters. 17. CONSOLIDATED STATEMENT OF CASH FLOWS INFORMATION Supplemental disclosures of cash flow information are as follows (in thousands):
2011 2010 2009
Cash paid for interest $ 6,784 $ 7,691 $ 10,492Income tax payments $ 6,898 $ 11,445 $ 17,382Income tax refunds $ 1,613 $ 2,627 $ 7,615Capital lease additions $ 1,081 $ 4,086 $ 10,913Capitalized interest $ 210 $ 382 $ 165
At December 31, 2011, 2010 and 2009, we had capital expenditures in total current liabilities of $3.5
million, $6.1 and $4.6 million, respectively.
In December 2011, we amended our existing credit facility to increase capacity, extend the term and lower pricing. The amended facility consists of a $250.0 million revolver, a $50.0 million Term A loan and an uncommitted $75.0 million accordion feature. We paid $1.5 million in cash for certain fees and expenses related to the amendment.
In October 2010, we closed the sale of our PGiSend business for $105.0 million in cash. We received
$55.9 million of the cash, while $49.1 million went directly to the respective banks in our syndicated credit facility to pay down the principal and interest outstanding on our Term A loan. Therefore, the retirement of our Term A loan in 2010 (prior to amending our credit facility in 2011) was a non-cash transaction.
In May 2010, we refinanced our prior existing credit facility by entering into a new four-year $325.0
million credit facility, which consisted of a $275.0 million revolver and a $50.0 million Term A loan. We used the initial borrowings of $230.4 million under the new credit facility and $50.0 million of proceeds from the Term A loan to satisfy $268.0 million of outstanding borrowings under the prior credit facility, $2.8 million of certain transaction fees and closing costs and $0.4 million of interest expense related to the prior credit facility, all of which were non-cash transactions. The residual $9.2 million was received in cash. We paid an additional $1.2 million in cash for certain fees and expenses related to the transaction. 18. INCOME TAXES
The components of income (loss) from continuing operations before expense (benefit) for income taxes for 2011, 2010 and 2009 are as follows (in thousands): 2011 2010 2009 United States $ 1,633 $ (12,510) $ 18,130 Foreign 23,841 23,016 20,028 Total $ 25,474 $ 10,506 $ 38,158

PREMIERE GLOBAL SERVICES, INC. AND SUBSIDIARIES NOTES TO CONSOLIDATED FINANCIAL STATEMENTS
64
Income tax expense (benefit) from continuing operations for 2011, 2010 and 2009 is as follows (in thousands): 2011 2010 2009 Current: Federal $ (810) $ (458) $ 5,265 State 984 229 124 International 5,598 5,217 5,831 Total current 5,772 4,988 11,220 Deferred: Federal 2,515 (2,798) 3,689 State 1,575 (1,000) 184 International (1,276) 350 (2,693) Total deferred 2,814 (3,448) 1,180 Income tax expense $ 8,586 $ 1,540 $ 12,400
The difference between the statutory federal income tax rate and our effective income tax rate applied to income before income taxes from continuing operations for 2011, 2010 and 2009 is as follows (in thousands):
2011 2010 2009
Federal rate $ 8,917 $ 3,677 $ 13,356 State taxes, net of federal benefit 2,205 (490) 472 Foreign taxes (4,582) (827) (2,282)Change in valuation allowance 97 115 423 Research and development credits 117 (600) (600)Non-deductible employee compensation 395 878 1,410 Deferred true-up 873 — — Other, net 263 (274) (371)Uncertain tax matters 301 (939) (8) Income taxes at our effective rate $ 8,586 $ 1,540 $ 12,400
The deferred true-up was made to correct the tax bases of certain assets that should have been amortized in prior periods.
Excess tax (deficiencies) benefits of approximately ($0.5) million, ($0.6) million, and $1.6 million in 2011,
2010 and 2009, respectively, are associated with restricted stock award releases and non-qualified stock option exercises, the impact of which was recorded directly to additional paid-in capital.

PREMIERE GLOBAL SERVICES, INC. AND SUBSIDIARIES NOTES TO CONSOLIDATED FINANCIAL STATEMENTS
65
Differences between the financial accounting and tax basis of assets and liabilities giving rise to deferred tax assets and liabilities are as follows at December 31, 2011 and 2010 (in thousands): 2011 2010 Deferred tax assets: Net operating loss carryforwards $ 24,259 $ 19,110 Capital loss carryforwards 15,425 25,622 Restructuring costs 1,105 2,286 Accrued expenses 2,165 3,285 Other assets 4,285 — Other tax credits 8,543 5,426 Gross deferred tax assets 55,782 55,729 Valuation allowance (24,145) (33,665) Total deferred tax assets 31,637 22,064 Deferred tax liabilities: Property and equipment (18,101) (22,708) Intangible assets (9,381) (2,199) Other liabilities (1,760) (201) Total deferred tax liabilities (29,242) (25,108)
Deferred income taxes, net $ 2,395 $ (3,044)
At December 31, 2011, we had federal income tax net operating loss carryforwards of approximately $41.8
million expiring in 2012 through 2030. The utilization of some of our net operating losses is subject to Internal Revenue Code of 1986, as amended, Section 382 limitations related to one of our previous acquisitions. We had federal capital loss carryforwards of approximately $42.6 million expiring in 2014 and 2015. We also had foreign income tax net operating loss carryforwards of approximately $9.7 million, some of which have expiration years beginning in 2015 and some of which are unlimited. If certain substantial changes to our ownership occur, there could be additional annual limitations on the amount of the carryforwards that can be utilized.
The undistributed earnings of our foreign subsidiaries are not subject to U.S. federal and state income taxes
unless such earnings are distributed in the form of dividends or otherwise to the extent of current and accumulated earnings and profits. Upon distribution, we would be subject to both U.S. income taxes, net of foreign tax credits, and withholding taxes payable to the various foreign countries. The undistributed earnings of our foreign subsidiaries are permanently reinvested to the extent the earnings cannot be distributed free of U.S. income taxes or are not subject to a loan payable held by the foreign subsidiary to a U.S. affiliate. The undistributed earnings of our foreign subsidiaries that are considered permanently reinvested and have not been remitted to the United States totaled $71.4 million and $73.2 million as of December 31, 2011 and 2010, respectively. We made the determination of permanent reinvestment on the basis of sufficient evidence that demonstrates that we will invest the undistributed earnings overseas indefinitely for use in working capital as well as foreign acquisitions and expansion. The determination of the amount of the unrecognized deferred U.S. income tax liability related to the undistributed earnings is not practicable; however, unrecognized foreign income tax credits would be available to reduce a portion of this liability.
A reconciliation of unrecognized tax benefits at the beginning and end of the years presented is as follows
(in thousands):
2011 2010 2009
Balance at January 1, $ 3,719 $ 5,707 $ 5,391 Additions for tax positions for the current year 91 478 213 Additions for tax positions for prior years 1,186 249 128 Reductions for tax positions for prior years (230) (948) (73)Settlements with taxing authorities (1,200) (141) (30)Expiration of the statute of limitations (119) (1,626) 78 Balance at December 31, $ 3,447 $ 3,719 $ 5,707

PREMIERE GLOBAL SERVICES, INC. AND SUBSIDIARIES NOTES TO CONSOLIDATED FINANCIAL STATEMENTS
66
Upon resolution, unrecognized tax benefits of $2.5 million and $2.3 million as of December 31, 2011 and
2010, respectively, would affect our annual effective tax rate. The unrecognized tax benefits at December 31, 2011 are included in “Other assets,” and “Accrued expenses” under “Long-Term Liabilities” in our consolidated balance sheets. We do not anticipate any significant changes in unrecognized tax benefits over the next 12 months.
We recognize interest and penalties related to uncertain tax positions in “Interest expense” and “Operating
expenses,” respectively, in our consolidated statements of operations. During the years ended December 31, 2011, 2010 and 2009, we recognized interest and penalties expense (benefit) of $0.8 million, ($0.1) million, and ($0.1) million, respectively. As of December 31, 2011 and 2010, we had accrued interest and penalties of approximately $2.4 million and $1.6 million, respectively, related to uncertain tax positions. As interest and penalties are classified as “Interest expense” and “Operating expenses,” respectively, the accrual or recognition of interest and penalties from the associated uncertain tax positions will not affect our annual effective tax rate.
In the normal course of business, we are subject to inquiries and routine income tax audits from U.S. and
non-U.S. tax authorities with respect to income taxes. In major tax jurisdictions, tax years 2000 to 2011 remain subject to income tax examinations by tax authorities. These inquiries may result in adjustments to the timing or amount of taxable income and deductions or the allocation of income among tax jurisdictions.
An analysis of our deferred tax asset valuation allowances is as follows (in thousands): Balance as of December 31, 2008, $ 12,631
Additions 4,526 Deductions —
Balance as of December 31, 2009, 17,157 Additions 17,699 Deductions (1,191)
Balance as of December 31, 2010 33,665 Additions — Deductions (9,520)
Balance at December 31, 2011 $ 24,145 Our valuation allowance at December 31, 2011 primarily relates to certain foreign and state net operating
loss and capital loss carryforwards that, in the opinion of management, are more likely than not to expire unutilized. During the year ended December 31, 2011, our valuation allowance decreased by approximately $9.5 million primarily as a result of a change in purchase price allocation that effected capital loss carryforwards related to our PGiSend sale.
During the year ended December 31, 2010, our valuation allowance increased by approximately $16.5 million, primarily as a result of an increase in the valuation reserves placed on the capital loss carryforwards related to our PGiSend sale.
During the year ended December 31, 2009, our valuation allowance increased by approximately $4.5 million, primarily as a result of establishing an accounting valuation allowance against deferred tax assets for certain foreign subsidiaries.

PREMIERE GLOBAL SERVICES, INC. AND SUBSIDIARIES NOTES TO CONSOLIDATED FINANCIAL STATEMENTS
67
19. SEGMENT REPORTING
We manage our operations on a geographic regional basis, with segments in North America, Europe and Asia Pacific. The accounting policies as described in the summary of significant accounting policies are applied consistently across our segments. Our North America segment is primarily comprised of operations in the United States and Canada. We present “Operating income” for each of our segments as a measure of segment profit. Our chief operating decision makers use operating income internally as a means of analyzing segment performance and believe that it more clearly represents our segment profit without the impact of income taxes and other non-operating items. The sum of these regional results may not agree to the consolidated results due to rounding. Information concerning our continuing operations in our segments is as follows (in thousands): Operating Segments North
America
Europe Asia
Pacific
Consolidated Year ended December 31, 2011: Statements of operations: Net revenues $ 316,231 $ 97,986 $ 59,617 $ 473,834 Depreciation 25,933 2,949 1,949 30,831 Amortization 4,465 1,640 260 6,365 Asset impairments 440 16 — 456 Interest (expense) income (9,860) 44 (138) (9,954) Interest income 1 28 17 46 Income tax expense (benefit) 8,340 3,121 (2,875) 8,586 Operating income 1,849 26,739 7,368 35,956 Balance sheets: Intangibles, net of amortization 9,633 1,273 — 10,906 Property and equipment, net 87,745 10,041 5,663 103,449 Total assets 379,882 120,787 42,152 542,821 Expenditures for long-lived assets: Capital expenditures 24,304 2,846 2,950 30,100 Business acquisitions, net of cash acquired (1,282) — — (1,282) Business disposition 1,902 — — 1,902 Year ended December 31, 2010: Statements of operations: Net revenues $ 303,906 $ 85,342 $ 52,505 $ 441,753 Depreciation 22,040 2,375 1,565 25,980 Amortization 5,552 1,560 274 7,386 Asset impairments 175 115 — 290 Interest (expense) income (10,735) 113 (163) (10,785) Interest income 89 46 22 157 Income tax (benefit) expense (4,186) 1,504 4,222 1,540 Operating (loss) income (4,369) 20,318 5,032 20,981 Balance sheets: Intangibles, net of amortization 13,823 2,888 256 16,967 Property and equipment, net 93,158 9,413 4,667 107,238 Total assets 451,690 56,135 33,832 541,657 Expenditures for long-lived assets: Capital expenditures 28,862 2,629 1,377 32,868 Business acquisitions, net of cash acquired 572 19 — 591 Business disposition 45,174 6,107 — 51,281

PREMIERE GLOBAL SERVICES, INC. AND SUBSIDIARIES NOTES TO CONSOLIDATED FINANCIAL STATEMENTS
68
Operating Segments (continued) North
America
Europe Asia
Pacific
Consolidated Year ended December 31, 2009: Statements of operations: Net revenues $ 313,860 $ 86,735 $ 53,367 $ 453,962 Depreciation 18,840 1,908 1,411 22,159 Amortization 8,648 1,633 236 10,517 Asset impairments 684 — — 684 Interest expense (11,194) (5) (109) (11,308) Interest income 111 63 245 419 Income tax expense 10,764 55 1,581 12,400 Operating income 15,885 19,306 10,179 45,370 Balance sheets: Intangibles, net of amortization 19,558 4,787 495 24,840 Property and equipment, net 118,253 12,085 6,897 137,235 Total assets 520,590 103,464 57,485 681,539 Expenditures for long-lived assets: Capital expenditures 23,824 1,510 1,522 26,856 Business acquisitions, net of cash acquired 8,201 220 — 8,421 Business dispositions 1,000 — — 1,000 20. SUBSEQUENT EVENTS In March 2012 through the filing of this annual report, we repurchased an aggregate of 113,600 shares of our common stock in the open market pursuant to our board-approved stock repurchase program for approximately $1.0 million.

69
SELECTED QUARTERLY FINANCIAL DATA
The following table presents certain unaudited quarterly consolidated statement of operations data from continuing operations for each of the eight quarters in the periods ended December 31, 2011 and 2010. The information has been derived from our unaudited financial statements, which have been prepared on substantially the same basis as the audited consolidated financial statements contained in this annual report. We have presented quarterly earnings per share numbers as reported in our earnings releases with amounts related to our discontinued businesses reclassified as discontinued operations. The sum of these quarterly results may differ from annual results due to rounding and the impact of the difference in the weighted shares outstanding for the stand-alone periods. The results of operations for any quarter are not necessarily indicative of the results to be expected for any future period.
First
Quarter Second Quarter
Third Quarter
Fourth Quarter
Total
(Unaudited in thousands, except per share data) Year Ended December 31, 2011 Net revenues $ 116,925 $ 118,990 $ 119,184 $ 118,735 $ 473,834 Cost of revenue 47,342 49,315 49,938 49,227 195,822 Gross profit 69,583 69,675 69,246 69,508 278,012 Operating income 7,039 9,028 9,911 9,978 35,956 Income from continuing operations 2,932 4,853 5,822 3,281 16,888 Income (loss) on discontinued operations (31) 36 6,735 (2,194) 4,546 Net income $ 2,901 $ 4,889 $ 12,557 $ 1,087 $ 21,434 Basic net income (loss) per share: Continuing operations $ 0.06 $ 0.10 $ 0.12 $ 0.07 $ 0.34 Discontinued operations 0.00 0.00 0.14 (0.05) 0.09 Net income per share $ 0.06 $ 0.10 $ 0.26 $ 0.02 $ 0.43 Diluted net income (loss) per share: Continuing operations $ 0.06 $ 0.10 $ 0.12 $ 0.07 $ 0.34 Discontinued operations 0.00 0.00 0.14 (0.04) 0.09 Net income per share $ 0.06 $ 0.10 $ 0.25 $ 0.02 $ 0.43
First
Quarter Second Quarter
Third Quarter
Fourth Quarter
Total
(Unaudited in thousands, except per share data) Year Ended December 31, 2010 Net revenues $ 112,495 $ 110,937 $ 109,497 $ 108,824 $ 441,753 Cost of Revenue 44,075 45,356 44,834 44,434 178,699 Gross profit 68,420 65,581 64,663 64,390 263,054 Operating income 8,072 8,235 4,607 67 20,981 Income (loss) from continuing operations 4,879 3,890 1,022 (825) 8,966 Income (loss) on discontinued operations 2,693 510 2,788 (10,126) (4,135) Net income (loss) $ 7,572 $ 4,400 $ 3,810 $ (10,951) $ 4,831 Basic net income (loss) per share: Continuing operations $ 0.08 $ 0.07 $ 0.02 $ (0.01) $ 0.15 Discontinued operations 0.05 0.01 0.05 (0.18) (0.07) Net income (loss) per share $ 0.13 $ 0.08 $ 0.07 $ (0.19) $ 0.08 Diluted net income (loss) per share: Continuing operations $ 0.08 $ 0.07 $ 0.02 $ (0.01) $ 0.15 Discontinued operations 0.05 0.01 0.05 (0.18) (0.07) Net income (loss) per share $ 0.13 $ 0.07 $ 0.06 $ (0.19) $ 0.08

70
Item 9. Changes in and Disagreements with Accountants on Accounting and Financial Disclosure
Not applicable. Item 9A. Controls and Procedures Disclosure Controls and Procedures
Our management has evaluated, under the supervision and with the participation of our principal executive officer and principal financial officer, the effectiveness of our disclosure controls and procedures as of December 31, 2011. Based on this evaluation, our principal executive officer and principal financial officer concluded that, as of December 31, 2011, our disclosure controls and procedures (as defined in Rules 13a-15(e) and 15d-15(e) under the Exchange Act), were effective and designed to ensure that (a) information required to be disclosed in our reports filed under the Exchange Act is recorded, processed, summarized, and reported within the time periods specified in the SEC's rules and instructions, and (b) information is accumulated and communicated to our management, including our principal executive officer and principal financial officer, as appropriate to allow timely decisions regarding required disclosures. Management’s Report on Internal Control Over Financial Reporting
Our management is responsible for establishing and maintaining adequate internal control over financial reporting, as such term is defined in Exchange Act Rules 13a-15(f)/15d-15(f). Under the supervision and with the participation of our management, including our principal executive officer and principal financial officer, we conducted an evaluation of the effectiveness of our internal control over financial reporting based on the framework in Internal Control – Integrated Framework issued by the Committee of Sponsoring Organizations of the Treadway Commission. Based on our evaluation under the framework in Internal Control – Integrated Framework, our management concluded that our internal control over financial reporting was effective as of December 31, 2011. The effectiveness of our internal control over financial reporting as of December 31, 2011 has been audited by Ernst & Young LLP, an independent registered public accounting firm, as stated in their report included on page 71 of this annual report. Changes in Internal Control Over Financial Reporting
There were no changes in our internal control over financial reporting during the quarter ended December 31, 2011 that have materially affected, or are reasonably likely to materially affect, our internal control over financial reporting.

71
Report of Independent Registered Public Accounting Firm on Internal Control over Financial Reporting
The Board of Directors and Shareholders of Premiere Global Services, Inc. We have audited Premiere Global Services, Inc. and subsidiaries’ internal control over financial reporting as of December 31, 2011, based on criteria established in Internal Control—Integrated Framework issued by the Committee of Sponsoring Organizations of the Treadway Commission (the COSO criteria). Premiere Global Services, Inc. and subsidiaries’ management is responsible for maintaining effective internal control over financial reporting, and for its assessment of the effectiveness of internal control over financial reporting included in Management’s Report on Internal Control Over Financial Reporting appearing under Item 9A. Our responsibility is to express an opinion on the company’s internal control over financial reporting based on our audit. We conducted our audit in accordance with the standards of the Public Company Accounting Oversight Board (United States). Those standards require that we plan and perform the audit to obtain reasonable assurance about whether effective internal control over financial reporting was maintained in all material respects. Our audit included obtaining an understanding of internal control over financial reporting, assessing the risk that a material weakness exists, testing and evaluating the design and operating effectiveness of internal control based on the assessed risk, and performing such other procedures as we considered necessary in the circumstances. We believe that our audit provides a reasonable basis for our opinion. A company’s internal control over financial reporting is a process designed to provide reasonable assurance regarding the reliability of financial reporting and the preparation of financial statements for external purposes in accordance with generally accepted accounting principles. A company’s internal control over financial reporting includes those policies and procedures that (1) pertain to the maintenance of records that, in reasonable detail, accurately and fairly reflect the transactions and dispositions of the assets of the company; (2) provide reasonable assurance that transactions are recorded as necessary to permit preparation of financial statements in accordance with generally accepted accounting principles, and that receipts and expenditures of the company are being made only in accordance with authorizations of management and directors of the company; and (3) provide reasonable assurance regarding prevention or timely detection of unauthorized acquisition, use or disposition of the company’s assets that could have a material effect on the financial statements. Because of its inherent limitations, internal control over financial reporting may not prevent or detect misstatements. Also, projections of any evaluation of effectiveness to future periods are subject to the risk that controls may become inadequate because of changes in conditions, or that the degree of compliance with the policies or procedures may deteriorate. In our opinion, Premiere Global Services, Inc. and subsidiaries’ maintained, in all material respects, effective internal control over financial reporting as of December 31, 2011, based on the COSO criteria. We also have audited, in accordance with the standards of the Public Company Accounting Oversight Board (United States), the consolidated balance sheets of Premiere Global Services, Inc. and subsidiaries’ as of December 31, 2011 and the related consolidated statements of operations, comprehensive income, shareholders’ equity and cash flows for each of the three years in the period ended December 31, 2011 of Premiere Global Services, Inc. and our report dated March 12, 2012 expressed an unqualified opinion thereon.
/s/ Ernst & Young LLP Atlanta, Georgia March 12, 2012
72
Item 9B. Other Information None.
PART III
Certain information required by Part III is omitted from this report and is incorporated by reference to our definitive proxy statement pursuant to Regulation 14A for our 2012 annual meeting of shareholders, which we will file not later than 120 days after the end of the fiscal year covered by this annual report. Item 10. Directors, Executive Officers and Corporate Governance
The information required by this item is incorporated herein by reference to our proxy statement under the headings “Proposal 1: Election of Directors — Information Regarding Nominees and Continuing Directors and Executive Officers,” “Corporate Governance Matters – Audit Committee” and “Section 16(a) Beneficial Ownership Reporting Compliance.”
Our board of directors adopted our Code of Conduct and Ethics that applies to all employees, directors and officers, including our principal executive officer, principal financial officer, principal accounting officer or controller or persons performing similar functions. This code is posted on our website at www.pgi.com (follow the “Investor Relations” tab to “Corporate Governance — Board Committees”). We will satisfy any disclosure requirements under Item 5.05 of Form 8-K regarding an amendment to, or a waiver from, any provision of this code with respect to our principal executive officer, our principal financial officer, principal accounting officer, or controller or persons performing similar functions by disclosing the nature of such amendment or waiver on our website. Item 11. Executive Compensation
The information required by this item is incorporated herein by reference to our proxy statement under the headings “Corporate Governance Matters – Compensation Committee,” “—Compensation Committee Interlocks and Insider Participation,” “—Director Compensation,” “—Director Compensation for the 2012 Fiscal Year,” “Compensation Committee Report,” which shall not be deemed filed in this annual report, “Compensation Discussion and Analysis” and “Executive Compensation.” Item 12. Security Ownership of Certain Beneficial Owners and Management and Related Stockholder Matters
The information required by this item is incorporated herein by reference to our proxy statement under the headings “Security Ownership of Certain Beneficial Owners and Management” and “Equity Compensation Plan Information.” Item 13. Certain Relationships and Related Transactions and Director Independence
The information required by this item is incorporated herein by reference to our proxy statement under the headings “Corporate Governance Matters — Independent Directors,” “—Audit Committee,” “—Compensation Committee,” “—Nominating and Governance Committee” and “Certain Transactions.” Item 14. Principal Accountant Fees and Services
The information required by this item is incorporated herein by reference to our proxy statement under the heading “Audit Matters.”

73
PART IV
Item 15. Exhibits and Financial Statement Schedules 1. Financial Statements
The financial statements listed in the index set forth in Item 8. “Financial Statements and Supplementary Data” of this report are filed as part of this annual report. 2. Financial Statement Schedules
Financial statement schedules of valuation and qualifying accounts are not applicable or the required information is included in our consolidated financial statements or notes thereto. 3. Exhibits
The exhibits filed with this report are listed on the “Exhibit Index” following the signature page of this annual report, which are incorporated herein by reference.

74
SIGNATURES
Pursuant to the requirements of Section 13 or 15(d) of the Securities Exchange Act of 1934, the registrant has duly caused this report to be signed on its behalf by the undersigned, thereunto duly authorized.
Premiere Global Services, Inc. By: /s/ Boland T. Jones
Boland T. Jones, Chairman of the Board and Chief Executive Officer
Date: March 12, 2012
POWER OF ATTORNEY
KNOW BY ALL PERSONS BY THESE PRESENTS, that each person whose signature appears below constitutes and appoints jointly and severally, Boland T. Jones and Scott Askins Leonard, and each one of them, his or her attorneys-in-fact, each with the power of substitution, for him or her in any and all capacities, to sign any and all amendments to this Annual Report on Form 10-K and to file the same, with exhibits thereto and other documents in connection therewith, with the Securities and Exchange Commission, hereby ratifying and confirming all that each said attorneys-in-fact, or his substitute or substitutes, may do or cause to be done by virtue hereof.
Pursuant to the requirements of Section 13 or 15(d) of the Securities Exchange Act of 1934, this annual report has been signed below by the following persons on behalf of the registrant in the capacities and on the dates indicated.
Signature Title Date
/s/ Boland T. Jones Boland T. Jones
Chairman of the Board and Chief Executive Officer (principal executive officer) and Director
March 12, 2012
/s/ David E. Trine
David E. Trine Chief Financial Officer
(principal financial and accounting officer)
March 12, 2012
/s/ Wilkie S. Colyer
Wilkie S. Colyer Director March 12, 2012
/s/ K. Robert Draughon
K. Robert Draughon Director March 8, 2012
/s/ John R. Harris
John R. Harris Director March 12, 2012
/s/ W. Steven Jones
W. Steven Jones Director March 8, 2012
/s/ Raymond H. Pirtle, Jr.
Raymond H. Pirtle, Jr. Director March 12, 2012
/s/ J. Walker Smith, Jr.
J. Walker Smith, Jr. Director March 3, 2012
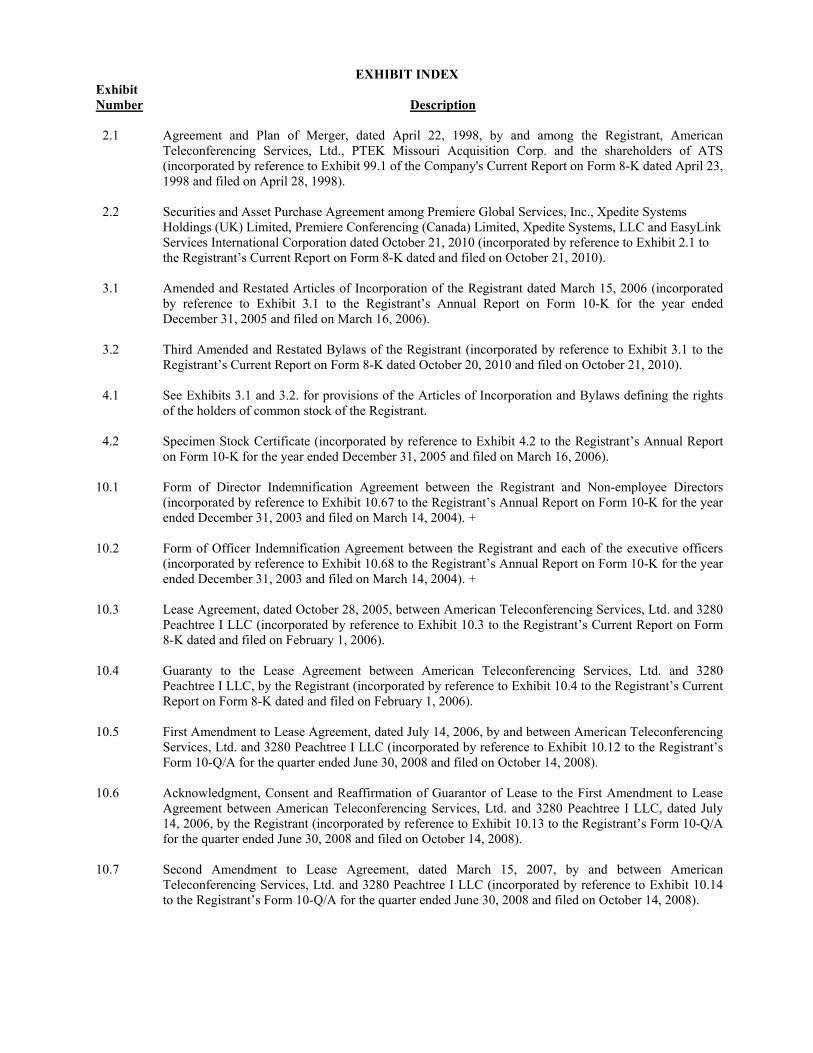
EXHIBIT INDEX Exhibit Number
Description
2.1 Agreement and Plan of Merger, dated April 22, 1998, by and among the Registrant, American
Teleconferencing Services, Ltd., PTEK Missouri Acquisition Corp. and the shareholders of ATS (incorporated by reference to Exhibit 99.1 of the Company's Current Report on Form 8-K dated April 23, 1998 and filed on April 28, 1998).
2.2 Securities and Asset Purchase Agreement among Premiere Global Services, Inc., Xpedite Systems
Holdings (UK) Limited, Premiere Conferencing (Canada) Limited, Xpedite Systems, LLC and EasyLink Services International Corporation dated October 21, 2010 (incorporated by reference to Exhibit 2.1 to the Registrant’s Current Report on Form 8-K dated and filed on October 21, 2010).
3.1 Amended and Restated Articles of Incorporation of the Registrant dated March 15, 2006 (incorporated
by reference to Exhibit 3.1 to the Registrant’s Annual Report on Form 10-K for the year ended December 31, 2005 and filed on March 16, 2006).
3.2 Third Amended and Restated Bylaws of the Registrant (incorporated by reference to Exhibit 3.1 to the
Registrant’s Current Report on Form 8-K dated October 20, 2010 and filed on October 21, 2010). 4.1 See Exhibits 3.1 and 3.2. for provisions of the Articles of Incorporation and Bylaws defining the rights
of the holders of common stock of the Registrant. 4.2 Specimen Stock Certificate (incorporated by reference to Exhibit 4.2 to the Registrant’s Annual Report
on Form 10-K for the year ended December 31, 2005 and filed on March 16, 2006). 10.1 Form of Director Indemnification Agreement between the Registrant and Non-employee Directors
(incorporated by reference to Exhibit 10.67 to the Registrant’s Annual Report on Form 10-K for the year ended December 31, 2003 and filed on March 14, 2004). +
10.2 Form of Officer Indemnification Agreement between the Registrant and each of the executive officers
(incorporated by reference to Exhibit 10.68 to the Registrant’s Annual Report on Form 10-K for the year ended December 31, 2003 and filed on March 14, 2004). +
10.3 Lease Agreement, dated October 28, 2005, between American Teleconferencing Services, Ltd. and 3280
Peachtree I LLC (incorporated by reference to Exhibit 10.3 to the Registrant’s Current Report on Form 8-K dated and filed on February 1, 2006).
10.4 Guaranty to the Lease Agreement between American Teleconferencing Services, Ltd. and 3280
Peachtree I LLC, by the Registrant (incorporated by reference to Exhibit 10.4 to the Registrant’s Current Report on Form 8-K dated and filed on February 1, 2006).
10.5 First Amendment to Lease Agreement, dated July 14, 2006, by and between American Teleconferencing
Services, Ltd. and 3280 Peachtree I LLC (incorporated by reference to Exhibit 10.12 to the Registrant’s Form 10-Q/A for the quarter ended June 30, 2008 and filed on October 14, 2008).
10.6 Acknowledgment, Consent and Reaffirmation of Guarantor of Lease to the First Amendment to Lease
Agreement between American Teleconferencing Services, Ltd. and 3280 Peachtree I LLC, dated July 14, 2006, by the Registrant (incorporated by reference to Exhibit 10.13 to the Registrant’s Form 10-Q/A for the quarter ended June 30, 2008 and filed on October 14, 2008).
10.7 Second Amendment to Lease Agreement, dated March 15, 2007, by and between American
Teleconferencing Services, Ltd. and 3280 Peachtree I LLC (incorporated by reference to Exhibit 10.14 to the Registrant’s Form 10-Q/A for the quarter ended June 30, 2008 and filed on October 14, 2008).

Exhibit Number
Description
10.8 Acknowledgment, Consent and Reaffirmation of Guarantor of Lease to the Second Amendment to Lease
Agreement between American Teleconferencing Services, Ltd. and 3280 Peachtree I LLC, dated March 15, 2007, by the Registrant (incorporated by reference to Exhibit 10.15 to the Registrant’s Form 10-Q/A for the quarter ended June 30, 2008 and filed on October 14, 2008).
10.9 Third Amendment to Lease Agreement, dated June 3, 2008, by and between American Teleconferencing
Services, Ltd. and 3280 Peachtree I LLC (incorporated by reference to Exhibit 10.16 to the Registrant’s Form 10-Q/A for the quarter ended June 30, 2008 and filed on October 14, 2008).
10.10 Acknowledgment, Consent and Reaffirmation of Guarantor of Lease to the Third Amendment to Lease
Agreement between American Teleconferencing Services, Ltd. and 3280 Peachtree I LLC, dated June 3, 2008, by the Registrant (incorporated by reference to Exhibit 10.17 to the Registrant’s Form 10-Q/A for the quarter ended June 30, 2008 and filed on October 14, 2008).
10.11 Fourth Amendment to Lease Agreement, dated August 27, 2008, by and between American
Teleconferencing Services, Ltd. and 3280 Peachtree I LLC (incorporated by reference to Exhibit 10.1 to the Registrant’s Quarterly Report on Form 10-Q for the quarter ended September 30, 2008 and filed on November 7, 2008)
10.12 Acknowledgment, Consent and Reaffirmation of Guarantor of Lease to the Fourth Amendment to Lease
Agreement between American Teleconferencing Services, Ltd. and 3280 Peachtree I LLC, dated August 27, 2008, by the Registrant (incorporated by reference to Exhibit 10.2 to the Registrant’s Quarterly Report on Form 10-Q for the quarter ended September 30, 2008 and filed on November 7, 2008).
10.13 Fifth Amendment to Lease Agreement, dated October 15, 2008, by and between American
Teleconferencing Services, Ltd. and 3280 Peachtree I LLC (incorporated by reference to Exhibit 10.72 to the Registrant’s Annual Report on Form 10-K for the year ended December 31, 2009 and filed on March 1, 2010).
10.14 Acknowledgement, Consent and Ratification of Guarantor of Lease to the Fifth Amendment to Lease
Agreement, dated October 15, 2008, by and between American Teleconferencing Services, Ltd. and 3280 Peachtree I LLC (incorporated by reference to Exhibit 10.73 to the Registrant’s Annual Report on Form 10-K for the year ended December 31, 2009 and filed on March 1, 2010).
10.15 Assignment and Assumption of Lease to the Third Amendment to Lease Agreement between Xpedite
Systems, LLC and 3280 Peachtree I LLC, dated October 20, 2010, by and between Xpedite Systems, LLC and American Teleconferencing Services, Ltd. (incorporated by reference to Exhibit 10.28 to the Registrant’s Annual Report on Form 10-K for the year ended December 31, 2010 and filed on March 14, 2011).
10.16 Acknowledgment, Consent and Reaffirmation of Guarantor of Lease to the Third Amendment to Lease
Agreement between Xpedite Systems, LLC and 3280 Peachtree I LLC, dated October 20, 2010, by the Registrant (incorporated by reference to Exhibit 10.29 to the Registrant’s Annual Report on Form 10-K for the year ended December 31, 2010 and filed on March 14, 2011).
10.17 Office Building Lease, dated November 12, 2009, between Verizon Business Network Services and
American Teleconferencing Services, Ltd. (incorporated by reference to Exhibit 10.79 to the Registrant’s Annual Report on Form 10-K for the year ended December 31, 2009 and filed on March 1, 2010).
10.18 First Amendment to Office Building Lease, dated January 14, 2010, between Verizon Business Network
Services and American Teleconferencing Services, Ltd. (incorporated by reference to Exhibit 10.7 to the Registrant’s Quarterly Report on Form 10-Q for the quarter ended March 31, 2010 and filed on May 10, 2010).

Exhibit Number
Description
10.19 Second Amendment to Office Building Lease, dated November 30, 2010, between Verizon Business
Network Services and American Teleconferencing Services, Ltd. (incorporated by reference to Exhibit 10.32 to the Registrant’s Annual Report on Form 10-K for the year ended December 31, 2010 and filed on March 14, 2011).
10.20 Office Lease Agreement, dated September 29, 2008, by and between Corporate Ridge, L.L.C. and
American Teleconferencing Services, Ltd. (incorporated by reference to Exhibit 10.74 to the Registrant’s Annual Report on Form 10-K for the year ended December 31, 2009 and filed on March 1, 2010).
10.21 First Amendment to Office Lease Agreement between Corporate Ridge, L.L.C. and American
Teleconferencing Services, Ltd., dated December 29, 2011. 10.22 Lease Guaranty to the Office Lease Agreement, dated September 29, 2008, by and between Corporate
Ridge, L.L.C. and American Teleconferencing Services, Ltd. (incorporated by reference to Exhibit 10.75 to the Registrant’s Annual Report on Form 10-K for the year ended December 31, 2009 and filed on March 1, 2010).
10.23 Credit Agreement, dated May 10, 2010, among American Teleconferencing Services, Ltd., as a
Borrower, the Registrant and Certain Subsidiaries and Affiliates of the Borrower, as Guarantors, the Lenders Party hereto, Bank of America, N.A., as Administrative Agent and Collateral Agent, JP Morgan Chase Bank, N.A. and RBS Citizens, National Association, as Co-Syndication Agents, and Wells Fargo Bank, National Association, as Documentation Agent (incorporated by reference to Exhibit 10.8 to the Registrant’s Quarterly Report on Form 10-Q dated and filed on May 10, 2010).
10.24 Amendment No. 1 to that certain Credit Agreement, dated May 10, 2010, among American
Teleconferencing Services, Ltd., as a Borrower, the Registrant and Certain Subsidiaries and Affiliates of the Borrower, as Guarantors, the Lenders Party hereto, Bank of America, N.A., as Administrative Agent and Collateral Agent, JP Morgan Chase Bank, N.A. and RBS Citizens, National Association, as Co-Syndication Agents, and Wells Fargo Bank, National Association, as Documentation Agent (incorporated by reference to Exhibit 10.1 to the Registrant’s Current Report on Form 8-K dated and filed on October 21, 2010).
10.25 Amendment No. 2 dated as of December 20, 2011 by and among American Teleconferencing Services,
Ltd., as a Borrower, the Registrant and certain Subsidiaries and Affiliates of the Borrower as “Guarantors”, the Lenders from time to time party thereto, and Bank of America, N.A., as Administrative Agent, which amends the certain Credit Agreement (as so amended and as amended from time to time) dated May 10, 2010 among the Borrower, the Registrant, the Guarantors, the Lenders party thereto and the Administrative Agent (incorporated by reference to Exhibit 10.1 to the Registrant’s Current Report on Form 8-K dated and filed December 20, 2011).
10.26 Security Agreement, dated May 10, 2010, among American Teleconferencing Services, Ltd., the
Registrant, PTEK Services, Inc., Xpedite Systems Worldwide, Inc., Netspoke, Inc., iMeet, Inc., Xpedite Systems, LLC and Bank of America, N.A., as Collateral Agent (incorporated by reference to Exhibit 10.9 to the Registrant’s Quarterly Report on Form 10-Q dated and filed on May 10, 2010).
10.27 Pledge Agreement, dated May 10, 2010, among American Teleconferencing Services, Ltd., the
Registrant, Netspoke, Inc., iMeet, Inc. and Bank of America, N.A., as Collateral Agent (incorporated by reference to Exhibit 10.10 to the Registrant’s Quarterly Report on Form 10-Q dated and filed on May 10, 2010).
10.28 1995 Stock Plan of the Registrant, as amended (incorporated by reference to Appendix C to the
Registrant’s Definitive Proxy Statement distributed in connection with the Registrant’s June 5, 2002 Annual Meeting of Shareholders, filed on April 30, 2002). +
Exhibit Number
Description
10.29 Form of Restricted Stock Award Agreement under the Registrant’s 1995 Stock Plan, as amended
(incorporated by reference to Exhibit 10.7 to the Registrant’s Quarterly Report on Form 10-Q for the quarter ended March 31, 2005 and filed on May 6, 2005). +
10.30 Amended and Restated 1998 Stock Plan of the Registrant (incorporated by reference to Exhibit 10.1 to
the Registrant's Quarterly Report on Form 10-Q for the quarter ended June 30, 1999 and filed on August 16, 1999). +
10.31 Amendment No. 1 to the Amended and Restated 1998 Stock Plan of the Registrant (incorporated by
reference to Exhibit 10.45 to the Registrant’s Annual Report on Form 10-K for the year ended December 31, 1999 and filed on March 30, 2000). +
10.32 Form of Stock Option Agreement under the Registrant’s Amended and Restated 1998 Stock Plan, as
amended (incorporated by reference to Exhibit 10.43 to the Registrant’s Annual Report on Form 10-K for the year ended December 31, 2010 and filed on March 14, 2011). +
10.33 Form of Restricted Stock Award Agreement under the Registrant’s Amended and Restated 1998 Stock
Plan, as amended (incorporated by reference to Exhibit 10.44 to the Registrant’s Annual Report on Form 10-K for the year ended December 31, 2010 and filed on March 14, 2011). +
10.34 Amended and Restated 2004 Long-Term Incentive Plan of the Registrant (incorporated by reference to
Appendix B of the Registrant’s Definitive Proxy Statement on Schedule 14A filed on April 18, 2008). + 10.35 Amendment to Amended and Restated 2004 Long-Term Incentive Plan of the Registrant (incorporated
by reference to Appendix A of the Registrant’s Definitive Proxy Statement on Schedule 14A filed on April 23, 2010). +
10.36 Form of NonStatutory Stock Option Agreement under the Registrant’s 2004 Long-Term Incentive Plan,
as amended (incorporated by reference to Exhibit 10.4 to the Registrant’s Quarterly Report on Form 10-Q for the quarter ended March 31, 2005 and filed on May 6, 2005). +
10.37 Form of Restricted Stock Agreement under the Registrant’s Amended and Restated 2004 Long-Term
Incentive Plan, as amended (incorporated by reference to Exhibit 10.1 to the Registrant’s Form 10-Q for the quarter ended September 30, 2011 and filed on November 9, 2011).+
10.38 Amended and Restated 2000 Directors Stock Plan of the Registrant (incorporated herein by reference to
Appendix B of the Registrant’s Definitive Proxy Statement on Schedule 14A filed on April 18, 2008). + 10.39 Amendment to Amended and Restated 2000 Directors Stock Plan of the Registrant (incorporated herein
by reference to Appendix B of the Registrant’s Definitive Proxy Statement on Schedule 14A filed on April 23, 2010). +
10.40 Form of Stock Option Agreement under the Registrant’s Amended and Restated 2000 Directors’ Stock
Plan, as amended (incorporated by reference to Exhibit 10.51 to the Registrant’s Annual Report on Form 10-K for the year ended December 31, 2010 and filed on March 14, 2011). +
10.41 Form of Restriction Agreement for non-employee directors under the Registrant’s Amended and
Restated 2000 Directors Stock Plan, as amended (incorporated by reference to Exhibit 10.10 to the Registrant’s Form 10-Q/A for the quarter ended June 30, 2008 and filed on October 14, 2008). +
10.42 Summary of the Registrant’s Non-Employee Director Compensation (incorporated by reference to
Exhibit 10.1 to the Registrant’s Current Report on Form 8-K dated and filed on December 22, 2005). + 10.43 Revised Summary of the Equity Compensation Component of the Registrant’s Non-Employee Director
Compensation, as amended on July 21, 2010 (incorporated by reference to Exhibit 10.1 to the Registrant’s Current Report on Form 8-K dated and filed on July 26, 2006, as amended by Current Report on Form 8-K dated July 21, 2010 and filed on July 22, 2010). +

Exhibit Number
Description
10.44 Form of Director Stock Deferral Agreement (incorporated by reference to Exhibit 10.1 to the
Registrant’s Current Report on Form 8-K dated and filed on December 22, 2010). + 10.45 Restated Wells Fargo Defined Contribution Prototype Plan and Trust Agreement of the Registrant,
effective January 1, 2009, dated September 3, 2010 (incorporated by reference to Exhibit 10.56 to the Registrant’s Annual Report on Form 10-K for the year ended December 31, 2010 and filed on March 14, 2011). +
10.46 Fourth Amended and Restated Executive Employment Agreement between Boland T. Jones and the
Registrant effective January 1, 2005 (incorporated by reference to Exhibit 10.1 to the Registrant’s Current Report on Form 8-K dated and filed on April 20, 2005). +
10.47 First Amendment to Fourth Amended and Restated Executive Employment Agreement between Boland
T. Jones and the Registrant dated September 15, 2006 (incorporated by reference to Exhibit 10.3 to the Registrant’s Current Report on Form 8-K dated and filed on September 19, 2006). +
10.48 Second Amendment to Fourth Amended and Restated Executive Employment Agreement between
Boland T. Jones and the Registrant dated December 21, 2007 (incorporated by reference to Exhibit 10.1 to the Registrant’s Current Report on Form 8-K dated December 20, 2007 and filed on December 21, 2007). +
10.49 Third Amendment to Fourth Amended and Restated Executive Employment Agreement between Boland
T. Jones and the Registrant dated December 23, 2008 (incorporated by reference to Exhibit 10.1 to the Registrant’s Current Report on Form 8-K dated and filed on December 23, 2008). +
10.50 Fourth Amendment to Fourth Amended and Restated Executive Employment Agreement between
Boland T. Jones and the Registrant dated January 13, 2010 (incorporated by reference to Exhibit 10.1 to the Registrant’s Current Report on Form 8-K dated and filed on January 15, 2010). +
10.51 Fifth Amendment to Fourth Amended and Restated Executive Employment Agreement between Boland
T. Jones and the Registrant dated May 31, 2011 (incorporated by reference to Exhibit 10.1 to the Registrant’s Current Report on Form 8-K dated and filed on May 31, 2011).+
10.52 Form of Restricted Stock Agreement to be issued to Boland T. Jones as Stock Bonuses pursuant to the
terms of his Fourth Amended and Restated Executive Employment Agreement, as amended, with the Registrant (incorporated by reference to Exhibit 10.11 to the Registrant’s Form 10-Q/A for the quarter ended June 30, 2008 and filed on October 14, 2008). +
10.53 Restricted Stock Agreement between Boland T. Jones and the Registrant, dated January 13, 2010, for
450,000 shares (incorporated by reference to Exhibit 10.5 to the Registrant’s Current Report on Form 8-K dated and filed on January 15, 2010). +
10.54 Restricted Stock Agreement between Boland T. Jones and the Registrant, dated January 13, 2010, for
225,000 shares (incorporated by reference to Exhibit 10.6 to the Registrant’s Current Report on Form 8-K dated and filed on January 15, 2010). +
10.55 Amended and Restated Employment Agreement between Theodore P. Schrafft and the Registrant dated
September 15, 2006 (incorporated by reference to Exhibit 10.1 to the Registrant’s Current Report on Form 8-K dated and filed on September 19, 2006). +
10.56 First Amendment to Amended and Restated Employment Agreement between Theodore P. Schrafft and
the Registrant dated December 21, 2007 (incorporated by reference to Exhibit 10.2 to the Registrant’s Current Report on Form 8-K dated December 20, 2007 and filed on December 21, 2007). +

Exhibit Number
Description
10.57 Second Amendment to Amended and Restated Employment Agreement between Theodore P. Schrafft
and the Registrant dated January 23, 2008 (incorporated by reference to Exhibit 10.1 to the Registrant’s Current Report on Form 8-K dated January 22, 2007 and filed on January 25, 2008). +
10.58 Third Amendment to Amended and Restated Employment Agreement between Theodore P. Schrafft and
the Registrant dated December 23, 2008 (incorporated by reference to Exhibit 10.2 to the Registrant’s Current Report on Form 8-K dated and filed on December 23, 2008). +
10.59 Fourth Amendment to Amended and Restated Employment Agreement between Theodore P. Schrafft
and the Registrant dated January 13, 2010 (incorporated by reference to Exhibit 10.2 to the Registrant’s Current Report on Form 8-K dated and filed on January 15, 2010). +
10.60 Restricted Stock Agreement between Theodore P. Schrafft and the Registrant dated July 29, 2010 for
100,000 shares (incorporated by reference to Exhibit 10.1 to the Registrant’s Current Report on Form 8-K dated and filed on July 30, 2010). +
10.61 Restricted Stock Agreement between Theodore P. Schrafft and the Registrant dated July 29, 2010 for
50,000 shares (incorporated by reference to Exhibit 10.2 to the Registrant’s Current Report on Form 8-K dated and filed on July 30, 2010). +
10.62 Employment Agreement between David E. Trine and the Registrant dated February 19, 2008
(incorporated by reference to Exhibit 10.1 to the Registrant’s Current Report on Form 8-K dated and filed on February 19, 2009). +
10.63 First Amendment to Employment Agreement between David Trine and the Registrant dated January 13,
2010 (incorporated by reference to Exhibit 10.3 to the Registrant’s Current Report on Form 8-K dated and filed on January 15, 2010). +
10.64 Restricted Stock Agreement between David E. Trine and the Registrant, dated March 31, 2009, under
the Registrant’s Amended and Restated 2004 Long-Term Incentive Plan (incorporated by reference to Exhibit 10.1 to the Registrant’s Current Report on Form 8-K dated March 31, 2009 and filed on April 1, 2009). +
10.65 Amended and Restated Employment Agreement between David M. Guthrie and the Registrant dated
May 19, 2008 and effective as of June 30, 2008 (incorporated by reference to Exhibit 10.2 to the Registrant’s Current Report on Form 8-K dated May 16, 2008 and filed on May 19, 2008). +
10.66 First Amendment to Amended and Restated Employment Agreement between David M. Guthrie and the
Registrant dated December 23, 2008 (incorporated by reference to Exhibit 10.1 to the Registrant’s Current Report on Form 8-K dated and filed on December 23, 2008). +
10.67 Second Amendment to Amended and Restated Employment Agreement between David Guthrie and the
Registrant dated January 13, 2010 (incorporated by reference to Exhibit 10.4 to the Registrant’s Current Report on Form 8-K dated and filed on January 15, 2010). +
10.68 Restricted Stock Agreement between David M. Guthrie and the Registrant dated March 31, 2011 for
66,667 shares (incorporated by reference to Exhibit 10.1 to the Registrant’s Current Report on Form 8-K dated March 31, 2011 and filed on April 4, 2011).+
10.69 Restricted Stock Agreement between David M. Guthrie and the Registrant dated March 31, 2011 for
33,333 shares (incorporated by reference to Exhibit 10.2 to the Registrant’s Current Report on Form 8-K dated March 31, 2011 and filed on April 4, 2011).+
21.1 Subsidiaries of the Registrant. 23.1 Consent of Ernst & Young LLP.

Exhibit Number
Description
31.1 Certification of Chief Executive Officer pursuant to Rule 13a-14(a)/15d-14(a) of the Securities
Exchange Act of 1934. 31.2 Certification of Chief Financial Officer pursuant to Rule 13a-14(a)/15d-14(a) of the Securities Exchange
Act of 1934. 32.1 Certification of Chief Executive Officer pursuant to Rule 13a-14(b)/15d-14(b) of the Securities
Exchange Act of 1934 and 18 U.S.C. Section 1350. 32.2 Certification of Chief Financial Officer pursuant to Rule 13a-14(b)/15d-14(b) of the Securities Exchange
Act of 1934 and 18 U.S.C. Section 1350. + Management contract or compensatory plan or arrangement required to be filed as an exhibit to this form pursuant to Item 15(b) of this report.

EXHIBIT 31.1 CERTIFICATION
I, Boland T. Jones, certify that: 1. I have reviewed this Annual Report on Form 10-K of Premiere Global Services, Inc; 2. Based on my knowledge, this report does not contain any untrue statement of a material fact or omit to state a material fact necessary to make the statements made, in light of the circumstances under which such statements were made, not misleading with respect to the period covered by this report; 3. Based on my knowledge, the financial statements, and other financial information included in this report, fairly present in all material respects the financial condition, results of operations and cash flows of the registrant as of, and for, the periods presented in this report; 4. The registrant’s other certifying officer and I are responsible for establishing and maintaining disclosure controls and procedures (as defined in Exchange Act Rules 13a-15(e) and 15d-15(e)) and internal control over financial reporting (as defined in Exchange Act Rules 13a-15(f) and 15d-15(f)) for the registrant and have:
(a) Designed such disclosure controls and procedures, or caused such disclosure controls and procedures to be designed under our supervision, to ensure that material information relating to the registrant, including its consolidated subsidiaries, is made known to us by others within those entities, particularly during the period in which this report is being prepared;
(b) Designed such internal control over financial reporting, or caused such internal control over
financial reporting to be designed under our supervision, to provide reasonable assurance regarding the reliability of financial reporting and the preparation of financial statements for external purposes in accordance with generally accepted accounting principles;
(c) Evaluated the effectiveness of the registrant’s disclosure controls and procedures and presented in
this report our conclusions about the effectiveness of the disclosure controls and procedures, as of the end of the period covered by this report based on such evaluation; and
(d) Disclosed in this report any change in the registrant’s internal control over financial reporting that
occurred during the registrant’s most recent fiscal quarter (the registrant’s fourth fiscal quarter in the case of an annual report) that has materially affected, or is reasonably likely to materially affect, the registrant’s internal control over financial reporting; and
5. The registrant’s other certifying officer and I have disclosed, based on our most recent evaluation of internal control over financial reporting, to the registrant’s auditors and the audit committee of the registrant’s board of directors (or persons performing the equivalent functions):
(a) all significant deficiencies and material weaknesses in the design or operation of internal control over financial reporting which are reasonably likely to adversely affect the registrant’s ability to record, process, summarize and report financial information; and
(b) any fraud, whether or not material, that involves management or other employees who have a
significant role in the registrant’s internal control over financial reporting. Date: March 12, 2012 /s/ Boland T. Jones Boland T. Jones Chief Executive Officer Premiere Global Services, Inc.

EXHIBIT 31.2 CERTIFICATION
I, David E. Trine, certify that: 1. I have reviewed this Annual Report on Form 10-K of Premiere Global Services, Inc.; 2. Based on my knowledge, this report does not contain any untrue statement of a material fact or omit to state a material fact necessary to make the statements made, in light of the circumstances under which such statements were made, not misleading with respect to the period covered by this report; 3. Based on my knowledge, the financial statements, and other financial information included in this report, fairly present in all material respects the financial condition, results of operations and cash flows of the registrant as of, and for, the periods presented in this report; 4. The registrant’s other certifying officer and I are responsible for establishing and maintaining disclosure controls and procedures (as defined in Exchange Act Rules 13a-15(e) and 15d-15(e)) and internal control over financial reporting (as defined in Exchange Act Rules 13a-15(f) and 15d-15(f)) for the registrant and have:
(a) Designed such disclosure controls and procedures, or caused such disclosure controls and procedures to be designed under our supervision, to ensure that material information relating to the registrant, including its consolidated subsidiaries, is made known to us by others within those entities, particularly during the period in which this report is being prepared;
(b) Designed such internal control over financial reporting, or caused such internal control over
financial reporting to be designed under our supervision, to provide reasonable assurance regarding the reliability of financial reporting and the preparation of financial statements for external purposes in accordance with generally accepted accounting principles;
(c) Evaluated the effectiveness of the registrant’s disclosure controls and procedures and presented in
this report our conclusions about the effectiveness of the disclosure controls and procedures, as of the end of the period covered by this report based on such evaluation; and
(d) Disclosed in this report any change in the registrant’s internal control over financial reporting that
occurred during the registrant’s most recent fiscal quarter (the registrant’s fourth fiscal quarter in the case of an annual report) that has materially affected, or is reasonably likely to materially affect, the registrant’s internal control over financial reporting; and
5. The registrant’s other certifying officer and I have disclosed, based on our most recent evaluation of internal control over financial reporting, to the registrant’s auditors and the audit committee of the registrant’s board of directors (or persons performing the equivalent functions):
(a) all significant deficiencies and material weaknesses in the design or operation of internal control over financial reporting which are reasonably likely to adversely affect the registrant’s ability to record, process, summarize and report financial information; and
(b) any fraud, whether or not material, that involves management or other employees who have a
significant role in the registrant’s internal control over financial reporting. Date: March 12, 2012 /s/ David E. Trine David E. Trine Chief Financial Officer Premiere Global Services, Inc.


EXHIBIT 32.2
STATEMENT OF CHIEF FINANCIAL OFFICER OF PREMIERE GLOBAL SERVICES, INC. PURSUANT TO 18 U.S.C. SECTION 1350,
AS ADOPTED PURSUANT TO § 906 OF THE SARBANES-OXLEY ACT OF 2002
In connection with the Annual Report of Premiere Global Services, Inc. (the “Company”) on Form 10-K for the year ended December 31, 2011 as filed with the Securities and Exchange Commission on the date hereof (the “Report”), the undersigned David E. Trine, Chief Financial Officer of the Company, certifies, pursuant to 18 U.S.C. § 1350, as adopted pursuant to § 906 of the Sarbanes-Oxley Act of 2002, that:
(1) The Report fully complies with the requirements of Section 13(a) or 15(d) of the Securities Exchange Act of 1934; and
(2) The information contained in the Report fairly presents, in all material respects, the financial
condition and results of operations of the Company.
/s/ David E. Trine David E. Trine Chief Financial Officer Premiere Global Services, Inc. March 12, 2012


BOARD OF DIRECTORS
Boland T. JonesChairman and Chief Executive OfficerPremiere Global Services, Inc.
Wilkie S. Coyler 1, 2
PartnerThe Breckenridge Group, Inc.
K. Robert Draughon 1
President and Chief Financial OfficerPress Ganey Associates, Inc.
John R. Harris 2, 3
Operating PartnerglendonTodd Capital LLC
W. Steven Jones 1
Professor of Strategy and Organizational BehaviorKenan-Flagler Business SchoolUniversity of North Carolina at Chapel Hill
Raymond H. Pirtle, Jr. 1
Chief ManagerClaridge Company, LLC
J. Walker Smith, Jr. 3
Global Executive ChairmanThe Futures Company
MANAGEMENT TEAM
Boland T. JonesChairman and Chief Executive Officer
Theodore P. SchrafftPresident
David M. GuthrieChief Technology Officer
David E. TrineChief Financial Officer
J. Scott TappExecutive Vice President Sales and Marketing
John StoneManaging Director, Europe
Dennis ChooManaging Director, Asia Pacific
Erik PetrikChief Creative Officer
Michele DobnikarExecutive Vice PresidentCustomer Care and SMB Base Management
Sean P. O’BrienExecutive Vice President Strategy and Communications
Scott Askins LeonardExecutive Vice President, Legal General Counsel and Secretary
SHAREHOLDER INFORMATION
Headquarters Premiere Global Services, Inc.3280 Peachtree Road, NEThe Terminus BuildingSuite 1000Atlanta, Georgia 30305404.262.8400 Annual Meeting of Shareholders will be held at 10:00 am MDT Wednesday, June 13, 2012Antlers Hilton4 South Cascade AvenueColorado Springs, Colorado 80903
Transfer Agent and RegistrarAmerican Stock Transfer & Trust Company6201 15th AvenueBrooklyn, New York 11219800.937.5449
Independent Registered Public Accounting FirmErnst & Young LLPAtlanta, Georgia
Investor Relations ContactSean P. O’BrienExecutive Vice PresidentStrategy and [email protected]
Stock Listing Our common stock is traded on the New York Stock Exchange® under the symbol “PGi.”
Annual ReportAn interactive online version of this annual report is available on our website at www.ar2011.pgi.com. A copy of our 2011 annual report on Form 10-K, including exhibits, filed with the Securities and Exchange Commission, is available by written request to Investor Relations at our headquarters.
All trademarks of third parties referred to in this annual report are the property of their respective owners.
1. Audit Committee2. Compensation Committee3. Nominating and Governance Committee