Embed Size (px)
Citation preview
2013 Annual Report
creating Value
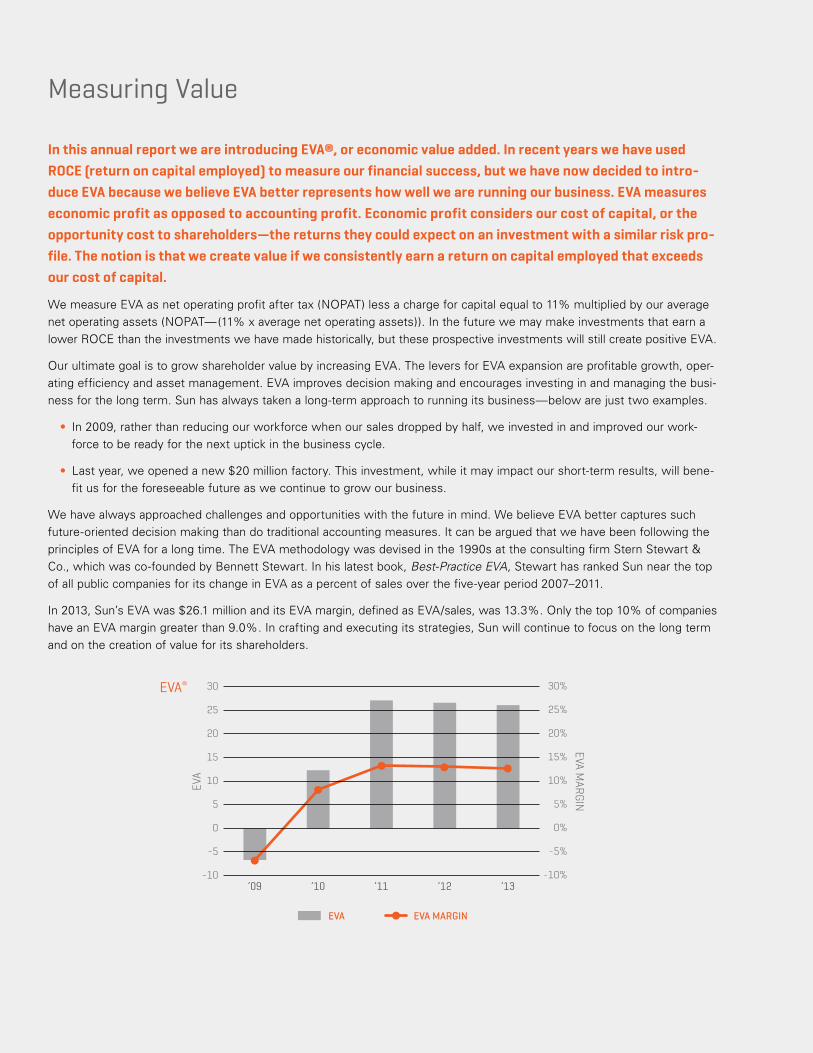
In this annual report we are introducing EVA®, or economic value added. In recent years we have used ROCE (return on capital employed) to measure our financial success, but we have now decided to intro-duce EVA because we believe EVA better represents how well we are running our business. EVA measures economic profit as opposed to accounting profit. Economic profit considers our cost of capital, or the opportunity cost to shareholders—the returns they could expect on an investment with a similar risk pro-file. The notion is that we create value if we consistently earn a return on capital employed that exceeds our cost of capital.
We measure EVA as net operating profit after tax (NOPAT) less a charge for capital equal to 11% multiplied by our average net operating assets (NOPAT—(11% x average net operating assets)). In the future we may make investments that earn a lower ROCE than the investments we have made historically, but these prospective investments will still create positive EVA.
Our ultimate goal is to grow shareholder value by increasing EVA. The levers for EVA expansion are profitable growth, oper-ating efficiency and asset management. EVA improves decision making and encourages investing in and managing the busi-ness for the long term. Sun has always taken a long-term approach to running its business—below are just two examples.
• In 2009, rather than reducing our workforce when our sales dropped by half, we invested in and improved our work-force to be ready for the next uptick in the business cycle.
• Last year, we opened a new $20 million factory. This investment, while it may impact our short-term results, will bene-fit us for the foreseeable future as we continue to grow our business.
We have always approached challenges and opportunities with the future in mind. We believe EVA better captures such future-oriented decision making than do traditional accounting measures. It can be argued that we have been following the principles of EVA for a long time. The EVA methodology was devised in the 1990s at the consulting firm Stern Stewart & Co., which was co-founded by Bennett Stewart. In his latest book, Best-Practice EVA, Stewart has ranked Sun near the top of all public companies for its change in EVA as a percent of sales over the five-year period 2007–2011.
In 2013, Sun’s EVA was $26.1 million and its EVA margin, defined as EVA/sales, was 13.3%. Only the top 10% of companies have an EVA margin greater than 9.0%. In crafting and executing its strategies, Sun will continue to focus on the long term and on the creation of value for its shareholders.
Measuring Value
EVA
EVA
EVA MARGIN
EVA
-10
-5
0
5
10
15
20
25
30
’13’12’11’10’09
-10%
-5%
0%
5%
10%
15%
20%
25%
30%
-10
-5
0
5
10
15
20
25
30
’13’12’11’10’09
-10
-5
0
5
10
15
20
25
30
’13’12’11’10’09
EVA MARGIN
EVA®
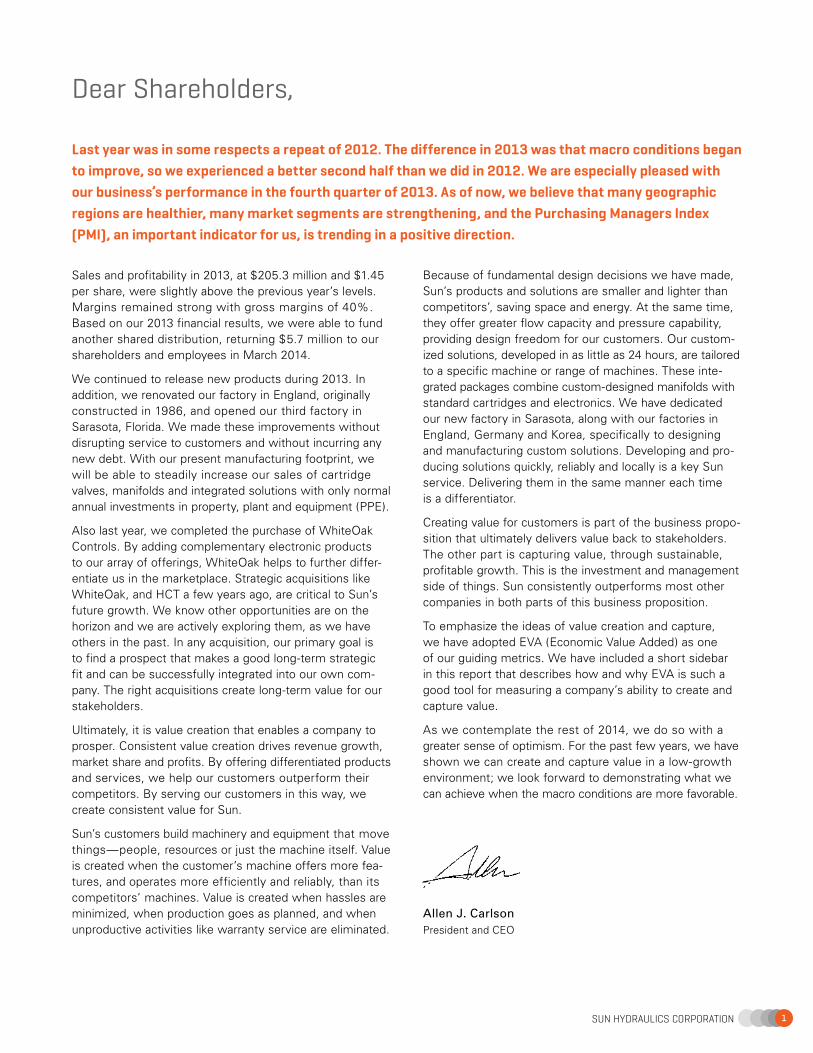
Dear Shareholders,
Last year was in some respects a repeat of 2012. The difference in 2013 was that macro conditions began to improve, so we experienced a better second half than we did in 2012. We are especially pleased with our business’s performance in the fourth quarter of 2013. As of now, we believe that many geographic regions are healthier, many market segments are strengthening, and the Purchasing Managers Index (PMI), an important indicator for us, is trending in a positive direction.
Sales and profitability in 2013, at $205.3 million and $1.45 per share, were slightly above the previous year’s levels. Margins remained strong with gross margins of 40%. Based on our 2013 financial results, we were able to fund another shared distribution, returning $5.7 million to our shareholders and employees in March 2014.
We continued to release new products during 2013. In addition, we renovated our factory in England, originally constructed in 1986, and opened our third factory in Sarasota, Florida. We made these improvements without disrupting service to customers and without incurring any new debt. With our present manufacturing footprint, we will be able to steadily increase our sales of cartridge valves, manifolds and integrated solutions with only normal annual investments in property, plant and equipment (PPE).
Also last year, we completed the purchase of WhiteOak Controls. By adding complementary electronic products to our array of offerings, WhiteOak helps to further differ-entiate us in the marketplace. Strategic acquisitions like WhiteOak, and HCT a few years ago, are critical to Sun’s future growth. We know other opportunities are on the horizon and we are actively exploring them, as we have others in the past. In any acquisition, our primary goal is to find a prospect that makes a good long-term strategic fit and can be successfully integrated into our own com-pany. The right acquisitions create long-term value for our stakeholders.
Ultimately, it is value creation that enables a company to prosper. Consistent value creation drives revenue growth, market share and profits. By offering differentiated products and services, we help our customers outperform their competitors. By serving our customers in this way, we create consistent value for Sun.
Sun’s customers build machinery and equipment that move things—people, resources or just the machine itself. Value is created when the customer’s machine offers more fea-tures, and operates more efficiently and reliably, than its competitors’ machines. Value is created when hassles are minimized, when production goes as planned, and when unproductive activities like warranty service are eliminated.
Because of fundamental design decisions we have made, Sun’s products and solutions are smaller and lighter than competitors’, saving space and energy. At the same time, they offer greater flow capacity and pressure capability, providing design freedom for our customers. Our custom-ized solutions, developed in as little as 24 hours, are tailored to a specific machine or range of machines. These inte-grated packages combine custom-designed manifolds with stand ard cartridges and electronics. We have dedicated our new factory in Sarasota, along with our factories in England, Germany and Korea, specifically to designing and manu facturing custom solutions. Developing and pro-ducing solutions quickly, reliably and locally is a key Sun service. Delivering them in the same manner each time is a differentiator.
Creating value for customers is part of the business propo-sition that ultimately delivers value back to stakeholders. The other part is capturing value, through sustainable, profitable growth. This is the investment and management side of things. Sun consistently outperforms most other companies in both parts of this business proposition.
To emphasize the ideas of value creation and capture, we have adopted EVA (Economic Value Added) as one of our guiding metrics. We have included a short sidebar in this report that describes how and why EVA is such a good tool for measuring a company’s ability to create and capture value.
As we contemplate the rest of 2014, we do so with a greater sense of optimism. For the past few years, we have shown we can create and capture value in a low-growth environment; we look forward to demonstrating what we can achieve when the macro conditions are more favorable.
Allen J. CarlsonPresident and CEO
1Sun HydraulicS corporation
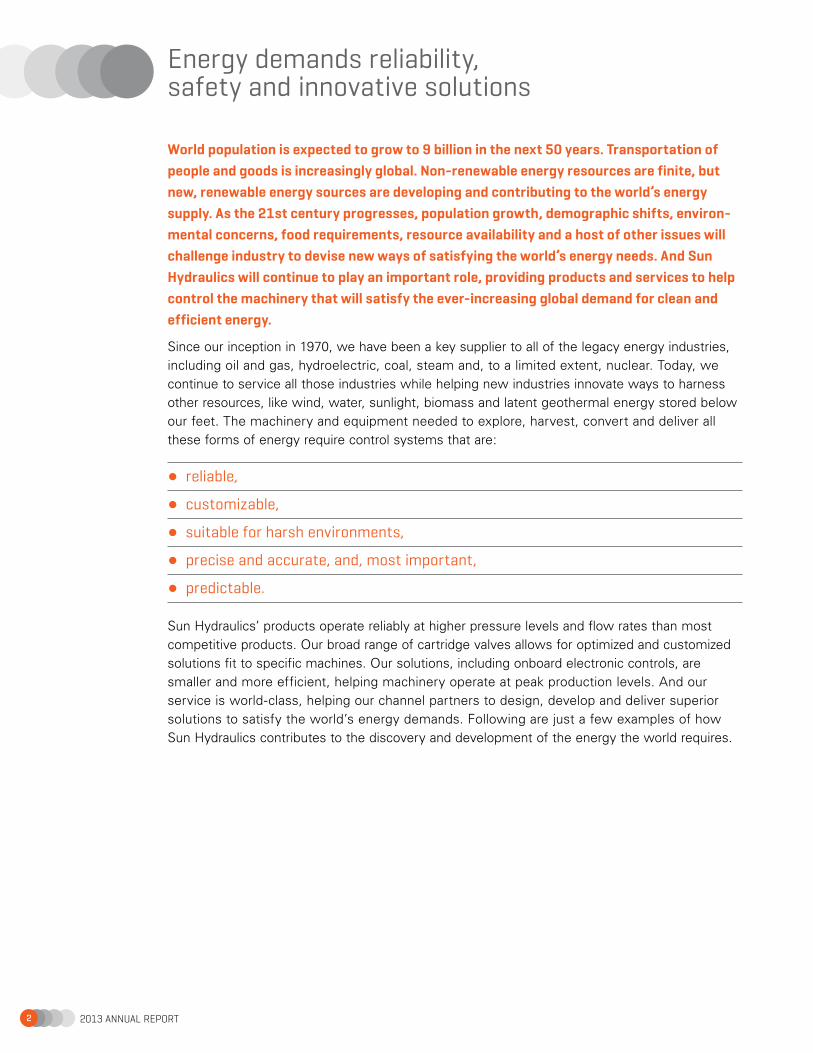
World population is expected to grow to 9 billion in the next 50 years. Transportation of people and goods is increasingly global. Non-renewable energy resources are finite, but new, renewable energy sources are developing and contributing to the world’s energy supply. As the 21st century progresses, population growth, demographic shifts, environ-mental concerns, food requirements, resource availability and a host of other issues will challenge industry to devise new ways of satisfying the world’s energy needs. And Sun Hydraulics will continue to play an important role, providing products and services to help control the machinery that will satisfy the ever-increasing global demand for clean and efficient energy.
Since our inception in 1970, we have been a key supplier to all of the legacy energy industries, including oil and gas, hydroelectric, coal, steam and, to a limited extent, nuclear. Today, we continue to service all those industries while helping new industries innovate ways to harness other resources, like wind, water, sunlight, biomass and latent geothermal energy stored below our feet. The machinery and equipment needed to explore, harvest, convert and deliver all these forms of energy require control systems that are:
• reliable,
• customizable,
• suitable for harsh environments,
• precise and accurate, and, most important,
• predictable.
Sun Hydraulics’ products operate reliably at higher pressure levels and flow rates than most competitive products. Our broad range of cartridge valves allows for optimized and customized solutions fit to specific machines. Our solutions, including onboard electronic controls, are smaller and more efficient, helping machinery operate at peak production levels. And our service is world-class, helping our channel partners to design, develop and deliver superior solutions to satisfy the world’s energy demands. Following are just a few examples of how Sun Hydraulics contributes to the discovery and development of the energy the world requires.
Energy demands reliability, safety and innovative solutions
2013 annual report2
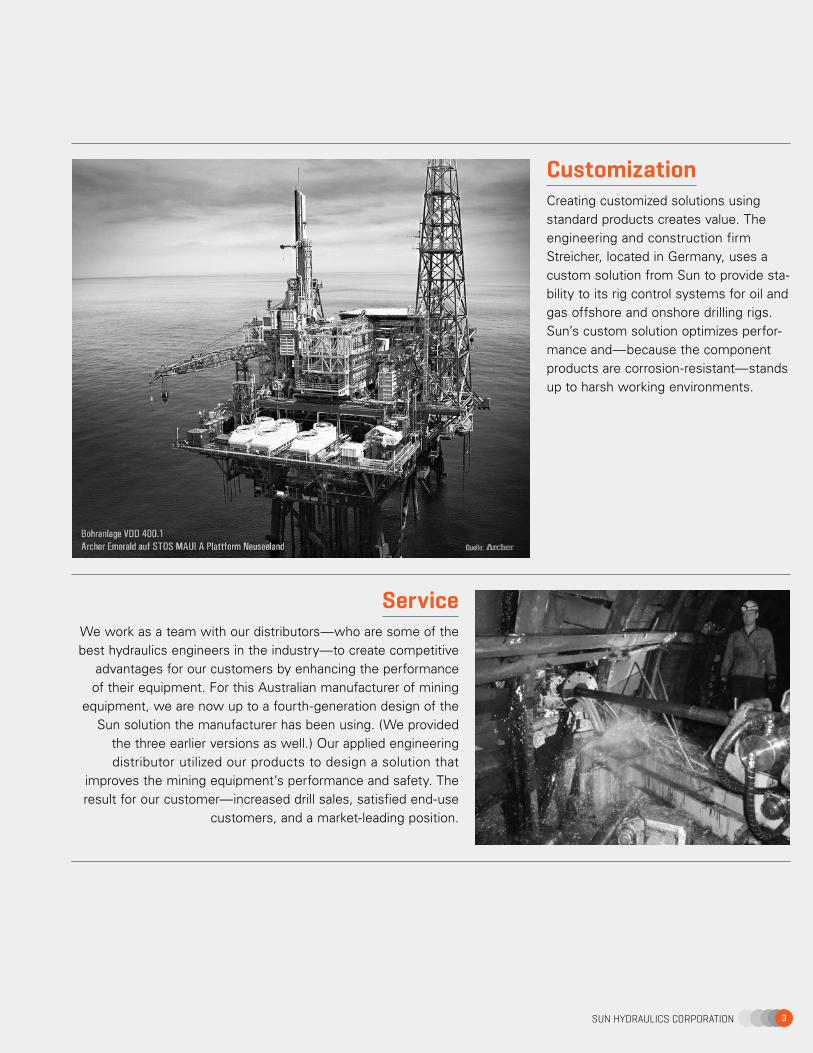
CustomizationCreating customized solutions using standard products creates value. The engineering and construction firm Streicher, located in Germany, uses a custom solution from Sun to provide sta-bility to its rig control systems for oil and gas offshore and onshore drilling rigs. Sun’s custom solution optimizes perfor-mance and—because the component products are corrosion-resistant—stands up to harsh working environments.
ServiceWe work as a team with our distributors—who are some of the best hydraulics engineers in the industry—to create competitive
advantages for our customers by enhancing the performance of their equipment. For this Australian manufacturer of mining
equipment, we are now up to a fourth-generation design of the Sun solution the manufacturer has been using. (We provided
the three earlier versions as well.) Our applied engineering distributor utilized our products to design a solution that
improves the mining equipment’s performance and safety. The result for our customer—increased drill sales, satisfied end-use
customers, and a market-leading position.
3Sun HydraulicS corporation
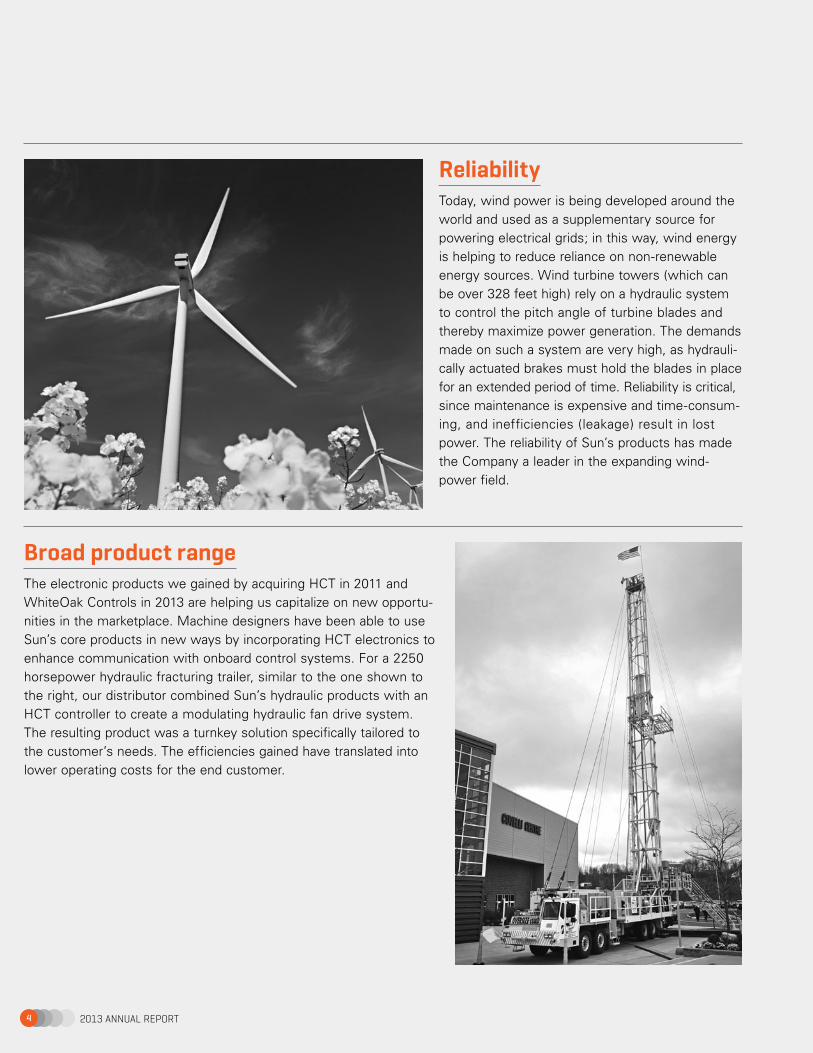
ReliabilityToday, wind power is being developed around the world and used as a supplementary source for powering electrical grids; in this way, wind energy is helping to reduce reliance on non-renewable energy sources. Wind turbine towers (which can be over 328 feet high) rely on a hydraulic system to control the pitch angle of turbine blades and thereby maximize power generation. The demands made on such a system are very high, as hydrauli-cally actuated brakes must hold the blades in place for an extended period of time. Reliability is critical, since maintenance is expensive and time-consum-ing, and inefficiencies (leakage) result in lost power. The reliability of Sun’s products has made the Company a leader in the expanding wind-power field.
Broad product rangeThe electronic products we gained by acquiring HCT in 2011 and WhiteOak Controls in 2013 are helping us capitalize on new opportu-nities in the marketplace. Machine designers have been able to use Sun’s core products in new ways by incorporating HCT electronics to enhance communication with onboard control systems. For a 2250 horsepower hydraulic fracturing trailer, similar to the one shown to the right, our distributor combined Sun’s hydraulic products with an HCT controller to create a modulating hydraulic fan drive system. The resulting product was a turnkey solution specifically tailored to the customer’s needs. The efficiencies gained have translated into lower operating costs for the end customer.
2013 annual report4

SafetySun has built a reputation for helping to safely hold people and things suspended in the air. Engineers designing these critical applications specify Sun products because of their quality and performance reliability. The engineers know that we test 100% of the cartridge valves that leave our facilities. Electric utility vehicles like the one shown here incorporate Sun products throughout. Our products hold the truck in place, ensuring the stabilizer legs do not move. We also lift and lower the working bucket, and hold the bucket in place and keep it level to maintain a safe working environment.
TrustLong-term customer relationships are critical to Sun’s success. Together with our distributor, we have been working with this winch and hoist manufacturer for two decades. The customer—whose products are used in such industries as oil and gas drilling, energy production and development, and mining—demands innovative solu-tions and added value. Our valves ensure smooth, precise load control whether the load is being raised or lowered. Our cartridges and integrated packages are designed to enable compact, lightweight custom solutions that fit within the framework of the customer’s winches. The customer values the reduction of potential leak points that our designs offer, and the reduction of manufacturing time and labor required. The customer especially values that our integrated packages disguise the customer’s intellectual property of the circuit design. The proprietary nature of the design solutions we have provided over the last two decades has built tremendous trust and a solid partnership between the customer, our distributor and us.
5Sun HydraulicS corporation
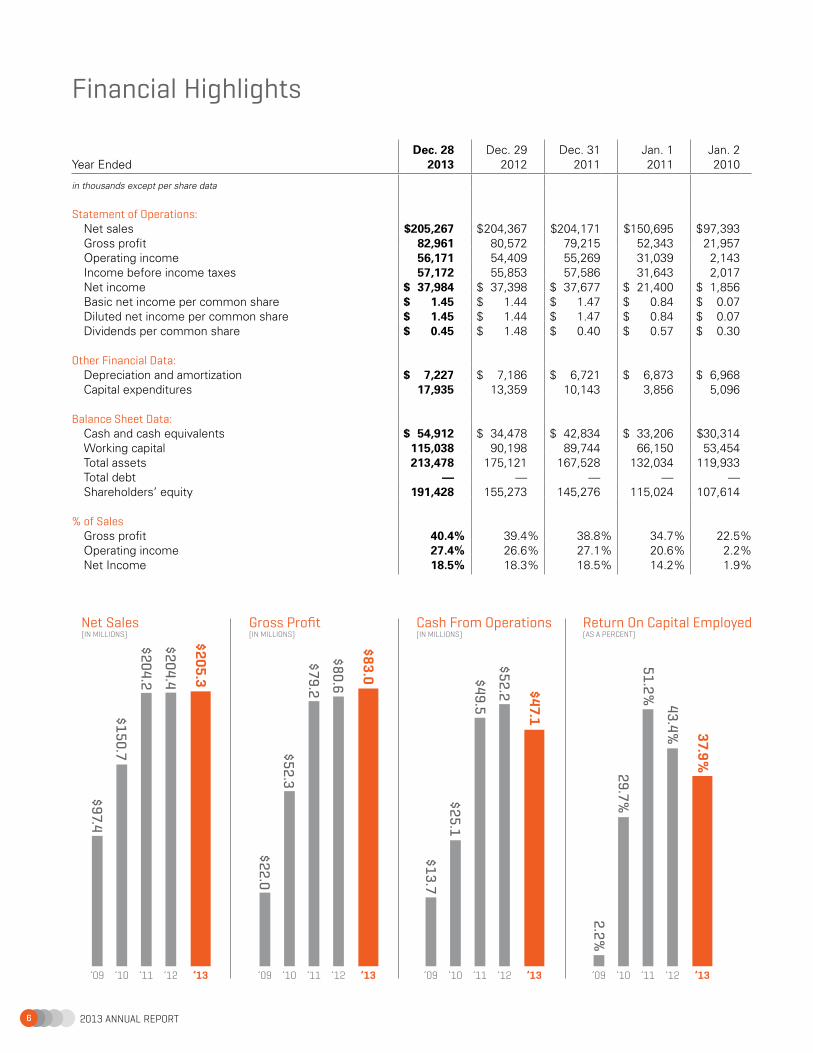
Financial Highlights
2013 annual report6
Year EndedDec. 28
2013Dec. 29
2012Dec. 31
2011Jan. 1 2011
Jan. 2 2010
in thousands except per share data
Statement of Operations: Net sales $205,267 $ 204,367 $204,171 $150,695 $ 97,393 Gross profit 82,961 80,572 79,215 52,343 21,957 Operating income 56,171 54,409 55,269 31,039 2,143 Income before income taxes 57,172 55,853 57,586 31,643 2,017 Net income $ 37,984 $ 37,398 $ 37,677 $ 21,400 $ 1,856 Basic net income per common share $ 1.45 $ 1.44 $ 1.47 $ 0.84 $ 0.07 Diluted net income per common share $ 1.45 $ 1.44 $ 1.47 $ 0.84 $ 0.07 Dividends per common share $ 0.45 $ 1.48 $ 0.40 $ 0.57 $ 0.30
Other Financial Data: Depreciation and amortization $ 7,227 $ 7,186 $ 6,721 $ 6,873 $ 6,968 Capital expenditures 17,935 13,359 10,143 3,856 5,096
Balance Sheet Data: Cash and cash equivalents $ 54,912 $ 34,478 $ 42,834 $ 33,206 $30,314 Working capital 115,038 90,198 89,744 66,150 53,454 Total assets 213,478 175,121 167,528 132,034 119,933 Total debt — — — — — Shareholders’ equity 191,428 155,273 145,276 115,024 107,614
% of Sales Gross profit 40.4% 39.4% 38.8% 34.7% 22.5% Operating income 27.4% 26.6% 27.1% 20.6% 2.2% Net Income 18.5% 18.3% 18.5% 14.2% 1.9%
0
25
50
75
100
125
150
175
200
225
’13’12’11’10’090
10
20
30
40
50
60
70
80
90
’13’12’11’10’090
10
20
30
40
50
60
’13’12’11’10’090
10
20
30
40
50
60
’13’12’11’10’09
’13’12’11’10’09
$97.4
$150.7
$204.2
$204.4
$205.3
’13’12’11’10’09 ’13’12’11’10’09 ’13’12’11’10’09
Net Sales(IN MILLIONS)
Gross Profit(IN MILLIONS)
Cash From Operations(IN MILLIONS)
Return On Capital Employed(AS A PERCENT)
$22.0
$52.3
$79.2
$80.6
$83.0
$13.7
$25.1
$49.5
$52.2 $47.1
2.2%
29.7%
51.2%
43.4% 37.9%
8 Selected Consolidated Financial Data
9 Management’s Discussion and Analysis of Financial Condition and Results of Operations
17 Quantitative and Qualitative Disclosures About Market Risk
18 Market for Registrant’s Common Equity, Related Stockholder Matters and Issuer Purchases of Equity Securities
19 Five-Year Stock Performance Graph
20 Forward-Looking Statements
21 Report of Independent Registered Public Accounting Firm
22 Consolidated Balance Sheets
23 Consolidated Statements of Operations
23 Consolidated Statements of Comprehensive Income (Loss)
24 Consolidated Statement of Shareholders’ Equity
25 Consolidated Statements of Cash Flows
26 Notes to the Consolidated Financial Statements
41 Controls and Procedures
41 Management’s Report on Internal Control over Financial Reporting
42 Consent of Independent Registered Public Accounting Firm
Financial Section
2013 AnnuAl RepoRt8
Selected Consolidated Financial Data
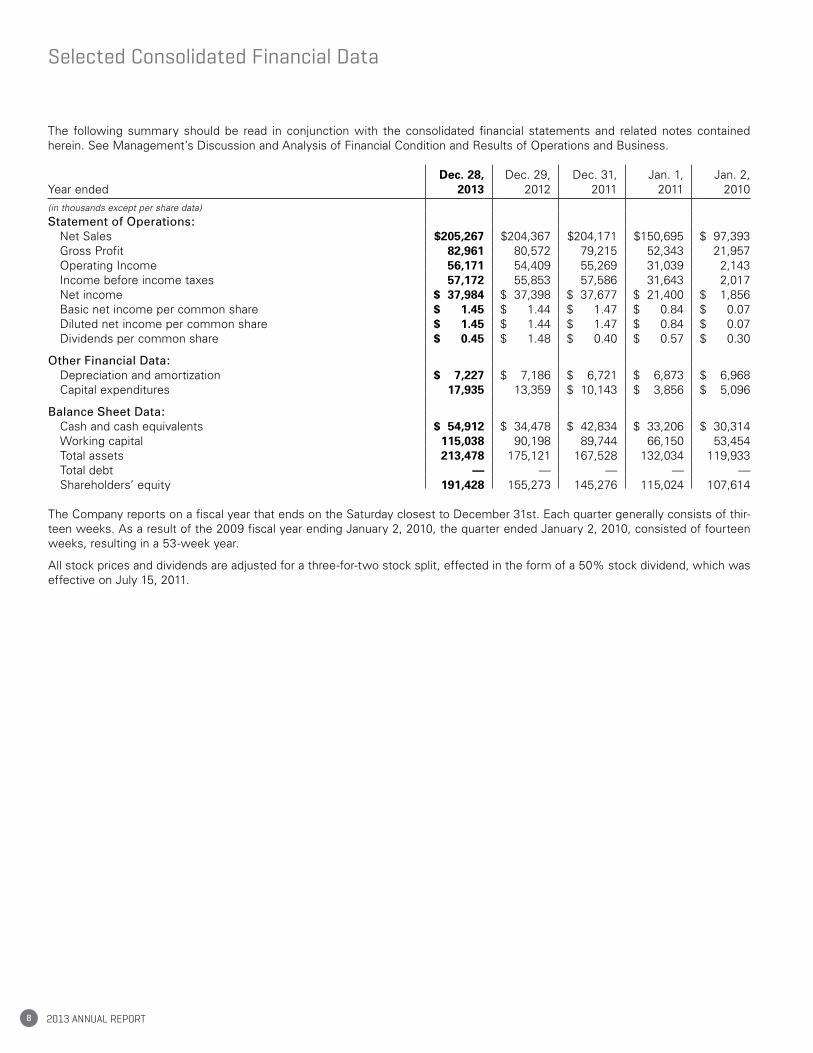
The following summary should be read in conjunction with the consolidated financial statements and related notes contained herein. See Management’s Discussion and Analysis of Financial Condition and Results of Operations and Business.
Year endedDec. 28,
2013Dec. 29,
2012Dec. 31,
2011Jan. 1,
2011Jan. 2,
2010(in thousands except per share data)
Statement of Operations: Net Sales $205,267 $204,367 $204,171 $150,695 $ 97,393 Gross Profit 82,961 80,572 79,215 52,343 21,957 Operating Income 56,171 54,409 55,269 31,039 2,143 Income before income taxes 57,172 55,853 57,586 31,643 2,017 Net income $ 37,984 $ 37,398 $ 37,677 $ 21,400 $ 1,856 Basic net income per common share $ 1.45 $ 1.44 $ 1.47 $ 0.84 $ 0.07 Diluted net income per common share $ 1.45 $ 1.44 $ 1.47 $ 0.84 $ 0.07 Dividends per common share $ 0.45 $ 1.48 $ 0.40 $ 0.57 $ 0.30
Other Financial Data: Depreciation and amortization $ 7,227 $ 7,186 $ 6,721 $ 6,873 $ 6,968 Capital expenditures 17,935 13,359 $ 10,143 $ 3,856 $ 5,096
Balance Sheet Data: Cash and cash equivalents $ 54,912 $ 34,478 $ 42,834 $ 33,206 $ 30,314 Working capital 115,038 90,198 89,744 66,150 53,454 Total assets 213,478 175,121 167,528 132,034 119,933 Total debt — — — — — Shareholders’ equity 191,428 155,273 145,276 115,024 107,614
The Company reports on a fiscal year that ends on the Saturday closest to December 31st. Each quarter generally consists of thir-teen weeks. As a result of the 2009 fiscal year ending January 2, 2010, the quarter ended January 2, 2010, consisted of fourteen weeks, resulting in a 53-week year.
All stock prices and dividends are adjusted for a three-for-two stock split, effected in the form of a 50% stock dividend, which was effective on July 15, 2011.
9Sun HydraulicS corporation
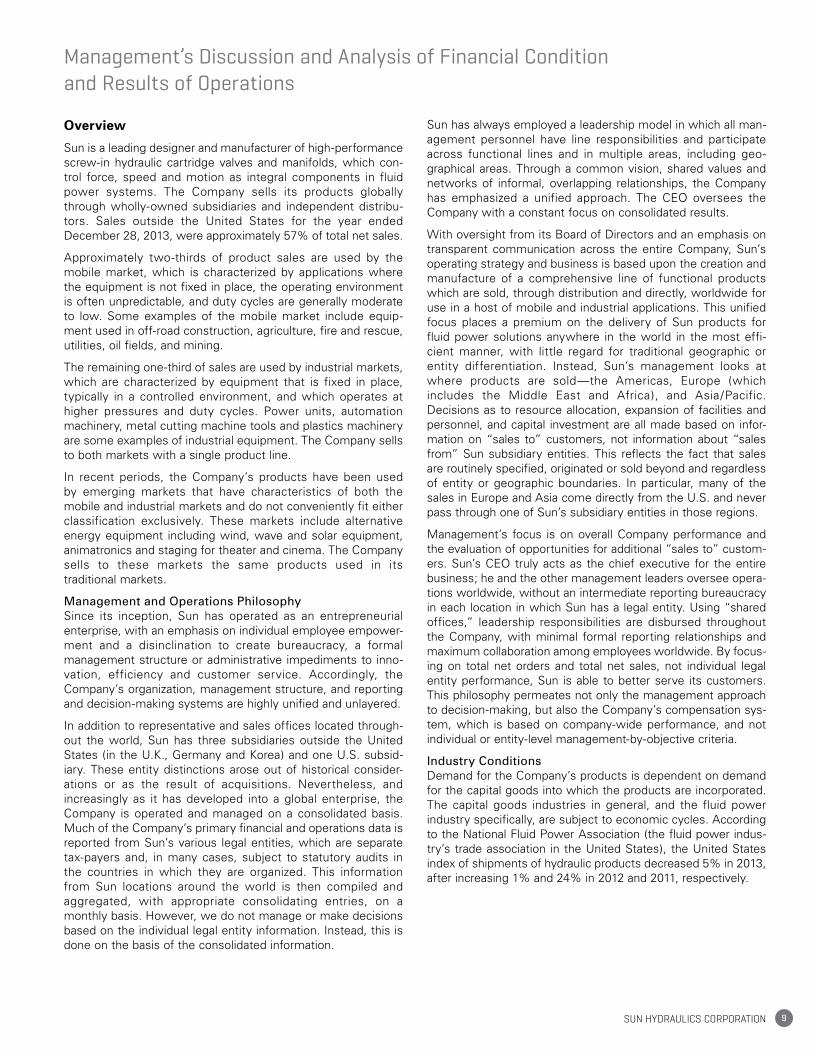
Overview
Sun is a leading designer and manufacturer of high-performance screw-in hydraulic cartridge valves and manifolds, which con-trol force, speed and motion as integral components in fluid power systems. The Company sells its products globally through wholly-owned subsidiaries and independent distribu-tors. Sales outside the United States for the year ended December 28, 2013, were approximately 57% of total net sales.
Approximately two-thirds of product sales are used by the mobile market, which is characterized by applications where the equipment is not fixed in place, the operating environment is often unpredictable, and duty cycles are generally moderate to low. Some examples of the mobile market include equip-ment used in off-road construction, agriculture, fire and rescue, utilities, oil fields, and mining.
The remaining one-third of sales are used by industrial markets, which are characterized by equipment that is fixed in place, typically in a controlled environment, and which operates at higher pressures and duty cycles. Power units, automation machinery, metal cutting machine tools and plastics machinery are some examples of industrial equipment. The Company sells to both markets with a single product line.
In recent periods, the Company’s products have been used by emerging markets that have characteristics of both the mobile and industrial markets and do not conveniently fit either classification exclusively. These markets include alternative energy equipment including wind, wave and solar equipment, animatronics and staging for theater and cinema. The Company sells to these markets the same products used in its traditional markets.
Management and Operations PhilosophySince its inception, Sun has operated as an entrepreneurial enterprise, with an emphasis on individual employee empower-ment and a disinclination to create bureaucracy, a formal management structure or administrative impediments to inno-vation, efficiency and customer service. Accordingly, the Company’s organization, management structure, and reporting and decision-making systems are highly unified and unlayered.
In addition to representative and sales offices located through-out the world, Sun has three subsidiaries outside the United States (in the U.K., Germany and Korea) and one U.S. subsid-iary. These entity distinctions arose out of historical consider-ations or as the result of acquisitions. Nevertheless, and increasingly as it has developed into a global enterprise, the Company is operated and managed on a consolidated basis. Much of the Company’s primary financial and operations data is reported from Sun’s various legal entities, which are separate tax-payers and, in many cases, subject to statutory audits in the countries in which they are organized. This information from Sun locations around the world is then compiled and aggregated, with appropriate consolidating entries, on a monthly basis. However, we do not manage or make decisions based on the individual legal entity information. Instead, this is done on the basis of the consolidated information.
Sun has always employed a leadership model in which all man-agement personnel have line responsibilities and participate across functional lines and in multiple areas, including geo-graphical areas. Through a common vision, shared values and networks of informal, overlapping relationships, the Company has emphasized a unified approach. The CEO oversees the Company with a constant focus on consolidated results.
With oversight from its Board of Directors and an emphasis on transparent communication across the entire Company, Sun’s operating strategy and business is based upon the creation and manufacture of a comprehensive line of functional products which are sold, through distribution and directly, worldwide for use in a host of mobile and industrial applications. This unified focus places a premium on the delivery of Sun products for fluid power solutions anywhere in the world in the most effi-cient manner, with little regard for traditional geographic or entity differentiation. Instead, Sun’s management looks at where products are sold—the Americas, Europe (which includes the Middle East and Africa), and Asia/Pacific. Decisions as to resource allocation, expansion of facilities and personnel, and capital investment are all made based on infor-mation on “sales to” customers, not information about “sales from” Sun subsidiary entities. This reflects the fact that sales are routinely specified, originated or sold beyond and regardless of entity or geographic boundaries. In particular, many of the sales in Europe and Asia come directly from the U.S. and never pass through one of Sun’s subsidiary entities in those regions.
Management’s focus is on overall Company performance and the evaluation of opportunities for additional “sales to” custom-ers. Sun’s CEO truly acts as the chief executive for the entire business; he and the other management leaders oversee opera-tions worldwide, without an intermediate reporting bureaucracy in each location in which Sun has a legal entity. Using “shared offices,” leadership responsibilities are disbursed throughout the Company, with minimal formal reporting relationships and maximum collaboration among employees worldwide. By focus-ing on total net orders and total net sales, not individual legal entity performance, Sun is able to better serve its customers. This philosophy permeates not only the management approach to decision-making, but also the Company’s compensation sys-tem, which is based on company-wide performance, and not individual or entity-level management-by-objective criteria.
Industry ConditionsDemand for the Company’s products is dependent on demand for the capital goods into which the products are incorporated. The capital goods industries in general, and the fluid power industry specifically, are subject to economic cycles. According to the National Fluid Power Association (the fluid power indus-try’s trade association in the United States), the United States index of shipments of hydraulic products decreased 5% in 2013, after increasing 1% and 24% in 2012 and 2011, respectively.
Management’s Discussion and Analysis of Financial Condition and Results of Operations
2013 AnnuAl RepoRt10
The Company’s order trend has historically tracked closely to the United States Purchasing Managers Index (PMI), with the PMI providing a six to ten months leading indication of busi-ness conditions. A PMI above 50 indicates economic expan-sion in the manufacturing sector and when below 50, it indicates economic contraction. The index increased to 56.5 in December 2013, from 50.4 in December 2012. The index was at or above 50 for all of 2013, with it showing considerable strength in the second half of the year. The index in the early part of 2014 decreased slightly with January at 51.3, but rebounded in February to 53.2. Adverse weather conditions across the U.S. contributed to the lower readings. However, February still signals the ninth consecutive month that the PMI has been above 50. Management believes the growth in the manufacturing sector is a positive sign for the Company’s business in 2014.
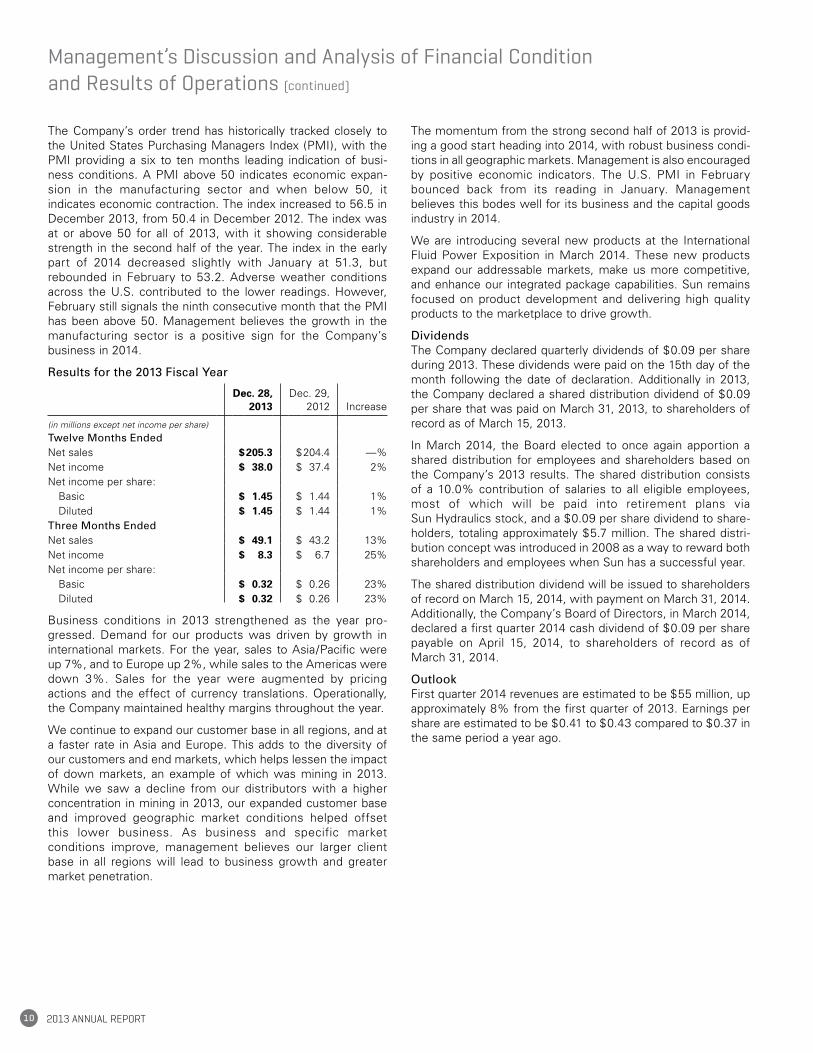
Results for the 2013 Fiscal Year
Dec. 28, 2013
Dec. 29, 2012 Increase
(in millions except net income per share)
Twelve Months EndedNet sales $205.3 $204.4 —%Net income $ 38.0 $ 37.4 2%Net income per share: Basic $ 1.45 $ 1.44 1% Diluted $ 1.45 $ 1.44 1%Three Months EndedNet sales $ 49.1 $ 43.2 13%Net income $ 8.3 $ 6.7 25%Net income per share: Basic $ 0.32 $ 0.26 23% Diluted $ 0.32 $ 0.26 23%
Business conditions in 2013 strengthened as the year pro-gressed. Demand for our products was driven by growth in international markets. For the year, sales to Asia/Pacific were up 7%, and to Europe up 2%, while sales to the Americas were down 3%. Sales for the year were augmented by pricing actions and the effect of currency translations. Operationally, the Company maintained healthy margins throughout the year.
We continue to expand our customer base in all regions, and at a faster rate in Asia and Europe. This adds to the diversity of our customers and end markets, which helps lessen the impact of down markets, an example of which was mining in 2013. While we saw a decline from our distributors with a higher concentration in mining in 2013, our expanded customer base and improved geographic market conditions helped offset this lower business. As business and specific market conditions improve, management believes our larger client base in all regions will lead to business growth and greater market penetration.
The momentum from the strong second half of 2013 is provid-ing a good start heading into 2014, with robust business condi-tions in all geographic markets. Management is also encouraged by positive economic indicators. The U.S. PMI in February bounced back from its reading in January. Management believes this bodes well for its business and the capital goods industry in 2014.
We are introducing several new products at the International Fluid Power Exposition in March 2014. These new products expand our addressable markets, make us more competitive, and enhance our integrated package capabilities. Sun remains focused on product development and delivering high quality products to the marketplace to drive growth.
DividendsThe Company declared quarterly dividends of $0.09 per share during 2013. These dividends were paid on the 15th day of the month following the date of declaration. Additionally in 2013, the Company declared a shared distribution dividend of $0.09 per share that was paid on March 31, 2013, to shareholders of record as of March 15, 2013.
In March 2014, the Board elected to once again apportion a shared distribution for employees and shareholders based on the Company’s 2013 results. The shared distribution consists of a 10.0% contribution of salaries to all eligible employees, most of which will be paid into retirement plans via Sun Hydraulics stock, and a $0.09 per share dividend to share-holders, totaling approximately $5.7 million. The shared distri-bution concept was introduced in 2008 as a way to reward both shareholders and employees when Sun has a successful year.
The shared distribution dividend will be issued to shareholders of record on March 15, 2014, with payment on March 31, 2014. Additionally, the Company’s Board of Directors, in March 2014, declared a first quarter 2014 cash dividend of $0.09 per share payable on April 15, 2014, to shareholders of record as of March 31, 2014.
OutlookFirst quarter 2014 revenues are estimated to be $55 million, up approximately 8% from the first quarter of 2013. Earnings per share are estimated to be $0.41 to $0.43 compared to $0.37 in the same period a year ago.
Management’s Discussion and Analysis of Financial Condition and Results of Operations (continued)
11Sun HydraulicS corporation
Results of OperationsThe following table sets forth, for the periods indicated, certain items in the Company’s statements of operations as a percentage of net sales.
For the year endedDec. 28,
2013Dec. 29,
2012Dec. 31,
2011Jan. 1,
2011Jan. 2,
2010
Net sales 100.0% 100.0% 100.0% 100.0% 100.0%Gross profit 40.4% 39.4% 38.8% 34.7% 22.5%Operating income 27.4% 26.6% 27.1% 20.6% 2.2%Income before income taxes 27.9% 27.3% 28.2% 21.0% 2.1%
Comparison of Years Ended December 28, 2013, and December 29, 2012
Net SalesNet sales were $205.3 million, an increase of $0.9 million, compared to $204.4 million in 2012. Demand for our products in 2013 was primarily driven by increased demand in our inter-national end markets, which primarily include capital goods equipment. Price increases, effective July 1, 2012, and October 1, 2013, contributed approximately 2% to sales. Exchange rates had a positive impact on sales in 2013 of approximately $1.1 million compared to a negative effect in the prior year of approx-imately $2.3 million. New product sales (defined as products introduced within the last five years) continue to make up 10%-15% of total sales.
Asian/Pacific sales increased 7.0% or $2.8 million, to $42.3 mil-lion in 2013, primarily related to demand from Korea and China. These amounts were partially offset from declines in Australia. Exchange rates had a $0.6 million positive impact on Asia/Pacific sales in 2013. EAME sales increased 1.9% or $1.1 mil-lion, to $61.2 million in 2013, resulting from the general eco-nomic improvement in Europe. Additionally, currency had a $0.5 million positive impact to EAME sales in 2013. Sales to the Americas decreased 2.9% or $3.0 million, to $101.7 million in 2013, due to weaker demand in the first three quarters of the year.
Gross ProfitGross profit increased $2.4 million or 3.0% to $83.0 million in 2013, compared to $80.6 million in 2012. Gross profit as a percentage of net sales increased to 40.4% in 2013, compared to 39.4% in 2012.
The increase in gross profit was attributed to price increases in July 2012 and October 2013, totaling approximately $4.6 million and decreases in material costs as a percent of sales of approx-imately $0.2 million. These amounts were partially offset by increased labor costs of $0.5 million related primarily to the addition of Seungwon, and overhead costs as a percent of sales of approximately $0.4 million. Additionally, sales volume, excluding pricing, reduced gross profit approximately $1.5 million.
Selling, Engineering, and Administrative ExpensesSelling, engineering and administrative expenses in 2013 were $26.8 million, a $0.6 million, or 2.4%, increase, compared to $26.2 million in 2012. The change for 2013 was related to increases in compensation of approximately $0.7 million, pri-marily related to stock compensation, and amounts associated with Seungwon of approximately $0.3 million that were not present in the prior year. These amounts were partially offset by reduced professional fees of approximately $0.2 million.
Operating IncomeOperating income increased $1.8 million or 3.2% to $56.2 mil-lion in 2013, compared to $54.4 million in 2012, with operating margins of 27.4% and 26.6% for 2013 and 2012, respectively.
The Company derives its operating income based on the con-solidated results of its legal entities. The Company has made the decision to consolidate engineering and manufacturing for the most part in the U.S. The Company’s foreign subsidiaries primarily act as part of our sales and distribution channel. This structure results in different operating margins between the legal entities due to the mix of products, channels to market, and industries present in different geographic regions.
Products manufactured in the U.S. are sold worldwide. Pricing, operations and cost structure are the primary reasons that operating income in the U.S. is higher than foreign subsid-iary operating income, which we expect will continue. Our German and U.K. entities act as value add distributors. These entities sell to both end use customers in their respective regions, as well as to third party distributors in certain parts of Europe. U.K. margins have historically been lower than Germany margins. This is due to the fact that, in the U.K., we manufac-ture iron manifolds for the European market. This results in higher overhead costs primarily related to machinery and equip-ment, and the employment of nearly twice as many people as in Germany. Margins are lowest in our Korean entity. Korea, more than any other subsidiary, sells direct to large OEM customers where pricing pressure is most pronounced.
2013 AnnuAl RepoRt12
The U.S. legal entity contributed $45.5 million to our consoli-dated operating income during 2013 compared to $44.4 million during 2012, an increase of $1.1 million. Increased revenue con-tributed approximately $0.8 million to operating income, while margin expansion, primarily related to pricing, contributed $0.4 million. Increased revenue volume was driven by sales to China, and to Europe, specifically Norway, the Netherlands, and Italy. Increasingly, the U.S. legal entity ships products directly to cus-tomers around the world. Third party export sales from the U.S. were $54.2 million in 2013 compared to $50.2 million in 2012. As demand strengthens internationally, the U.S. legal entity will benefit from these direct export sales.
Our Korean subsidiary contributed $1.8 million to our consoli-dated operating income during 2013 compared to $1.2 million during 2012, an increase of $0.6 million. Margins expanded from approximately 7% in 2012 to approximately 9% in 2013, representing $0.5 million of the increased operating income. Margins were impacted by reduced material costs related to items purchased in U.S. Dollars and a strengthening Korean Won. These amounts were partially offset by cost increases associated with Seungwon.
Our German subsidiary contributed $5.5 million to our consoli-dated operating income during 2013 compared to $5.4 million during 2012, an increase of $0.1 million. The increase was related to volume as margins remained flat at approximately 21%. Material cost decreases related to purchases of material in U.S. Dollars and a strengthening Euro were offset by increased overhead and selling, engineering and administration costs primarily related to trade show and compensation expenses.
Our U.K. subsidiary contributed $3.5 million to our consolidated operating income during 2013 compared to $3.7 million during 2012, a decrease of $0.2 million. Decreased volume reduced operating income approximately $0.5 million. This was partially offset by improved margins of approximately $0.3 million. Margins improved from approximately 18% in 2012 to approxi-mately 20% in 2013. The increase in margins was primarily related to decreased material costs which were partially offset by fixed overhead costs as a percent of sales.
Interest Income, NetNet interest income for 2013 was $1.0 million compared to net interest income of $1.4 million for 2012. Total average cash and marketable securities for 2013 was $82.9 million compared to total average cash and marketable securities for 2012 of $86.9 million, excluding the dividend payment on December 28, 2012. Although total cash and marketable securities remained high in 2013, interest rates and investment returns remain at low lev-els. Interest is primarily derived from investments in corporate and municipal bonds, mutual funds, certificates of deposit, and money market funds.
Foreign Currency Transaction (Gain) Loss, NetNet foreign currency transaction gain was minimal in 2013 compared to $0.1 million in 2012. The U.S. Dollar weakened against the Euro and the Korean Won at times during 2013, resulting in foreign currency transaction gains at our German and Korean locations. These amounts were partially offset at our U.K. location due to a strengthening U.S. Dollar against the British Pound at times during 2013.
Miscellaneous (Income) Expense, NetNet miscellaneous (income) expense was minimal in 2013 and 2012. During the current year, costs associated with the reloca-tion of our Kansas operations of approximately $0.7 million were offset by a gain of $0.5 million as a result of remeasuring to fair value our 40% equity interest in WhiteOak Controls held before the business combination, and an incentive received for the activation of our thermal storage energy building on our new facility of approximately $0.5 million.
Income TaxesThe provision for income taxes for the year ended December 28, 2013, was 33.6% of pretax income compared to a provision of 33.0% for the year ended December 29, 2012. The change was primarily due to the relative levels of income and different tax rates in effect among the countries in which the Company sells its products. The provisions were affected by discrete items related to a reserve for uncertain tax positions from previous years. Excluding these discrete items, the effective rate would have been approximately 33.3% and 31.8% for the years ended December 28, 2013, and December 29, 2012, respectively.
Comparison of Years Ended December 29, 2012, and December 31, 2011
Historically, the Company had four operating and reportable segments, which were based on the geographic location of its subsidiaries. In 2012, the Company re-evaluated its operating and reportable segments, resulting in a change to a single reportable segment in manufacturing, marketing, selling and distributing its products worldwide. Prior period financial infor-mation included herein has been restated to reflect the financial position and results of operations as one segment.
Net SalesNet sales were $204.4 million, an increase of $0.2 million, compared to $204.2 million in 2011. Demand for our products in 2012 was primarily driven by increased demand in our North American end markets, which primarily include capital goods equipment. Price increases, effective July 1, 2011, and 2012, contributed approximately 3% to sales. Exchange rates had a negative impact on sales in 2012 of approximately $2.3 million compared to a positive effect in the prior year of approximately $2.6 million. Sales from HCT increased approximately $2.5 mil-lion compared to the prior year. New product sales (defined as products introduced within the last five years) continue to make up 10%-15% of total sales.
Management’s Discussion and Analysis of Financial Condition and Results of Operations (continued)
13Sun HydraulicS corporation
Sales to the Americas increased 9.4% or $9.0 million, to $105.0 million in 2012, driven by North American demand. Asian/Pacific sales decreased 8.8% or $3.8 million, to $39.6 million in 2012, primarily related to demand from Korea and China. Exchange rates had a $0.4 million negative impact on Asia/Pacific sales in 2012. EAME sales decreased 7.8% or $5.0 mil-lion, to $59.8 million in 2012, resulting from the general eco-nomic slowdown in Europe. Additionally, currency had a $1.9 million negative impact to EAME sales in 2012.
Gross ProfitGross profit increased $1.4 million or 1.7% to $80.6 million in 2012, compared to $79.2 million in 2011. Gross profit as a per-centage of net sales increased to 39.4% in 2012, compared to 38.8% in 2011.
The increase in gross profit was attributed to price increases in July 2011 and 2012, totaling approximately $6.2 million, and decreases in variable overhead costs as a percent of sales of approximately $1.6 million primarily related to reduced overtime and retirement benefits. These amounts were partially offset by increased material costs of $2.5 million, labor costs of $0.7 million, and fixed overhead costs as a percent of sales of $0.9 million. Additionally, sales volume, excluding pricing, reduced gross profit approximately $2.3 million.
Current year overhead expense includes approximately $0.7 million less expense relating to the shared distribution as compared to the prior year.
Selling, Engineering, and Administrative ExpensesSelling, engineering and administrative expenses in 2012 were $26.2 million, a $2.2 million, or 9.3%, increase, compared to $23.9 million in 2011. The change for 2012 was primarily due to expenses at HCT of approximately $1.3 million, which were included in the current year, and increased com-pensation costs of $0.9 million, including stock and variable director compensation.
Operating IncomeOperating income decreased $0.8 million or 1.5% to $54.4 mil-lion in 2012, compared to $55.3 million in 2011, with operating margins of 26.6% and 27.1% for 2012 and 2011, respectively. The Company derives its operating income based on the con-solidated results of its legal entities. The Company has made the decision to consolidate engineering and manufacturing for the most part in the U.S. The Company’s foreign subsidiaries primarily act as part of our sales and distribution channel. This structure results in different operating margins between the legal entities due to the mix of products, channels to market, and industries present in different geographic regions.
Products manufactured in the U.S. are sold worldwide. Pricing, operations and cost structure are the primary reasons that oper-ating income in the U.S. is higher than foreign subsidiary operat-ing income, which we expect will continue. Our German and U.K. entities act as value add distributors. These entities sell to both end use customers in their respective regions, as well as to third party distributors in certain parts of Europe. U.K. mar-gins have historically been lower than Germany margins. This is
due to the fact that in the U.K., we manufacture iron manifolds for the European market. This results in higher overhead costs primarily related to machinery and equipment, and the employ-ment of nearly twice as many people as in Germany. Margins are lowest in our Korean entity. Korea, more than any other subsidiary, sells direct to large OEM customers where pricing pressure is most pronounced.
The U.S. legal entity contributed $44.4 million to our consoli-dated operating income during 2012 compared to $41.8 million during 2011, an increase of $2.6 million. The increase was pri-marily related to an increase in volume as operating margins remained flat at approximately 32%. This increased volume was driven by North American sales. Increasingly, the U.S. legal entity ships products directly to customers around the world. Third party export sales from the U.S. were $50.2 mil-lion in 2012 compared to $49.7 million in 2011.
Our Korean subsidiary contributed $1.2 million to our consoli-dated operating income during 2012 compared to $2.5 million during 2011, a decrease of $1.3 million. Margins contracted from approximately 12% in 2011 to approximately 7% in 2012. Korea, more than any other subsidiary, sells direct to large OEM customers. Sales volume declined due to lower demand from these customers within Korea and for product ultimately being sold to China. Margins were also impacted by increased material costs.
Our German subsidiary contributed $5.4 million to our consoli-dated operating income during 2012 compared to $6.7 million during 2011, a decrease of $1.3 million. Margins contracted from approximately 24% in 2011 to approximately 21% in 2012. The decrease in operating margins was primarily related to reduced demand within Europe and increased material costs. Material cost increases were related to purchases of material in U.S. Dollars and a weakening Euro.
Our U.K. subsidiary contributed $3.7 million to our consolidated operating income during 2012 compared to $4.2 million during 2011, a decrease of $0.5 million. Margins improved from approx-imately 17% in 2011 to approximately 18% in 2012. The decrease in operating income was primarily related to decreased sales volume resulting in $0.6 million in less operating income. This amount was primarily offset by reduced material costs as a percent of sales of approximately $0.5 million.
Interest Income, NetNet interest income for 2012 was $1.4 million compared to net interest income of $0.8 million for 2011. Excluding the dividend payment on December 28, 2012, total average cash and marketable securities for 2012 was $86.9 million compared to total average cash and marketable securities of $59.0 million for 2011. Although total cash and marketable securities increased in 2012, interest rates and investment returns remain at low levels. Interest is primarily derived from investments in corporate and municipal bonds, mutual funds, certificates of deposit, and money market funds.
2013 AnnuAl RepoRt14
Foreign Currency Transaction (Gain) Loss, NetNet foreign currency transaction gain was $0.1 million in 2012 compared to $0.2 million in 2011. The U.S. Dollar weakened against the Euro, the Korean Won and the British Pound at times during 2012, resulting in foreign currency transaction gains at our German and Korean locations. These amounts were partially offset by assets held in U.S. dollars at our U.K. location.
Miscellaneous (Income) Expense, NetNet miscellaneous expense was minimal in 2012 compared to income of $1.4 million in 2011. The prior period amount included a gain of $1.2 million as a result of remeasuring to fair value its 38% equity interest in HCT held before the business combina-tion. The remaining 2011 income was related to the gain on the sale of the Chinese joint venture company.
Income TaxesThe provision for income taxes for the year ended December 29, 2012, was 33.0% of pretax income compared to a provision of 34.6% for the year ended December 31, 2011. The change was primarily due to the relative levels of income and different tax rates in effect among the countries in which the Company sells its products. The provisions were affected by discrete items related to a reserve for uncertain tax positions from previous years. Excluding these discrete items, the effec-tive rate would have been approximately 31.8% and 33.8% for the years ended December 29, 2012, and December 31, 2011, respectively.
Liquidity and Capital ResourcesHistorically, the Company’s primary source of capital has been cash generated from operations, although short-term fluctua-tions in working capital requirements have been met through borrowings under revolving lines of credit as needed. The Company’s principal uses of cash have been paying operating expenses, paying dividends to shareholders, making capital expenditures, and servicing debt.
Net cash flow from operations in 2013 was $47.1 million, com-pared to $52.2 million in 2012 and $49.5 million in 2011. The $5.1 million decrease in the Company’s net cash flow from operations in 2013 was due primarily to changes in accounts receivable and inventory. Changes in inventory and accounts receivable reduced cash $4.4 million in the current year com-pared to an increase in cash of $2.2 million in the prior year. These changes were primarily related to improved business conditions in the fourth quarter of 2013. Days sales outstanding increased to 28 in 2013 from 27 in 2012. Inventory turns decreased to 9.3 in 2013 from 9.8 in 2012. Cash on hand increased $20.4 million from $34.5 million in 2012 to $54.9 mil-lion in 2013. Investments in marketable securities increased $1.0 million from $37.7 million in 2012 to $38.7 million in 2013.
The $2.7 million increase in the Company’s net cash flow from operations in 2012 was due primarily to changes in non-cash adjustments to net income and changes in working capital relating to accounts receivable, inventories, accounts payable, and accrued expenses. These changes were primarily related
to the slower general business conditions in the fourth quarter of 2012.
In 2012, the Company began construction on a third manufac-turing facility in Sarasota, Florida. The new facility has 58,000 square feet of manufacturing and 17,000 square feet of office space. The Company began moving manufacturing operations into the facility during the third quarter of 2013 and began occu-pying the office space in the fourth quarter. As part of this tran-sition, the Company closed its Kansas location and moved those operations to this new facility. The total investment in the new facility was approximately $17.0 million. Total one-time costs to relocate the Kansas operation were approximately $0.9 million, which were incurred in the third and fourth quar-ters of 2013. Fixed costs associated with the new facility, net of the savings realized from relocating the Kansas facility, are estimated to be approximately $1.0 million annually.
Capital expenditures were $17.9 million in 2013, compared to $13.4 million in 2012 and $10.1 million in 2011. Included in capi-tal expenditures for 2013 and 2012 were approximately $10.6 million and $7.3 million, respectively, relating to the new Sarasota facility. Additionally, approximately $1.4 million and $1.0 million for an expansion and update of our U.K. facility was included in 2013 and 2012, respectively. Included in capital expenditures for the year ended December 31, 2011 was a building expansion of $1.0 million and an infrastructure utility building of $3.0 million. The remaining expenditures consisted of purchases of machinery and equipment.
Capital expenditures for 2014 are estimated to be $10.0 million, which includes approximately $2.0 million for the renovation of the Company’s Manatee County facility originally constructed in 1997, with the remainder primarily consisting of purchases of machinery and equipment.
Effective August 1, 2011, the Company entered into a credit and security agreement in the U.S. with Fifth Third Bank (the “Bank”). The agreement provides for three separate credit facilities totaling $50 million.
Facility A is a $15 million unsecured revolving line of credit and requires monthly payments of interest. Facility A has a floating interest rate of 1.45% over the 30-day LIBOR Rate (as defined).
Facility B is an accordion feature to increase the revolving line of credit to a $35 million secured revolving line of credit. Facility B will be secured by the Company’s U.S. assets, including its manufacturing facilities, and requires monthly payments of interest. Facility B will bear interest at the 30-day LIBOR Rate or the Bank’s Base Rate (as defined), at the Company’s discre-tion, plus a margin based on the Borrower’s Funded Debt to EBITDA Leverage Ratio (as defined). The LIBOR Margin ranges from 1.45% to 2.25% and the Bank’s Base Rate ranges from -0.25% to 0.00%.
Facility C provided for a $15 million construction and term loan. The Company did not activate Facility C for the construction of its new Sarasota factory.
Management’s Discussion and Analysis of Financial Condition and Results of Operations (continued)
15Sun HydraulicS corporation
Facility A or Facility B (if activated) is payable in full on August 1, 2016. Maturity may be accelerated by the Bank upon an Event of Default (as defined). Prepayment may be made with-out penalty or premium at any time upon the required notice to the Bank.
Facility A is subject to debt covenants (capitalized terms are defined therein) including: 1) Minimum Tangible Net Worth of not less than $92 million, increased annually by 50% of Net Income, and 2) Minimum EBITDA of not less than $5 million; and requires the Company to maintain its primary domestic deposit accounts with the bank.
If Facility B is activated, covenant 2 above will automatically terminate and two additional covenants will be required: 1) Funded Debt to EBITDA ratio equal to or less than 3.0:1.0, and 2) EBIT to Interest Expense ratio of not less than 2.5:1.0.
The Company did not have any amounts drawn on Facilities A, B, or C for the periods ended December 28, 2013, and December 29, 2012.
As a result of the acquisition of HCT on September 27, 2011, the Company acquired a line of credit equal to $100. Interest on the line of credit is equal to Prime plus 5%. The Company can-celled this line of credit during the fourth quarter of 2011.
As a result of the acquisition of Seungwon on October 18, 2012, the Company acquired a loan equal to $169. The Company paid and cancelled the loan during the fourth quarter of 2012.
Except as noted below, the Company declared the following regular quarterly dividends to shareholders of record on the last calendar day of the respective quarter, paid on the 15th day of each month following the date of declaration:
2013 2012 2011
First quarter $0.090 $0.090 $0.060Second quarter 0.090 0.090 0.090Third quarter 0.090 0.090 0.090Fourth quarter 0.090 0.090 0.090
In addition to the regular quarterly dividends, the Company declared shared distribution cash dividends in 2013, 2012 and 2011, equal to $0.09, $0.12 and $0.07, respectively. The 2013 dividend was paid on March 31, 2013, to shareholders of record on March 15, 2013, the 2012 dividend was paid on March 31, 2012, to shareholders of record on March 22, 2012, and the 2011 dividend was paid on March 31, 2011, to shareholders of record as of March 15, 2011. The shared distribution was intro-duced in 2008 as a way to reward both shareholders and employees when the Company has a successful year. The Board of Directors declared a shared distribution cash dividend of $0.09 per share, payable on March 31, 2014, to shareholders of record as of March 15, 2014.
In light of the Company’s cash position, its current and per-ceived uses for cash, and the likely increase in income tax rates on corporate dividends as of January 1, 2013, the Board of Directors in December 2012 declared a special one-time cash dividend of $1.00 per share to shareholders of record as of December 14, 2012. In anticipation of the expected tax law changes in 2013, the payment date for both the special divi-dend and the regular quarterly dividend of $0.09 per share was December 28, 2012.
The Company paid dividends totaling $9.4 million, $40.9 mil-lion, and $9.6 million for the years ended December 28, 2013, December 29, 2012, and December 31, 2011, respectively.
The declaration and payment of future dividends is subject to the sole discretion of the Board of Directors, and any determi-nation as to the payment of future dividends will depend upon the Company’s profitability, financial condition, capital needs, acquisition opportunities, future prospects and other factors deemed pertinent by the Board of Directors.
The Company believes that cash generated from operations and its borrowing availability under the revolving Line of Credit will be sufficient to satisfy the Company’s operating expenses and capital expenditures for the foreseeable future. In the event that economic conditions were to severely worsen for a pro-tracted period of time, the Company would have several options available to ensure liquidity in addition to increased borrowing. Capital expenditures could be postponed since they primarily pertain to long-term improvements in operations. Additional operating expense reductions also could be made. Finally, the dividend to shareholders could be reduced or suspended.
OTHER MATERIAL COMMITMENTS. Our contractual obliga-tions and debt obligations as of December 28, 2013, are summarized in the table below (in thousands):
Payments due by period
Contractual Obligations Total 20142015–2016
2017–2018 Thereafter
Operating leases $267 $121 $ 35 $39 $72Other long-term liabilities(1) 284 — 284 — —
Total contractual obligations $551 $121 $319 $39 $72
(1) Other long-term liabilities consist of a liability associated with the acquisition of Seungwon for a holdback amount of approximately $284,000.
Critical Accounting Policies and EstimatesThe Company currently only applies judgment and estimates which may have a material effect on the eventual outcome of assets, liabilities, revenues and expenses for impairment of long-lived assets, inventory, goodwill, accruals, income taxes, and fair value of short-term investments. The following explains the basis and the procedure for each account where judgment and estimates are applied.
2013 AnnuAl RepoRt16
Revenue RecognitionThe Company reports revenues, net of sales incentives, when title passes and risk of loss transfers to the customer. The effect of material non-recurring events related to product liabili-ties is provided for when they become known. The Company has not experienced any material product liabilities in the past.
Short-Term InvestmentsThe Company’s short-term investments have been classified and accounted for as available-for-sale. Management deter-mines the appropriate classification of its investments at the time of purchase and re-evaluates the designation at each bal-ance sheet date. The Company may or may not hold securities with stated maturities greater than 12 months until maturity. As management views these securities as available to support cur-rent operations, the Company classifies securities with maturi-ties beyond 12 months as current assets under the caption short-term investments in the accompanying Consolidated Balance Sheets. The Company’s short-term investments are carried at fair value, with the unrealized gains and losses reported as a component of shareholder’s equity. Realized gains and losses on sales of short-term investments are gener-ally determined using the specific identification method, and are included in miscellaneous (income) expense in the Consolidated Statements of Operations.
Fair Value MeasurementsThe Company applies fair value accounting guidelines for all financial assets and liabilities and non-financial assets and liabil-ities that are recognized or disclosed at fair value in the financial statements on a recurring basis (at least annually). Under these guidelines, fair value is defined as the price that would be received for the sale of an asset or paid to transfer a liability (i.e. an exit price) in an orderly transaction between market partici-pants at the measurement date. The guidance establishes a three-tier fair value hierarchy which prioritizes the inputs used in measuring fair value as follows:
Level 1—Quoted prices in active markets for identical assets or liabilities.
Level 2—Observable inputs other than quoted prices included in Level 1, such as quoted prices for similar assets or liabilities in active markets or quoted prices for identical assets or liabilities in inactive markets.
Level 3—Unobservable inputs that are supported by little, infrequent, or no market activity and reflect the Company’s own assumptions about inputs used in pricing the asset or liability.
The fair value hierarchy also requires an entity to maximize the use of observable inputs and minimize the use of unobservable inputs when measuring fair value.
The Company’s valuation techniques used to measure the fair value of marketable equity securities were derived from quoted prices in active markets for identical assets or liabilities. The valuation techniques used to measure the fair value of all other financial instruments were valued based on quoted mar-ket prices or model driven valuations using significant inputs derived from or corroborated by observable market data.
Impairment of Long-Lived AssetsLong-lived assets, such as property and equipment, and pur-chased intangibles subject to amortization, are reviewed for impairment whenever events or changes in circumstances indi-cate that the carrying amount of an asset may not be recover-able. Recoverability of the asset is measured by comparison of its carrying amount to future net cash flows the asset is expected to generate. If such assets are considered impaired, the impairment to be recognized is measured as the amount by which the carrying amount of the asset exceeds its fair value.
InventoryThe Company offers a wide variety of standard products and as a matter of policy does not discontinue products. On an ongoing basis, component parts found to be obsolete through design or process changes are disposed of and charged to material cost. The Company reviews on-hand balances of products and component parts against specific criteria. Products and component parts without usage or that have excess quantities on hand are evaluated. An inventory reserve is then established for the full inventory carrying value of those products and component parts deemed to be obsolete or slow moving. See Note 5 to the Financial Statements for inventory reserve amounts.
GoodwillGoodwill, which represents the excess of the purchase price of acquisition over the fair value of the net assets acquired, is car-ried at cost. Goodwill is tested for impairment annually or more often if events or circumstances indicate a reduction in the fair value below the carrying value. The carrying value of assets is calculated at the reporting unit. An impairment loss is recorded to the extent that the fair value of the goodwill within the reporting unit is less than its carrying value.
The Company completed its annual goodwill impairment test-ing and determined that the carrying amount of goodwill was not impaired. See Note 7 to the Financial Statements for good-will amounts.
AccrualsThe Company makes estimates related to certain employee benefits and miscellaneous accruals. Estimates for employee benefit accruals are based on management’s assessment of estimated liabilities related to workers’ compensation, health care benefits and annual contributions to an employee stock ownership plan (“ESOP”) established in 2004 as part of the Company’s retirement plan. Estimates for miscellaneous accruals are based on management’s assessment of estimated liabilities for costs incurred.
Management’s Discussion and Analysis of Financial Condition and Results of Operations (continued)
17Sun HydraulicS corporation
The Company accrues for health care benefit costs under a self-funded plan. The Company purchases re-insurance for both specific and aggregate stop losses on claims that exceed $155 thousand on an individual basis and approximately $8.0 million on an aggregate basis.
Income TaxesThe Company’s income tax policy provides for a liability approach under which deferred income taxes are provided for based upon enacted tax laws and rates applicable to the peri-ods in which the taxes become payable. These differences result from items reported differently for financial reporting and income tax purposes, primarily depreciation, accrued expenses and reserves.
The Company reports a liability for unrecognized tax benefits resulting from uncertain tax positions taken or expected to be taken in a tax return. The Company recognizes potential inter-est and penalties related to its unrecognized tax benefits in income tax expense. The Company files U.S. federal income tax returns as well as income tax returns in various states and foreign jurisdictions. The Company is no longer subject to income tax examinations by tax authorities for years prior to 2004 for the majority of tax jurisdictions.
The Company’s federal returns are currently under examination by the Internal Revenue Service (IRS) in the United States for the periods 2004 through 2011. Audit outcomes and the timing of audit settlements are subject to significant uncertainty. It is reasonably possible that within the next twelve months the Company will resolve some or all of the matters presently under consideration for 2004 through 2011 with the IRS and that there could be significant increases or decreases to unrec-ognized tax benefits. See Note 14 to the Financial Statements for income tax amounts, including reserves.
Off Balance Sheet ArrangementsThe Company does not engage in any off balance sheet financ-ing arrangements. In particular, the Company does not have any material interest in variable interest entities, which include special purpose entities and structured finance entities.
The Company used the equity method of accounting to account for its 40% equity investment in WhiteOak until April 2013 when the Company acquired the remaining 60% of the capital stock of WhiteOak. WhiteOak was merged into HCT. This investment was not material to the financial statements of the Company for the years ended December 28, 2013 and December 29, 2012.
SeasonalityThe Company generally has experienced increased sales during the second quarter of the year, largely as a result of the order patterns of our customers. As a result, the Company’s second quarter net sales, income from operations and net income historically are the highest of any quarter during the year.
InflationThe impact of inflation on the Company’s operating results has been moderate in recent years, reflecting generally lower rates of inflation in the economy. While inflation has not had, and the Company does not expect that it will have, a material impact upon operating results, there is no assurance that the Company’s business will not be affected by inflation in the future.
Quantitative and Qualitative Disclosures About Market Risk
The Company is exposed to market risk from changes in interest rates on borrowed funds, which could affect its results of operations and financial condition. The Company’s interest rate on its debt financing remains variable based upon the Company’s leverage ratio. The Company had no variable-rate debt outstanding at December 28, 2013, and December 29, 2012.
The Company’s exposure to foreign currency exchange fluctua-tions relates primarily to the direct investment in its facilities in the United Kingdom, Germany, and Korea. The Company does not use financial instruments to hedge foreign currency exchange rate changes.
2013 AnnuAl RepoRt18
Market Information
The Common Stock of the Company has been trading publicly under the symbol SNHY on the Nasdaq Global Select Market since the Company’s initial public offering on January 9, 1997. The following table sets forth the high and low closing sale prices of the Company’s Common Stock as reported by the Nasdaq Global Select Market and the dividends declared for the periods indicated.
High LowDividends
declared
2013First quarter $33.160 $26.080 $0.180Second quarter 33.610 29.640 0.090Third quarter 36.300 30.000 0.090Fourth quarter 43.270 34.950 0.090
2012First quarter $33.360 $23.710 $0.210Second quarter 26.930 21.070 0.090Third quarter 27.250 21.360 0.090Fourth quarter 27.990 23.730 1.090
Holders
There were 164 shareholders of record of Common Stock on April 7, 2014. The number of record holders was determined from the records of the Company’s transfer agent and does not include beneficial owners of Common Stock whose shares are held in the names of securities brokers, dealers, and registered clearing agencies. The Company believes that there are approx-imately 13,000 beneficial owners of Common Stock.
Dividends
Except as noted below, quarterly dividends were paid on the 15th day of each month following the date of declaration.
In addition to the regular quarterly dividends, the Company declared shared distribution cash dividends in 2013 and 2012 equal to $0.09 and $0.12, respectively. The 2013 dividend was paid on March 31, 2013, to shareholders of record on March 15, 2013, and the 2012 dividend was paid on March 31, 2012, to shareholders of record on March 22, 2012.
Additionally, in 2012 the Company declared a special cash divi-dend and accelerated payment of its fourth quarter dividend. In anticipation of the expected tax law changes in 2013, the spe-cial cash dividend of $1.00 per share and accelerated quarterly dividend of $0.09 per share were both paid on December 28, 2012, to shareholders of record as of December 14, 2012.
The Company’s Board of Directors has also declared a shared distribution cash dividend of $0.09 per share, payable on March 31, 2014, to shareholders of record as of March 15, 2014. Additionally, the Company’s Board of Directors declared a first quarter 2014 cash dividend of $0.09 per share payable on April 15, 2014, to shareholders of record as of March 31, 2014.
The Company’s Board of Directors currently intends to continue to pay a quarterly dividend of $0.09 per share during 2014. However, the declaration and payment of future dividends is subject to the sole discretion of the Board of Directors, and any determination as to the payment of future dividends will depend upon the Company’s profitability, financial condition, capital needs, acquisition opportunities, future prospects and other factors deemed pertinent by the Board of Directors.
Stock Split
On June 9, 2011, the Company declared a three-for-two stock split, effected in the form of a 50% stock dividend, to share-holders of record on June 30, 2011, payable on July 15, 2011. The Company issued approximately 8,500,000 shares of common stock as a result of the stock split.
The effect of this stock split on outstanding shares, earnings per share and dividends per share has been retroactively applied to all periods presented.
Equity Compensation Plans
Information called for by Item 5 of Regulation S-K is provided in Note 15 of our 2013 Audited Financial Statements.
Issuer Purchases of Equity Securities
The Company did not repurchase any of its stock during the fourth quarter of 2013.
Market for Registrant’s Common Equity, Related Stockholder Matters and Issuer Purchases of Equity Securities
19Sun HydraulicS corporation
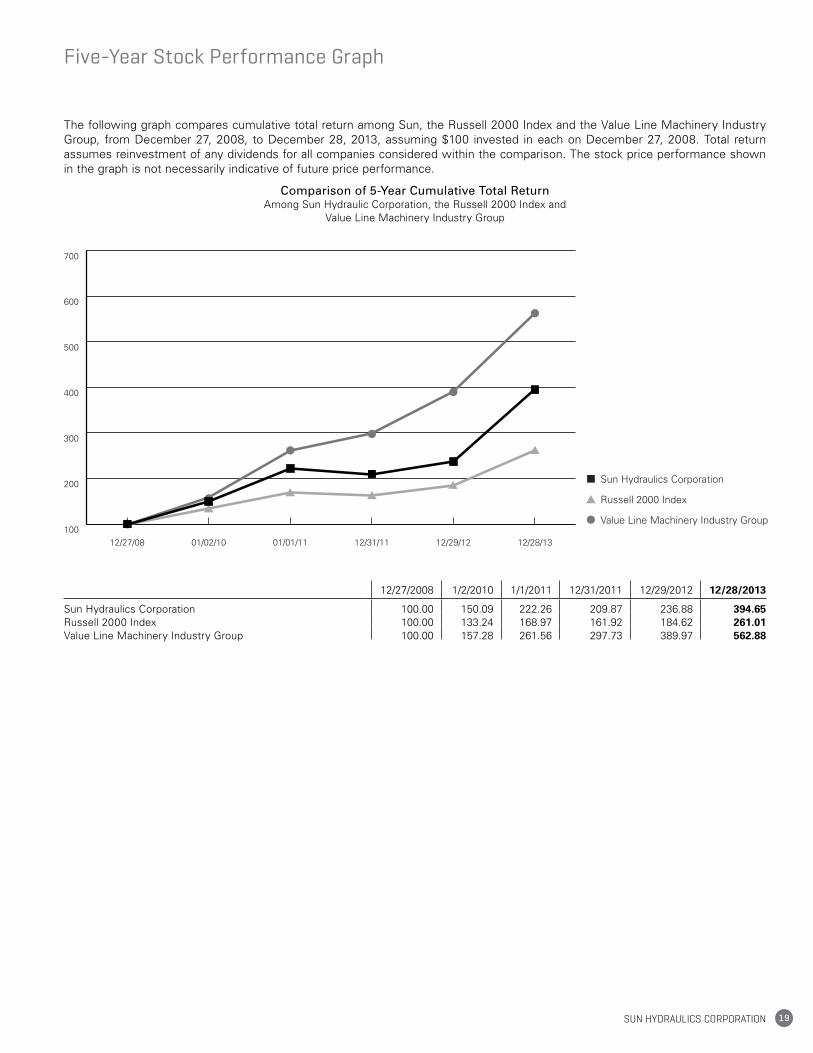
The following graph compares cumulative total return among Sun, the Russell 2000 Index and the Value Line Machinery Industry Group, from December 27, 2008, to December 28, 2013, assuming $100 invested in each on December 27, 2008. Total return assumes reinvestment of any dividends for all companies considered within the comparison. The stock price performance shown in the graph is not necessarily indicative of future price performance.
Comparison of 5-Year Cumulative Total ReturnAmong Sun Hydraulic Corporation, the Russell 2000 Index and
Value Line Machinery Industry Group
12/27/2008 1/2/2010 1/1/2011 12/31/2011 12/29/2012 12/28/2013
Sun Hydraulics Corporation 100.00 150.09 222.26 209.87 236.88 394.65Russell 2000 Index 100.00 133.24 168.97 161.92 184.62 261.01Value Line Machinery Industry Group 100.00 157.28 261.56 297.73 389.97 562.88
Five-Year Stock Performance Graph
Sun Hydraulics Corporation
Russell 2000 Index
Value Line Machinery Industry Group
100
200
300
400
500
600
700
12/28/1312/29/1212/31/1101/01/1101/02/1012/27/08
100
200
300
400
500
600
700
12/28/1312/29/1212/31/1101/01/1101/02/1012/27/08
2013 AnnuAl RepoRt20
This Annual Report contains “forward-looking statements” (within the meaning of the Private Securities Litigation Reform Act of 1995) that are based on current expectations, estimates, forecasts, and projections about us, our beliefs, and assump-tions made by us, including (i) our strategies regarding growth, including our intention to develop new products; (ii) our financ-ing plans; (iii) trends affecting our financial condition or results of operations; (iv) our ability to continue to control costs and to meet our liquidity and other financing needs; (v) the declaration and payment of dividends; and (vi) our ability to respond to changes in customer demand domestically and internationally, including as a result of standardization. In addition, we may make other written or oral statements, which constitute for-ward-looking statements, from time to time. Words such as “may,” “expects,” “projects,” “anticipates,” “intends,” “plans,” “believes,” “seeks,” “estimates,” variations of such words, and similar expressions are intended to identify such forward-looking statements. Similarly, statements that describe our future plans, objectives or goals also are forward-looking state-ments. These statements are not guarantees of future perfor-mance and are subject to a number of risks and uncertainties, including those discussed below and elsewhere in this report. Our actual results may differ materially from what is expressed or forecasted in such forward-looking statements, and undue reliance should not be placed on such statements. All forward-looking statements are made as of the date hereof, and we undertake no obligation to update any forward-looking statements, whether as a result of new information, future events or otherwise.
Factors that could cause actual results to differ materially from what is expressed or forecasted in such forward-looking statements include, but are not limited to: (i) conditions in the capital markets, including the interest rate environment and the availability of capital; (ii) changes in the competitive market-place that could affect our revenue and/or cost bases, such as increased competition, lack of qualified engineering, marketing, management or other personnel, and increased labor and raw materials costs; (iii) new product introductions, product sales mix and the geographic mix of sales nationally and internation-ally. Further information relating to factors that could cause actual results to differ from those anticipated is included but not limited to information under the headings Item 1 “Business,” Item 1A. “Risk Factors” and Item 7 “Management’s Discussion and Analysis of Financial Condition and Results of Operations” in the Form 10-K for the year ended December 28, 2013. The Company disclaims any intention or obligation to update or revise forward-looking statements, whether as a result of new information, future events or otherwise.
Forward-Looking Statements
21Sun HydraulicS corporation
To the Board of Directors andStockholders of Sun Hydraulics Corporation
We have audited the accompanying consolidated balance sheets of Sun Hydraulics Corporation (a Florida Corporation) and subsidiaries (collectively, the Company) as of December 28, 2013, December 29, 2012 and December 31, 2011, and the related consolidated statements of operations, comprehensive income, stockholders’ equity, and cash flows for each of the years in the three-year period ended December 28, 2013. We also have audited Sun Hydraulics Corporation and subsidiaries’ internal control over financial reporting as of December 28, 2013 based on criteria established in Internal Control —Integrated Framework (1992) issued by the Committee of Sponsoring Organizations of the Treadway Commission (COSO). The Company’s management is responsible for these consolidated financial statements, for maintaining effective internal control over financial reporting, and for its assessment of the effectiveness of internal control over financial reporting, included in the accompanying Management’s Report on Internal Control over Financial Reporting. Our responsibility is to express an opinion on these consolidated financial state-ments and an opinion on the company’s internal control over financial reporting based on our audits.
We conducted our audits in accordance with the standards of the Public Company Accounting Oversight Board (United States). Those standards require that we plan and perform the audits to obtain reasonable assurance about whether the con-solidated financial statements are free of material misstatement and whether effective internal control over financial reporting was maintained in all material respects. Our audits of the con-solidated financial statements included examining, on a test basis, evidence supporting the amounts and disclosures in the consolidated financial statements, assessing the accounting principles used and significant estimates made by manage-ment, and evaluating the overall consolidated financial state-ment presentation. Our audit of internal control over financial reporting included obtaining an understanding of internal control over financial reporting, assessing the risk that a material weak-ness exists, and testing and evaluating the design and operating effectiveness of internal control based on the assessed risk. Our audits also included performing such other procedures as we considered necessary in the circumstances. We believe that our audits provide a reasonable basis for our opinions.
A company’s internal control over financial reporting is a process designed to provide reasonable assurance regarding the reliabil-ity of financial reporting and the preparation of consolidated financial statements for external purposes in accordance with generally accepted accounting principles. A company’s internal control over financial reporting includes those policies and pro-cedures that (1) pertain to the maintenance of records that, in reasonable detail, accurately and fairly reflect the transactions and dispositions of the assets of the company; (2) provide rea-sonable assurance that transactions are recorded as necessary to permit preparation of consolidated financial statements in accordance with generally accepted accounting principles, and that receipts and expenditures of the company are being made only in accordance with authorizations of management and directors of the company; and (3) provide reasonable assurance regarding prevention or timely detection of unauthorized acquisi-tion, use, or disposition of the company’s assets that could have a material effect on the consolidated financial statements.
Because of its inherent limitations, internal control over finan-cial reporting may not prevent or detect misstatements. Also, projections of any evaluation of effectiveness to future periods are subject to the risk that controls may become inadequate because of changes in conditions, or that the degree of compliance with the policies or procedures may deteriorate.
In our opinion, the consolidated financial statements referred to above present fairly, in all material respects, the financial posi-tion of Sun Hydraulics Corporation and subsidiaries as of December 28, 2013 and December 29, 2012, and the results of its operations and its cash flows for each of the years in the three-year period ended December 28, 2013 in conformity with accounting principles generally accepted in the United States of America. Also in our opinion, Sun Hydraulics Corporation and subsidiaries maintained, in all material respects, effective inter-nal control over financial reporting as of December 28, 2013, based on criteria established in Internal Control—Integrated Framework (1992) issued by the Committee of Sponsoring Organizations of the Treadway Commission (COSO).
March 7, 2014Clearwater, Florida
Report of Independent Registered Public Accounting Firm
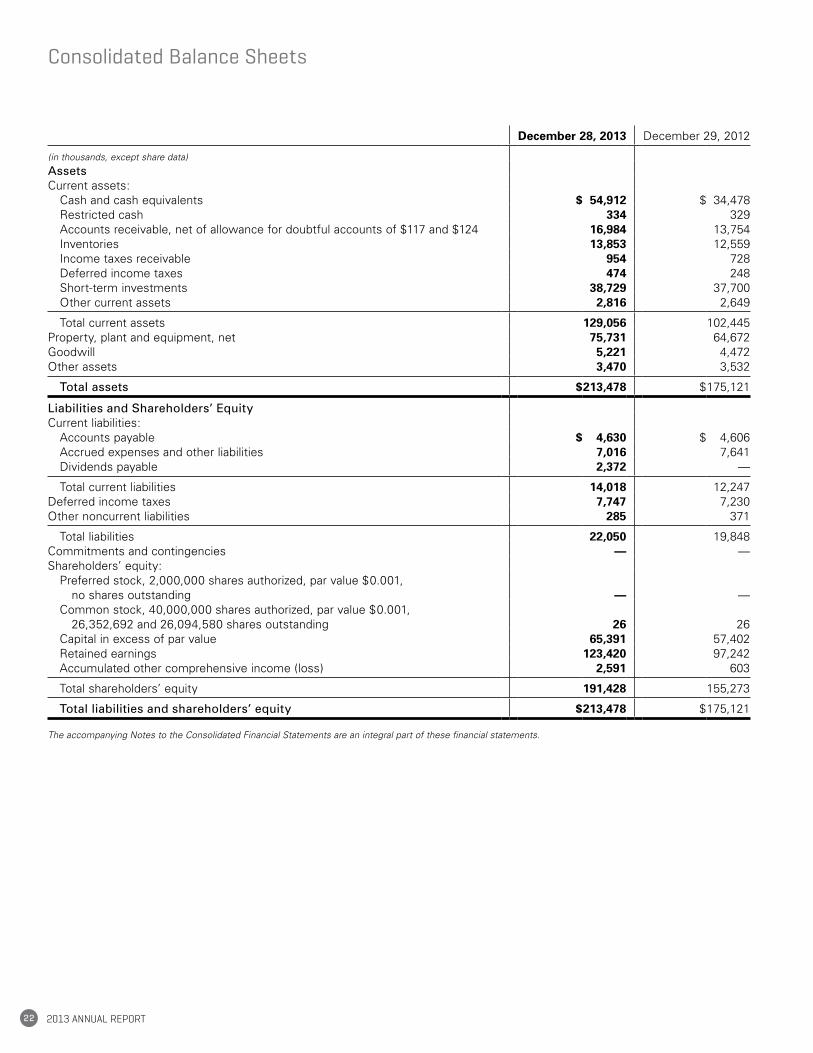
2013 AnnuAl RepoRt22
December 28, 2013 December 29, 2012
(in thousands, except share data)
AssetsCurrent assets: Cash and cash equivalents $ 54,912 $ 34,478 Restricted cash 334 329 Accounts receivable, net of allowance for doubtful accounts of $117 and $124 16,984 13,754 Inventories 13,853 12,559 Income taxes receivable 954 728 Deferred income taxes 474 248 Short-term investments 38,729 37,700 Other current assets 2,816 2,649
Total current assets 129,056 102,445Property, plant and equipment, net 75,731 64,672Goodwill 5,221 4,472Other assets 3,470 3,532
Total assets $213,478 $175,121
Liabilities and Shareholders’ EquityCurrent liabilities: Accounts payable $ 4,630 $ 4,606 Accrued expenses and other liabilities 7,016 7,641 Dividends payable 2,372 —
Total current liabilities 14,018 12,247Deferred income taxes 7,747 7,230Other noncurrent liabilities 285 371
Total liabilities 22,050 19,848Commitments and contingencies — —Shareholders’ equity: Preferred stock, 2,000,000 shares authorized, par value $0.001,
no shares outstanding — — Common stock, 40,000,000 shares authorized, par value $0.001,
26,352,692 and 26,094,580 shares outstanding 26 26 Capital in excess of par value 65,391 57,402 Retained earnings 123,420 97,242 Accumulated other comprehensive income (loss) 2,591 603
Total shareholders’ equity 191,428 155,273
Total liabilities and shareholders’ equity $213,478 $175,121
The accompanying Notes to the Consolidated Financial Statements are an integral part of these financial statements.
Consolidated Balance Sheets
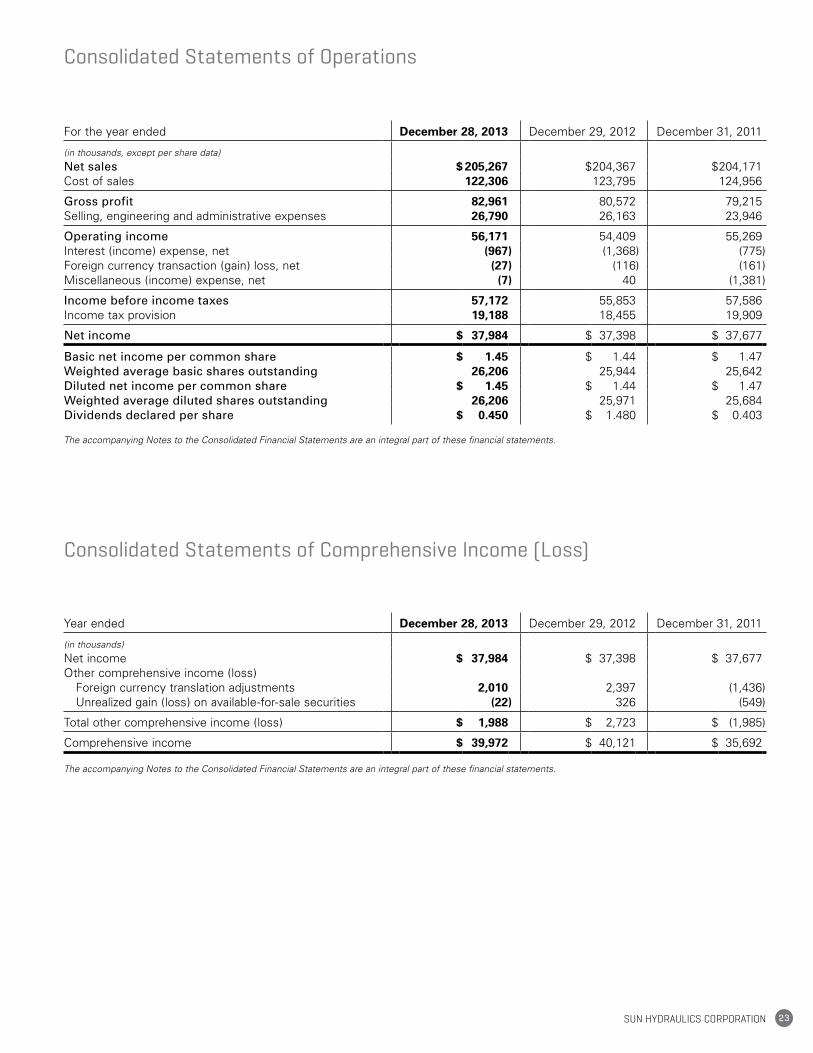
23Sun HydraulicS corporation
Consolidated Statements of Operations
For the year ended December 28, 2013 December 29, 2012 December 31, 2011
(in thousands, except per share data)
Net sales $ 205,267 $204,367 $204,171Cost of sales 122,306 123,795 124,956
Gross profit 82,961 80,572 79,215Selling, engineering and administrative expenses 26,790 26,163 23,946
Operating income 56,171 54,409 55,269Interest (income) expense, net (967) (1,368) (775)Foreign currency transaction (gain) loss, net (27) (116) (161)Miscellaneous (income) expense, net (7) 40 (1,381)
Income before income taxes 57,172 55,853 57,586Income tax provision 19,188 18,455 19,909
Net income $ 37,984 $ 37,398 $ 37,677
Basic net income per common share $ 1.45 $ 1.44 $ 1.47Weighted average basic shares outstanding 26,206 25,944 25,642Diluted net income per common share $ 1.45 $ 1.44 $ 1.47Weighted average diluted shares outstanding 26,206 25,971 25,684Dividends declared per share $ 0.450 $ 1.480 $ 0.403
The accompanying Notes to the Consolidated Financial Statements are an integral part of these financial statements.
Consolidated Statements of Comprehensive Income (Loss)
Year ended December 28, 2013 December 29, 2012 December 31, 2011
(in thousands)
Net income $ 37,984 $ 37,398 $ 37,677Other comprehensive income (loss) Foreign currency translation adjustments 2,010 2,397 (1,436) Unrealized gain (loss) on available-for-sale securities (22) 326 (549)
Total other comprehensive income (loss) $ 1,988 $ 2,723 $ (1,985)
Comprehensive income $ 39,972 $ 40,121 $ 35,692
The accompanying Notes to the Consolidated Financial Statements are an integral part of these financial statements.
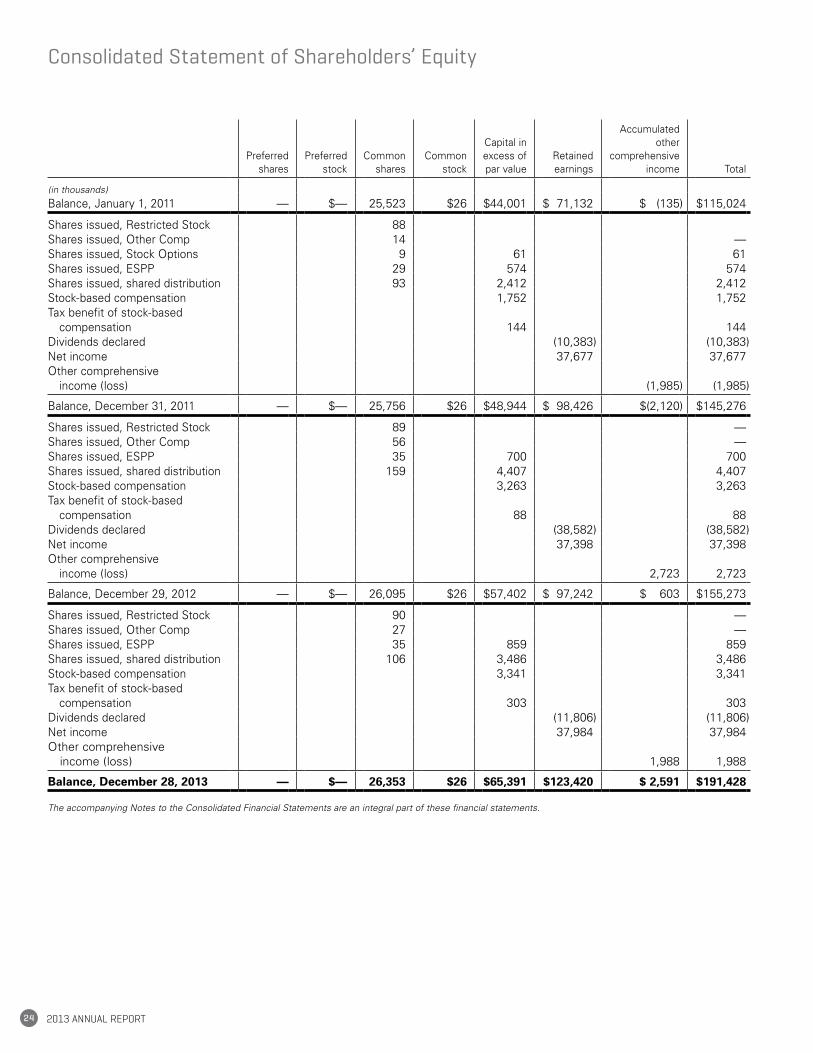
2013 AnnuAl RepoRt24
Preferred shares
Preferred stock
Common shares
Common stock
Capital in excess of par value
Retained earnings
Accumulated other
comprehensive income Total
(in thousands)
Balance, January 1, 2011 — $— 25,523 $26 $44,001 $ 71,132 $ (135) $115,024
Shares issued, Restricted Stock 88Shares issued, Other Comp 14 —Shares issued, Stock Options 9 61 61Shares issued, ESPP 29 574 574Shares issued, shared distribution 93 2,412 2,412Stock-based compensation 1,752 1,752Tax benefit of stock-based compensation 144 144Dividends declared (10,383) (10,383)Net income 37,677 37,677Other comprehensive income (loss) (1,985) (1,985)
Balance, December 31, 2011 — $— 25,756 $26 $48,944 $ 98,426 $(2,120) $145,276
Shares issued, Restricted Stock 89 —Shares issued, Other Comp 56 —Shares issued, ESPP 35 700 700Shares issued, shared distribution 159 4,407 4,407Stock-based compensation 3,263 3,263Tax benefit of stock-based compensation 88 88Dividends declared (38,582) (38,582)Net income 37,398 37,398Other comprehensive income (loss) 2,723 2,723
Balance, December 29, 2012 — $— 26,095 $26 $57,402 $ 97,242 $ 603 $155,273
Shares issued, Restricted Stock 90 —Shares issued, Other Comp 27 —Shares issued, ESPP 35 859 859Shares issued, shared distribution 106 3,486 3,486Stock-based compensation 3,341 3,341Tax benefit of stock-based compensation 303 303Dividends declared (11,806) (11,806)Net income 37,984 37,984Other comprehensive income (loss) 1,988 1,988
Balance, December 28, 2013 — $— 26,353 $26 $65,391 $123,420 $ 2,591 $191,428
The accompanying Notes to the Consolidated Financial Statements are an integral part of these financial statements.
Consolidated Statement of Shareholders’ Equity
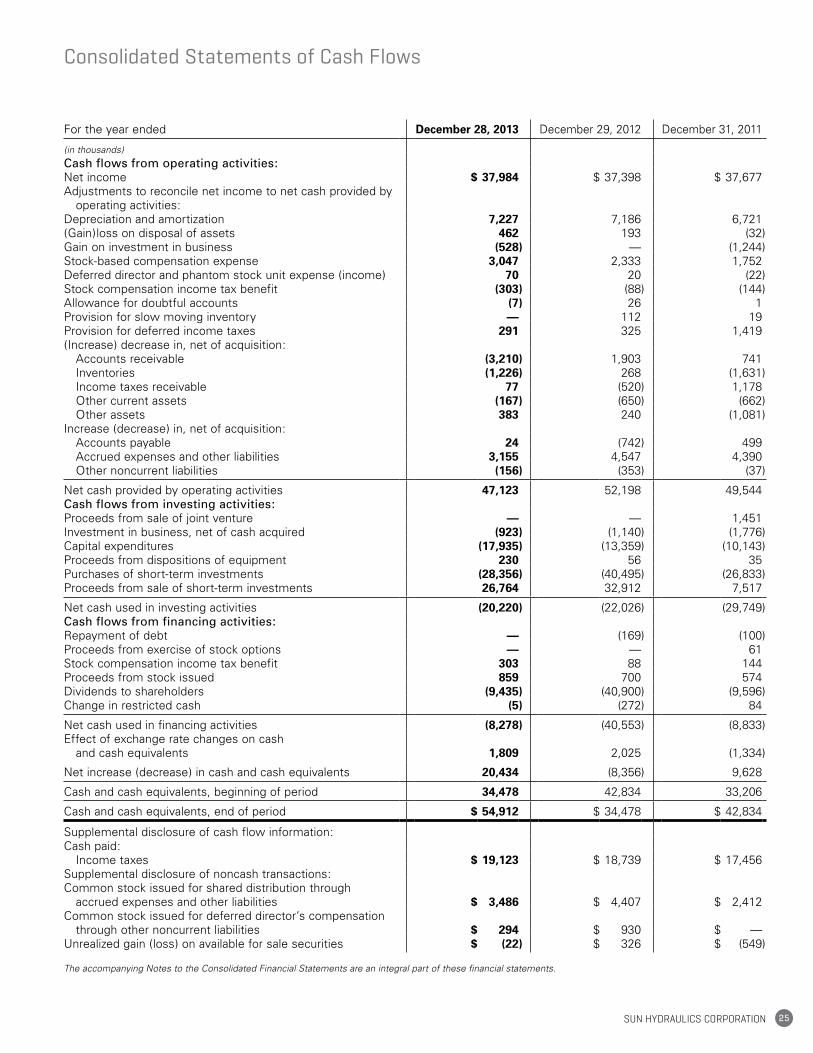
25Sun HydraulicS corporation
Consolidated Statements of Cash Flows
For the year ended December 28, 2013 December 29, 2012 December 31, 2011
(in thousands)
Cash flows from operating activities:Net income $ 37,984 $ 37,398 $ 37,677Adjustments to reconcile net income to net cash provided by operating activities:Depreciation and amortization 7,227 7,186 6,721(Gain)loss on disposal of assets 462 193 (32)Gain on investment in business (528) — (1,244)Stock-based compensation expense 3,047 2,333 1,752Deferred director and phantom stock unit expense (income) 70 20 (22)Stock compensation income tax benefit (303) (88) (144)Allowance for doubtful accounts (7) 26 1Provision for slow moving inventory — 112 19Provision for deferred income taxes 291 325 1,419(Increase) decrease in, net of acquisition: Accounts receivable (3,210) 1,903 741 Inventories (1,226) 268 (1,631) Income taxes receivable 77 (520) 1,178 Other current assets (167) (650) (662) Other assets 383 240 (1,081)Increase (decrease) in, net of acquisition: Accounts payable 24 (742) 499 Accrued expenses and other liabilities 3,155 4,547 4,390 Other noncurrent liabilities (156) (353) (37)
Net cash provided by operating activities 47,123 52,198 49,544Cash flows from investing activities:Proceeds from sale of joint venture — — 1,451Investment in business, net of cash acquired (923) (1,140) (1,776)Capital expenditures (17,935) (13,359) (10,143)Proceeds from dispositions of equipment 230 56 35Purchases of short-term investments (28,356) (40,495) (26,833)Proceeds from sale of short-term investments 26,764 32,912 7,517
Net cash used in investing activities (20,220) (22,026) (29,749)Cash flows from financing activities:Repayment of debt — (169) (100)Proceeds from exercise of stock options — — 61Stock compensation income tax benefit 303 88 144Proceeds from stock issued 859 700 574Dividends to shareholders (9,435) (40,900) (9,596)Change in restricted cash (5) (272) 84
Net cash used in financing activities (8,278) (40,553) (8,833)Effect of exchange rate changes on cash and cash equivalents 1,809 2,025 (1,334)
Net increase (decrease) in cash and cash equivalents 20,434 (8,356) 9,628
Cash and cash equivalents, beginning of period 34,478 42,834 33,206
Cash and cash equivalents, end of period $ 54,912 $ 34,478 $ 42,834
Supplemental disclosure of cash flow information:Cash paid: Income taxes $ 19,123 $ 18,739 $ 17,456Supplemental disclosure of noncash transactions:Common stock issued for shared distribution through accrued expenses and other liabilities $ 3,486 $ 4,407 $ 2,412Common stock issued for deferred director’s compensation through other noncurrent liabilities $ 294 $ 930 $ —Unrealized gain (loss) on available for sale securities $ (22) $ 326 $ (549)
The accompanying Notes to the Consolidated Financial Statements are an integral part of these financial statements.
2013 AnnuAl RepoRt26
1. Business
Sun Hydraulics Corporation, and its wholly-owned subsidiaries, design, manufacture, and sell screw-in cartridge valves and manifolds used in hydraulic systems. The Company has facili-ties in the United States, the United Kingdom, Germany, Korea, France, China, and India. Sun Hydraulics Corporation (“Sun Hydraulics”), with its main offices located in Sarasota, Florida, designs, manufactures, and sells its products primarily through distributors. Sun Hydraulik Holdings Limited (“Sun Holdings”), a wholly-owned subsidiary of Sun Hydraulics, was formed to provide a holding company for the European market operations; its wholly-owned subsidiaries are Sun Hydraulics Limited (a British corporation, “Sun Ltd.”) and Sun Hydraulik GmbH (a German corporation, “Sun GmbH”). Sun Ltd. operates a manu-facturing and distribution facility located in Coventry, England, and Sun GmbH operates a manufacturing and distribution facil-ity located in Erkelenz, Germany. Sun Hydraulics Korea Corporation (“Sun Korea”), a wholly-owned subsidiary of Sun Hydraulics, located in Inchon, South Korea, operates a manu-facturing and distribution facility. In 2012, Sun Korea acquired Seungwon Solutions Corporation (“Seungwon”), also located in Inchon, South Korea, a component supplier to Sun Korea and third parties. Sun Hydraulics (France) (“Sun France”), a liaison office located in Bordeaux, France, is used to service the French market. Sun Hydraulics established Sun Hydraulics China Co. Ltd, a representative office in Shanghai in January 2011, to develop new business opportunities in the Chinese market. Sun Hydraulics (India), a liaison office in Bangalore, India, is used to develop new business opportunities in the Indian market. On September 27, 2011, Sun Hydraulics pur-chased the outstanding shares of High Country Tek, Inc. (“HCT”) it did not already own. HCT, now a wholly-owned sub-sidiary of Sun Hydraulics, is located in Nevada City, California, and designs and manufactures ruggedized electronic/hydraulic control solutions for mobile equipment markets. WhiteOak Controls, Inc. (“WhiteOak”), a 40% equity method investment, located in Mediapolis, Iowa, designs and produces comple-mentary electronic control products. On April 1, 2013, Sun Hydraulics purchased the remaining 60% of WhiteOak, which was merged into HCT (see note 9).
2. Summary of Significant Accounting Policies
Principles of ConsolidationThe consolidated financial statements include the accounts and operations of Sun Hydraulics and its direct and indirect subsid-iaries. All significant intercompany accounts and transactions are eliminated in consolidation. The Company used the equity method of accounting for its investment in WhiteOak until April 1, 2013, when it acquired the remaining 60% of WhiteOak (see Note 7). The Company did not have a majority ownership in or exercise control over this entity prior to that date.
Critical Accounting Policies and Use of EstimatesThe preparation of financial statements in conformity with accounting principles generally accepted in the United States of America requires management to make estimates and assumptions that affect the reported amounts of assets and liabilities and disclosure of contingent assets and liabilities at the date of the financial statements and the reported amounts of revenues and expenses during the reporting period. Actual results could differ from those estimates. Significant estimates are used in the determination of impairment of long-lived assets, inventory, goodwill, accruals, income taxes, and fair value of short-term investments.
Cash, Cash Equivalents and Short-Term InvestmentsThe Company considers all highly liquid investments pur-chased with an original maturity of three months or less to be cash equivalents.
The Company’s short-term investments have been classified and accounted for as available-for-sale. Management deter-mines the appropriate classification of its investments at the time of purchase and re-evaluates the designation at each bal-ance sheet date. The Company may or may not hold securities with stated maturities greater than 12 months until maturity. As management views these securities as available to support cur-rent operations, the Company classifies securities with maturi-ties beyond 12 months as current assets under the caption short-term investments in the accompanying Consolidated Balance Sheets. The Company’s short-term investments are carried at fair value, with the unrealized gains and losses reported as a component of shareholder’s equity. Realized gains and losses on sales of short-term investments are gener-ally determined using the specific identification method, and are included in miscellaneous (income) expense in the Consolidated Statements of Operations.
Notes to the Consolidated Financial Statements (dollars in thousands except per share data)
27Sun HydraulicS corporation
Accounts ReceivableThe Company sells to most of its customers on a recurring basis, primarily through distributors with which the Company maintains long-term relationships. As a result, bad debt experi-ence has not been material. The allowance for doubtful accounts is determined on a specific identification basis by a review of those accounts that are significantly in arrears. There can be no assurance that a distributor or a large direct sale cus-tomer with overdue accounts receivable balances will not develop financial difficulties and default on payment. See the Consolidated Balance Sheets for allowance amounts.
InventoryInventories are valued at the lower of cost or market, with cost determined on a first-in, first-out basis. The Company offers a wide variety of standard products and as a matter of policy does not discontinue products. On an ongoing basis, compo-nent parts found to be obsolete through design or process changes are disposed of and charged to material cost. The Company reviews on-hand balances of products and compo-nent parts against specific criteria. Products and component parts without usage or that have excess quantities on hand are evaluated. An inventory reserve is then established for the full inventory carrying value of those products and component parts deemed to be obsolete or slow moving. See Note 5 to the Financial Statements for inventory reserve amounts.
Property, Plant and EquipmentProperty, plant and equipment is stated at cost. Expenditures for repairs and improvements that significantly add to the pro-ductive capacity or extend the useful life of an asset are capital-ized. Repairs and maintenance are expensed as incurred. Depreciation is computed using the straight-line method over the following useful lives:
Years
Computer equipment 3–5Machinery and equipment 4–12Furniture and fixtures 4–10Leasehold and land improvements 5–15Buildings 40
Gains or losses on the retirement, sale, or disposition of prop-erty, plant, and equipment are reflected in the Consolidated Statement of Operations in the period in which the assets are taken out of service.
Fair Value MeasurementsThe Company applies fair value accounting guidelines for all financial assets and liabilities and non-financial assets and liabil-ities that are recognized or disclosed at fair value in the financial statements on a recurring basis (at least annually). Under these guidelines, fair value is defined as the price that would be received for the sale of an asset or paid to transfer a liability (i.e. an exit price) in an orderly transaction between market partici-pants at the measurement date. The guidance establishes a three-tier fair value hierarchy which prioritizes the inputs used in measuring fair value as follows:
Level 1—Quoted prices in active markets for identical assets or liabilities.
Level 2—Observable inputs other than quoted prices included in Level 1, such as quoted prices for similar assets or liabilities in active markets or quoted prices for identical assets or liabilities in inactive markets.
Level 3—Unobservable inputs that are supported by little, infrequent, or no market activity and reflect the Company’s own assumptions about inputs used in pricing the asset or liability.
The fair value hierarchy also requires an entity to maximize the use of observable inputs and minimize the use of unobservable inputs when measuring fair value.
The Company’s valuation techniques used to measure the fair value of marketable equity securities were derived from quoted prices in active markets for identical assets or liabilities. The valuation techniques used to measure the fair value of all other financial instruments were valued based on quoted market prices or model driven valuations using significant inputs derived from or corroborated by observable market data.
GoodwillGoodwill, which represents the excess of the purchase price of acquisition over the fair value of the net assets acquired, is car-ried at cost. Goodwill is tested for impairment annually or more often if events or circumstances indicate a reduction in the fair value below the carrying value. The carrying value of assets is calculated at the reporting unit. An impairment loss is recorded to the extent that the fair value of the goodwill within the reporting unit is less than its carrying value.
2013 AnnuAl RepoRt28
Notes to the Consolidated Financial Statements (continued)
The Company completed its annual goodwill impairment test-ing and determined that the carrying amount of goodwill was not impaired. See Note 7 to the Financial Statements for goodwill amounts.
Impairment of Long-Lived AssetsLong-lived assets, such as property and equipment, and pur-chased intangibles subject to amortization, are reviewed for impairment whenever events or changes in circumstances indi-cate that the carrying amount of an asset may not be recover-able. Recoverability of the asset is measured by comparison of its carrying amount to future net cash flows the asset is expected to generate. If such assets are considered impaired, the impairment to be recognized is measured as the amount by which the carrying amount of the asset exceeds its fair value.
AccrualsThe Company makes estimates related to certain employee benefits and miscellaneous accruals. Estimates for employee benefit accruals are based on management’s assessment of estimated liabilities related to workers’ compensation, health care benefits and annual contributions to an employee stock ownership plan (“ESOP”), established in 2004 as part of the Company’s retirement plan. Estimates for miscellaneous accruals are based on management’s assessment of estimated liabilities for costs incurred.
The Company accrues for health care benefit costs under a self-funded plan. The Company purchases re-insurance for both specific and aggregate stop losses on claims that exceed $155 on an individual basis and approximately $8,000 on an aggregate basis.
Revenue RecognitionThe Company reports revenues, net of sales incentives, when title passes and risk of loss transfers to the customer. The effect of material non-recurring events is provided for when they become known.
Shipping and Handling CostsShipping and handling costs billed to distributors and custom-ers are recorded in revenue. Shipping costs incurred by the Company are recorded in cost of goods sold.
Foreign Currency Translation and TransactionsThe Pound Sterling is the functional currency of Sun Ltd. The Euro is the functional currency of Sun GmbH. The South Korean Won is the functional currency of Sun Korea. The U.S. Dollar is the functional currency for Sun Hydraulics and the reporting currency for the consolidated group. The assets and liabilities of Sun Ltd., Sun GmbH, and Sun Korea are translated at the exchange rate in effect at the balance sheet date, and income and expense items are translated at the average annual rate of exchange for the period. The resulting unrealized translation gains and losses are included as a component of shareholders’ equity designated as “accumulated other com-prehensive income (loss).” Realized gains and losses from for-eign currency transactions are included in the Consolidated Statement of Operations.
Income TaxesThe Company’s income tax policy provides for a liability approach under which deferred income taxes are provided for based upon enacted tax laws and rates applicable to the peri-ods in which the taxes become payable. These differences result from items reported differently for financial reporting and income tax purposes, primarily depreciation, accrued expenses and reserves.
The Company reports a liability for unrecognized tax benefits resulting from uncertain tax positions taken or expected to be taken in a tax return. The Company recognizes potential inter-est and penalties related to its unrecognized tax benefits in income tax expense.
Stock-Based CompensationAll share-based compensation cost is measured at the grant date, based on the fair value of the award, and is recognized as an expense in earnings over the requisite service period. Benefits of tax deductions in excess of recognized compensation costs are reported as a financing cash inflow.
ReclassificationNon-trade receivables classified as accounts receivable in the prior period were reclassified to other current assets to con-form to the current year presentation.
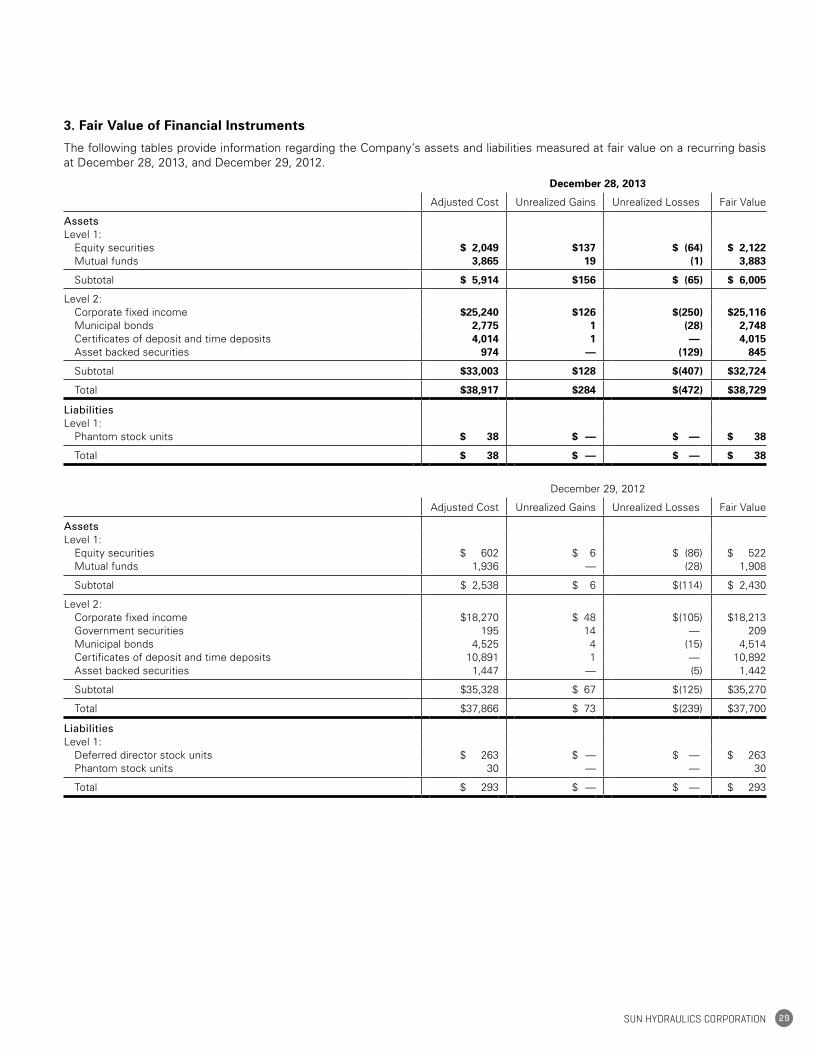
29Sun HydraulicS corporation
3. Fair Value of Financial Instruments
The following tables provide information regarding the Company’s assets and liabilities measured at fair value on a recurring basis at December 28, 2013, and December 29, 2012.
December 28, 2013
Adjusted Cost Unrealized Gains Unrealized Losses Fair Value
AssetsLevel 1: Equity securities $ 2,049 $137 $ (64) $ 2,122 Mutual funds 3,865 19 (1) 3,883
Subtotal $ 5,914 $156 $ (65) $ 6,005
Level 2: Corporate fixed income $25,240 $126 $(250) $25,116 Municipal bonds 2,775 1 (28) 2,748 Certificates of deposit and time deposits 4,014 1 — 4,015 Asset backed securities 974 — (129) 845
Subtotal $33,003 $128 $(407) $32,724
Total $38,917 $284 $(472) $38,729
LiabilitiesLevel 1: Phantom stock units $ 38 $ — $ — $ 38
Total $ 38 $ — $ — $ 38
December 29, 2012
Adjusted Cost Unrealized Gains Unrealized Losses Fair Value
AssetsLevel 1: Equity securities $ 602 $ 6 $ (86) $ 522 Mutual funds 1,936 — (28) 1,908
Subtotal $ 2,538 $ 6 $ (114) $ 2,430
Level 2: Corporate fixed income $18,270 $ 48 $ (105) $18,213 Government securities 195 14 — 209 Municipal bonds 4,525 4 (15) 4,514 Certificates of deposit and time deposits 10,891 1 — 10,892 Asset backed securities 1,447 — (5) 1,442
Subtotal $35,328 $ 67 $ (125) $35,270
Total $37,866 $ 73 $ (239) $37,700
LiabilitiesLevel 1: Deferred director stock units $ 263 $ — $ — $ 263 Phantom stock units 30 — — 30
Total $ 293 $ — $ — $ 293
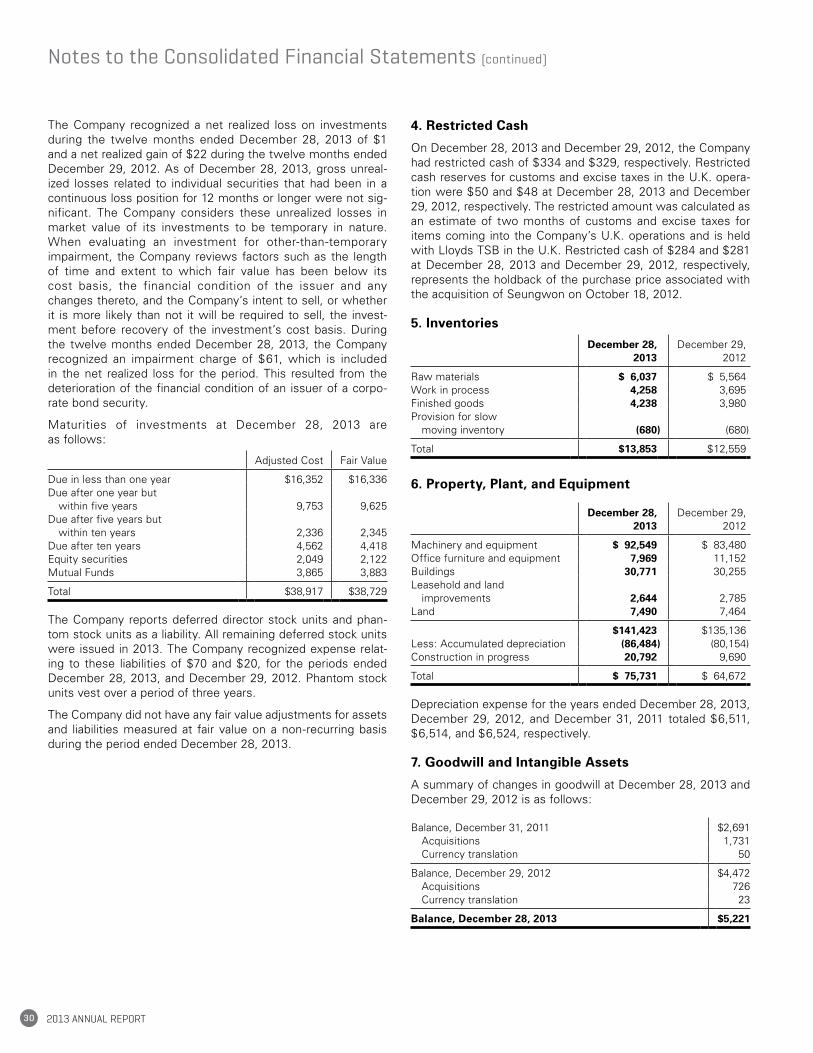
2013 AnnuAl RepoRt30
The Company recognized a net realized loss on investments during the twelve months ended December 28, 2013 of $1 and a net realized gain of $22 during the twelve months ended December 29, 2012. As of December 28, 2013, gross unreal-ized losses related to individual securities that had been in a continuous loss position for 12 months or longer were not sig-nificant. The Company considers these unrealized losses in market value of its investments to be temporary in nature. When evaluating an investment for other-than-temporary impairment, the Company reviews factors such as the length of time and extent to which fair value has been below its cost basis, the financial condition of the issuer and any changes thereto, and the Company’s intent to sell, or whether it is more likely than not it will be required to sell, the invest-ment before recovery of the investment’s cost basis. During the twelve months ended December 28, 2013, the Company recognized an impairment charge of $61, which is included in the net realized loss for the period. This resulted from the deterioration of the financial condition of an issuer of a corpo-rate bond security.
Maturities of investments at December 28, 2013 are as follows:
Adjusted Cost Fair Value
Due in less than one year $16,352 $16,336Due after one year but within five years 9,753 9,625Due after five years but within ten years 2,336 2,345Due after ten years 4,562 4,418Equity securities 2,049 2,122Mutual Funds 3,865 3,883
Total $38,917 $38,729
The Company reports deferred director stock units and phan-tom stock units as a liability. All remaining deferred stock units were issued in 2013. The Company recognized expense relat-ing to these liabilities of $70 and $20, for the periods ended December 28, 2013, and December 29, 2012. Phantom stock units vest over a period of three years.
The Company did not have any fair value adjustments for assets and liabilities measured at fair value on a non-recurring basis during the period ended December 28, 2013.
4. Restricted Cash
On December 28, 2013 and December 29, 2012, the Company had restricted cash of $334 and $329, respectively. Restricted cash reserves for customs and excise taxes in the U.K. opera-tion were $50 and $48 at December 28, 2013 and December 29, 2012, respectively. The restricted amount was calculated as an estimate of two months of customs and excise taxes for items coming into the Company’s U.K. operations and is held with Lloyds TSB in the U.K. Restricted cash of $284 and $281 at December 28, 2013 and December 29, 2012, respectively, represents the holdback of the purchase price associated with the acquisition of Seungwon on October 18, 2012.
5. Inventories
December 28, 2013
December 29, 2012
Raw materials $ 6,037 $ 5,564Work in process 4,258 3,695Finished goods 4,238 3,980Provision for slow moving inventory (680) (680)
Total $13,853 $ 12,559
6. Property, Plant, and Equipment
December 28, 2013
December 29, 2012
Machinery and equipment $ 92,549 $ 83,480Office furniture and equipment 7,969 11,152Buildings 30,771 30,255Leasehold and land improvements 2,644 2,785Land 7,490 7,464
$141,423 $135,136Less: Accumulated depreciation (86,484) (80,154)Construction in progress 20,792 9,690
Total $ 75,731 $ 64,672
Depreciation expense for the years ended December 28, 2013, December 29, 2012, and December 31, 2011 totaled $6,511, $6,514, and $6,524, respectively.
7. Goodwill and Intangible Assets
A summary of changes in goodwill at December 28, 2013 and December 29, 2012 is as follows:
Balance, December 31, 2011 $2,691 Acquisitions 1,731 Currency translation 50
Balance, December 29, 2012 $4,472 Acquisitions 726 Currency translation 23
Balance, December 28, 2013 $5,221
Notes to the Consolidated Financial Statements (continued)
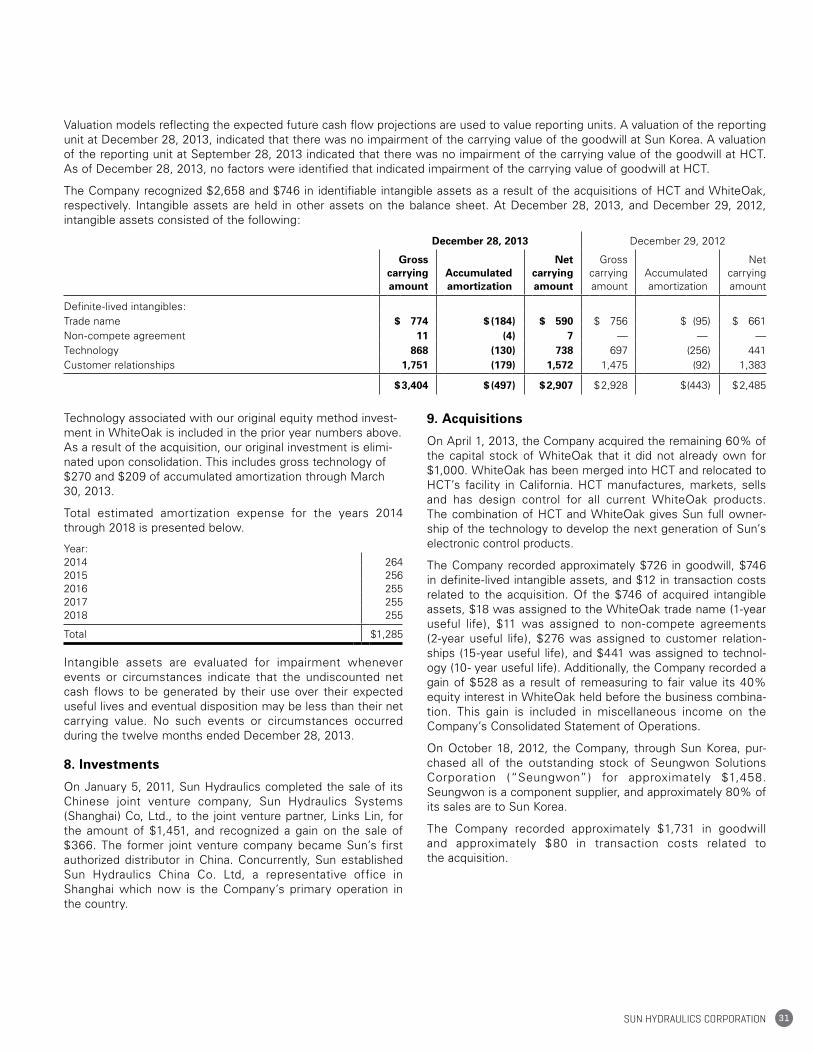
31Sun HydraulicS corporation
Valuation models reflecting the expected future cash flow projections are used to value reporting units. A valuation of the reporting unit at December 28, 2013, indicated that there was no impairment of the carrying value of the goodwill at Sun Korea. A valuation of the reporting unit at September 28, 2013 indicated that there was no impairment of the carrying value of the goodwill at HCT. As of December 28, 2013, no factors were identified that indicated impairment of the carrying value of goodwill at HCT.
The Company recognized $2,658 and $746 in identifiable intangible assets as a result of the acquisitions of HCT and WhiteOak, respectively. Intangible assets are held in other assets on the balance sheet. At December 28, 2013, and December 29, 2012, intangible assets consisted of the following:
December 28, 2013 December 29, 2012
Gross carrying amount
Accumulated amortization
Net carrying amount
Gross carrying amount
Accumulated amortization
Net carrying amount
Definite-lived intangibles:Trade name $ 774 $(184) $ 590 $ 756 $ (95) $ 661Non-compete agreement 11 (4) 7 — — —Technology 868 (130) 738 697 (256) 441Customer relationships 1,751 (179) 1,572 1,475 (92) 1,383
$3,404 $(497) $2,907 $2,928 $(443) $2,485
Technology associated with our original equity method invest-ment in WhiteOak is included in the prior year numbers above. As a result of the acquisition, our original investment is elimi-nated upon consolidation. This includes gross technology of $270 and $209 of accumulated amortization through March 30, 2013.
Total estimated amortization expense for the years 2014 through 2018 is presented below.
Year:2014 2642015 2562016 2552017 2552018 255
Total $1,285
Intangible assets are evaluated for impairment whenever events or circumstances indicate that the undiscounted net cash flows to be generated by their use over their expected useful lives and eventual disposition may be less than their net carrying value. No such events or circumstances occurred during the twelve months ended December 28, 2013.
8. Investments
On January 5, 2011, Sun Hydraulics completed the sale of its Chinese joint venture company, Sun Hydraulics Systems (Shanghai) Co, Ltd., to the joint venture partner, Links Lin, for the amount of $1,451, and recognized a gain on the sale of $366. The former joint venture company became Sun’s first authorized distributor in China. Concurrently, Sun established Sun Hydraulics China Co. Ltd, a representative office in Shanghai which now is the Company’s primary operation in the country.
9. Acquisitions
On April 1, 2013, the Company acquired the remaining 60% of the capital stock of WhiteOak that it did not already own for $1,000. WhiteOak has been merged into HCT and relocated to HCT’s facility in California. HCT manufactures, markets, sells and has design control for all current WhiteOak products. The combination of HCT and WhiteOak gives Sun full owner-ship of the technology to develop the next generation of Sun’s electronic control products.
The Company recorded approximately $726 in goodwill, $746 in definite-lived intangible assets, and $12 in transaction costs related to the acquisition. Of the $746 of acquired intangible assets, $18 was assigned to the WhiteOak trade name (1-year useful life), $11 was assigned to non-compete agreements (2-year useful life), $276 was assigned to customer relation-ships (15-year useful life), and $441 was assigned to technol-ogy (10- year useful life). Additionally, the Company recorded a gain of $528 as a result of remeasuring to fair value its 40% equity interest in WhiteOak held before the business combina-tion. This gain is included in miscellaneous income on the Company’s Consolidated Statement of Operations.
On October 18, 2012, the Company, through Sun Korea, pur-chased all of the outstanding stock of Seungwon Solutions Corporation (“Seungwon”) for approximately $1,458. Seungwon is a component supplier, and approximately 80% of its sales are to Sun Korea.
The Company recorded approximately $1,731 in goodwill and approximately $80 in transaction costs related to the acquisition.
2013 AnnuAl RepoRt32
The results of operations of WhiteOak and Seungwon have been included in the Company’s consolidated results since the dates of acquisition. Supplemental pro forma information and disclosure of acquired assets and liabilities have not been provided as these acquisitions did not have a material impact on the consolidated financial statements individually or in the aggregate.
On September 27, 2011, Sun purchased the remaining pre-ferred and common shares of HCT that it did not already own. HCT designs and produces encapsulated, modular, highly rug-gedized digital and analog electronic controller products for the global fluid power and motion control industry. HCT’s products complement Sun’s electro-hydraulic line of valves providing reli-able, easy, simple and accurate control of individual valves, or seamless management of systems and sub-systems.
Goodwill arising from the acquisition was $1,976 consisting of the value of the workforce, synergies and competitive advan-tages obtained as a result of the acquisition. Identifiable intan-gible assets arising from the acquisition consist of the HCT Trade Name, Patented Technology, Unpatented Technology, and Customer Relationships. These identifiable intangibles totaled $2,658, and are amortized over ten years with the exception of Customer Relationships, which are amortized over twenty years. These amounts are recorded as other assets on the Consolidated Balance Sheet.
The following table summarizes the consideration paid for HCT and the amounts of the assets acquired and liabilities assumed, recognized at the acquisition date.
At September 27, 2011
ConsiderationCash $ 1,894Stock 12
Fair value of total consideration transferred $ 1,906Fair value of Sun’s equity interest in HCT held before the business combination 1,472
Total $ 3,378Acquisition-related costs (included in Selling, engineering, and administrative expenses) 40Recognized amounts of identifiable assets acquired and liabilities assumedCash $ 130Accounts receivable 570Inventory 444Property, plant, and equipment 317Identifiable intangible assets 2,658Other assets 210Accounts payable and accrued expenses (748)Notes payable (2,123)Other liabilities (56)
Total identifiable net assets $ 1,402Goodwill 1,976
Total $ 3,378
Approximately half of the acquisition-related costs above were incurred in the third quarter with the remainder incurred in the Company’s fourth quarter. The amount of notes payable above is primarily made up of amounts due to Sun Hydraulics and eliminated upon consolidation.
Sun Hydraulics’ fair value of the equity interest in HCT held before the business combination was $1,472. The fair value of the previously held equity interest was determined based on the current purchase price per the purchase agreement before the deduction for option and warrant proceeds. Sun Hydraulics recognized a gain of $1,244 as a result of remeasuring to fair value, based on the current purchase price, its 38% equity interest in HCT held before the business combination. The equity interest was diluted from the original investment as a result of warrant and option exercises. This gain was included in net miscellaneous income on the Consolidated Statements of Operations for the year ending December 31, 2011.
For the period ending October 1, 2011, the Company accounted for HCT under the equity method. The revenue and earnings for HCT included in Sun’s Consolidated Statement of Operations for the year ended December 31, 2011, and the revenue and earnings of the combined entity had the acquisition date been January 2, 2011 were:
Revenue Earnings
Actual from 10/02/11 to 12/31/2011 $ 1,270 $ (58)
Revenue (unaudited)
Earnings (unaudited)
Supplemental pro forma from 01/02/2011 to 12/31/2011 $206,968 $37,534
10. Other Assets
December 28, 2013
December 29, 2012
Definite-lived intangibles, net of amortization of $497 and $443 $2,907 $2,485Equity investment in WhiteOak Controls, Inc. — 69Loan acquisition costs, net of amortization of $42 and $24 44 62Deposits with suppliers 129 171Notes receivable 337 650Other 53 95
Total $3,470 $3,532
Notes to the Consolidated Financial Statements (continued)
33Sun HydraulicS corporation
11. Accrued Expenses and Other Liabilities
December 28, 2013
December 29, 2012
Compensation and benefits $5,546 $5,581Self insurance liability 703 1,007Other 767 1,053
Total $7,016 $7,641
12. Long-Term Debt
Effective August 1, 2011, the Company entered into a credit and security agreement in the U.S. with Fifth Third Bank (the “Bank”). The agreement provides for three separate credit facilities totaling $50,000.
Facility A is a $15,000 unsecured revolving line of credit and requires monthly payments of interest. Facility A has a floating interest rate of 1.45% over the 30-day LIBOR Rate (as defined).
Facility B is an accordion feature to increase the revolving line of credit to a $35,000 secured revolving line of credit. Facility B will be secured by the Company’s U.S. assets, including its manufacturing facilities, and requires monthly payments of interest. Facility B will bear interest at the 30-day LIBOR Rate or the Bank’s Base Rate (as defined), at the Company’s discre-tion, plus a margin based on the Borrower’s Funded Debt to EBITDA Leverage Ratio (as defined). The LIBOR Margin ranges from 1.45% to 2.25% and the Bank’s Base Rate ranges from (0.25)% to 0.00%.
Facility C is a $15,000 construction and term loan. The Company did not activate Facility C for the construction of its new Sarasota factory.
Facility A or Facility B (if activated) is payable in full on August 1, 2016. Maturity may be accelerated by the Bank upon an Event of Default (as defined). Prepayment may be made without penalty or premium at any time upon the required notice to the Bank.
Facility A is subject to debt covenants (capitalized terms are defined therein) including: 1) Minimum Tangible Net Worth of not less than $92,000, increased annually by 50% of Net Income, and 2) Minimum EBITDA of not less than $5,000; and requires the Company to maintain its primary domestic deposit accounts with the bank. At December 28, 2013, the Company was in compliance with all debt covenants related to Facility A as follows:
Covenant Required Ratio/Amount Actual Ratio/Amount
Minimum Tangible Net Worth $148,530 $183,236Minimum EBITDA Not less than $5 million $ 62,742
If Facility B is activated, covenant 2 above will automatically terminate and two additional covenants will be required: 1) Funded Debt to EBITDA ratio equal to or less than 3.0:1.0, and 2) EBIT to Interest Expense ratio of not less than 2.5:1.0. As of December 28, 2013, the Company had not activated Facility B.
The Company did not have any amounts drawn on Facilities A, B, or C for the periods ended December 28, 2013, and December 29, 2012.
13. Dividends to Shareholders
The Company declared dividends of $11,806, $38,582, and $10,383 to shareholders in 2013, 2012, and 2011, respectively.
Except as noted below, the Company declared the following regular quarterly dividends to shareholders of record on the last day of the respective quarter, paid on the 15th day of each month following the date of declaration:
2013 2012 2011
First quarter $0.090 $0.090 $0.060Second quarter 0.090 0.090 0.090Third quarter 0.090 0.090 0.090Fourth quarter 0.090 0.090 0.090
In addition to the regular quarterly dividends, the Company declared shared distribution cash dividends in 2013, 2012 and 2011, equal to $0.09, $0.12 and $0.07, respectively. The 2013 dividend was paid on March 31, 2013, to shareholders of record on March 15, 2013, the 2012 dividend was paid on March 31, 2012, to shareholders of record on March 22, 2012, and the 2011 dividend was paid on March 31, 2011, to shareholders of record as of March 15, 2011. The shared distribution was intro-duced in 2008 as a way to reward both shareholders and employees when the Company has a successful year. The Board of Directors has declared a shared distribution cash dividend of $0.09 per share, payable on March 31, 2014, to shareholders of record as of March 15, 2014.
In light of the Company’s cash position, its current and per-ceived uses for cash, and the likely increase in income tax rates on corporate dividends as of January 1, 2013, the Board of Directors in December 2012 declared a special one-time cash dividend of $1.00 per share to shareholders of record as of December 14, 2012. In anticipation of the expected tax law changes in 2013, the payment date for both the special divi-dend and the regular quarterly dividend of $0.09 per share was December 28, 2012.
2013 AnnuAl RepoRt34
14. Income Taxes
Deferred income tax assets and liabilities are provided to reflect the future tax consequences of differences between the tax basis of assets and liabilities and their reported amounts in the financial statements.
For financial reporting purposes, income before income taxes includes the following components:
For the year ended
December 28, 2013
December 29, 2012
December 31, 2011
United States $46,314 $44,957 $43,513Foreign 10,858 10,896 14,073
Total $57,172 $55,853 $57,586
The Company derives its pretax income based on the consoli-dated results of its legal entities. The Company has made the decision to consolidate engineering and manufacturing for the most part in the U.S. The Company’s foreign subsidiaries pri-marily act as part of our sales and distribution channel, resulting in different pretax income levels. Products manufactured in the U.S. are sold worldwide and are the primary reason that pretax income in the U.S. is higher than foreign pretax income. The U.S. legal entity had third party export sales of $54,213, $50,231, and $49,753 for the years 2013, 2012, and 2011, respectively. Foreign pretax income is impacted by the level of foreign manufacturing, sales at varying market levels, as well as direct sales to large OEM customers.
Notes to the Consolidated Financial Statements (continued)
The components of the income tax provision (benefit) are as follows:
For the year endedDecember 28,
2013December 29,
2012December 31,
2011
Current tax expense (benefit): United States $15,634 $15,396 $14,034 State and local 950 924 436 Foreign 2,466 1,788 3,972
Total current 19,050 18,108 18,442
Deferred tax expense (benefit): United States 158 545 1,095 State and local 6 12 471 Foreign (26) (210) (99)
Total deferred 138 347 1,467
Total income tax provision $19,188 $18,455 $19,909
The reconciliation between the effective income tax rate and the U.S. federal statutory rate is as follows:
For the year endedDecember 28,
2013December 29,
2012December 31,
2011
U.S. federal taxes at the statutory rate $20,010 $19,549 $20,155 Increase (decrease) Foreign tax credit (433) (358) (1,026) Domestic production activity deduction (1,632) (1,483) (1,075) Research and Development Tax Credit—Current Year (50) (50) (150) Foreign income taxed at lower rate (1,013) (901) (1,052) Nondeductible items 302 411 1,049 State and local taxes, net 957 935 907 Change in reserve 168 710 440 Other 879 (358) 661
Income tax provision $19,188 $18,455 $19,909
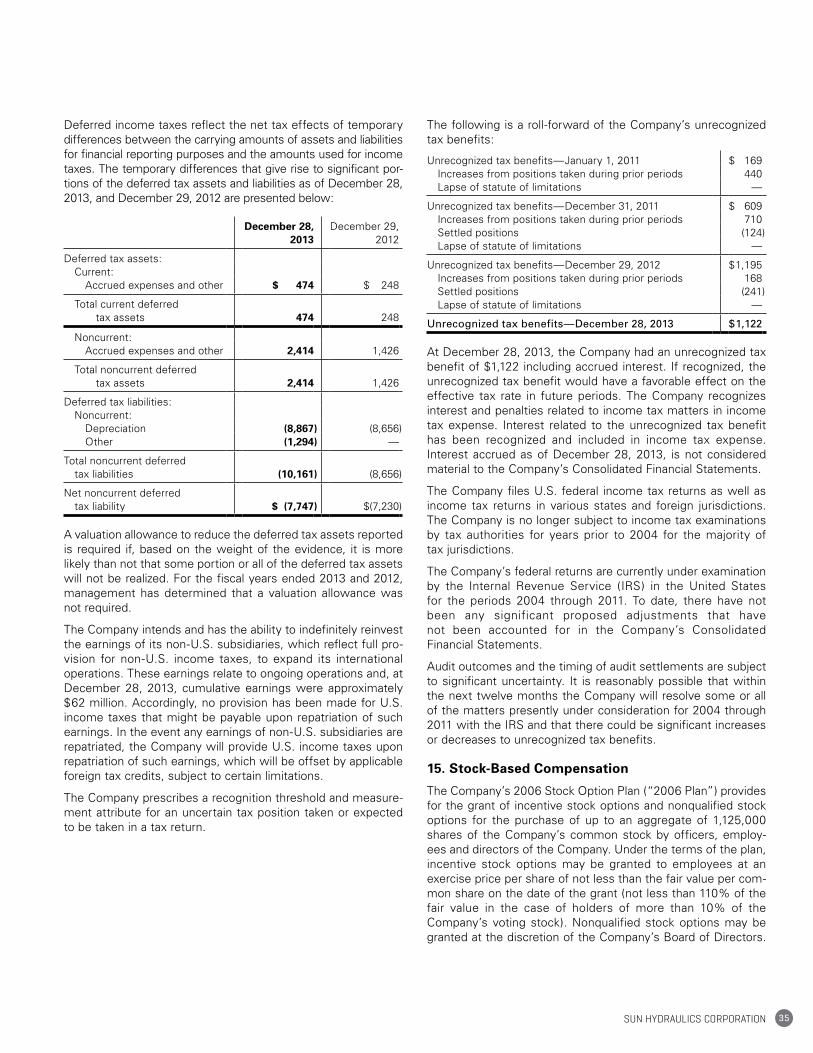
35Sun HydraulicS corporation
Deferred income taxes reflect the net tax effects of temporary differences between the carrying amounts of assets and liabilities for financial reporting purposes and the amounts used for income taxes. The temporary differences that give rise to significant por-tions of the deferred tax assets and liabilities as of December 28, 2013, and December 29, 2012 are presented below:
December 28, 2013
December 29, 2012
Deferred tax assets: Current: Accrued expenses and other $ 474 $ 248
Total current deferred tax assets 474 248
Noncurrent: Accrued expenses and other 2,414 1,426
Total noncurrent deferred tax assets 2,414 1,426
Deferred tax liabilities: Noncurrent: Depreciation (8,867) (8,656) Other (1,294) —
Total noncurrent deferred tax liabilities (10,161) (8,656)
Net noncurrent deferred tax liability $ (7,747) $(7,230)
A valuation allowance to reduce the deferred tax assets reported is required if, based on the weight of the evidence, it is more likely than not that some portion or all of the deferred tax assets will not be realized. For the fiscal years ended 2013 and 2012, management has determined that a valuation allowance was not required.
The Company intends and has the ability to indefinitely reinvest the earnings of its non-U.S. subsidiaries, which reflect full pro-vision for non-U.S. income taxes, to expand its international operations. These earnings relate to ongoing operations and, at December 28, 2013, cumulative earnings were approximately $62 million. Accordingly, no provision has been made for U.S. income taxes that might be payable upon repatriation of such earnings. In the event any earnings of non-U.S. subsidiaries are repatriated, the Company will provide U.S. income taxes upon repatriation of such earnings, which will be offset by applicable foreign tax credits, subject to certain limitations.
The Company prescribes a recognition threshold and measure-ment attribute for an uncertain tax position taken or expected to be taken in a tax return.
The following is a roll-forward of the Company’s unrecognized tax benefits:
Unrecognized tax benefits—January 1, 2011 $ 169 Increases from positions taken during prior periods 440 Lapse of statute of limitations —
Unrecognized tax benefits—December 31, 2011 $ 609 Increases from positions taken during prior periods 710 Settled positions (124) Lapse of statute of limitations —
Unrecognized tax benefits—December 29, 2012 $ 1,195 Increases from positions taken during prior periods 168 Settled positions (241) Lapse of statute of limitations —
Unrecognized tax benefits—December 28, 2013 $ 1,122
At December 28, 2013, the Company had an unrecognized tax benefit of $1,122 including accrued interest. If recognized, the unrecognized tax benefit would have a favorable effect on the effective tax rate in future periods. The Company recognizes interest and penalties related to income tax matters in income tax expense. Interest related to the unrecognized tax benefit has been recognized and included in income tax expense. Interest accrued as of December 28, 2013, is not considered material to the Company’s Consolidated Financial Statements.
The Company files U.S. federal income tax returns as well as income tax returns in various states and foreign jurisdictions. The Company is no longer subject to income tax examinations by tax authorities for years prior to 2004 for the majority of tax jurisdictions.
The Company’s federal returns are currently under examination by the Internal Revenue Service (IRS) in the United States for the periods 2004 through 2011. To date, there have not been any significant proposed adjustments that have not been accounted for in the Company’s Consolidated Financial Statements.
Audit outcomes and the timing of audit settlements are subject to significant uncertainty. It is reasonably possible that within the next twelve months the Company will resolve some or all of the matters presently under consideration for 2004 through 2011 with the IRS and that there could be significant increases or decreases to unrecognized tax benefits.
15. Stock-Based Compensation
The Company’s 2006 Stock Option Plan (“2006 Plan”) provides for the grant of incentive stock options and nonqualified stock options for the purchase of up to an aggregate of 1,125,000 shares of the Company’s common stock by officers, employ-ees and directors of the Company. Under the terms of the plan, incentive stock options may be granted to employees at an exercise price per share of not less than the fair value per com-mon share on the date of the grant (not less than 110% of the fair value in the case of holders of more than 10% of the Company’s voting stock). Nonqualified stock options may be granted at the discretion of the Company’s Board of Directors.
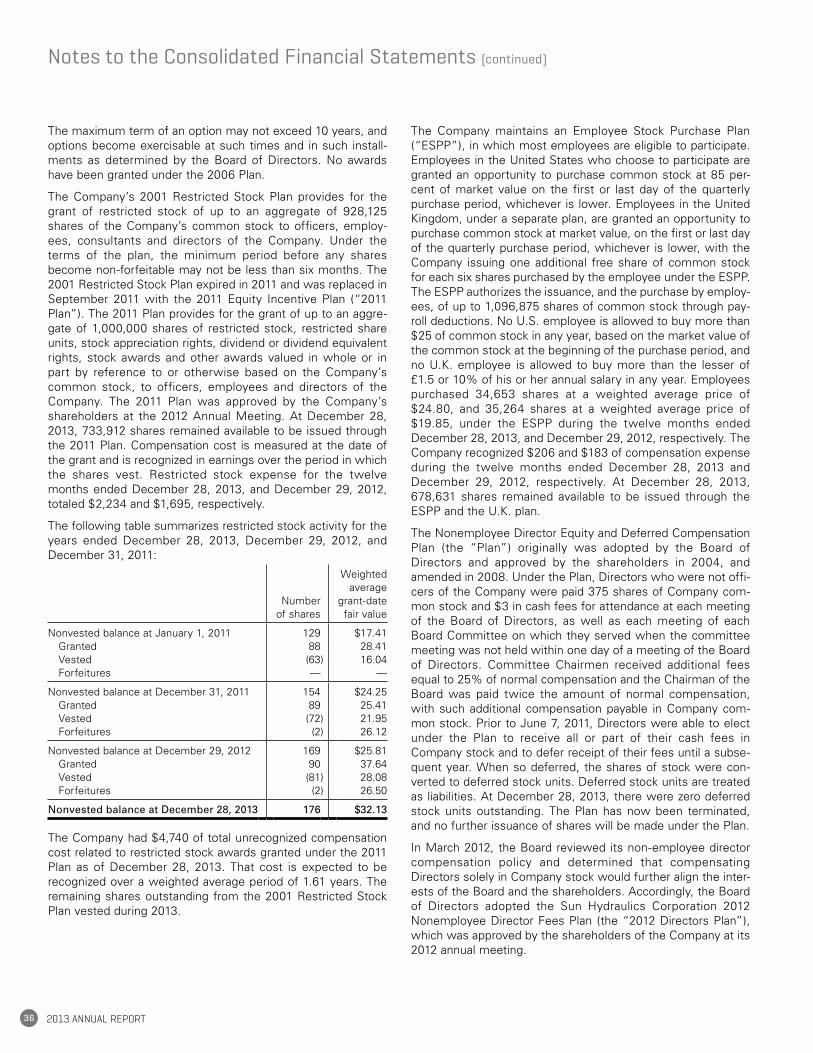
2013 AnnuAl RepoRt36
The maximum term of an option may not exceed 10 years, and options become exercisable at such times and in such install-ments as determined by the Board of Directors. No awards have been granted under the 2006 Plan.
The Company’s 2001 Restricted Stock Plan provides for the grant of restricted stock of up to an aggregate of 928,125 shares of the Company’s common stock to officers, employ-ees, consultants and directors of the Company. Under the terms of the plan, the minimum period before any shares become non-forfeitable may not be less than six months. The 2001 Restricted Stock Plan expired in 2011 and was replaced in September 2011 with the 2011 Equity Incentive Plan (“2011 Plan”). The 2011 Plan provides for the grant of up to an aggre-gate of 1,000,000 shares of restricted stock, restricted share units, stock appreciation rights, dividend or dividend equivalent rights, stock awards and other awards valued in whole or in part by reference to or otherwise based on the Company’s common stock, to officers, employees and directors of the Company. The 2011 Plan was approved by the Company’s shareholders at the 2012 Annual Meeting. At December 28, 2013, 733,912 shares remained available to be issued through the 2011 Plan. Compensation cost is measured at the date of the grant and is recognized in earnings over the period in which the shares vest. Restricted stock expense for the twelve months ended December 28, 2013, and December 29, 2012, totaled $2,234 and $1,695, respectively.
The following table summarizes restricted stock activity for the years ended December 28, 2013, December 29, 2012, and December 31, 2011:
Number of shares
Weighted average
grant-date fair value
Nonvested balance at January 1, 2011 129 $17.41 Granted 88 28.41 Vested (63) 16.04 Forfeitures — —
Nonvested balance at December 31, 2011 154 $24.25 Granted 89 25.41 Vested (72) 21.95 Forfeitures (2) 26.12
Nonvested balance at December 29, 2012 169 $25.81 Granted 90 37.64 Vested (81) 28.08 Forfeitures (2) 26.50
Nonvested balance at December 28, 2013 176 $32.13
The Company had $4,740 of total unrecognized compensation cost related to restricted stock awards granted under the 2011 Plan as of December 28, 2013. That cost is expected to be recognized over a weighted average period of 1.61 years. The remaining shares outstanding from the 2001 Restricted Stock Plan vested during 2013.
The Company maintains an Employee Stock Purchase Plan (“ESPP”), in which most employees are eligible to participate. Employees in the United States who choose to participate are granted an opportunity to purchase common stock at 85 per-cent of market value on the first or last day of the quarterly purchase period, whichever is lower. Employees in the United Kingdom, under a separate plan, are granted an opportunity to purchase common stock at market value, on the first or last day of the quarterly purchase period, whichever is lower, with the Company issuing one additional free share of common stock for each six shares purchased by the employee under the ESPP. The ESPP authorizes the issuance, and the purchase by employ-ees, of up to 1,096,875 shares of common stock through pay-roll deductions. No U.S. employee is allowed to buy more than $25 of common stock in any year, based on the market value of the common stock at the beginning of the purchase period, and no U.K. employee is allowed to buy more than the lesser of £1.5 or 10% of his or her annual salary in any year. Employees purchased 34,653 shares at a weighted average price of $24.80, and 35,264 shares at a weighted average price of $19.85, under the ESPP during the twelve months ended December 28, 2013, and December 29, 2012, respectively. The Company recognized $206 and $183 of compensation expense during the twelve months ended December 28, 2013 and December 29, 2012, respectively. At December 28, 2013, 678,631 shares remained available to be issued through the ESPP and the U.K. plan.
The Nonemployee Director Equity and Deferred Compensation Plan (the “Plan”) originally was adopted by the Board of Directors and approved by the shareholders in 2004, and amended in 2008. Under the Plan, Directors who were not offi-cers of the Company were paid 375 shares of Company com-mon stock and $3 in cash fees for attendance at each meeting of the Board of Directors, as well as each meeting of each Board Committee on which they served when the committee meeting was not held within one day of a meeting of the Board of Directors. Committee Chairmen received additional fees equal to 25% of normal compensation and the Chairman of the Board was paid twice the amount of normal compensation, with such additional compensation payable in Company com-mon stock. Prior to June 7, 2011, Directors were able to elect under the Plan to receive all or part of their cash fees in Company stock and to defer receipt of their fees until a subse-quent year. When so deferred, the shares of stock were con-verted to deferred stock units. Deferred stock units are treated as liabilities. At December 28, 2013, there were zero deferred stock units outstanding. The Plan has now been terminated, and no further issuance of shares will be made under the Plan.
In March 2012, the Board reviewed its non-employee director compensation policy and determined that compensating Directors solely in Company stock would further align the inter-ests of the Board and the shareholders. Accordingly, the Board of Directors adopted the Sun Hydraulics Corporation 2012 Nonemployee Director Fees Plan (the “2012 Directors Plan”), which was approved by the shareholders of the Company at its 2012 annual meeting.
Notes to the Consolidated Financial Statements (continued)
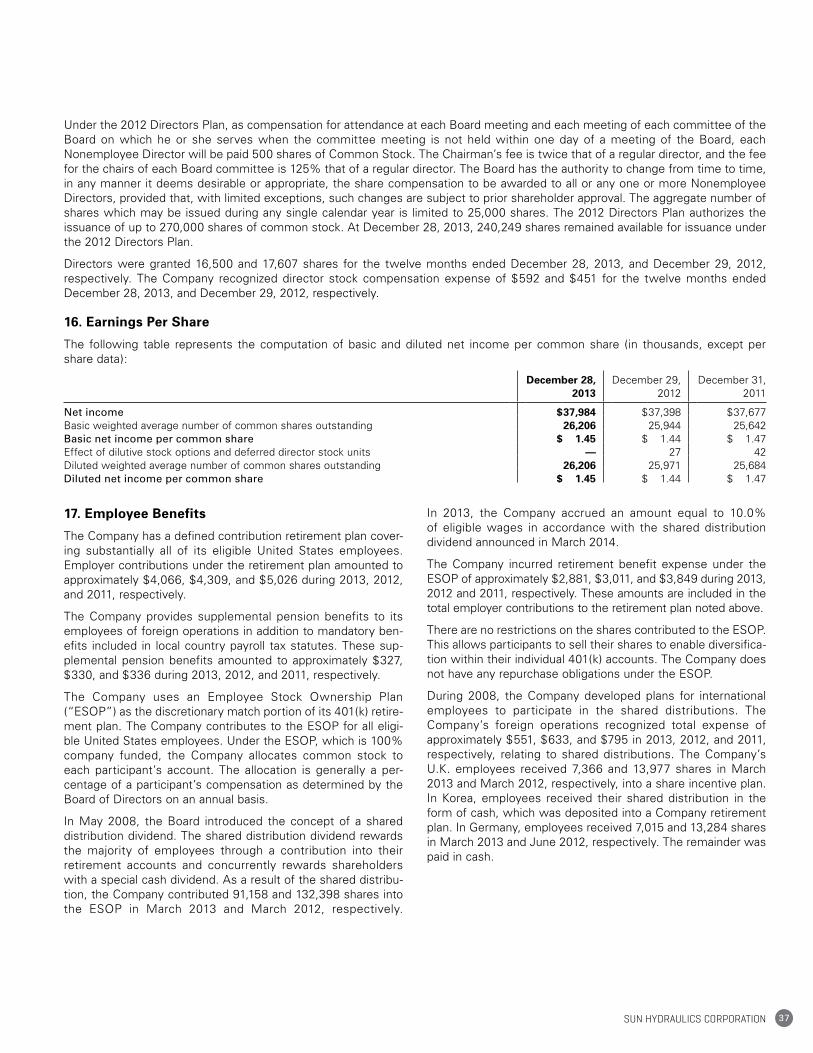
37Sun HydraulicS corporation
Under the 2012 Directors Plan, as compensation for attendance at each Board meeting and each meeting of each committee of the Board on which he or she serves when the committee meeting is not held within one day of a meeting of the Board, each Nonemployee Director will be paid 500 shares of Common Stock. The Chairman’s fee is twice that of a regular director, and the fee for the chairs of each Board committee is 125% that of a regular director. The Board has the authority to change from time to time, in any manner it deems desirable or appropriate, the share compensation to be awarded to all or any one or more Nonemployee Directors, provided that, with limited exceptions, such changes are subject to prior shareholder approval. The aggregate number of shares which may be issued during any single calendar year is limited to 25,000 shares. The 2012 Directors Plan authorizes the issuance of up to 270,000 shares of common stock. At December 28, 2013, 240,249 shares remained available for issuance under the 2012 Directors Plan.
Directors were granted 16,500 and 17,607 shares for the twelve months ended December 28, 2013, and December 29, 2012, respectively. The Company recognized director stock compensation expense of $592 and $451 for the twelve months ended December 28, 2013, and December 29, 2012, respectively.
16. Earnings Per Share
The following table represents the computation of basic and diluted net income per common share (in thousands, except per share data):
December 28, 2013
December 29, 2012
December 31, 2011
Net income $37,984 $37,398 $37,677Basic weighted average number of common shares outstanding 26,206 25,944 25,642Basic net income per common share $ 1.45 $ 1.44 $ 1.47Effect of dilutive stock options and deferred director stock units — 27 42Diluted weighted average number of common shares outstanding 26,206 25,971 25,684Diluted net income per common share $ 1.45 $ 1.44 $ 1.47
17. Employee Benefits
The Company has a defined contribution retirement plan cover-ing substantially all of its eligible United States employees. Employer contributions under the retirement plan amounted to approximately $4,066, $4,309, and $5,026 during 2013, 2012, and 2011, respectively.
The Company provides supplemental pension benefits to its employees of foreign operations in addition to mandatory ben-efits included in local country payroll tax statutes. These sup-plemental pension benefits amounted to approximately $327, $330, and $336 during 2013, 2012, and 2011, respectively.
The Company uses an Employee Stock Ownership Plan (“ESOP”) as the discretionary match portion of its 401(k) retire-ment plan. The Company contributes to the ESOP for all eligi-ble United States employees. Under the ESOP, which is 100% company funded, the Company allocates common stock to each participant’s account. The allocation is generally a per-centage of a participant’s compensation as determined by the Board of Directors on an annual basis.
In May 2008, the Board introduced the concept of a shared distribution dividend. The shared distribution dividend rewards the majority of employees through a contribution into their retirement accounts and concurrently rewards shareholders with a special cash dividend. As a result of the shared distribu-tion, the Company contributed 91,158 and 132,398 shares into the ESOP in March 2013 and March 2012, respectively.
In 2013, the Company accrued an amount equal to 10.0% of eligible wages in accordance with the shared distribution dividend announced in March 2014.
The Company incurred retirement benefit expense under the ESOP of approximately $2,881, $3,011, and $3,849 during 2013, 2012 and 2011, respectively. These amounts are included in the total employer contributions to the retirement plan noted above.
There are no restrictions on the shares contributed to the ESOP. This allows participants to sell their shares to enable diversifica-tion within their individual 401(k) accounts. The Company does not have any repurchase obligations under the ESOP.
During 2008, the Company developed plans for international employees to participate in the shared distributions. The Company’s foreign operations recognized total expense of approximately $551, $633, and $795 in 2013, 2012, and 2011, respectively, relating to shared distributions. The Company’s U.K. employees received 7,366 and 13,977 shares in March 2013 and March 2012, respectively, into a share incentive plan. In Korea, employees received their shared distribution in the form of cash, which was deposited into a Company retirement plan. In Germany, employees received 7,015 and 13,284 shares in March 2013 and June 2012, respectively. The remainder was paid in cash.
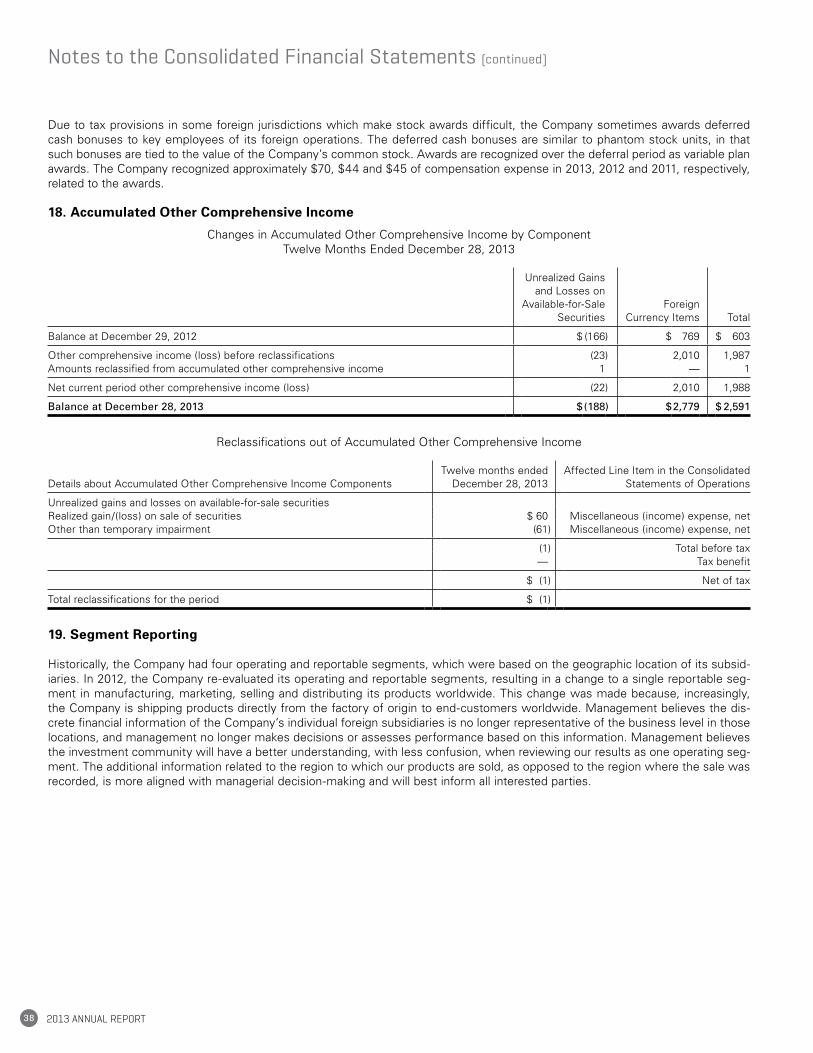
2013 AnnuAl RepoRt38
Notes to the Consolidated Financial Statements (continued)
Due to tax provisions in some foreign jurisdictions which make stock awards difficult, the Company sometimes awards deferred cash bonuses to key employees of its foreign operations. The deferred cash bonuses are similar to phantom stock units, in that such bonuses are tied to the value of the Company’s common stock. Awards are recognized over the deferral period as variable plan awards. The Company recognized approximately $70, $44 and $45 of compensation expense in 2013, 2012 and 2011, respectively, related to the awards.
18. Accumulated Other Comprehensive Income
Changes in Accumulated Other Comprehensive Income by Component Twelve Months Ended December 28, 2013
Unrealized Gains and Losses on
Available-for-Sale Securities
Foreign Currency Items Total
Balance at December 29, 2012 $ (166) $ 769 $ 603
Other comprehensive income (loss) before reclassifications (23) 2,010 1,987Amounts reclassified from accumulated other comprehensive income 1 — 1
Net current period other comprehensive income (loss) (22) 2,010 1,988
Balance at December 28, 2013 $(188) $2,779 $ 2,591
Reclassifications out of Accumulated Other Comprehensive Income
Details about Accumulated Other Comprehensive Income ComponentsTwelve months ended
December 28, 2013Affected Line Item in the Consolidated
Statements of Operations
Unrealized gains and losses on available-for-sale securitiesRealized gain/(loss) on sale of securities $ 60 Miscellaneous (income) expense, netOther than temporary impairment (61) Miscellaneous (income) expense, net
(1) Total before tax— Tax benefit
$ (1) Net of tax
Total reclassifications for the period $ (1)
19. Segment Reporting
Historically, the Company had four operating and reportable segments, which were based on the geographic location of its subsid-iaries. In 2012, the Company re-evaluated its operating and reportable segments, resulting in a change to a single reportable seg-ment in manufacturing, marketing, selling and distributing its products worldwide. This change was made because, increasingly, the Company is shipping products directly from the factory of origin to end-customers worldwide. Management believes the dis-crete financial information of the Company’s individual foreign subsidiaries is no longer representative of the business level in those locations, and management no longer makes decisions or assesses performance based on this information. Management believes the investment community will have a better understanding, with less confusion, when reviewing our results as one operating seg-ment. The additional information related to the region to which our products are sold, as opposed to the region where the sale was recorded, is more aligned with managerial decision-making and will best inform all interested parties.
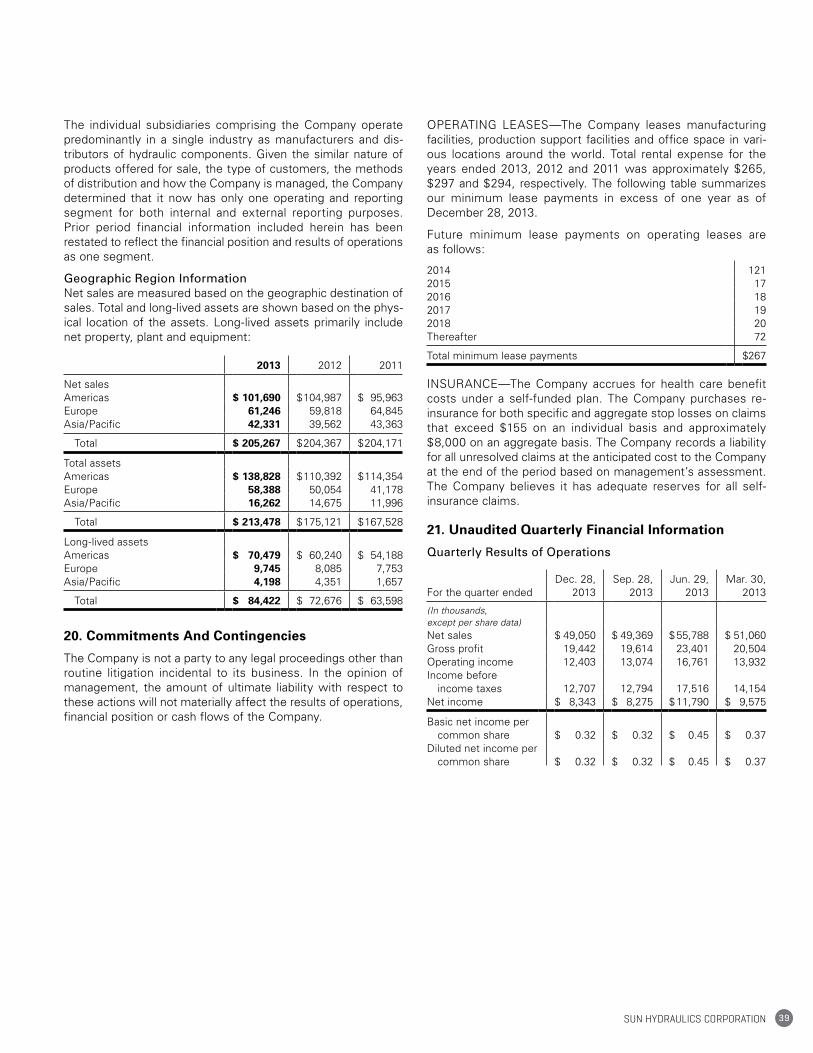
39Sun HydraulicS corporation
The individual subsidiaries comprising the Company operate predominantly in a single industry as manufacturers and dis-tributors of hydraulic components. Given the similar nature of products offered for sale, the type of customers, the methods of distribution and how the Company is managed, the Company determined that it now has only one operating and reporting segment for both internal and external reporting purposes. Prior period financial information included herein has been restated to reflect the financial position and results of operations as one segment.
Geographic Region InformationNet sales are measured based on the geographic destination of sales. Total and long-lived assets are shown based on the phys-ical location of the assets. Long-lived assets primarily include net property, plant and equipment:
2013 2012 2011
Net salesAmericas $ 101,690 $ 104,987 $ 95,963Europe 61,246 59,818 64,845Asia/Pacific 42,331 39,562 43,363
Total $ 205,267 $ 204,367 $ 204,171
Total assetsAmericas $ 138,828 $ 110,392 $ 114,354Europe 58,388 50,054 41,178Asia/Pacific 16,262 14,675 11,996
Total $ 213,478 $ 175,121 $ 167,528
Long-lived assetsAmericas $ 70,479 $ 60,240 $ 54,188Europe 9,745 8,085 7,753Asia/Pacific 4,198 4,351 1,657
Total $ 84,422 $ 72,676 $ 63,598
20. Commitments And Contingencies
The Company is not a party to any legal proceedings other than routine litigation incidental to its business. In the opinion of management, the amount of ultimate liability with respect to these actions will not materially affect the results of operations, financial position or cash flows of the Company.
OPERATING LEASES—The Company leases manufacturing facilities, production support facilities and office space in vari-ous locations around the world. Total rental expense for the years ended 2013, 2012 and 2011 was approximately $265, $297 and $294, respectively. The following table summarizes our minimum lease payments in excess of one year as of December 28, 2013.
Future minimum lease payments on operating leases are as follows:
2014 1212015 172016 182017 192018 20Thereafter 72
Total minimum lease payments $267
INSURANCE—The Company accrues for health care benefit costs under a self-funded plan. The Company purchases re-insurance for both specific and aggregate stop losses on claims that exceed $155 on an individual basis and approximately $8,000 on an aggregate basis. The Company records a liability for all unresolved claims at the anticipated cost to the Company at the end of the period based on management’s assessment. The Company believes it has adequate reserves for all self-insurance claims.
21. Unaudited Quarterly Financial Information
Quarterly Results of Operations
For the quarter endedDec. 28,
2013Sep. 28,
2013Jun. 29,
2013Mar. 30,
2013
(In thousands, except per share data)Net sales $ 49,050 $ 49,369 $ 55,788 $ 51,060Gross profit 19,442 19,614 23,401 20,504Operating income 12,403 13,074 16,761 13,932Income before income taxes 12,707 12,794 17,516 14,154Net income $ 8,343 $ 8,275 $ 11,790 $ 9,575
Basic net income per common share $ 0.32 $ 0.32 $ 0.45 $ 0.37Diluted net income per common share $ 0.32 $ 0.32 $ 0.45 $ 0.37
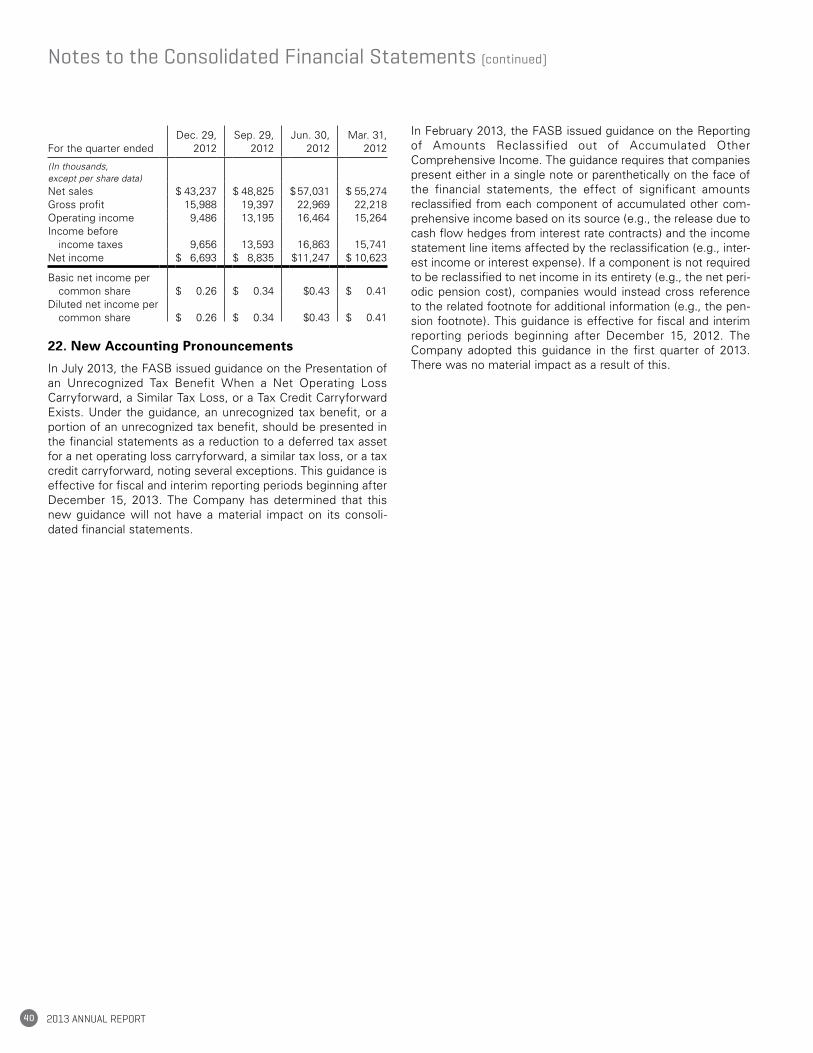
2013 AnnuAl RepoRt40
For the quarter endedDec. 29,
2012Sep. 29,
2012Jun. 30,
2012Mar. 31,
2012
(In thousands, except per share data)Net sales $ 43,237 $ 48,825 $ 57,031 $ 55,274Gross profit 15,988 19,397 22,969 22,218Operating income 9,486 13,195 16,464 15,264Income before income taxes 9,656 13,593 16,863 15,741Net income $ 6,693 $ 8,835 $11,247 $ 10,623
Basic net income per common share $ 0.26 $ 0.34 $0.43 $ 0.41Diluted net income per common share $ 0.26 $ 0.34 $0.43 $ 0.41
22. New Accounting Pronouncements
In July 2013, the FASB issued guidance on the Presentation of an Unrecognized Tax Benefit When a Net Operating Loss Carryforward, a Similar Tax Loss, or a Tax Credit Carryforward Exists. Under the guidance, an unrecognized tax benefit, or a portion of an unrecognized tax benefit, should be presented in the financial statements as a reduction to a deferred tax asset for a net operating loss carryforward, a similar tax loss, or a tax credit carryforward, noting several exceptions. This guidance is effective for fiscal and interim reporting periods beginning after December 15, 2013. The Company has determined that this new guidance will not have a material impact on its consoli-dated financial statements.
In February 2013, the FASB issued guidance on the Reporting of Amounts Reclassified out of Accumulated Other Comprehensive Income. The guidance requires that companies present either in a single note or parenthetically on the face of the financial statements, the effect of significant amounts reclassified from each component of accumulated other com-prehensive income based on its source (e.g., the release due to cash flow hedges from interest rate contracts) and the income statement line items affected by the reclassification (e.g., inter-est income or interest expense). If a component is not required to be reclassified to net income in its entirety (e.g., the net peri-odic pension cost), companies would instead cross reference to the related footnote for additional information (e.g., the pen-sion footnote). This guidance is effective for fiscal and interim reporting periods beginning after December 15, 2012. The Company adopted this guidance in the first quarter of 2013. There was no material impact as a result of this.
Notes to the Consolidated Financial Statements (continued)
41Sun HydraulicS corporation
Controls and Procedures
Disclosure Controls and ProceduresThe Company’s management, with the participation of the Chief Executive Officer and Chief Financial Officer, after evalu-ating the effectiveness of the Company’s “disclosure controls and procedures” (as defined in Rules 13a-15(e) and 15d-15(e) under the Securities Exchange Act of 1934, as amended) as of the end of the period covered by this report, have concluded that our disclosure controls and procedures are effective and are designed to ensure that the information we are required to disclose is recorded, processed, summarized and reported within the necessary time periods. Our disclosure controls and procedures include, without limitation, controls and procedures designed to ensure that information required to be disclosed by us in reports that we file or submit pursuant to the Securities Exchange Act of 1934, as amended, is accumulated and com-municated to our management, including our Chief Executive Officer and Chief Financial Officer, as appropriate to allow timely decisions regarding required disclosure.
Management’s Report on Internal Control over Financial Reporting
Management of the Company is responsible for establishing and maintaining adequate internal control over financial report-ing, as such term is defined in Exchange Act Rule 13a-15(f). The Company’s internal control over financial reporting is a pro-cess designed to provide reasonable assurance regarding the reliability of financial reporting and the preparation of financial statements for external purposes in accordance with generally accepted accounting principles. Internal control over financial reporting includes those policies and procedures that:
•pertaintothemaintenanceofrecordsthat,inreasonabledetail, accurately and fairly reflect the transactions and dispositions of the assets of the Company;
•provide reasonable assurance that transactions arerecorded, as necessary, to permit preparation of financial statements in accordance with generally accepted accounting principles, and that receipts and expenditures of the Company are being made only in accordance with authorizations of management and directors of the Company; and
•provide reasonable assurance regarding prevention ortimely detection of unauthorized acquisition, use or dispo-sition of the Company’s assets that could have a material effect on the financial statements.
Because of its inherent limitations, internal control over finan-cial reporting may not prevent or detect misstatements. Management, with the participation of the Chief Executive Officer and Chief Financial Officer, conducted an evaluation of the effectiveness of the Company’s internal control over finan-cial reporting based on the criteria set forth in Internal Control—Integrated Framework issued by the Committee of Sponsoring Organizations of the Treadway Commission. Based on this evaluation under the Internal Control— Integrated Framework, management, with the participation of the Chief Executive Officer and Chief Financial Officer, concluded that the internal control over financial reporting was effective as of December 28, 2013.
Changes in Internal Control Over Financial Reporting
There were no changes in the Company’s internal control over financial reporting during the quarter ended December 28, 2013, that materially affected, or are reasonably likely to materially affect, the Company’s internal control over financial reporting.
Attestation Report of Independent Registered Public Accounting Firm
Mayer Hoffman McCann P.C., our independent registered pub-lic accounting firm, has issued an attestation report on our internal control over financial reporting. This report appears on page 21.
2013 AnnuAl RepoRt42
We have issued our report dated March 7, 2014, accompanying the consolidated financial statements included in the Annual Report of Sun Hydraulics Corporation on Form 10-K for the years ended December 28, 2013, December 29, 2012, and December 31, 2011. We hereby consent to the incorporation by reference of said report in the Registration Statements of Sun Hydraulics Corporation of Forms S-8 (File No. 333-30801, effective July 3, 1997, File No. 333-83269, effective July 20, 1999, File No. 333-62816, effective June 12, 2001, File No. 333-66008 effective July 27, 2001, File No. 333-119367, effective September 29, 2004, File No. 333-124174, effective April 19, 2005, File No. 333-158245, effective March 27, 2009, File No. 333-177448, effective October 21, 2011, and File No. 333-184840, effective November 9, 2012).
March 7, 2014Clearwater, Florida
Consent of Independent Registered Public Accounting Firm
Shareholder Information
Corporate Officers
Allen J. CarlsonPresident, CEO
Tricia L. FultonChief Financial Officer
Mark BokorneyOfficer
Steve HancoxOfficer
Tim A. TwittyOfficer
Directors
Marc Bertoneche, PhDProfessor, Business AdministrationUniversity of Bordeaux
Allen J. CarlsonPresident, CEOSun Hydraulics Corporation
Wolfgang H. DangelConsultant, Schaeffler Holding Company
John S. KahlerPresident, CEO retiredCincinnati Incorporated
Christine L. KoskiPresident, CEOnMetric LLC
Philippe LemaitreChairman of the BoardSun Hydraulics CorporationChairman, President, CEO retiredWoodhead Industries, Inc.
David N. Wormley, PhDDean, Engineering School retiredPennsylvania State University
Legal CounselShumaker, Loop & Kendrick, LLPTampa, Florida
AuditorsMayer Hoffman McCann P.C.Clearwater, Florida
Corporate HeadquartersSun Hydraulics Corporation1500 West University ParkwaySarasota, FL 34243Phone: 941-362-1200Fax: 941-355-4497
Investor RelationsIf you wish to be placed on Sun Hydraulics’ email list for periodic news and financial releases, please send your request to [email protected] or visit Sun’s website to sign up.
The Company’s Annual Reports, Forms 10-K, 10-Q, 3, 4, 5, and press releases are available at the Investor Relations section of Sun’s website, www.sunhydraulics.com, or by request from corporate headquarters.
If you would like a hard copy of Form 10-K, a copy will be provided without charge upon request to:
Investor RelationsSun Hydraulics Corporation1500 West University ParkwaySarasota, FL 34243
Transfer AgentComputershareCampton, Massachusetts
Common Stock InformationThe Common Stock of Sun Hydraulics Corporation is traded on the NASDAQ Global Select Market under the symbol SNHY.
As of April 7, 2014, there were 164 shareholders of record. The number of record holders was determined from the records of the Company’s transfer agent and does not include beneficial owners of common stock whose shares are held in the name of various securities brokers, dealers and registered clearing agencies. The Company believes that there are approximately 13,000 beneficial owners of common stock.
As of April 7, 2014, the closing price per share of SNHY stock was $41.68 and there were 26,441,543 shares outstanding.
Shareholders Annual MeetingThe annual meeting of shareholders will be held at 10:00 AM Eastern Time on Monday, June 2, 2014, at:
Sun Hydraulics Corporation803 Tallevast RoadSarasota, Florida 34243A
nnua
l Re
po
rt D
esi
gn
by
Cur
ran
& C
onn
ors
, Inc
. / w
ww
.cur
ran
-co
nno
rs.c
om
Sun Hydraulics Corporation1500 West University ParkwaySarasota, Florida 34243 U.S.A.Phone: 941-362-1200 Email: [email protected]
High Country Tek, Inc.208 Gold Flat CourtNevada City, California 95959 U.S.A.Phone: 530-265-3236Email: [email protected]
Sun Hydraulics LimitedWheler RoadCoventry C3V 4LA EnglandPhone: 44-2476-217400Email: [email protected]
Sun Hydraulik GmbHBrusseler Allee 2D-41812 Erkelenz, GermanyPhone: 49-2431-8091-0Email: [email protected]
Sun Hydraulics (France)Parc Innolin6 rue du Golf33700 Mérignac, FrancePhone: 33-557-291529 Email: [email protected]
Sun Hydraulics Korea Corporation97B 13L Namdong Industrial Complex664-12 Gojan Dong, Namdong GuIncheon, 405-310 KoreaPhone: 82-32-813-1350Email: [email protected]
Sun Hydraulics China Co., Ltd.Hong Kong New World Tower47th Floor300, Huaihai Zhong RoadShanghai 200021P.R. ChinaPhone: 86-21-5116-2862Email: [email protected]
Sun Hydraulics ( India)No. 48, Regent PrimeUnit No. 306, Level -3,Whitefield Main RoadBangalore-560066 IndiaPhone: 0091-80-25236325Email: [email protected]
www.sunhydraulics.com
WorldWide locations