Embed Size (px)
Citation preview

Instructions for use
Title Performance characterization of the Inveon preclinical small-animal PET/SPECT/CT system for multimodality imaging
Author(s) Magota, Keiichi; Kubo, Naoki; Kuge, Yuji; Nishijima, Ken-ichi; Zhao, Songji; Tamaki, Nagara
Citation European Journal of Nuclear Medicine and Molecular Imaging, 38(4): 742-752
Issue Date 2011-04
Doc URL http://hdl.handle.net/2115/48719
Rights The original publication is available at www.springerlink.com
Type article (author version)
File Information EJNMMI38-4_742-752.pdf
Hokkaido University Collection of Scholarly and Academic Papers : HUSCAP

1
Keiichi Magota1, 2, Naoki Kubo3, Yuji Kuge4, Ken-ichi Nishijima4, Songji Zhao4, and
Nagara Tamaki1
Performance characterization of the Inveon preclinical small-animal
PET/SPECT/CT system for multi-modality imaging
1Department of Nuclear Medicine, Hokkaido University Graduate School of
Medicine, Sapporo, Japan
2Department of Radiology, Hokkaido University Hospital, Sapporo, Japan
3Faculty of Health Sciences, Hokkaido University, Sapporo, Japan
4Department of Tracer Kinetics and Bioanalysis, Hokkaido University Graduate
School of Medicine, Sapporo, Japan

2
Corresponding author: Keiichi Magota,
e-mail: [email protected], Tel: +81-11-7065150, Fax: +81-11-7067155,
Address: Kita 15 Nishi 7, Kita-ku, Sapporo 060-8638, Japan
3
Purpose: We analyzed the performance of the Inveon for an integrated small-animal
PET/SPECT/CT system and compared the imaging capabilities of the SPECT and
the PET components.
Methods: For SPECT, energy resolution, tomographic spatial resolution, and
system sensitivity were evaluated with 99mTc solution using a single pinhole
collimator. For PET, spatial resolution, absolute sensitivity, scatter fraction, and peak
noise equivalent count (NEC) were evaluated. A micro-Derenzo phantom,
cylindrical phantom, and National Electrical Manufacturers Association NU-4 image
quality phantom were scanned to compare SPECT and PET image capabilities, and
SPECT and PET bone imaging were performed on a normal rat in vivo.
Results: SPECT spatial resolution was 0.84 mm full width at half maximum (FWHM)
at a radius of rotation of 25 mm using the 0.5-mm pinhole aperture collimator, while
PET spatial resolution was 1.63 mm FWHM at the center. SPECT system sensitivity
at a radius of rotation of 25 mm was 35.3 cps/MBq (4 × 10⁻³%) using 0.5-mm
pinhole aperture, while PET absolute sensitivity was 3.2% for 350–650 keV and
3.432 ns. Accordingly, the volume sensitivity of PET was three orders of magnitude
4
higher than that of SPECT.
Conclusions: This integrated PET/SPECT/CT system provided high system
performance with excellent spatial resolution for SPECT and sensitivity for PET.
Based on tracer availability and system performance, SPECT and PET have
complementary roles for multi-modality small-animal imaging.
Key Words: integrated PET/SPECT/CT system; small-animal imaging; performance
measurement; instrumentation; molecular imaging
5
INTRODUCTION
Molecular imaging of small laboratory animals using single photon emission
tomography (SPECT), positron emission tomography (PET), and x-ray computed
tomography (CT) has recently emerged as an important tool for the in vivo study of
animal models of human disease. This imaging method enables longitudinal studies
to be performed in the same animal, and animals can serve as their own control.
SPECT and PET have been used in functional imaging, including brain, heart,
gene expression, and oncology studies [1, 2]. CT has also been used for anatomical
imaging (e.g., bone imaging) because it provides high contrast between bone and
soft tissue [3]. The use of SPECT, PET, and CT in combinations such as SPECT/CT,
PET/CT, SPECT/PET, and SPECT/PET/CT―so-called “multi-modality imaging”―
may enable the development of new and interesting protocols for investigating
many biological phenomena more effectively than is possible using SPECT, PET, or
CT modalities alone. Using these techniques, lesions visualized by functional
imaging can be correlated with anatomic imaging. In general, CT is also used for
attenuation and scatter correction of SPECT and PET images. However, in this
6
study, neither attenuation nor scatter correction was performed.
Integration of SPECT, PET, and CT images can be achieved by a “software
approach” that fuses the images acquired by separate scanners. These techniques,
however, are hampered by problems with object positioning and internal organ
movement. Thus, animal movement and positioning of the holder require extreme
care in the software approach. Alternatively, these problems can be addressed by
using a “hardware approach”, which can be achieved by automatic imaging bed
moving. The spatial transformation matrix for the registration is predetermined by a
phantom scanning. A hardware approach would be the most useful and convenient
method for small-animal imaging.
In the past several years, a large number of small-animal SPECT [4–8], PET
[9–12], and CT systems have been developed and become commercially available.
Moreover, efforts to develop trimodality preclinical systems integrated in a common
gantry including SPECT/PET/CT also are under way. Examples of such a system
are the FLEX TriumphTM imaging platform from Gamma Medica-Ideas and
YAP(S)-PET [13]. Multi-modality systems are accessible with the same animal bed
and image fusion can be obtained.
7
We have had the opportunity to use a new integrated PET/SPECT/CT system
developed for molecular imaging of small animals in vivo. Several recent studies
have reported the performance of the PET [14–17]; however, evaluation of the
SPECT component and comparison of performance between PET and SPECT
have not yet been reported.
It is known that SPECT using a pinhole collimator has high spatial resolution, while
PET has high sensitivity. This feature plays an important role when deciding
whether to use SPECT or PET. When integrated multi-modality imaging systems
are used, it is particularly important to understand the features and performance of
each modality and to choose the appropriate modality for a particular experiment, to
obtain the best results. Therefore, it is necessary to compare performance between
SPECT and PET in standard use, in terms of reconstruction methods and their
parameters.
In the first two sections of this study, we aimed to evaluate the performance
measurements of the SPECT component and validate the basic characterization of
the PET component. In the final sections, we compare the capabilities of SPECT
8
and PET in terms of spatial resolution and sensitivity, respectively.
MATERIALS AND METHODS
System Description
We tested the latest commercially available small-animal imaging system (Inveon;
Siemens Medical Solutions, Knoxville, TN). Inveon offers SPECT, PET, and CT
imaging in dedicated, docked or integrated configurations to fit the research needs.
Each performance is the same for all configurations. We have installed the
integrated type SPECT/PET/CT system. In this configuration, the SPECT, PET, and
CT components are combined in a common gantry, with SPECT and CT placed at
the front and PET at the rear. The SPECT component is mounted perpendicularly to
the CT component. The carbon fiber imaging bed has axial movement sufficient to
image individually or with all three modalities in combination.
The SPECT component has dual head detector geometry that be mounted on a
rotating gantry. Each detector head contains a 68 × 68 pixelated scintillator array of
9
2.0 × 2.0 × 10 mm NaI(Tl) crystals with 0.2 mm gap, in combination with a
position-sensitive photomultiplier tube (PS-PMT) readout. The maximum active
imaging region is 150 × 150 mm. Various interchangeable tungsten collimators can
be attached to the detector: single pinhole collimators have aperture of 0.5, 1.0, 2.0,
and 3.0 mm. The acceptance angle of the aperture is 90°, with focal length of 90 or
95 mm. The transaxial and axial field of view (FOV) varies with the radius of rotation
from 28 to 45 mm. In the axial bed travel (continuous bed motion) mode, the axial
FOV can be set larger (≦250 mm). All counts are recorded and maintained in list
mode to enable the use of various energy windows in postprocessing and
reconstruction. Images can be reconstructed by three-dimensional ordered subset
expectation maximization (3D-OSEM) or 3D maximum a posteriori (3D-MAP)
method.
The PET component consists of 64 lutetium oxyorthosilicate (LSO) detectors
arranged in 4 contiguous rings of 16 blocks with a ring diameter of 16.1 cm, to give
an effective transaxial FOV of 10 cm and an axial FOV of 12.7 cm. Each detector
consists of a 20 × 20 array of 1.5 × 1.5 × 10 mm LSO crystal elements coupled to a
PS-PMT via a light guide. The scanner acquires exclusively in 3D mode. The
10
reconstruction methods have been described in detail in previous reports [14–17].
Physical Study
We characterized the performance of the Inveon with regard to the SPECT and
PET components. For SPECT, energy resolution, tomographic spatial resolution,
and system sensitivity were evaluated. For PET, spatial resolution, absolute
sensitivity, scatter fraction, and noise equivalent count (NEC) were evaluated. To
compare the imaging capabilities of SPECT and PET, spatial resolution and
sensitivity were evaluated using common phantoms: the micro-Derenzo phantom,
cylindrical phantom, and National Electrical Manufacturers Association (NEMA)
NU-4 image quality phantom [18]. Finally, to investigate in the practical animal-study,
rat bone imaging was performed. Optimal imaging parameters (e.g., activity,
acquisition time, and reconstruction settings) were not evaluated; therefore, these
parameters were determined from visual evaluation of the rat bone images and the
findings of previous reports [1, 2, 4–12]. The Inveon Acquisition Workplace 1.2.2.2
(Siemens Medical Solutions, Knoxville, TN) was used for SPECT and PET
reconstruction.
11
1. SPECT
With regard to tomographic spatial resolution, and phantom and rat bone
imaging (next section), projection data were acquired in step-and-shoot mode with
60 or 120 views over 360° at 30, 60, or 90 s/view. The acquisition time per view was
prolonged according to the radioactivity decay. A 20% window was centered at the
140 keV photopeak of 99mTc. The radius of rotation was 25, 30, or 35 mm. The
3D-OSEM algorithm method was used in reconstruction (number of iteration, 2;
subsets, 6). Image matrix voxel size was 0.5 × 0.5 × 0.5 mm (0.2 × 0.2 × 0.2 mm for
tomographic spatial resolution measurements). Neither attenuation nor scatter
correction was performed. All reconstructed images were normalized using a
correction matrix derived from a uniform cylindrical phantom imaged prior to
reconstruction. Since the aperture sizes less than 1.0 mm of single pinhole
collimator have been used in recent small-animal research [1, 4, 6, 7], this size only
was evaluated in this study.
1.A. Energy Resolution
Crystal energy spectra within energy window of 0–300 keV were obtained
12
using a 99mTc point source. A total of at least 10,000 counts were collected.
Energy resolution was determined for all crystals in the system and calculated
as full width at half maximum (FWHM) of a 140 keV energy peak divided by the
energy value.
1.B. Tomographic Spatial Resolution
Tomographic resolution was measured for the 0.5- and 1.0-mm pinhole
aperture with a line source made from glass capillary tubes (inner diameter, 0.28
mm) filled with 99mTc solution. The line source was mounted on the imaging bed
and placed in the center of the transaxial FOV and aligned axially. Line-source
images were obtained as a function of the radius of rotation, which varied in 5
mm steps from 25 to 35 mm. Projection data were acquired with 60 views over
360° at 60 s/view, for total acquisition time of 32 min.
Count profiles of the reconstructed transaxial images across the voxel having
the maximum voxel intensity were plotted in the horizontal and vertical directions.
FWHM and full width at tenth maximum (FWTM) were then determined by linear
interpolation between adjacent pixels at a half or tenth, respectively, of the
13
profile maximum value, which was determined by parabolic fit using peak points
and their two nearest neighboring points. The averages of horizontal and vertical
direction were calculated simultaneously over 10 transaxial slices. The results of
resolution measurements were not corrected for source dimension.
1.C. System Sensitivity
System sensitivity was measured in planar mode for the 0.5- and 1.0-mm
pinhole apertures with a 99mTc point source as a function of source to collimator
distance, which varied in 5 mm steps from 25 to 35 mm. The point source was
created by drawing a small fluid column into the tip of a 0.85 mm (inner
diameter) capillary tube that was then mounted on the imaging bed, in the center
of the transaxial and axial FOVs. Activity of the point source was approximately
0.5 MBq. During the acquisition time of 10 min, a total of at least 10,000 counts
were collected in each measurement. System sensitivity was defined as the
recorded counts per second divided by the decay-corrected activity of the point
source.
2. PET
14
All performance measurements were set to a coincidence window of 3.432 ns
and an energy window of 350–650 keV. Delayed events were subtracted from
prompt events to correct for random events. The image matrix was 256 × 256 × 159,
resulting in voxel size of 0.385 × 0.385 × 0.796 mm (512 × 512 × 159 matrix, 0.215
× 0.215 × 0.796 mm for spatial resolution measurements).
2.A. Spatial Resolution
Spatial resolution was measured using a 22Na point source with a nominal
size of 0.6 mm, embedded in a Lucite disk. The activity of the point source was
approximately 2.8 MBq. The point source was attached to the imaging bed and
centered in the axial FOV. Data were acquired for 30 s in list mode at the center
of the FOV and 2 cm radial offset position. All measurements were repeated
four times. The images were reconstructed using Fourier rebinning algorithm
(FORE) and filtered backprojection (FBP) with ramp filter cutoff at the Nyquist
frequency. The method for calculating FWHM and FWTM was similar to that in
the SPECT spatial resolution test (previous section). Results of the spatial
resolution measurements were not corrected for source dimension, positron
15
range, or non-colinearity of positron annihilation.
2.B. Absolute Sensitivity
Absolute sensitivity was measured using a 15.0 cm glass tube with inner
diameter of 1.0 mm that was filled with 4.8 MBq of 18F-FDG over 13.0 cm of its
length. The glass line source was sealed at both ends and inserted into the
smallest of a set of five concentric aluminum sleeves with wall thickness of 1.0
mm, and was scanned to determine sensitivity free from the effects of photon
attenuation and scatter. Measurements were performed with the line source
aligned along the scanner axis at the center. Data were acquired for each
decreasing number of sleeves, and for 10 min. The number of coincidences
was measured for intrinsic radioactivity from 176Lu in the LSO crystals were
subtracted to obtain true counting rates, which were corrected for 18F activity
decay. Sensitivity was extrapolated to zero wall thickness from an exponential
fit to slice sensitivity plotted as a function of the number of sleeves [19].
2.C. Scatter Fraction and NEC
16
Scatter fraction and NEC were measured using two different cylindric
polyethylene phantoms to simulate a typical mouse (diameter, 3 cm; length, 7
cm) and rat (diameter, 6 cm; length, 15 cm). A 3.2 mm hole was drilled parallel
to the central axis of the cylinder at a radial distance of 10 mm (mouse-like
phantom) and 17.5 mm (rat-like phantom). A line-source insert with the same
length as each phantom was filled with 11C solution and threaded through these
holes. The phantoms were mounted on the imaging bed and placed in the
center of the transaxial and axial FOVs [12].
Background coincidence events due to intrinsic radioactivity from 176Lu in
the LSO crystals was also measured for 1 h with the mouse- or rat-like
phantoms centered in the FOV, with no activity in the line source [20]. PET list
mode data were sorted into two-dimensional (2D) sinograms using single-slice
rebinning (SSRB). Prompt and random sinograms were generated separately.
For prompt sinograms of each slice, each projection was shifted so that the
pixel containing the maximum value was aligned with the central pixel of the
sinogram. After alignment, a sum projection was produced such that a pixel in
the sum projection is the sum of the pixels in each angular projection having the

17
same radial offset as the pixel in the sum projection. For each summed
projection, all pixels in each sinogram located farther than 8 mm from the edge
of the phantom were set to zero. All pixel counts beyond a 7 mm radius
(line-source band) from the center of the profile were assumed to be the sum of
random, scatter, and intrinsic counts; these counts under the peak were
estimated by linearly interpolating the number of events at the left and right
borders of the line-source band. Counts above this line were regarded as true
counts. Random and intrinsic counts were estimated from random and blank
sinograms, respectively, using the same band size of 16 mm larger than the
phantom [9, 18]. The scatter counting rate and NEC have been used a
methodology based on previous report [12]. Finally, peak NEC was determined
for each phantom size.
Comparative Study
1. Spatial Resolution
A micro-Derenzo phantom was scanned to compare image resolution. This
phantom has an inner diameter of 32 mm and contains fillable hot rods of different
18
sizes (0.75, 1.00, 1.35, 1.70, 2.00, and 2.40 mm) arranged into six segments (Data
Spectrum Corp). The phantom was filled with 37 MBq (5.3 MBq/mL) of 18F-FDG for
PET scanning, or 111 MBq (15.9 MBq/mL) of 99mTc solution for SPECT scanning.
Acquisition time for PET scanning was 30 min. Sinograms were reconstructed using
FORE and FBP into a 256 × 256 × 159 matrix. Attenuation and scatter correction
were performed using a CT-based method. CT images were acquired in
step-and-shoot mode. Acquisition parameters were as follows: voltage 80 kVp,
anode current 500 μA, angular sampling 1° per projection for a full 360° scan, and
effective pixel size 186.1 μm. Images were reconstructed using a modified
Feldkamp algorithm. In SPECT scanning, 60 projection views were acquired at 60
s/view over 360°, with collimators of 0.5 and 1.0 mm aperture, at a radius of rotation
of 30 mm. Total acquisition time was 32 min. Neither attenuation nor scatter
correction was performed.
To calculate the recovery coefficient and estimate the fraction of the signal lost in
the image due to resolution effects, we performed SPECT and PET scans of the
NEMA NU-4 image quality phantom [18]. This phantom has a main fillable uniform
region (inner diameter, 3.0 cm; length, 3.0 cm) and a solid acrylic glass region (inner
19
diameter, 3.0 cm; length, 2.0 cm) with five fillable rods drilled through with diameters
of 1, 2, 3, 4, and 5 mm. The phantom was filled with 35 MBq (1.6 MBq/mL) of
18F-FDG for PET scanning, or 31 MBq (1.4 MBq/mL) of 99mTc solution for SPECT
scanning. For PET, the scan and reconstruction parameters were similar to those
used for scanning the micro-Derenzo phantom. For SPECT, 120 projection views
were acquired at 30 s/view over 360°, with a collimator of 0.5 mm aperture, at a
radius of rotation of 35 mm. Total acquisition time was 32 min. Circular ROIs were
then drawn in the reconstructed transaxial images for both SPECT and PET, around
the main uniform region and for each rod. The recovery coefficient was defined as
the mean value in each rod divided by the mean value obtained in the main uniform
region. Simultaneously, the average and standard deviation of 10 axial slices was
calculated.
2. Sensitivity
A cylindrical phantom was scanned to calculate volume sensitivity [21] and
evaluate uniformity. The glass cylindrical phantom (inner diameter, 2.5 cm; length, 9
cm) was filled with 50 MBq (1.1 MBq/mL) of 18F-FDG for PET scanning, or 117 MBq
20
(2.6 MBq/mL) of 99mTc solution for SPECT scanning. For PET, the scan and
reconstruction parameters were similar to those used for scanning the
micro-Derenzo phantom. For SPECT, 60 projection views were acquired at 90
s/view over 360°, with collimators of 0.5 and 1.0 mm aperture, at a radius of rotation
of 25 mm. Total acquisition time was 48 min. Neither attenuation nor scatter
correction was performed. Circular ROIs were then drawn in the reconstructed
transaxial images of both the SPECT and PET images. Using the data from these
ROIs, volume sensitivity was calculated as follows:
( ) ,= LAtC cmmLMBqcps ySensitivit Volume total Eq. 1
where Ctotal is the total counts in all projections with SPECT and the total
true events in all systems with PET, t is mid-scan time, A is
decay-corrected activity, and L is the axial length of a cylindrical phantom
within an axial FOV. This method has been used previously for
evaluating SPECT sensitivity in a clinical system [21]. For comparison,
the PET data were then applied to this equation.
We calculated quantitative uniformity and the coefficient of
21
variation (CV) using the same ROI data. Quantitative uniformity was
calculated as follows:
( ) ( )( ) ,
+
-100
count SPECT Min count SPECT Maxcount SPECT Min count SPECT Max
%Uniformity ×= Eq. 2
3. Animal Study
On the same day and in the same position, the same animal was scanned with
CT, 99mTc-methylene disphosphonate (99mTc-MDP) SPECT, and 18F- PET. First, a
normal rat (Sprague–Dawley, 165 g) was scanned with CT. Second, bone SPECT
scanning was performed 2 h later, for 48 min, after injection of 96.9 MBq of
99mTc-MDP. Finally, bone PET was performed 1 h later, for 30 min, after injection of
59.8 MBq of 18F-. The rat was anesthetized with 1.0–1.5% isoflurane prior to
imaging. The scan and reconstruction parameters used in CT and 18F- PET
scanning were similar to those used in scanning of the micro-Derenzo phantom. In
99mTc-MDP SPECT scanning, 60 projection views were acquired at 90 s/view over
360°, with a collimator of 1.0 mm aperture, at a radius of rotation of 35 mm. Total
acquisition time was 48 min. This animal study was performed in accordance with
the guidelines for the care and use of laboratory animals of the Hokkaido University

22
Graduate School of Medicine.
RESULTS
Physical Study
1. SPECT
Energy resolution for averaged over all crystals was 12.4%.
Fig. 1 shows the averages of horizontal and vertical tomographic spatial
resolution as functions of the radius of rotation for the 0.5- and 1.0-mm pinhole
aperture. Resolution for the 0.5-mm pinhole aperture was 0.84, 1.03, and 1.08 mm
FWHM at a radius of rotation of 25, 30, and 35 mm, respectively, while resolution for
the 1.0-mm pinhole aperture at each radius of rotation was 1.20, 1.25, and 1.27 mm,
respectively.
System sensitivity as a function of source-to-collimator distance for the 0.5-
and 1.0-mm pinhole aperture is plotted in Fig. 2. System sensitivity at a
23
source-to-collimator distance of 25 mm was 35.3 cps/MBq (4 × 10⁻³%) for the
0.5-mm pinhole aperture and 76.7 cps/MBq (9 × 10⁻³%) for the 1.0-mm pinhole
aperture.
2. PET
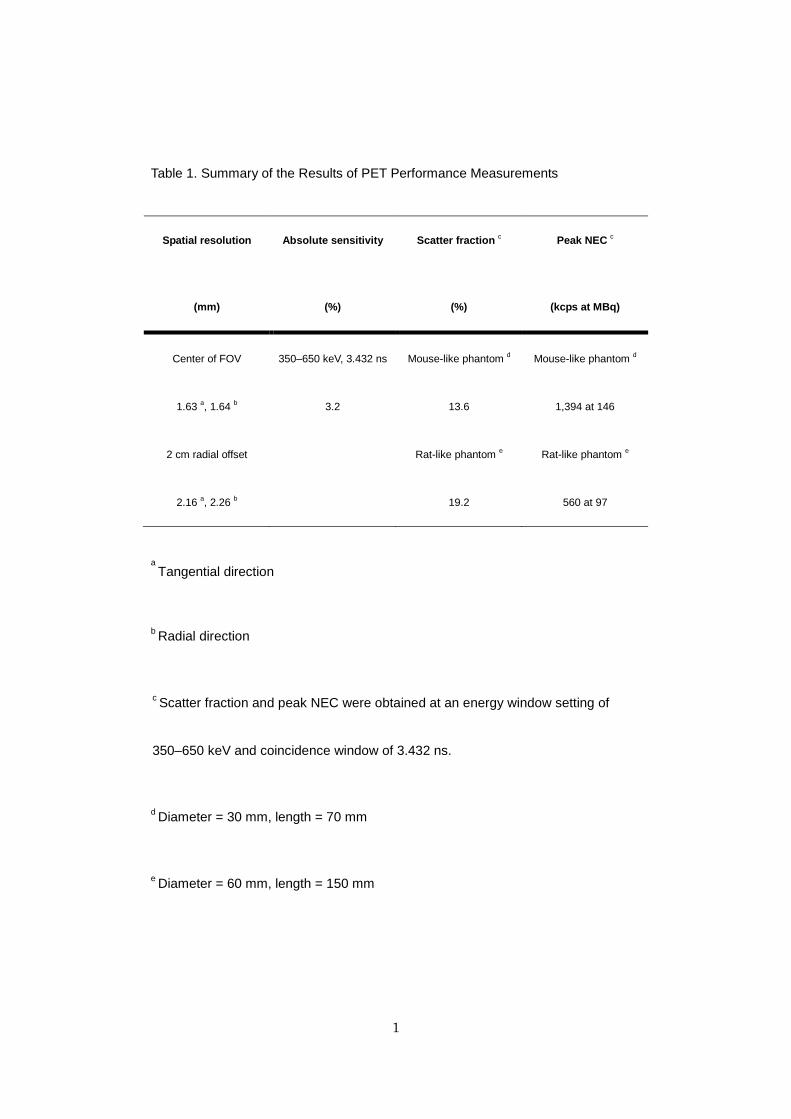
The results of PET performance measurements are summarized in Table 1.
Horizontal and vertical spatial resolution were 1.63 and 1.64 mm FWHM,
respectively, at the center of the FOV, and 2.16 and 2.26 mm FWHM, respectively,
at radial offset of 2 cm.
At the center of the FOV, absolute sensitivity for energy windows of 350–650
keV using a coincidence window of 3.432 ns was 3.2%.
For an energy window of 350–650 keV and a coincidence window of 3.432 ns,
scatter fraction and peak NEC were 13.6% and 1,394 kcps at 146 MBq for the
mouse-like phantom, and 19.2% and 560 kcps at 97 MBq for the rat-like phantom,
respectively.
Comparative Study
24
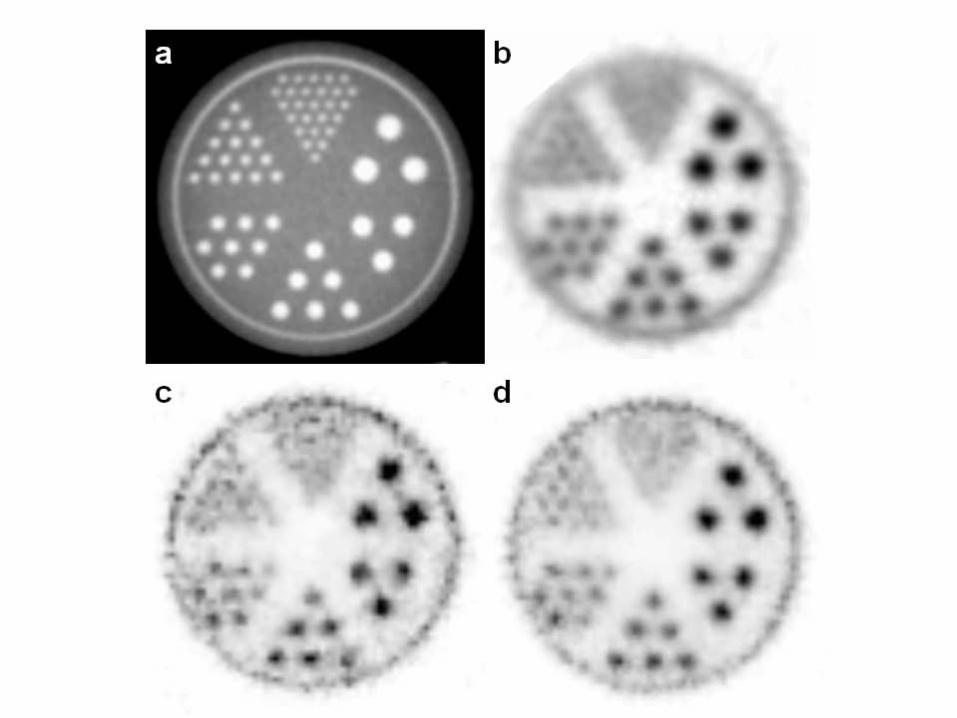
In comparing spatial resolution between PET and SPECT using reconstructed
images of the micro-Derenzo phantom, the 1.70 mm hot rods could be
distinguished visually on the PET image (Fig. 3b), while the 1.35 mm hot rods could
be distinguished on SPECT with the 0.5-mm (Fig. 3c) and 1.0-mm pinhole aperture
(Fig. 3d).
The recovery coefficients for SPECT using the 0.5-mm pinhole aperture and PET
of each hot rod are shown in Fig. 4. The recovery coefficient for SPECT of the
0.5-mm pinhole aperture was greater than that for PET in all hot rods. Therefore,
the results of the recovery coefficient study indicate that the partial volume effect
was slightly less for SPECT than for PET.
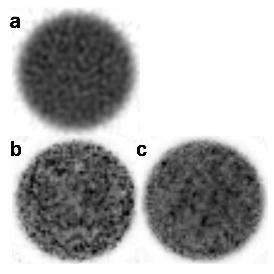
Fig. 5 demonstrates image uniformity in the reconstructed images of the cylindrical
phantom. No image contains any visible artifact. No residual systematic deviation is
apparent from the center to the edge of the image.
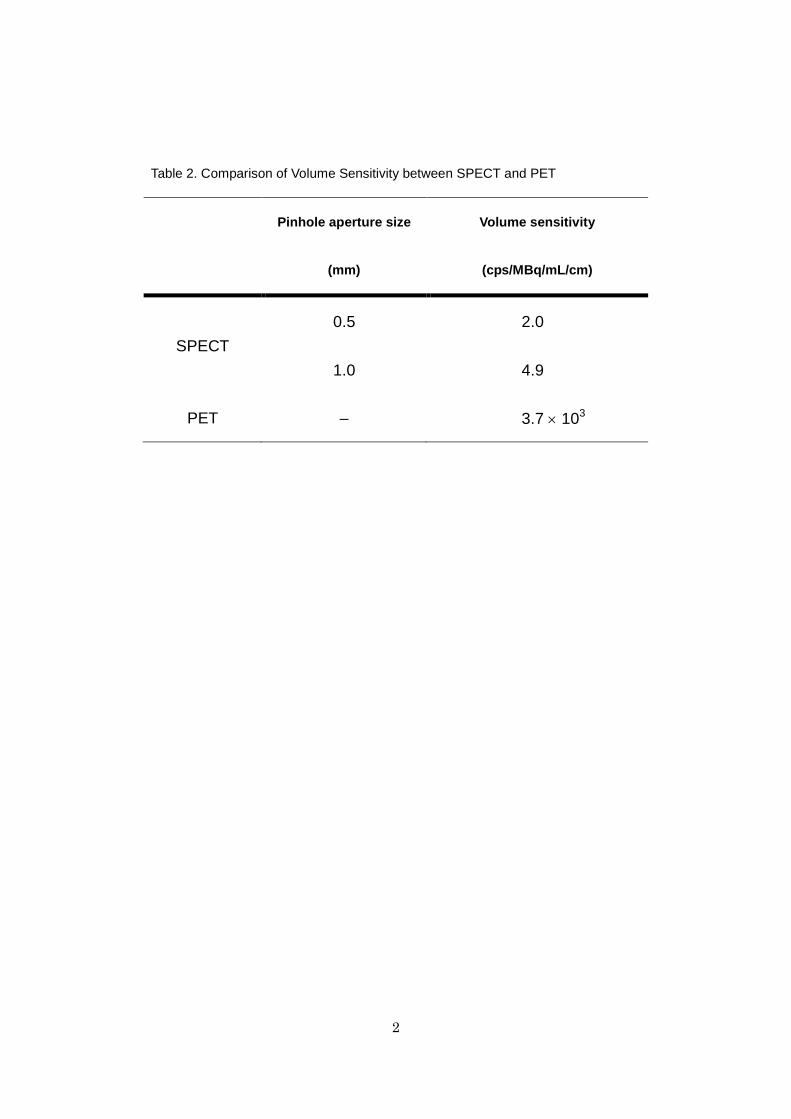
Volume sensitivity as measured for SPECT with the 0.5- and 1.0-mm pinhole
aperture and for PET was 2.0, 4.9, and 3.7 × 10³ cps/MBq/mL/cm, respectively,
(Table 2), which indicates that volume sensitivity was three orders of magnitude
25
higher for PET than for SPECT.
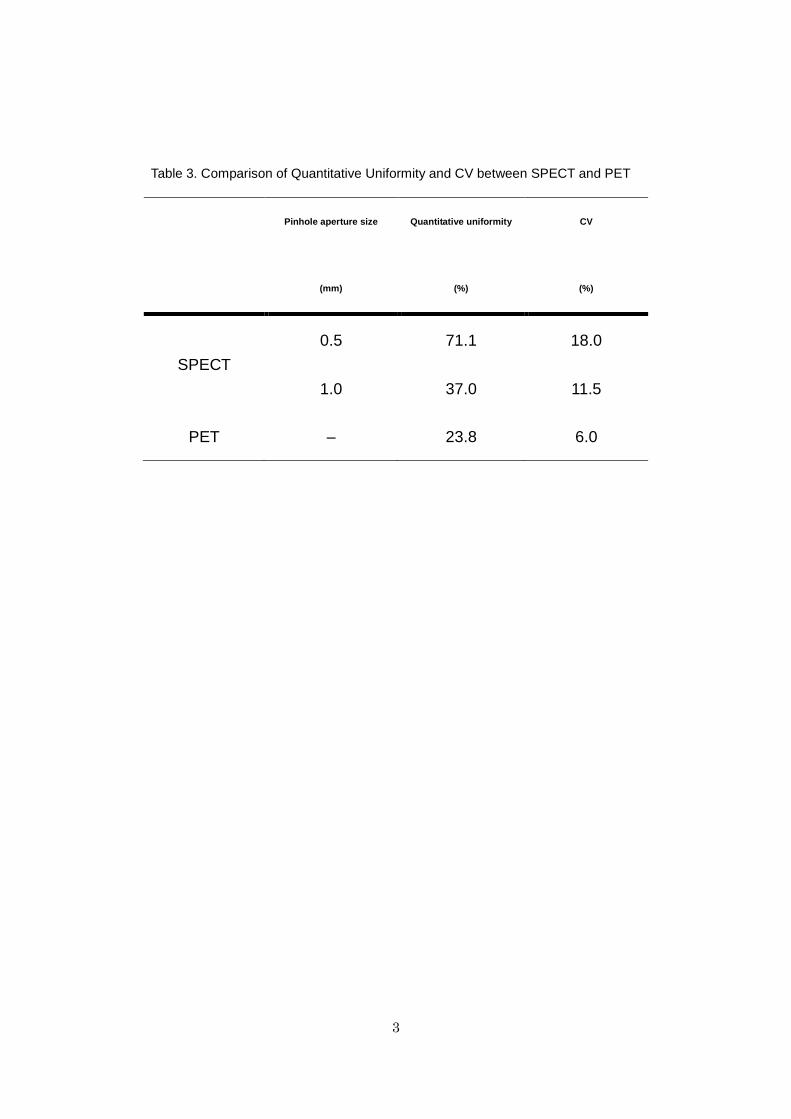
Quantitative uniformity and CV measured for SPECT with the 0.5- and 1.0-mm
pinhole aperture and for PET are summarized in Table 3. Quantitative uniformity
measured for SPECT with the 0.5- and 1.0-mm pinhole aperture and for PET was
71.1, 37.0, and 23.8%, respectively. CV values were lower for PET (6.0%) than for
SPECT (0.5-mm aperture, 18.0%; 1.0-mm aperture, 11.5%), which indicates greater
uniformity for PET. Among the SPECT images, uniformity for the 1.0-mm pinhole
aperture was better than for the 0.5-mm pinhole aperture.
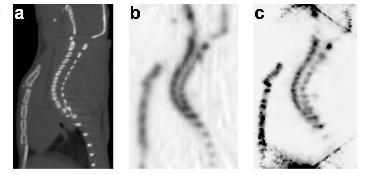
Fig. 6 shows sagittal images of rat bone obtained by CT, 18F- PET, and 99mTc-MDP
SPECT. Statistical noise was markedly lower in the 18F- PET image (Fig. 6b)
compared with the 99mTc-MDP SPECT image (Fig. 6c). Bony structures, including
the spine, vertebral canal, and sternum, were more clearly visible in the 99mTc-MDP
SPECT image than in the PET image.
DISCUSSION
26
We studied the system performance and imaging capability of a new integrated
PET/SPECT/CT system for molecular imaging of small animals in vivo. The
performances of the PET component of this system has recently been reported
[14–17]; however, this is the first report to evaluate SPECT performance in
comparison with PET performance. We evaluated the full performance
measurements of the SPECT component and validated the basic characterization
of the PET component. By comparing SPECT and PET, we demonstrated the
feasibility of the system for multi-modality imaging, and provided a basis for
deciding whether to select SPECT or PET. A study using SPECT and PET has a
number of potentials for molecular imaging with various types of suitable
radiopharmaceuticals, but also for integrated molecular imaging using multiple
radiopharmaceuticals at the same time. Of particular, molecular imaging in a
pathology/physiology study, development of treatment strategy, therapeutic agents
and methods and diagnostic probes/radiopharmaceuticals [22, 23] have been fully
investigated in combination with perfusion imaging, including metabolic imaging,
neuronal transporter-receptor imaging, angiogenesis, etc. 99mTc-annexin A5, a new
SPECT tracer as a marker of ongoing apoptotic cell death, and 18F-FDG, a standard
27
PET tracer as a marker of inflammation, are supposed to be useful in the detection
of metabolically active atheroma. Zhao Y et al. [23] reported a comparison of the
intralesional distribution of these tracers. In this development of a new diagnostic
probe, comparative evaluation with standard probe is essential to understand its
potentials and to show its superiority to standard probe Therefore, when we
interpret the results of SPECT and PET images, it is particularly important to
understand the feature and performance of each modality.
The results of spatial resolution measurements and micro-Derenzo phantom
imaging indicate that SPECT provides much better spatial resolution of
reconstructed images than does PET (at a submillimeter scale). This is because
PET has inherent limiting factors that degrade the resolution of reconstructed
images, including those associated with the crystals (width, scattering, and
penetration), photon non-colinearity, and positron range [24]. However, direct
comparisons of spatial resolution between SPECT and PET are not appropriate
because the size of the sources was different (0.25 mm in SPECT and 0.6 mm in
PET). After correcting for source dimension, SPECT spatial resolution was 0.80,
1.00, 1.06 mm at a radius of rotation of 25, 30, and 35 mm, respectively, whereas
28
PET spatial resolution was 1.52 mm. Differences of spatial resolution were
diminished but SPECT remained better than PET. In contrast, the advantage of PET
over SPECT is that it exhibits a much higher sensitivity (by approximately three
orders of magnitude) with respect to volume sensitivity. This advantage can be
proven by the greater uniformity of PET for a lower CV value, using the cylindrical
phantom, which occurs because SPECT requires physical collimators to reject
photons [24]. The image quality of the rat bone study showed good agreement with
these findings. Thus, the performances of SPECT and PET are complementary.
The trade-off relation between resolution and sensitivity was in agreement with a
previous report [24]. These features offer biomedical scientists important
information for selecting SPECT or PET, with regard to physical characteristics and
pharmaceutical selections.
To compare the sensitivities of SPECT and PET, we measured volume sensitivity
from the cylindrical phantom. The emitted photons suffer attenuation and scattering
by the water in the cylindrical phantom. This effect is dependent on the emitted
radiation energy, object size, and material. Although volume sensitivity includes the
effects of attenuation and scatter, we consider that this method is suitable for
29
evaluating final image feasibility in comparing SPECT and PET. Because this
measurement method is easy and convenient, we suggest that this method should
be used to compare sensitivity between SPECT and PET.
With regard to SPECT performance measurements, tomographic spatial resolution
was in general agreement with the results obtained from other small-animal
scanners [4, 5], for the same aperture size and radius of rotation. Our results for
system sensitivity were also in general agreement with those for other small-animal
scanners equipped with a single pinhole collimator and the same aperture size and
radius of rotation [4, 7]. Comparison to the latest small-animal SPECT system with
their much number of detectors and pin-holes such as U-SPECT-II [6], and
NanoSPECT [25], these systems provide much higher sensitivity than the Inveon
SPECT. The energy resolution was worse for this system as compared with the
semiconductor system (12.4%–5.6%) [11], which was comparable to the same
Anger-type system [7, 12]. The present results for tomographic spatial resolution
and system sensitivity less lower than that for manufacturers datasheets. Because
energy window, reconstruction setting, etc. may be different to those used in o9ur
measurement.
30
With regard to PET performance measurements, the present results for spatial
resolution differ slightly from those reported in previous studies [14–16] in which the
results were obtained from 22Na point-source images. Because the diameters of
these sources are different to those used in our measurements, direct comparison
is not appropriate. We measured absolute sensitivity, free of photon attenuation and
scatter, using an extrapolation method [19]. Absolute sensitivity in our study was
comparable to the previous study [17]. The present results for scatter fraction and
peak NEC differ slightly from those reported in previous studies because we used
cylindrical phantoms of differing diameters. We used phantoms with slightly larger
diameters than those reported in previous studies [15–17].
Improvement in PET resolution is generally limited by positron range, particularly
in small-animal scanners. The MAP reconstruction method has the advantage of
being able to include the entire positron range directly into the algorithm. SPECT
using a pinhole collimator is an exciting example of a technological advance that
introduces the possibility of enhanced image resolution. It must be noted, however,
that using a pinhole collimator with a small aperture results in decreased sensitivity.
A multi-pinhole collimator has the potential to improve sensitivity. The Inveon
31
permits the use MAP reconstruction in PET and a multi-pinhole collimator in
SPECT; thus, these are topics for further study.
In the present study, 99mTc-MDP SPECT showed higher spatial resolution, while
18F- PET showed higher sensitivity, consistent with our physical measurements.
Other tracers, however, are used in SPECT imaging for animal research. 125I and
111In, for example, have attractive chemical properties and are commonly used in
molecular biology for labeling of nucleic acids, antibodies, ligands, and other
pharmaceuticals. Spatial resolution and sensitivity in SPECT using a pinhole
collimator are changed by isotope energy because of aperture penetration [6]. In
addition, the results of SPECT and PET performance, particularly spatial resolution
and imaging studies, are influenced by the employed image reconstruction methods
and parameters (iteration, subset, etc.) [14]. Thus, in future research it will be
necessary to evaluate these performance tests, using the alternative tracers and
the reconstruction methods and parameters.
CONCLUSION

32
This study evaluated the performance of a new integrated PET/SPECT/CT system
for small-animal imaging with regard to the SPECT and PET components.
This system provided high system performance with excellent spatial resolution for
SPECT and sensitivity for PET. Based on tracer availability and system
performance, SPECT and PET have complementary roles in multi-modality
small-animal imaging.
ACKNOWLEDGMENTS
The authors would like to thank Kotaro Suzuki and Kyotaro Suzuma for
assisting with data collection.
CONFLICT OF INTEREST STATEMENT
I declare no conflict of interest.
33
REFERENCES
1. Liu Z, Kastis GA, Stevenson GD, Barrett HH, Furenlid LR, Kupinski MA, et al.
Quantitative analysis of acute myocardial infarct in rat hearts with
ischemia-reperfusion using a high-resolution stationary SPECT system. J Nucl
Med 2002;43:933–9.
2. Inubushi M, Wu JC, Gambhir SS, Sundaresan G, Satyamurthy N, Namavari M,
et al. Positron-emission tomography reporter gene expression imaging in rat
myocardium. Circulation 2003;107:326–32.
3. Waarsing JH, Day JS, van der Linden JC, Ederveen AG, Spanjers C, De Clerck
N, et al. Detecting and tracking local changes in the tibiae of individual rats: a
novel method to analyse longitudinal in vivo micro-CT data. Bone
2004;34:163–9.
4. McElroy DP, MacDonald LR, Beekman FJ, Wang YC, Patt BE, Iwanczyk JS, et
al. Performance evaluation of A-SPECT: a high resolution desktop pinhole
SPECT system for imaging small animals. IEEE Trans Nucl Sci
2002;49:2139–47.
5. Weber DA, Ivanovic M, Franceschi D, Strand SE, Erlandsson K, Franceschi M,
34
et al. Pinhole SPECT: an approach to in vivo high resolution SPECT imaging in
small laboratory animals. J Nucl Med 1994;35:342–8.
6. van der Have F, Vastenhouw B, Ramakers RM, Branderhorst W, Krah JO, Ji C,
et al. U-SPECT-II: an ultra-high-resolution device for molecular small-animal
imaging. J Nucl Med 2009;50:599–605.
7. Zeniya T, Watabe H, Aoi T, Kim KM, Teramoto N, Takeno T, et al. Use of a
compact pixellated gamma camera for small animal pinhole SPECT imaging.
Ann Nucl Med 2006;20:409–16.
8. Kubo N, Zhao S, Fujiki Y, Kinda A, Motomura N, Katoh C, et al. Evaluating
performance of a pixel array semiconductor SPECT system for small animal
imaging. Ann Nucl Med 2005;19:633–9.
9. Tai YC, Chatziioannou A, Siegel S, Young J, Newport D, Goble RN, et al.
Performance evaluation of the microPET P4: a PET system dedicated to
animal imaging. Phys Med Biol 2001;46:1845–62.
10. Knoess C, Siegel S, Smith A, Newport D, Richerzhagen N, Winkeler A, et al.
Performance evaluation of the microPET R4 PET scanner for rodents. Eur J
Nucl Med Mol Imaging 2003;30:737–47. doi:10.1007/s00259-002-1052-6.
35
11. Kim JS, Lee JS, Im KC, Kim SJ, Kim SY, Lee DS, et al. Performance
measurement of the microPET focus 120 scanner. J Nucl Med
2007;48:1527–35. doi:10.2967/jnumed.107.040550.
12. Tai YC, Ruangma A, Rowland D, Siegel S, Newport DF, Chow PL, et al.
Performance evaluation of the microPET focus: a third-generation miroPET
scanner dedicated to animal imaging. J Nucl Med 2005;46:455–63.
13. Del Guerra A, Bartoli A, Belcari N, Herbert D, Motta A, Vaiano A, et al.
Performance evaluation of the fully engineered YAP-(S)PET scanner for small
animal imaging. IEEE Trans Nucl Sci 2006;53:1078–83.
doi:10.1109/TNS.2008.2002257.
14. Visser EP, Disselhorst JA, Brom M, Laverman P, Gotthardt M, Oyen WJG, et al.
Spatial resolution and sensitivity of the Inveon small-animal PET scanner. J
Nucl Med 2009;50:139–47. doi:10.2967/jnumed.108.055152.
15. Bao Q, Newport D, Chen M, Stout DB, Chatziioannou AF. Performance
evaluation of the Inveon dedicated PET preclinical tomograph based on the
NEMA NU-4 standards. J Nucl Med 2009;50:401–8.
doi:10.2967/jnumed.108.056374.
36
16. Kemp BJ, Hruska CB, McFarland AR, Lenox MW, Lowe VJ. NEMA NU2-2007
performance measurements of the Siemens InveonTM preclinical small animal
PET system. Phys Med Biol 2009;54:2359–76.
doi:10.1088/0031-9155/54/8/007.
17. Constantinescu CC, Mukherjee J. Performance evaluation of an Inveon PET
preclinical scanner. Phys Med Biol 2009;54:2885–99.
doi:10.1088/0031-9155/54/9/020
18. National Electrical Manufacturers Association (NEMA). Performance
Measurements of Small Animal Positron Emission Tomographs. NEMA
Standards Publication NU4-2008. Rosslyn, VA: National Electrical
Manufacturers Association; 2008.
19. Bailey DL, Jones T, Spinks TJ. A method for measuring the absolute sensitivity
of positron emission tomographic scanners. Eur J Nucl Med 1991;18:374–9.
20. Watson CC, Casey ME, Eriksson L, Mulnix T, Adams D, Bendriem B. NEMA NU
2 performance tests for scanners with intrinsic radioactivity. J Nucl Med
2004;45:822–6.
21. Kouris K, Clarke GA, Jarritt PH, Townsend CE, Thomas SN. Physical
37
performance evaluation of the Toshiba GCA-9300A triple-headed system. J
Nucl Med 1993; 34:1778–89.
22. Kuge Y, Yokota C, Tagaya M, Hasegawa Y, Nishimura A, Kito G, et al. Serial
changes in cerebral blood flow and flow-metabolism uncoupling in primates
with acute thromboembolic stroke. J Cereb Blood Flow Metab 2001;21:202–10.
23. Zhao Y, Kuge Y, Zhao S, Morita K, Inubushi M, Strauss HW, et al. Comparison
of 99mTc-annexin A5 with 18F-FDG for the detection of atherosclerosis in
ApoE–/– mice. Eur J Nucl Med Mol Imaging 2007;34:1747–55.
doi:10.1007/s00259-007-0433-2.
24. Rahmim A, Zaidi H. PET versus SPECT: strengths, limitations and challenges.
Nucl Med Commun 2008;29:193–207.
25. Del Guerra A, Belcari N. State-of-the-art of PET, SPECT and CT for small
animal imaging. Nucl Instr Methods A 2007;583:119–24.
doi:10.1016/j.nima.2007.08.187.
1
Table 1. Summary of the Results of PET Performance Measurements
Spatial resolution
(mm)
Absolute sensitivity
(%)
Scatter fraction c
(%)
Peak NEC c
(kcps at MBq)
Center of FOV 350–650 keV, 3.432 ns Mouse-like phantom d Mouse-like phantom d
1.63 a, 1.64 b 3.2 13.6 1,394 at 146
2 cm radial offset Rat-like phantom e Rat-like phantom e
2.16 a, 2.26 b 19.2 560 at 97
a Tangential direction
b Radial direction
c Scatter fraction and peak NEC were obtained at an energy window setting of
350–650 keV and coincidence window of 3.432 ns.
d Diameter = 30 mm, length = 70 mm
e Diameter = 60 mm, length = 150 mm
2
Table 2. Comparison of Volume Sensitivity between SPECT and PET
Pinhole aperture size
(mm)
Volume sensitivity
(cps/MBq/mL/cm)
SPECT 0.5 2.0
1.0 4.9
PET – 3.7 × 10³
3
Table 3. Comparison of Quantitative Uniformity and CV between SPECT and PET
Pinhole aperture size
(mm)
Quantitative uniformity
(%)
CV
(%)
SPECT 0.5 71.1 18.0
1.0 37.0 11.5
PET – 23.8 6.0
4
Figure legends
Fig. 1 Tomographic spatial resolution in SPECT as a function of radius of rotation for 0.5- and
1.0-mm aperture size. FWHM = full width at half maximum. FWTM = full width at tenth maximum.
Fig. 2 System sensitivity in SPECT as a function of source-to-collimator distance for different
pinhole aperture sizes. cps = counts per second.
Fig. 3 Images of the micro-Derenzo phantom obtained by each modality. (a) CT: with contrast
material, (b) PET, (c) SPECT: pinhole aperture size of 0.5 mm, and (d) SPECT: pinhole aperture
size of 1.0 mm. (Rod diameter = 0.75, 1.0, 1.35, 1.7, 2.0, and 2.4 mm).
Fig. 4 Recovery coefficient as a function of rod diameter for PET and SPECT (pinhole aperture
size of 0.5 mm).
Fig. 5 Images of the cylindrical phantom obtained by each modality. (a) PET, (b) SPECT: pinhole
aperture size of 0.5 mm, and (c) SPECT: pinhole aperture size of 1.0 mm.
Fig. 6 Sagittal images of rat bone. (a) CT, (b) 18F- PET, and (c) 99mTc-MDP SPECT: pinhole
aperture size of 1.0 mm.