Embed Size (px)
Citation preview

Tailwind Energy Ltd. 1
Petrophysics of Thin Beds
Paul Hoddinott7th March 2019

Geological Outcrop examples of Thin Beds
2Tailwind Energy Ltd. Ltd.
Deepwater Thin Beds, Carboniferous Ross Fm, Ireland Triassic Blomidon Fm, Bay of Fundy, Nova Scotia
E. Jurassic, Bridport Sands, West
Bay, Dorset, UK

Quiz - Scale of Wireline Logs sampling volume
3Tailwind Energy Ltd. Ltd.
Question 1/
The Bulk Density wireline tool samples a volume of rock
similar to the volume of what household item ?
A B C
Quiz - Scale of Wireline Logs sampling volume
4Tailwind Energy Ltd. Ltd.
Question 1/ The Bulk Density wireline tool samples a volume of rock similar to the
volume of what household item ?
Answer/
A

Quiz - Scale of Wireline Logs sampling volume
5Tailwind Energy Ltd. Ltd.
Question 2/
The Induction Resistivity wireline tool samples a volume of rock similar to the volume of what household item ?
A B C

Quiz - Scale of Wireline Logs sampling volume
6Tailwind Energy Ltd. Ltd.
Question 2/
The Induction Resistivity wireline tool samples a volume of rock similar to the volume of what household item ?
Answer/
C

Scale of Wireline Logs sampling volume
7Tailwind Energy Ltd. Ltd.
Based on Rider, 1997

Thick Beds are well quantified byPetrophysics 1)
8Tailwind Energy Ltd. Ltd.
5 ft 5 ft
Core Oil
Stain Flag
Net
Reservoir &
Net Pay
Flags
Core
Porosity
Core
Permeability
Water
Saturation
curve
(shaded to
show
hydrocarbons
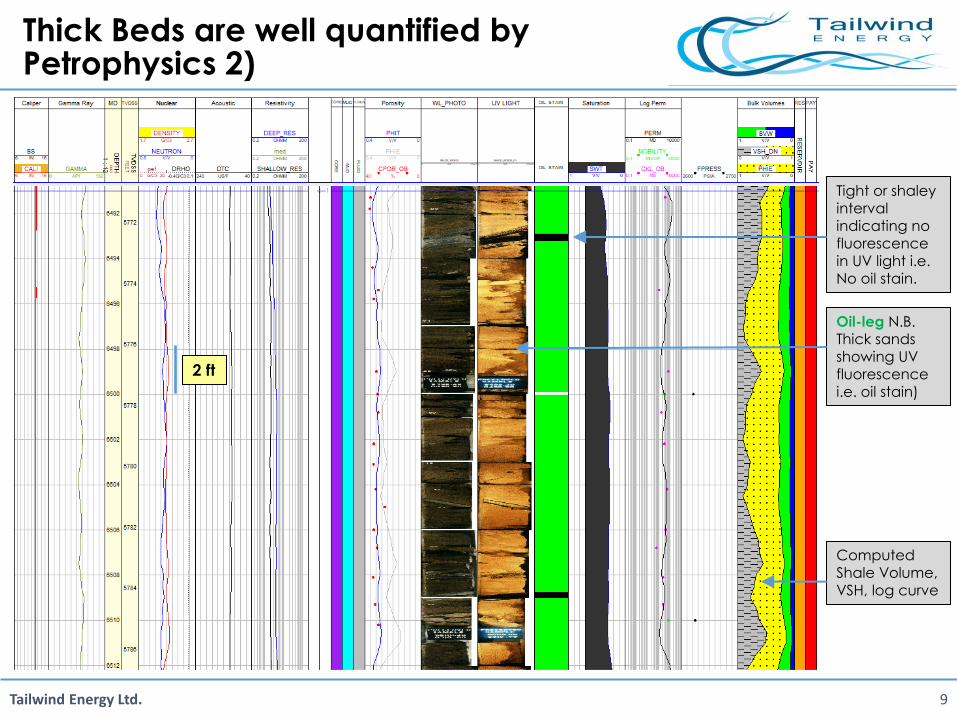
Thick Beds are well quantified by Petrophysics 2)
9Tailwind Energy Ltd. Ltd.
2 ft
Tight or shaley
interval
indicating no
fluorescence
in UV light i.e.
No oil stain.
Computed
Shale Volume,
VSH, log curve
Oil-leg N.B. Thick sands
showing UV
fluorescence
i.e. oil stain)

Core photos can even detect Oil-Water contacts in Thick beds
10Tailwind Energy Ltd. Ltd.
5 ft
Tight or shaley
interval
indicating no
fluorescence
in UV light i.e.
No oil stain.
Water-leg N.B. Lack of UV
fluorescence
(i.e. oil stain)
Gap in core
Oil-leg N.B. Thick sands
showing UV
fluorescence
i.e. oil stain)

Thin Beds – Conventional Petrophysicsstruggles to quantify due to resolution
11Tailwind Energy Ltd. Ltd.
1
2
50 ft
Wireline logs struggle to resolve and quantify Thin Beds e.g. < 2 feet thick.
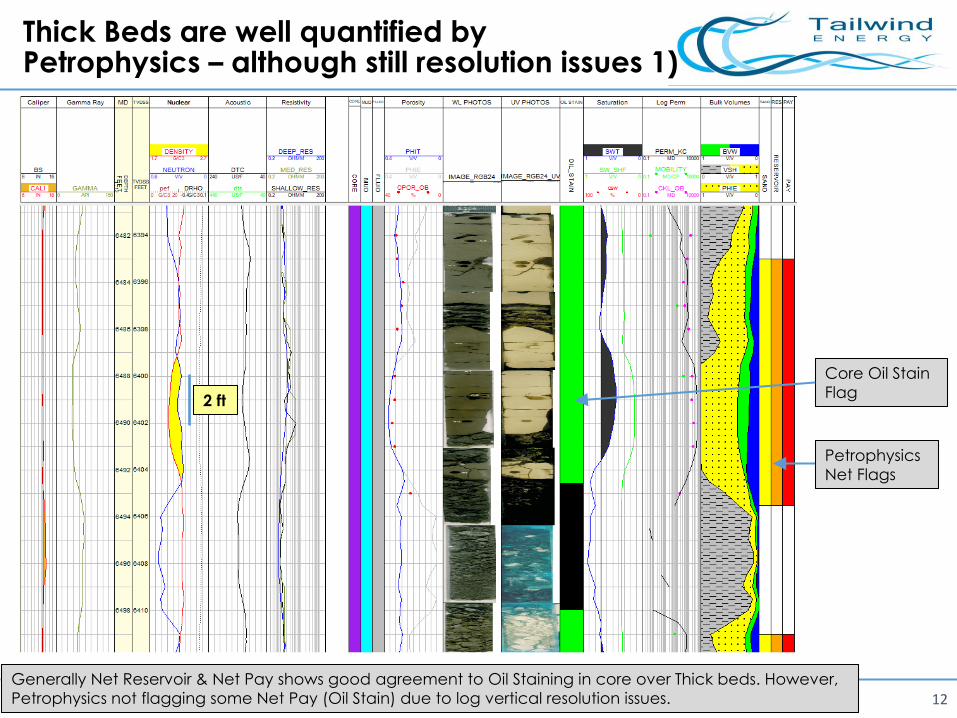
Thick Beds are well quantified byPetrophysics – although still resolution issues 1)
12Tailwind Energy Ltd. Ltd.Generally Net Reservoir & Net Pay shows good agreement to Oil Staining in core over Thick beds. However,
Petrophysics not flagging some Net Pay (Oil Stain) due to log vertical resolution issues.
Core Oil Stain
Flag
Petrophysics
Net Flags
2 ft

Thin Beds – Conventional Petrophysicsstruggles to quantify due to resolution 2)
13Tailwind Energy Ltd. Ltd.However, over Thin beds Petrophysics can underestimate Net Reservoir & Net Pay (in this example by 3.5 feet)
compared to Oil Staining as indicated by core photos.
Core Oil Stain
Flag over Thin
Beds
Petrophysics
Net Flags
2 ft
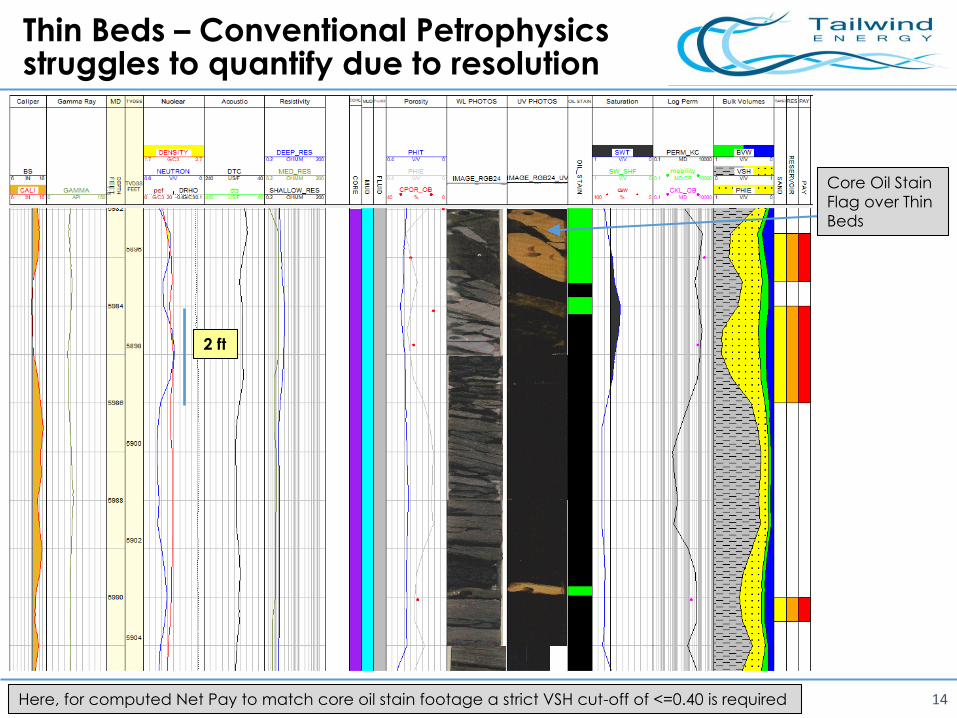
Thin Beds – Conventional Petrophysicsstruggles to quantify due to resolution
14Tailwind Energy Ltd. Ltd.
Core Oil Stain
Flag over Thin
Beds
2 ft
Here, for computed Net Pay to match core oil stain footage a strict VSH cut-off of <=0.40 is required

Thin Beds – Conventional Petrophysicsstruggles to quantify due to resolution
15Tailwind Energy Ltd. Ltd.
2 ft
In previous work, these oil-stained Thin Beds were totally underestimated by Petrophysics.
A more relaxed VSH cut-off of <0.65 is required to match core oil stain footage

Special Case: Glauconitic interval & Thin Beds
16Tailwind Energy Ltd. Ltd.
Interval looks shaly but is due to Glauconitic sand (mica). ALWAYS CHECK COMPOSITE LOG (Cuttings)
& CORE DESCRIPTIONS. Also, useful to generate a Density/Neutron Separation log to detect thin sandy beds
1) Section appears to be
entirely shaley. However, the
interval was tested and gave
good rates. Presumably he
interval was tested based on
core/cuttings indicating sands.
Also Deep Res > Shallow Res
indicating moveable
hydrocarbons.
1) Core indicates sand units with
oil stain, totaling 23 feet of oil
stained sands. These sands
contain Glauconite – giving the
shaley appearance on logs.
Density/Neutron separation
closing up indicates sandy units.
To match core and well test
result petrophysics requires
increased RHOsh parameter.
10 ft

Thin Beds – Petrophysical Findings
17Tailwind Energy Ltd. Ltd.
• Standard Wireline & LWD logs may not be able to detect / quantify ThinBeds e.g. less than 2 ft (60 cm) thick.
• It is always good practice to refer to lithology cuttings and coredescriptions / core photographs for evidence of thin beds and unusualmineralogy. e.g. Micas such as Glauconite.
• Modern day technology can help detect and quantify Thin Beds e.g.Image logs, NMR, Multi-array Resistivity, Forward modelling.
• Core oil stain footage can be replicated by Petrophysical evaluations bycomparing/contrasting to Petrophysical cut-offs when computing NetPay footages.
• Petrophysical Cut-offs may need to meet more relaxed or stricter criteria,depending on the nature of the geological setting.

Acknowledgements
18Tailwind Energy Ltd. Ltd.
• Rich Hiney & Dave Freeman (Tailwind Energy)
& for kind permission to release slides
• Mike Millar (Independent)


![Reservoir Petrophysics[1]](https://img.pdfslide.us/doc/110x75/577cc7871a28aba711a139a5/reservoir-petrophysics1.jpg)