Embed Size (px)
Citation preview
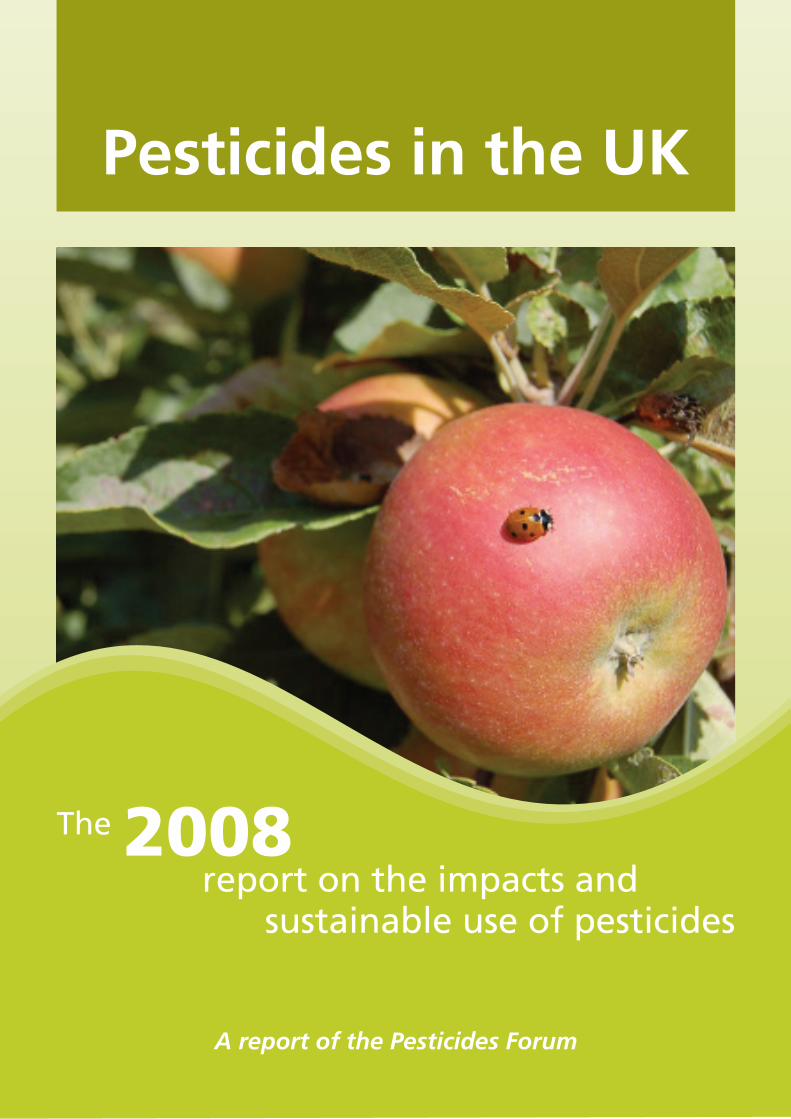
The 2008report on the impacts and
sustainable use of pesticides
Pesticides in the UK
A report of the Pesticides Forum

Welcome to the new style annual report of
the Pesticides Forum. This new report
replaces the previous ‘annual report’ and the
‘report of indicators reflecting the impacts of
pesticide use’.
The Pesticides Forum was set up in 1996 to
bring together a range of organisations with
an interest in how pesticides are used and
their impacts. In 2006 the Government
published its UK Pesticides Strategy; this was
updated in 2008. The aim of the Strategy is ‘to
achieve high standards of human and
environmental protection against potential
risks posed by pesticides whilst maintaining
the economic viability of crop protection and
effective control of pests, weeds and diseases’.
A number of stakeholder action plan groups
have been established to develop work
programmes to deliver this aim. These groups
are considering measures to: protect human
health, water and biodiversity; improve
practice in the amenity and amateur (home
and garden) sectors; and ensure the
availability of a sufficient range of pest and
vegetation management options. One of the
Forum’s main tasks is to review the work of
these groups in delivering the Strategy and
provide advice to the Government in order to
maximise the effectiveness of its work.
This report is structured along similar lines to
last year’s indicators report, which in turn
mirrored the structure of the Strategy’s action
plan groups. This meant looking at: the
impacts of pesticides on human health, water
and biodiversity; practice of users in the
amenity and amateur (home and garden)
sectors; and issues for pest and weed control
and vegetation management arising from a
decreasing number of pesticides. We have
supplemented this information by detailing
the work which the Forum has undertaken
looking at these issues. Records of our
discussions can be found on our website:
Pesticides Forum Home Page
We are also investigating the potential for
regional indicators in future editions of this
report to complement the national perspective
currently provided.
Our members represent 24 organisations
covering the farming (conventional and
organic production), farming equipment and
pesticide industries; environmental and
conservation groups; education and training;
consumer interests and trades unions.
Representatives from all the Government
Departments responsible for, or those who
have an interest in, pesticides in the UK
participate in our meetings to provide advice
and listen to the views put across. Details of
all the members and advisers are listed on our
website:
Pesticides Forum Membership
Indicators are an important way of monitoring
the impacts of pesticides on human health and
the environment. They typically come in one
of two forms: those which measure impacts
directly (e.g. the amount of pesticide pollution
of water or residues in foodstuffs); or those
which measure the behaviour of pesticide
users (e.g. regular testing of spray equipment
can reduce risks of pollution).
Assessing the risks from the use of pesticides is
largely addressed by the rigorous approvals
system. Firstly, no pesticide would be
approved for use if it is shown to be a risk to
human health. Once a pesticide has passed
i
INTRODUCTION
the human health checks, the next stage is to
assess how it will behave once it is released
into the environment. Only products which
are assessed as safe for users, consumers,
residents, bystanders and the environment will
be authorised for use. Stringent conditions of
use are often placed on products to ensure
that any risks associated with their use are
reduced to an acceptable level.
The impacts of pesticide use are carefully
monitored, to ensure that they are behaving
as predicted by the approvals process. This
information, along with a review of the
amount of pesticide used and the behaviour
of pesticide users, forms the basis of the
indicators in this report. However, using
indicators to assess the risks arising from
pesticide use is not a precise science. It
inevitably involves pulling together relevant
information and expert opinion to ‘paint a
picture’.
UK Approvals System
ii
Pesticides in the UK
We also revised our objectives last year to
more clearly define the role of the Forum in
respect of the UK Pesticides Strategy, and
these are reproduced in Section D of this
report. Finally, this is the first year that the
annual report has been produced in electronic
form only. This decision has been taken to
keep the cost of production down but also to
allow for the increased number of hyperlinks
to other relevant websites which have been
placed throughout the report. However, it has
also been produced in a way that allows you
to print a good quality copy.
If you have any comments or views on this
report please do not hesitate to contact us
at the address below:
Pesticides Forum Secretariat, c/o Pesticides
Safety Directorate, Room 214,
Mallard House, Kings Pool, 3 Peasholme
Green, York, YO1 7PX
Email: [email protected]
This new report pulls
together the full
range of work the
Pesticides Forum
does in one
document. A key
focus of our work
since last year, when
the Government
introduced the latest
version of the 'UK Pesticides Strategy: A
Strategy for the Sustainable Use of Plant
Protection Products' has been to monitor
impacts and encourage responsible use.
Although all the member organisations of the
Pesticides Forum have always put a great deal
of effort into understanding the use of and
reducing the impacts from pesticides, it was
not always clear how to bring together all this
information. We now structure each meeting
in such a way that we focus on all the key
action plans from the UK Pesticides Strategy:
human health; availability of products and
techniques; water; biodiversity; amateur use;
and amenity use. Each of these plans is
reviewed in turn and Forum members provide
a clear steer both on the actions taken by
Government, Agencies, the industry and NGOs
to date, and where future work should be
focussed and who should do it.
This was perhaps most clearly shown in the
work the Forum did to support the UK
Government in gaining a better
understanding of the implications of the
implementation of the proposed EU
Authorisation Regulation (replacing Directive
91/414/EEC on the placing of plant protection
products on the market: Directive 91/414/EEC).
Based on our meeting, Forum members
agreed I should write to the EU Commissioner
overseeing the new Regulation, Mme
Androulla Vasilliou, highlighting the problems
resulting from the lack of a robust Regulatory
Impact Assessment covering the proposals:
Letter to European Commissioner This
omission had created a great deal of concern,
across Government and the agricultural
industry, over the potential loss of a wide
range of chemical pesticides, with consequent
major impact on both food production and
food prices, at a time when food security and
sustainability are high on the political agenda.
I fear that, unless we get an early and clear
understanding of the potential impacts of the
new Regulation, the pressures faced by the
industry as a whole could be greatly
exacerbated as it is required to produce ever
greater amounts of food whilst hampered by
the reduced availability of the correct tools
with which to minimise pests, diseases and
weeds in crops.
The Forum recognises the key importance of
scientific evidence and expert advice in
protecting human health and the environment
from the harmful effects of pesticides. It
welcomes engagement with other relevant
expert bodies, including the Advisory
Committee on Hazardous Substances: ACHS
Home Page, in the process of making sound
decisions to ensure the safe use of pesticides.
However, as well as reporting on the progress
of individual action plans, we have not lost
sight of the need to highlight new issues
raised by our own members. An example has
been the work we have done to explain the
problems associated with container design,
spillages and recycling. Here a group of
members have developed a discussion paper
iii
FOREWORD
PF 170 Container Management highlighting all
the important issues and work is now
progressing on identifying key stakeholders
such as manufacturers of plastics, the pesticide
producers and local authority waste managers
to see how these issues can be progressed.
I hope I have been able to give you a taste of
some of the most important work the Forum
members have done this year. This report will
provide further information about the many
subjects we have covered at our meetings. I
think you will find the new format helpful in
understanding the range of issues considered
by the Pesticides Forum, and that it puts our
work into clear perspective alongside the UK
Pesticides Strategy. In this way, we hope it is
relevant to everyone with an interest in both
the impacts and sustainable use of plant
protection products.
Finally, I would like to take this opportunity to
thank all the members of the Pesticides Forum,
and the secretariat, for their valuable
contributions both at meetings and in
correspondence. The engagement of every
one of our members ensures that each and
every topic is covered thoroughly and
professionally. This depth of knowledge,
combined with enthusiasm, of all the members
is perhaps the most important factor in the
continuing success of the Forum.
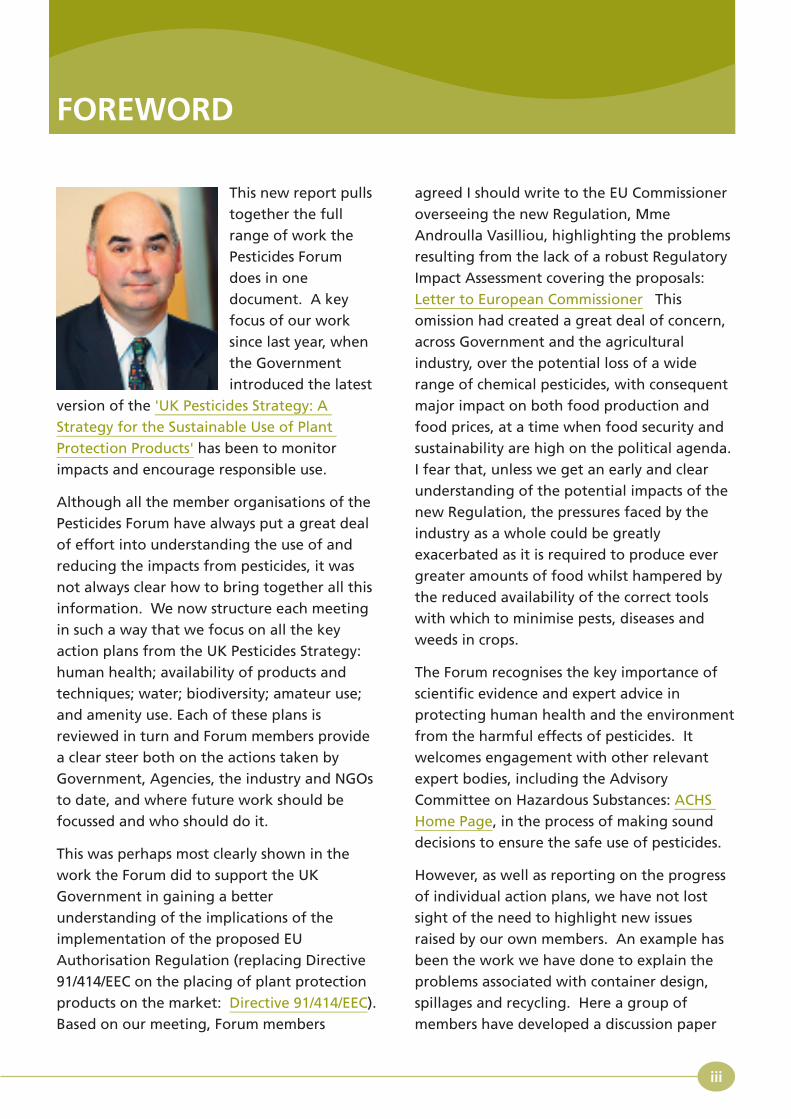
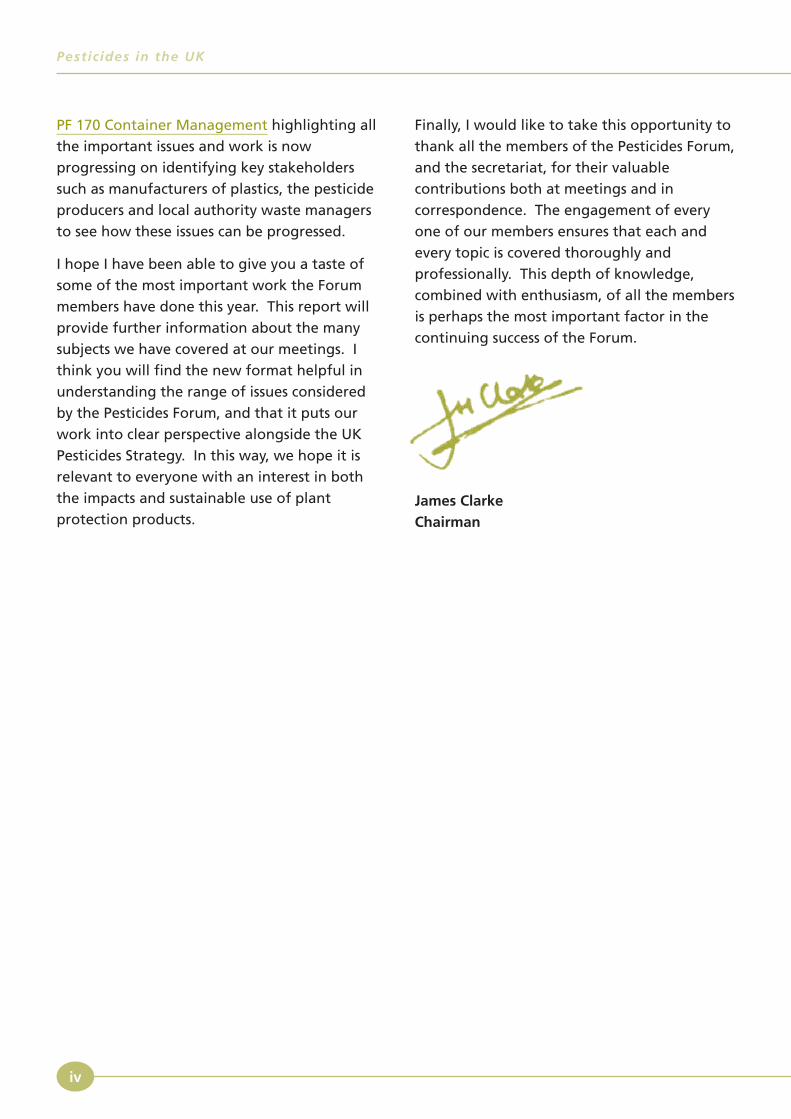
James Clarke
Chairman
iv
Pesticides in the UK
1
CONTENTS
Introduction. . . . . . . . . . . . . . . . . . . . . . . . . . . . . . . . . . . . . . . . . . . . . . . . . . . . . . . . . . . . . . . . . . . . . . . . . . . . . . . . . i
Foreword . . . . . . . . . . . . . . . . . . . . . . . . . . . . . . . . . . . . . . . . . . . . . . . . . . . . . . . . . . . . . . . . . . . . . . . . . . . . . . . . . iii
Executive summary . . . . . . . . . . . . . . . . . . . . . . . . . . . . . . . . . . . . . . . . . . . . . . . . . . . . . . . . . . . . . . . . . . . . . . . . . . 2
Section A: The wider context . . . . . . . . . . . . . . . . . . . . . . . . . . . . . . . . . . . . . . . . . . . . . . . . . . . . . . . . . . . . . . . . . . 4
• Pesticide sales . . . . . . . . . . . . . . . . . . . . . . . . . . . . . . . . . . . . . . . . . . . . . . . . . . . . . . . . . . . . . . . . . . . . . . . . . 5
• Cropped areas in the UK . . . . . . . . . . . . . . . . . . . . . . . . . . . . . . . . . . . . . . . . . . . . . . . . . . . . . . . . . . . . . . . . 6
• Pesticide average inputs per crop . . . . . . . . . . . . . . . . . . . . . . . . . . . . . . . . . . . . . . . . . . . . . . . . . . . . . . . . . 7
• Pesticide use on oilseed rape . . . . . . . . . . . . . . . . . . . . . . . . . . . . . . . . . . . . . . . . . . . . . . . . . . . . . . . . . . . . . 7
• Fungicide use on wheat . . . . . . . . . . . . . . . . . . . . . . . . . . . . . . . . . . . . . . . . . . . . . . . . . . . . . . . . . . . . . . . . . 8
• National Sprayer Testing Scheme . . . . . . . . . . . . . . . . . . . . . . . . . . . . . . . . . . . . . . . . . . . . . . . . . . . . . . . . . . 9
• National Register of Sprayer Operators . . . . . . . . . . . . . . . . . . . . . . . . . . . . . . . . . . . . . . . . . . . . . . . . . . . 10
• BASIS professional register . . . . . . . . . . . . . . . . . . . . . . . . . . . . . . . . . . . . . . . . . . . . . . . . . . . . . . . . . . . . . . 11
• Crop Protection Management Plans . . . . . . . . . . . . . . . . . . . . . . . . . . . . . . . . . . . . . . . . . . . . . . . . . . . . . . 11
• Cross Compliance checks . . . . . . . . . . . . . . . . . . . . . . . . . . . . . . . . . . . . . . . . . . . . . . . . . . . . . . . . . . . . . . . 12
Section B: Review of activities supporting the Government’s UK Pesticides Strategy
Part 1: Protecting human health . . . . . . . . . . . . . . . . . . . . . . . . . . . . . . . . . . . . . . . . . . . . . . . . . . . . . . . . 13
• Pesticide Incidents Appraisal Panel investigations . . . . . . . . . . . . . . . . . . . . . . . . . . . . . . . . . 14
• Maximum Residue Level compliance . . . . . . . . . . . . . . . . . . . . . . . . . . . . . . . . . . . . . . . . . . . 15
Part 2: Availability of products and techniques . . . . . . . . . . . . . . . . . . . . . . . . . . . . . . . . . . . . . . . . . . . . 17
• Number of biopesticides available to users . . . . . . . . . . . . . . . . . . . . . . . . . . . . . . . . . . . . . . 18
Part 3: Protecting water . . . . . . . . . . . . . . . . . . . . . . . . . . . . . . . . . . . . . . . . . . . . . . . . . . . . . . . . . . . . . . . 19
• Pesticides in surface waters (England and Wales) . . . . . . . . . . . . . . . . . . . . . . . . . . . . . . . . . 20
• Top nine pesticides in surface waters (England and Wales) . . . . . . . . . . . . . . . . . . . . . . . . . 21
• Pesticides in groundwater (England and Wales) . . . . . . . . . . . . . . . . . . . . . . . . . . . . . . . . . . 22
• Substantiated category 1 and 2 pollution incidents for land,air or water involving pesticides . . . . . . . . . . . . . . . . . . . . . . . . . . . . . . . . . . . . . . . . . . . . . . . 23
Part 4: Protecting biodiversity . . . . . . . . . . . . . . . . . . . . . . . . . . . . . . . . . . . . . . . . . . . . . . . . . . . . . . . . . . 24
• Populations of selected farmland bird species . . . . . . . . . . . . . . . . . . . . . . . . . . . . . . . . . . . . 25
• Pesticide poisoning incidents investigated by theWildlife Incident Investigation Scheme . . . . . . . . . . . . . . . . . . . . . . . . . . . . . . . . . . . . . . . . . 27
• Arable field margins UK . . . . . . . . . . . . . . . . . . . . . . . . . . . . . . . . . . . . . . . . . . . . . . . . . . . . . . 28
Part 5: Best practice in amenity use . . . . . . . . . . . . . . . . . . . . . . . . . . . . . . . . . . . . . . . . . . . . . . . . . . . . . 29
Part 6: Best practice in amateur (home and garden) use . . . . . . . . . . . . . . . . . . . . . . . . . . . . . . . . . . . . 31
Section C: Forward look . . . . . . . . . . . . . . . . . . . . . . . . . . . . . . . . . . . . . . . . . . . . . . . . . . . . . . . . . . . . . . . . . . . . . 33
Section D: Pesticides Forum objectives . . . . . . . . . . . . . . . . . . . . . . . . . . . . . . . . . . . . . . . . . . . . . . . . . . . . . . . . . 35
Annex A: UK Pesticides Strategy Framework . . . . . . . . . . . . . . . . . . . . . . . . . . . . . . . . . . . . . . . . . . . . . . . . . . . . 36
Annex B: Indicators Framework . . . . . . . . . . . . . . . . . . . . . . . . . . . . . . . . . . . . . . . . . . . . . . . . . . . . . . . . . . . . . . 37
Acknowledgements . . . . . . . . . . . . . . . . . . . . . . . . . . . . . . . . . . . . . . . . . . . . . . . . . . . . . . . . . . . . . . . . . . . . . . . . 38
This new report pulls together the work of the
UK Pesticides Forum in 2008. It contains both
‘annual report’ items and the ‘report of
indicators reflecting the impacts of pesticide
use’. We have structured the report, as we
have our meeting schedules, around the UK
Pesticides Strategy. It covers progress with the
key action plans: human health; availability of
products and techniques; water; biodiversity;
amateur use; and amenity use. These items
are prefaced by background information on
the use of pesticides.
Our report confirms that the use of pesticides
is not impacting adversely on the health of UK
citizens or the environment. The mix of
statutory and voluntary controls delivered
within the framework of the Government’s UK
Pesticides Strategy have been successful in
ensuring that society derives the benefits
which can accrue from the responsible use of
these chemicals, without being exposed to
unacceptable levels of risk which could arise
from their use.
A major change in 2008 was the increased
land area under cropping as land came out of
set-aside. This is a major driver of the total
amount of pesticide used. We are also pleased
to note the impact of the new, lower use rate
fungicides in reducing total fungicide use and
the continued success of NRoSO, NSTS and
BASIS training/registration schemes in getting
the good practice message to the vast majority
of users. It is also worth noting the relatively
low number of breaches in pesticide
legislation identified in RPA Cross Compliance
inspections, the majority of which were
‘rectifiable’.
In relation to the human health action plan,
there has been good progress with
establishing the implementation group; and
we note the continued decline in pesticide
incident cases reported under PIAP. We are
pleased to acknowledge two initiatives to
interact with members of the public in relation
to local spraying, namely the proposed PSD
bureau to allow members of the public to find
out more about spraying practices in their
neighbourhood, and the NFU ‘good neighbour
initiative’. MRL exceedances, especially in UK
and EU produce, remain at very low levels.
Under the availability plan we note the
developing range of biopesticide choices.
There is continuing development of water and
biodiversity indicators and these groups
continue to evolve to meet new challenges.
The continued recent downward trend in
percentage of water samples above 0.1 g/litre
is encouraging.
We also welcome and support the
development of ‘Amenity Assured’, a
registration scheme which aims to ensure a
consistent standard of performance (including
minimisation of risk) amongst amenity
contractors.
A particular highlight of 2008 for Forum
members was a visit to Peter Hall’s farm,
where organically produced top fruit is being
grown at conventional production levels using
a range of alternative approaches.
2
EXECUTIVE SUMMARY
Pesticides in the UK: The 2008 report on the impacts andsustainable use of pesticides
There is, however, still room for improvement.
For example:
� the report indicates that pesticide use may
be increasing. This may be due to a
number of factors, including the facts that
more land is being farmed (due to the
ending of set-aside and increased
commodity prices having created an
incentive to plant) and some broad-
spectrum products are no longer
approved for use. Whilst an increase in
use does not necessarily equate to an
increased risk, this is something we will
want to keep an eye on;
� we also feel that it would be beneficial to
have access to either different, or a wider
range of, information in order to better
assess the risks which can arise from the
use of pesticides. Therefore, whilst we
were pleased to note the progress of the
Government’s UK Pesticides Strategy
action plan groups, we would stress the
need for work to continue on the
development of relevant indicators
against which their success and progress
can be monitored; and
� the reported increased number of cases of
abuse of pesticides reported to the
Wildlife Incident Investigation Scheme is
of concern. We recognise that this may be
due to increased vigilance and reporting,
which we would support, but we hope
that measures will be taken to examine
this evidence further.
In general, though, the UK public can be
assured that users of pesticides are applying
these chemicals in a responsible manner.
Many users take specialist advice before,
during and after applications, and are
adopting practices which exceed the statutory
requirements. As such, the UK is well placed
to meet the demands to further improve the
way we use pesticides which will flow from
the requirements of the EU Directive on the
Sustainable Use of Pesticides.
3
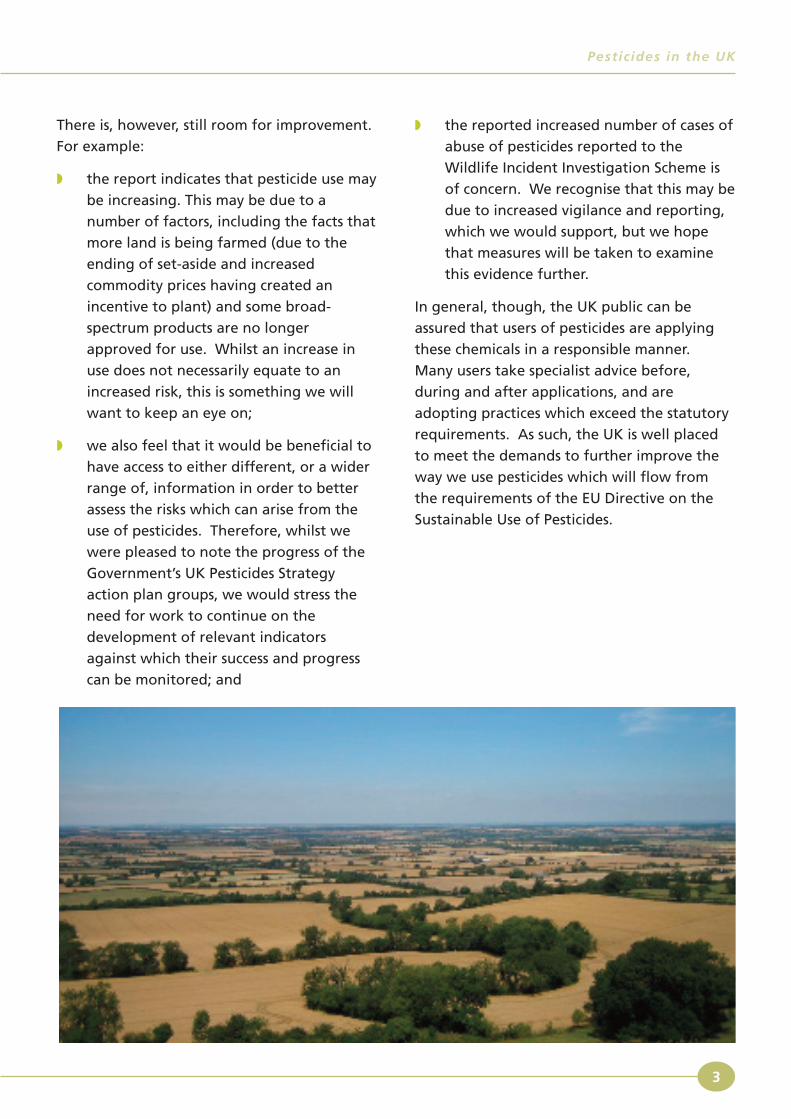
Pesticides in the UK
Before looking in detail at our work on:
� the impact of pesticides on human health,
water and biodiversity;
� practice in the amenity and amateur
(home and garden) sectors;
� and issues relating to the availability of
pesticide products in 2008;
it is important to establish the context in
which this is reported.
To set the scene, therefore, this part of the
report contains indicators detailing pesticide
sales, cropping patterns, usage, and practice
amongst users in 2008 (where data are not
available we have referred to the most recent).
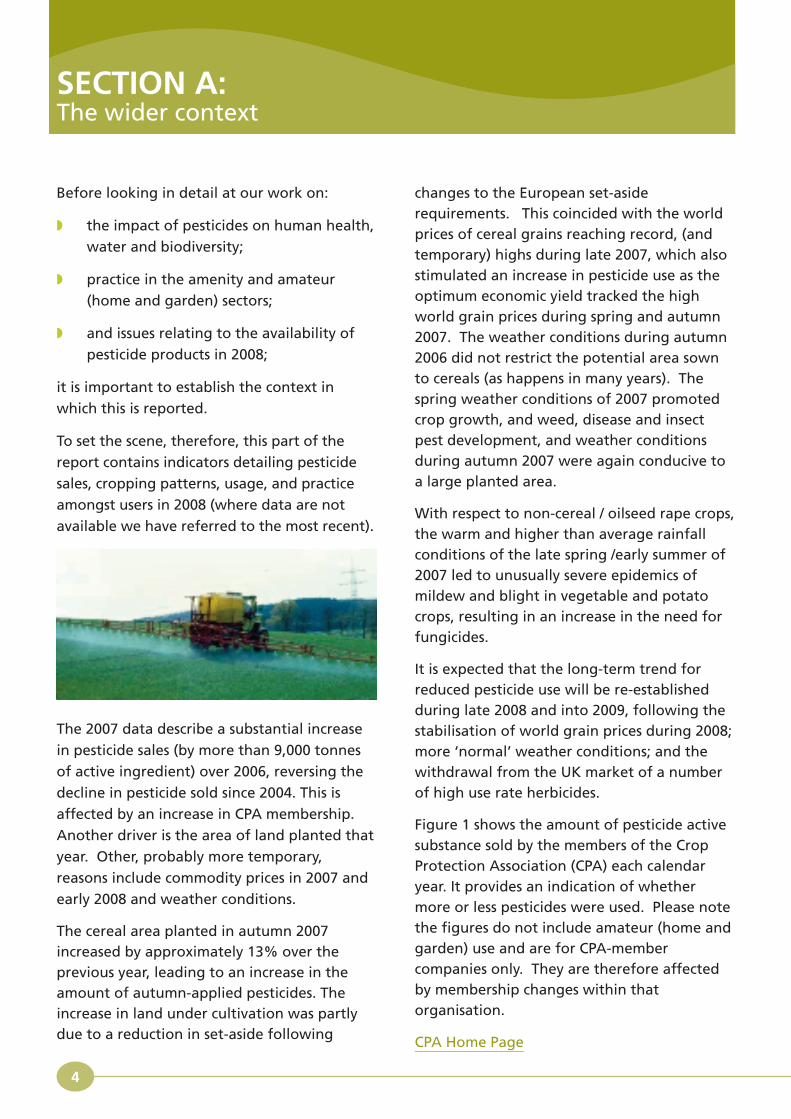
The 2007 data describe a substantial increase
in pesticide sales (by more than 9,000 tonnes
of active ingredient) over 2006, reversing the
decline in pesticide sold since 2004. This is
affected by an increase in CPA membership.
Another driver is the area of land planted that
year. Other, probably more temporary,
reasons include commodity prices in 2007 and
early 2008 and weather conditions.
The cereal area planted in autumn 2007increased by approximately 13% over theprevious year, leading to an increase in theamount of autumn-applied pesticides. Theincrease in land under cultivation was partlydue to a reduction in set-aside following
changes to the European set-asiderequirements. This coincided with the worldprices of cereal grains reaching record, (andtemporary) highs during late 2007, which alsostimulated an increase in pesticide use as theoptimum economic yield tracked the highworld grain prices during spring and autumn2007. The weather conditions during autumn2006 did not restrict the potential area sownto cereals (as happens in many years). Thespring weather conditions of 2007 promotedcrop growth, and weed, disease and insectpest development, and weather conditionsduring autumn 2007 were again conducive toa large planted area.
With respect to non-cereal / oilseed rape crops,the warm and higher than average rainfallconditions of the late spring /early summer of2007 led to unusually severe epidemics ofmildew and blight in vegetable and potatocrops, resulting in an increase in the need forfungicides.
It is expected that the long-term trend forreduced pesticide use will be re-establishedduring late 2008 and into 2009, following thestabilisation of world grain prices during 2008;more ‘normal’ weather conditions; and thewithdrawal from the UK market of a numberof high use rate herbicides.
Figure 1 shows the amount of pesticide activesubstance sold by the members of the CropProtection Association (CPA) each calendaryear. It provides an indication of whethermore or less pesticides were used. Please notethe figures do not include amateur (home andgarden) use and are for CPA-membercompanies only. They are therefore affectedby membership changes within thatorganisation.
CPA Home Page
4
SECTION A:The wider context
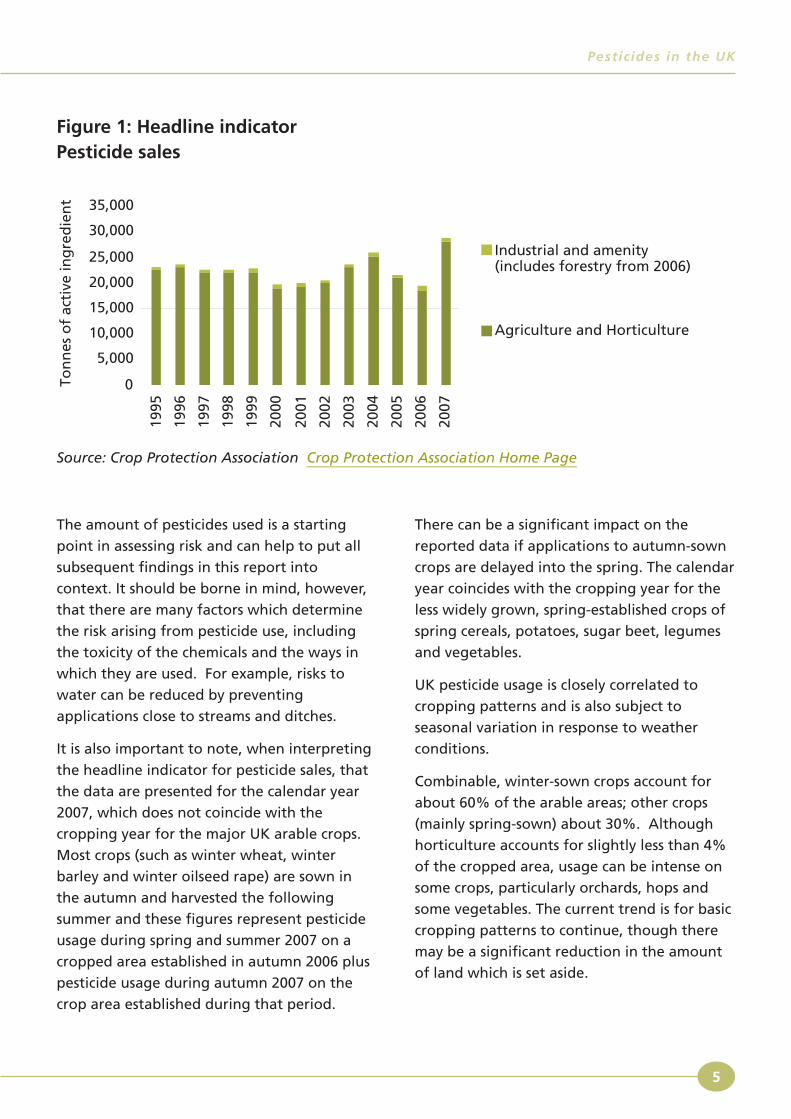
The amount of pesticides used is a starting
point in assessing risk and can help to put all
subsequent findings in this report into
context. It should be borne in mind, however,
that there are many factors which determine
the risk arising from pesticide use, including
the toxicity of the chemicals and the ways in
which they are used. For example, risks to
water can be reduced by preventing
applications close to streams and ditches.
It is also important to note, when interpreting
the headline indicator for pesticide sales, that
the data are presented for the calendar year
2007, which does not coincide with the
cropping year for the major UK arable crops.
Most crops (such as winter wheat, winter
barley and winter oilseed rape) are sown in
the autumn and harvested the following
summer and these figures represent pesticide
usage during spring and summer 2007 on a
cropped area established in autumn 2006 plus
pesticide usage during autumn 2007 on the
crop area established during that period.
There can be a significant impact on the
reported data if applications to autumn-sown
crops are delayed into the spring. The calendar
year coincides with the cropping year for the
less widely grown, spring-established crops of
spring cereals, potatoes, sugar beet, legumes
and vegetables.
UK pesticide usage is closely correlated to
cropping patterns and is also subject to
seasonal variation in response to weather
conditions.
Combinable, winter-sown crops account for
about 60% of the arable areas; other crops
(mainly spring-sown) about 30%. Although
horticulture accounts for slightly less than 4%
of the cropped area, usage can be intense on
some crops, particularly orchards, hops and
some vegetables. The current trend is for basic
cropping patterns to continue, though there
may be a significant reduction in the amount
of land which is set aside.
5
Pesticides in the UK
0
5,000
10,000
15,000
20,000
25,000
30,000
35,000
1995
1996
1997
1998
1999
2000
2001
2002
2003
2004
2005
2006
2007
Ton
nes
of
acti
ve in
gre
die
nt
Industrial and amenity(includes forestry from 2006)
Agriculture and Horticulture
Figure 1: Headline indicatorPesticide sales
Source: Crop Protection Association Crop Protection Association Home Page
0
1000000
2000000
3000000
4000000
5000000
6000000
2001 2002 2003 2004 2005 2006 2007 2008
Pulses
Other crops not for stockfeeding
Potatoes
Other Cereals
Sugar beet
Horticulture
Crops for stockfeeding
Winter barley
Set-aside
Oilseeds
Spring barley
Wheat
6
Pesticides in the UK
Source: Defra June Agricultural Survey
Figure 2: Core indicatorCropped areas (ha) in UK
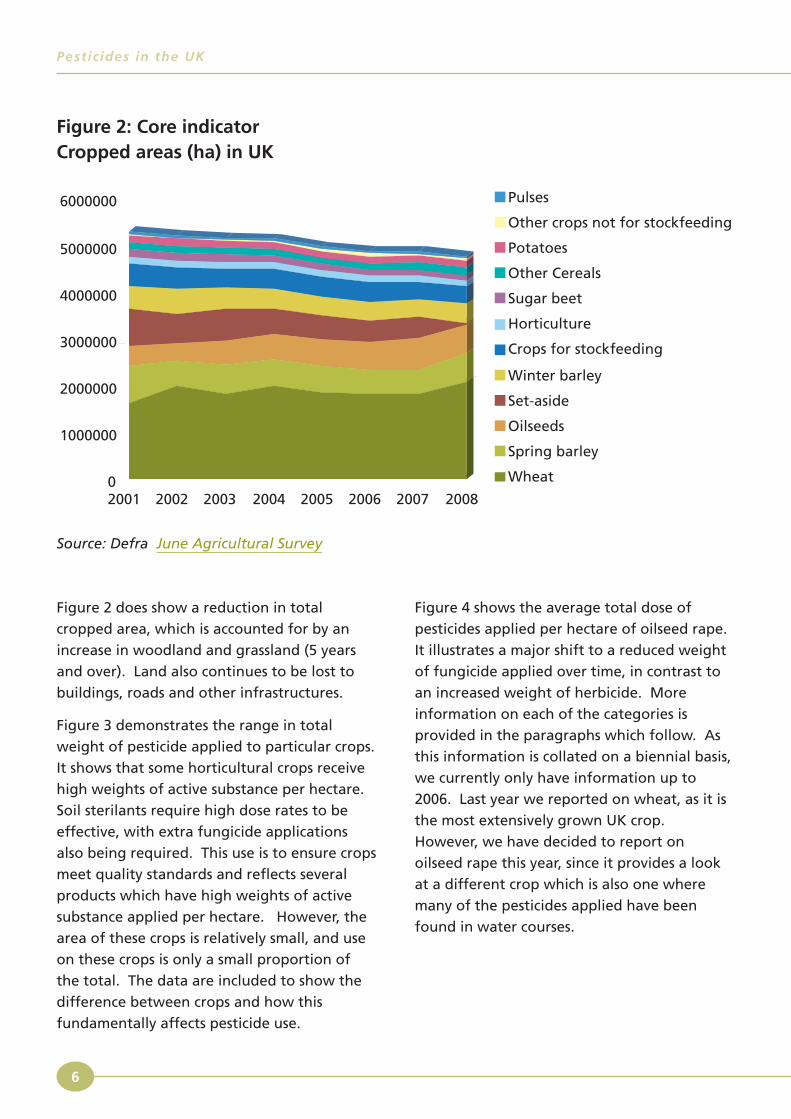
Figure 2 does show a reduction in total
cropped area, which is accounted for by an
increase in woodland and grassland (5 years
and over). Land also continues to be lost to
buildings, roads and other infrastructures.
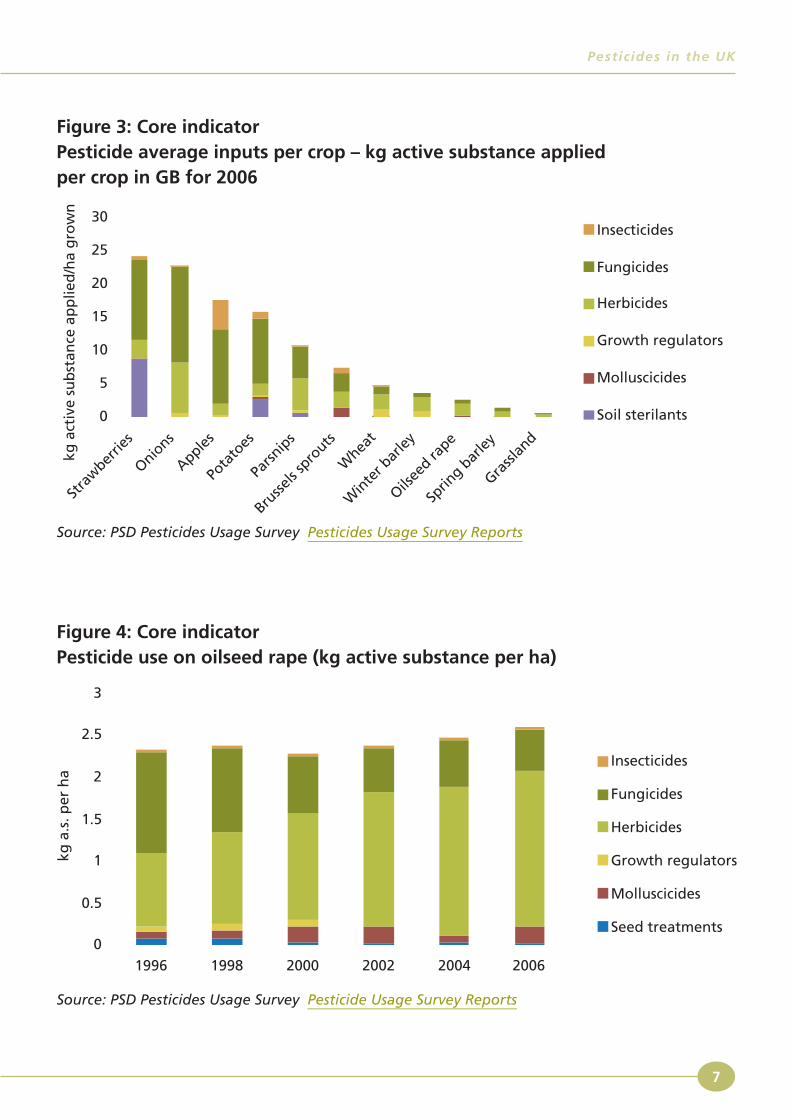
Figure 3 demonstrates the range in total
weight of pesticide applied to particular crops.
It shows that some horticultural crops receive
high weights of active substance per hectare.
Soil sterilants require high dose rates to be
effective, with extra fungicide applications
also being required. This use is to ensure crops
meet quality standards and reflects several
products which have high weights of active
substance applied per hectare. However, the
area of these crops is relatively small, and use
on these crops is only a small proportion of
the total. The data are included to show the
difference between crops and how this
fundamentally affects pesticide use.
Figure 4 shows the average total dose of
pesticides applied per hectare of oilseed rape.
It illustrates a major shift to a reduced weight
of fungicide applied over time, in contrast to
an increased weight of herbicide. More
information on each of the categories is
provided in the paragraphs which follow. As
this information is collated on a biennial basis,
we currently only have information up to
2006. Last year we reported on wheat, as it is
the most extensively grown UK crop.
However, we have decided to report on
oilseed rape this year, since it provides a look
at a different crop which is also one where
many of the pesticides applied have been
found in water courses.
7
Pesticides in the UK
0
5
10
15
20
25
30
Stra
wber
ries
Onions
Apples
Pota
toes
Parsn
ips
Brusse
ls sp
routs
Whea
t
Win
ter b
arle
y
Oilsee
d rape
Sprin
g bar
ley
Grassl
and
kg a
ctiv
e su
bst
ance
ap
plie
d/h
a g
row
n
Insecticides
Fungicides
Herbicides
Growth regulators
Molluscicides
Soil sterilants
Figure 3: Core indicatorPesticide average inputs per crop – kg active substance appliedper crop in GB for 2006
Source: PSD Pesticides Usage Survey Pesticides Usage Survey Reports
0
0.5
1
1.5
2
2.5
3
1996 1998 2000 2002 2004 2006
kg a
.s. p
er h
a
Insecticides
Fungicides
Herbicides
Growth regulators
Molluscicides
Seed treatments
Figure 4: Core indicatorPesticide use on oilseed rape (kg active substance per ha)
Source: PSD Pesticides Usage Survey Pesticide Usage Survey Reports
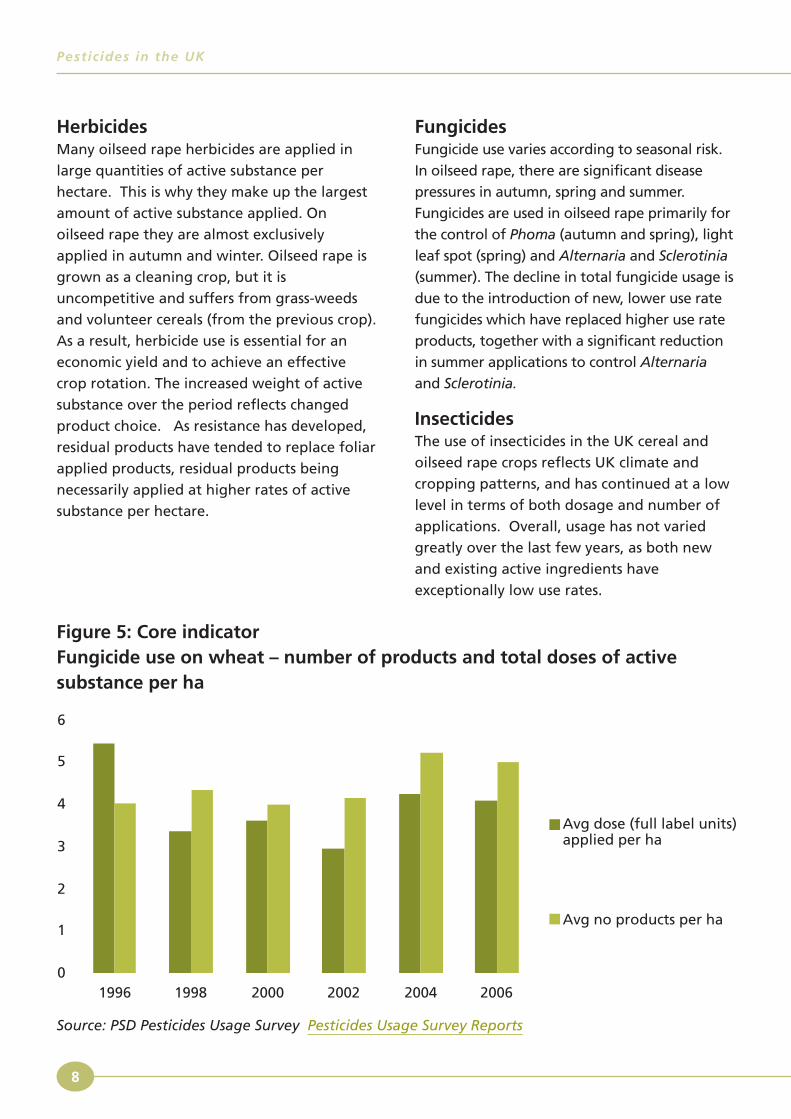
HerbicidesMany oilseed rape herbicides are applied in
large quantities of active substance per
hectare. This is why they make up the largest
amount of active substance applied. On
oilseed rape they are almost exclusively
applied in autumn and winter. Oilseed rape is
grown as a cleaning crop, but it is
uncompetitive and suffers from grass-weeds
and volunteer cereals (from the previous crop).
As a result, herbicide use is essential for an
economic yield and to achieve an effective
crop rotation. The increased weight of active
substance over the period reflects changed
product choice. As resistance has developed,
residual products have tended to replace foliar
applied products, residual products being
necessarily applied at higher rates of active
substance per hectare.
FungicidesFungicide use varies according to seasonal risk.
In oilseed rape, there are significant disease
pressures in autumn, spring and summer.
Fungicides are used in oilseed rape primarily for
the control of Phoma (autumn and spring), light
leaf spot (spring) and Alternaria and Sclerotinia
(summer). The decline in total fungicide usage is
due to the introduction of new, lower use rate
fungicides which have replaced higher use rate
products, together with a significant reduction
in summer applications to control Alternaria
and Sclerotinia.
InsecticidesThe use of insecticides in the UK cereal and
oilseed rape crops reflects UK climate and
cropping patterns, and has continued at a low
level in terms of both dosage and number of
applications. Overall, usage has not varied
greatly over the last few years, as both new
and existing active ingredients have
exceptionally low use rates.
8
Pesticides in the UK
0
1
2
3
4
5
6
1996 1998 2000 2002 2004 2006
Avg dose (full label units)applied per ha
Avg no products per ha
Source: PSD Pesticides Usage Survey Pesticides Usage Survey Reports
Figure 5: Core indicatorFungicide use on wheat – number of products and total doses of activesubstance per ha

Plant Growth Regulators (PGRs)All approvals for use on oilseed rape were
withdrawn in 2001. Most growers now rely on
a side effect of many fungicides which helps
improve crop standing ability. It is not clear
how new variety types might change this
pattern in future.
MolluscicidesMolluscicides are used to protect crops from
slugs which are potentially the cause of
greatly reduced crop establishment. Heavy
soils and wet years create a greater need, and
this seasonal effect accounts for the changes
between years.
Seed TreatmentsVirtually all crops are grown from treated seed.
Because the amounts of pesticide used to treat
seeds are particularly low, seed treatments
constitute a very small proportion of pesticides
used in the UK. However, seed treatments are
only effective for a few weeks following crop
emergence and have not replaced subsequent
insecticide or fungicide use.
Figure 6a indicates the number of sprayer tests
conducted, and percentage of the sprayed
area treated by equipment tested, under the
National Sprayer Testing Scheme (NSTS), as
part of the Voluntary Initiative (VI):
NSTS Home Page
Voluntary Initiative Home Page
Well maintained and correctly serviced spraymachinery is essential for safe and accurateapplication of pesticides. This is especiallyimportant as the average age of such equipmentis estimated to be seven years. Sprayer testingwill help to ensure that equipment is leak proof,capable of operating correctly, and is equippedwith nozzles that are suitable for use. This hasthe potential to significantly minimise the risksto water, wildlife habitats and the sprayoperator. Figure 6a, therefore, indicates the
9
Pesticides in the UK
0
2,000
4,000
6,000
8,000
10,000
12,000
14,000
1997
1998
1999
2000
2001
2002
2003
/4
2004
/5
2005
/6
2006
/7
2007
/8
0
10
20
30
40
50
60
70
80
90
100
Tests (Left Axis)
% Sprayed areacovered
Figure 6a: Core indicatorUser practice: National Sprayer Testing Scheme(number of tests and % sprayed area)
Source: VI Annual Report 2007-08 and NSTS VI Annual Report 2007-08
extent to which users are adopting behaviourswhich increase efficacy and reduce risk to humanhealth and the environment.
The number of tests conducted is lessimportant than the sprayed area covered as,with increasing farm rationalisation, individualspray machines are used to cover larger areasand contractors are being used more widely.Consequently, the ‘sprayed area’ is now thepreferred measure for assessing the coverageof the scheme. An estimate of 1m ha sprayedarea for the forestry and amenity sector hasbeen made.
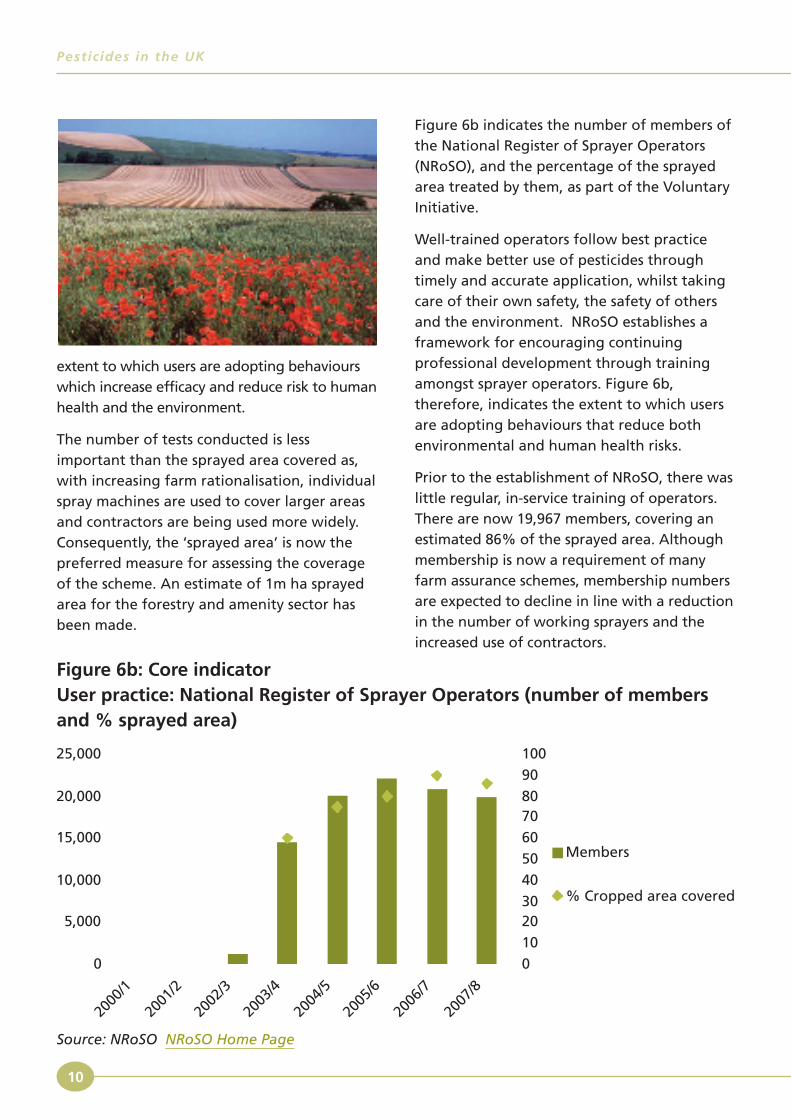
Figure 6b indicates the number of members ofthe National Register of Sprayer Operators(NRoSO), and the percentage of the sprayedarea treated by them, as part of the VoluntaryInitiative.
Well-trained operators follow best practiceand make better use of pesticides throughtimely and accurate application, whilst takingcare of their own safety, the safety of othersand the environment. NRoSO establishes aframework for encouraging continuingprofessional development through trainingamongst sprayer operators. Figure 6b,therefore, indicates the extent to which usersare adopting behaviours that reduce bothenvironmental and human health risks.
Prior to the establishment of NRoSO, there waslittle regular, in-service training of operators.There are now 19,967 members, covering anestimated 86% of the sprayed area. Althoughmembership is now a requirement of manyfarm assurance schemes, membership numbersare expected to decline in line with a reductionin the number of working sprayers and theincreased use of contractors.
10
Pesticides in the UK
Source: NRoSO NRoSO Home Page
0
5,000
10,000
15,000
20,000
25,000
2000
/1
2001
/2
2002
/3
2003
/4
2004
/5
2005
/6
2006
/7
2007
/8
0
10
2030
40
50
60
7080
90
100
Members
% Cropped area covered
Figure 6b: Core indicatorUser practice: National Register of Sprayer Operators (number of membersand % sprayed area)
Source: VI Annual Report 2007-08
0
200,000
400,000
600,000
800,000
1,000,000
1,200,000
1,400,000
1,600,000
1,800,000
2000/1 2001/2 2002/3 2003/4 2004/5 2005/6 2006/7 2007/8
Ara
ble
Are
a C
ove
red
Ha
LEAF Audit
VI CPMP
Figure 6d: Core indicatorUser practice: Crop Protection Management Plans (area covered)
11
Pesticides in the UK
Source: BASIS BASIS Home Page
0
500
1000
1500
2000
2500
3000
3500
4000
4500
2001 2002 2003 2004 2005 2006 2007 2008
Membership of BASISProfessional Register
Figure 6c: Core indicatorUser practice: BASIS professional register (number of members)
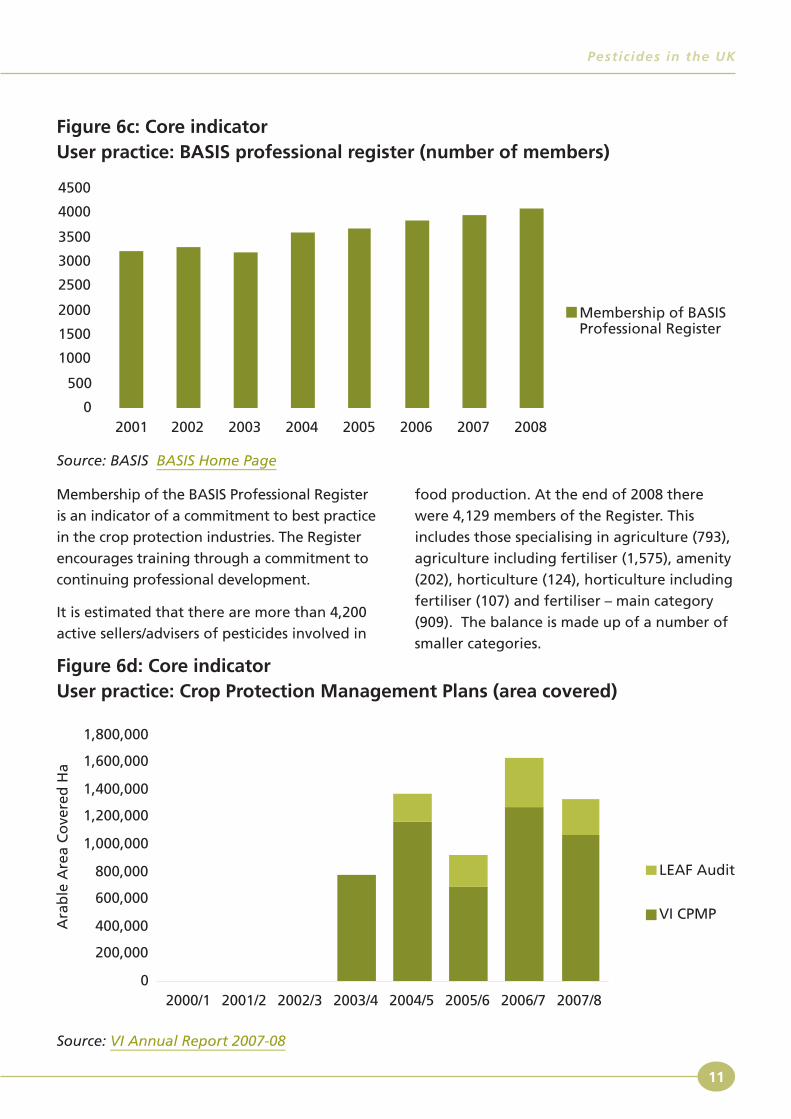
Membership of the BASIS Professional Register
is an indicator of a commitment to best practice
in the crop protection industries. The Register
encourages training through a commitment to
continuing professional development.
It is estimated that there are more than 4,200
active sellers/advisers of pesticides involved in
food production. At the end of 2008 there
were 4,129 members of the Register. This
includes those specialising in agriculture (793),
agriculture including fertiliser (1,575), amenity
(202), horticulture (124), horticulture including
fertiliser (107) and fertiliser – main category
(909). The balance is made up of a number of
smaller categories.
12
Pesticides in the UK
0
8.3%
25.0%
4.2% 4.2%
33.3%
4.2%
20.8%
0
1
2
3
4
5
6
7
8
9
Bre
ach
of
Co
de
Bre
ach
of
Lab
elC
on
dit
ion
s
Exp
ired
pro
du
cts
Failu
re t
ota
kere
aso
nab
leca
re
Lack
of
cert
ific
atio
n
Spra
yer
leak
Bre
ach
of
Foo
d &
Fee
dLa
w
SMR 9 SMR 9 SMR 9 SMR 9 SMR 9 SMR 9 SMR 11
Description of Breach and Statutory Management Requirement (SMR)
Nu
mb
er o
f C
ases
0%
5%
10%
15%
20%
25%
30%
35%
40%
45%
Perc
enta
ge
of
24 c
ases
inw
hic
h a
bre
ach
occ
urr
ed
3% Penalty
1% Penalty
Warning Letter
Figure 6e: Core indicatorUser practice: Cross Compliance checks, legislative breaches
Source: RPA inspection records
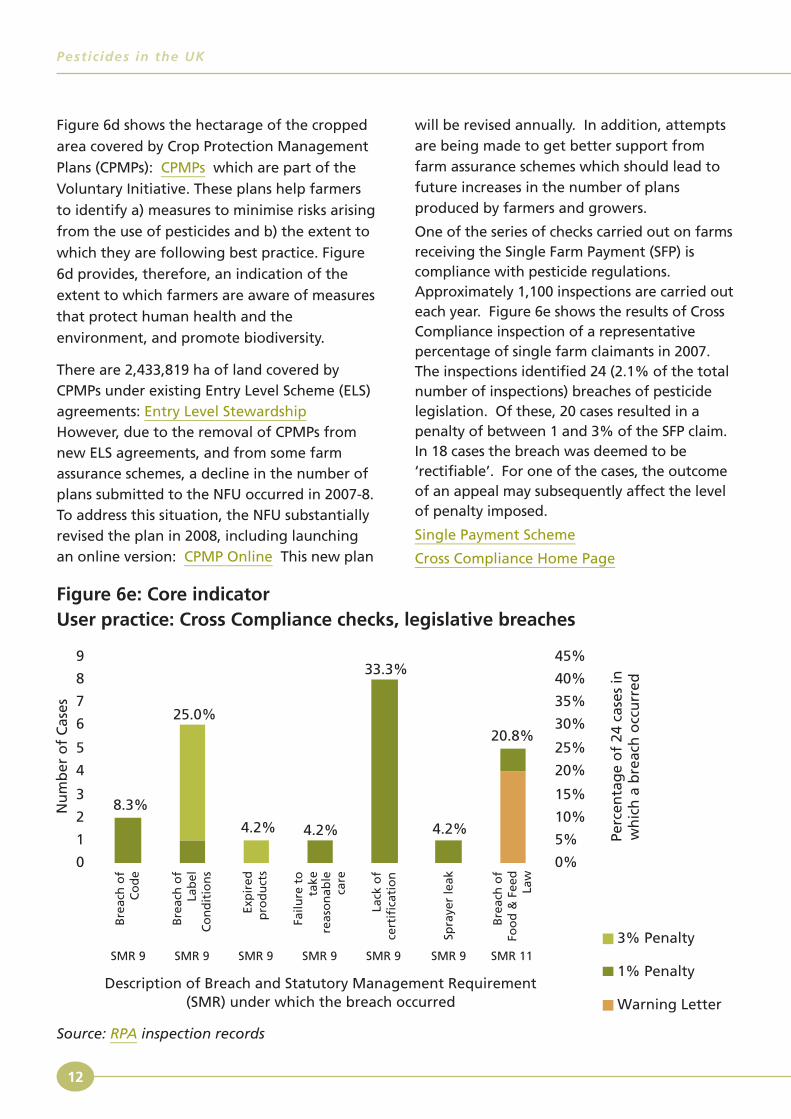
Figure 6d shows the hectarage of the cropped
area covered by Crop Protection Management
Plans (CPMPs): CPMPs which are part of the
Voluntary Initiative. These plans help farmers
to identify a) measures to minimise risks arising
from the use of pesticides and b) the extent to
which they are following best practice. Figure
6d provides, therefore, an indication of the
extent to which farmers are aware of measures
that protect human health and the
environment, and promote biodiversity.
There are 2,433,819 ha of land covered byCPMPs under existing Entry Level Scheme (ELS)agreements: Entry Level StewardshipHowever, due to the removal of CPMPs fromnew ELS agreements, and from some farmassurance schemes, a decline in the number ofplans submitted to the NFU occurred in 2007-8.To address this situation, the NFU substantiallyrevised the plan in 2008, including launchingan online version: CPMP Online This new plan
will be revised annually. In addition, attemptsare being made to get better support fromfarm assurance schemes which should lead tofuture increases in the number of plansproduced by farmers and growers.
One of the series of checks carried out on farmsreceiving the Single Farm Payment (SFP) iscompliance with pesticide regulations.Approximately 1,100 inspections are carried outeach year. Figure 6e shows the results of CrossCompliance inspection of a representativepercentage of single farm claimants in 2007.The inspections identified 24 (2.1% of the totalnumber of inspections) breaches of pesticidelegislation. Of these, 20 cases resulted in apenalty of between 1 and 3% of the SFP claim.In 18 cases the breach was deemed to be‘rectifiable’. For one of the cases, the outcomeof an appeal may subsequently affect the levelof penalty imposed.
Single Payment Scheme
Cross Compliance Home Page
Description of Breach and Statutory Management Requirement(SMR) under which the breach occurred
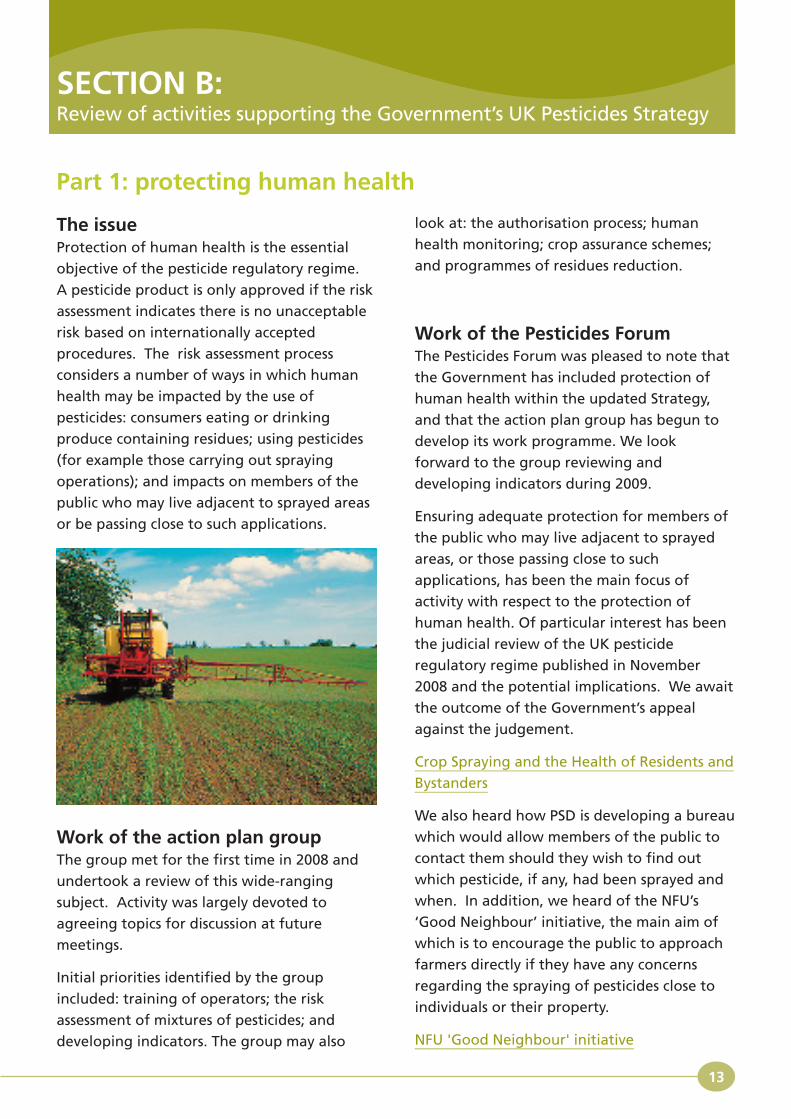
The issueProtection of human health is the essential
objective of the pesticide regulatory regime.
A pesticide product is only approved if the risk
assessment indicates there is no unacceptable
risk based on internationally accepted
procedures. The risk assessment process
considers a number of ways in which human
health may be impacted by the use of
pesticides: consumers eating or drinking
produce containing residues; using pesticides
(for example those carrying out spraying
operations); and impacts on members of the
public who may live adjacent to sprayed areas
or be passing close to such applications.
Work of the action plan groupThe group met for the first time in 2008 and
undertook a review of this wide-ranging
subject. Activity was largely devoted to
agreeing topics for discussion at future
meetings.
Initial priorities identified by the group
included: training of operators; the risk
assessment of mixtures of pesticides; and
developing indicators. The group may also
look at: the authorisation process; human
health monitoring; crop assurance schemes;
and programmes of residues reduction.
Work of the Pesticides ForumThe Pesticides Forum was pleased to note that
the Government has included protection of
human health within the updated Strategy,
and that the action plan group has begun to
develop its work programme. We look
forward to the group reviewing and
developing indicators during 2009.
Ensuring adequate protection for members of
the public who may live adjacent to sprayed
areas, or those passing close to such
applications, has been the main focus of
activity with respect to the protection of
human health. Of particular interest has been
the judicial review of the UK pesticide
regulatory regime published in November
2008 and the potential implications. We await
the outcome of the Government’s appeal
against the judgement.
Crop Spraying and the Health of Residents and
Bystanders
We also heard how PSD is developing a bureau
which would allow members of the public to
contact them should they wish to find out
which pesticide, if any, had been sprayed and
when. In addition, we heard of the NFU’s
‘Good Neighbour’ initiative, the main aim of
which is to encourage the public to approach
farmers directly if they have any concerns
regarding the spraying of pesticides close to
individuals or their property.
NFU 'Good Neighbour' initiative
13
SECTION B:Review of activities supporting the Government’s UK Pesticides Strategy
Part 1: protecting human health
The Food Standards Agency (FSA) updated
members about its action plan to minimise
pesticide residues in food which had resulted
in the development of specific crop guides.
Members also learnt details of subsequent
liaison with relevant industry organisations to
take the residue minimisation work forward.
The FSA highlighted the possible impact of its
advice on mycotoxin development and told
members about its Code of Good Agricultural
Practice for Reduction of Mycotoxins in UK
Cereals which should be used in conjunction
with guidelines for minimising residues. Both
the action plan and the codes are currently
available on the FSA's website:
Crop guides on pesticide residue minimisation
Managing mycotoxin risk
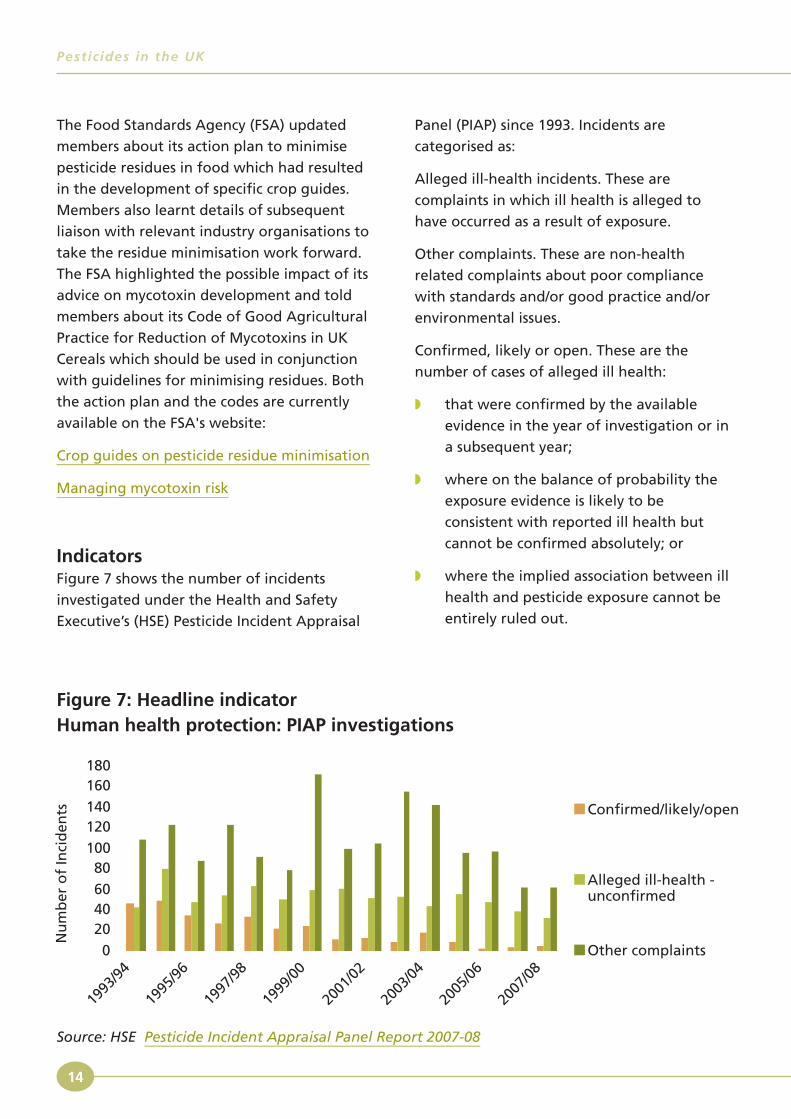
IndicatorsFigure 7 shows the number of incidents
investigated under the Health and Safety
Executive’s (HSE) Pesticide Incident Appraisal
Panel (PIAP) since 1993. Incidents are
categorised as:
Alleged ill-health incidents. These are
complaints in which ill health is alleged to
have occurred as a result of exposure.
Other complaints. These are non-health
related complaints about poor compliance
with standards and/or good practice and/or
environmental issues.
Confirmed, likely or open. These are the
number of cases of alleged ill health:
� that were confirmed by the available
evidence in the year of investigation or in
a subsequent year;
� where on the balance of probability the
exposure evidence is likely to be
consistent with reported ill health but
cannot be confirmed absolutely; or
� where the implied association between ill
health and pesticide exposure cannot be
entirely ruled out.
14
Pesticides in the UK
Source: HSE Pesticide Incident Appraisal Panel Report 2007-08
0
204060
80100
120140
160180
1993
/94
1995
/96
1997
/98
1999
/00
2001
/02
2003
/04
2005
/06
2007
/08
Nu
mb
er o
f In
cid
ents Confirmed/likely/open
Alleged ill-health -unconfirmed
Other complaints
Figure 7: Headline indicatorHuman health protection: PIAP investigations
All complaints of alleged ill health, and the vast
majority of other complaints referred to HSE,
are investigated. Where an incident is not
clearly pesticide related, or where the reported
condition(s) amount to a generalised allegation
of feeling ‘unwell’ which cannot be associated
with a particular incident or exposure to a
pesticide, the complaint will not be classified as
an incident nor will it be investigated.
The overall number of complaints varies from
year to year and is thought to reflect
variability in the awareness of, and concern by,
members of the public about the use of
pesticides. It is, however, good to note that, if
anything, there is a reduction in the number
of complaints reported.
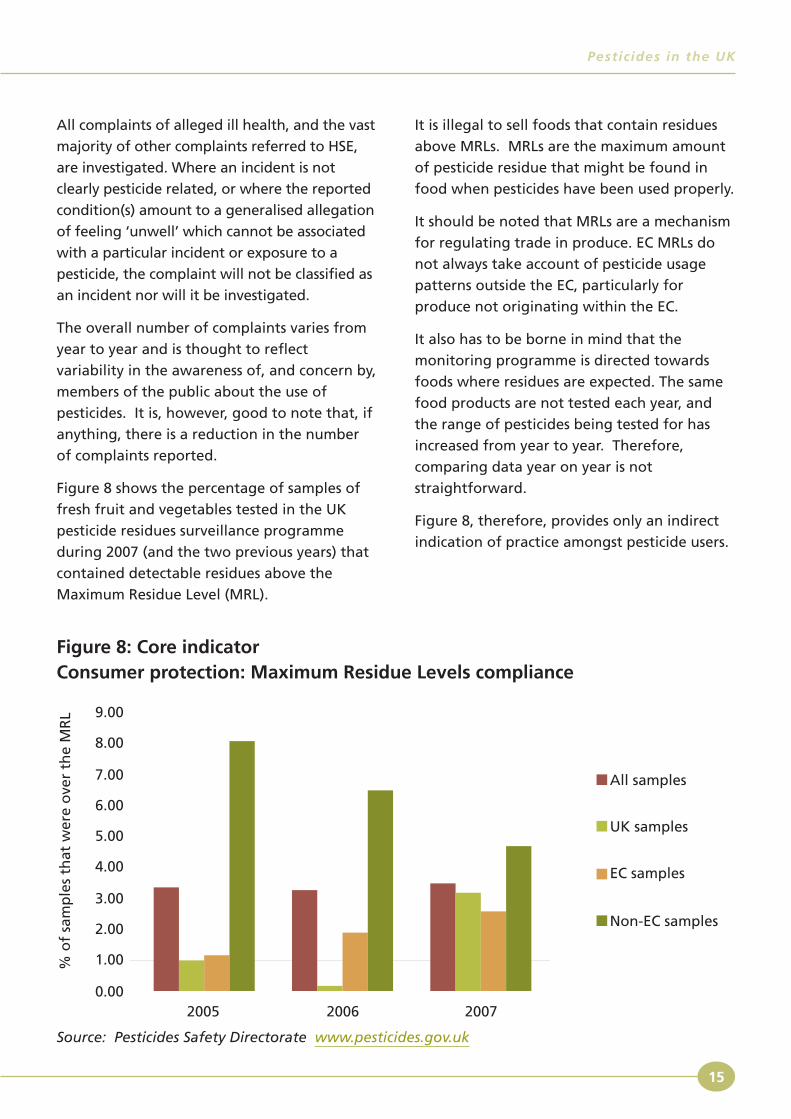
Figure 8 shows the percentage of samples of
fresh fruit and vegetables tested in the UK
pesticide residues surveillance programme
during 2007 (and the two previous years) that
contained detectable residues above the
Maximum Residue Level (MRL).
It is illegal to sell foods that contain residues
above MRLs. MRLs are the maximum amount
of pesticide residue that might be found in
food when pesticides have been used properly.
It should be noted that MRLs are a mechanism
for regulating trade in produce. EC MRLs do
not always take account of pesticide usage
patterns outside the EC, particularly for
produce not originating within the EC.
It also has to be borne in mind that the
monitoring programme is directed towards
foods where residues are expected. The same
food products are not tested each year, and
the range of pesticides being tested for has
increased from year to year. Therefore,
comparing data year on year is not
straightforward.
Figure 8, therefore, provides only an indirect
indication of practice amongst pesticide users.
15
Pesticides in the UK
0.00
1.00
2.00
3.00
4.00
5.00
6.00
7.00
8.00
9.00
2005 2006 2007
% o
f sa
mp
les
that
wer
e o
ver
the
MR
L
All samples
UK samples
EC samples
Non-EC samples
Figure 8: Core indicatorConsumer protection: Maximum Residue Levels compliance
Source: Pesticides Safety Directorate www.pesticides.gov.uk
Further information on MRLs
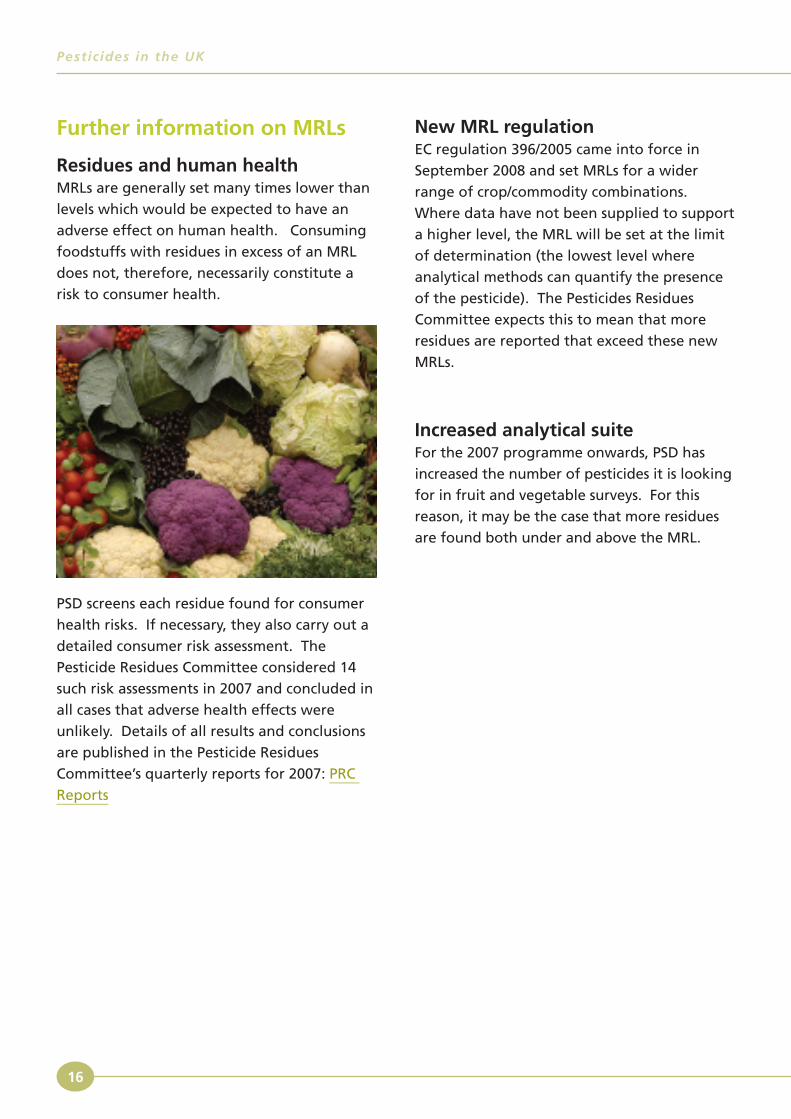
Residues and human health MRLs are generally set many times lower than
levels which would be expected to have an
adverse effect on human health. Consuming
foodstuffs with residues in excess of an MRL
does not, therefore, necessarily constitute a
risk to consumer health.
PSD screens each residue found for consumer
health risks. If necessary, they also carry out a
detailed consumer risk assessment. The
Pesticide Residues Committee considered 14
such risk assessments in 2007 and concluded in
all cases that adverse health effects were
unlikely. Details of all results and conclusions
are published in the Pesticide Residues
Committee’s quarterly reports for 2007: PRC
Reports
New MRL regulationEC regulation 396/2005 came into force in
September 2008 and set MRLs for a wider
range of crop/commodity combinations.
Where data have not been supplied to support
a higher level, the MRL will be set at the limit
of determination (the lowest level where
analytical methods can quantify the presence
of the pesticide). The Pesticides Residues
Committee expects this to mean that more
residues are reported that exceed these new
MRLs.
Increased analytical suiteFor the 2007 programme onwards, PSD has
increased the number of pesticides it is looking
for in fruit and vegetable surveys. For this
reason, it may be the case that more residues
are found both under and above the MRL.
16
Pesticides in the UK
The issueVirtually all farmers (including many organic
growers) rely on pesticides to produce an
economic crop. The availability of a sufficient
range of products and techniques to control
pests and diseases is, therefore, central to
sustainable farming. Problems with the
availability of pesticides are being exacerbated
as the review programme under Directive
91/414/EEC removes many of the older
substances from the market. The Maximum
Residue Levels (MRL) programme, for similar
reasons, is likely to reduce the range of
permitted pesticide uses. The problem will be
particularly acute for ‘minor pesticide uses’
(uses on minor crops, or minor uses on major
crops) which occur principally in the
horticultural sector.
Work of the action plan groupThe group has focussed its attention on
increasing, or at least maintaining, the
availability of plant protection products,
particularly for minor uses. Activity has
concentrated on ensuring all elements of the
pesticides regulatory regime and processes
take sufficient account of this issue.
Key activities include: promoting the benefits
of zonal authorisations in the new EC pesticide
approvals regime; supporting the adoption by
the EC of broader residues extrapolations and
by EPPO of changes to efficacy extrapolations;
securing the vast majority of Maximum
Residue Levels needed to accommodate UK
authorised uses; and introducing special
authorisation arrangements for biopesticides.
EPPO Home Page
Future activity is likely to focus on: taking
advantage of zonal authorisations to help
develop collaborative approaches; the
practicalities associated with the adoption of
integrated and alternative approaches; and
the development of robust indicators.
Work of the Pesticides ForumThe Pesticides Forum has heard how
computerised decision support systems can be
used to help farmers and growers make
informed decisions about whether to spray
pesticides and, if so, which pesticide, when
and in what quantity. But members also learnt
that, however good these programmes are,
any error in the decision made can have a
significant bearing on the confidence farmers
and growers have in the system in future.
However, the Forum agreed that such systems,
as they become more intelligent, will
inevitably be much more widely used on farms
in the future.
IndicatorsFigure 9 shows the number of products and
the number of active substances approved, in
any one year, as biopesticides since 1996.
17
Pesticides in the UK
Part 2: availability of products and techniques
18
Pesticides in the UK
Figure 9: Core indicatorNumber of biopesticides available to users 1996 to 2008
Source: Pesticides Safety Directorate Biopesticides Home Page
0
2
4
6
8
10
12
14
16
1996
1997
1998
1999
2000
2001
2002
2003
2004
2005
2006
2007
2008
Nu
mb
er
Activesubstances
Products
Although the number of products has fallen,
the number of active substances has gradually
been rising. Biopesticides are, therefore,
becoming increasingly available for the
purposes of biological control as innocula,
insecticides, herbicides and fungicides across a
wide range of edible and non-edible crops.
Biopesticides are defined as one of the
following:
� Products based on pheromones or
semiochemicals. Semiochemicals are
natural chemicals emitted by plants,
animals and other organisms (or synthetic
chemicals designed to mimic the natural
substances) that evoke a behavioural or
physiological response in the target
species (such as deterring target insects
from entering the crop or attracting them
away from the crop to the margins).
� Products containing a micro-organism
(e.g. bacterium, fungus, protozoa, virus,
viroid).
� Products based on plant extracts. There is
a large spectrum of plant extracts (i.e.
unprocessed extracts representing a
‘cluster of substances’ or those which are
highly refined containing one active
substance).
� Other novel alternative products. As the
description suggests, these are potential
products which do not easily sit within
one of the specific categories above.
More information on the definitions of
biopesticides can be found on:
Biopesticides Home Page
The IssueProtecting water and minimising risks to water
quality is a key objective of the UK Pesticides
Strategy. There is a need to integrate water
protection policies in relation to plant
protection products with wider water policy
matters such as meeting the requirements of
the Water Framework Directive (WFD). Water
quality is already being addressed through
initiatives such as the England Catchment
Sensitive Farming Delivery Initiative (ECSFDI)
and via the Voluntary Initiative for pesticides
which includes pilot water catchment projects.
The Strategy’s water action plan seeks to
integrate and build on these initiatives.
Water Framework Directive
ECSFDI
Work of the action plan groupThe Water action plan group met twice during
2008. Activity is largely being driven by
measures designed to implement the WFD.
Members of the group have been working on
projects led by the Environment Agency that
are designed to: identify waterbodies which
are at risk of failing chemical or ecological
quality requirements of the Directive; develop
measures that could be used to ensure
compliance with the required standards; and
improve the headline and core indicators used
by the action plan.
The group also considered the potential
impact of the emergence of pesticides such as
carbetamide, propyzamide and metaldehyde
in supplies used for the abstraction of drinking
water and the most appropriate procedures
for addressing such issues.
Work of the Pesticides ForumIn October, the Pesticides Forum was updated
on latest developments relating to
implementation of the WFD. The
Environment Agency invited members to
participate in reviewing draft River Basin
Management Plans (RBMPs) which will set out
a Programme of Measures (POM) for each
water body, and draft Pollution Reduction
Programmes (PRPs) for a number of individual
pesticides identified as either WFD Priority
Substances or UK Specific Pollutants. The
Pesticides Forum noted that work to develop
new surface water indicators had not
progressed as quickly as anticipated.
River Basin Management Plans
The Forum also considered how pesticide
container design might lead to the risk of
spillages and point source pollution of
19
Pesticides in the UK
Part 3: protecting water

20
Pesticides in the UK
watercourses. At its June meeting, members
heard from a range of industry representatives
about the issues surrounding container design,
including the potential for use of
biodegradeable film, which would break
down in the mixing tank (similar to the system
used in dishwashing machines). Members
0
2
4
6
8
10
1998 1999 2000 2001 2002 2003 2004 2005 2006 2007Perc
enta
ge
of
pes
tici
de
exce
edin
g 0
.1u
g/l
Figure 10: Headline indicatorPesticides in surface waters (England and Wales)
Source: Environment Agency
were also reminded of the potential risks that
can result from the use of foil caps on
containers which, if not disposed of properly,
can be a major point source pollutant. A
Forum Container Management sub-group was
set up at the October meeting, tasked with
the production of a set of recommendations
for improved and best practice.
IndicatorsThe Environment Agency’s surface water
indicator is based on nine pesticides most
commonly found at relatively high levels.
These substances are 2,4-D, atrazine,
chlorotoluron, dichlorprop, diuron,
isoproturon, mecoprop, MCPA, and simazine.
These are all herbicides that are mobile and
persistent and have traditionally been used in
large quantities.
Figure 10 shows, for each year since 1998, the
percentage of samples breaching 0.1 g/l. The
Environment Agency uses 0.1 g/litre as a
threshold to look at trends of pesticides in the
environment. It is not a measure of
environmental damage.
The figure only uses data from monitoring
sites that have been consistently sampled for
several years, as this allows for better analysis
of trends. Annual results are generated using
data from over 10,500 samples, taken at
approximately 1,100 sites over the Agency’s
eight regions.
The sites represent, in the main, those where
inputs of pesticides will have come from use
rather than, for example, discharges from
manufacturing plants or discharges from
historically contaminated sites.

21
Pesticides in the UK
Figure 11: Headline indicatorTop nine pesticides in surface waters (England and Wales)
0
5
10
15
20
Atrazin
e
Chloro
tolu
ron
2,4-
D
Dichlo
rpro
p
Diuro
n
Isopro
turo
n
MCPA
Mec
oprop
Simaz
ine
1998 1999 2000 2001 2002 2003 2004 2005 2006 2007
Perc
enta
ge
of
pes
tici
de
> 0
.1u
g/l
Source: Environment Agency
Figure 11 shows year-on-year trends in
exceedances for each of the 9 pesticides used
within the indicator. Those pesticides with the
greatest exceedance levels in 2007 were
isoproturon (12.9%), mecoprop (10.3%),
diuron (8.8%) and MCPA (6.6%). These have
typically been the top four pesticides in
previous years also, although the order has
varied.
In 2007, 5.98% of pesticide samples were
above 0.1 g/litre. This compares with 6.49% of
samples in 2006 and 7.98% of samples in 2005.
The reason for the rise and fall in annual
percentage of samples above 0.1 g/litre is not
easy to explain as there are many contributory
factors, including which crops are being
grown; the prevalence of different pests and
choice of pesticide used; weather patterns
(loss to water is more likely when application
coincides with rainfall); and the degree to
which best practice has been employed.
Nevertheless, it is encouraging that levels are
on a downward trend.
The most frequently occurring pesticides that
the Environment Agency found in
groundwater in 2007 (figure 12) were atrazine,
atrazine breakdown products and simazine.
In the majority of groundwater samples where
pesticides were detected, concentrations
measured were below 0.1µg/litre. Atrazine
and its breakdown products were the group of
substances most frequently exceeding this
value, along with bentazone.
Flutriafol appeared in the equivalent graph
for 2006 but was ranked 11th; whereas in 2007
it is the 5th most frequently detected
pesticide. It is a broad spectrum triazole
fungicide used on cereals. The oilseed rape
herbicide metazachlor did not feature in the
2006 rankings. In 2007 it was detected in just
under 3% of groundwater samples.
The Environment Agency categorises pollution
incidents to land, air or water in terms of their
impact on the environment, from category 1
(the most serious) down to category 4 (no
impact).
22
Pesticides in the UK
0.0
5.0
10.0
15.0
20.0
25.0
30.0
Atrazine
Simazine
Atrazine desethyl
Atrazine desisopropyl
Flutriafol
Diuron
Propazine
Bentazone
Dieldrin
Isoproturon
Carbendazim
Metazachlor
Pesticides abovelevel of detection
Pesticides greaterthan 0.1ug/l
Figure 12: Core indicatorPesticides in groundwater in England and Wales 2007(top 10 pesticides and their metabolites detected in groundwater)
Source: Environment Agency

Figure 13 shows the total number of category
1 and 2 incidents for pesticides for each year
since 1999. This includes all incidents relating
to land, air and water, although in the
majority of instances the incidents are water-
related. A split is made to show those
incidents attributable to agricultural activity
and those attributable to non-agricultural
activity.
In 2007, the Environment Agency investigated
eight category 1 and 2 incidents relating to
pesticides (plant protection products). Five
related to agricultural activity, and three to
non- agricultural activity. These numbers are
similar to those for recent years. It should be
noted that EA will not capture all incidents
that occur, only those that are reported.
Incidents resulting from agricultural activity
included a ‘fish kill’ following discharge of the
herbicides trifluralin and prosulfocarb from a
damaged crop sprayer to a watercourse; and
four incidents where water company drinking
water intakes were temporarily closed because
of high levels of pesticides in the intake water.
The pesticides in question were propyzamide
(responsible for two of the incidents),
isoproturon and oxadixyl.
Incidents resulting from non-agricultural
activity included one involving damage to
several kilometres of river life following
release of cypermethrin (suspected to have
arisen from forestry activity). Another
involved closure of a drinking water
abstraction after aerial spraying of asulam to
control bracken. Buffer zones in place to
protect vulnerable watercourses were over
sprayed. In the third incident, aquatic life was
damaged due to the release of promecarb, the
source of which was suspected to have been
an industrial unit experimenting with novel
waste treatment techniques.
23
Pesticides in the UK
0
2
4
6
8
10
12
14
1999 2000 2001 2002 2003 2004 2005 2006 2007
Non-agricultural
Agricultural
Figure 13: Core indicatorNumber of substantiated category 1 and 2 pollution incidents for land, air orwater, involving agricultural and non-agricultural pesticides
Source: Environment Agency
The issueThe UK Government has made a commitment
to reversing the long-term decline in the
numbers of farmland birds by 2020. The
indicators within the biodiversity action plan
support this high level target.
The pesticide approvals system aims to limit the
direct adverse effects of pesticides on non-
target species. These controls are under
continuous development. However, the
authorisation system alone will not completely
eliminate the effects of pesticides on non-
target species. Pesticides can also indirectly
affect wildlife by removing the plant, seed and
invertebrate food sources that it needs to
survive. Initiatives are required to supplement
the pesticide regulatory controls and address
the indirect effects of pesticides on biodiversity.
The Government’s UK Pesticides Strategy
biodiversity action plan is based around taking
some of these key initiatives forward.
Work of the action plan groupThe group met twice during 2008 and
focussed activity on supporting the
Government’s wider biodiversity objectives. A
key piece of work in this respect has been to
identify the UK BAP species and habitats
which may be adversely affected by the use of
pesticides. The group has also: overseen a
project to develop guidance on indirect effects
and compensatory measures (which will be
published in 2009); considered measures for
inclusion in environmental schemes, including
the Government’s proposed Enhanced Farm
Environment Record (EnFER); and heard
updates on the work of the Voluntary
Initiative.
UK BAP Home Page
Future activity will be directed at: driving
existing projects to completion; considering
development of an enhanced crop protection
management plan; reviewing the potential
impact of integrated approaches; and
developing a more robust set of indicators to
more accurately assess the impacts of
pesticides on biodiversity.
Work of the Pesticides ForumThis year the Pesticides Forum learnt of PSD’s
investigations into the incidents of bee deaths
in southern Germany in 2008 caused by use of
a seed dressing on maize. It is understood
that the treatment was applied to the seed
with insufficient ‘sticker’ so did not adhere to
the seed during drilling as it should have
done. This, and the type of drilling equipment
used, resulted in dust drifting in to adjacent
areas where bees were present. In addition,
drilling took place later in the season than
usual and coincided with the flowering of
neighbouring crops such as oilseed rape and
fruit trees where the bees were foraging. At
present there is no evidence that the
approvals on the crops and at the rates used in
the UK need to be amended. PSD is
continuing to be involved with the
24
Pesticides in the UK
Part 4: protecting biodiversity
development of bee risk assessment
methodology, and will also continue to keep
abreast of research and developments in other
EU Member States and elsewhere to see if
they are relevant to the UK.
Some members visited the farm of another
Pesticides Forum member, Peter Hall, to learn
about modern organic top fruit growing
methods. Linked with targeted alternatives
to synthetic chemical pesticides (such as
codling moth traps which use pheromones to
confuse and disrupt the moth’s mating
practices), these approaches can provide levels
of production similar to conventional farming
systems. Members heard how the hope was
that the system for top fruit could be
developed for use on a wide range of other
cropping systems.
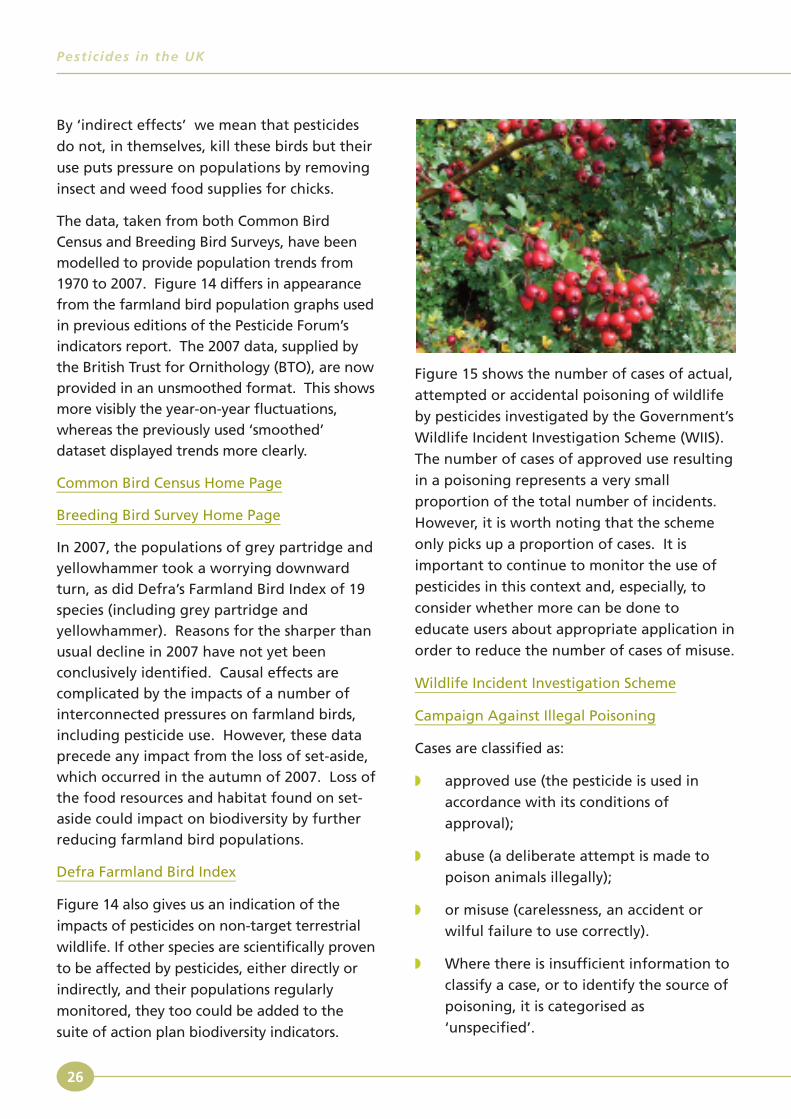
Farmland bird populations are used by the UK
Pesticides Strategy biodiversity action plan as a
measure of the impact of pesticides on
biodiversity. This is because farmland bird
populations are widely and routinely surveyed,
and the three species shown in the graph have
been proven to be indirectly impacted by the
use of pesticides.
25
Pesticides in the UK
0
0.2
0.4
0.6
0.8
1
1.2
1.4
1.6
1970
1973
1976
1979
1982
1985
1988
1991
1994
1997
2000
2003
2006
Ind
ex (
1970
= 1
) All species (19)
Corn Bunting
Grey Partridge
Yellowhammer
Figure 14: Headline indicatorPopulations of selected farmland bird species
Source: British Trust for Ornithology
26
Pesticides in the UK
By ‘indirect effects’ we mean that pesticides
do not, in themselves, kill these birds but their
use puts pressure on populations by removing
insect and weed food supplies for chicks.
The data, taken from both Common BirdCensus and Breeding Bird Surveys, have beenmodelled to provide population trends from1970 to 2007. Figure 14 differs in appearancefrom the farmland bird population graphs usedin previous editions of the Pesticide Forum’sindicators report. The 2007 data, supplied bythe British Trust for Ornithology (BTO), are nowprovided in an unsmoothed format. This showsmore visibly the year-on-year fluctuations,whereas the previously used ‘smoothed’dataset displayed trends more clearly.
Common Bird Census Home Page
Breeding Bird Survey Home Page
In 2007, the populations of grey partridge andyellowhammer took a worrying downwardturn, as did Defra’s Farmland Bird Index of 19species (including grey partridge andyellowhammer). Reasons for the sharper thanusual decline in 2007 have not yet beenconclusively identified. Causal effects arecomplicated by the impacts of a number ofinterconnected pressures on farmland birds,including pesticide use. However, these dataprecede any impact from the loss of set-aside,which occurred in the autumn of 2007. Loss ofthe food resources and habitat found on set-aside could impact on biodiversity by furtherreducing farmland bird populations.
Defra Farmland Bird Index
Figure 14 also gives us an indication of the
impacts of pesticides on non-target terrestrial
wildlife. If other species are scientifically proven
to be affected by pesticides, either directly or
indirectly, and their populations regularly
monitored, they too could be added to the
suite of action plan biodiversity indicators.
Figure 15 shows the number of cases of actual,
attempted or accidental poisoning of wildlife
by pesticides investigated by the Government’s
Wildlife Incident Investigation Scheme (WIIS).
The number of cases of approved use resulting
in a poisoning represents a very small
proportion of the total number of incidents.
However, it is worth noting that the scheme
only picks up a proportion of cases. It is
important to continue to monitor the use of
pesticides in this context and, especially, to
consider whether more can be done to
educate users about appropriate application in
order to reduce the number of cases of misuse.
Wildlife Incident Investigation Scheme
Campaign Against Illegal Poisoning
Cases are classified as:
� approved use (the pesticide is used in
accordance with its conditions of
approval);
� abuse (a deliberate attempt is made to
poison animals illegally);
� or misuse (carelessness, an accident or
wilful failure to use correctly).
� Where there is insufficient information to
classify a case, or to identify the source of
poisoning, it is categorised as
‘unspecified’.
In 2007, 124 of the 354 incidents investigated
involved pesticide poisoning. There were two
incidents of approved use and 21 incidents
were a result of misuse. Of the total number
of incidents, 75 were recorded as abuse and
there were 23 cases of unspecified use. There
were three cases that involved a veterinary
product. None of the approved use and
misuse cases indicated any need to amend the
conditions of approval.
Birds of prey are the most common target for
abuse and rodenticides are the pesticides most
often detected, usually as a result of secondary
poisoning when birds of prey and owls pick up
poisoned rodents. The Pesticides Forum has
been pleased to note the activities of the
Campaign for Responsible Rodenticide Use
(CRRU) which are aimed at increasing
awareness and operator training in relation to
rodenticide use.
WIIS Annual Report 2007
27
Pesticides in the UK
0
50
100
150
200
250
1995
*19
9619
9719
9819
9920
0020
0120
0220
0320
0420
0520
0620
07
Veterinary compounds
Unspecified use
Approved use
Misuse
Abuse
Figure 15: Core indicatorPesticide poisoning incidents investigated by WIIS
Source: Pesticides Safety Directorate WIIS Annual Report 2007
* Numbers for 1995 do not include invertebrates or fish.
28
Pesticides in the UK
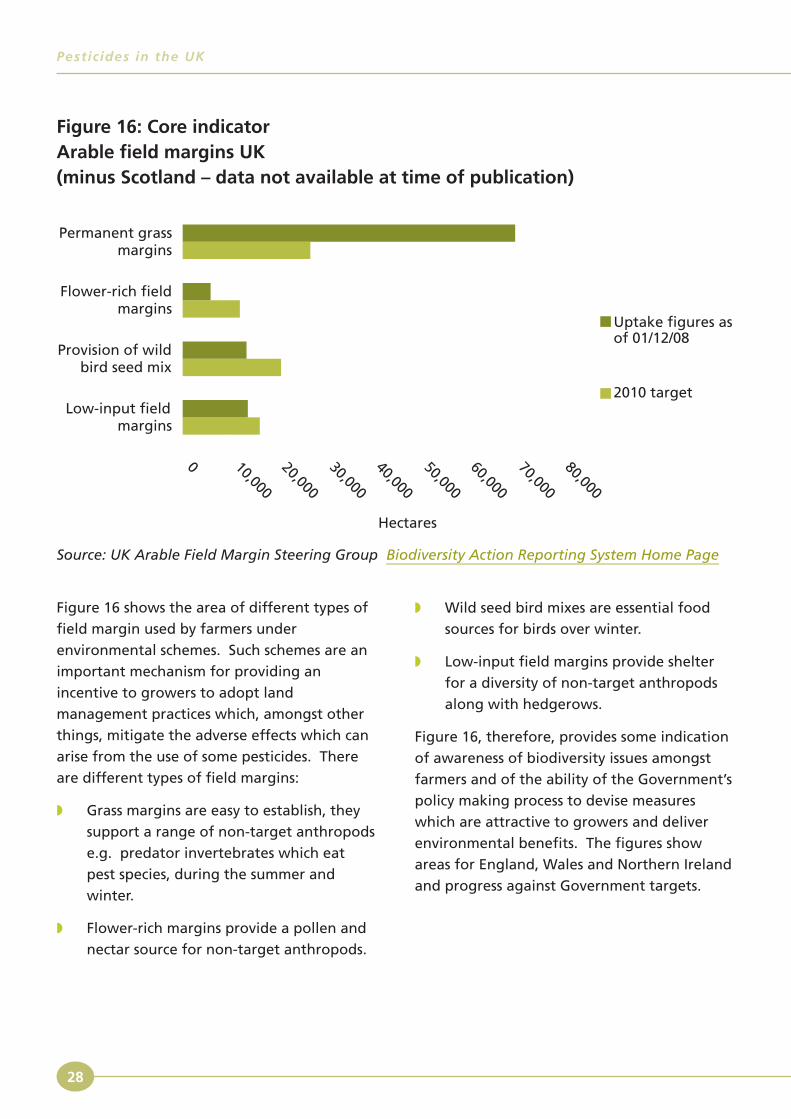
Figure 16: Core indicator Arable field margins UK(minus Scotland – data not available at time of publication)
0 10,00020,000
30,00040,000
50,00060,000
70,00080,000
Low-input fieldmargins
Provision of wildbird seed mix
Flower-rich fieldmargins
Permanent grassmargins
Hectares
Uptake figures asof 01/12/08
2010 target
Source: UK Arable Field Margin Steering Group Biodiversity Action Reporting System Home Page
Figure 16 shows the area of different types of
field margin used by farmers under
environmental schemes. Such schemes are an
important mechanism for providing an
incentive to growers to adopt land
management practices which, amongst other
things, mitigate the adverse effects which can
arise from the use of some pesticides. There
are different types of field margins:
� Grass margins are easy to establish, they
support a range of non-target anthropods
e.g. predator invertebrates which eat
pest species, during the summer and
winter.
� Flower-rich margins provide a pollen and
nectar source for non-target anthropods.
� Wild seed bird mixes are essential food
sources for birds over winter.
� Low-input field margins provide shelter
for a diversity of non-target anthropods
along with hedgerows.
Figure 16, therefore, provides some indication
of awareness of biodiversity issues amongst
farmers and of the ability of the Government’s
policy making process to devise measures
which are attractive to growers and deliver
environmental benefits. The figures show
areas for England, Wales and Northern Ireland
and progress against Government targets.
The issueSignificant quantities of pesticides are used in
the amenity sector (about 10% of the total for
amenity and forestry). This includes many
aspects of our transport infrastructure as well
as parks, sports grounds, public spaces and
industrial facilities. Although such use has
historically received less attention than
agricultural applications, there is evidence to
suggest that good/best application and
disposal practice is followed to a lesser degree
than it is in other sectors.
Work of the action plan groupThe work of the action plan group has largely
been driven by assessing and then following
up the messages contained in PSD’s survey of
pesticide use and practice in the amenity
sector. The report identified the need to
improve:
� understanding of the risk associated with
the use of pesticides;
� training;
� quality of tender specification and
contract management;
� disposal practice;
It also highlighted the need for a
consideration of alternative approaches,
amongst key groups of users.
Industry was tasked with developing measures
to achieve these improvements and
established the Amenity Forum to bring
stakeholders together. Key activities of the
Amenity Forum and its stakeholders have
included promotion and roll-out of the
‘Amenity Assured’ Scheme
Amenity Assured and BACCS
and a programme of activity to promote ‘best
practice’ measures including:
� a new website:
Amenity Forum Home Page
� two sets of guidance notes available in
2008:
Specification for Weed Control Contracts
Check Your Sprayer guidance notes
� the establishment of a group of northern
local authorities to encourage best
practice/share experience:
Northern Local Authority Amenity Forum
� and a weed control conference for local
authorities based in the south east.
The industry has also succeeded in developing
a test for the application equipment used by
Network Rail to manage vegetation along
railway tracks and the rail authority is using
Amenity Assured Contractors.
Future activity will concentrate on further
developing the scope and quality of these
projects.
Work of the Pesticides ForumDuring the year the Pesticides Forum received
updates on: the messages emerging from the
PSD survey; the work of the Amenity Forum;
and alternatives to pesticide-based methods
for controlling vegetation in amenity
situations and how this is being reflected in
the Strategy’s action plan. The Forum
encouraged the action plan group to develop
indicators demonstrating the progress made in
delivering its programme of work.
29
Pesticides in the UK
Part 5: best practice in amenity use
IndicatorsLast year’s indicators report contained
information about the adoption of ‘best
practice’; factors influencing vegetation
control priorities; and motivation for choice of
contractors. The indicators were based on
information contained in the PSD survey.
Resource constraints mean that it is not
practical to conduct such a survey on an
annual basis but the Forum understands that
the Government intends to conduct a similar
enquiry in 2010 to review progress.
In the meantime the Pesticides Forum notes
the following information for 2008:
� 18,000 miles of mainline track managed
by Network Rail were sprayed by Amenity
Assured contractors.
� 202 local authorities had weed control
contracts carried out by Amenity Assured
contractors.
� 183 candidates have taken the new BASIS
Field Sales and Technical Staff course and
examination.
� 77 managers have completed the BASIS
POWER (Protection of water, the
environment and recommendations)
course.
� 8,089 candidates were awarded with the
Certificate of Competence in the Safe Use
of Pesticides from City and Guilds NPTC.
� 125 amenity members are on the National
Register of Sprayer Operators.
BASIS Home Page
NPTC Home Page
30
Pesticides in the UK

The issuePesticides are widely used by members of the
public in the home and garden (also known as
‘amateur use’). Although the quantities used
by any individual are tiny, the number of
gardeners in the country using pesticides is
estimated to be around 6-7 million. This means
that the total quantity of pesticide used in the
home or garden, while still small in relation to
farm use, is significant. Whilst home and
garden products present a much lower risk
than professional products, their use by large
numbers of untrained individuals raises special
issues. The Government’s UK Pesticides
Strategy aims to encourage best practice and
to ensure the safe disposal of unused products.
Work of the action plan groupThe group has continued to develop its
programme promoting best practice, largely
driven by the results of the survey of this
sector undertaken in 2007.
The group has also considered the data from
the National Poisons Information Service on
the incidence of poisonings by amateur
products, paying particular attention to
incidents involving small children.
National Poisons Information Service
Key activities/measures include:
� restricting pack sizes to sufficient for a
single season of use;
� improving label instructions on safe
container disposal;
� distribution of publicity material
(including via retailers);
� and development of training courses for
garden centre staff.
Future work will focus on:
� controls to minimise the risk of incidents
involving children;
� updating information on local authority
disposal facilities;
� and developing increasingly robust
indicators.
Work of the Pesticides ForumThe Pesticides Forum did not discuss amateur
uses specifically in 2008. However, a number
of subjects covered had implications for
amateur use. The most important of these
was an agenda item relating to ‘container
design, the avoidance of spillages, and
appropriate disposal and recycling of
containers’. Although these discussions
focussed on agricultural pesticide containers, it
was clear that any improvements hold
significant potential benefits for home and
garden users of pesticides.
31
Pesticides in the UK
Part 6: best practice in amateur (home and garden) use
IndicatorsLast year’s indicators report contained details
of disposal practice and facilities. These were
based on information contained in the PSD
survey. The survey showed that 35% of
amateur users dispose of unused or unwanted
pesticides at a household waste or recycling
centre, or use a local authority collection
service. The remainder of users adopt practices
which either do not accord with these ‘best
practice’ measures or are unknown. The survey
also showed that there was a long way to go
in terms of local authorities providing suitable
disposal facilities.
Resource constraints mean that it is not
practical to conduct such a survey on an
annual basis but the Forum understands that
the Government intends to conduct a similar
enquiry in 2010 to review progress. The group
will provide data in 2009 on the number of
local authorities providing civic amenity
facilities and a ‘chemical safe’ facility as a basis
for comparison with the 2003 and 2006 data.
32
Pesticides in the UK
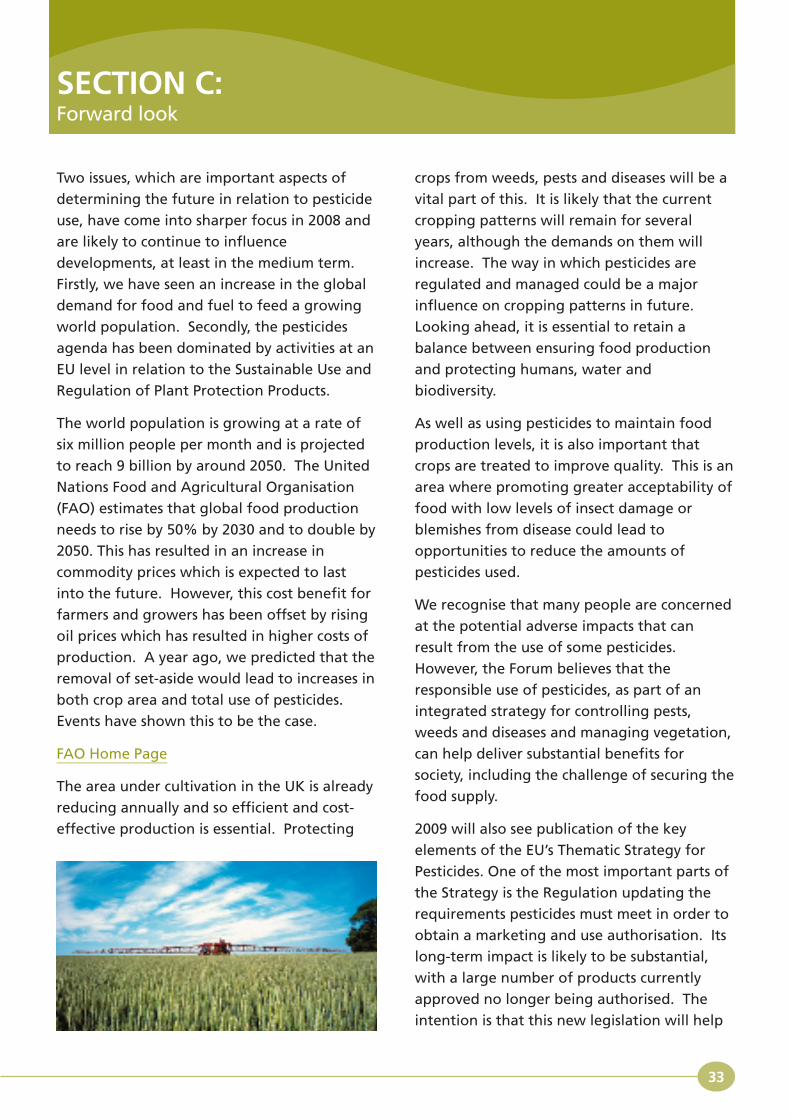
Two issues, which are important aspects of
determining the future in relation to pesticide
use, have come into sharper focus in 2008 and
are likely to continue to influence
developments, at least in the medium term.
Firstly, we have seen an increase in the global
demand for food and fuel to feed a growing
world population. Secondly, the pesticides
agenda has been dominated by activities at an
EU level in relation to the Sustainable Use and
Regulation of Plant Protection Products.
The world population is growing at a rate of
six million people per month and is projected
to reach 9 billion by around 2050. The United
Nations Food and Agricultural Organisation
(FAO) estimates that global food production
needs to rise by 50% by 2030 and to double by
2050. This has resulted in an increase in
commodity prices which is expected to last
into the future. However, this cost benefit for
farmers and growers has been offset by rising
oil prices which has resulted in higher costs of
production. A year ago, we predicted that the
removal of set-aside would lead to increases in
both crop area and total use of pesticides.
Events have shown this to be the case.
FAO Home Page
The area under cultivation in the UK is already
reducing annually and so efficient and cost-
effective production is essential. Protecting
crops from weeds, pests and diseases will be a
vital part of this. It is likely that the current
cropping patterns will remain for several
years, although the demands on them will
increase. The way in which pesticides are
regulated and managed could be a major
influence on cropping patterns in future.
Looking ahead, it is essential to retain a
balance between ensuring food production
and protecting humans, water and
biodiversity.
As well as using pesticides to maintain food
production levels, it is also important that
crops are treated to improve quality. This is an
area where promoting greater acceptability of
food with low levels of insect damage or
blemishes from disease could lead to
opportunities to reduce the amounts of
pesticides used.
We recognise that many people are concerned
at the potential adverse impacts that can
result from the use of some pesticides.
However, the Forum believes that the
responsible use of pesticides, as part of an
integrated strategy for controlling pests,
weeds and diseases and managing vegetation,
can help deliver substantial benefits for
society, including the challenge of securing the
food supply.
2009 will also see publication of the key
elements of the EU’s Thematic Strategy for
Pesticides. One of the most important parts of
the Strategy is the Regulation updating the
requirements pesticides must meet in order to
obtain a marketing and use authorisation. Its
long-term impact is likely to be substantial,
with a large number of products currently
approved no longer being authorised. The
intention is that this new legislation will help
33
SECTION C:Forward look

to reduce dependency on pesticides and
stimulate the development of alternative ways
of controlling pests, weeds and diseases. But
we need to recognise, and be prepared to deal
with, the challenges that may arise from
relying on a smaller range of pesticide
products.
The other key element of the Strategy is the
Directive on the Sustainable Use of Pesticides.
This will call for Member States to develop
National Action Plans to reduce dependency
on pesticides and the risks that can arise from
their use (the UK Government’s Pesticides
Strategy already does this in the UK). The
Directive will help improve usage practice by
ensuring better:
� training of operators;
� controls on sales;
� testing of equipment;
� promotion of integrated approaches;
� protection of watercourses; and
� use of pesticides in amenity and special
conservation areas.
Positive stakeholder engagement will be
necessary to respond to these challenges and
to make the most of the opportunities arising
from the implementation of the legislation.
In addition, the effects of the new EC MRL
Regulation 396/2005, which came into force in
September 2008 and sets MRLs for a wider
range of crop/commodity combinations, will
start to become apparent. Where data have
not been supplied to support a higher level,
the MRL will be set at the limit of
determination (the lowest level where
analytical methods can quantify the presence
of the pesticide). The Pesticides Residues
Committee expects this to mean that more
residues are reported that exceed these new
MRLs. This does not necessarily mean that
there are more residues in foodstuffs but
rather that the basis on which the analysis and
reporting is carried out has changed.
There is, therefore, plenty of work for the
Pesticides Forum to do in future, advising on
measures to minimise adverse impacts and
helping to inform public debate. The UK
Pesticides Strategy provides an excellent basis
and structure for dealing with these issues as
they emerge. The Pesticides Forum will
continue to actively encourage best practice in
sustainable use. In this way the UK can
continue to grow the amount and quality of
food that is demanded, and ensure the safety
of transport networks, whilst protecting
human health, water, biodiversity and the
wider environment.
EU Thematic Strategy for Pesticides
MRLs General Guidance
34
Pesticides in the UK
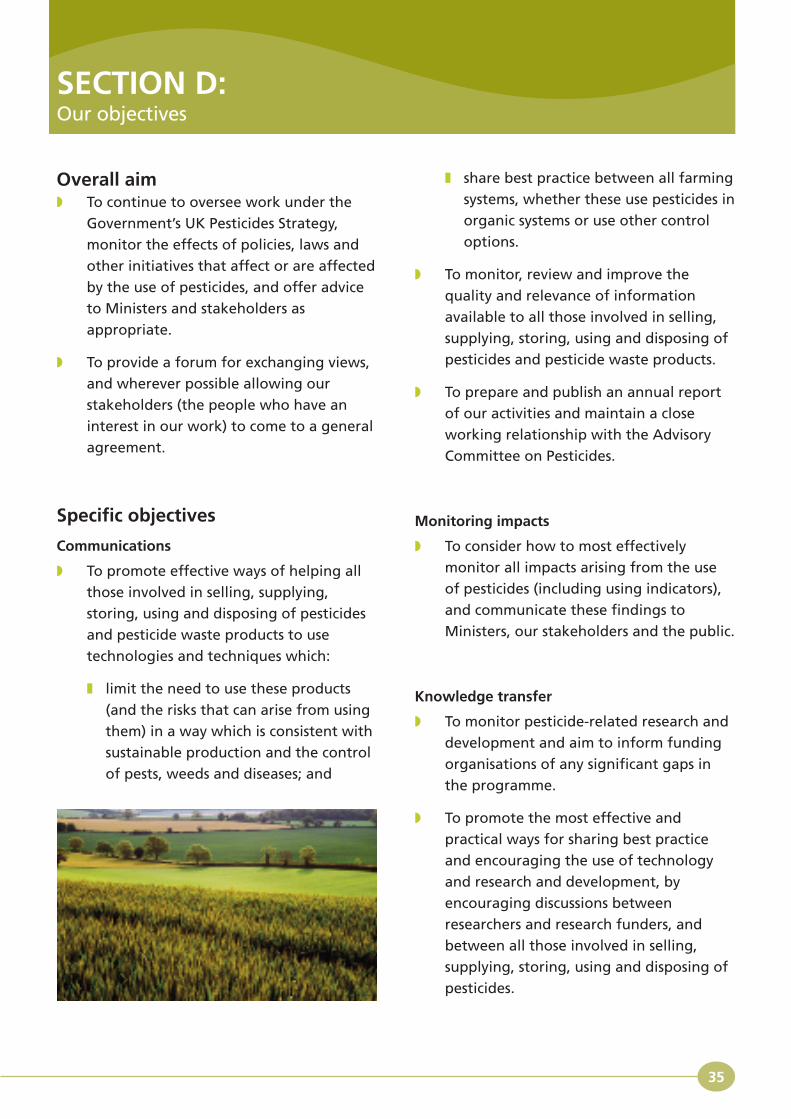
Overall aim� To continue to oversee work under the
Government’s UK Pesticides Strategy,
monitor the effects of policies, laws and
other initiatives that affect or are affected
by the use of pesticides, and offer advice
to Ministers and stakeholders as
appropriate.
� To provide a forum for exchanging views,
and wherever possible allowing our
stakeholders (the people who have an
interest in our work) to come to a general
agreement.
Specific objectives
Communications
� To promote effective ways of helping all
those involved in selling, supplying,
storing, using and disposing of pesticides
and pesticide waste products to use
technologies and techniques which:
� limit the need to use these products
(and the risks that can arise from using
them) in a way which is consistent with
sustainable production and the control
of pests, weeds and diseases; and
� share best practice between all farming
systems, whether these use pesticides in
organic systems or use other control
options.
� To monitor, review and improve the
quality and relevance of information
available to all those involved in selling,
supplying, storing, using and disposing of
pesticides and pesticide waste products.
� To prepare and publish an annual report
of our activities and maintain a close
working relationship with the Advisory
Committee on Pesticides.
Monitoring impacts
� To consider how to most effectively
monitor all impacts arising from the use
of pesticides (including using indicators),
and communicate these findings to
Ministers, our stakeholders and the public.
Knowledge transfer
� To monitor pesticide-related research and
development and aim to inform funding
organisations of any significant gaps in
the programme.
� To promote the most effective and
practical ways for sharing best practice
and encouraging the use of technology
and research and development, by
encouraging discussions between
researchers and research funders, and
between all those involved in selling,
supplying, storing, using and disposing of
pesticides.
35
SECTION D:Our objectives

36
ANNEX A:Pesticides Strategy Framework
Stra
teg
y A
ims
and
Ob
ject
ives
Pest
icid
es F
oru
m (
incl
ud
ing
Su
b-G
rou
ps)
Hu
man
Hea
lth
Act
ion
Fram
ewo
rk
Res
iden
ts a
nd
Bys
tan
der
s A
ctio
n P
lan
Co
nsu
mer
s A
ctio
n P
lan
Use
rs A
ctio
n P
lan
Ind
ust
ry In
itia
tive
s
Vo
lun
tary
Init
iati
ve
Am
enit
y Fo
rum
Ass
ure
d C
rop
s Sc
hem
es
Ince
nti
ves
Envi
ron
men
tal S
chem
es
Sin
gle
pay
men
t/C
ross
Co
mp
lian
ce
Res
earc
h a
nd
dev
elo
pm
ent
Go
vern
men
t
Ind
ust
ry
Join
t p
rog
ram
mes
ND
PB a
nd
NG
O
Ava
ilab
ility
Act
ion
Fram
ewo
rk
Ava
ilab
ility
Act
ion
Pla
n
Envi
ron
men
t A
ctio
nFr
amew
ork
Wat
er A
ctio
n P
lan
Bio
div
ersi
ty A
ctio
n P
lan
Am
enit
y U
se A
ctio
nFr
amew
ork
Am
enit
y U
se A
ctio
n P
lan
Am
ateu
r U
se A
ctio
nFr
amew
ork
Am
ateu
r U
se A
ctio
n P
lan
Leg
isla
tio
n
Pest
icid
es
Wat
er
Envi
ron
men
tal
Was
te M
anag
emen
t
Foo
d S
afet
y
Hea
lth
an
d S
afet
y
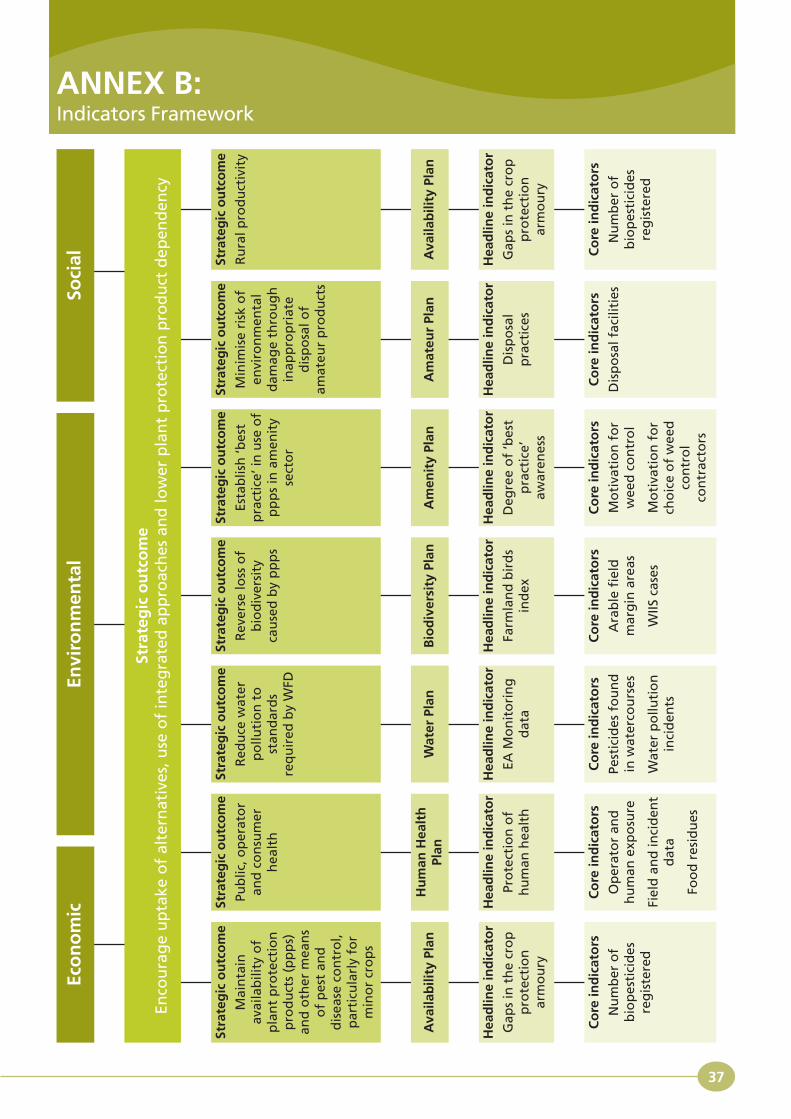
37
ANNEX B:Indicators Framework
Eco
no
mic
Envi
ron
men
tal
Stra
teg
ic o
utc
om
eEn
cou
rag
e u
pta
ke o
f al
tern
ativ
es, u
se o
f in
teg
rate
d a
pp
roac
hes
an
d lo
wer
pla
nt
pro
tect
ion
pro
du
ct d
epen
den
cy
Stra
teg
ic o
utc
om
e
Mai
nta
inav
aila
bili
ty o
fp
lan
t p
rote
ctio
np
rod
uct
s (p
pp
s)an
d o
ther
mea
ns
of
pes
t an
dd
isea
se c
on
tro
l,p
arti
cula
rly
for
min
or
cro
ps
Ava
ilab
ility
Pla
n
Hea
dlin
e in
dic
ato
r
Gap
s in
th
e cr
op
pro
tect
ion
arm
ou
ry
Co
re in
dic
ato
rs
Nu
mb
er o
fb
iop
esti
cid
esre
gis
tere
d
Stra
teg
ic o
utc
om
e
Pub
lic, o
per
ato
ran
d c
on
sum
erh
ealt
h
Hu
man
Hea
lth
Plan
Hea
dlin
e in
dic
ato
r
Pro
tect
ion
of
hu
man
hea
lth
Co
re in
dic
ato
rs
Op
erat
or
and
hu
man
exp
osu
re
Fiel
d a
nd
inci
den
td
ata
Foo
d r
esid
ues
Stra
teg
ic o
utc
om
e
Red
uce
wat
erp
ollu
tio
n t
ost
and
ard
sre
qu
ired
by
WFD
Wat
er P
lan
Hea
dlin
e in
dic
ato
r
EA M
on
ito
rin
gd
ata
Co
re in
dic
ato
rs
Pest
icid
es f
ou
nd
in w
ater
cou
rses
Wat
er p
ollu
tio
nin
cid
ents
Stra
teg
ic o
utc
om
e
Rev
erse
loss
of
bio
div
ersi
tyca
use
d b
y p
pp
s
Bio
div
ersi
ty P
lan
Hea
dlin
e in
dic
ato
r
Farm
lan
d b
ird
sin
dex
Co
re in
dic
ato
rs
Ara
ble
fie
ldm
arg
in a
reas
WIIS
cas
es
Stra
teg
ic o
utc
om
e
Esta
blis
h ‘b
est
pra
ctic
e’ in
use
of
pp
ps
in a
men
ity
sect
or
Am
enit
y Pl
an
Hea
dlin
e in
dic
ato
r
Deg
ree
of
‘bes
tp
ract
ice’
awar
enes
s
Co
re in
dic
ato
rs
Mo
tiva
tio
n f
or
wee
d c
on
tro
l
Mo
tiva
tio
n f
or
cho
ice
of
wee
dco
ntr
ol
con
trac
tors
Stra
teg
ic o
utc
om
e
Min
imis
e ri
sk o
fen
viro
nm
enta
ld
amag
e th
rou
gh
inap
pro
pri
ate
dis
po
sal o
fam
ateu
r p
rod
uct
s
Am
ateu
r Pl
an
Hea
dlin
e in
dic
ato
r
Dis
po
sal
pra
ctic
es
Co
re in
dic
ato
rs
Dis
po
sal f
acili
ties
Stra
teg
ic o
utc
om
e
Ru
ral p
rod
uct
ivit
y
Ava
ilab
ility
Pla
n
Hea
dlin
e in
dic
ato
r
Gap
s in
th
e cr
op
pro
tect
ion
arm
ou
ry
Co
re in
dic
ato
rs
Nu
mb
er o
fb
iop
esti
cid
esre
gis
tere
d
Soci
al

We wish to thank the following for the use of their
pictures:
Peter Hall (H E Hall and sons) for the front cover
picture and also pictures at pages 17, 24, 25 and 32.
Emily Ledder (Natural England) pages 3 and 26.
38
Acknowledgements
© Crown copyright 2009
Copyright in the typographical arrangement and designrests with the Crown.
This publication may be re-used free of charge in anyformat or medium provided that it is re-used accuratelyand not used in a misleading context. The material mustbe acknowledged as crown copyright and the title of thepublication specified.
39
If you have any comments or views on this
report please do not hesitate to contact us
at the address below:
Pesticides Forum Secretariat, c/o Pesticides
Safety Directorate, Room 214,
Mallard House, Kings Pool, 3 Peasholme
Green, York, YO1 7PX
Email: [email protected]


![ENDURE Mobility Report - Endure Project · Entrepreneurship [ENDURE MOBILITY REPORT] ... The selection process ... were related to the identification of their targets,](https://img.pdfslide.us/doc/110x75/5b1d590d7f8b9a64508b5651/endure-mobility-report-endure-entrepreneurship-endure-mobility-report-.jpg)