Embed Size (px)
Citation preview
www.nt.gov.au/lrm
Pesticides and nutrients in groundwater of the Darwin
region
Julia Schult
Report No. 21/2016D
November 2016
Groundwater Quality of the Darwin rural area 2016 ii
Bibliographic Reference
Schult, J. 2016. Pesticides and nutrients in groundwater of the Darwin region. Northern
Territory Department of Environment and Natural Resources, Report No. 21/2016D.
Palmerston.
ISBN 9781743501177 Pesticides and nutrients in groundwater of the Darwin region.
For further information contact:
Julia Schult
Department of Land Resource Management
PO Box 496, Palmerston, NT, 0831
Australia
Copyright and Disclaimer
© 2016 Northern Territory Government
Copyright resides with the Northern Territory Government, 2016. Information contained in
this publication may be copied or reproduced for study, research, information, or educational
purposes, subject to inclusion of an acknowledgment of the source.
Cover Photograph: Rodney Metcalfe sampling a bore in the Darwin rural area. (Photo: Liza
Schenkel)
Acknowledgments
I would like to thank all the landholders who participated in this project and provided access
to their properties and bores. Thanks also to Roger Farrow, Rob Chaffer, Liza Schenkel and
Rodney Metcalfe who did the field work and client liaison for this project, and to Simon
Townsend for helpful comments on drafts of this document.
Groundwater Quality of the Darwin rural area 2016 3
1. Summary
This study is the second in a series of surveys of baseline groundwater quality in water
allocation plan areas of the Top End.
In particular, this study aimed to:
1. investigate whether any pesticides are currently present in groundwater of the Darwin
region
2. investigate current nutrient concentrations in groundwater of the region
3. compare historical pesticide and nutrient data to current results where available
The survey examined 24 bores in the Howard East and Berry Springs water planning
regions. The bores were selected to be spread across the aquifer and included both private
equipped bores used for domestic or irrigation purposes and NT Government monitoring
bores. Sites included bores on uncleared, agricultural, and rural domestic blocks.
Traces of 8 different pesticides were detected in this study. Six of the 24 bores contained at
least one herbicide or insecticide while the remaining 18 bores had no detections at all. No
more than three different chemicals were found at any one site.
Guideline values were only available for 2 of the chemicals and the detected concentrations
were well below these. All other chemicals were detected at very low concentrations close to
their respective limits of detection.
Nitrate concentrations were low in comparison to other regions of Australia but variable
across the sampling region. Significantly higher nitrate concentrations were found under
agricultural land use than other land use categories. All concentrations were well below the
Australian drinking water guideline value.
Overall, the current levels of groundwater contamination of the Darwin rural area with
pesticides and nitrate are very low and are not a cause for concern. However, the detection
of any aquifer contamination should serve as a reminder to apply best practice in the
storage, application and disposal of chemicals and fertilisers.
Groundwater Quality of the Darwin rural area 2016 4
2. Introduction
2.1. Background and study aims
Dry season surface water monitoring of streams in the Darwin, Katherine and Douglas-Daly
regions between 2011 and 2015 detected small traces of herbicides and insecticides
((Schult 2012, Schult 2014, Schult 2016)). Since dry season flows in these regions are
almost entirely supplied by groundwater, the Department of Environment and Natural
Resources commenced a series of baseline studies of selected aquifers of the Top End in
2015 to examine groundwater quality with a focus on chemical contaminants. The first
groundwater quality survey covered the Tindal aquifer in the Katherine region (Schult 2016).
This current study is the second in the series and focussed on groundwater resources in the
Darwin rural area.
In particular, this study aimed to:
1. investigate whether any pesticide residues are currently present in groundwater of
the Darwin region
2. investigate current nutrient concentrations, particularly nitrate (NO3), in groundwater
of the region
3. where available, compare historical pesticide and nitrate data to current results to
detect any trends
Recently, contamination of ground and surface water with chemicals from fire-fighting foams,
(per- and polyfluoroalkyl substances or PFAS) has emerged as an issue of concern in the
Northern Territory. The work reported here was unrelated to this issue and did not test
samples for PFAS chemicals.
2.2. Definition of terms
The term “pesticide” means a chemical substance that is used to destroy or deter any pest.
This can include weeds, insects, fungi and other pests. The term pesticide as used in this
report therefore encompasses both herbicides and insecticides as well as other substances
including fungicides, rodenticides and insect repellents.
2.3. Groundwater in the Darwin Region
The aquifers of the region have been well studied since the 1980s and there is much
information available on their characteristics (e.g.Jolly 1983, Jolly and Yin Foo 1988, Verma
1995, Hatton et al. 1998, Radke et al. 1998, Tien 2002, Fell-Smith and Sumner 2011, Schult
2014).
Most of the groundwater in the Darwin rural area is sourced from two karst aquifers: the
Koolpinyah dolomite in the Howard Springs area and the Berry Springs Dolostone. These
cavernous fractured limestone formations have a porous texture and act like sponges to hold
large amounts of water. In the wet season, the aquifers in the Darwin region are recharged
from rainwater that infiltrates the soil and unconfined shallower aquifers until it reaches the
karstic layers; or by direct recharge through areas where the karst formations reach the
surface.
The Koolpinyah dolomite and Berry Springs dolostone aquifers are subject to water
allocation planning which resulted in the recent declaration of the Berry Springs Water
Groundwater Quality of the Darwin rural area 2016 5
Allocation Plan (WRD 2016) and is continuing with the current development of a Howard
East Water Allocation Plan. Other aquifers also exist in the region but are not currently
subject to water allocation planning.
The geology of an aquifer naturally influences the water quality of groundwater. The minerals
dissolved in the water reflect the type of rock water is stored in.
Changes to groundwater quality can occur when chemicals used at the surface reach the
water table by leaching through the soil or more directly through contamination of bores and
sinkholes. Because it takes time for these substances to move through the soil and the
aquifer, shallow, unconfined areas are most at risk from surface contamination since there is
no physical barrier of impervious rock. Processes that generate a change in groundwater
quality can be natural or caused by human activities.
Human-made chemicals, including pesticides, can enter aquifers and contaminate
groundwater. Pesticides are used widely in the community with uses ranging from small
scale applications around the home and garden, termite control around buildings, larger
scale herbicide spraying around infrastructure and roads to the control of noxious weeds on
rural blocks and applications of pesticides to crops and livestock by farmers and the
agricultural industry.
Where these chemicals are stored or applied incorrectly, they can enter the groundwater, for
example via backflow through faulty valves of fertigation systems or when excessive
amounts of chemicals or fertilisers are applied to crops and leach through the soil into the
aquifer below. Chemicals that are highly water-soluble pose a higher risk to groundwater
because they are easily carried from the soil surface into the aquifer by rain or irrigation. In
Australia, the Australian Pesticides and Veterinary Medicines Authority (APVMA) regulates
the registration and use of pesticides.
Similarly, excess nutrients can also reach the water table. The most common anthropogenic
(human-generated) contaminant of groundwater is the nutrient nitrate. Nitrate occurs
naturally and is produced from the decomposition of organic material and the fixation of
atmospheric nitrogen by bacteria and its subsequent oxidation. These processes occur in
soils and plants. The main anthropogenic sources of nitrate are sewerage discharge, animal
waste and the agricultural application of industrial fertilisers which usually contain nitrogen in
the form of ammonia or nitrate. Another source of nitrate is atmospheric deposition of
nitrogen from burning fossil fuels.
While other nutrients, such as phosphorus or organically bound nitrogen adsorb to soil
particles and are therefore filtered out as water passes through the soil, nitrate is easily
dissolved in water and can be carried deep into the aquifer.
The removal of nitrate from soils only occurs if nitrate is taken up by plants for further growth,
or through the process of denitrification, the biological reduction of nitrate to molecular N2 (a
gas, which is released back into the atmosphere). This can only occur under certain
anaerobic soil conditions, however, these conditions are not common in the unsaturated
zone above the water table, so that once nitrate moves below the root zone of plants, it is
likely to persist and reach the aquifer below.
Groundwater Quality of the Darwin rural area 2016 6
Nitrate contamination of groundwater can potentially lead to the eutrophication of aquatic
ecosystems and cause algal blooms and other changes to the aquatic flora, when
contaminated groundwater is discharged to rivers and streams.
2.4. Current knowledge of groundwater quality
The NT Government’s Water Resources Division carries out regular sampling for general
water quality in selected monitoring bores but this does not routinely include pesticides or
nutrients.
Newly established bores are routinely sampled for a number of parameters to establish their
aquifer source and to determine if water is suitable for drinking. This analysis includes
sampling for nitrate, however, it is generally done to a detection limit that is unsuitable for
environmental applications. Prior to the early 2000s the results of this analysis were provided
to the NT government and stored in the Water Resources database, however, this
requirement has been removed for more recently established bores, so that the data is not
publicly available.
A comprehensive survey of groundwater quality in the Darwin region was conducted by
Geoscience Australia (formerly the Australian Geological Survey Organisation) in 1995
(Radke et al. 1998). The survey investigated a large number of bores in the Darwin rural
area with the aim of providing baseline information on groundwater quality including the
presence of pesticides. At the time, no pesticides were detected in any of the sampled bores
at detection limits of 0.1 -0.01 µg/L depending on the individual chemical.
In 2004 a review of pesticide sampling in the Darwin region was undertaken (Waugh and
Padovan 2004) which concluded that there had been only a small amount of small scale,
project-specific sampling in surface and groundwater, and that pesticide monitoring had
often not been the primary objective of the studies. The report list one study in which 24
bores in the Darwin rural area were tested in 1992/93. Three pesticides (atrazine, prometryn
and heptoachlor epoxide) were detected in 2 bores at concentrations of 0.04-0.07 µg/L. The
study itself has not been published and detection limits and results cannot be verified.
3. Methods
Site selection
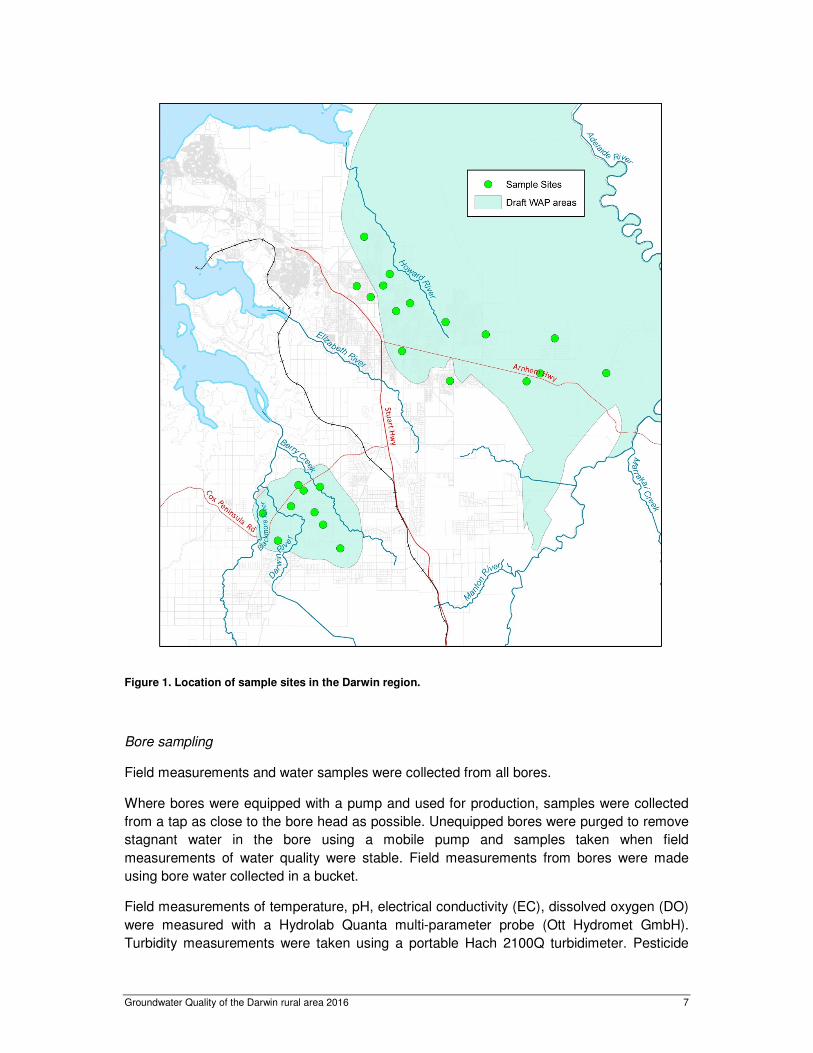
The survey examined 24 bores in the Darwin region, 15 of these were located in the Howard
Springs and 9 in the Berry Springs area (Figure 1). Sites were selected to be spread across
the aquifer and included both private bores equipped with pumps and used for domestic or
irrigation purposes and NT Government monitoring bores. Bores were situated within
different land uses including agricultural, rural domestic, and uncleared blocks. Each site
was allocated one of four land use categories (agricultural (mangoes), agricultural
(vegetables), rural/domestic or natural environment) according to the immediate surrounding
area using Google Earth imagery.
Groundwater Quality of the Darwin rural area 2016 7
Figure 1. Location of sample sites in the Darwin region.
Bore sampling
Field measurements and water samples were collected from all bores.
Where bores were equipped with a pump and used for production, samples were collected
from a tap as close to the bore head as possible. Unequipped bores were purged to remove
stagnant water in the bore using a mobile pump and samples taken when field
measurements of water quality were stable. Field measurements from bores were made
using bore water collected in a bucket.
Field measurements of temperature, pH, electrical conductivity (EC), dissolved oxygen (DO)
were measured with a Hydrolab Quanta multi-parameter probe (Ott Hydromet GmbH).
Turbidity measurements were taken using a portable Hach 2100Q turbidimeter. Pesticide
Groundwater Quality of the Darwin rural area 2016 8
and herbicide samples were collected in three separate glass bottles for pesticide, herbicide
and glyphosate analysis. All herbicide and pesticide samples were refrigerated in the field
and upon return to the laboratory. Samples were analysed by the Queensland Department of
Health’s Forensic and Scientific Services for a large range of pesticides and some other
common contaminants. A total of 180 substances were tested for, including organochlorine
pesticides (e.g. DDT, Dieldrin), organophosphate pesticides (e.g. chlorpyrifos), synthetic
pyrethroids, triazine herbicides, glyophosate (“Roundup”) and other common herbicides. A
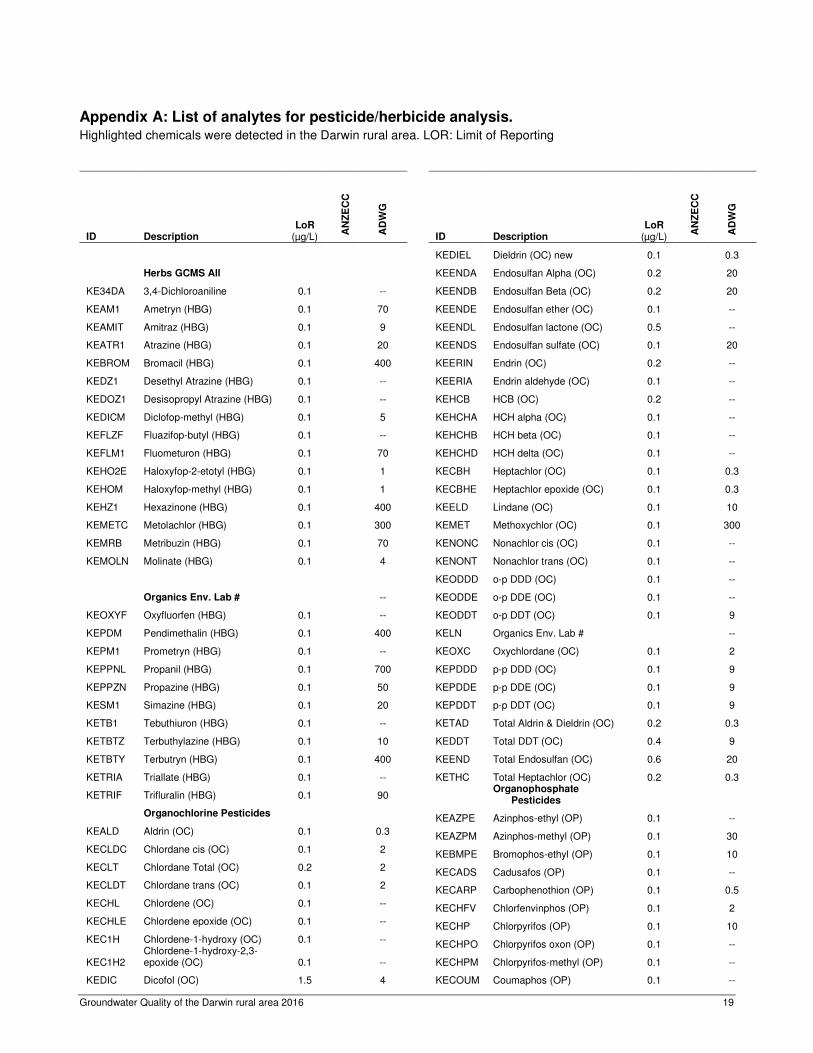
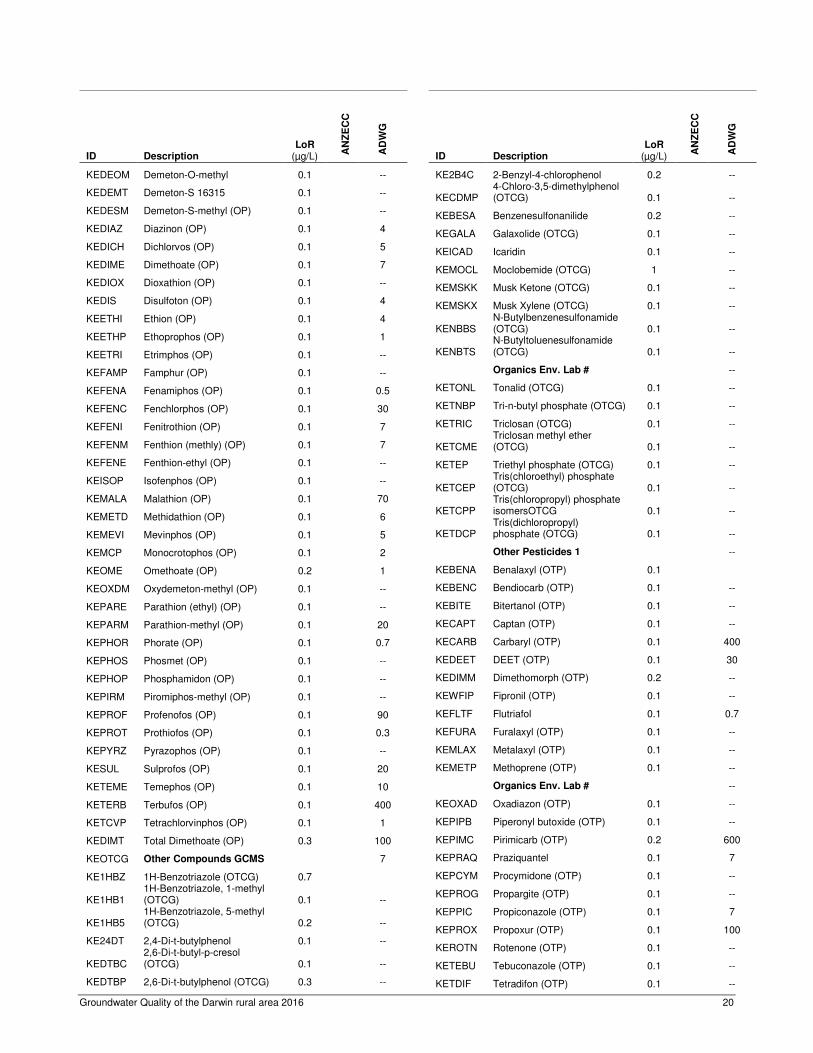
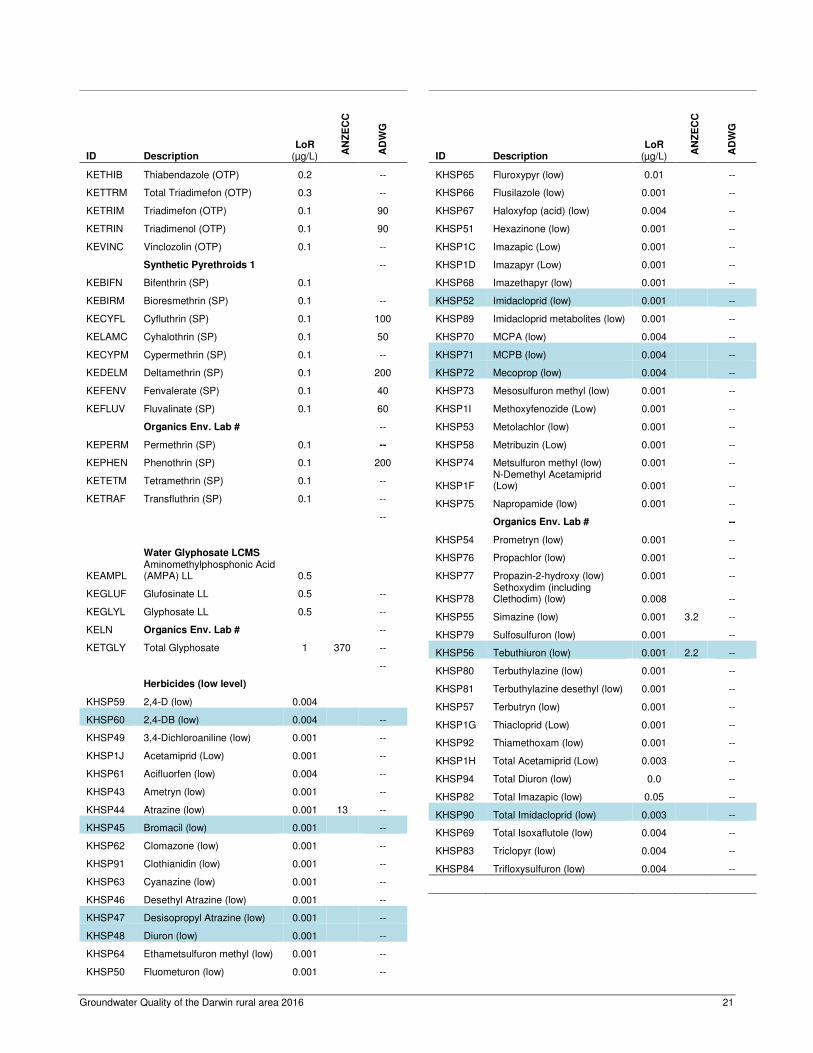
full list of analytes and their Limits of Reporting (LOR) is provided in Appendix A. The LOR is
currently used by many laboratories in place of a limit of detection.
Nutrient samples were collected in polyethylene sample bottles for total and soluble
nutrients. Soluble nutrient samples were filtered in the field using through Minisart 0.45 µm
PES a syringe filters. All nutrient samples were stored on ice in the field and frozen on return
to the laboratory. Samples were analysed by the Northern Territory Environmental
Laboratories (NTEL Intertek) for total nitrogen and total phosphorus, nitrite (NO2), nitrate
(NO3), ammonia (NH3) and filterable phosphorus (FRP). Samples for general water quality
parameters (alkalinity, hardness, pH, conductivity) and major cations (K+, Na2+, Ca2+, Mg2+)
and anions (Cl-, HCO3-, SO4
-) were collected in polyethylene bottles and kept refrigerated
until they were analysed by NTEL Intertek, Darwin. All samples were analysed according to
APHA (2005) standard methods.
Historical data
For comparison of historical nitrate concentrations with current results, data from the DENR
water quality database was used where available. Bore water quality is routinely tested when
a bore is first established and the data is held in the DENR database. Historical NO3 data
were available for most of the sites and were collected between 1968 and 2000.
Some of the bores that were sampled in this survey were included in a previous assessment
of pesticides in Darwin region groundwater in 1995 (Radke et al. 1998).
4. Results
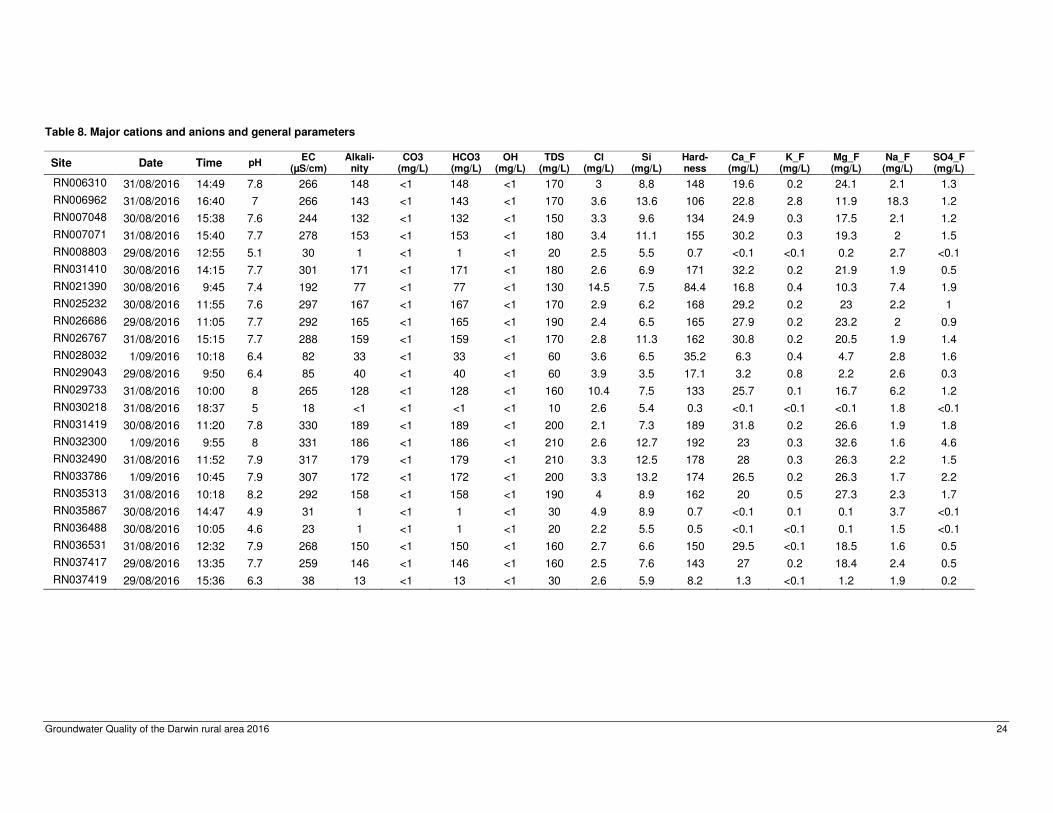
4.1. General water quality
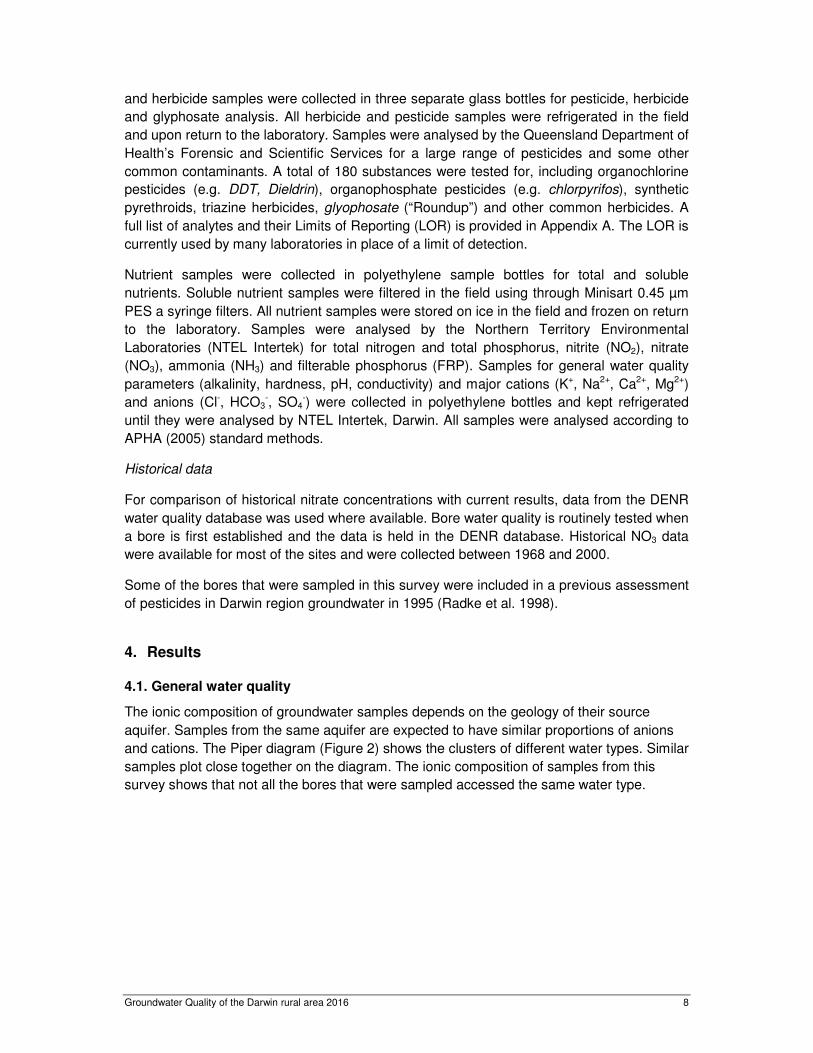
The ionic composition of groundwater samples depends on the geology of their source
aquifer. Samples from the same aquifer are expected to have similar proportions of anions
and cations. The Piper diagram (Figure 2) shows the clusters of different water types. Similar
samples plot close together on the diagram. The ionic composition of samples from this
survey shows that not all the bores that were sampled accessed the same water type.
Groundwater Quality of the Darwin rural area 2016 9
Figure 2. Piper plot of ionic composition of sampled bores. Samples with similar water types plot close together. Each dot represents one sample.
The majority of samples were dominated by calcium and magnesium bicarbonate ions
indicative of the Koolpinyah dolomite and Berry Springs dolostone aquifers (Figure 2, Group
1). These waters typically have an electrical conductivity of 200-350 µS/cm. Four of the
bores were sodium chloride dominated with low pH and low electrical conductivity (<50
µS/cm) (Figure 2, Group 2). Another group of three samples was very low in electrical
conductivity but contained higher proportions of calcium bicarbonate (Figure 2, Group 3).
For the summary of field and general parameter data provided in Table 1 samples from
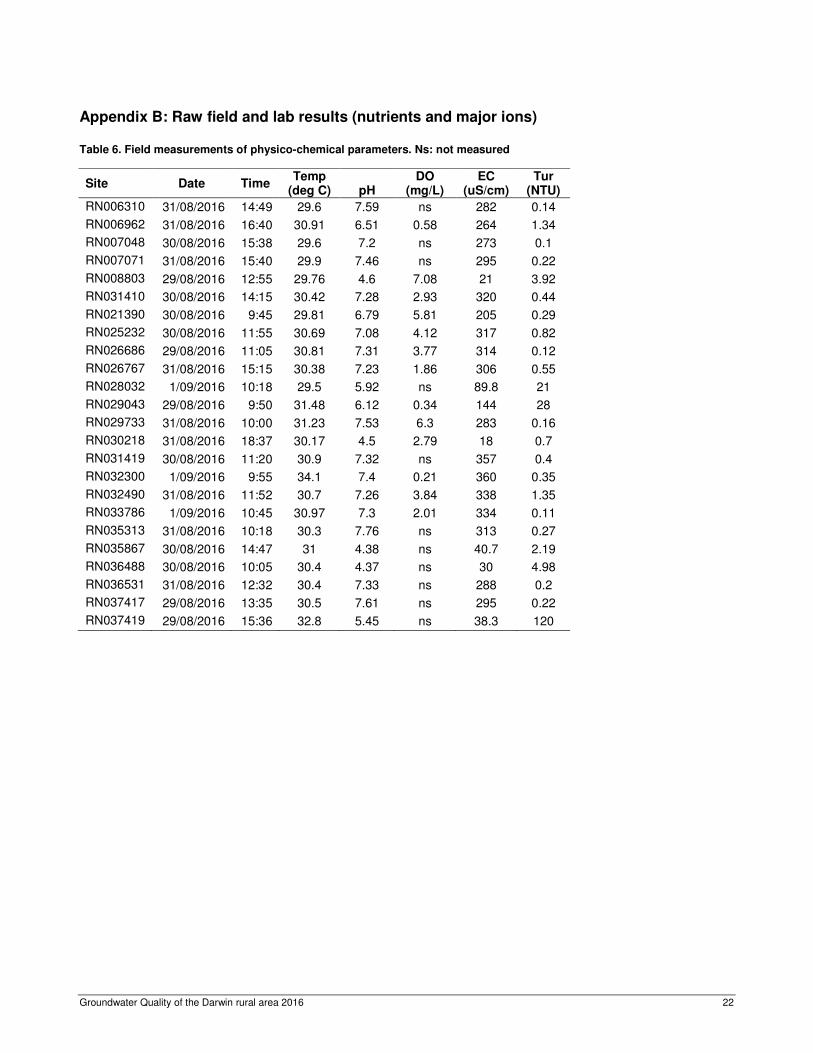
groups 2 and 3 were combined. Raw results for each bore are presented in Appendix B.
1
1
2
2
3
32
Groundwater Quality of the Darwin rural area 2016 10
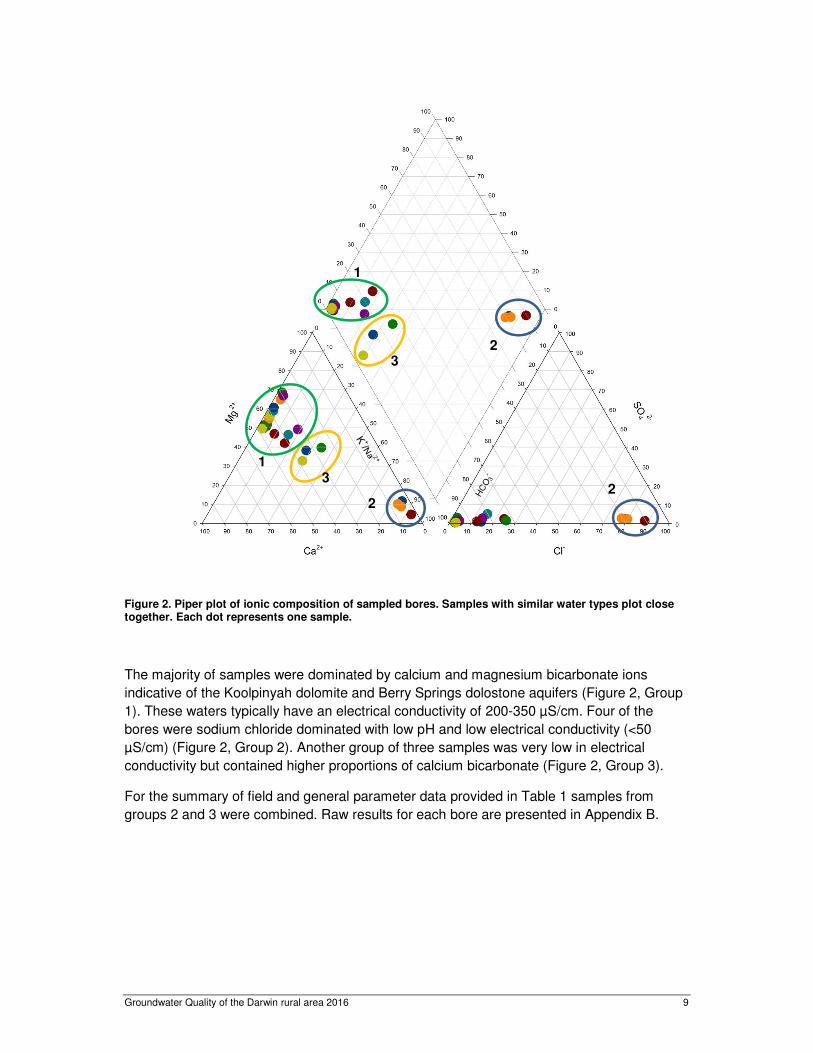
Table 1. Summary statistics of general water quality parameters in bores and springs in the Darwin region. SE: standard error of the mean.
Karst (n=17) Other (n=7)
Parameter (unit) Mean (SE) Median Max Min Mean (SE) Median Max Min
Field Measurements
Temperature (deg C) 30.7 (0.06) 30.5 34.1 29.6 30.73 (0.16) 30.40 32.80 29.50
Field pH* (units) na na 7.31 7.76 6.51 na na 4.60 6.12 4.37
DO (mg/L) 3.1 (0.20) 3.4 6.3 0.2 3.40 (1.14) 2.79 7.08 0.34
EC (µS/cm) 303 (2.20) 301 360 205 54.54 (6.59) 38.30 144.00 18.00
Turbidity (NTU) 0.4 (0.02) 0.2 1.35 0.1 25.83 (6.12) 4.98 120.00 0.70
Major ions
Lab pH* na na 7.7 8.2 7 na na 5.1 6.4 4.6
Lab EC (µS/cm) 281.9 (2) 283 331 192 43.9 (3.97) 31 85 18
Alkalinity (mg CaCO3/L) 154.3 (1.55) 156 189 77 12.8 (2.42) 1 40 0.5
CO3 (mg/L) <1 na <1 na na <1 na <1 na na
HCO3 (mg/L) 154.3 (1.55) 156 189 77 14.8 (2.93) 7 40 1
OH (mg/L) <1 na <1 na na <1 na <1 na na
TDS (mg/L) 176.5 (1.28) 170 210 130 32.9 (2.82) 30 60 10
Cl (mg/L) 4.1 (0.19) 3.15 14.5 2.1 3.2 (0.14) 2.6 4.9 2.2
Si (mg/L) 9.3 (0.15) 8.84 13.6 6.2 5.9 (0.23) 5.5 8.9 3.5
Hardness 153.8 (1.65) 159 192 84.4 9.0 (1.88) 0.7 35.2 0.3
Ca (mg/L) 26.2 (0.27) 26.8 32.2 16.8 1.6 (0.34) 0.05 6.3 0.05
K (mg/L) 0.4 (0.04) 0.2 2.8 0.05 0.2 (0.04) 0.05 0.8 0.05
Mg (mg/L) 21.4 (0.34) 21.2 32.6 10.3 1.2 (0.25) 0.2 4.7 0.05
Na (mg/L) 3.5 (0.24) 2.1 18.3 1.6 2.4 (0.11) 2.6 3.7 1.5
SO4 (mg/L) 1.5 (0.06) 1.25 4.6 0.5 0.3 (0.08) 0.05 1.6 0.05
*pH data unsuitable for calculation of mean due to log10 scale of pH units
na: not applicable
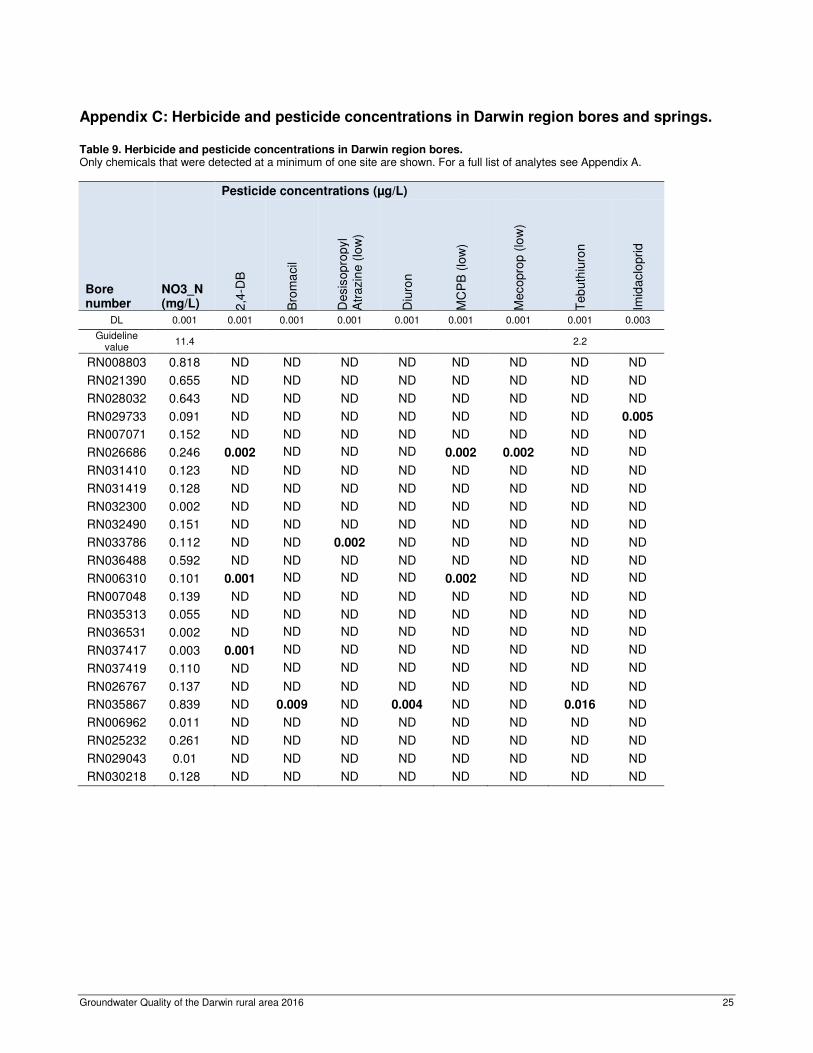
4.2. Pesticides
Traces of 8 different pesticides were detected during this study. Six of the 24 bores tested
contained at least one herbicide or insecticide while the remaining 18 bores had no
detections at all. No more than three different chemicals were found at any one site (Figure
3).
The most commonly detected chemical was
the herbicide 2,4-DB, which was found in
three of the bores. The herbicide MCPB was
found at 2 sites while the herbicides
tebuthiuron, diuron, bromacil, mecoprop and
desisopropyl atrazine, a breakdown product
of atrazine, were detected once each.
Imidacloprid, an insecticide, was also found
at only one site (Table 2). Raw results for
individual bores are presented in Appendix C.
Figure 3. Frequency of pesticide detection.
Groundwater Quality of the Darwin rural area 2016 11
Environmental guideline values are currently only available for one of the detected
pesticides, tebuthiuron. The detected concentrations of this herbicide were several orders of
magnitude below the trigger values (ANZECC and ARMCANZ 2000) for moderately
disturbed ecosystems (Table 2). The concentrations of all the pesticides without available
guidelines were very low and close to their respective reporting limits of 0.001 µg/L
(herbicides) or 0.003 µg/L (imidacloprid).
Table 2. Results of pesticide analysis for the Darwin region, 2016. Only detected pesticides are listed. For a complete list of analytes see Appendix A.
Analyte ANZECC Guideline
(µg/L)
Reporting Limit (µg/L)
% detection (No. of sites)
Max Concentration
(µg/L)
Herbicides
2,4-DB 0.001 12 (3) 0.002
Bromacil - 0.001 4 (1) 0.009
Desisopropyl atrazine - 0.001 4 (1) 0.002
Diuron - 0.001 4 (1) 0.002
MCPB - 0.001 8 (2) 0.002
Mecoprop - 0.001 4 (1) 0.002
Tebuthiuron 2.2 0.001 4 (1) 0.016
Insecticides
Total Imidacloprid - 0.003 4 (1) 0.005
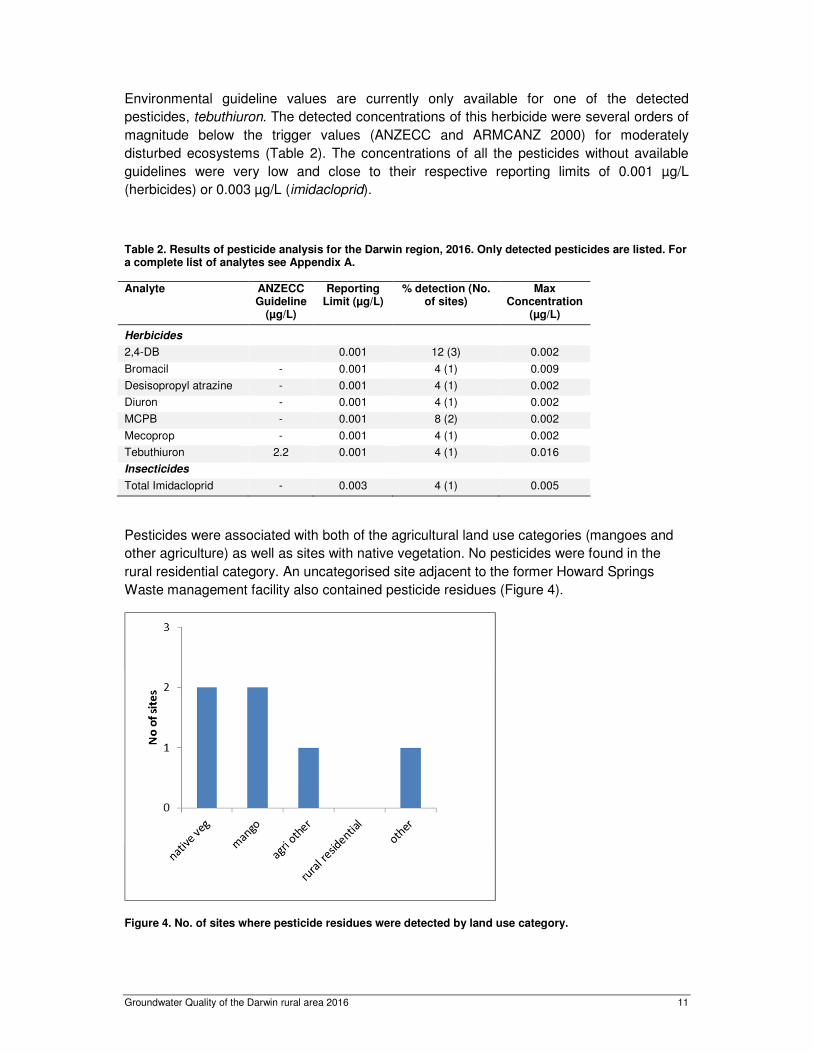
Pesticides were associated with both of the agricultural land use categories (mangoes and
other agriculture) as well as sites with native vegetation. No pesticides were found in the
rural residential category. An uncategorised site adjacent to the former Howard Springs
Waste management facility also contained pesticide residues (Figure 4).
Figure 4. No. of sites where pesticide residues were detected by land use category.
Groundwater Quality of the Darwin rural area 2016 12
4.1. Nutrients
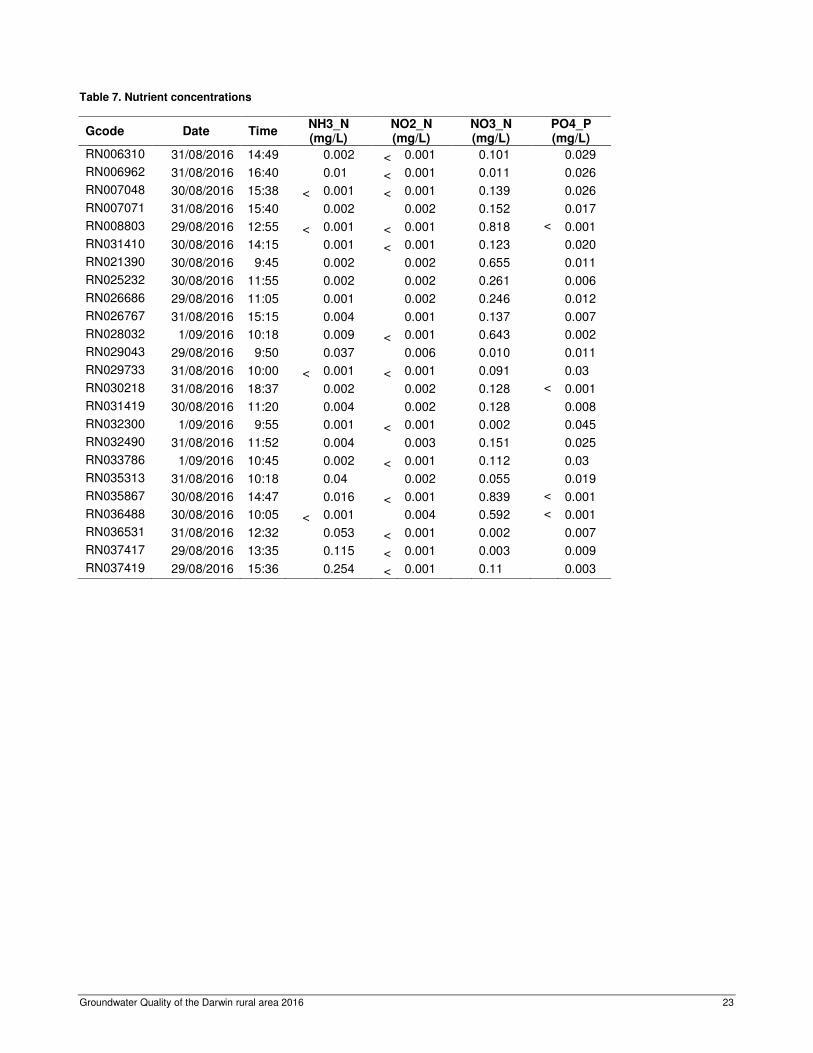
Soluble nutrient concentrations were low for nitrite (NO2), ammonia (NH3) and filterable
reactive phosphorus (FRP), with medians of <0.001, 0.002 and 0.011mg/L respectively. .
Nitrate concentrations were more variable across the aquifer and much higher with a mean
of 0.350 mg/L and values ranging from <0.001 mg/L to 1.85 mg/L (Table 3).
Table 3. Summary statistics for nutrient concentrations in bores and springs of the Darwin region (n=25). SE: standard error of the mean.
Parameter (unit) Mean SE Median Max Min
NO2_N (mg/L) <0.001 na <0.001 0.010 <0.001
NO3_N (mg/L) 0.230 (0.011) 0.128 0.840 0.002
FRP (mg/L) 0.014 (0.001) 0.011 0.050 <0.001
NH3_N (mg/L) 0.023 (0.002) 0.002 0.250 <0.001
Mean nitrate concentrations by land use ranged from 0.07 mg/L under native vegetation to
0.55 mg/L in non-mango agricultural areas (Table 4). Mean nitrate concentrations were
significantly higher under non-mango agricultural areas than under all other land uses
(p<0.005, one-way ANOVA).
Table 4. Mean NO3 (mg N/L) concentrations by land use category
Land Use Category n Mean (SD) Max Min
Horticulture (mangoes)
8 0.19 0.18 0.59 0.002
Agriculture (other) 4 0.55 0.32 0.818 0.091
Natural environments 6 0.07 0.06 0.139 0.002
Rural/domestic 4 0.10 0.12 0.261 0.010
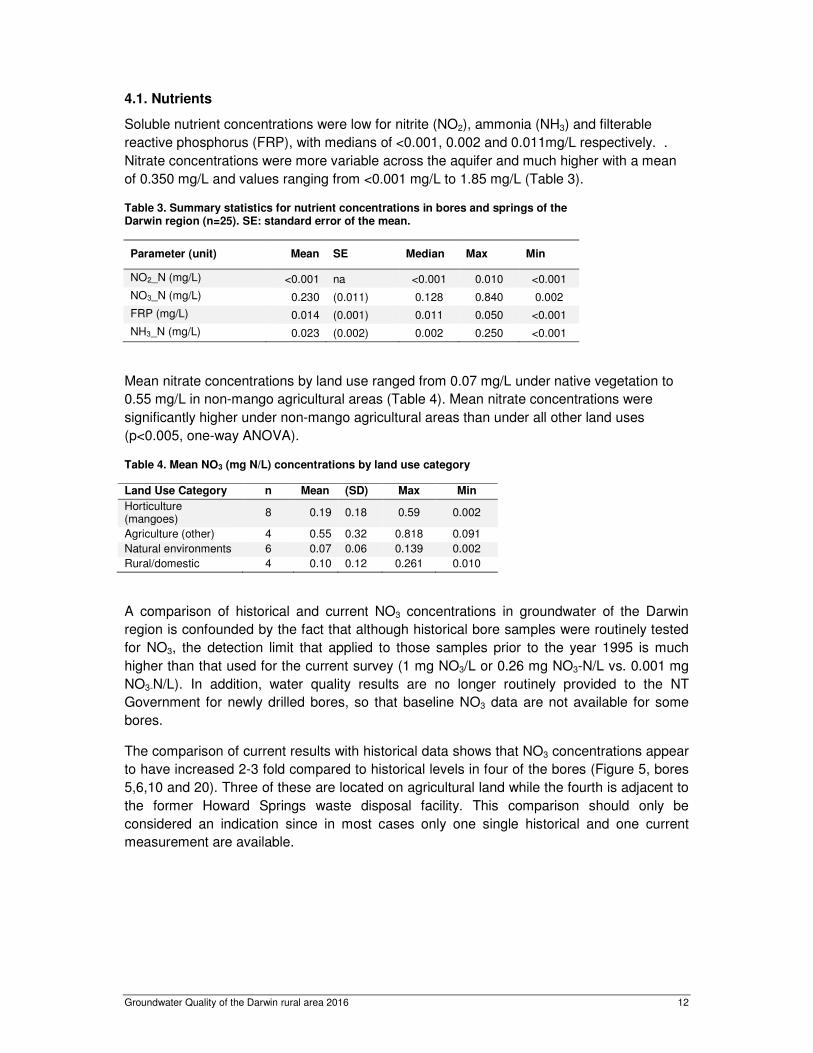
A comparison of historical and current NO3 concentrations in groundwater of the Darwin
region is confounded by the fact that although historical bore samples were routinely tested
for NO3, the detection limit that applied to those samples prior to the year 1995 is much
higher than that used for the current survey (1 mg NO3/L or 0.26 mg NO3-N/L vs. 0.001 mg
NO3-N/L). In addition, water quality results are no longer routinely provided to the NT
Government for newly drilled bores, so that baseline NO3 data are not available for some
bores.
The comparison of current results with historical data shows that NO3 concentrations appear
to have increased 2-3 fold compared to historical levels in four of the bores (Figure 5, bores
5,6,10 and 20). Three of these are located on agricultural land while the fourth is adjacent to
the former Howard Springs waste disposal facility. This comparison should only be
considered an indication since in most cases only one single historical and one current
measurement are available.
Groundwater Quality of the Darwin rural area 2016 13
Figure 5. Comparison of historical (1968-2014) and current NO3 concentrations in Darwin region bores. Where concentrations were below the detection limit, half the detection limit is shown.
5. Discussion
5.1. Pesticides and herbicides
The results of this survey show that there is currently very little contamination of groundwater
in the Darwin rural area with herbicides or insecticides. Only eight different herbicides,
insecticides or their derivatives were detected out of a total of approximately 180 substances
that were tested for. All of the detected chemicals were found at very low concentrations that
would have been undetectable prior to recent improvements to analytical methods. None of
the samples exceeded environmental or drinking water quality guidelines where such
guidelines exist.
The substances that were detected were highly mobile pesticides that are associated with a
relatively high risk of leaching into groundwater because of their chemical properties. They
are commonly found in groundwater in other regions of Australia, often in higher
concentrations than those detected in this study (e.g. (Wightwick and Allinson 2007, Shaw et
al. 2012))
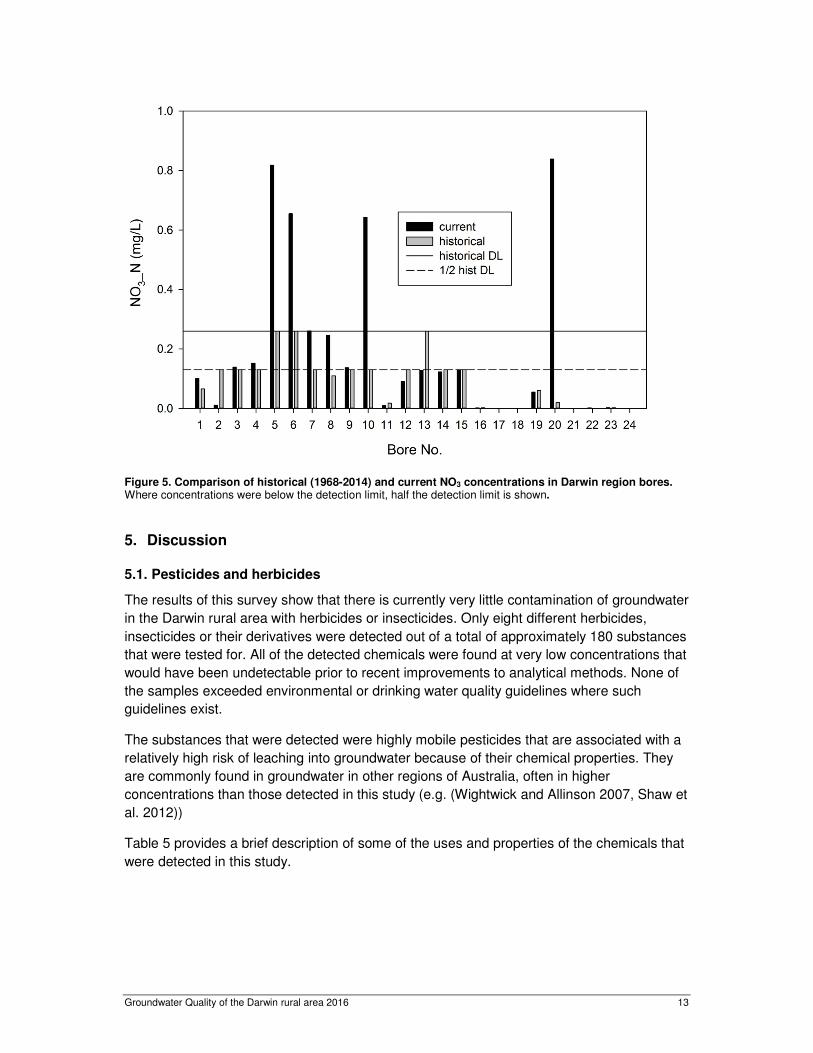
Table 5 provides a brief description of some of the uses and properties of the chemicals that
were detected in this study.
Groundwater Quality of the Darwin rural area 2016 14
Table 5. Description of chemicals detected in Darwin rural bores
Chemical name Description and main uses Examples of trade names*
2,4-D Common herbicide for the control of broadleaf weeds. It is also a breakdown product of 2,4-DB (see below)
Surefire Vortex Nufarm
2,4-DB Common herbicide used to control broadleaf weeds Relyon Empress Bromacil Herbicide used mainly to control perennial grasses. Often used
in roadside weed control. Uragan HYVAR
Desisopropyl Atrazine Breakdown product of atrazine. Atrazine used to be one of the main herbicides used in Australia. Used before and after planting of crops to control broad-leaved weeds and grasses in crops such as sorghum, sugar cane, maize and canola. Also used in turf and non-agricultural sites such as lawns, industrial areas, rights-of-way and in orchards (APVMA 2008, US EPA 2014). Atrazine is a common contaminant of surface and groundwater in Eastern Australia (Shaw and Muller 2005) and has been banned in Europe after persistent contamination of groundwater was found (EC 2014)
Farmozine Nutrazine Gesaprim
Diuron Broad-spectrum herbicide and algaecide used to control broadleaved and grass weeds in agriculture, around buildings and roads and to control weeds around waterbodies. A component of marine antifouling paint. Use has been restricted since a 2011 review to protect aquatic environments.
Di-RON Kenso Aqua One Algae Eliminator
Imidacloprid Very widely used insecticide. Registered for use on a variety of crops to control aphis, mites, thrips and other insects in agriculture and gardening. Also used to control fleas and worms in pets. Highly water soluble with a high risk of leaching. Persistent in water in the absence of light. Can persist in groundwater for extended periods.
Confidor Advantage Kenso Agcare savage 350
MCPB Herbicide to control broadleaf weeds in pastures Nufarm MCPB-400
Mecoprop Herbicide to control broadleaf weeds. Often used in combination with 2,4-D and other herbicides.
Nufarm Miracle-grow lawn food BARMAC
Tebuthiuron A general herbicide that is commonly used to control weeds. It is slightly toxic to aquatic vertebrates and invertebrates at higher concentrations but has little potential to accumulate in the environment.
Farmalinx Graslan Tebulan
All herbicides and pesticides that were detected in this study were found in very few samples
(3 or less). No spatial patterns of contamination could be discerned due to the small number
of detections. The low concentrations and isolated occurrence of pesticides in groundwater
of the Darwin region indicate that the low level contamination is only localised.
The exact source of the contamination cannot be determined by a survey of this kind.
Pesticides and herbicides are an integral part of modern agricultural practices and are also
widely used for infrastructure maintenance such as weed control around buildings and
roads. With the widespread use of these chemicals it is almost inevitable that traces of them
will make their way into the environment.
Two springs in the Howard East area (Howard Springs and Whitewood Jungle) were
included in a study of Darwin springs that were tested for pesticides in 2014 (Schult 2014).
Of the pesticides found in the groundwater, only diuron was detected in this previous study
at an extremely low level.
Groundwater Quality of the Darwin rural area 2016 15
The springs provide an integrated sample of groundwater from different areas. Since
pesticides are not present throughout the entire aquifer, concentrations in the springs are
expected to be lower due to a dilution effect.
5.2. Nitrate
Intensive agricultural land use and the application of fertilisers and manures is one of the
most common sources of nitrate in groundwater throughout the world (Bolger and Stevens
1999). A review by Geoscience Australia (Sundaram and Coram 2009) found that elevated
nitrate concentrations in Australia were generally found in areas surrounded by intensive
agriculture.
Nitrate concentrations in the Darwin region are low in comparison to other regions of
Australia where concentrations of up to 50 mg NO3_N/L have been found in groundwater
(Bolger and Stevens 1999). However, there was a high variability in nitrate concentrations in
the Darwin rural area with levels ranging from 0.002 mg NO3_N/L to 0.8 mg NO3_N/L. This
variability in indicates that nitrate concentrations are influenced by local surface processes.
There are natural sources of elevated nitrate in groundwater. For instance, nitrogen-fixing
bacteria associated with termites have been identified as a major potential natural source of
nitrate to groundwater in the Australian arid zone (Barnes et al. 1992)
However, significantly higher nitrate concentrations in the “non-mango” agricultural land use
category indicate that the use of fertilisers may be having an impact on the local
groundwater in these areas.
A comparison with historical data is confounded by the fact that historical detection limits
were based on human health concerns and were much higher than the current standard for
environmental purposes. Nevertheless, the fact that several agricultural sites had
substantially increased NO3 levels compared to historical measurements is another
indication that agricultural practices may be having an impact on groundwater resources.
6. Conclusion
This survey was the first comprehensive study of groundwater quality in the Darwin rural
area since the study by the Australian Geographical and Survey Organisation in 1995, which
found no pesticides, though the survey used a higher detection limit.
Development and human activities in the region currently have a very small impact on
groundwater quality. There is some localised low level contamination of groundwater with
some pesticides and nitrate. The increased detection of pesticides compared to the previous
survey in 1995 is entirely due to improvements in detection limits for pesticides since that
time. These chemicals can now be detected at lower concentrations, which has increased
the likelihood of detection.
Groundwater Quality of the Darwin rural area 2016 16
The low level nitrate contamination of the groundwater is likely to be caused at least in part
to human activities, including agricultural land use in the region.
The concentrations of both nitrate and pesticide contaminants are currently well below
guidelines for health (nitrate) and environmental protection and are low in comparison with
many other regions of Australia. However, any detection of aquifer contamination should
serve as a reminder to apply best practice in the storage, application and disposal of any
domestic and agricultural chemicals.
Groundwater Quality of the Darwin rural area 2016 17
7. References
ANZECC and ARMCANZ (2000). Australian and New Zealand Guidelines for fresh and marine water quality - Volume 1 The Guidelines, " Australian and New Zealand Environment and Conservation Council, Agriculture and Resource Management Council of Australia and New Zealand".
APHA (2005). Standard methods for the Examinations of Water and Wastewater, American Public Health Association, American Water Works Association, Water Environment Federation.
Barnes, C. J., G. Jacobson and G. Smith (1992). "The origin of high nitrate groundwater in the Australian arid zone." Journal of Hydrology 137: 181–197.
Bolger, P. and M. Stevens (1999). Contamination of Australian Groundwater Systems with Nitrate. Canberra, Land and Water Resources Research and Development Corporation.
Fell-Smith, S. and J. Sumner (2011). Technical Report - Koolpinyah DOlomite Aquifer Characteristics Project. E. Department of Natural Resources, The Arts and Sport. Palmerston.
Hatton, T. G., P. Cook, G. Kelly, A. O'Grady, L. Hutley, P. PReece, R. Farrow, D. Eamus and D. Pidsley (1998). Hydrological Investigation at Howard East, N.T. C. L. a. Water. Perth.
Jolly, P. (1983). McMinn's -Benham lagoon Borefiled investigation 1981-1982. . D. o. M. a. E. Northern Territory Water Resources Division. Darwin.
Jolly, P. and D. Yin Foo (1988). Lambell's Lagoon, Groundwater Resource Investigation. P. a. W. Authority. Darwin.
Radke, B., K. L. Watkins and J. Bauld (1998). A Groundwater Quality Assessment of Shallow Aquifers in the Darwin Rural Area, Northern Territory. Canberra, Australian Geological Survey Organisation.
Schult, J. (2012). Trial monitoring for pesticides and PAHs in the Katherine River using passive samplers. Palmerston, Department of Land Resource Management.
Schult, J. (2014). Pesticide and nutrient monitoring in five springs of the Darwin region in the 2014 dry season. Palmerston, Department of Land Resource Management.
Schult, J. (2016). " Herbicides, pesticides and nutrients in the Tindall Aquifer (Katherine Region)". Palmerston, NT Department of Land Resource Management.
Schult, J. (2016). Pesticide monitoring in the Douglas Daly region during the 2014 and 2015 dry seasons. Palmerston, Department of Land Resource Management.
Groundwater Quality of the Darwin rural area 2016 18
Shaw, M., D. Silburn, M. Lenahan and H. M (2012). Pesticides in Groundwater in the lower Burdekin floodplain. D. o. E. a. R. Management. Brisbane, Queensland Government.
Sundaram, B. and j. Coram (2009). Groundwater Quality in Australia and New Zealand: a literature review. D. o. E. Geoscience Australia, Water, Heritage and the Arts. Canberra.
Tien, A. T. (2002). Hydrology and Water Quality at Howard Springs Nature Park, Northern Australia. Armidale, Australia, School of Rural Science and Natural Resources, Faculty of the Sciences, University of New England,.
Verma, M. (1995). Groundwater Resources of the Berry Springs - Noonamah Area. N. G. Water Resource Division. Darwin.
Waugh, P. and A. Padovan (2004). Review of Pesticide Monitoring - Use and Risk to Water resources in the Darwin Region. Palmerston, "NT Department of Infrastructure, Planning and Environment, ".
Wightwick, A. and G. Allinson (2007). "Pesticide Residues in Victorian Waterways: A Review." Australasian Journal of Ecotoxicology 13: 91-112.
WRD (2016). Berry Springs Water Allocation Plan 2016-2026. D. o. L. R. Management. Palmerston.
Groundwater Quality of the Darwin rural area 2016 19
Appendix A: List of analytes for pesticide/herbicide analysis. Highlighted chemicals were detected in the Darwin rural area. LOR: Limit of Reporting
ID Description
LoR (µg/L) A
NZ
EC
C
AD
WG
Herbs GCMS All
KE34DA 3,4-Dichloroaniline 0.1 --
KEAM1 Ametryn (HBG) 0.1 70
KEAMIT Amitraz (HBG) 0.1 9
KEATR1 Atrazine (HBG) 0.1 20
KEBROM Bromacil (HBG) 0.1 400
KEDZ1 Desethyl Atrazine (HBG) 0.1 --
KEDOZ1 Desisopropyl Atrazine (HBG) 0.1 --
KEDICM Diclofop-methyl (HBG) 0.1 5
KEFLZF Fluazifop-butyl (HBG) 0.1 --
KEFLM1 Fluometuron (HBG) 0.1 70
KEHO2E Haloxyfop-2-etotyl (HBG) 0.1 1
KEHOM Haloxyfop-methyl (HBG) 0.1 1
KEHZ1 Hexazinone (HBG) 0.1 400
KEMETC Metolachlor (HBG) 0.1 300
KEMRB Metribuzin (HBG) 0.1 70
KEMOLN Molinate (HBG) 0.1 4
Organics Env. Lab # --
KEOXYF Oxyfluorfen (HBG) 0.1 --
KEPDM Pendimethalin (HBG) 0.1 400
KEPM1 Prometryn (HBG) 0.1 --
KEPPNL Propanil (HBG) 0.1 700
KEPPZN Propazine (HBG) 0.1 50
KESM1 Simazine (HBG) 0.1 20
KETB1 Tebuthiuron (HBG) 0.1 --
KETBTZ Terbuthylazine (HBG) 0.1 10
KETBTY Terbutryn (HBG) 0.1 400
KETRIA Triallate (HBG) 0.1 --
KETRIF Trifluralin (HBG) 0.1 90
Organochlorine Pesticides
KEALD Aldrin (OC) 0.1 0.3
KECLDC Chlordane cis (OC) 0.1 2
KECLT Chlordane Total (OC) 0.2 2
KECLDT Chlordane trans (OC) 0.1 2
KECHL Chlordene (OC) 0.1 --
KECHLE Chlordene epoxide (OC) 0.1 --
KEC1H Chlordene-1-hydroxy (OC) 0.1 --
KEC1H2 Chlordene-1-hydroxy-2,3-epoxide (OC) 0.1 --
KEDIC Dicofol (OC) 1.5 4
ID Description
LoR (µg/L) A
NZ
EC
C
AD
WG
KEDIEL Dieldrin (OC) new 0.1 0.3
KEENDA Endosulfan Alpha (OC) 0.2 20
KEENDB Endosulfan Beta (OC) 0.2 20
KEENDE Endosulfan ether (OC) 0.1 --
KEENDL Endosulfan lactone (OC) 0.5 --
KEENDS Endosulfan sulfate (OC) 0.1 20
KEERIN Endrin (OC) 0.2 --
KEERIA Endrin aldehyde (OC) 0.1 --
KEHCB HCB (OC) 0.2 --
KEHCHA HCH alpha (OC) 0.1 --
KEHCHB HCH beta (OC) 0.1 --
KEHCHD HCH delta (OC) 0.1 --
KECBH Heptachlor (OC) 0.1 0.3
KECBHE Heptachlor epoxide (OC) 0.1 0.3
KEELD Lindane (OC) 0.1 10
KEMET Methoxychlor (OC) 0.1 300
KENONC Nonachlor cis (OC) 0.1 --
KENONT Nonachlor trans (OC) 0.1 --
KEODDD o-p DDD (OC) 0.1 --
KEODDE o-p DDE (OC) 0.1 --
KEODDT o-p DDT (OC) 0.1 9
KELN Organics Env. Lab # --
KEOXC Oxychlordane (OC) 0.1 2
KEPDDD p-p DDD (OC) 0.1 9
KEPDDE p-p DDE (OC) 0.1 9
KEPDDT p-p DDT (OC) 0.1 9
KETAD Total Aldrin & Dieldrin (OC) 0.2 0.3
KEDDT Total DDT (OC) 0.4 9
KEEND Total Endosulfan (OC) 0.6 20
KETHC Total Heptachlor (OC) 0.2 0.3 Organophosphate
Pesticides
KEAZPE Azinphos-ethyl (OP) 0.1 --
KEAZPM Azinphos-methyl (OP) 0.1 30
KEBMPE Bromophos-ethyl (OP) 0.1 10
KECADS Cadusafos (OP) 0.1 --
KECARP Carbophenothion (OP) 0.1 0.5
KECHFV Chlorfenvinphos (OP) 0.1 2
KECHP Chlorpyrifos (OP) 0.1 10
KECHPO Chlorpyrifos oxon (OP) 0.1 --
KECHPM Chlorpyrifos-methyl (OP) 0.1 --
KECOUM Coumaphos (OP) 0.1 --
Groundwater Quality of the Darwin rural area 2016 20
ID Description
LoR (µg/L) A
NZ
EC
C
AD
WG
KEDEOM Demeton-O-methyl 0.1 --
KEDEMT Demeton-S 16315 0.1 --
KEDESM Demeton-S-methyl (OP) 0.1 --
KEDIAZ Diazinon (OP) 0.1 4
KEDICH Dichlorvos (OP) 0.1 5
KEDIME Dimethoate (OP) 0.1 7
KEDIOX Dioxathion (OP) 0.1 --
KEDIS Disulfoton (OP) 0.1 4
KEETHI Ethion (OP) 0.1 4
KEETHP Ethoprophos (OP) 0.1 1
KEETRI Etrimphos (OP) 0.1 --
KEFAMP Famphur (OP) 0.1 --
KEFENA Fenamiphos (OP) 0.1 0.5
KEFENC Fenchlorphos (OP) 0.1 30
KEFENI Fenitrothion (OP) 0.1 7
KEFENM Fenthion (methly) (OP) 0.1 7
KEFENE Fenthion-ethyl (OP) 0.1 --
KEISOP Isofenphos (OP) 0.1 --
KEMALA Malathion (OP) 0.1 70
KEMETD Methidathion (OP) 0.1 6
KEMEVI Mevinphos (OP) 0.1 5
KEMCP Monocrotophos (OP) 0.1 2
KEOME Omethoate (OP) 0.2 1
KEOXDM Oxydemeton-methyl (OP) 0.1 --
KEPARE Parathion (ethyl) (OP) 0.1 --
KEPARM Parathion-methyl (OP) 0.1 20
KEPHOR Phorate (OP) 0.1 0.7
KEPHOS Phosmet (OP) 0.1 --
KEPHOP Phosphamidon (OP) 0.1 --
KEPIRM Piromiphos-methyl (OP) 0.1 --
KEPROF Profenofos (OP) 0.1 90
KEPROT Prothiofos (OP) 0.1 0.3
KEPYRZ Pyrazophos (OP) 0.1 --
KESUL Sulprofos (OP) 0.1 20
KETEME Temephos (OP) 0.1 10
KETERB Terbufos (OP) 0.1 400
KETCVP Tetrachlorvinphos (OP) 0.1 1
KEDIMT Total Dimethoate (OP) 0.3 100
KEOTCG Other Compounds GCMS 7
KE1HBZ 1H-Benzotriazole (OTCG) 0.7
KE1HB1 1H-Benzotriazole, 1-methyl (OTCG) 0.1 --
KE1HB5 1H-Benzotriazole, 5-methyl (OTCG) 0.2 --
KE24DT 2,4-Di-t-butylphenol 0.1 --
KEDTBC 2,6-Di-t-butyl-p-cresol (OTCG) 0.1 --
KEDTBP 2,6-Di-t-butylphenol (OTCG) 0.3 --
ID Description
LoR (µg/L) A
NZ
EC
C
AD
WG
KE2B4C 2-Benzyl-4-chlorophenol 0.2 --
KECDMP 4-Chloro-3,5-dimethylphenol (OTCG) 0.1 --
KEBESA Benzenesulfonanilide 0.2 --
KEGALA Galaxolide (OTCG) 0.1 --
KEICAD Icaridin 0.1 --
KEMOCL Moclobemide (OTCG) 1 --
KEMSKK Musk Ketone (OTCG) 0.1 --
KEMSKX Musk Xylene (OTCG) 0.1 --
KENBBS N-Butylbenzenesulfonamide (OTCG) 0.1 --
KENBTS N-Butyltoluenesulfonamide (OTCG) 0.1 --
Organics Env. Lab # --
KETONL Tonalid (OTCG) 0.1 --
KETNBP Tri-n-butyl phosphate (OTCG) 0.1 --
KETRIC Triclosan (OTCG) 0.1 --
KETCME Triclosan methyl ether (OTCG) 0.1 --
KETEP Triethyl phosphate (OTCG) 0.1 --
KETCEP Tris(chloroethyl) phosphate (OTCG) 0.1 --
KETCPP Tris(chloropropyl) phosphate isomersOTCG 0.1 --
KETDCP Tris(dichloropropyl) phosphate (OTCG) 0.1 --
Other Pesticides 1 --
KEBENA Benalaxyl (OTP) 0.1
KEBENC Bendiocarb (OTP) 0.1 --
KEBITE Bitertanol (OTP) 0.1 --
KECAPT Captan (OTP) 0.1 --
KECARB Carbaryl (OTP) 0.1 400
KEDEET DEET (OTP) 0.1 30
KEDIMM Dimethomorph (OTP) 0.2 --
KEWFIP Fipronil (OTP) 0.1 --
KEFLTF Flutriafol 0.1 0.7
KEFURA Furalaxyl (OTP) 0.1 --
KEMLAX Metalaxyl (OTP) 0.1 --
KEMETP Methoprene (OTP) 0.1 --
Organics Env. Lab # --
KEOXAD Oxadiazon (OTP) 0.1 --
KEPIPB Piperonyl butoxide (OTP) 0.1 --
KEPIMC Pirimicarb (OTP) 0.2 600
KEPRAQ Praziquantel 0.1 7
KEPCYM Procymidone (OTP) 0.1 --
KEPROG Propargite (OTP) 0.1 --
KEPPIC Propiconazole (OTP) 0.1 7
KEPROX Propoxur (OTP) 0.1 100
KEROTN Rotenone (OTP) 0.1 --
KETEBU Tebuconazole (OTP) 0.1 --
KETDIF Tetradifon (OTP) 0.1 --
Groundwater Quality of the Darwin rural area 2016 21
ID Description
LoR (µg/L) A
NZ
EC
C
AD
WG
KETHIB Thiabendazole (OTP) 0.2 --
KETTRM Total Triadimefon (OTP) 0.3 --
KETRIM Triadimefon (OTP) 0.1 90
KETRIN Triadimenol (OTP) 0.1 90
KEVINC Vinclozolin (OTP) 0.1 --
Synthetic Pyrethroids 1 --
KEBIFN Bifenthrin (SP) 0.1
KEBIRM Bioresmethrin (SP) 0.1 --
KECYFL Cyfluthrin (SP) 0.1 100
KELAMC Cyhalothrin (SP) 0.1 50
KECYPM Cypermethrin (SP) 0.1 --
KEDELM Deltamethrin (SP) 0.1 200
KEFENV Fenvalerate (SP) 0.1 40
KEFLUV Fluvalinate (SP) 0.1 60
Organics Env. Lab # --
KEPERM Permethrin (SP) 0.1
--
KEPHEN Phenothrin (SP) 0.1 200
KETETM Tetramethrin (SP) 0.1 --
KETRAF Transfluthrin (SP) 0.1 --
--
Water Glyphosate LCMS
KEAMPL Aminomethylphosphonic Acid (AMPA) LL 0.5
KEGLUF Glufosinate LL 0.5 --
KEGLYL Glyphosate LL 0.5 --
KELN Organics Env. Lab # --
KETGLY Total Glyphosate 1 370 --
--
Herbicides (low level)
KHSP59 2,4-D (low) 0.004
KHSP60 2,4-DB (low) 0.004 --
KHSP49 3,4-Dichloroaniline (low) 0.001 --
KHSP1J Acetamiprid (Low) 0.001 --
KHSP61 Acifluorfen (low) 0.004 --
KHSP43 Ametryn (low) 0.001 --
KHSP44 Atrazine (low) 0.001 13 --
KHSP45 Bromacil (low) 0.001 --
KHSP62 Clomazone (low) 0.001 --
KHSP91 Clothianidin (low) 0.001 --
KHSP63 Cyanazine (low) 0.001 --
KHSP46 Desethyl Atrazine (low) 0.001 --
KHSP47 Desisopropyl Atrazine (low) 0.001 --
KHSP48 Diuron (low) 0.001 --
KHSP64 Ethametsulfuron methyl (low) 0.001 --
KHSP50 Fluometuron (low) 0.001 --
ID Description
LoR (µg/L) A
NZ
EC
C
AD
WG
KHSP65 Fluroxypyr (low) 0.01 --
KHSP66 Flusilazole (low) 0.001 --
KHSP67 Haloxyfop (acid) (low) 0.004 --
KHSP51 Hexazinone (low) 0.001 --
KHSP1C Imazapic (Low) 0.001 --
KHSP1D Imazapyr (Low) 0.001 --
KHSP68 Imazethapyr (low) 0.001 --
KHSP52 Imidacloprid (low) 0.001 --
KHSP89 Imidacloprid metabolites (low) 0.001 --
KHSP70 MCPA (low) 0.004 --
KHSP71 MCPB (low) 0.004 --
KHSP72 Mecoprop (low) 0.004 --
KHSP73 Mesosulfuron methyl (low) 0.001 --
KHSP1I Methoxyfenozide (Low) 0.001 --
KHSP53 Metolachlor (low) 0.001 --
KHSP58 Metribuzin (Low) 0.001 --
KHSP74 Metsulfuron methyl (low) 0.001 --
KHSP1F N-Demethyl Acetamiprid (Low) 0.001 --
KHSP75 Napropamide (low) 0.001 --
Organics Env. Lab # --
KHSP54 Prometryn (low) 0.001
--
KHSP76 Propachlor (low) 0.001 --
KHSP77 Propazin-2-hydroxy (low) 0.001 --
KHSP78 Sethoxydim (including Clethodim) (low) 0.008 --
KHSP55 Simazine (low) 0.001 3.2 --
KHSP79 Sulfosulfuron (low) 0.001 --
KHSP56 Tebuthiuron (low) 0.001 2.2 --
KHSP80 Terbuthylazine (low) 0.001 --
KHSP81 Terbuthylazine desethyl (low) 0.001 --
KHSP57 Terbutryn (low) 0.001 --
KHSP1G Thiacloprid (Low) 0.001 --
KHSP92 Thiamethoxam (low) 0.001 --
KHSP1H Total Acetamiprid (Low) 0.003 --
KHSP94 Total Diuron (low) 0.0 --
KHSP82 Total Imazapic (low) 0.05 --
KHSP90 Total Imidacloprid (low) 0.003 --
KHSP69 Total Isoxaflutole (low) 0.004 --
KHSP83 Triclopyr (low) 0.004 --
KHSP84 Trifloxysulfuron (low) 0.004 --
Groundwater Quality of the Darwin rural area 2016 22
Appendix B: Raw field and lab results (nutrients and major ions)
Table 6. Field measurements of physico-chemical parameters. Ns: not measured
Site Date Time Temp
(deg C) pH DO
(mg/L) EC
(uS/cm) Tur
(NTU)
RN006310 31/08/2016 14:49 29.6 7.59 ns 282 0.14
RN006962 31/08/2016 16:40 30.91 6.51 0.58 264 1.34
RN007048 30/08/2016 15:38 29.6 7.2 ns 273 0.1
RN007071 31/08/2016 15:40 29.9 7.46 ns 295 0.22
RN008803 29/08/2016 12:55 29.76 4.6 7.08 21 3.92
RN031410 30/08/2016 14:15 30.42 7.28 2.93 320 0.44
RN021390 30/08/2016 9:45 29.81 6.79 5.81 205 0.29
RN025232 30/08/2016 11:55 30.69 7.08 4.12 317 0.82
RN026686 29/08/2016 11:05 30.81 7.31 3.77 314 0.12
RN026767 31/08/2016 15:15 30.38 7.23 1.86 306 0.55
RN028032 1/09/2016 10:18 29.5 5.92 ns 89.8 21
RN029043 29/08/2016 9:50 31.48 6.12 0.34 144 28
RN029733 31/08/2016 10:00 31.23 7.53 6.3 283 0.16
RN030218 31/08/2016 18:37 30.17 4.5 2.79 18 0.7
RN031419 30/08/2016 11:20 30.9 7.32 ns 357 0.4
RN032300 1/09/2016 9:55 34.1 7.4 0.21 360 0.35
RN032490 31/08/2016 11:52 30.7 7.26 3.84 338 1.35
RN033786 1/09/2016 10:45 30.97 7.3 2.01 334 0.11
RN035313 31/08/2016 10:18 30.3 7.76 ns 313 0.27
RN035867 30/08/2016 14:47 31 4.38 ns 40.7 2.19
RN036488 30/08/2016 10:05 30.4 4.37 ns 30 4.98
RN036531 31/08/2016 12:32 30.4 7.33 ns 288 0.2
RN037417 29/08/2016 13:35 30.5 7.61 ns 295 0.22
RN037419 29/08/2016 15:36 32.8 5.45 ns 38.3 120
Groundwater Quality of the Darwin rural area 2016 23
Table 7. Nutrient concentrations
Gcode Date Time NH3_N (mg/L)
NO2_N (mg/L)
NO3_N (mg/L)
PO4_P (mg/L)
RN006310 31/08/2016 14:49 0.002 < 0.001 0.101 0.029
RN006962 31/08/2016 16:40 0.01 < 0.001 0.011 0.026
RN007048 30/08/2016 15:38 < 0.001 < 0.001 0.139 0.026
RN007071 31/08/2016 15:40 0.002 0.002 0.152 0.017
RN008803 29/08/2016 12:55 < 0.001 < 0.001 0.818 < 0.001
RN031410 30/08/2016 14:15 0.001 < 0.001 0.123 0.020
RN021390 30/08/2016 9:45 0.002 0.002 0.655 0.011
RN025232 30/08/2016 11:55 0.002 0.002 0.261 0.006
RN026686 29/08/2016 11:05 0.001 0.002 0.246 0.012
RN026767 31/08/2016 15:15 0.004 0.001 0.137 0.007
RN028032 1/09/2016 10:18 0.009 < 0.001 0.643 0.002
RN029043 29/08/2016 9:50 0.037 0.006 0.010 0.011
RN029733 31/08/2016 10:00 < 0.001 < 0.001 0.091 0.03
RN030218 31/08/2016 18:37 0.002 0.002 0.128 < 0.001
RN031419 30/08/2016 11:20 0.004 0.002 0.128 0.008
RN032300 1/09/2016 9:55 0.001 < 0.001 0.002 0.045
RN032490 31/08/2016 11:52 0.004 0.003 0.151 0.025
RN033786 1/09/2016 10:45 0.002 < 0.001 0.112 0.03
RN035313 31/08/2016 10:18 0.04 0.002 0.055 0.019
RN035867 30/08/2016 14:47 0.016 < 0.001 0.839 < 0.001
RN036488 30/08/2016 10:05 < 0.001 0.004 0.592 < 0.001
RN036531 31/08/2016 12:32 0.053 < 0.001 0.002 0.007
RN037417 29/08/2016 13:35 0.115 < 0.001 0.003 0.009
RN037419 29/08/2016 15:36 0.254 < 0.001 0.11 0.003
Groundwater Quality of the Darwin rural area 2016 24
Table 8. Major cations and anions and general parameters
Site Date Time pH EC
(µS/cm) Alkali-
nity CO3
(mg/L) HCO3 (mg/L)
OH (mg/L)
TDS (mg/L)
Cl (mg/L)
Si (mg/L)
Hard-ness
Ca_F (mg/L)
K_F (mg/L)
Mg_F (mg/L)
Na_F (mg/L)
SO4_F (mg/L)
RN006310 31/08/2016 14:49 7.8 266 148 <1 148 <1 170 3 8.8 148 19.6 0.2 24.1 2.1 1.3
RN006962 31/08/2016 16:40 7 266 143 <1 143 <1 170 3.6 13.6 106 22.8 2.8 11.9 18.3 1.2
RN007048 30/08/2016 15:38 7.6 244 132 <1 132 <1 150 3.3 9.6 134 24.9 0.3 17.5 2.1 1.2
RN007071 31/08/2016 15:40 7.7 278 153 <1 153 <1 180 3.4 11.1 155 30.2 0.3 19.3 2 1.5
RN008803 29/08/2016 12:55 5.1 30 1 <1 1 <1 20 2.5 5.5 0.7 <0.1 <0.1 0.2 2.7 <0.1
RN031410 30/08/2016 14:15 7.7 301 171 <1 171 <1 180 2.6 6.9 171 32.2 0.2 21.9 1.9 0.5
RN021390 30/08/2016 9:45 7.4 192 77 <1 77 <1 130 14.5 7.5 84.4 16.8 0.4 10.3 7.4 1.9
RN025232 30/08/2016 11:55 7.6 297 167 <1 167 <1 170 2.9 6.2 168 29.2 0.2 23 2.2 1
RN026686 29/08/2016 11:05 7.7 292 165 <1 165 <1 190 2.4 6.5 165 27.9 0.2 23.2 2 0.9
RN026767 31/08/2016 15:15 7.7 288 159 <1 159 <1 170 2.8 11.3 162 30.8 0.2 20.5 1.9 1.4
RN028032 1/09/2016 10:18 6.4 82 33 <1 33 <1 60 3.6 6.5 35.2 6.3 0.4 4.7 2.8 1.6
RN029043 29/08/2016 9:50 6.4 85 40 <1 40 <1 60 3.9 3.5 17.1 3.2 0.8 2.2 2.6 0.3
RN029733 31/08/2016 10:00 8 265 128 <1 128 <1 160 10.4 7.5 133 25.7 0.1 16.7 6.2 1.2
RN030218 31/08/2016 18:37 5 18 <1 <1 <1 <1 10 2.6 5.4 0.3 <0.1 <0.1 <0.1 1.8 <0.1
RN031419 30/08/2016 11:20 7.8 330 189 <1 189 <1 200 2.1 7.3 189 31.8 0.2 26.6 1.9 1.8
RN032300 1/09/2016 9:55 8 331 186 <1 186 <1 210 2.6 12.7 192 23 0.3 32.6 1.6 4.6
RN032490 31/08/2016 11:52 7.9 317 179 <1 179 <1 210 3.3 12.5 178 28 0.3 26.3 2.2 1.5
RN033786 1/09/2016 10:45 7.9 307 172 <1 172 <1 200 3.3 13.2 174 26.5 0.2 26.3 1.7 2.2
RN035313 31/08/2016 10:18 8.2 292 158 <1 158 <1 190 4 8.9 162 20 0.5 27.3 2.3 1.7
RN035867 30/08/2016 14:47 4.9 31 1 <1 1 <1 30 4.9 8.9 0.7 <0.1 0.1 0.1 3.7 <0.1
RN036488 30/08/2016 10:05 4.6 23 1 <1 1 <1 20 2.2 5.5 0.5 <0.1 <0.1 0.1 1.5 <0.1
RN036531 31/08/2016 12:32 7.9 268 150 <1 150 <1 160 2.7 6.6 150 29.5 <0.1 18.5 1.6 0.5
RN037417 29/08/2016 13:35 7.7 259 146 <1 146 <1 160 2.5 7.6 143 27 0.2 18.4 2.4 0.5
RN037419 29/08/2016 15:36 6.3 38 13 <1 13 <1 30 2.6 5.9 8.2 1.3 <0.1 1.2 1.9 0.2
Groundwater Quality of the Darwin rural area 2016 25
Appendix C: Herbicide and pesticide concentrations in Darwin region bores and springs.
Table 9. Herbicide and pesticide concentrations in Darwin region bores. Only chemicals that were detected at a minimum of one site are shown. For a full list of analytes see Appendix A.
Bore number
NO3_N (mg/L)
Pesticide concentrations (µg/L)
2,4
-DB
Bro
ma
cil
Desis
opro
pyl
Atr
azin
e (
low
)
Diu
ron
MC
PB
(lo
w)
Mecopro
p (
low
)
Teb
uth
iuro
n
Imid
aclo
prid
DL 0.001 0.001 0.001 0.001 0.001 0.001 0.001 0.001 0.003
Guideline value
11.4 2.2
RN008803 0.818 ND ND ND ND ND ND ND ND
RN021390 0.655 ND ND ND ND ND ND ND ND
RN028032 0.643 ND ND ND ND ND ND ND ND
RN029733 0.091 ND ND ND ND ND ND ND 0.005
RN007071 0.152 ND ND ND ND ND ND ND ND
RN026686 0.246 0.002 ND ND ND 0.002 0.002 ND ND
RN031410 0.123 ND ND ND ND ND ND ND ND
RN031419 0.128 ND ND ND ND ND ND ND ND
RN032300 0.002 ND ND ND ND ND ND ND ND
RN032490 0.151 ND ND ND ND ND ND ND ND
RN033786 0.112 ND ND 0.002 ND ND ND ND ND
RN036488 0.592 ND ND ND ND ND ND ND ND
RN006310 0.101 0.001 ND ND ND 0.002 ND ND ND
RN007048 0.139 ND ND ND ND ND ND ND ND
RN035313 0.055 ND ND ND ND ND ND ND ND
RN036531 0.002 ND ND ND ND ND ND ND ND
RN037417 0.003 0.001 ND ND ND ND ND ND ND
RN037419 0.110 ND ND ND ND ND ND ND ND
RN026767 0.137 ND ND ND ND ND ND ND ND
RN035867 0.839 ND 0.009 ND 0.004 ND ND 0.016 ND
RN006962 0.011 ND ND ND ND ND ND ND ND
RN025232 0.261 ND ND ND ND ND ND ND ND
RN029043 0.01 ND ND ND ND ND ND ND ND
RN030218 0.128 ND ND ND ND ND ND ND ND