Embed Size (px)
Citation preview
PO-CON1752E
Pesticide analysis in Hopsand Cannabis by GC-MS-MS
ASMS 2017 TP-191
Jeffrey H. Dahl,1 Riki Kitano,1 Vikki Johnson,1
and Julie Kowalski2
1Shimadzu Scienti�c Instruments; Columbia, Maryland2Trace Analytics; Spokane, Washington
2
Pesticide analysis in Hops and Cannabis by GC-MS-MS
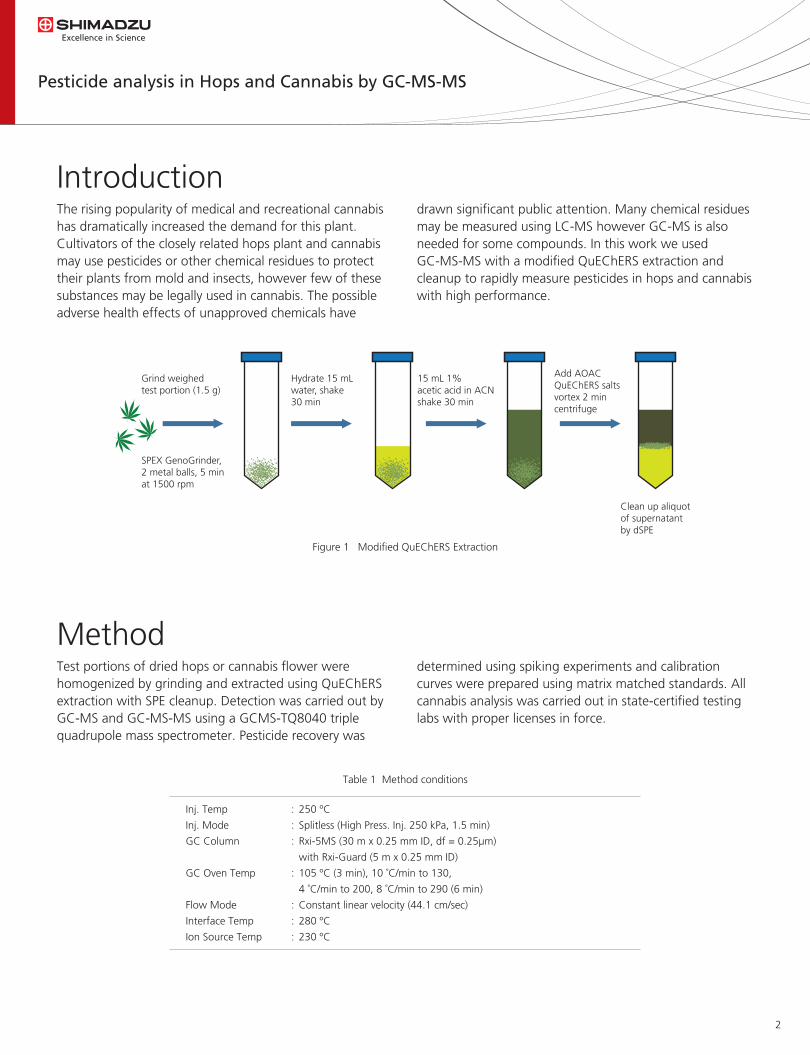
IntroductionThe rising popularity of medical and recreational cannabis has dramatically increased the demand for this plant. Cultivators of the closely related hops plant and cannabis may use pesticides or other chemical residues to protect their plants from mold and insects, however few of these substances may be legally used in cannabis. The possible adverse health effects of unapproved chemicals have
drawn signi�cant public attention. Many chemical residues may be measured using LC-MS however GC-MS is also needed for some compounds. In this work we used GC-MS-MS with a modi�ed QuEChERS extraction and cleanup to rapidly measure pesticides in hops and cannabis with high performance.
MethodTest portions of dried hops or cannabis �ower were homogenized by grinding and extracted using QuEChERS extraction with SPE cleanup. Detection was carried out by GC-MS and GC-MS-MS using a GCMS-TQ8040 triple quadrupole mass spectrometer. Pesticide recovery was
determined using spiking experiments and calibration curves were prepared using matrix matched standards. All cannabis analysis was carried out in state-certi�ed testing labs with proper licenses in force.
Figure 1 Modi�ed QuEChERS Extraction
Grind weighed test portion (1.5 g)
SPEX GenoGrinder,2 metal balls, 5 minat 1500 rpm
Hydrate 15 mLwater, shake 30 min
15 mL 1%acetic acid in ACNshake 30 min
Add AOACQuEChERS saltsvortex 2 mincentrifuge
Clean up aliquotof supernatantby dSPE
Table 1 Method conditions
Inj. Temp : 250 ºC
Inj. Mode : Splitless (High Press. Inj. 250 kPa, 1.5 min)
GC Column : Rxi-5MS (30 m x 0.25 mm ID, df = 0.25µm)
with Rxi-Guard (5 m x 0.25 mm ID)
GC Oven Temp : 105 ºC (3 min), 10 ˚C/min to 130,
4 ˚C/min to 200, 8 ˚C/min to 290 (6 min)
Flow Mode : Constant linear velocity (44.1 cm/sec)
Interface Temp : 280 ºC
Ion Source Temp : 230 ºC
3
Pesticide analysis in Hops and Cannabis by GC-MS-MS
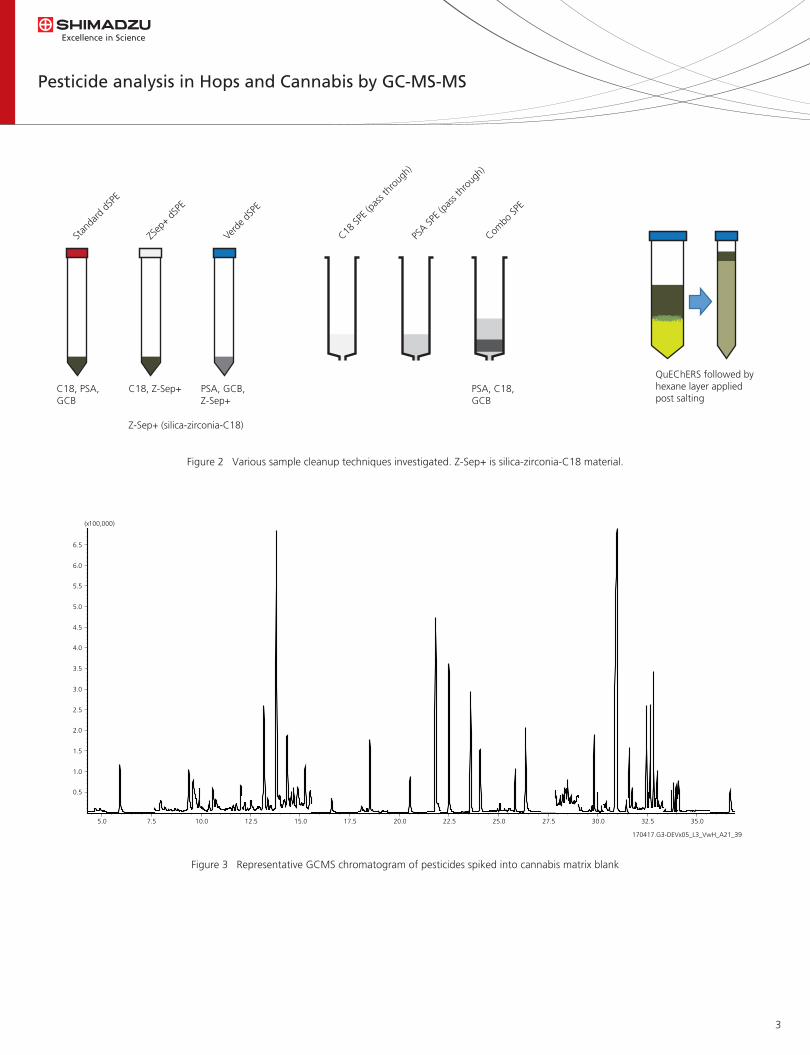
Figure 2 Various sample cleanup techniques investigated. Z-Sep+ is silica-zirconia-C18 material.
Z-Sep+ (silica-zirconia-C18)
QuEChERS followed byhexane layer appliedpost salting
C18, PSA, GCB
C18, Z-Sep+ PSA, GCB, Z-Sep+
PSA, C18,GCB
Stan
dard
dSP
E
ZSep
+ dSP
E
Verd
e dSP
E
C18 SP
E (pa
ss th
roug
h)
PSA SP
E (pa
ss th
roug
h)
Combo
SPE
Figure 3 Representative GCMS chromatogram of pesticides spiked into cannabis matrix blank
5.0 7.5 10.0 12.5 15.0 17.5 20.0 22.5 25.0 27.5 30.0 32.5 35.0
0.5
1.0
1.5
2.0
2.5
3.0
3.5
4.0
4.5
5.0
5.5
6.0
6.5
(x100,000)
170417.G3-DEVx05_L3_VwH_A21_39
4
Pesticide analysis in Hops and Cannabis by GC-MS-MS
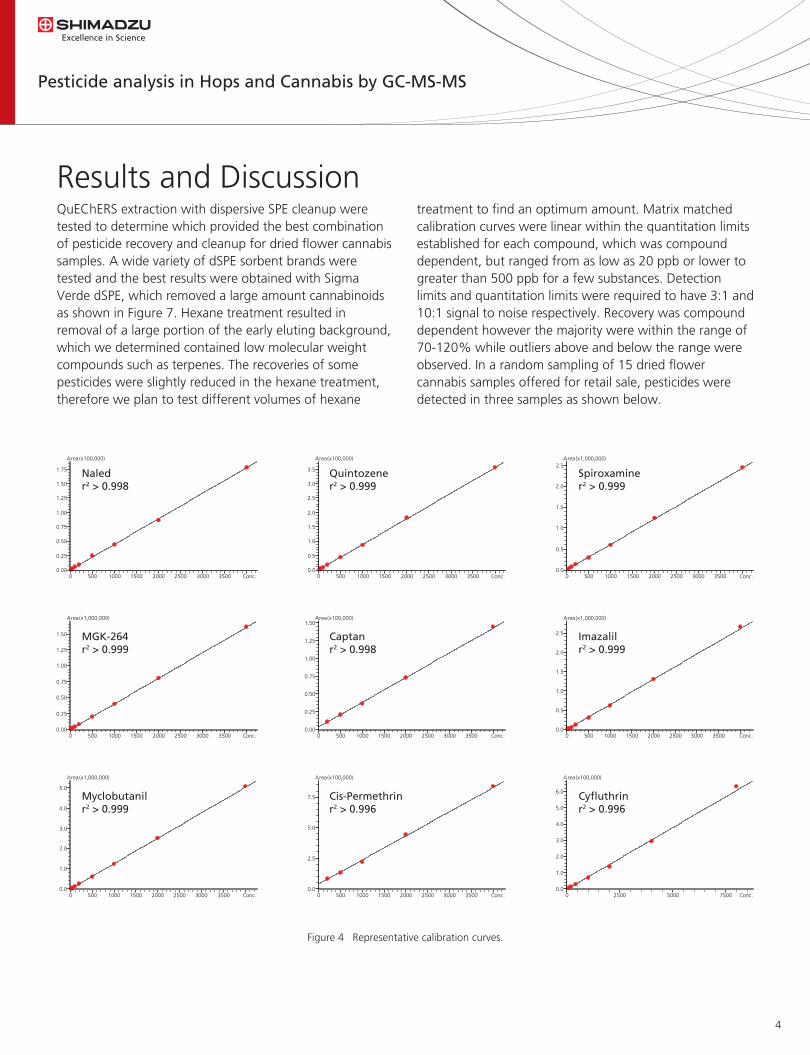
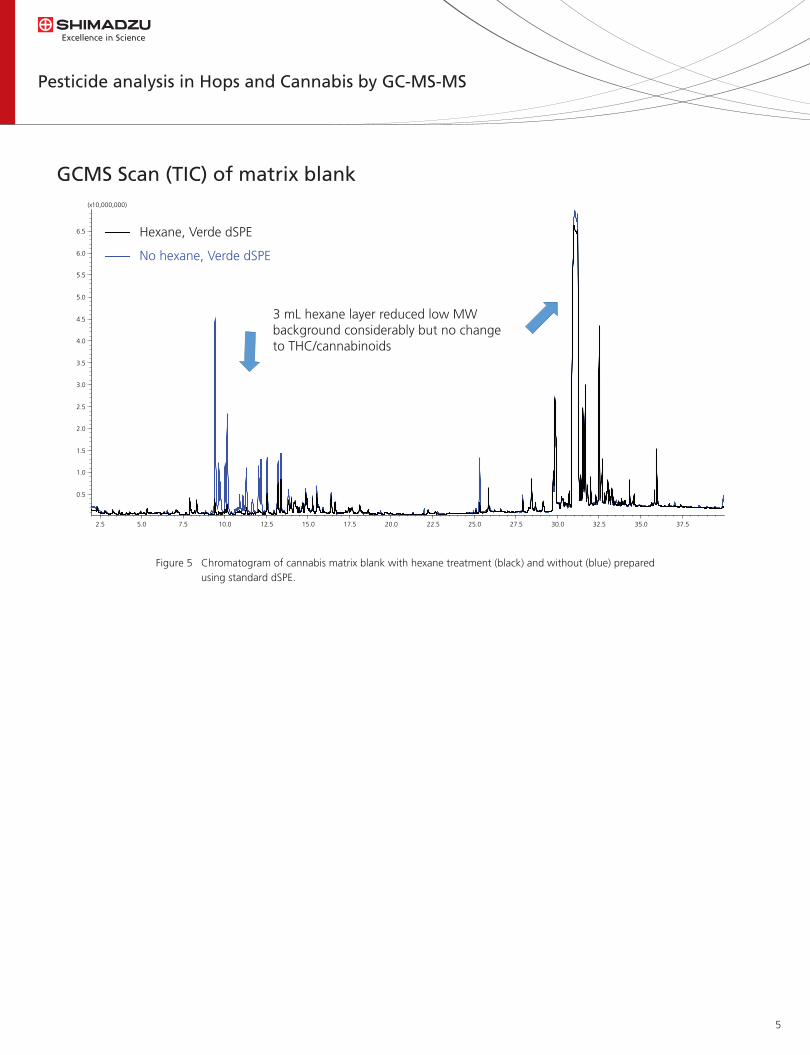
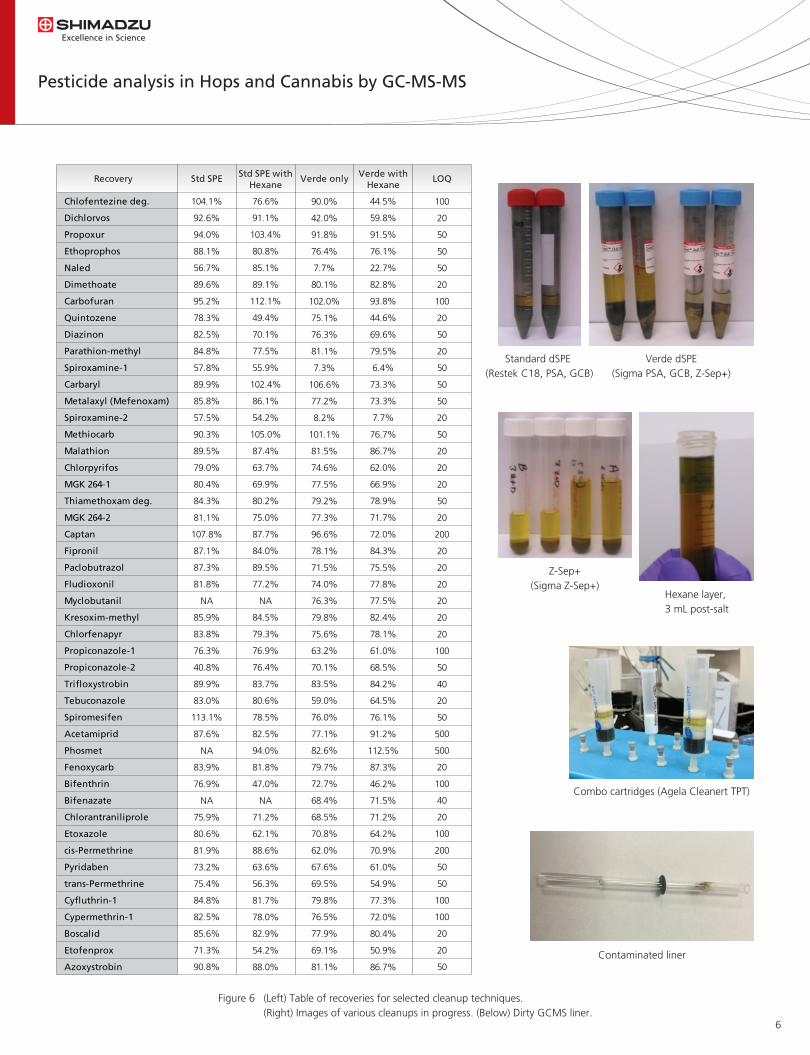
Results and DiscussionQuEChERS extraction with dispersive SPE cleanup were tested to determine which provided the best combination of pesticide recovery and cleanup for dried �ower cannabis samples. A wide variety of dSPE sorbent brands were tested and the best results were obtained with Sigma Verde dSPE, which removed a large amount cannabinoids as shown in Figure 7. Hexane treatment resulted in removal of a large portion of the early eluting background, which we determined contained low molecular weight compounds such as terpenes. The recoveries of some pesticides were slightly reduced in the hexane treatment, therefore we plan to test different volumes of hexane
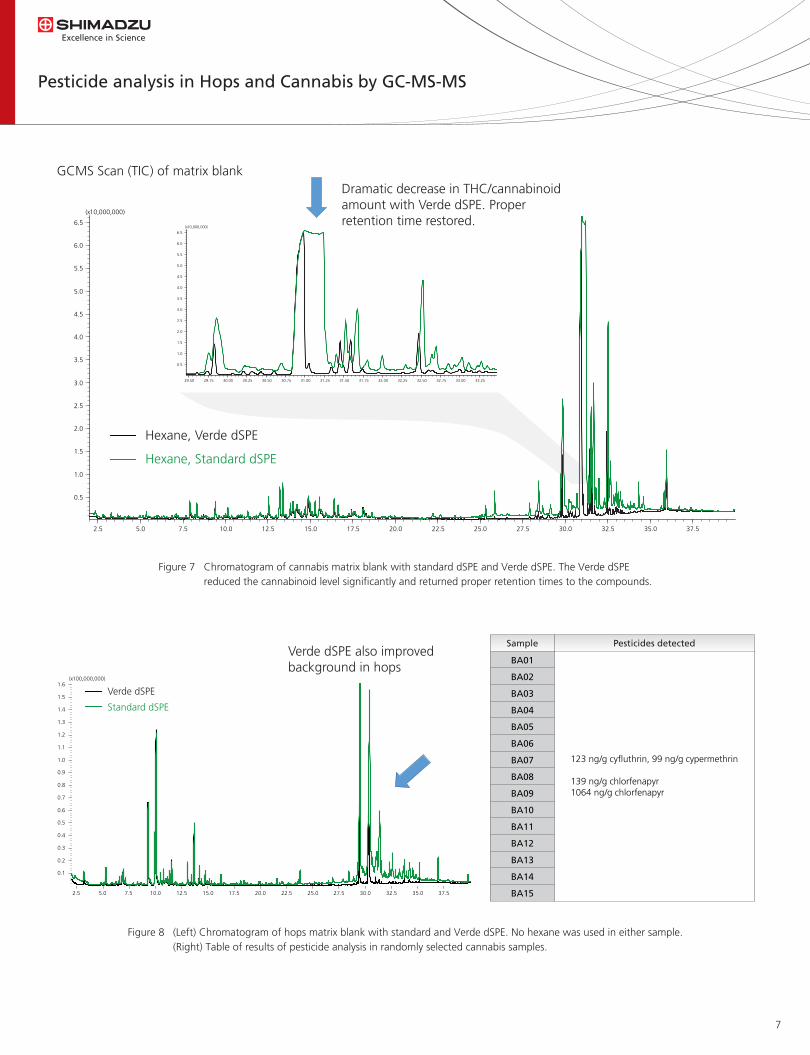
treatment to �nd an optimum amount. Matrix matched calibration curves were linear within the quantitation limits established for each compound, which was compound dependent, but ranged from as low as 20 ppb or lower to greater than 500 ppb for a few substances. Detection limits and quantitation limits were required to have 3:1 and 10:1 signal to noise respectively. Recovery was compound dependent however the majority were within the range of 70-120% while outliers above and below the range were observed. In a random sampling of 15 dried �ower cannabis samples offered for retail sale, pesticides were detected in three samples as shown below.
Figure 4 Representative calibration curves.
0 500 1000 1500 2000 2500 3000 3500 Conc.0.00
0.25
0.50
0.75
1.00
1.25
1.50
1.75
Area(x100,000)
0 500 1000 1500 2000 2500 3000 3500 Conc.0.0
0.5
1.0
1.5
2.0
2.5
3.0
3.5
Area(x100,000)
0 500 1000 1500 2000 2500 3000 3500 Conc.0.0
0.5
1.0
1.5
2.0
2.5Area(x1,000,000)
0 500 1000 1500 2000 2500 3000 3500 Conc.0.00
0.25
0.50
0.75
1.00
1.25
1.50
Area(x1,000,000)
0 500 1000 1500 2000 2500 3000 3500 Conc.0.00
0.25
0.50
0.75
1.00
1.25
1.50Area(x100,000)
0 500 1000 1500 2000 2500 3000 3500 Conc.0.0
0.5
1.0
1.5
2.0
2.5
Area(x1,000,000)
0 500 1000 1500 2000 2500 3000 3500 Conc.0.0
1.0
2.0
3.0
4.0
5.0
Area(x1,000,000)
0 500 1000 1500 2000 2500 3000 3500 Conc.0.0
2.5
5.0
7.5
Area(x100,000)
0 2500 5000 7500 Conc.0.0
1.0
2.0
3.0
4.0
5.0
6.0
Area(x100,000)
Naledr2 > 0.998
Quintozener2 > 0.999
Spiroxaminer2 > 0.999
MGK-264r2 > 0.999
Captanr2 > 0.998
Imazalilr2 > 0.999
Myclobutanilr2 > 0.999
Cis-Permethrinr2 > 0.996
Cy�uthrinr2 > 0.996
5
Pesticide analysis in Hops and Cannabis by GC-MS-MS
Figure 5 Chromatogram of cannabis matrix blank with hexane treatment (black) and without (blue) prepared using standard dSPE.
2.5 5.0 7.5 10.0 12.5 15.0 17.5 20.0 22.5 25.0 27.5 30.0 32.5 35.0 37.5
0.5
1.0
1.5
2.0
2.5
3.0
3.5
4.0
4.5
5.0
5.5
6.0
6.5
(x10,000,000)
3 mL hexane layer reduced low MWbackground considerably but no changeto THC/cannabinoids
Hexane, Verde dSPE
No hexane, Verde dSPE
GCMS Scan (TIC) of matrix blank
6
Pesticide analysis in Hops and Cannabis by GC-MS-MS
Figure 6 (Left) Table of recoveries for selected cleanup techniques. (Right) Images of various cleanups in progress. (Below) Dirty GCMS liner.
Standard dSPE (Restek C18, PSA, GCB)
Verde dSPE(Sigma PSA, GCB, Z-Sep+)
Z-Sep+(Sigma Z-Sep+)
Hexane layer, 3 mL post-salt
Combo cartridges (Agela Cleanert TPT)
Contaminated liner
Recovery Std SPE Std SPE withHexane
Verde only Verde withHexane
LOQ
Chlofentezine deg.
Dichlorvos
Propoxur
Ethoprophos
Naled
Dimethoate
Carbofuran
Quintozene
Diazinon
Parathion-methyl
Spiroxamine-1
Carbaryl
Metalaxyl (Mefenoxam)
Spiroxamine-2
Methiocarb
Malathion
Chlorpyrifos
MGK 264-1
Thiamethoxam deg.
MGK 264-2
Captan
Fipronil
Paclobutrazol
Fludioxonil
Myclobutanil
Kresoxim-methyl
Chlorfenapyr
Propiconazole-1
Propiconazole-2
Tri�oxystrobin
Tebuconazole
Spiromesifen
Acetamiprid
Phosmet
Fenoxycarb
Bifenthrin
Bifenazate
Chlorantraniliprole
Etoxazole
cis-Permethrine
Pyridaben
trans-Permethrine
Cy�uthrin-1
Cypermethrin-1
Boscalid
Etofenprox
Azoxystrobin
104.1%
92.6%
94.0%
88.1%
56.7%
89.6%
95.2%
78.3%
82.5%
84.8%
57.8%
89.9%
85.8%
57.5%
90.3%
89.5%
79.0%
80.4%
84.3%
81.1%
107.8%
87.1%
87.3%
81.8%
NA
85.9%
83.8%
76.3%
40.8%
89.9%
83.0%
113.1%
87.6%
NA
83.9%
76.9%
NA
75.9%
80.6%
81.9%
73.2%
75.4%
84.8%
82.5%
85.6%
71.3%
90.8%
76.6%
91.1%
103.4%
80.8%
85.1%
89.1%
112.1%
49.4%
70.1%
77.5%
55.9%
102.4%
86.1%
54.2%
105.0%
87.4%
63.7%
69.9%
80.2%
75.0%
87.7%
84.0%
89.5%
77.2%
NA
84.5%
79.3%
76.9%
76.4%
83.7%
80.6%
78.5%
82.5%
94.0%
81.8%
47.0%
NA
71.2%
62.1%
88.6%
63.6%
56.3%
81.7%
78.0%
82.9%
54.2%
88.0%
90.0%
42.0%
91.8%
76.4%
7.7%
80.1%
102.0%
75.1%
76.3%
81.1%
7.3%
106.6%
77.2%
8.2%
101.1%
81.5%
74.6%
77.5%
79.2%
77.3%
96.6%
78.1%
71.5%
74.0%
76.3%
79.8%
75.6%
63.2%
70.1%
83.5%
59.0%
76.0%
77.1%
82.6%
79.7%
72.7%
68.4%
68.5%
70.8%
62.0%
67.6%
69.5%
79.8%
76.5%
77.9%
69.1%
81.1%
44.5%
59.8%
91.5%
76.1%
22.7%
82.8%
93.8%
44.6%
69.6%
79.5%
6.4%
73.3%
73.3%
7.7%
76.7%
86.7%
62.0%
66.9%
78.9%
71.7%
72.0%
84.3%
75.5%
77.8%
77.5%
82.4%
78.1%
61.0%
68.5%
84.2%
64.5%
76.1%
91.2%
112.5%
87.3%
46.2%
71.5%
71.2%
64.2%
70.9%
61.0%
54.9%
77.3%
72.0%
80.4%
50.9%
86.7%
100
20
50
50
50
20
100
20
50
20
50
50
50
20
50
20
20
20
50
20
200
20
20
20
20
20
20
100
50
40
20
50
500
500
20
100
40
20
100
200
50
50
100
100
20
20
50
Pesticide analysis in Hops and Cannabis by GC-MS-MS
7
Figure 7 Chromatogram of cannabis matrix blank with standard dSPE and Verde dSPE. The Verde dSPE reduced the cannabinoid level signi�cantly and returned proper retention times to the compounds.
Figure 8 (Left) Chromatogram of hops matrix blank with standard and Verde dSPE. No hexane was used in either sample. (Right) Table of results of pesticide analysis in randomly selected cannabis samples.
Dramatic decrease in THC/cannabinoid amount with Verde dSPE. Proper retention time restored.
2.5 5.0 7.5 10.0 12.5 15.0 17.5 20.0 22.5 25.0 27.5 30.0 32.5 35.0 37.5
0.5
1.0
1.5
2.0
2.5
3.0
3.5
4.0
4.5
5.0
5.5
6.0
6.5
(x10,000,000)
29.50 29.75 30.00 30.25 30.50 30.75 31.00 31.25 31.50 31.75 32.00 32.25 32.50 32.75 33.00 33.25
0.5
1.0
1.5
2.0
2.5
3.0
3.5
4.0
4.5
5.0
5.5
6.0
6.5(x10,000,000)
GCMS Scan (TIC) of matrix blank
Hexane, Verde dSPE
Hexane, Standard dSPE
2.5 5.0 7.5 10.0 12.5 15.0 17.5 20.0 22.5 25.0 27.5 30.0 32.5 35.0 37.5
0.1
0.2
0.3
0.4
0.5
0.6
0.7
0.8
0.9
1.0
1.1
1.2
1.3
1.4
1.5
1.6(x100,000,000)
123 ng/g cy�uthrin, 99 ng/g cypermethrin
139 ng/g chlorfenapyr1064 ng/g chlorfenapyr
Verde dSPE also improved background in hops
Verde dSPE
Standard dSPE
Sample
BA01
BA02
BA03
BA04
BA05
BA06
BA07
BA08
BA09
BA10
BA11
BA12
BA13
BA14
BA15
Pesticides detected
First Edition: June, 2017
© Shimadzu Corporation, 2017
Pesticide analysis in Hops and Cannabis by GC-MS-MS
A method for detection of chemical residues in dried cannabis �ower samples by GC-MS-MS was developed. Our method can detect low levels of common pesticides in samples offered for retail sale with excellent selectivity and speed. Measurements of a larger selection of commercially available cannabis samples are being carried out.
Conclusion