Embed Size (px)
Citation preview

Perspectives on the Development of LNG Market Hubs in the Asia Pacific Region
March 2017
Independent Statistics & Analysis
www.eia.gov
U.S. Department of Energy
Washington, DC 20585

U.S. Energy Information Administration | Perspectives on the Development of LNG Market Hubs in the Asia Pacific Region i
This report was prepared by the U.S. Energy Information Administration (EIA), the statistical and analytical agency within the U.S. Department of Energy. By law, EIA’s data, analyses, and forecasts are independent of approval by any other officer or employee of the United States Government. The views in this report therefore should not be construed as representing those of the U.S. Department of Energy or other federal agencies.

March 2017
U.S. Energy Information Administration | Perspectives on the Development of LNG Market Hubs in the Asia Pacific Region 1
Introduction This report was prepared by ICF International, Inc. under contract to the U.S. Energy Information Administration (EIA). The report discusses current initiatives to establish regional liquefied natural gas (LNG) trading hubs and pricing benchmarks in Asia and assesses the prospects for the Asian gas hubs in the near future. The report examines the characteristics of successful natural gas trading hubs and develops qualitative and quantitative indicators of the components of effective hubs, with emphasis on applying these indicators to Asian markets.
As the global LNG market continues to grow and as liquidity increases in part as a result of U.S. participation, EIA’s aim is to better understand the interplay between U.S. LNG exports and international natural gas prices. This understanding will inform EIA’s international energy models and its outlook for the development of world natural gas markets.
Historically, effective market pricing points (referred to as market hubs) emerged in North America following the deregulation of natural gas commodity markets and the development of an extensive natural gas pipeline network. As natural gas markets have become less regulated in other parts of the world, notably Europe and the United Kingdom, market pricing hubs have emerged in those areas.
The large Asian markets (Japan, South Korea, Taiwan, and to a lesser degree China and India) have traditionally relied on LNG, which has been priced under long-term contracts tied to crude oil prices. With significant expansion of the global liquefaction capacity (primarily from new projects in Australia and the United States) and changes to LNG contracting, a more market-sensitive trade in LNG is emerging. However, Asia does not have a fully functioning pricing point that can reliably transmit price signals to the market. Development of reliable pricing indexes and market hubs in Asian countries that reflect the underlying demand-supply fundamentals becomes increasingly important as global natural gas markets evolve and mature.
Global liquefaction capacity is projected to increase by one-third by 2020. In recent years, high oil prices and rapid growth in natural gas demand (primarily in Asia) spurred major investments in the global export capacity of LNG. As a result, global LNG export capacity is projected to increase by one-third by 2020, with most of the new capacity located in Australia and the United States. Once all liquefaction projects currently under construction come online, the United States is projected to have the world’s third-largest LNG export capacity.
U.S. LNG exports will increase liquidity in global LNG trade and enhance supply security. The large U.S. LNG export capacity, combined with destination flexibility in the off-take contracts, will result in a greater liquidity in global LNG trade. The growth in liquidity will lead to a gradual shift away from long-term, oil-linked contract pricing toward more short-term, spot-based transactions. These changes will underscore the need for transparent and reliable regional LNG pricing indexes and trading hubs, particularly in Asia.
Asian markets lack a transparent pricing benchmark. Although Asia is the major natural gas-consuming region (accounting for one-third of the global natural gas trade and three-quarters of the global LNG trade), the region lacks a liquid and transparent LNG pricing benchmark similar to the Henry Hub in the

March 2017
U.S. Energy Information Administration | Perspectives on the Development of LNG Market Hubs in the Asia Pacific Region 2
United States or the National Balancing Point in the United Kingdom. Asian LNG consumers have historically relied on long-term contracts to guarantee the security of supply because they lack indigenous natural gas resources and have limited access to pipeline trade. Increasing volumes of flexible LNG supply in the region will lead to more liquid LNG trading in Asia.
Multiple initiatives are underway to facilitate price discovery in Asian LNG markets. Japan, China, and Singapore are now developing regional trading hubs in Asia Pacific markets and have launched LNG pricing indexes to increase the transparency in price formation. For example, the Japanese government developed a comprehensive strategy to liberalize its domestic natural gas market and launched major initiatives to encourage private-sector participation in the development of an LNG trading hub and a pricing index. Japan’s Fair Trade Commission is now probing resale restrictions in long-term LNG contracts that could fundamentally shift how LNG is contracted and traded. All three countries have established benchmark LNG pricing indexes and announced various financial instruments to be traded on domestic exchanges to encourage LNG price discovery and transparency.
The formation of functional natural gas market hubs in Asia Pacific will take time. In the United States and Europe, the development of natural gas hubs and pricing indexes took 15 years and 10 years, respectively. Each of the proposed LNG market hubs in Japan, China, and Singapore faces considerable regulatory and infrastructure challenges, including lack of third-party access to infrastructure and limited pipeline connectivity within and between countries. To attract multiple participants and reduce possible dominance of large, incumbent players, market liberalization will be necessary, including a regulatory environment that assures equal third-party access to natural gas infrastructure (pipelines, regasification facilities, storage, etc.) and promotes transparent LNG pricing based on demand and supply fundamentals.
As the global LNG market continues to evolve and mature, reliable pricing indexes and market hubs in Asian countries will fundamentally transform the global LNG market into a more efficient, integrated, and transparent market.

Perspectives on the Development of LNG Market Hubs in the Asia Pacific Region
November 2016
Independent Statistics & Analysis
www.eia.gov
U.S. Department of Energy
Washington, DC 20585
Prepared by ICF Fairfax, VA Under contract to Z, INC.

November 2016
U.S. Energy Information Administration | Perspectives on the Development of LNG Market Hubs in the Asia Pacific Region i
Acknowledgements
This report was prepared by ICF under contract to Z, INC for the U.S. Energy Information Administration (EIA). Information concerning the content of this report may be obtained from Victoria Zaretskaya, ([email protected]) and Mindi Farber-DeAnda ([email protected]). ICF acknowledges the valuable contribution of LNG market experts David Carlson and Jinyu Cheong at the Singapore Exchange (SGX); Heloise Capon and Shelly Kerr of S&P Global; and Ruth Liao and Ben Wetherall at ICIS Heren. Principal contributors from ICF are Leonard Crook, E. Harry Vidas, Cecelia Coffey and Natalie Amarin.
This report was prepared by the U.S. Energy Information Administration (EIA), the statistical and analytical agency within the U.S. Department of Energy. By law, EIA’s data, analyses, and forecasts are independent of approval by any other officer or employee of the United States Government. The views in this report therefore should not be construed as representing those of the U.S. Department of Energy or other federal agencies.

November 2016
U.S. Energy Information Administration | Perspectives on the Development of LNG Market Hubs in the Asia Pacific Region ii
Table of Contents Table of Contents .......................................................................................................................................... ii
1 Executive Summary ............................................................................................................................... 1
2 Introduction ........................................................................................................................................... 7
3 Market Hub Economics and Characteristics .......................................................................................... 9
4 Market Hubs in the United States and Canada ................................................................................... 13
4.1 Background ............................................................................................................................... 13
4.2 Henry Hub and Select Hubs in North America.......................................................................... 14
4.3 Liquidity and the Churn Rate in the United States ................................................................... 15
4.4 Observations on U.S. and Canadian Hub Development ........................................................... 16
5 Market Hubs in Europe ........................................................................................................................ 17
5.1 Overview of the European Gas Market .................................................................................... 17
5.1.1 Gas Market Reform in the United Kingdom ........................................................................... 17
5.1.2 Gas Market Reform in Europe ................................................................................................ 18
5.1.3 European Gas Market Today .................................................................................................. 18
5.2 Key European Hubs ................................................................................................................... 20
5.2.1 Austria Central European Gas Hub (CEGH) ......................................................................... 21
5.2.2 Belgium Zeebrugge Hub (ZEE) ............................................................................................. 21
5.2.3 France Trading Region South (TRS) and Point d’Exchange Nord (PEG Nord) ..................... 22
5.2.4 National Connect Germany (NCG) ...................................................................................... 22
5.2.5 Germany Gaspool (GPL) ...................................................................................................... 23
5.2.6 Italy Punto di Scambio Virtuale (PSV) ................................................................................. 23
5.2.7 Netherlands Title Transfer Facility (TTF) ............................................................................. 23
5.2.8 Spain Mercado Ibérico Del Gas (MIBGAS) .......................................................................... 24
5.2.9 United Kingdom National Balancing Point (NBP) ................................................................ 24
5.3 Price Convergence at Major European Hubs ............................................................................ 25
5.4 Observations on European Hub Development ......................................................................... 26
6 Asia Pacific Gas Market ........................................................................................................................ 28
6.1 LNG and the Asia-Pacific Gas Market ....................................................................................... 28
6.2 Natural Gas Prices and Price Formation ................................................................................... 32
6.3 Conditions for the Development of a Natural Gas Market Hub in Asia ................................... 34
7 Market Hub and Price Index Developments in Asia Pacific ................................................................. 36

November 2016
U.S. Energy Information Administration | Perspectives on the Development of LNG Market Hubs in the Asia Pacific Region iii
7.1 Market Hub Developments ...................................................................................................... 36
7.1.1 Japan ................................................................................................................................... 36
7.1.2 China-Shanghai ................................................................................................................... 39
7.1.3 Singapore ............................................................................................................................ 41
7.1.4 Summary of Asia-Pacific Hub Developments ...................................................................... 41
7.2 Indexes Tracking LNG Prices in Asia Pacific .............................................................................. 41
7.2.1 Japan Monthly LNG Spot ..................................................................................................... 41
7.2.2 East Asian Index (EAX) ......................................................................................................... 42
7.2.3 Japan Korea Marker (JKMTM) ............................................................................................... 42
7.2.4 SGX LNG Index Group (SLInG) ............................................................................................. 43
7.2.5 Other LNG Indexes .............................................................................................................. 43
7.2.6 Comparison of Asia-Pacific LNG Indexes ............................................................................. 44
7.2.7 Prospects for an Asia-Pacific Gas Market Hub in Japan .................................................. 47
7.3 Summary Observations ............................................................................................................ 49
Appendix A. Acronyms ................................................................................................................................ 53
Appendix B. Key Terms and Definitions ...................................................................................................... 55
Appendix C. Churn Rate Analysis ................................................................................................................ 58
Appendix D. Gas Price Formation in Japan and China ................................................................................ 60
D.1 Japanese Custom Crude Clearing (JCC) formula ....................................................................... 60
D.2 China Pricing Formula ............................................................................................................... 60

November 2016
U.S. Energy Information Administration | Perspectives on the Development of LNG Market Hubs in the Asia Pacific Region iv
List of Tables
Table 3-1. Stages of development of market hubs ..................................................................................... 10 Table 4-1. North American natural gas hub metrics ................................................................................... 14 Table 4-2. Example calculation of natural gas churn ratio for the United States ....................................... 16 Table 5-1. Natural gas balances for select European countries, 2015 ........................................................ 19 Table 5-2. Metrics for select European gas trading hubs ........................................................................... 21 Table 6-1. Natural gas balances for select Asia-Pacific countries, 2015 ..................................................... 28 Table 6-2. Global LNG imports by region .................................................................................................... 29 Table 6-3. Largest LNG exporting countries, 2015 ...................................................................................... 29 Table 7-1. Characteristics of Asia-Pacific LNG price indexes ...................................................................... 45 Table 7-2. Comparing Asia-Pacific gas market maturity to U.S. and European development ................... 50 Table C-1. Physical gas trades reported for 2015 to FERC and PREs .......................................................... 59
List of Figures
Figure 1-1. Stages of gas market hub development ..................................................................................... 1 Figure 5-1. Price movements at European hubs, January 2014–October 2016 ......................................... 26 Figure 6-1. World LNG trade by contract duration, 2000–2015 ................................................................. 30 Figure 6-2. LNG contracted volumes and contract expirations .................................................................. 31 Figure 6-3. Selected annual average prices for gas and LNG, 2000–2015 .................................................. 33 Figure 7-1. Japan’s natural gas infrastructure, 2015 .................................................................................. 36 Figure 7-2. Price of LNG imported to China (Shanghai), 2016 .................................................................... 40 Figure 7-3. Comparison of price indexes for spot LNG in Asia Pacific, 2014–16 ........................................ 46

November 2016
U.S. Energy Information Administration | Perspectives on the Development of LNG Market Hubs in the Asia Pacific Region 1
1 Executive Summary Natural gas market hubs have been a key feature of competitive gas markets in the United States, the United Kingdom, and Europe. These hubs provide physical locations for trading gas and ultimately for price discovery of natural gas sold in the hub. The most important hubs have publicly reported price indexes that are benchmarks for the value of gas in the larger market. These price indexes in turn form the basis for futures contracts and for managing price risk.
With Asia Pacific as the world’s largest liquefied natural gas (LNG) consuming region, governments in the region have sought to liberalize their domestic markets to promote competitive LNG trading that can provide price discovery for LNG. This report examines the development of gas market hubs in North America and Europe to evaluate whether such hubs are likely to develop in Asia Pacific.
The key stages of maturity in natural gas hub development are illustrated in Figure 1-1. The history of gas market hubs indicates that there are certain prerequisites necessary for market hubs to develop. A robust natural gas infrastructure is presumed. Gas market deregulation allowing prices to reflect supply and demand and third-party access (TPA) to transport facilities is also necessary.
Figure 1-1. Stages of gas market hub development
Fully mature gas market hubs have many independent buyers and sellers, open access to transport facilities, trading liquidity, and clear and transparent price and volume reporting by price reporting entities (PREs). The reported prices can become indexes of market conditions at the hubs and attract non-physical traders who increase the market liquidity. The most successful hubs are liquid trading centers with many buyers and sellers buying and selling gas. These hubs can become the locus of financial futures contracts and ultimately a liquid forward price curve that allows for price discovery months and years into the future.
The first natural gas hubs emerged in the United States in the 1990s. Market reforms initiated by the Federal Energy Regulatory Commission (FERC) promoted competitive gas markets and specifically encouraged the development of “market centers.” The United Kingdom and the European Union

November 2016
U.S. Energy Information Administration | Perspectives on the Development of LNG Market Hubs in the Asia Pacific Region 2
subsequently began market reforms that also led to the development of gas market hubs. Henry Hub in the United States is the most successful gas market hub with a large, liquid futures market linked to the price index at the hub, which serves as a benchmark indicator of the value of gas in the United States. Benchmark pricing is also provided in the United Kingdom at the National Balancing Point (NBP) and the Netherlands at the Title Transfer Facility (TTF), although neither has a forward price curve as liquid as Henry Hub.
These gas market hubs in the United States and in Europe are connected with natural gas pipeline systems that provide for continuous supply and trading as gas flows through the system. The Asia Pacific presents unique problems for hub development, given its geography, its reliance on LNG, and the relatively large ship-size volumes typical of LNG contracts and deliveries to regasification terminals. None of the major Asia Pacific LNG importing countries has a robust domestic market with fully deregulated gas prices and TPA. The traditional LNG contract structures contain long-term commitments, LNG prices linked to oil prices, and re-delivery restrictions that limit the buyer’s option to sell unneeded LNG to other markets.
LNG markets are undergoing significant changes as a consequence of softening demand in Asia Pacific, a growing LNG supply, and lower oil prices. These conditions have encouraged the growth in spot LNG trading, shorter-term contracts, and pressure to modify destination clauses in LNG contracts. The governments of Japan, China, and Singapore have recognized the importance of creating gas market hubs for the purpose of price discovery and are each taking steps to promote such LNG market hubs.
Japan’s Ministry of Economy, Trade and Industry has announced a strategy to promote the liberalization of the domestic gas market, which is tied to the development of a Japanese LNG market hub. The government of Japan will follow policies to encourage private sector parties to develop a trading hub. The Japanese strategy provides a coherent way forward to create the conditions for an LNG market hub.
China has encouraged the development of a gas trading hub centered on Shanghai and private entities have begun reporting prices there. Chinese gas prices are heavily regulated and the outlook for a successful gas hub developing there in the near future is dim.
Singapore has developed infrastructure to accommodate LNG delivery and storage and has a fully deregulated gas market. However, efforts to create a hub at Singapore must address the fact that it is a small market.
A number of PREs (Platts, Argus Media, ICIS Heren, and others) have begun reporting spot LNG prices in Asia Pacific and have developed their own price indexes. Several exchanges also offer LNG futures contracts (although, there has been limited trading activity to-date). What is noteworthy is that the reported indexes are not founded on specific gas market hubs, but rather, on general LNG market trading across the Asia Pacific region. The price indexes rely on voluntary reporting by market participants for which PREs have established protocols for ensuring the consistency and reliability of reported prices. With the exception of the Platts Japan Korea Market (JKM) index, there appear to be few trades tied to these indexes. Nevertheless, these LNG indexes are likely to remain the most reliable indicator of natural gas market value in Asia Pacific.

November 2016
U.S. Energy Information Administration | Perspectives on the Development of LNG Market Hubs in the Asia Pacific Region 3
Key metrics of market hubs as they apply to countries in Asia Pacific are summarized below.
Successful Gas Market Hubs are Highly Liquid
Fully developed gas market hubs have many independent buyers and sellers, open access to transport facilities, significant trading volume, and clear and transparent price and volume reporting – all of which allow for high liquidity. A market hub can be a specific location, like Henry Hub, or a notional hub that reflects a trades over a defined network. Examples of notional hubs are Canada’s AECO-C in Alberta, the National Balancing Point (NBP) in the United Kingdom, or the Title Transfer Facility (TTF) in the Netherlands. Other hubs can exist which serve many of the same functions of market hubs but do not have the liquidity to create pricing information adequate for indexation. The presence of an active futures market tied to a price index provides confirmation for the pricing reliability of the market hub and its index.
Besides Henry Hub in Louisiana, the North American market has a number of other hubs with high liquidity, index pricing, and futures contracting. The regulatory reforms in the U.S. market that helped create the conditions for the emergence of gas market hubs included de-regulation of gas commodity prices, the unbundling of sales versus transport services, and open third party access to transportation. Preceding these reforms was a period of market upheaval, including excess supply that resulted in pressures on traditional ways of doing business (not unlike the events in Asia Pacific today).
Regulatory Reforms and Sufficient Physical Infrastructure are Critical Enablers of Hub Development
Market hubs in Europe grew out of regulatory reforms in the United Kingdom and later directives from the European Union to encourage competition in gas markets. The full development of gas market hubs in Europe has been slower than in the United States due to varying regulations and industry organization across the countries of the European Union. The expansion of large, transnational pipeline systems has progressed relatively recently, allowing regionally-interconnected networks to create opportunities for custody transfers of gas that facilitate the balancing of European gas markets and the propagation of price information. With price discovery occurring at key hubs like the NBP and the TTF, futures contracts have been developed and are traded in those locales.
Although both North America and Europe have markets that are pipeline based, pipelines in Asia Pacific are limited to the countries themselves, the exception being Southeast Asia where transnational pipelines connect several countries and China with interconnections to other parts of continental Asia. The distinguishing feature in Asia Pacific is the LNG trade, which is the major component of gas supply. Three countries are vying to become the LNG hub for Asia Pacific – Japan, Singapore, and China (Shanghai). Efforts are underway in each of these countries to create the conditions whereby markets through the interactions of many buyers and sellers determine gas prices.
LNG Price Discovery Exhibits Unique Challenges in Addition to those Surrounding Trading Hub Development
LNG price discovery presents a number of challenges to the pipeline-based model of market hub and price index development. This model relies on more or less continuous flows of gas, daily scheduling of

November 2016
U.S. Energy Information Administration | Perspectives on the Development of LNG Market Hubs in the Asia Pacific Region 4
receipts and deliveries, homogeneity of product, uniform transportation and contracting rules, and diligent regulatory oversight. In contrast, LNG shipments are large and lumpy; there can be significant time between contracting and delivery; cargoes can differ in LNG specifications; LNG import terminals have limited interconnectivity, and bi-lateral contracts set the operating rules, not government regulation.
Nevertheless, this study has found that the contracting regime for Asia Pacific LNG trading is rapidly changing in important ways. Long-term contracts are becoming shorter; there are more medium and short term deals, the latter defined as less than two years. There is more interest in breaking the destination clause restrictions thus allowing more contracted supply to be diverted to other terminals in response to market needs. There is some spot market contracting, but it appears to still be a small part of the market. Pricing terms are also changing with the addition of hybrid pricing terms: some deals are linked to spot indexes, such as Henry Hub, or sometimes to local price indexes, in addition to traditional linkages to various oil indexes, or a combination of all of these.
There are also two publically available spot LNG indexes developed by Japan’s Ministry of Economy, Trade, and Industry and a free-of-charge index published by Singapore Exchange (SGX) reflecting a Singapore FOB price for LNG. All of these reported index prices are derived from actual trades that are adjusted in some fashion to create more transparent and consistent price index. In some cases, the indexes may also contain bid and ask offers or hypothetical trades based on known origin prices and transportation costs between the origin and destination points. LNG traders may use one or more of these price indexes to price gas by formula. Other than anecdotes, there is no solid information on which of these indexes is being used by traders. The JKM index was most frequently mentioned during interviews as being one that is used by traders to price deals. Nevertheless, oil-based contracting dominates, which is understandable given the liquidity of the oil markets and the ability to hedge on the oil indexes.
No Location in Asia Pacific has a Sufficiently Developed Physical or Regulatory System to Promote the Imminent Creation of a Trading Hub
The research undertaken for this report suggests the market pre-conditions do not currently exist to allow Japan, China (Shanghai), or Singapore to be fully liberalized markets where natural gas prices are efficiently and transparently determined by supply and demand. Japan is just now moving towards liberalizing its internal gas market and has a limited network connectivity for internal trading of gas. China’s pricing regime has different price determinations for pipeline and LNG supply and limited communication between the two systems. Singapore, as noted before, is a small market and the surrounding countries markets still operate under price controls. Therefore, we do not see an Asian market hub evolving in the near-term with a liquid market capable of producing a reliable price index that can be used for Asia-wide or reginal transactions.
However, spot and short-term Asian LNG trade does appear to be liquid enough to provide adequate price discovery and indexation, but with caveats. It is a large market operating over a transportation network of LNG tankers, under conditions akin to “open access” rules, where bi-lateral negotiations set prices parties will pay on fixed price basis or with formulas linked to oil or gas indexes. And there are a

November 2016
U.S. Energy Information Administration | Perspectives on the Development of LNG Market Hubs in the Asia Pacific Region 5
variety of entities reporting prices and trading activity. On the other hand, Asia Pacific is vast, with the major markets operating under very different legal and economic conditions. Access to regasification terminals are not open to third parties for the most part. Transport costs within the region, though transparent are significant. This requires indexes at multiple locations or corrections to put a single index into a common locational basis.
Japan’s National Policy Directives May Outline a Way Forward for LNG Hub Development in Asia
The outlook for a Japan trading hub is uncertain, yet market liberalization and price index formation have set the country on a track toward the development of a larger, more liquid trading hub. Japan’s Ministry of Economy, Trade and Industry (METI) has summarized the essential problem well in its 2016 Strategy for LNG Market Development. For a market hub to be developed, there needs to be a much more robust trade in physical LNG on a spot market. A more robust trade depends on greater flexibility in LNG commercial operations. At the same time, a spot market must have some way of identifying a market price in order to develop. The Government of Japan seems intent on promoting a Japanese market index for LNG and is encouraging private sector activities for the development of a market hub upon which such an index could be developed and led by the private sector.
While the ideal achievement of a large, liquid hub with low transaction costs may still be a decade or more away, steps may be taken today to facilitate greater market development. These include establishing a standard for gas quality (heat content), expanding regional gas transport infrastructure so as to facilitate greater intra-national trade, and establishing forms of market oversight and cost recovery that allow for consistent third-party access both to infrastructure and to markets. Several barriers to hub development remain in Japan, including a status quo of legacy, long-term contracts that would need to be replaced with spot trading. Other barriers include the physical need for greater LNG transportation and storage capacity within Japan, as well as resistance from market players who fear losing their investments in the existing market structure, were a major gas market liberalization to be accomplished. Despite these barriers, greater price transparency provided by a number of LNG price indexes that have been developed in the Asia Pacific region and the commitment of METI to support market restructuring have established Japan as a regional leader in the development of a larger, more liquid LNG trading hub.
LNG Indexes are Likely to Remain the Most Reliable Indicator of Natural Gas Market Value in Asia
Applying the U.S. and European concept of a trading hub to natural gas and LNG price discovery in Asia Pacific may not be appropriate in that no single location will have the proper characteristics in the near-term. Rather, given the ongoing activity in developing spot and short-term LNG price indexes, it is more likely that index pricing using those LNG indexes will continue to grow so as to reflect a value(s) of LNG in different markets across the Asian trading landscape. Liquid physical trading hubs may eventually develop in Japan, Singapore, Shanghai and other areas, yet both publically-driven and privately-driven initiatives to increase trade volumes and price transparency will be critical steps in the maturation of these markets and the evolution of reliable hub-based price indexes. Such hub-based price indexes would reflect the monthly and half-month Asian LNG price indexes and, presumably, would expand to include hub-specific daily price discovery as well. As existing LNG price surveys continue to improve in accuracy and increase their significance as indicators of the market price for LNG and reliable hub-based

November 2016
U.S. Energy Information Administration | Perspectives on the Development of LNG Market Hubs in the Asia Pacific Region 6
price indexes emerge, indexes will be more reliably used not only to set the pricing for sales and purchase contracts, but also to serve as the basis for greater volumes of futures and derivatives trading.
Key metrics to watch for in the development of reliable LNG price indexation include:
• The expiration of long-term LNG contracts, accompanied by indicators of their replacement by shorter-term contracts (i.e., 4 years or less)
• More spot LNG cargoes • Progress in Japan’s gas market liberalization • More short-term trades tied to indexes rather than negotiated fixed prices

November 2016
U.S. Energy Information Administration | Perspectives on the Development of LNG Market Hubs in the Asia Pacific Region 7
2 Introduction The United States is on the verge of becoming a major exporter of liquefied natural gas (LNG). Markets for these exports will include Europe, South America, and Asia. The large LNG-consuming nations of the Asia Pacific region1 are undergoing major changes in how LNG is bought and sold. While in the United States and to some degree in Europe, gas market centers (called hubs) provide pricing transparency and an indication of market balances, the situation in the Asia Pacific region is less clear. The U.S. Energy Information Administration (EIA)2 has undertaken a review of the developments in these export markets to get a better understanding of how and when LNG hub-based prices and market transparency may evolve.
LNG in the Asia Pacific region is traded primarily under long-term, full-commitment contracts between buyers in the region and sellers from around the world.3 LNG prices are often linked to the price of crude oil through formulas negotiated privately between the parties. The dominant crude oil linkage is with the Japan customs-cleared crude (JCC) price of oil. LNG contracts typically include restrictions on where the LNG can be delivered, referred to as destination clauses. They also have take-or-pay provisions that require buyers to pay for LNG even when it is not needed. In combinations, these contract terms offer buyers little flexibility in managing supply. At the same time, the value of LNG and natural gas is often distorted in that it largely follows oil prices and does not reflect market supply and demand dynamics. This contract structure has existed to ensure the revenue stream that supports the large capital investments in LNG liquefaction, shipping, and regasification facilities. The linkage to widely traded oil also provides a way to manage price risk through hedging strategies.
The global LNG market is undergoing significant changes. Australia is adding large volumes of new liquefaction capacity. In the United States, the shale revolution in gas supply has ended U.S. imports of LNG and has spurred the construction of export-oriented liquefaction plants. New supplies may come online in east Africa in the next ten years. While markets for LNG in Asia are expected to expand in the long term, with growing demand in China, India, Pakistan, Thailand, Malaysia, Indonesia, and Singapore, and new upcoming markets in Vietnam, Philippines, and Bangladesh, demand for LNG has softened considerably at present.
With these developments, LNG contracts in Asia Pacific are coming under pressure, particularly with respect to the oil price linkages and the delivery restrictions in LNG contract destination clauses. Spot trading has increased. Japan, Singapore, and China are seeking a more transparent LNG pricing that represents the interplay of supply and demand. Several organizations in Asia have announced their intentions to develop natural gas market hubs. 4 However, at present there is no fully functioning pricing point in Asia Pacific that can reliably transmit price signals to the market.
1 Asia Pacific as used in this report represents the major LNG importing countries of the Western Pacific Ocean: Japan, South Korea, Taiwan, China, and Singapore. The other gas-consuming or gas-producing countries in the region include Vietnam, Thailand, Malaysia, Myanmar, Brunei, Philippines, Papua New Guinea, Australia, and New Zealand. India, Bangladesh, and Pakistan are not covered in this report because of the distance from other Asia Pacific countries. 2 Appendix A contains a full list of acronyms used in this report. 3 Full commitment contracts require buyers of LNG to take all of their gas from suppliers’ dedicated LNG facilities with very limited opportunities for adjusting the purchased quantities. These contracts also include take-or-pay provisions requiring buyers to pay for gas contracted, even if contract volumes are not taken. 4 Bold italicized terms are defined in Appendix B.

November 2016
U.S. Energy Information Administration | Perspectives on the Development of LNG Market Hubs in the Asia Pacific Region 8
An important feature of gas market liberalization in the United States and Canada, as well as in the United Kingdom and Europe, is the emergence of natural gas market hubs. Market hubs develop where multiple pipelines converge and interconnect and where numerous parties meet to buy and sell natural gas at negotiated prices. Various publications report the price, volume, and number of the trades at these market hubs. The prices reported at market hubs can be important indicators of the natural gas supply/demand balance for the regions served by those market hubs. Major market hubs, where large volumes are traded among many parties, can become centers for futures contracts. These contracts and their derivatives help buyers and sellers manage financial risk around future deliveries.
This study examines the characteristics of gas market hubs and assesses the likelihood of a natural gas market hub developing in Asia Pacific. A major emphasis is on the prerequisites for gas market hubs that create benchmark price indexes. These benchmark indexes, such as the Henry Hub gas price in the United States, are widely accepted by industry as indicative of the market’s supply and demand balance. They are critical to the development of contracts for future deliveries and a myriad of financial hedging instruments. The analysis examines gas hubs in the United States and Canada as well as market hub developments in the United Kingdom and the European Union. For Asia Pacific, the focus is on efforts to create LNG and gas hubs in Singapore, China, and Japan.

November 2016
U.S. Energy Information Administration | Perspectives on the Development of LNG Market Hubs in the Asia Pacific Region 9
3 Market Hub Economics and Characteristics The history and characteristics of natural gas market hubs have been well documented. EIA has published a number of reports on gas hubs in North America.5 The Oxford Institute for Energy Studies (OIES) has analyzed European gas market hubs.6 The International Energy Agency (IEA) published a report in 2013 on the outlook for developing a natural gas market hub in Asia.7
This section draws on this literature to describe stages of market hub development. These stages occur within the broader context of regulatory reforms to transform the natural gas industry from a highly regulated, monopolistic structure to a more competitive marketplace. Central to this transformation has been the development of physical gas market hubs with a close interaction between supply and demand. This section discusses the key characteristics of gas market hubs that support competitive markets and reliable benchmark price indexes.
Gas market hubs that report reliable price information require a number of actions by government and industry aimed at creating the conditions for price discovery. The following discussion assumes that the physical facilities necessary for a market hub are already present. These include adequate physical pipeline capacity for large volumes of gas with access to both supply and end use markets, nearby gas storage, adequate interconnection facilities, and a market hub operator. An LNG market hub would also include port facilities, LNG storage, regasification or liquefaction capacity, and pipelines interconnected with the markets. The stages of market hub maturity are summarized in Table 3-1.
Stages 1 and 2 have been critical to the development of competitive gas markets and the operations of gas market hubs. Virtually all gas industries arose with transmission pipelines selling bundled service (gas and transportation) to distributors and end users. To facilitate market reform, government regulators have deregulated the price of gas and required the separation of gas sales from transportation and related services (e.g., gas storage). At the same time, regulators required transmission pipelines to offer non-discriminatory TPA. Removing barriers to entry in Stages 1 and 2 allowed more parties to buy, sell, and transport gas (Stage 3) at the physical hubs through many individual bilateral transactions. As trading activities have grown, various PREs began canvassing parties and reporting price and volume trades. In Stage 4 the PREs’ reporting provides a degree of price transparency that leads to price discovery and allows market participants and outsiders to evaluate market fundamentals. This transparency has encouraged more parties to enter the market. Typically, the PREs aggregate all sales and report average prices for the time period. In the United States, reported pricing follows guidelines established by the Federal Energy Regulatory Commission (FERC) as well as reporting standards set by the publications.8
5 U.S. Energy Information Administration, “Natural Gas Market Centers and Hubs: A 2008 Update” (accessed October 2, 2016), https://www.eia.gov/pub/oil_gas/natural_gas/feature_articles/2009/ngmarketcenter/ngmarketcenter.pdf; U.S. Energy Information Administration, “The Emergence of Natural Gas Market Centers” (accessed October 2, 2016), Natural Gas 1996, http://www.eia.gov/pub/oil_gas/natural_gas/analysis_publications/natural_gas_1996_issues_trends/pdf/it96ch3.pdf. 6 The Oxford Institute for Energy Studies, “The Evolution of European Traded Gas Hubs” (accessed October 2, 2016), https://www.oxfordenergy.org/wpcms/wp-content/uploads/2016/02/NG-104.pdf. 7 International Energy Agency, “Developing a Natural Gas Trading Hub in Asia: Obstacles and Opportunities” (accessed September 24, 2016), http://www.iea.org/publications/freepublications/publication/asiangashub_final_web.pdf. 8 U.S. Federal Energy Regulatory Commission, “Policy Statement on Natural Gas and Electric Price Indexes” (accessed September 23, 2016), https://www.ferc.gov/legal/maj-ord-reg/policy-statements.asp.

November 2016
U.S. Energy Information Administration | Perspectives on the Development of LNG Market Hubs in the Asia Pacific Region 10
Table 3-1. Stages of development of market hubs Stages Explanation
1 Gas prices deregulated and gas sales unbundled from gas transmission
Governments deregulate the price of natural gas and regulators reform the market to separate the commodity sales function from transportation and other logistics services. Number of buyers and sellers increases.
2 Third party access to transport facilities, terminals
Regulators mandate that all potential infrastructure users have access on non-discriminatory commercial terms, known as third-party access (TPA). This opens the hub network to the new buyers and sellers.
3 Bilateral trading predominates
Multiple parties begin to contract with each other on their own terms and over the TPA facilities. Producers can trade directly with distributors and large end users. The number of parties and transactions expands.
4 Transparency in pricing and volumes traded
Price reporting entities (PRE) begin publishing pricing information where prices and volumes are reported and published daily, weekly, or monthly, under rules to ensure accuracy. Reliable price information supports bilateral trading and reduces transaction costs.
5 Standardization of trading rules and contracts
Instituted by regulators or an industry organization, such as the North American Energy Standards Board (NAESB), ensures common use of terms and standardized trading and transfer practices. This facilitates trading by reducing transaction costs and making trading more efficient.
6 Over-the-counter (OTC) brokered trading
In addition to producers, distributors, and end users, traders such as merchants, financial institutions, and brokers enter the market to trade gas and provide additional market liquidity.
7 Price indexation Liquidity at the hub increases to the point that PRE-reported prices at the hub become a reliable indicator of market balance. The reported prices become a reliable index that parties will cite for future pricing in long-term contracts.
8 Non-physical traders enter Non-physical traders offering pure financial hedging instruments based on the hub index enter the market to take price risk and offer customized OTC hedging services linked to the index.
9 Futures exchange A commodity exchange such as the New York Mercantile Exchange (NYMEX) creates a standardized tradeable futures contract and offers a trading platform under exchange rules.
10 Liquid forward price curve Parties trade large numbers of futures contracts for deliveries many months out, providing future price discovery and a means of managing price risk on future commitments.
Source: Adapted from Patrick Heather, The Evolution of European Traded Gas Hubs, Oxford Institute for Energy Studies
With the growth of trading at some gas market hubs, commodity trading exchanges have offered alternative platforms for executing physical trades. Exchange participants submit offers to sell and bids to buy on the exchange (i.e., bid and ask). The exchange matches bids and asks and establishes the market clearing price. Trading is anonymous; the exchange reports on its website the results of the trade, which include bid, ask, final price, and quantity.
Standardization of contract terms and operating rules (Stage 5) further enhances trading by reducing uncertainty and lowering transaction time and costs. In the United States and Canada industry groups like NAESB have led the standardization. In Europe and the United Kingdom, government regulators have installed operating codes as part of overall market reform. With widely available price information and larger numbers of parties trading under uniform rules, other parties not directly involved in gas production or consumption enter the markets (Stage 6). These parties include banks, brokers, and gas merchants. Besides buying and selling gas, they also provide various merchant services and risk

November 2016
U.S. Energy Information Administration | Perspectives on the Development of LNG Market Hubs in the Asia Pacific Region 11
management in over-the-counter (OTC) individual transactions. With the entry of these parties into the market, trading increases, and markets at hubs become more robust and liquid.
Liquidity is an essential feature of a mature gas market hub. “A market is often said to be liquid when the prevailing structure of transactions provides a prompt and secure link between the demand and supply of assets, thus delivering low transaction costs.”9 A liquid market at a hub allows trades to occur quickly and with a minimal impact on the price. Liquidity is represented by the number of trades, the number of independent parties trading, and the volumes of trades. Churn rate is a term used to describe one aspect of liquidity: the number of times a unit of natural gas is traded at a hub, physically and through financial instruments such as futures contracts. A gas market hub with a high rate of churn is also a highly liquid market hub.
The reliability and transparency of the prices reported by the PREs are critical in the development of a liquid gas market hub. Market participants must be comfortable that the prices reported are true and reflect the value of gas at any point in time for that hub location. When this acceptance is widespread, the prices reported at a gas market hub can be said to be an index for that hub (Stage 7). Buyers and sellers will be willing to strike deals for future deliveries at the future unknown index price for that hub. Price indexation, combined with other factors, can attract non-physical traders (e.g., investment banks, trading houses) offering purely financial derivative products tied to the hub index (Stage 8). The other factors include gas market liquidity at the hub, evidenced by the large number of participants trading large volumes of gas in many independent transactions.
Where trading at a market hub is sufficiently robust, it can support a standardized financial futures contract offered by an organized exchange (Stage 9) such as the NYMEX or Intercontinental Exchange (ICE). Futures contracts and their derivatives provide low-cost, standardized price risk management for gas deliveries in the future and future price discovery. Where these contracts become highly traded across many months or years, the forward prices can become reliable indicators of what market participants consider the value of gas in the future to be at that gas market hub. A robustly traded forward price curve is the final stage in the evolution of a gas market hub that yields a benchmark price index (Stage 10). An indicator of a liquid forward curve would be a large amount of open interest for the futures or derivatives contract extending months into the future.
Not all gas hubs have the same functionality and physical structure. The ten stages of hub maturity are useful for categorizing or distinguishing between hubs. Transit hubs operating in competitive markets have substantial volumes of gas moving across the hub, but little trading takes place. PREs may report prices at transit hubs despite relatively thin trading. These hubs operate at Stages 4 and 5. Successful gas market hubs operate at least at Stage 8 or even Stage 9. Prices at these hubs can be widely followed and frequently reported as indicative of the market conditions. (Gas market hubs may be located where major pipeline systems intersect or they may be notional points in a pipeline network; these latter points are referred to as notional market hubs and sometimes as virtual market hubs.) Few gas market hubs operate at stage 10, where there is a liquid forward price curve based on the hub’s price index.
9 Gabrielsen, Alexandros with Massimiliano Marzo and Paolo Zagaglia, “Measuring Market Liquidity: An Introductory Survey” (accessed May 17, 2016), p. 1, http://arxiv.org/pdf/1112.6169.pdf.

November 2016
U.S. Energy Information Administration | Perspectives on the Development of LNG Market Hubs in the Asia Pacific Region 12
Indeed, one recent paper asserts that of all the hubs in the world, only Henry Hub in Louisiana constitutes a fully functional market hub where reliable price discovery takes place (Stage 10).10
10 Makholm, Jeff D., “There is but One True Hub, and His Name is Henry,” Wiley Periodicals: Natural Gas & Electricity, June 2016 http://www.nera.com/content/dam/nera/publications/2016/GAS32_11b_Makholm.pdf.

November 2016
U.S. Energy Information Administration | Perspectives on the Development of LNG Market Hubs in the Asia Pacific Region 13
4 Market Hubs in the United States and Canada
4.1 Background
The world’s first gas market hubs appeared in the United States in the 1990s and were a result of governmental reform of the natural gas industry.
Beginning in the mid-1980s, FERC initiated reforms of the natural gas pipeline industry that were aimed at promoting competitive markets for natural gas. These reforms culminated in FERC Order 636 in 1992. Combined with Congress’ lifting price controls on natural gas, the reforms transformed the U.S. natural gas industry. Two important reforms were fundamental in this restructuring. First, FERC separated gas sales from gas transportation; pipelines were limited to providing transportation services exclusively. Second, FERC mandated TPA. FERC prohibited pipelines from selling bundled gas service and required non-discriminatory open access to pipeline services. As FERC was reforming the U.S. gas industry, a parallel effort was underway in Canada to deregulate gas prices, separate gas sales from transportation, and require TPA.
FERC specifically prohibited pipelines from instituting rules that would limit the development of “market centers.”11 Market centers were defined by FERC as locations where pipelines interconnected and where there was a possibility for gas trading. Operators of market centers could offer commodity exchange services, e.g., wheeling, park and loan, storage, title transfer, and trading. By the mid-1990s, a number of these market centers had sprung up around the country offering these services and actively trading gas. The most important of these was Henry Hub in Erath, Louisiana.
Fairly quickly, gas buyers and sellers and a new breed of gas market middlemen (marketers, traders, and aggregators) began using these market centers, or market hubs as they came to be referred to, as locations for trading physical gas, mostly by means of direct bilateral deals between parties. Early on, several PREs began publishing the prices of gas traded at Henry Hub and at other hub locations. These PREs relied on voluntary daily surveys of trading parties. While the reported prices were considered reliable, there were instances of misreporting of trades and more elaborate efforts at market manipulation at some hubs.12 The Energy Policy Act of 2005 expanded FERC jurisdiction to monitor markets and to issue rules prohibiting false reporting or other forms of market manipulation.13
The NYMEX selected Henry Hub as the site for its natural gas futures contract beginning in 1990. The standard futures contract is for 10,000 million British thermal units (MMBtu). Daily clearing prices for futures contracts for monthly deliveries extend forward about eight years. Physical gas trading continues at the hub via OTC bilateral trading and to some extent on the exchange as well. Futures contracts trading dominates, however, and now averages approximately 400,000 futures contracts per day, and
11 Code of Federal Regulations, Title 18, Chapter 1, Subchapter 1, Part 284, Subpart A, 284.7, Firm Transportation Service, (b) (3): “An interstate pipeline that offers transportation service on a firm basis under subpart B or G of this part may not include in its tariff any provision that inhibits the development of market centers.”(18 CFR § 284.7 (b) (3)). 12 The most famous case involved Enron’s manipulation of gas prices in the California energy crisis in 2000. 13 The FERC’s market oversight authority extends to electricity markets as well. For a list of recent FERC actions, see the FERC website: http://www.ferc.gov/enforcement/market-manipulation.asp.

November 2016
U.S. Energy Information Administration | Perspectives on the Development of LNG Market Hubs in the Asia Pacific Region 14
more than that when options and other derivative products are included.14 (CME lists over 280 derivative financial natural gas contracts in addition to the Henry Hub futures contract.)15 The CME Group offers various financial derivatives based on gas market indexes (futures contracts, swaps, and options) at approximately 40 hubs.16 These are the more heavily traded, liquid gas market hubs. (That said, very few of the listed financial derivatives at these other hubs are actually traded.)
4.2 Henry Hub and Select Hubs in North America
Table 4-1 presents basic statistics for five major gas market hubs in the United States and Canada. Dominion South Point is a growing center for Marcellus production. Texas Eastern M3 is a major gateway to the Northeast and New England. Dawn is the major pricing point for gas flowing into eastern Canada from the United States and western Canada. Alberta Energy Company (AECO) is the notional hub for all Alberta production and provides large volumes of gas to the United States as well as Canada.
Table 4-1. North American natural gas hub metrics
Market hub Location
Physical Trades Futures
Average 2015 volume
(000 MMBtu/d)
Average 2015 deals
/day
CME futures contract open
interest contract volume
CME forward open interest dates
Henry Hub Southern Louisiana 192 29 1,167,930 Nov. 2016 - May
2024
Dominion South Point
Southwestern Pennsylvania (Marcellus)
218 48 58,380 a Nov. 2016 – Dec. 2020
Texas Eastern M-3 Receipts
New York, New England 201 38 21,275 a Nov. 2016 – Oct.
2020
Dawn (Canada) Southwestern Ontario 644 109 None None
AECO (Canada) Alberta 1,562 138 None None a Average daily volumes, deals and price ranges were calculated by averaging the values from a data sample composed of the first Trading day for each calendar month in 2015. The mean values from the twelve days were calculated using a simple average, with conversions made to USD/ MMBtu where necessary. AECO volumes converted from GJ to MMBtu. Source: Platts Gas Daily, various issues; CME Group, Daily Energy Volume and Open Interest
The table shows the average physical volumes traded in 2015 and the average number of deals per day as reported to Platts Gas Daily. Not all trades are reported. According to FERC, Form 552, “Annual Report of Natural Gas Transactions,” PREs reported only about 49% of reportable transactions in 2015.17 The table indicates that Henry Hub has fewer volumes and trades reported by Platts Gas Daily than the other hubs. AECO appears to be the largest in terms of reported physical trading.
14 CME Group, “Daily Energy Volume and Open Interest,” (accessed June 2, 2016), http://www.cmegroup.com/market-data/volume-open-interest/energy-volume.html. 15 CME Group, “CME Group All Products Code and Slate,” (accessed October 18, 2016), http://www.cmegroup.com/trading/products/. 16 Ibid. 17 Estimated from FERC Form 552 data. See Appendix Table C-1.

November 2016
U.S. Energy Information Administration | Perspectives on the Development of LNG Market Hubs in the Asia Pacific Region 15
Also shown are data on the forward contracts for deliveries at these hubs in the form of the open interest for futures and basis futures contracts. CME Group open interest represents the “total number of futures contracts long or short in a delivery month or market that has been entered into and not yet offset or fulfilled by delivery.”18 Open interest indicates the liquidity of the forward price curve for the contracts in question; the higher the open interest, the more liquid the reported prices are. Only Henry Hub has a substantial number of forward contracts. (The number shown in the table is only for the basic futures contract; there are several other derivative products for Henry Hub that also have substantial open interest.)
The implications of these data are that Henry Hub operates at Stage 10 in the hub development stages. Dominion and Texas Eastern are at least at Stage 9, and possibly at Stage 10. Dawn and AECO have futures contracts but are not actively traded locations; they are likely operating at Stage 8 or 9.
4.3 Liquidity and the Churn Rate in the United States
One measure of a gas market hub’s liquidity is the churn rate. Churn rate refers to the number of times a single unit of gas is sold, including non-physical sales of financial derivatives at a location over a defined period of time. The calculation includes the estimate of first sales of gas at the hub, the number of resales of physical units of gas, and the number of financial product sales based on the physical market. Doing this calculation for individual hubs can be challenging. First, one must determine the relevant area to be considered in estimating the volume of physical sales (the denominator). For example, do nearby sales count? The second challenge is estimating the number of trades occurring across multiple platforms and derivative products.
One possible calculation for the natural gas market churn ratio is for the United States as a whole, shown in Table 4-2. For the United States, the sum of all monthly and daily physical market trades reported in FERC Form 552 in 2015 is 62 quadrillion Btu (corrected for double counting of both sides of each transaction and rounded to the nearest whole number).19 U.S. natural gas consumption was 26 quadrillion Btu in 2015. This indicates that the churn ratio in terms of only physical volumes traded was about 2.4.
Looking more broadly, the amount of trading on the two large trading markets, CME’s NYMEX (Henry Hub futures and other products) and ICE (various products at Henry Hub and other locations), in recent years has ranged from 1,100 to 1,500 and 419 to 768 quadrillion Btu, respectively.20 (The natural gas volumes on NYMEX Henry Hub futures and ICE in the United States are higher in years with high price volatility and lower in years with less price volatility.) Using these measures, Table 4-2 shows a national churn ratio of 61–90. This estimated churn ratio does not count trades for companies too small to 18 CME Group, “Glossary” (accessed October 15, 2016), http://www.cmegroup.com/education/glossary.html. For calculation of open interest only one side of the contract is counted. 19Cornerstone Research, “Characteristics of U.S. Natural Gas Transactions, Insights from FERC Form 552 Submissions 2016” (accessed October 13, 2016), https://www.cornerstone.com/Publications/Reports/Characteristics-of-US-Natural-Gas-Transactions-2016. The total sales are only wholesale and do not include sales to affiliates (e.g., Shell production to Shell Trading) or sales by distribution companies to their customers. 20 Ibid., p. 5. Commodity volumes computed by ICF from contract counts. Also see Federal Energy Regulatory Commission, “State of the Markets Report 2015” (accessed October 2, 2016), https://www.ferc.gov/market-oversight/reports-analyses/st-mkt-ovr/2015-som.pdf.

November 2016
U.S. Energy Information Administration | Perspectives on the Development of LNG Market Hubs in the Asia Pacific Region 16
report under FERC Form 552 and does not take into account differences in trading volumes among regional natural gas markets. However, the relevance of regional factors is ambiguous given that futures and other products at Henry Hub are used to hedge trades throughout the U.S. Even with these data omissions and definitional ambiguities, it is clear that natural gas markets in the United States on the whole are very liquid as measured by the churn ratio.
Table 4-2. Example calculation of natural gas churn ratio for the United States
Type of trade Quadrillion Btu/y or ratio
1. Physical trades reported on FERC Form 552 for 2015 62
2. NYMEX natural gas products in recent years 1,100 - 1,500
3. ICE financial natural gas products in recent years 419 - 768
4. Total Trades [=1+2+3] 1,581 - 2,330
5. Natural Gas Consumption for 2015 26
6. Churn Ratio [=4/5] 61 - 90
4.4 Observations on U.S. and Canadian Hub Development
Natural gas market hubs are central to the operation of the U.S. and Canadian natural gas markets. Across the United States and Canada, gas prices quoted at over 100 market hubs provide daily snapshots of the gas supply and demand balance in both countries. The emergence of market hubs came after government regulators revamped the interstate gas pipeline system and Congress deregulated gas prices. The United States and Canada can be considered as operating in Stage 10 of gas market development, with Henry Hub providing a benchmark price of gas nationally with a highly liquid forward price curve. The Henry Hub index and futures contract provides a reliable basis for managing price risk for traders without having to rely on oil or other price indexes. The key elements in the success of the North American market are
• A highly integrated pipeline network with multiple points of interconnectivity • The separation of pipeline transportation services from gas sales • Third-party access to pipelines, storage, and LNG terminals • Transparency in the reporting of gas pipeline capacity utilization, tariffs, and prices at market
hubs • Broad liquidity in the physical and financial markets

November 2016
U.S. Energy Information Administration | Perspectives on the Development of LNG Market Hubs in the Asia Pacific Region 17
5 Market Hubs in Europe Gas markets initially evolved in Europe as a collection of discrete national markets. Over the last two decades, both market reforms and infrastructure projects have supported the development of a more integrated European market. Today, gas moves more freely across the European pipeline network. A number of notional gas trading hubs have developed where gas custody transfer takes place. At many hubs, gas prices and price discovery are becoming more reliable. Although the European market continues to evolve, lessons learned from the development of its major gas trading hubs may be applied to immature gas markets in the Asia Pacific region.
5.1 Overview of the European Gas Market
European gas infrastructure initially consisted of only national gas systems. These developed internally within each country and were designed originally to deliver manufactured gas to local markets.21 Following the 1959 discovery of the Groningen gas field in the Netherlands, the first transnational pipelines were installed to carry natural gas across Western Europe. Beginning in the 1960s, LNG imports from North Africa and the Middle East supplemented pipeline gas before piped gas from the North Sea (1970s) and Russia (1982) added to the European supply. Today Europe’s system resembles a constellation of national natural gas systems that are linked through a series of trunk lines to import gateways. The level of interconnectivity across national borders varies greatly from system to system.22
Historically, each country regulated its own national gas industry and European wholesale buyers—mostly national gas monopolies—operated through long-term contracts tied to the price of fuel oil. Today, greater gas market liquidity and competition at all levels of the supply chain have led to increased volumes of natural gas trading on a spot market basis. A series of market reforms and infrastructure improvements facilitated these changes.
5.1.1 Gas Market Reform in the United Kingdom
The United Kingdom led the way with its Gas Act of 1986. The Act privatized the U.K. gas system and initiated a process of market liberalization where gas supply and demand would set prices across the network. Subsequent legislation in 1995 included the establishment of the Uniform Network Code (UNC or Code), which established a common set of rules for all industry players and substantially completed the process of setting up a fully integrated competitive gas market. Most importantly, it established the principle of non-discriminatory (third-party) access to gas transportation, or TPA. The Office of Gas and Electricity Markets (OFGEM) regulates and oversees the U.K.’s restructured gas industry. In addition to bilateral contracts, the Code provides for two forms of gas trading: 1) spot OTC for day-ahead transactions and 2) on-day commodity market (OCM) for deals to balance the market. A significant
21 Manufactured gas is an artificial gas made from coal, petroleum or coal, and oil mixtures. Also known at town gas, manufactured gas was the source for urban gas lighting in the 19th century. 22 International Energy Agency, “Development of Competitive Gas Trading in Europe: How to Achieve Workable Competition in European Gas Markets?” (accessed August 1, 2016), p.11, https://www.iea.org/publications/freepublications/publication/gas_trading.pdf. The United Kingdom was the first country to import LNG, receiving its first cargo from the United States in 1959; subsequent cargoes were from North Africa. France and Italy began importing LNG in the early 1970s.

November 2016
U.S. Energy Information Administration | Perspectives on the Development of LNG Market Hubs in the Asia Pacific Region 18
proportion of the gas sold under long-term contracts is also re-traded by buyers in the spot OTC market. The National Balancing Point (NBP) was established as the notional market hub where this trading could take place.
5.1.2 Gas Market Reform in Europe
Historically, the natural gas market in Europe was highly concentrated within individual countries. A few major buyers effectively controlled the transmission pipelines and negotiated contracts with large natural gas sellers. Gas traded under long-term contracts (20–30 years), with most contracts having take-or-pay clauses. The price of natural gas was linked to the price of other fuels, primarily fuel oil, often some mixture of residual fuel oil and distillate. Producers received a net-back price from the consuming market, i.e., the market price less transportation costs. Re-delivery of gas was restricted, so buyers could not resell gas to others in other markets. Although contracts had occasional price reopeners to allow parties to harmonize terms with market conditions, the market as a whole was highly inflexible.23
Following the liberalization of the U.S. and U.K natural gas markets, the European Union (EU) sought to develop a competitive gas market across Europe. In 2009, the European Parliament passed legislation known as the Third Energy Package, which set in motion market reforms for natural gas (and electricity) system and harmonized network rules across the EU in order to create a large, competitive gas market. Market development was facilitated by the unbundling of transportation services from sales and non-discriminatory TPA.24 As part of this reform, the EU also created the Agency for the Cooperation of Energy Regulators (ACER) to act as a super-regulator that works with EU countries to harmonize regulations and provide regulatory support for the integrated gas market (OFGEM is a member of ACER.)25
5.1.3 European Gas Market Today
Over the past 15 years, the Northwest European gas markets have developed substantially, as both trading hubs and market-clearing exchanges supporting a greater variety of natural gas sources and growing regional trade in natural gas. Global technological and political trends that affect both the supply and demand sides of the global gas market have also influenced European hub development. Greater technological ability to recover shale gas as well as other unconventional sources of gas has rapidly increased the global gas supply during the past decade. Concurrently, the replacement of oil- and coal-fired power plants with natural gas plants has increased regional gas demand.26 The location of
23 Ibid., p. 13 24 This Directive superseded earlier directives issued in 2003 also aimed at creating an integrated market. 25 As this report was being written, the United Kingdom voted to leave the European Union. It is unlikely that this departure will affect gas market integration in any significant way, given the advantages integration holds for the United Kingdom, which receives gas from European suppliers. The relationship between Ofgem and ACER is likely to change. 25 International Energy Agency, “Golden Rules for a Golden Age of Gas: World Energy Outlook Special Report on Unconventional Gas” (accessed August 1, 2016), p. 87, http://www.worldenergyoutlook.org/media/weowebsite/2012/goldenrules/weo2012_goldenrulesreport.pdf. 26 Ibid.

November 2016
U.S. Energy Information Administration | Perspectives on the Development of LNG Market Hubs in the Asia Pacific Region 19
infrastructure, including LNG export facilities, pipelines, and storage terminals is especially critical to maintaining high liquidity at physical hubs and thereby preventing gas shortages.
Table 5-1 shows the gas balances and the pipeline and LNG trade for the nine European countries that have significant gas market hub activity. The largest gas-consuming countries in Europe, in order, in 2015 were Germany, the United Kingdom, France, Italy, Netherlands, and Spain. Norway, Netherlands, and the United Kingdom are the largest producers of natural gas, with Norway and Netherlands exporting signficant amounts to the rest of Europe. LNG imports to the nine European countries listed in Table 5-1 were 4.1 Bcf/d in 2015 compared to approximately 40 Bcf/d of pipeline imports (pipeline imports plus Norway exports). As of January 2016, 24 regasification terminals were operational in Europe, with another 4 regasification facilities under construction.27 Europe’s LNG regasification capacity represented approximately 20% of world regasification capacity as of 2015, slightly eclipsing the United States’ 18% share, yet falling short of Japan’s 28%.28
Table 5-1. Natural gas balances for select European countries, 2015
(Bcf/d)
Country Estimated natural gas
consumption b
Pipeline exports
Pipeline imports
LNG exports a
LNG imports
Natural gas production
Austria 1.18 0.05 1.11 - - 0.12 Belgium 1.53 0.25 1.56 0.02 0.24 - France 3.88 0.36 3.66 0.05 0.63 0.00 Germany 10.03 0.78 9.97 - - 0.84 Italy 6.56 0.01 5.34 - 0.57 0.65 Netherlands 3.19 5.39 3.43 - - 5.15 Norway 1.58 9.62 - 0.56 - 11.76 Spain 3.05 0.05 1.83 0.04 1.31 0.01 United Kingdom 7.06 1.26 2.99 - 1.33 3.99 Total 38.07 17.76 29.89 0.68 4.09 22.54 a LNG exports include re-exports of LNG previously imported. b Estimated country-level consumption figures may vary slightly due to rounding Source: ICF compilation of data from International Energy Agency Natural Gas Information (2016 edition).
The combined impact of increased pipeline interconnectivity, a uniform and transparent regulatory framework and operating code, and a greater number of LNG import facilities connected to the network has supported the growth of gas market hubs in Europe. With greater gas availability and the support of financial systems that promote trade transparency and accessibility, buyers and sellers have fueled the development of more liquid trade structures, including an increase in spot trading of physical volumes and financial derivatives. Since 2009, European wholesalers have been increasingly reliant on spot markets to meet swings in customer demands.29 As a result, spot sales displaced or complemented gas volumes that historically had been traded under long-term take-or-pay contracts. Although both available gas volumes and accurate price discovery are seen as prerequisites of spot trading, it is the 27 The International Group of Liquefied Natural Gas Importers, “The LNG Industry” (accessed October 2, 2016), p.30, http://www.giignl.org/sites/default/files/PUBLIC_AREA/Publications/giignl_2016_annual_report.pdf. 28 Gas in Focus, “Existing and Planned LNG Terminals,” (accessed September 15, 2016), p.1, http://www.gasinfocus.com/en/indicator/existing-and-planned-lng-terminals/. 29 U.S. Energy Information Administration, “An Introduction to Global Natural Gas Markets, Drivers, and Theory” (accessed October 2, 2016), p. 40, https://www.eia.gov/workingpapers/pdf/global_gas.pdf.

November 2016
U.S. Energy Information Administration | Perspectives on the Development of LNG Market Hubs in the Asia Pacific Region 20
presence of a significant volume of spot trading activity that promotes efficient market pricing mechanisms. Further, it is the presence of futures trading —which, in turn, rely on these efficient pricing mechanisms— that confirms a gas market hub’s status as both liquid and stable enough to drive contract pricing. Stronger correlation among hub prices has continued to narrow spreads between regional gas markets since 2007. Absent the effects of regional geopolitics, technology changes, or supply disruptions, prices at the European hubs are increasingly correlated, even as locational prices vary.30
5.2 Key European Hubs
The NBP was the first European gas market hub to become operational, followed by Belgium’s Zeebrugge (ZEE) hub, in operation since 2000.31 Since then, seven other major hubs were established in Northwest Europe: Netherlands Title Transfer Facility (TTF) and Italian Punto di Scambio Virtuale (PSV) in 2003; the French Points d’Exchange (PEG Nord and Sud) in 2004; Austria’s Central European Gas Hub (CEGH) in 2005; and the German hubs more recently, with National Connect Germany (NCG) established in 2008 and Gaspool (GPL) in 2009.32 While these nine hubs make up the backbone of the current European hub landscape, other smaller or less liquid hubs are continuing to develop in countries surrounding the existing trade centers, including Poland, the Czech Republic, Hungary, and other eastern European countries.33 For many of the major European hubs—all of which are notional hubs except for Belgium ZEE—natural gas exchanges like the European Energy Exchange (EEX) or Powernext track spot transactions of gas and maintain detailed pricing records for the hubs within their jurisdictions.34
Table 5-2 presents a quantitative comparison of the above European hubs. The table shows both 2015 average daily volumes and 2016 year-to-date (through May) volumes, as compared to volumes traded in 2011, the first year the London Energy Brokers Association (LEBA) published its monthly volumetric reports.35 Traded volumes are OTC bilaterally settled volumes and include a combination of prompt month and future months traded settlements, which may include the same gas sold several times. In the first five months of 2016, average daily volumes appear to have declined at all hubs, with substantial declines at the NBP.36 The U.K. NBP and Netherlands TTF are the most heavily traded locations in Europe as reported by LEBA, with the churn rate at TTF substantially higher than at the NBP.37
30 The Oxford Institute for Energy Studies, “European Gas Hubs: How Strong is Price Correlation?” (accessed on September 14, 2016), https://www.oxfordenergy.org/wpcms/wp-content/uploads/2013/10/NG-79.pdf. 31 The Oxford Institute for Energy Studies, “Continental European Gas Hubs: Are they fit for purpose?” (accessed on October 1, 2016), https://www.oxfordenergy.org/wpcms/wp-content/uploads/2012/06/NG-63.pdf. 32 Ibid., p. 4. 33 European Federation of Energy Traders, “European Gas Hub Development” (accessed September 12, 2016), http://www.efet.org/Cms_Data/Contents/EFET/Folders/Documents/EnergyMarkets/VTP_Assessment/~contents/3WAJGMFN7MDJYZ2Q/GHD-Study_summary-ppt_part-1.pdf. 34 EEX Newsroom, “About Us” (accessed June 17, 2016), p. 1, https://www.eex.com/en/about/eex. 35 LEBA did not record volumes for Austria, Italy, or Belgium in 2011, which is its earliest monthly volumetric report. 36LEBA changed the definition of French hubs in 2016, making comparisons impossible. 37LEBA publishes churn rates computed as 2015 trades divided by national consumption for 2014. Continental sum includes all listed trades except NBP and all national consumption except U.K. Methodology for this table is not the same as OFGEM calculations presented in the prior section showing a U.K. churn ratio of 22.

November 2016
U.S. Energy Information Administration | Perspectives on the Development of LNG Market Hubs in the Asia Pacific Region 21
Table 5-2. Metrics for select European gas trading hubs
Hub
Year
established
Active
market
participants
Day-ahead trades
per month
2011
(Bcf/d)
2015
(Bcf/d)
2016
(Bcf/d)
Churn rate
circa 2015
Austria CEGH 2005 10 798 - 2.8 1.7 3.53
Belgium ZEE 2000 15 1,696 - 7.2 2.9 5.15
French Hubs - 15 3,999 3.6 3.9 2.2 1.10
France PEG Nord 2004 10 3,217 NA NA 2.0 -
France TRS 2015 5 782 NA NA 0.2 -
German Hubs - 25 7,184 10.1 22.2 10.8 3.22
Germany NCG 2008 - 4,913 7.3 14.5 7.0 -
Germany
GasPool
2009 - 2,271 2.8 7.7 3.8 -
Italy PSV 2003 12 NA - 6.5 3.8 1.18
Netherlands TTF 2003 30 7,659 56.6 114.9 60.9 37.05
U.K. NBP 1996 40 7,390 123.6 77.0 37.6 11.85 Sources: London Energy Brokers Association, Oxford Institute for Energy Studies. Notes: NA stands for not available. Million MWh converted to Bcf at 3.31 Bcf/million MWh. 2016 data are averages through May.
5.2.1 Austria Central European Gas Hub (CEGH)
Austria’s natural gas pipeline largely depends on inflows from Russia through Slovakia.38 As a result, Austria’s notional hub, CEGH, offers limited transfer access between international and domestic natural gas supplies. The role of hub operator is shared between the Austrian Gas Clearing and Settlement (AGCS) entity, Gas Connect Austria (GCA), Wiener Borse Exchange, and the CEGH itself.39 The CEGH hub is a reliable location for title transfers and hosts all spot and futures trading on the Austrian system, although limited access is available for non-physical traders.40
5.2.2 Belgium Zeebrugge Hub (ZEE)
ZEE in Belgium is a physical hub with interconnections between pipelines and LNG imports terminals that connect continental Europe with the United Kingdom and Norway. ZEE was the second hub to be established in Europe when it became operational in 2000.41 It operates as a transit hub for gas flowing to Europe from the North Sea and gas to the United Kingdom. Pipeline infrastructure carries gas from Zeebrugge to interconnect with the Netherlands TTF and France PEG Nord gas systems, as well as with
38 International Energy Agency, “By Country: Gas Trade Flows in Europe” (accessed October 16, 2016), p. 1. https://www.iea.org/gtf/. 39 European Federation of Energy Traders, “European Gas Hub Development” (accessed June 15, 2016), p. 11, http://www.efet.org/Cms_Data/Contents/EFET/Folders/Documents/EnergyMarkets/VTP_Assessment/~contents/3WAJGMFN7MDJYZ2Q/GHD-Study_summary-ppt_part-1.pdf. 40 Oxford Institute for Energy Studies, “The Evolution of European Traded Gas Hubs” accessed October 17, 2016), p. 100, https://www.oxfordenergy.org/wpcms/wp-content/uploads/2016/02/NG-104.pdf. 41 Oxford Institute for Energy Studies, “Continental European Gas Hubs: Are they fit for purpose?” (accessed October 16, 2016), p.4, https://www.oxfordenergy.org/wpcms/wp-content/uploads/2012/06/NG-63.pdf.

November 2016
U.S. Energy Information Administration | Perspectives on the Development of LNG Market Hubs in the Asia Pacific Region 22
both German hubs—NCG and GPL. Fluxys is both the hub operator for ZEE and the independent system operator for all natural gas transmission and storage infrastructure in Belgium.42 ICE currently offers futures contracts for physical delivery at ZEE, while ICE-Endex facilitates spot trading for gas at ZEE on its exchange, as does Powernext.
5.2.3 France Trading Region South (TRS) and Point d’Exchange Nord (PEG Nord)
The French PEG hubs represent the entirety of the French natural gas market and operate within the Powernext natural gas exchange framework.43 Powernext offers both spot and futures trading for the French hubs, which are operated primarily under the oversight of GRTgaz.44 Originally, the French natural gas trading system was composed of three hubs: PEG Nord, PEG Sud, and PEG Transport et Infrastructures Gaz France (TIGF). As of April 2015, however, PEG Sud and TIGF merged to trade under the common name Trading Region South (TRS). 45 Today, the French Hubs are key fixtures in the Powernext trading exchange.
5.2.4 National Connect Germany (NCG)
NCG, a market hub operated within the EEX, is Germany’s second notional hub. Initially established in a small region of southern Germany, the NCG gas transport system now represents a larger market area. This market is overseen by a coalition of transmission system operators that trade gas along their collective pipeline systems.46 Futures contracts are offered on the ICE and EEX for gas delivered through the NCG trading point. Spot contracts are also offered for NCG on the EEX.47 The NCG hub is sufficiently firm due to its integration into the EEX exchange and increases reliability in Europe as a benchmark for natural gas pricing. Going forward, if NCG continues to develop and if trading volumes increase, a wider variety of futures contract structures may be offered. Nevertheless, consistent higher trade volumes will be required for NCG to develop a reliable forward price curve.48
42 Fluxys, “Independent Operator of the Natural Gas Transmission System in Belgium” (accessed October 13, 2016), p.1, http://www.fluxys.com/belgium/en/About%20Fluxys/AboutFluxys. 43 European Federation of Energy Traders, “European Gas Hub Development” (accessed October 16, 2016), http://www.efet.org/Cms_Data/Contents/EFET/Folders/Documents/EnergyMarkets/VTP_Assessment/~contents/3WAJGMFN7MDJYZ2Q/GHD-Study_summary-ppt_part-1.pdf. 44 S&P Platts, “French Gas Traders Mull New Market Balancing Proposals” (accessed July 13, 2016), p.1, http://www.platts.com/latest-news/natural-gas/london/french-gas-traders-mull-new-market-balancing-26145343. 45 Reuters, “Southern France Gas Trading Hubs to Merge on April 1” (accessed October 20, 2016), p.1, http://af.reuters.com/article/commoditiesNews/idAFL5N0VY4XD20150224. 46 NetConnect Germany, “Company Profile” (accessed September 16, 2016), p.1, https://www.net-connect-germany.de/en-gb/About-us/Company-Profile. 47 Oxford Institute for Energy Studies, “The Evolution of European Traded Gas Hubs” (accessed September 17, 2016), p.100, https://www.oxfordenergy.org/wpcms/wp-content/uploads/2016/02/NG-104.pdf. 48 EEX, “NCG- PEGAS” (accessed June 17, 2016), p. 1, https://www.eex.com/en/market-data/natural-gas/spot-market/ncg#!/2016/06/09.
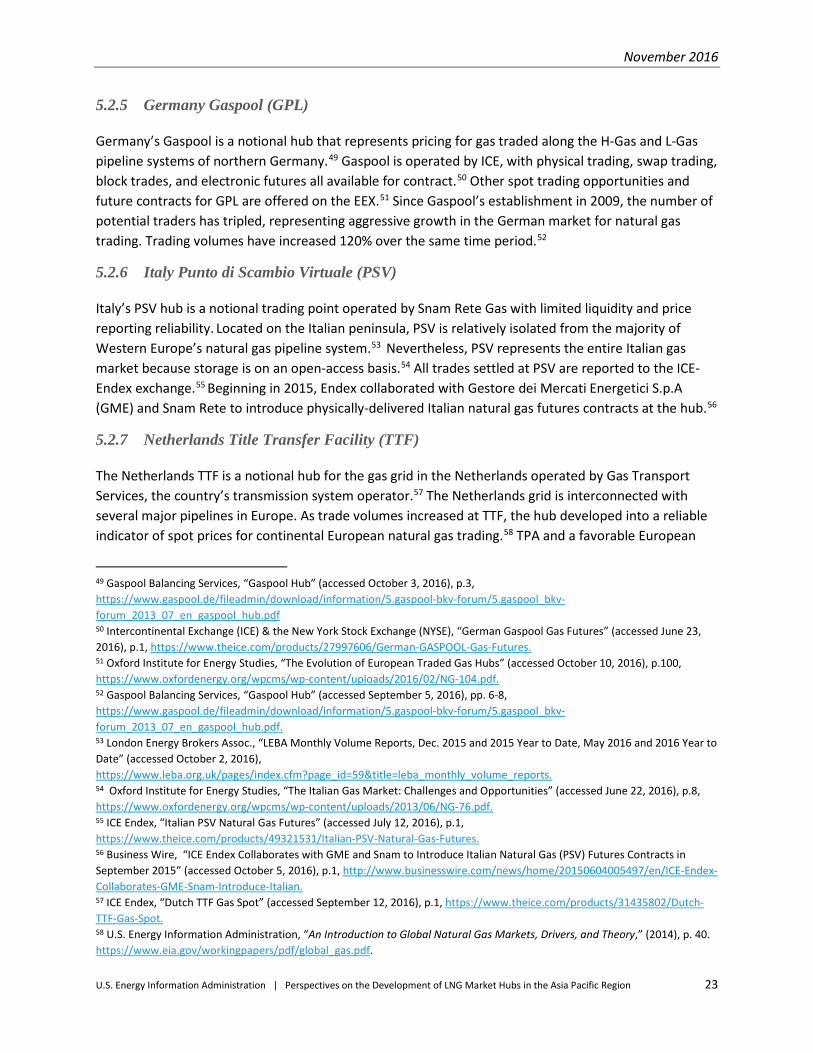
November 2016
U.S. Energy Information Administration | Perspectives on the Development of LNG Market Hubs in the Asia Pacific Region 23
5.2.5 Germany Gaspool (GPL)
Germany’s Gaspool is a notional hub that represents pricing for gas traded along the H-Gas and L-Gas pipeline systems of northern Germany.49 Gaspool is operated by ICE, with physical trading, swap trading, block trades, and electronic futures all available for contract.50 Other spot trading opportunities and future contracts for GPL are offered on the EEX.51 Since Gaspool’s establishment in 2009, the number of potential traders has tripled, representing aggressive growth in the German market for natural gas trading. Trading volumes have increased 120% over the same time period.52
5.2.6 Italy Punto di Scambio Virtuale (PSV)
Italy’s PSV hub is a notional trading point operated by Snam Rete Gas with limited liquidity and price reporting reliability. Located on the Italian peninsula, PSV is relatively isolated from the majority of Western Europe’s natural gas pipeline system.53 Nevertheless, PSV represents the entire Italian gas market because storage is on an open-access basis.54 All trades settled at PSV are reported to the ICE-Endex exchange.55 Beginning in 2015, Endex collaborated with Gestore dei Mercati Energetici S.p.A (GME) and Snam Rete to introduce physically-delivered Italian natural gas futures contracts at the hub.56
5.2.7 Netherlands Title Transfer Facility (TTF)
The Netherlands TTF is a notional hub for the gas grid in the Netherlands operated by Gas Transport Services, the country’s transmission system operator.57 The Netherlands grid is interconnected with several major pipelines in Europe. As trade volumes increased at TTF, the hub developed into a reliable indicator of spot prices for continental European natural gas trading.58 TPA and a favorable European
49 Gaspool Balancing Services, “Gaspool Hub” (accessed October 3, 2016), p.3, https://www.gaspool.de/fileadmin/download/information/5.gaspool-bkv-forum/5.gaspool_bkv-forum_2013_07_en_gaspool_hub.pdf 50 Intercontinental Exchange (ICE) & the New York Stock Exchange (NYSE), “German Gaspool Gas Futures” (accessed June 23, 2016), p.1, https://www.theice.com/products/27997606/German-GASPOOL-Gas-Futures. 51 Oxford Institute for Energy Studies, “The Evolution of European Traded Gas Hubs” (accessed October 10, 2016), p.100, https://www.oxfordenergy.org/wpcms/wp-content/uploads/2016/02/NG-104.pdf. 52 Gaspool Balancing Services, “Gaspool Hub” (accessed September 5, 2016), pp. 6-8, https://www.gaspool.de/fileadmin/download/information/5.gaspool-bkv-forum/5.gaspool_bkv-forum_2013_07_en_gaspool_hub.pdf. 53 London Energy Brokers Assoc., “LEBA Monthly Volume Reports, Dec. 2015 and 2015 Year to Date, May 2016 and 2016 Year to Date” (accessed October 2, 2016), https://www.leba.org.uk/pages/index.cfm?page_id=59&title=leba_monthly_volume_reports. 54 Oxford Institute for Energy Studies, “The Italian Gas Market: Challenges and Opportunities” (accessed June 22, 2016), p.8, https://www.oxfordenergy.org/wpcms/wp-content/uploads/2013/06/NG-76.pdf. 55 ICE Endex, “Italian PSV Natural Gas Futures” (accessed July 12, 2016), p.1, https://www.theice.com/products/49321531/Italian-PSV-Natural-Gas-Futures. 56 Business Wire, “ICE Endex Collaborates with GME and Snam to Introduce Italian Natural Gas (PSV) Futures Contracts in September 2015” (accessed October 5, 2016), p.1, http://www.businesswire.com/news/home/20150604005497/en/ICE-Endex-Collaborates-GME-Snam-Introduce-Italian. 57 ICE Endex, “Dutch TTF Gas Spot” (accessed September 12, 2016), p.1, https://www.theice.com/products/31435802/Dutch-TTF-Gas-Spot. 58 U.S. Energy Information Administration, “An Introduction to Global Natural Gas Markets, Drivers, and Theory,” (2014), p. 40. https://www.eia.gov/workingpapers/pdf/global_gas.pdf.

November 2016
U.S. Energy Information Administration | Perspectives on the Development of LNG Market Hubs in the Asia Pacific Region 24
regulatory structure for gas trading were key factors that promoted this growth. When the Dutch market regulator removed the requirement in 2008 that traders must be invested in the physical gas market, both the number of market participants and the gas volumes traded increased substantially. Also in 2008, GasTerra, formerly the supply arm of Gasunie, began reporting its volumes traded on TTF. By far the largest portfolio operating through the TTF market at the time, Gasterra’s transactions increased market liquidity.59 Today, ICE-Endex and EEX operate exchanges for TTF spot contracts, while Powernext and ICE-Endex offer TTF futures contracts and long-term contracts.60 TTF has surpassed NBP as the most liquid hub in Western Europe. As of December 2015, the exchange represented approximately 45% of total gas volumes traded in Europe.
5.2.8 Spain Mercado Ibérico Del Gas (MIBGAS)
In December 2015 Spain launched a pan-Iberian natural gas market hub for trading in Spain and Portugal. The hub began trading with the Mercado Ibérico Del Gas (MIBGAS), serving as the market operator.61 The hub, referenced by the market as MIBGAS, joins a growing number of European gas hubs that are in earlier stages of development than those described previously. MIBGAS connects Spain’s existing balancing point, Almacenamiento Operativo Comercial (AOC), a storage facility that limits market participation to traders who contract physical transmission capacity.62 Gas imports to Spain’s six LNG import facilities and increasing gas demand nationwide are expected to drive future development of the country’s natural gas trade.63 As one of Europe’s newest virtual trading points, greater OTC trade volumes will be required to trigger price indexation (stage 7 of the hub development process listed in Table 2-1). As of October 2016, MIBGAS announced that 38 registered traders could trade in its organized gas market, a development that suggests both trade volumes and market liquidity may increase in the coming months.64 However, the liquidity at MIBGAS is likely to remain low until the new network codes for gas balancing are implemented in both Spain and Portugal.
5.2.9 United Kingdom National Balancing Point (NBP)
The U.K. government established the NBP in 1996 as part of the restructuring and liberalization of the U.K. gas sector. While originally designed as a daily gas injection/withdrawal imbalance clearing
59 Baringa Partners LLP “The Benefits of TTF Liquidity” (accessed June 2, 2016), https://www.acm.nl/download/documenten/nma/NMa_TTF_rapport_DEF.pdf; Kamerstukken, “Acceleration of the Development of the TTF and the Gas Wholesale Market” (accessed October 2, 2016), p. 26, https://www.rijksoverheid.nl/binaries/rijksoverheid/documenten/kamerstukken/2008/03/03/appendix-1-acceleration-of-the-development-of-the-ttf-and-the-gas-wholesale-market/appendix-1-acceleration-of-the-development-of-the-ttf-and-the-gas-wholesale-market.pdf. 60 Oxford Institute for Energy Studies, “The Evolution of European Traded Gas Hubs” (accessed October 20, 2016), p.84, https://www.oxfordenergy.org/wpcms/wp-content/uploads/2016/02/NG-104.pdf. 61 Mercado Ibérico del Gas, “The Market Operator” (accessed November 3, 2016), p.1, http://www.mibgas.es/en/gas-markets/iberian-gas-market/market-operator. 62 Iberian Gas Hub, “The Iberian Natural Gas Market” (accessed November 3, 2016), http://www.iberiangashub.com/TheIberiannaturalgasmarket.aspx. 63 International Gas Union, “2016 World LNG Report” (accessed September 12, 2016), www.igu.org/download/file/fid/2123. 64 Mercado Ibérico del Gas, “38 Agents are Registered in MIBGAS” (accessed November 3, 2016), p.1, http://www.mibgas.es/en/gas-markets/information-and-notices-MIBGAS.

November 2016
U.S. Energy Information Administration | Perspectives on the Development of LNG Market Hubs in the Asia Pacific Region 25
mechanism under the UNC (which established operating rules for TPA to the gas system), the NBP evolved into a notional market hub for the national transmission grid. Contracts for spot gas at NBP are offered on the ICE-Endex exchange.65 Today, prices quoted at the NBP represent natural gas trading across the U.K. gas network, which includes both LNG import terminals and pipeline supplies.66 This shift from stage 6 (OTC-brokered trading) to stage 7 (price indexation) occurred once clearing prices at the NBP came to be accepted by gas traders as indicative of market conditions. During the past five years, the NBP hub matured to the point at which non-shipper OTC trading was increasingly prevalent, the eighth benchmark stage of hub maturity.67
The on-day commodity market at the NBP is operated by ICE, which also offers futures and options contracts. During the past two decades, the role of the NBP pricing in the spot OTC and OCM markets has increased in significance as a price indicator across the U.K. It is believed that many of the new supply contracts between shippers, producers, and importers have pricing formulae that include an NBP component such that bilateral supply contracting reflects a combination of spot prices, oil prices, and inflation indices. As the NBP has gained status as a reliable pricing hub for gas contracts, the percentage of contracts that are bought and sold through ICE futures market has grown as a share of total NBP-based trades. Today, NBP is both the longest-standing European gas pricing point and the region’s most fully-developed market hub, having achieved the liquid forward price curve that reflects the tenth and final stage of hub development.
5.3 Price Convergence at Major European Hubs
Pricing at the European gas market hubs is shown in Figure 5-1. Since 2014, prices have fallen considerably from an average of about $10/MMBtu to around $4/MMBtu. The decline in natural gas prices reflects lower oil prices and is consistent with the broader price movements in markets worldwide. Notably, prices across the more established European hubs move together, as is expected from efficient markets. The most recently established hub to be included, Spain’s MIBGAS, initially followed a different pricing curve than the other hubs, but by the fourth quarter of 2016, displayed greater conformity with the rest of the markets. Overall, despite an expected degree of variation between prices at one hub versus another in response to local market conditions, natural gas trading hubs in Europe generally are exhibiting price convergence.
65 Oxford Institute for Energy Studies, “The Evolution of European traded gas hubs” (accessed October 2, 2016), p.100, https://www.oxfordenergy.org/wpcms/wp-content/uploads/2016/02/NG-104.pdf. 66 Pipeline & Oil Gas Journal, “National Grid at Home and Abroad” (accessed September 12, 2016), p.1, https://pgjonline.com/2016/01/13/22450/. 67 U.S. Energy Information Administration, “An Introduction to Global Natural Gas Markets, Drivers, and Theory” (August 2014), p.39, https://www.eia.gov/workingpapers/pdf/global_gas.pdf.
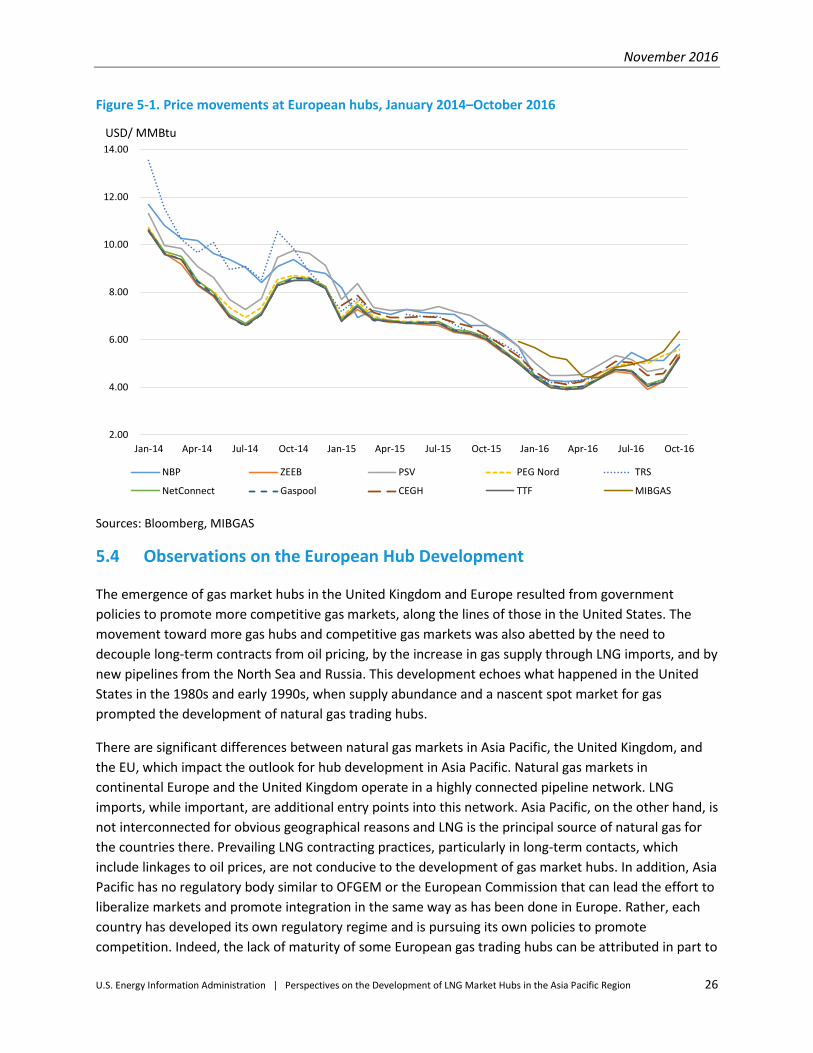
November 2016
U.S. Energy Information Administration | Perspectives on the Development of LNG Market Hubs in the Asia Pacific Region 26
Figure 5-1. Price movements at European hubs, January 2014–October 2016
Sources: Bloomberg, MIBGAS
5.4 Observations on the European Hub Development
The emergence of gas market hubs in the United Kingdom and Europe resulted from government policies to promote more competitive gas markets, along the lines of those in the United States. The movement toward more gas hubs and competitive gas markets was also abetted by the need to decouple long-term contracts from oil pricing, by the increase in gas supply through LNG imports, and by new pipelines from the North Sea and Russia. This development echoes what happened in the United States in the 1980s and early 1990s, when supply abundance and a nascent spot market for gas prompted the development of natural gas trading hubs.
There are significant differences between natural gas markets in Asia Pacific, the United Kingdom, and the EU, which impact the outlook for hub development in Asia Pacific. Natural gas markets in continental Europe and the United Kingdom operate in a highly connected pipeline network. LNG imports, while important, are additional entry points into this network. Asia Pacific, on the other hand, is not interconnected for obvious geographical reasons and LNG is the principal source of natural gas for the countries there. Prevailing LNG contracting practices, particularly in long-term contacts, which include linkages to oil prices, are not conducive to the development of gas market hubs. In addition, Asia Pacific has no regulatory body similar to OFGEM or the European Commission that can lead the effort to liberalize markets and promote integration in the same way as has been done in Europe. Rather, each country has developed its own regulatory regime and is pursuing its own policies to promote competition. Indeed, the lack of maturity of some European gas trading hubs can be attributed in part to
2.00
4.00
6.00
8.00
10.00
12.00
14.00
Jan-14 Apr-14 Jul-14 Oct-14 Jan-15 Apr-15 Jul-15 Oct-15 Jan-16 Apr-16 Jul-16 Oct-16
USD/ MMBtu
NBP ZEEB PSV PEG Nord TRS
NetConnect Gaspool CEGH TTF MIBGAS

November 2016
U.S. Energy Information Administration | Perspectives on the Development of LNG Market Hubs in the Asia Pacific Region 27
the European Commission’s incomplete success in overcoming national monopolies and regulatory practices. This challenge is much greater in the Asia Pacific region.

November 2016
U.S. Energy Information Administration | Perspectives on the Development of LNG Market Hubs in the Asia Pacific Region 28
6 Asia Pacific Gas Market In the United States and Canada, where the first gas market hubs developed and flourished, the natural gas pipeline transmission network provides the physical interconnections that make gas market hubs possible. The same is largely true for the United Kingdom and Europe. Asia Pacific is fundamentally different with widely dispersed and somewhat isolated national gas markets that have limited internal pipeline networks and little physical connectivity between countries. The Asia Pacific region relies heavily on LNG imports to supply individual domestic markets. This dependence on LNG has implications for the development of gas market hubs and price discovery in Asia Pacific.
6.1 LNG and the Asia Pacific Gas Market
The significance of LNG supply for the Asia Pacific gas market can be seen in Table 6-1, which shows natural gas balances in the major gas-consuming and producing countries in Asia Pacific in 2015. Total gas consumption for these countries was 54.45 Bcf/d with LNG accounting for 37% of total consumption. China has significant production, which is almost entirely consumed domestically. In recent years, China has increased pipeline and LNG imports to meet domestic demand. The major LNG exporting countries in Asia Pacific (Australia, Malaysia, and Indonesia) also have relatively large domestic markets. Cross-country pipeline imports are modest, and include flows mostly from Myanmar and Malaysia to China, Singapore, and Thailand.
Table 6-1. Natural gas balances for select Asia Pacific countries, 2015 (Bcf/d)
Country Estimated consumption
Pipeline exports
Pipeline imports LNG exports a LNG imports Natural gas
production Australia 3.73 - 0.62 3.62 - 6.74 China 18.92 0.25 3.19 - 2.43 13.54 Indonesia 4.17 1.40 - 2.10 - 7.67 Japan 11.63 - - - 11.32 0.31 Malaysia 4.33 0.13 0.71 3.26 - 7.01 Singapore 1.10 - 0.81 - 0.29 - Korea 4.22 - - - 4.20 0.02 Taiwan 1.70 - - - 1.67 0.03 Thailand 4.72 - 1.06 - 0.35 3.31 Total 54.52 1.77 6.39 8.99 20.26 38.63 a LNG exports include re-exports of LNG previously imported. Source: ICF compilation of data from International Energy Agency Natural Gas Information (2016 edition). These are the 2015 provisional estimates.
The gas pipeline network in Asia Pacific is limited because the countries are separated by wide expanses of water. Thus, there is no pipeline-based model for gas market hub development in the region. China has large pipeline interconnections with Kazakhstan and Myanmar and imports gas from those countries. Southeastern Asia has multiple pipelines that cross national boundaries. For the most part, the pipeline infrastructure in Asia Pacific serves internal markets, connecting LNG terminals to consumers, offshore production to onshore markets, or internal production to consumers.

November 2016
U.S. Energy Information Administration | Perspectives on the Development of LNG Market Hubs in the Asia Pacific Region 29
Asia Pacific continues to dominate world LNG trade with approximately 66% of the world’s LNG imports in 2015.68 Table 6-2 shows LNG imports by region and share of world LNG trade.
Table 6-2. Global LNG imports by region Region Imports (Bcf/d) Percent
Asia 23.02 72.2 Of which Asia Pacific 20.98 65.8
Europe 4.88 15.3 Americas 2.69 8.5 Middle East 1.28 4.0 Total 31.87 100.0
Source: GIIGNL, 2016, Table: Quantities Received in 2015
As shown in Table 6-3, Qatar is the largest LNG exporter, with 32% of the world total, followed by Australia at 12%. Asia Pacific LNG exports stay in the Asia Pacific region, flowing primarily to Japan, South Korea, and China. The Middle East, however, exports to both Europe and Asia Pacific countries. This exporting pattern is expected to continue into the future.
Table 6-3. Largest LNG exporting countries, 2015
Country Liquefaction
Capacity End of 2015 (Bcf/d)
2015 Exports (Bcf/d)
Percent of World LNG Exports
Qatar 10 10.2 32
Australia 4.8 3.8 12
Malaysia 4.1 2.3 7
Nigeria 3.1 3.2 10
Indonesia 2.8 2.5 8
Subtotal 24.8 22 69
Rest of World 15.1 9.7 31
Total 39.9 31.7 100 Source: GIIGNL (2016), converting million metric tonnes per year to Bcf/d using 0.13. Note: Exports can exceed nominal capacity when the conditions defining nominal capacity change or when the number of days offline are fewer than expected.
As shown in Table 6-3, world liquefaction capacity stands at about 40 Bcf/d.69 LNG exports in 2015 totaled 31.9 Bcf/d, implying a liquefaction capacity utilization rate of 80%. LNG exporters are expanding liquefaction capacity in Australia, the United States, Russia, Malaysia, and Indonesia.
Regasification capacity worldwide was 84.2 Bcf/d at the beginning of 2016 (excluding the United States, where most LNG-receiving terminals are idle or being converted to export terminals.).70 Regasification capacity in Asia Pacific at the beginning of 2016 was 50.4 Bcf/d, or 63% of the non-U.S. total. LNG imports were 31.9 Bcf/d in 2015, implying a utilization factor for non-U.S. regasification capacity of about 38%. With about 7.3 Bcf/d of new regasification capacity coming online in the near future (of
68 International Group of Liquefied Natural Gas Importers (GIIGNL), “The LNG Industry: GIIGNL Annual Report 2016 Edition” (accessed October 12, 2016), http://www.giignl.org/sites/default/files/PUBLIC_AREA/Publications/giignl_2016_annual_report.pdf. 69 Ibid., p. 3. This corresponds to 308 million tonnes per annum using conversion factor 0.13. 70 Ibid., p. 29-31. The total of U.S. import terminals send out capacity is 18.5 Bcf/d.

November 2016
U.S. Energy Information Administration | Perspectives on the Development of LNG Market Hubs in the Asia Pacific Region 30
which 5.2 Bcf/d is in Asia),71 demand for LNG is expanding slower than the supply. A surplus of LNG supply will likely put downward pressure on LNG prices and may lead to review and revisions of restrictive contract terms.
Traditionally, LNG in Asia Pacific is bought and sold under long-term contracts.72 The contracts have terms that tie the supply and delivery of LNG to specific liquefaction and regasification plants, with contract prices indexed to oil prices. This structure guarantees developers of LNG liquefaction projects offtake volumes and prices that support the financing of their infrastructure investments. At the same time, buyers of LNG also are assured that LNG supplies will be forthcoming in the long term to justify their own infrastructure development.
This traditional approach to LNG contracting is changing. One sign of the change is the growth in short-term or spot LNG sales. As indicated in Figure 6-1, spot/short-term sales have been growing steadily in the last 15 years. The increase in spot and short-term sales has tracked the overall increase in the global LNG trade and the expansions in infrastructure. In 2000, short-term sales accounted for just over 5% of all LNG sales; by 2015, the estimate is that about 27% of sales are of a duration less than four years.
Figure 6-1. World LNG trade by contract duration, 2000–2015
Source: GIIGNL, The LNG Industry in 2016 and earlier years.
Another indicator, or change, is the expiration of long-term contracts. GIIGNL’s annual report for 2016, covering the year 2015, lists the long-term and medium-term LNG contracts in force as of the end of
71 Ibid., p. 26. 72 GIIGNL considers contracts of greater than 4-years duration as long-term contracts; less than 4 years are short-term contracts. GIIGNL, “The LNG Industry: GIIGNL Annual Report 2016 Edition” (accessed October 12, 2016), p.6. http://www.giignl.org/sites/default/files/PUBLIC_AREA/Publications/giignl_2016_annual_report.pdf.
0.00
0.05
0.10
0.15
0.20
0.25
0.30
0.35
0
5
10
15
20
25
30
35
2000 2002 2004 2006 2008 2010 2012 2014
Volume of transactions (Bcf/d)
Long- and medium-term Spot/Short-term Percent Spot/Short-term
Percent spot/ short-term

November 2016
U.S. Energy Information Administration | Perspectives on the Development of LNG Market Hubs in the Asia Pacific Region 31
each year. The total for 2015 volumes for these contracts comes to approximately 39 Bcf/d. Figure 6-2 shows contract volumes for Asia, Europe, and the Americas, with the middle tranche being contracts to the international oil companies (IOCs) for their own portfolio sales. By 2020, an estimated (cumulative) 3.0 Bcf/d of contracts will expire, and by 2025 10.4 Bcf/d will expire. Most of these expiring contracts are in Asia Pacific markets. These expiring volumes may be renegotiated with the same buyers and the contracts extended or sold to other buyers as new contracts, sellers may decide not to renew contracts because of resource exhaustion in the export countries, or sellers may have to divert natural gas for domestic uses.
Figure 6-2. LNG contracted volumes and contract expirations
Source: Calculated from GIIGNL, The LNG Industry in 2015
Another aspect of LNG contracting has been the destination clauses that restrict buyers from diverting LNG from the intended port to another location or reselling excess cargoes when they cannot use all of the contract delivered volumes. A number of press accounts have reported buyers pressing for destination clause relief.73 A general consensus in the industry is that destination clauses will be phased
73 The Hindu, Business Line, “India-Japan to Push for Removal of Destination Clause in LNG Contracts” (accessed June 6, 2016), http://www.thehindubusinessline.com/economy/indiajapan-to-push-for-removal-of-destination-clause-in-lng-contracts/article8106985.ece; and Platts S&P Global, “LNG buyers call for more delivery flexibility to manage supply glut”(accessed June 6, 2016), http://www.platts.com/latest-news/natural-gas/singapore/lng-buyers-call-for-more-delivery-flexibility-27817357.
0
5
10
15
20
25
30
35
40
45
2015 2016 2017 2018 2019 2020 2021 2022 2023 2024 2025 2026 2027 2028 2029 2030
Asia Pacific Portfolio Europe Americas Expiring Expiring Asia Pacific
billion cubic feet per day

November 2016
U.S. Energy Information Administration | Perspectives on the Development of LNG Market Hubs in the Asia Pacific Region 32
out.74 There is some indication that destination clauses are indeed weakening. JERA Co. Inc. (JERA), a joint venture of Tokyo Electric Power Company, Inc. and Chubu Electric Power Co., Inc. formed in April 2015, announced that it will no longer entertain destination clauses in its LNG contracts. JERA is the world’s largest buyer of LNG, and in a world of competitive LNG suppliers, JERA is likely to prevail.75 Japan’s Ministry of Economy, Trade and Industry (METI) also has indicated that it will support removal of destination clauses in LNG contracts in an effort to enhance LNG trading.76
6.2 Natural Gas Prices and Price Formation
In Asia Pacific, natural gas end users pay a combination of market-based and regulated prices. Because LNG provides the majority of natural gas supply in all countries of Asia Pacific except China, LNG prices set in the world market dominate domestic prices. Domestic prices, on the other hand, are largely regulated or are constrained by regulation of the pipeline transmission sector.
In the Asia Pacific LNG market, the contract formula based on the price of crude oil delivered to Japan, called the Japanese Customs-cleared Crude oil price or JCC (also known as the Japanese Crude Cocktail) is widely used. (The formula is described in detail in Appendix D.) Buyers and sellers negotiate prices for delivered LNG that usually have three components: a negotiated fixed component, the JCC as published by the Petroleum Association of Japan, and a negotiated fraction used to multiply the JCC. The fraction normally discounts the JCC component. Other elements of the negotiated price can include floors and ceilings on the JCC component. JCC-related prices for LNG have been the norm in Asia Pacific in long-term contracts.
The influence of the JCC is illustrated in Figure 6-3, which compares the Japan LNG price with the prices of natural gas in the United Kingdom, Germany, and the United States (Henry Hub). All of the indexes track together through 2008, and then diverge. In the U.K. and Germany, market liberalization has reduced the linkage of gas prices to fuel oil and introduced more gas-on-gas competition. Shale gas production in the United States has caused gas prices to essentially decouple from oil prices.
Japanese electric and gas utilities are the major buyers of LNG. Prices are passed through to consumers. Japan does not have a backbone gas transmission network, so there is little trading of landed and regasified LNG, other than in the immediate vicinity of the LNG terminals. Japanese pipelines mainly connect LNG terminals to local markets. TPA is required in pipeline tariffs, but enforcement of these provisions is limited, in part because of a small infrastructure grid. 77
74 Reuters, “Destination clauses on LNG will soon fade away: gas union president” (accessed October 12, 2016) http://www.reuters.com/article/us-asia-lng-contracts-idUSKBN0LT0YY20150225. 75 The Economic Times, “Top LNG buyer Japan's JERA to accept no destination clauses” (accessed June 6, 2016), http://energy.economictimes.indiatimes.com/news/oil-and-gas/top-lng-buyer-japans-jera-to-accept-no-destination-clauses/51850296. 76 Ministry of Economy, Trade and Industry (METI), “Strategy for LNG Market Development: Challenges and Countermeasures toward the Creation of Flexible and LNG Market and LNG Trading Hub in Japan” (accessed May 2, 2016), http://www.meti.go.jp/english/press/2016/pdf/0502_01a.pdf. 77 International Energy Agency, “Natural Gas Information” (accessed September 10, 2016). http://wds.iea.org/wds/pdf/Gas_documentation.pdf.

November 2016
U.S. Energy Information Administration | Perspectives on the Development of LNG Market Hubs in the Asia Pacific Region 33
Figure 6-3. Selected natural gas and LNG prices, 2000–2015
Source: BP Statistical Review of World Energy June 2016, p. 27. Note: cif refers to cost, insurance, and freight; see Appendix B for definition.
The Japanese domestic market is undergoing a major liberalization reform. Liberalization of the electricity market commenced in April 2016, and liberalization of the domestic natural gas market will begin in 2017. The reforms could allow Japanese gas buyers to secure a more flexible and market-responsive gas supply. According to METI, “To adapt to such changes, Japanese companies will attempt to leverage a flexible market as means for optimizing and hedging quantities and prices of their LNG portfolio. In the near term, there may be more cases where some purchasers that have surpluses under long-term contracts become spot sellers both within Japan and overseas.”78
Prior to 2007, China consumed only domestic natural gas. China’s internal gas pricing system balanced the cost of production, transmission, and distribution with affordability. The National Development and Reform Commission (NDRC) regulated prices at each step along the value chain to recover the cost of production through distribution, but did not reflect the value of demand. (See Appendix D.) Once China’s demand began to exceed domestic supply, pipeline imports from central Asia and LNG were needed to make up the difference. These sources cost more than domestic gas. In 2011, China began a pricing reform that tied the price of incremental supplies to the prices of alternative fuels—fuel oil and liquefied petroleum gas (LPG). An important aspect of the reform, from the point of view of this paper, is the use of Shanghai as the market location for setting the price. Besides being China’s largest city by
78 METI, Strategy for LNG Market Development Creating flexible LNG Market and Developing an LNG Trading Hub in Japan, May 2, 2016, p. 4.
$0
$2
$4
$6
$8
$10
$12
$14
$16
$18
2000 2001 2002 2003 2004 2005 2006 2007 2008 2009 2010 2011 2012 2013 2014 2015
USD/ MMBtu
Japan LNG (cif) U.K. NBP German pipeline import US Henry Hub

November 2016
U.S. Energy Information Administration | Perspectives on the Development of LNG Market Hubs in the Asia Pacific Region 34
population and a worldwide financial center, Shanghai and environs are a large consumer of natural gas.79 Prices in China remain regulated, even as LNG is purchased on the world market.
South Korean gas supply is dominated by Korean Gas Company (KOGAS), which operates a monopoly on gas transmission and sales. South Korea is almost entirely dependent on LNG. Prices are passed through to consumers usually with a month or more delay.
Malaysia, Myanmar, Vietnam, Indonesia, Thailand, Philippines, and Singapore combined have a total gas consumption about half of that of China, Japan, and South Korea. The major characteristics of these countries are:
• Several have domestic gas resources and trade within the Association of Southeast Asian Nations (ASEAN) zone
• Individual markets are dominated by monopolies for gas production, transmission, and distribution
• They have different regulatory regimes and hydrocarbon subsidy programs for consumers and most have gas price regulation
• Pipeline interconnections between countries are limited and mostly bilateral
With the exception of Singapore, these countries have made little progress toward liberalization that provides a foundation for competitive natural gas price setting based on underlying demand-supply fundamentals. The government of Singapore has moved to liberalize its gas market in an effort to create an internal market for natural gas and to establish itself as an LNG trading hub. This includes encouraging a spot market for gas, TPA, and a secondary market for domestic gas consumers.
Singapore’s large refining capacity has enabled it to become an oil pricing point. Its location in the center of Southeast Asia gas pipeline network and astride major seaborne trade routes to Asia from the Middle East and Australia provides a strategic base for establishing an LNG trading hub.
6.3 Conditions for the Development of a Natural Gas Market Hub in Asia
LNG is the dominant supply for natural gas in Asia Pacific. The infrastructure around LNG is fundamentally different from the pipeline-based markets in the United States, Canada, Europe, and the U.K., where gas market hubs have developed. The national gas markets in Asia Pacific are in the early stages of liberalization, with the exception of Singapore with its fully deregulated gas market. Pipeline interconnections between countries are limited to the ASEAN region.
The national markets in Asia Pacific at present are largely undeveloped and do not appear to provide a foundation for market hubs within the individual countries. This is because of underdeveloped infrastructure, government regulation of prices to make gas affordable, and the small size of the markets. Because the marginal supply of natural gas is LNG in Asia Pacific, the question is whether conditions exist within the LNG market that would support market hub development where price
79MIT, ““Natural Gas Pricing Reform in China: Getting Closer to a Market System?” (accessed October 2, 2016), http://www.sciencedirect.com/science/article/pii/S0301421515002451. This paper offers an in-depth description and evaluation of the effects of the policy.

November 2016
U.S. Energy Information Administration | Perspectives on the Development of LNG Market Hubs in the Asia Pacific Region 35
discovery would take place. The prerequisite for this includes an active spot market for LNG, where the price of LNG is unbundled from its delivery mechanism and buyers have easy access to the LNG market (the equivalent of TPA). A spot market is expanding for LNG in Asia Pacific, but unbundling LNG from restrictive contract terms for its delivery and TPA to regasification facilities has been quite limited. This is true in the major LNG importing markets of Japan, South Korea, China, and the ASEAN countries.
In considering the stages of development listed in Table 3-1, the picture is mixed. Only Singapore has fully achieved stages 1 and 2 as a practical matter. Bilateral trading dominates the market (stage 3), albeit under long-term contracting. At the same time, a number of PREs report prices of LNG trading in the nascent spot market that includes brokered trading (stage 6) and attempts at indexation.
Governments in Asia Pacific are seeking ways to make the LNG and domestic gas markets more market based with varying efforts at liberalization.

November 2016
U.S. Energy Information Administration | Perspectives on the Development of LNG Market Hubs in the Asia Pacific Region 36
7 Market Hub and Price Index Developments in Asia Pacific At present, there are no natural gas or LNG market hubs in Asia Pacific that provide the type of price discovery that can be useful for indexation of contract prices. While there is much interest across the region in developing such a hub, efforts to-date have been limited, in large part due to the absence of large volume pipeline interconnections or a significant spot market in pipeline gas or LNG trading. The amount of pure spot trading is small relative to the size of the market. Most of the trading is done under long-term contracts, with a growing share of short-term contracts. Prices are either fixed through negotiations, or reference various oil and gas indexes.
7.1 Market Hub Developments
7.1.1 Japan
Except for a small volume of domestic production, Japan is entirely dependent on LNG imports. With 33 operating LNG import terminals on the islands, Japan’s pipeline infrastructure is designed to connect the terminals and nearby markets80 (Figure 7-1). There is little pipeline interconnectivity among regions, hence little in the way of an integrated national market. This market is dominated by a mix of large electric utilities, gas distribution utilities, and large industries.
Figure 7-1. Japan’s natural gas infrastructure, 2015
Source: IEA, Natural Gas Information (2016 edition), p. VI 43.
80 International Group of Liquefied Natural Gas Importers (GIIGNL), The LNG Industry: GIIGNL Annual Report 2016 Edition, (accessed September 15, 2016), http://www.giignl.org/sites/default/files/PUBLIC_AREA/Publications/giignl_2016_annual_report.pdf.

November 2016
U.S. Energy Information Administration | Perspectives on the Development of LNG Market Hubs in the Asia Pacific Region 37
Japan has initiated a liberalization of the power sector, and in April 2017, will begin liberalizing the natural gas sector by opening up the residential and small commercial user’s market to full competition.81 To support this market restructuring, the METI released the 2016 “Strategic Energy Plan” that includes a number of initiatives to secure “greater supply flexibility and resiliency and market utilization.”82 This policy implies that there will be more potential players in the gas market seeking access to LNG terminals, as well as buying and selling gas system-wide. Eventually, this may evolve into gas trading on a larger scale than is now the case.
The Japanese government believes that a market hub located in Japan would provide valuable price information for both the domestic and the global LNG market. The JCC LNG pricing formula has long set gas prices across Asia Pacific. More recently, the Platts JKMTM price, which represents LNG trades in Japan and South Korea, has provided indication of spot market prices for the region. A major step toward the development of a liquid trading hub would be the establishment of reliable price indexes based on competitive market forces. METI accepts that multiple LNG price indexes across Asia Pacific can develop to reflect local supply-demand balance and establish prices in relation to the larger Japanese market.
Given the ongoing liberalization of the power and gas markets in Japan, METI encourages the Tokyo Commodities Exchange to “design and improve systems while proceeding with its efforts to create a comprehensive energy market.”83 Although METI believes market players will cooperate in the development of a Japanese index by providing information, contributing to the development of physical infrastructure, and publishing accurate transaction prices, the Ministry itself plans to take the lead in facilitating communications and ensuring that appropriate indexes are developed.
Japan’s current “Strategy for LNG Market Development” highlights several areas in which federal regulatory support will guide and enable the development of a new procurement model that is de-linked from crude oil prices and puts less emphasis on long-term contracting. This regulatory support could allow the country to develop a larger, more liquid hub with lower transaction costs. METI’s stated goal is that Japan obtains internationally recognized LNG hub status by the early 2020s. METI has identified three policy initiatives to further this goal:84
1. Enhance the tradability of LNG and natural gas–METI will promote the elimination of destination clauses in LNG contracts that it views as a barrier to easier trading.85 METI will also work to resolve other barriers to trade, promote wider use of natural gas and LNG, improve pipeline connectivity, work with other countries and industries to develop standard practices and uniformity, improve tanker access to LNG terminals.
2. Create a proper price discovery mechanism–METI will encourage further spot trading and the development of price indexes that reflect gas supply and demand fundamentals.
81 METI, “Strategy for LNG Market Development” (accessed October 3, 2016), http://www.meti.go.jp/english/press/2016/pdf/0502_01b.pdf. 82 Ibid., p. 2. 83 Ibid., p. 13. 84 Ibid., p. 7. 85 Japan’s Fair Trade Commission has launched an inquiry into destination clauses to determine whether the restriction on resales violates Japan’s competition laws. See Bloomberg News, “Japan Said to Review if LNG Contracts Baring Resale Violate Law.” July 14, 2016.

November 2016
U.S. Energy Information Administration | Perspectives on the Development of LNG Market Hubs in the Asia Pacific Region 38
3. Enhance the physical infrastructure and improve access–METI will promote TPA to LNG terminals and to the gas network and support efforts to improve the LNG, pipeline, and storage infrastructure.
Additionally, the physical components of Japan’s natural gas market restructuring reflect the following four key priorities:
1. Make physical gas traded within the country interchangeable. Whether a high-BTU or low-BTU standard is established, it is critical that gas distributed and consumed in various regions of the country be of a similar quality if national pipeline infrastructure is to be used effectively to balance local markets.
2. Increase the current number of interconnecting pipelines to support growing volumes of gas transport and trade. A greater number of pipelines ought to be interconnected with each other to ensure that localized LNG imports do not skew national gas pricing mechanisms.
3. Solve gas dispatch issue. This may be accomplished through the establishment of an Independent System Operator (ISO) and the construction of substantial ‘backbone’ gas transportation infrastructure.
4. Establish transparent cost recovery system with a fee structure to promote the construction of new infrastructure (including pipeline, storage and backbone systems). Without a guarantee of cost recovery, private local distribution companies are unlikely to invest in interconnecting infrastructure at the scale necessary to catalyze Japan’s national gas distribution system growth and to support the near-term development of a national hub for price discovery.
Structural changes to Japan’s physical gas infrastructure and the removal of associated trade barriers could further support market restructuring, but Japan has yet to develop a substantial pipeline interconnectivity and TPA. As long as LNG import terminals remain customized to a single importer’s supply portfolio, third party access will necessarily also be limited.
Since the national gas industry is dominated by private local distribution companies, which supply the majority of gas for commercial and residential use, both regulatory and financial incentives provided by the government to private industry could expedite market restructuring. One major paradigm shift would involve the restructuring of the gas delivery system by placing both transportation and distribution infrastructure under the jurisdictional oversight of an ISO. This would ensure open access to the gas delivery and storage infrastructure necessary to promote market liberalization. While local distribution systems could remain under private ownership and operation, the overall gas import and delivery system (including both import terminals and gas pipelines) would be overseen by the ISO.
Concurrent regulatory support to promote greater gas system interconnectivity would further enable market liberalization. Standards dictating the heat content and other quality specifications (also referred to as ‘interchangeability’) of natural gas being transported and traded could promote the interconnectivity of regional pipeline infrastructure. Implementation barriers do exist, however, as a standard for gas quality would also require either the downgrading of high-BTU gas (by fractionation to remove ethane and other petrochemicals or dilution of high-BTU gas with nitrogen) or the upgrading of

November 2016
U.S. Energy Information Administration | Perspectives on the Development of LNG Market Hubs in the Asia Pacific Region 39
low-BTU gas by the addition of ethane after importation and prior to distribution. A system capable of conveying large quantities of gas transnationally would also be crucial to ensure gas markets are able to be balanced in various regions of the country. This transport function could be served in one of two ways: by a substantial ‘backbone’ pipeline capable of connecting multiple local distribution systems, or by a fleet of LNG shuttle tankers capable of transporting small cargo volumes efficiently from one region of the country to another.
Finally, in addition to the necessary physical gas infrastructure expansion and concurrent market liberalization in Japan supported by METI, development of the fundamentally-global LNG market will be aided by international as well as intra-national collaboration. Japan may wish to engage and promote collaboration with other countries to promote LNG trading, including Qatar, Australia, Russia, United States, the G7, the G20, and other international organizations to address the barriers to LNG trading. One way of doing so may be to promote dialogues with all private sector market players and support newcomers to the LNG market involving LNG trading, operation of open-access LNG terminals, or LNG bunkering.
Although the outlook for a Japanese trading hub is uncertain, METI has outlined several initiatives designed to overcome barriers to development. For a trading hub to become larger and more liquid, there needs to be a much more robust trade in physical LNG on the spot market.86 A more robust trade in turn depends on greater flexibility in LNG commercial operations, while at the same time, a spot market must have some way of identifying a market price in order to develop. By working to promote a national market index for LNG and by examining opportunities to support market liberalization through financial and regulatory incentives, the Japanese government is encouraging private sector activities that may pave the way for the eventual development of greater centralized spot trading and a gas market hub where price discovery can take place.
7.1.2 China-Shanghai
China, like Japan, is pursuing policies that would establish a regional market hub that reflects the gas market conditions applicable to the mainland. The focus has been on Shanghai, which besides being China’s largest city, is also a significant market for natural gas that receives both pipeline and LNG supplies. The pipeline network in eastern China is relatively well developed, interconnecting markets with supplies.87 Shanghai also has access to several LNG terminals along the coast through the pipeline network.
The government of China has taken steps to set up institutions to promote more market-driven oil and gas trading. The Shanghai Petroleum Exchange (SPEX) began offering spot LNG contracting in 2010. In 2013, the Shanghai Free Trade Zone and Shanghai International Energy Trading Center were established to facilitate the international trading of oil and gas. In July 2015, the Shanghai Petroleum and Natural Gas Exchange (SHPGX) was launched to provide a market-based trading platform for oil and gas. The SHPGX reports daily trades in pipeline natural gas and LNG. For the first six months of 2016, there were
86 METI, “Strategy for LNG Market Development” (accessed October 10, 2016), http://www.meti.go.jp/english/press/2016/pdf/0502_01b.pdf. 87 International Energy Agency, Developing and Natural Gas Trading Hub in Asia: Obstacles and Opportunities, accessed September 5, 2016.

November 2016
U.S. Energy Information Administration | Perspectives on the Development of LNG Market Hubs in the Asia Pacific Region 40
458 LNG trades, averaging 20,000 MMBtu per trade from the Ningbo LNG import terminal near Shanghai.88 The reported prices in Figure 7-2 show a stair-step pattern of stable prices for a period of time, followed by an adjustment that appears to be related to LNG cargo deliveries and not to market-clearing activity.
Figure 7-2. Price of LNG imported to China (Shanghai), 2016
Source: Shanghai Petroleum and Natural Gas Exchange, 2016. Cargoes delivered to Ningbo terminal near Shanghai through July.
Chinese companies purchase LNG under long-term, short-term, and spot contracts. But, as in Japan, the Chinese market is in the midst of reforms that should eventually lead to market-based gas pricing. At present, the pricing system remains opaque and the city-gate prices, which are regulated by local authorities, and are managed to subsidize residential consumption at the expense of industrial uses. Pipeline gas pricing under the formula shown in Appendix D is administratively determined. Three sets of prices prevail:
• domestic pipeline gas priced by formula
• LNG and imported pipeline gas priced under bilaterally-negotiated long-term contracts
• LNG and imported pipeline gas priced in reference to oil prices (JCC, for example)
Over time, if the reforms continue, a market hub could develop that would reflect the interplay between pipeline gas and LNG imports.
88 Shanghai Petroleum and Natural Gas Exchange, “LNG Data” (accessed August 22, 2016), http://www.shpgx.com/web/news/datasingle.jsp?parentid=49&classid=94.
$8
$9
$10
$11
$12
$13
$14
Jan-16 Feb-16 Mar-16 Apr-16 May-16 Jun-16
USD/MMBtu

November 2016
U.S. Energy Information Administration | Perspectives on the Development of LNG Market Hubs in the Asia Pacific Region 41
7.1.3 Singapore
Singapore, like Shanghai, receives both pipeline gas and LNG, but is not a large gas market, with consumption of only 1.09 Bcf/d in 2015.89 Natural gas is primarily used in power generation and industrial sectors; residential and commercial sectors rely on manufactured gas. Singapore has a single natural gas transporter that provides open-access transportation to importers and other natural gas suppliers. Buyers are free to buy natural gas from any supplier. The sector is regulated by the Energy Market Authority (EMA), which oversees the power and oil sectors.90 Singapore has a more free-wheeling business economy that allows for the development of an LNG trading center.
Singapore offers some advantages as an LNG market hub for Asia Pacific. Singapore is strategically located and the port can accommodate large LNG tankers. Singapore LNG Corporation has been expanding its LNG facilities to increase receiving and storage capacity and allow re-export of LNG.
As a foundational market for a gas hub, Singapore’s size and infrastructure are problematic. Despite significant expansion of storage, the storage capacity remains small relative to the size of the LNG market in Asia Pacific.
7.1.4 Summary of Asia Pacific Hub Developments
The markets in Japan and in Shanghai, China are still in the development phase and do not yet appear to support a robust gas market hub where prices reflect the balance of supply and demand from numerous bilaterally negotiated transactions. The Singapore market is more open, but small. It is unlikely that any of these markets could soon serve as a market hub that provides price signals for the whole Asia Pacific. Rather, it is more likely that LNG price indexes covering the entire region, or a significant part of it, will grow in prominence at the same time that localized market hubs would emerge in China (Shanghai), Japan, Singapore, and perhaps other markets as they liberalize and evolve. The absence of a physical market hub representative of Asia Pacific has not limited the development of several LNG price indexes published by PREs and need not be a limiting factor in the future.
7.2 Indexes Tracking LNG Prices in Asia Pacific
Several price indexes have been developed to track LNG trade in Asia. These include the Japan Monthly LNG Spot index tallied by METI, the East Asian Index (EAX) tracked by ICIS Heren, the Platts Japan and South Korea Index tracking the price of LNG delivered to these two countries (JKMTM), and the Singapore Exchange LNG Index (SLInG) compiled by SGX.
7.2.1 Japan Monthly LNG Spot
METI developed the Japan Monthly Spot index to track contract prices for the LNG cargoes delivered to Japan. In 2014, METI began publishing the results of a monthly census distributed to LNG market
89 BP, “Statistical Review of World Energy” (accessed October 2, 2016), https://www.bp.com/content/dam/bp/pdf/energy-economics/statistical-review-2016/bp-statistical-review-of-world-energy-2016-full-report.pdf. Million metric ton of oil equivalent converted to Bcf using 39.2 Bcf per million metric ton oil equivalent. 90 Singapore Energy Market Authority, “About Us” (accessed October 13, 2016), https://www.ema.gov.sg/index.aspx.

November 2016
U.S. Energy Information Administration | Perspectives on the Development of LNG Market Hubs in the Asia Pacific Region 42
participants that tracked the LNG bid and offer prices among active traders.91 This has provided some indication of LNG value.
METI polls 15 market participants on a monthly basis for the prices of delivered LNG called delivery ex-ship (DES) prices. Reported LNG prices include prices of both contracted and delivered LNG in that month and exclude names of trading companies (to protect confidentiality of transactions).92 This method results in the creation of two indexes—the Contract-based monthly LNG spot price and the Arrival-based LNG spot price. The Contract-based price reflects the pricing for those deals made within the month, and the Arrival-based price includes prices of LNG cargoes, which arrived during the survey month. The Japan Monthly LNG Spot price index applies to ships of any cargo size with spot LNG freight to be delivered to any location in Japan.
7.2.2 East Asian Index (EAX)
The EAX is published by ICIS Heren and is calculated by averaging each day’s DES front-month and second-month ahead assessments for Japan, South Korea, Taiwan, and China.93 Price assessments for the EAX index are published daily.94 The EAX index relies on surveys conducted via phone and online with a variety of market participants (gas producers, LNG brokers and traders, and LNG end users). Price assessments are completed for prompt delivery up to 90 days ahead.95 Five half-month contracts are assessed for the second, third, fourth, fifth, and sixth half months ahead.96
All standard LNG cargo sizes are eligible for price discovery, with tanker capacities ranging from 30,000 cubic meters (m3) LNG (0.6 Bcf) to 266,000 m3 LNG (5.6 Bcf)97. The largest volume is the capacity of the ”Q-Max” tankers, which refers to the Qatar Max carrier, the largest LNG carrier class in the world at 267,335 m3 LNG or 5.7 Bcf of capacity.98
7.2.3 Japan South Korea Marker (JKMTM)
Platts Japan South Korea Marker (JKMTM) is estimated from daily surveys of market players (the number of survey participants is unknown) via phone or other electronic forms of contact. The JKMTM price assessment for any given delivery period is based on trades, bids, and offers that must be both recent and repeatable.99 Requiring the “repeatability” of trades supports price transparency by ensuring that one-time sales of single cargoes either below market price (for the purpose of liquidating a cargo immediately) or above market price (to a shortage-strapped buyer) do not unduly impact market volatility.
91 Japanese Ministry of Economy, Trade and Industry, “Trend of the Price of Spot-LNG” (accessed September 16, 2016), http://www.meti.go.jp/english/statistics/sho/slng/result/pdf/201605-e.pdf. 92 Ibid., p. 2. 93 ICIS Heren, “LNG Markets Daily Methodology” (accessed October 2, 2016), https://s3-eu-west-1.amazonaws.com/cjp-rbi-icis-compliance/wp-content/uploads/2016/05/Global-LNG-Markets-Methodology-12-May-2016.pdf. 94 Ibid., p. 3. 95 Ibid., p. 7. 96 Ibid., p. 12. 97 GIIGNL, The LNG Industry, annual report, 2016, pg. 14-18. 98 Maritime Connector, “Q-Max” (accessed October 14, 2016), http://maritime-connector.com/wiki/q-max/. 99 S&P Global Platts, “Platts JKM™ (Japan Korea Marker) Gas Price Assessment: Price Assessments” (accessed October 12, 2016), http://www.platts.com/price-assessments/natural-gas/jkm-japan-korea-marker.

November 2016
U.S. Energy Information Administration | Perspectives on the Development of LNG Market Hubs in the Asia Pacific Region 43
Platts LNG assessments are market-on-close (MOC) prices and include all transactions for cargoes within the range of standard ship sizes.100 Development of the daily JKMTM price assessment considers information that is not directly reported but that affects market supply or demand fundamentals, such as current shipping costs (including fuel prices), production maintenance, tender issues, and weather data.101
7.2.4 SGX LNG Index Group (SLInG)
The SGX LNG Index Group is a joint venture of Energy Market Company (EMC), which operates Singapore’s electricity market and Singapore Exchange Limited (SGX), that has developed a Singapore-based spot LNG index, called SLInG index. The SLlnG relies on a survey of market participants for its price assessments, an average price that LNG traders, exporters, and importers report. The number of market participants contributing to the SLInG index has increased since its inception. In September 2014, the Index received input from only 5 participants.102 By June of 2016, SGX estimates that approximately 50 market participants provide the input used to calculate the Index.103
Participants provide half-monthly spot price assessments for the upcoming 3rd through 6th half-calendar months, based on the expected value of an LNG cargo slated for delivery at a given location during that timeframe.104 The SLInG price assessment applies to vessels on the water in the vicinity of Singapore that are not destination limited. The standard cargo size for ships eligible for SLInG consideration is between 135,000 m3 LNG (2.9 Bcf) and 175,000 m3 LNG (3.7 Bcf). The index value—based on the calculated average of the half-monthly prices for the first full month of price assessments—is currently published twice weekly.
In 2016, SGX expanded service offerings to include swap and futures contracts. As the spot LNG market in Asia Pacific continues to develop, SGX and EMC expect to see greater volumes of spot LNG traded. With greater spot volumes and a larger number of bilateral deals, the SLInG Index operators expect to see greater opportunity for index-based LNG OTC trading. Starting in September 2016, SGX LNG also provides price assessment for a North Asia LNG price series alongside the SLlnG Index. The first reported data show the North Asian index being approximately $0.25/MMBtu higher than the Singapore-based SLInG index.
7.2.5 Other LNG Indexes
The SLInG index tracks free on board (FOB) prices for LNG, assessed as if being shipped from Singapore. The three other indexes tracking Asia Pacific LNG prices conduct their price assessments for LNG DES. Comparing SLInG with other indexes requires accounting for transportation costs in addition to the SLInG price assessment. With the expansion of liquefaction capacity, some PREs are now reporting FOB prices in producing markets. Platts reports FOB prices for the Middle East and Australia, where the latter
100 Ibid. 101 Ibid. 102 Energy Market Company and SGX, “SLInG FAQs” (accessed September 3, 2016), https://www.emcsg.com/f1415,106648/FAQ_for_LNG_Nov_2015_Final.pdf. 103 Notes from call with SGX on Asia Pacific Gas Markets, 21 June 2016. 104 Energy Markey Company, “Methodology and Specifications Guide: SGX LNG Index Group” (accessed September 12, 2016), https://www.emcsg.com/f1415,99779/SLInG_Methodology_and_Specifications_Guide.pdf.

November 2016
U.S. Energy Information Administration | Perspectives on the Development of LNG Market Hubs in the Asia Pacific Region 44
is derived by subtracting current tanker rates from the JKMTM index. (Australia LNG is largely stranded, with little internal market for the gas and only an export market. Australia inaugurated a gas supply market hub in 2014 in Queensland to facilitate the marketing of gas to Australia’s southern domestic markets and its east coast LNG export facilities.)105 Other PREs also report various FOB prices for LNG, including U.S. Gulf Coast (by ICIS), African locations (by Argus), and Europe for reloads (by Argus).
Other DES indexes remain in early stages of maturity. In February 2016, the CME Group introduced the LNG DES Japan futures contract trading through the Japan OTC Exchange (JOE) and other OTC brokers. The contract is based on the price settlements index developed by RIM Intelligence Co. of Japan. The LNG DES Japan (or RIM) futures standard contract is for 10,000 MMBtu and uses the spot LNG price assessments for LNG Japan DES for price settlements by RIM Intelligence. Based on a review of the CME website, there appears to be no trading in this contract.
7.2.6 Comparison of Asia Pacific LNG Indexes
While the value of price discovery at individual hubs is determined by market factors, including the number of participants and the volumes of pipeline gas and LNG exchanged at a given location, price discovery for the entire Asia Pacific region is most readily conducted by examining a core group of indexes tracking LNG pricing. These include the indexes charted in Figure 8 and sourced from EAX, METI, Platts, SGX and other regional price assessments, e.g., Argus Media (ANEA index), RIM Intelligence (for Japan, South Korea, and Singapore), and Platts JKMTM.
Table 7-1 summarizes selected price indexes in Asia Pacific. All indexes are quoted in U.S. dollars per MMBtu.
105 Australian Energy Market Operator, “Gas Supply Hubs” (accessed August 18, 2016), https://www.aemo.com.au/Gas/Gas-Supply-Hubs.
November 2016
U.S. Energy Information Administration | Perspectives on the Development of LNG Market Hubs in the Asia Pacific Region 45
Table 7-1. Characteristics of Asia Pacific LNG price indexes
Index Japan/METI JKMTM RIM Japan ANAE EAX SLInG
Publisher METI Platts RIM Intelligence Argus Media ICIS SGX & EMC
Start of Stats Mar. 2014 Feb. 2009 Feb. 2016 2012 Jan. 2014 Sept. 2014
Ship (Cargo) Size
Any 2.9–3.7 Bcf 2.9 Bcf tankers & partial cargoes
2.9–3.3 Bcf & partial cargoes
normalized
0.6–5.6 Bcf & partial volumes 2.9–3.7 Bcf
Index Coverage Area
LNG delivered to Japan
Spot physical cargoes delivered
into Japan and South Korea
Japan, South Korea, Taiwan
and China
Japan, South Korea, Taiwan,
China
Physical cargoes to Japan, South Korea, Taiwan &
China
Vessels on the water with potential to deliver to Singapore
Assessment Type
Census sent from METI to market players
Daily phone or electronic survey of market players
Trading info from OTC market;
Price assessment from JOE LNG
market deals & bids/offers
Daily phone or electronic survey
of market participants
Daily phone or electronic survey
of bids, offers (first-hand or
observed)
Survey of select market
participants
Assessment Frequency
Monthly price assessments
Daily, with market close
prices
Assessed & published daily
Assessed & published daily
Assessed & published daily
Half-monthly assessments,
published twice weekly
Sale or delivery
DES contracted and arrival DES DES DES DES FOB
Assessment Forward
Range
Any forward period for LNG
delivery (contract-based);
within-month (arrival-based)
Prompt delivery; 3rd & 4th or 4th
& 5th half-month forward
Half-monthly assessments for the 3rd–5th half-months forward
Prompt delivery; 2nd–5th half-
months forward
3rd–6th half-months out
3rd–6th half-months out
Index Calculated
Contract-based (for deals made in-month) and
arrival- based (for cargoes arriving
that month)
Prompt or deferred spot
prices averaged for assessed half-
months
Monthly average price for half-
months calculated daily
Physical and forward swap are assessed daily for forward half-months
Daily front and second month
ahead prices for all countries
averaged
Half-monthly prices are
averaged for the first full month
Types of Trades
Included
Spot LNG to be delivered
Spot LNG to be delivered
Deals done and bids/offers on LNG cargoes
Spot LNG to be delivered in 6–12
weeks
Global prompt & mid-term charter
LNG
Spot LNG able to be shipped to
Singapore
Number of Contributors
~ 15 Not specified in Methodology
Not specified in Methodology
Not specified in Methodology
Varies daily; no minimum data
threshold 50
Contributor Requirements
Companies/ consumers of
spot LNG
Any market participant; buy/ sell prices must
pass the ”repeatability”
test
None; market prices assessed
from OTC market trading
information
All credible market sources,
market participants and brokers/trading
platforms
Active or past LNG industry
participants, not only the physical
market
Active in the physical LNG
market
Data Cleaning N/A
Data aligned with standard assessment specifications
Higher bids & lower offers are
prioritized as closer to market
values
Market condition adjustments if
assessment hierarchy would
skew results
Data verified with trading
counterparty; technical-
purpose cargoes excluded
Top 15% and bottom 15% removed as
outliers

November 2016
U.S. Energy Information Administration | Perspectives on the Development of LNG Market Hubs in the Asia Pacific Region 46
The lack of data makes estimations of the churn rate for LNG trading in Asia Pacific very difficult. A reasonable estimate is that it is probably just over 1.0. There is not a substantial amount of trading on the exchanges for derivative products and information on re-trading of physical volumes is based on anecdotes. Trading in JKMTM futures has been modest in volume and has grown from 201 trades in 2012 to 270 trades in 2013, 1,654 trades in 2014, and 2,791 trades in 2015.106 This represents 28 trillion Btu of futures trading in 2015, about 0.5% of recent annual LNG consumption in Japan and South Korea.
Figure 7-3. Comparison of price indexes for spot LNG in Asia Pacific, 2014–16
Sources: Japan Ministry of Energy, Trade, and Industry, Singapore SGX, and Platts.
As shown in Figure 7-3, LNG price indexes in Japan and Singapore can vary, but generally track each other. Note that the Singapore SLInG Spot LNG index reflects a price assessment for FOB LNG. The three other indexes track DES LNG pricing, which includes insurance and transportation costs in the sales price.107 The indexes reflect both reported deals and expert judgment from the index participants, which may influence their congruity. In large part, the indexes follow one another as expected. The two METI indexes are post-delivery summaries of prices paid in the previous month. The SLlnG and JKMTM track quite closely. There is no price assessment for the China Shanghai index that reflects day-to-day market transactions.
106 Center for Energy Economics, “LNG Supply Outlook 2016 to 2030” (accessed October 20, 2016), http://www.beg.utexas.edu/energyecon/thinkcorner/CEE_Advisor_Research_Note-Andy_Flower_LNG_Supply_Outlook-Aug16.pdf. 107 NatGas.info, “Gas Pricing” (accessed July 11, 2016), http://natgas.info/gas-information/what-is-natural-gas/gas-pricing-contracts.
$0
$2
$4
$6
$8
$10
$12
$14
$16
$18
Japan Contract-based Spot LNG Import Price (METI) Japan Arrival-based Spot LNG Import Price (METI)
Singapore SLInG Spot LNG Index (SGX) JKM
USD/MMBtu

November 2016
U.S. Energy Information Administration | Perspectives on the Development of LNG Market Hubs in the Asia Pacific Region 47
Looking across the prospective hubs and pricing indexes in Asia Pacific, the following conclusions can be drawn:
• Japan does not have the physical infrastructure or TPA to transport natural gas between domestic market participants. If Japan could solve its infrastructure limitations and gas quality issues (different gas specifications at different points of entry due to LNG sourced from multiple countries), then it could increase liquidity. METI’s “Strategy for LNG Market Development” provides high-level details but little information on concrete steps that need to be taken to overcome existing limitations for the hub development. The government is committed to supporting private sector initiatives focused on development of a trading regime for natural gas that could lead to the establishment of a reliable natural gas market hub. METI’s stated goal is to become the “internationally recognized hub by the early 2020s.”108
• China (Shanghai) has a developed infrastructure; however, the Chinese government’s close involvement with price setting and market control may be viewed as a deterrent by potential participants. There is no meaningful TPA as of yet.
• Singapore is considered a strong candidate for an Asia-wide market hub because its price reporting is transparent. It may be acceptable as an independent location to both Chinese and Japanese buyers. However, it does not have integrated physical infrastructure or storage capabilities for a liquid hub, is a small market, and is distant geographically from both Japan and China.
• Proposed FOB price indexes in the U.S. Gulf Coast (USGC) and Eastern Australia as price setters for Asia Pacific markets may be useful in special circumstances. For example, a buyer of gas priced at a USGC liquefaction terminal (and typically tied to Henry Hub) may resell the gas in Asia Pacific at a USGC price, plus or minus some cost adjustment. It is unlikely that these FOB prices would have a major influence on Asia Pacific market prices given the size of the consumer markets and the variety of alternative supply sources available to the region.
• LNG price indexes for Asia Pacific offered by the various competing PREs provide a degree of price discovery. The indexes strive to provide accurate and vetted price assessments and appear to be reliable. Absent a market hub, these indexes provide actionable price information. That said, the market will decide which index prevails when a sufficient number of market participants begin using one or another index exclusively.
7.2.7 Prospects for an Asia Pacific Gas Market Hub in Japan
The best prospect for a liquid physical hub expected to develop in the foreseeable future in Asia likely would be centered in Tokyo and would extend as far as there are gas pipeline connections with adequate capacity. The creation of the Tokyo-centered physical hub for natural gas would conceivably evolve into the trading of spot physical gas on a variety of time bases such as month-ahead, half-month-ahead, day-ahead and intraday. Forward and futures markets would also be expected to evolve with products available for several months and half-months into the future. In a future scenario with robust trading of spot and financial products on a Tokyo hub, one would expect that the pricing of gas in the
108 Ministry of Economy, Trade and Industry, “Strategy for LNG Market Development” (accessed September 13, 2016), http://www.meti.go.jp/english/press/2016/pdf/0502_01b.pdf.
November 2016
U.S. Energy Information Administration | Perspectives on the Development of LNG Market Hubs in the Asia Pacific Region 48
hub would reflect LNG spot price indexes for future time periods for which incremental spot LNG deliveries are taking place and are being surveyed (that is, approximately the 3rd to 6th half-months forward from the present). The forward/futures hub gas prices for a specific future period would be expected to equal the LNG index of the corresponding time period adjusted as necessary for entry/exit fees109 and fuel retainage for regasification. The reason that the hub prices (after adjustments) would be expected to converge with spot LNG indexes is that marketers at the Tokyo hub would be able to sell/buy gas at the hub and balance their physical positions by bringing in incremental LNG shipments or by diverting shipments to other Asian market locations.
Initially, this price arbitrage process would be subject to the practical limits of LNG transaction size (that is, a full ship load of roughly 3.4 bcf or a partial ship load if available of “new” LNG or a volume of “remarketed” LNG shuttled to/from surrounding markets). The making of the Tokyo hub as large as feasible by interconnecting surrounding markets would make it easier to change LNG flows to balance the market without overwhelming the hub’s ship offloading and LNG storage capacity and the ability of market to absorb or make available incremental volumes. If a close correspondence between the Tokyo price and the Asian LNG indexes were to take place, the Tokyo hub futures market could be used to hedge LNG transactions throughout Asia, in the same way that Henry Hub futures are used to hedge natural gas transactions throughout North America.
Short-term spot natural gas prices on a Tokyo hub (i.e., prices for spot sales today and for the next month or so) would reflect local market conditions and would potentially differ from short-term prices in any other similar hub that might develop in Asia. The short-term natural gas hub prices would reflect local weather, electricity demand, power plant availability and alternative fuel availability and prices. However, even the hub’s short-term gas prices for the next 30 days would be related to spot LNG prices for the next 3rd to 6th half-months in so far as marketers can change their short-term regasification volumes and balance those volumes with incremental LNG purchase and sales/diversions. Having a large hub with large LNG storage capacity will help to arbitrage prices across time periods. In this way a large Asian hub with large storage capacity relative to market demand would be expected to see less volatile short-term gas prices that correspond well with spot LNG indexes. On the other hand, smaller Asian gas hubs with little storage might be expected to have more volatile short-term natural gas prices.
Which Asia Pacific countries develop liquid natural gas hubs with reliable price indexes will depend in part on the trading activities of buyers and sellers. While the governments of Japan and China have indicated a preference for the private sector to lead the way in establishing a gas trading regime, it is
109 The Tokyo hub might use an entry/exit fee approach similar to what is used in European systems wherein entering gas pays
an entrance tariff and gas exiting the system pays an exit tariff. (There would also have to be a storage fee for LNG stored
within the hub beyond the nominal storage period included in the “entry fee” tariff.) If a transaction in the hub were based on
an “in hub” basis then such gas would reflect the spot LNG index plus the hub entrance tariff. If the gas where sold on an “out
of hub” basis then the hub gas prices would reflect the spot LNG index plus the hub entrance tariff, plus the hub exit tariff, plus
the value of gas used for regasification.
November 2016
U.S. Energy Information Administration | Perspectives on the Development of LNG Market Hubs in the Asia Pacific Region 49
clear from the experience of the United States and Europe that an active government effort to overcome obstacles will be required. These obstacles include:
• the need to allocate the cost of restructuring legacy contracts with pricing formulae yielding higher-than-market prices
• resistance from franchise utilities unwilling to give up captive customers • reluctance of infrastructure owners to make new investments to expand interconnectivity or to
operate their systems under open access rules • slow acceptance by market participants of the competitive rules (e.g., affiliate information
sharing) and market monitoring requirements • preferences of regulators for administered prices • popular resistance to a new market system where some restructuring cost that will be socialized
and recovered from customers is known and certain, but long-term efficiency savings for customers are promised but less certain
7.3 Summary Observations
The history of gas market development in the United States and Europe offers insight into the possible evolution of a functional gas market hubs in Asia Pacific where prices are tied to supply and demand of natural gas rather than to alternative fuels. In both the United States and Europe, government regulators initiated policies that created the opportunities for competitive gas markets to develop. The principal changes were the unbundling of natural gas from transportation and delivery services, the guarantee of non-discriminatory third-party access to transportation services, and the deregulation of natural gas prices. Regulators in the United States were responding to an excess supply of gas that had major consuming segments of the economy calling for wider access to lower-cost supply. In the United Kingdom, privatization of the national gas sector led to the creation of a competitive market and establishment of the NBP. In Europe, the desire for a U.S.-like large, internal competitive market precipitated EU directives to implement changes. Because the European Union is a collection of sovereign states, each with its own legal and institutional structures that require considerable effort to harmonize, producing a coordinated response to these directives took substantial international collaboration. Key to these experiences in Europe and the United States was the role of regulators with authority to make changes. Looking ahead to the anticipated development of a gas market in Asia Pacific, the lack of a centralized regulatory body for the region as a whole as well as a lack of legislatures and regulators within each country may impact the advancement of market liberalization.
This report has attempted to distinguish between gas market hubs and gas market indexes. Traditionally, the operation of hubs has preceded generation of the reliable gas price information, which in turn evolved into reliable price indexes.
In Asia Pacific, this traditional relationship between market hubs and price discovery may not necessarily hold. LNG price indexes—based on monthly and half-month delivery periods—are being established before any of the markets described here (China (Shanghai), Japan, and Singapore) will develop operational natural gas hubs with reliable price indexes. Despite a lack of substantial Asia Pacific gas

November 2016
U.S. Energy Information Administration | Perspectives on the Development of LNG Market Hubs in the Asia Pacific Region 50
transport infrastructure, of the total 4,057 global LNG voyages in 2015,110 57% went to Asia Pacific.111 Therefore, the virtual pipeline system made up of LNG ships is heavily concentrated in the Asia Pacific region. Additionally, the number of trading parties is significant across the region: approximately 25 active sellers of LNG and about 40 active buyers, including aggregators.112 Meanwhile, LNG contract terms are becoming increasingly flexible, buyers and sellers are seeing fewer traditional long-term deals, prices are becoming more hybridized and creative, and actual spot market sales, while modest, appear to be increasing.
Table 7-2 compares Asia Pacific region with the United States and Europe in terms of the development of gas market hubs and reliable price indexes.
Table 7-2. Comparison of Asia Pacific gas markets with the U.S. and European markets
Development Stage United States
United Kingdom
European Union Asia Pacific
1 Gas prices deregulated and gas sales unbundled from gas transmission Yes Yes Largely yes Not in all countries
2 Third-party access to transport facilities, terminals Yes Yes Yes No
3 Bilateral trading predominates Yes Yes Yes Yes in LNG, not so for gas in all countries
4 Transparency in pricing and volumes traded Yes Yes Yes Not in all countries
5 Standardization of trading rules and contracts Yes Yes Yes No
6 Over-the-counter brokered trading Yes Yes Yes Yes
7 Price indexation Yes Yes Yes Yes for LNG
8 Non-physical traders enter Yes Yes Yes Yes
9 Futures Exchange Yes Yes Yes Yes
10 Liquid Forward Price Curve Yes No No No
Looking at the churn rate for these markets, the United States has an estimated churn rate of between 60 and 90 and the United Kingdom of about 22. The churn rate estimate for the European Union is about 5.2. The estimate for Asia Pacific is just over 1.
The LNG trade generally, and in Asia Pacific in particular, presents a number of complications to the development of a market hub with a location and time-specific price index that yields price discovery for LNG and natural gas. The size of LNG cargoes and the uneven nature of LNG cargo delivery schedules is one confounding factor. Pipeline receipts and deliveries are by contrast continuous and almost instantaneous (i.e., a daily price at Henry Hub for next day delivery is propagated throughout the North American network and reflected in prices at other locations on the same day). The geographic size of the Asia Pacific LNG market and the distances between ports also contribute to pricing uncertainties. In
110 International Gas Union, “World Gas LNG Report” (accessed October 4, 2016), http://www.igu.org/publications/2016-world-lng-report. 111 Ibid, p. 9. 112 International Group of Liquefied Natural Gas Importers, The LNG Industry (accessed October 4, 2016), http://www.giignl.org/sites/default/files/PUBLIC_AREA/Publications/giignl_2016_annual_report.pdf.

November 2016
U.S. Energy Information Administration | Perspectives on the Development of LNG Market Hubs in the Asia Pacific Region 51
addition, variations in gas quality among cargoes affect the comparability of prices reported at different locations and times. These discrepancies are not generally a problem in pipeline systems where calorific standards are maintained through limitations on the specification of the gas that can enter the pipeline system.
All other gas market hubs have been based on pipeline models of delivery. Asia Pacific, with its heavy dependence on LNG, has unique characteristics. Progress towards market hub-based price discovery will depend on a number of developments: more spot trading of LNG, removal of destination clauses, full TPA to LNG facilities, and other institutional and regulatory reforms in individual countries.
Interviews with several market participants trading LNG in Asia have provided relevant information about the ongoing evolution of the Asia Pacific LNG market. The general consensus is that LNG trading norms are undergoing many changes, with substantial variability and uncertainty developing in the market regarding pricing and contract terms. Legacy long-term contracts still prevail in the market. However, these contracts are likely to be modified in the near future. Contract terms may be reduced from the 20+ year average that now prevails, while in some cases the inclusion of destination clauses in contracts may be eliminated or modified. Futures contracts offered for Asian LNG, meanwhile, continue to be thinly traded at present. Short term and spot contracts are increasingly more common, but pure spot trades appear to account for a small percentage of the total trading. Today, pricing in most contracts still appears to be based on oil indexes: the JCC and Brent are most commonly mentioned. However, hybrid pricing that uses a combination of oil indexes and, rarely, Henry Hub or NBP, is beginning to appear in contract terms more frequently.
Despite earlier discussion of the various Asian LNG price indexes that have been developed, it is unclear to what extent these are being used to price LNG deals. A promising development is that although the specific prices examined for this report from the various LNG indexes for Asia Pacific differed from each other due to definitional and methodological differences, their general trends track closely. The persistence of LNG trades linked to oil prices is understandable given the novelty and uncertainty around the published LNG indexes, the remoteness and disconnection of many buyers’ markets, and the fact that the oil indexes can be hedged in a much more liquid market. Where LNG is traded using LNG indexes, trades involving Japan and South Korea, which accounts for the largest share of the market, tend to favor those indexes linked more closely to those markets.
Based on conversations with market participants, several large LNG producers and aggregators do not provide market information or prices to PREs since the large market participants cannot be seen to influence indexes. The price assessment methodologies mentioned in this report undoubtedly include prices of actual transactions from parties, who do engage with the reporting agencies. However, participation is selective and not all transactions are reported, so estimates have to be made given the limited amount of reportable and reported transactions. The various indexes are perceived by the market to be useful indicators, but not necessarily fully reflective of all actual spot prices.
Despite certain questions about inconsistencies among the development of LNG price indexes for the Asia Pacific region, it could be expected that for the near future the various published indexes will be the most reliable indicators of the market value of natural gas in Asia Pacific. As existing LNG price surveys

November 2016
U.S. Energy Information Administration | Perspectives on the Development of LNG Market Hubs in the Asia Pacific Region 52
continue to improve in accuracy and increase their significance as indicators of the market price for LNG, indexes will be more reliably used, not only to set the pricing for sales and purchase contracts, but also to serve as the basis for greater volumes of futures and derivatives trading.
Price indexes arising from physical gas trading in Japan, China (Shanghai), Singapore, or other locations will follow to the degree that those hubs can gain physical and financial trade volume. This is most likely to occur in Japan, given the size of the gas market and the policies of the government to encourage the development of trading in both the electricity and natural gas, infrastructure enhancements, and other policies to promote market development led by the private sector. It is also in the interests of Japan’s largest commercial LNG importers to support a market for spot trading of natural gas. However, it could take five to ten years to develop a natural gas hub in Japan that would provide reliable and transparent prices. Such hub-based price indexes would reflect the monthly and half-month Asia Pacific LNG price indexes and potentially would expand to include hub-specific daily price discovery as well.

November 2016
U.S. Energy Information Administration | Perspectives on the Development of LNG Market Hubs in the Asia Pacific Region 53
Appendix A. Acronyms ACER Agency for the Cooperation of Energy Regulators AECO Alberta Energy Company (Canada) AGCS Austrian Gas Clearing and Settlement ASEAN The Association of Southeast Asian Nations Bcf/d Billion cubic feet per day Btu British thermal unit CEGH Central European Gas Hub CIF Cost Insurance and Freight CME Chicago Mercantile Exchange CNMC Spanish National Commission for Markets and Competition COP Conference of the Parties DES Delivery Ex-Ship EAX East Asian Index EEX European Energy Exchange EFP Exchange for Physical Gas EFS Exchange for Swap EMC Energy Market Company EU European Union FERC Federal Energy Regulatory Commission FOB Free on Board GCA Gas Connect Austria GIIGNL International Group of LNG Importers GME Gestore dei Mercati Energetici (Italy) GPL Germany Gaspool ICE Intercontinental Exchange IEA International Energy Agency IGH Iberian Gas Hub (Spain) IOCs International Oil Companies JCC Japanese Customs-Cleared Crude JKM Japan South Korea-Marker JOE Japan OTC Exchange LEBA London Energy Brokers Association LNG Liquefied Natural Gas LPG Liquefied Petroleum Gas METI Japan’s Ministry of Economy, Trade and Industry MIBGAS Iberian Gas Market (Spain) MMBtu Million British thermal units NAESB North American Energy Standards Board NBP National Balancing Point (U.K.) NCG National Connect Germany NDRC The National Development and Reform Commission (China)

November 2016
U.S. Energy Information Administration | Perspectives on the Development of LNG Market Hubs in the Asia Pacific Region 54
NGPA Natural Gas Policy Act NYMEX New York Mercantile Exchange OCM On-day commodity market OFGEM U.K.’s Office of Gas and Electricity Markets OIES The Oxford Institute for Energy Studies OTC Over-the-Counter PEG Nord Point d’Exchange Nord (France) PEG Sud Point d’Exchange Sud (France) – now part of Trading Region South PRE Price Reporting Entity PSV Punto di Scambio Virtuale (Italy) SGX Singapore Exchange Limited SHPGX The Shanghai Petroleum and Natural Gas Exchange SLInG Singapore Exchange LNG Index SPEX The Shanghai Petroleum Exchange (China) TIGF Transport Infrastructures Gaz France – now part of Trading Region South TPA Third-party access TRS Trading Region South (France) TTF Title Transfer Facility (Netherlands) UNC USD
Uniform Network Code (United Kingdom) U.S. dollar
VTP Virtual Trading Point ZEE Belgium Zeebrugge Hub

November 2016
U.S. Energy Information Administration | Perspectives on the Development of LNG Market Hubs in the Asia Pacific Region 55
Appendix B. Key Terms and Definitions Below, key terms are organized as they appear in the report.
A gas market hub is a physical location with interconnecting pipelines, and possibly other natural gas transportation and storage infrastructure that provides receipt and delivery capabilities between pipelines, allowing parties to exchange gas and transfer title to gas at minimal cost. Because of this interconnectivity, buyers and sellers of gas transact business at these hubs. Gas market hubs are sometimes referred to as “Market Centers” to emphasize their role in market balancing and price formation.
A notional hub (also called a virtual hub) is a type of gas market hub that has all of the characteristics of a gas market hub, but encompasses market activities over a wide area rather than a single point or small area. Notional hubs are always associated with transmission networks within which physical transfer costs are minimal. Examples of notional hubs are the U.K.’s NBP, Canada’s AECO-C, and the Dutch TTF.
A transit hub is a physical location with interconnecting pipelines where gas custody transfers take place, but where there is little trading activity. PREs may report prices at transit hubs.
Price Reporting Entity (PRE) regularly surveys buyers and sellers within a region or at various gas hubs and reports prices, volumes, and number of trades, usually on a daily basis. The PRE typically does not reveal who the buyers and sellers are. The PRE has protocols for ensuring the reliability of the information it receives from market participants and may adjust reported prices for consistency. The PRE publishes prices regularly to paying subscribers or (for public agencies) by posting results on the internet.
A price index is an average of the gas prices reported by a PRE or exchange for a specific location over a defined period of time (day, week, or month) and may be a simple average or a volume-weighted average of all reported trades. Typically an index is associated with a specific location, such as a market hub, but it also can be more broadly associated with a region, depending on how the index is constructed. For example, an index could represent the average of all gas traded across several hubs or locations that do not, in themselves, constitute market hubs. In this report, a price index at a gas market hub is a reliable indication of market conditions at the hub. Because of this, buyers and sellers are willing to set prices for future deliveries at whatever price the index indicates. Derivative contracts (futures, swaps, options) also refer to the index price for the underlying gas value.
A benchmark price index as reported by a PRE is used to price physical and financial trades within the geographic location and for the commodity specification for which the index is defined, as well as for other locations and commodity specifications. A price index can reach benchmark status when it is widely referred to as a true representation of the market. A benchmark index is associated with a gas market hub strategically located relative to consuming or production markets, where there is a high volume of physical trading. A benchmark index will be used in the pricing of derivative financial instruments, like futures contracts, options, and swaps. Prices for gas at other gas market hubs or locations are quoted in reference to the

November 2016
U.S. Energy Information Administration | Perspectives on the Development of LNG Market Hubs in the Asia Pacific Region 56
benchmark index. Similarly, other financial derivative products will be based on the benchmark index.
Synthetic price index is based on calculations intended to represent the actual sales prices when direct observations are infrequent and inadequate. A synthetic price index may be the result of adjusting observed prices and averaging these across a variety of locations and time frames. PREs develop and report synthetic indexes when there is no operating gas market hub to generate sufficient price information. The adjustments are intended to “correct” the reported prices for differences in transportation cost, volume, fuel specifications, etc.
Price discovery in this report refers to the quality of the pricing information at a hub that reveals the value of gas in commerce at a specific time and place based on the supply and demand for gas. Price formation at a market hub arises through bilateral arms-length trades between parties or through market clearing mechanisms at exchanges. PREs and exchanges report volumes and prices traded. Indexes based on these reported prices are useful indicators of market conditions. Prices for contracted future deliveries provide information on market expectations.
Exchanges serve as market-clearing agents where offers of gas and bids for gas are posted under the rules of the exchange and trades are executed on the exchange without buyers and sellers knowing the identity of the counter parties. Exchanges enforce standard contract terms (quantity, delivery conditions, quality, etc.). Exchanges also offer derivative products based on the underlying gas trading; these products include futures contracts, swaps, and options that facilitate financial hedging of the underlying physical trades.
Third-party access (TPA) is a characteristic of all liberalized gas markets where there is no discrimination in access to gas pipeline, storage, and related facilities. Owners of the facilities are required to grant access to their facilities and services to any third party (including competitors) on commercial terms similar to those of their existing customers. TPA is an essential feature of gas market hubs and the networks in which they operate.
Over-the-Counter (OTC) or bilateral trading refers to arm’s-length agreements to buy and sell gas between two parties negotiating directly with one another or through a broker or agent. PREs canvas parties to bilateral trades to develop price series and price indexes.
On-the-day Commodity Market or OCM is a United Kingdom gas exchange-based anonymous trading platform that provides a framework for same-day trading to minimize system imbalances caused by shippers’ injections/withdrawals that deviate from their nomination schedules. Ideally, transactions in these two markets between shippers lead to bids that reflect the true short-run marginal cost of gas in the system.
Liquidity describes a market hub where significant volumes of gas are traded involving many independent participants, and many individual transactions, all of which indicates that the prices revealed at the hub are accurate indicators of the value of gas based on supply and demand. A liquid market is one where a seller or buyer can be reasonably assured that trades can be consummated quickly without greatly affecting the prices within the market. One indicator of a market’s liquidity will

November 2016
U.S. Energy Information Administration | Perspectives on the Development of LNG Market Hubs in the Asia Pacific Region 57
be the spread between the bids and ask prices: a narrow spread indicates a more liquid market than one with wider spreads.
Churn rate or churn ratio is an indicator of market liquidity and refers to the number of times a package of gas is traded before final physical delivery in the hub and includes both physical re-trades and financial derivative trades. More detail provided in Appendix C.
Free on board or FOB means that the buyer takes delivery of goods being shipped to it by seller once the goods leave the seller's shipping dock; buyer pays shipping and all other costs associated with transporting the cargo.
Delivered ex ship (DES) means that the buyer takes delivery at the destination port for the cargo, i.e., the buyers shipping dock.
CIF (cost, insurance, and freight) is the same as DES when seller has arranged for the carriage of goods by sea to a port of destination and paid all associated transportation costs.

November 2016
U.S. Energy Information Administration | Perspectives on the Development of LNG Market Hubs in the Asia Pacific Region 58
Appendix C. Churn Rate Analysis The terms “churn rate” or “churn ratio” refer to a measure of market liquidity calculated as the volume of trades (measured in units of a commodity rather than number of contracts) in a time period divided by the units of that commodity finally delivered or consumed in the market during that same time period. Depending on who is making the calculations and what data are available, trades going into the calculation may include monthly, daily, and intra-day spot; forward market; futures market; swaps; and option trades—wherein all products (that is, any contract type and any future delivery date) with publicly available volume statistics are typically counted. For example, the U.K. Office of Gas and Electricity Markets (OFGEM)113 calculates the churn ratio for the U.K. gas market as:
Intercontinental Exchange (ICE) traded futures + OTC contract trades + ICE Endex On-the-day commodity market day-ahead and within-day trades
natural gas consumption in the country
The average of 12 monthly churn ratios computed by OFGEM came to an annual average churn ratio of 22 for the year 2015. This is roughly 58,245 Bcf of trades versus 2,648 Bcf of annual consumption in U.K.
According to a source cited by OFGEM,114 a churn ratio of 10 or more is indicative of a “mature market.” However, comparison of churn ratios among markets is made difficult by the fact that readily available trade data that goes into the calculations may not include all relevant trades (e.g., OFGEM excludes both spot trades not going through ICE Endex and non-brokered bilateral deals, both for which data are presumably not readily available). Comparisons of churn ratios among markets are also problematic because the geographic area used to aggregate market deliveries/consumption data may not exactly correspond to the trade data if such trade data excludes trades related to commodity imports into that geographic area or includes trades related to exports. Also it is possible that hedging for physical trades in geographic market X may take place in forward and futures markets in nearby geographic market Y because there might be no liquid forward and future markets within X itself.
In estimating the churn rate for the U.S. FERC Form 522, data were used to estimate the percentage of trades that are reported verses those that are not reported. The table below presents that analysis.
113 OFGEM, “Wholesale Power Market Liquidity: Annual Report 2016,” (accessed September 3, 2016), https://www.ofgem.gov.uk/publications-and-updates/wholesale-power-market-liquidity-annual-report-2016. 114 OFGEM, “Continental European Gas Hubs: Are they fit for purpose?” (accessed September 3, 2016), https://www.oxfordenergy.org/wpcms/wp-content/uploads/2012/06/NG-63.pdf.

November 2016
U.S. Energy Information Administration | Perspectives on the Development of LNG Market Hubs in the Asia Pacific Region 59
Table C-1. Physical gas trades reported for 2015 to FERC and PREs
Contract Type Quadrillion Btu per Year Bcf/d Percent
Fixed Price, Next Day [r] 1.86 4.9 3.00%
Fixed Price, Monthly [r] 7.37 19.6 11.90%
Indexed, Next Day 20.06 53.4 32.40%
Indexed, Monthly 28.3 75.3 45.70%
Physical Basis [r] 3.71 9.9 6.00%
Price Trigger 0.62 1.6 1.00%
Sum of Physical Trades 61.92 164.7 100%
"Reportable" to PREs -- [r] above 12.94 34.4 20.90%
Reported to PREs 6.38 17 10.30%
Fraction of "reportable" actually reported to PREs 49.3%
Source: FERC Form 552: Annual Report of Natural Gas Transactions, 2015.

November 2016
U.S. Energy Information Administration | Perspectives on the Development of LNG Market Hubs in the Asia Pacific Region 60
Appendix D. Gas Price Formation in Japan and China
D.1 Japan Customs-Cleared Crude (JCC) formula
PLNG = a * JCC + B
PLNG is the CIF price in Japan a is the slope of the curve or discount rate JCC is the basket of crude prices published by the government B is a constant value
In this formula, the “slope” typically has been less than the 0.172 to 0.167 (the crude equivalent price for 5.8 MMBtu per barrel or 6 MMBtu per barrel, respectively) under long-term contracts. The slopes have occasionally been higher for short periods when new contracts were negotiated in years when limited new LNG supply exceeded new contract demand. Also, there have been modifications to the slope to create a floor and a ceiling price for LNG to protect the parties from market disruptions.
D.2 China Pricing Formula
The National Development and Reform Commission (NDRC) regulates prices at each step along the value chain to recover the costs of production through distribution. China has begun implementing a pricing reform that ties the price of incremental supplies of gas to the prices of alternative fuels—fuel oil and liquefied petroleum gas (LPG). The pricing formula below solves for the price of gas in Shanghai—all other prices are calculated off of this price.115
PCGPIN is the city gate price for the incremental natural gas in Shanghai K is a constant NDRC uses to discount the final price (85% at present) α and β are the energy share weights for fuel oil and LPG respectively within China’s energy supply PFO and PLPG are the average prices for imported fuel oil and LPG HNG, HFO, and HLPG are the heating value of natural gas, fuel oil and LPG R is the value-added tax (VAT) rate for natural gas116
115 Sergey Paltsev and Danwei Zhang, Natural Gas Pricing Reform in China: Getting Closer to a Market System? MIT Joint Program on the Science and Policy of Global Climate Change, July 2015, pp. 9-10. This paper offers an in-depth description and evaluation of the effects of the policy. 116 Ibid, p. 10.