Embed Size (px)
Citation preview
Perspectives on Impacts of the 2002 U.S. Farm Act
Paul C. WestcottAgricultural Economist
U.S. Department of AgricultureEconomic Research Service
April 2003

Presentation Overview
• Overview of 3-piece commodity program
• USDA & FAPRI impacts
• Potential additional marketing loans effects
• Counter-cyclical payments
• Direct payments
• Other effects
3-Piece Commodity Program
3-Piece Commodity Program
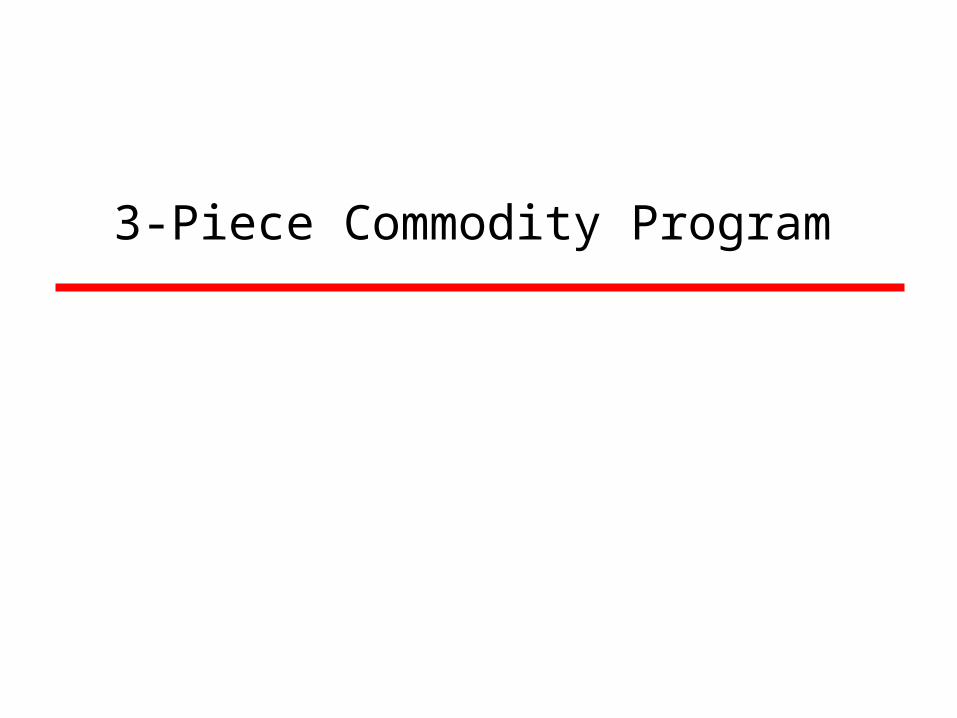
• Marketing loan program– Most loan rates raised, except soybeans, rice– Loan rates fixed– Additional commodities added
• New counter-cyclical payments– Price dependent payments
• Direct payments– Replace Production Flexibility Contract payments– Soybeans, minor oilseeds, peanuts added
3-Piece Commodity Program
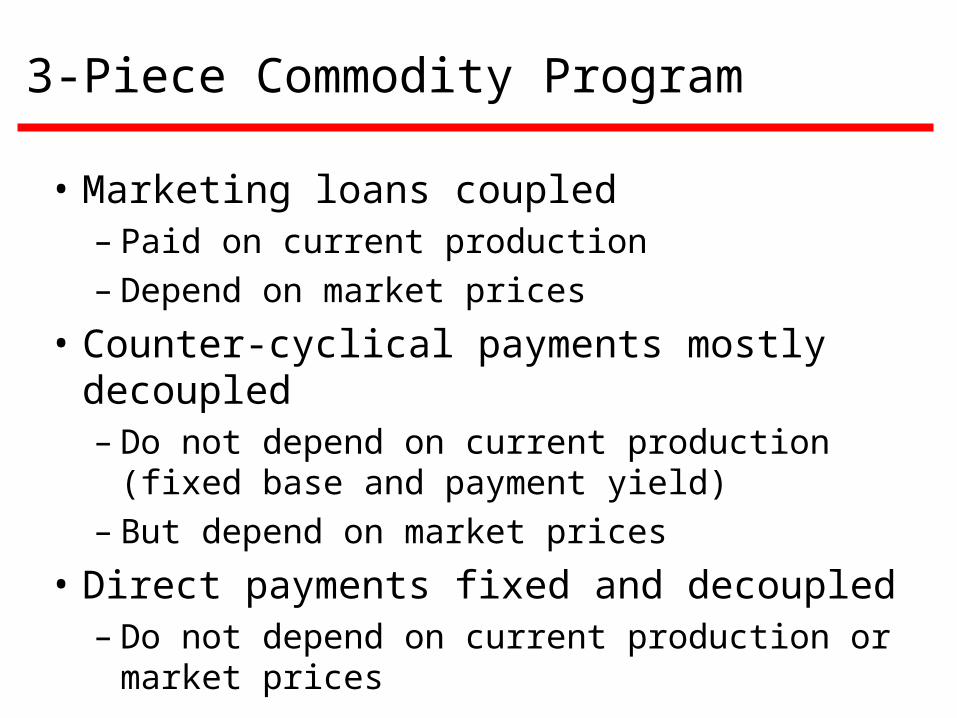
• Marketing loans coupled– Paid on current production– Depend on market prices
• Counter-cyclical payments mostly decoupled– Do not depend on current production (fixed base and
payment yield)– But depend on market prices
• Direct payments fixed and decoupled– Do not depend on current production or market
prices
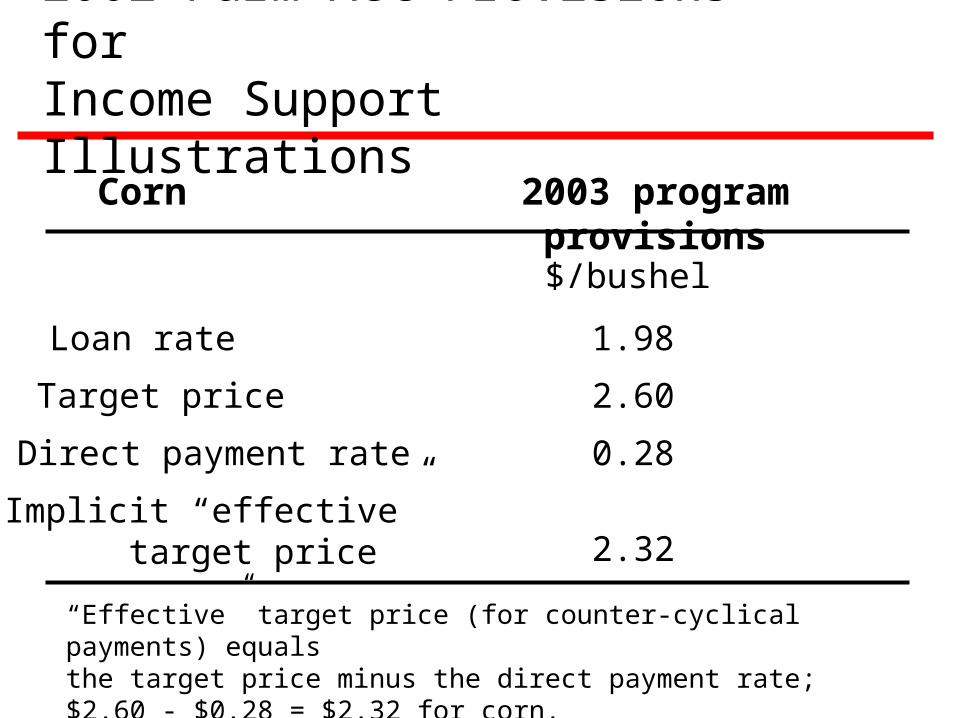
2003 program provisions
Direct payment rate 0.28
$/bushel
Target price 2.60
Loan rate 1.98
Implicit “effective” target price 2.32
Corn
2002 Farm Act Provisions for Income Support Illustrations
“Effective” target price (for counter-cyclical payments) equals the target price minus the direct payment rate; $2.60 - $0.28 = $2.32 for corn.

$0
$5,000
$10,000
1.50 1.75 2.00 2.25 2.50 2.75
Decoupled payments
Direct payments
Assumes 100 acres of corn base, 103 bushels/acre direct payment yield, and 120 bushels/acre counter-cyclical payment yield.
Counter-cyclical
Market price
Loan rate ($1.98)
Target price minusdirect payment rate
($2.60 minus $0.28 = $2.32)
Counter-cyclical and direct payments for corn under the 2002 Farm Act
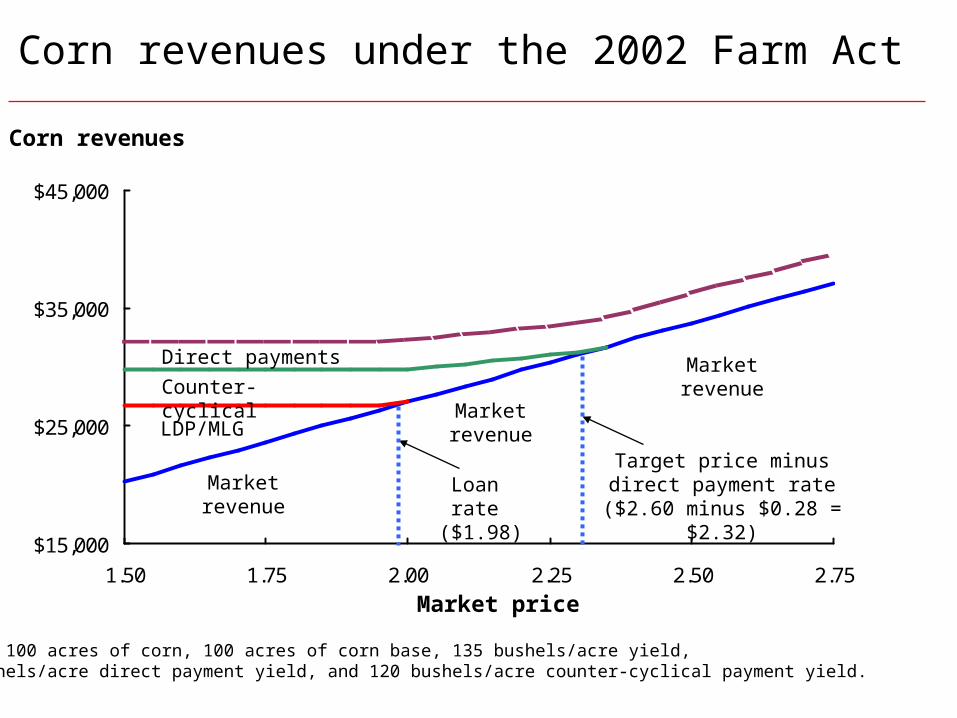
$15,000
$25,000
$35,000
$45,000
1.50 1.75 2.00 2.25 2.50 2.75
Direct payments
Marketrevenue
LDP/MLG
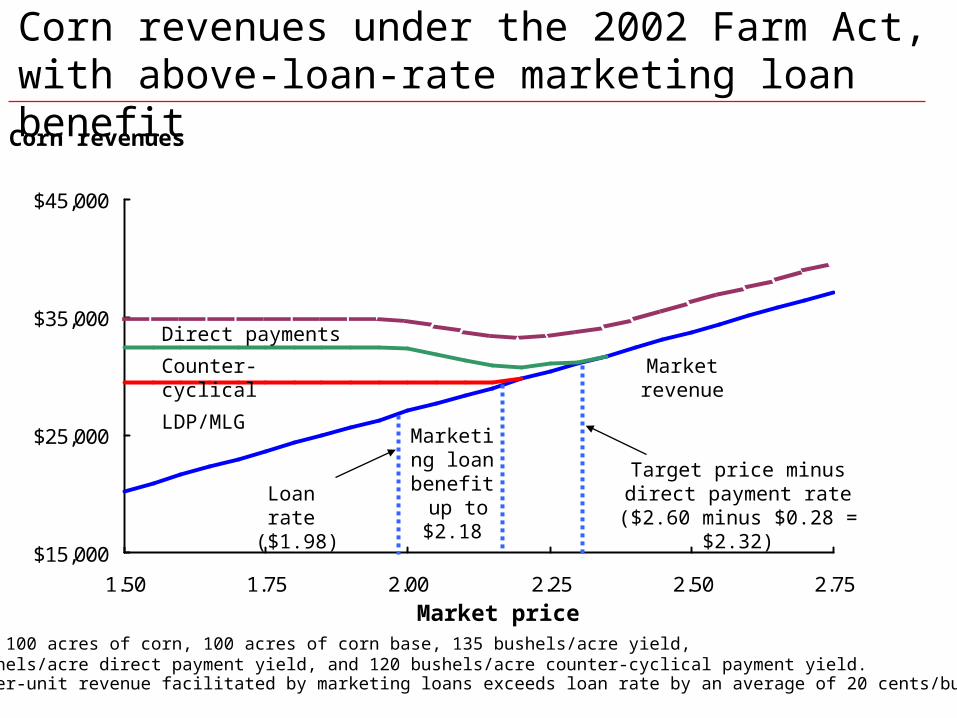
Corn revenues under the 2002 Farm Act
Counter-cyclical
Market price
Loan rate ($1.98)
Target price minusdirect payment rate
($2.60 minus $0.28 = $2.32)
Corn revenues
Marketrevenue
Marketrevenue
Assumes 100 acres of corn, 100 acres of corn base, 135 bushels/acre yield, 103 bushels/acre direct payment yield, and 120 bushels/acre counter-cyclical payment yield.
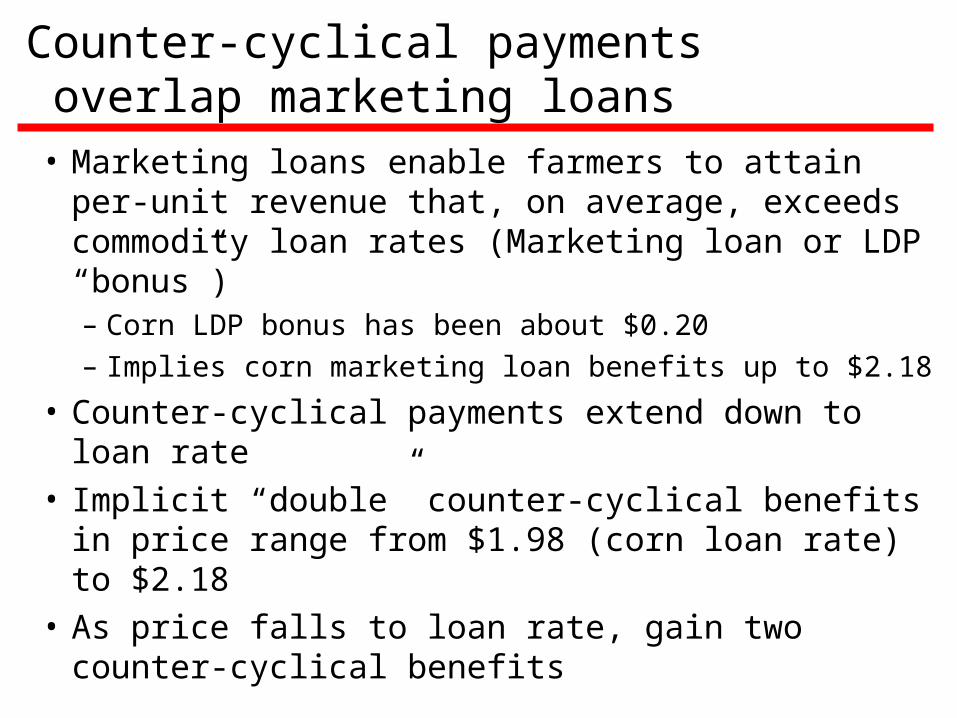
Counter-cyclical payments overlap marketing loans
• Marketing loans enable farmers to attain per-unit revenue that, on average, exceeds commodity loan rates (Marketing loan or LDP “bonus”)– Corn LDP bonus has been about $0.20
– Implies corn marketing loan benefits up to $2.18
• Counter-cyclical payments extend down to loan rate
• Implicit “double” counter-cyclical benefits in price range from $1.98 (corn loan rate) to $2.18
• As price falls to loan rate, gain two counter-cyclical benefits
$15,000
$25,000
$35,000
$45,000
1.50 1.75 2.00 2.25 2.50 2.75
Direct payments
Marketrevenue
LDP/MLG
Counter-cyclical
Market price
Loan rate ($1.98)
Target price minusdirect payment rate
($2.60 minus $0.28 = $2.32)
Corn revenues under the 2002 Farm Act, with above-loan-rate marketing loan benefit
Assumes per-unit revenue facilitated by marketing loans exceeds loan rate by an average of 20 cents/bushel.
Marketing loan
benefit up to $2.18
Corn revenues
Assumes 100 acres of corn, 100 acres of corn base, 135 bushels/acre yield, 103 bushels/acre direct payment yield, and 120 bushels/acre counter-cyclical payment yield.
Market Impacts--Supply Response Effects
Market Impacts--Supply Response Analysis
• FAPRI & USDA analyses similar– Differences reflect baseline differences
• Focus on acreage effects– Main impacts through planting decisions– Other impacts reflect market adjustments to
production changes
• Analysis conducted in 2002, at the time that the 2002 Act became law– Before 2002 production shortfall & price runup
Acreage Impact Analysis--3 Main Causes
• Marketing loan impacts– Particularly in near term years– 2002 acreage impacts reduced by 50 percent
and no 2002 winter wheat impact, due to timing of enactment of law
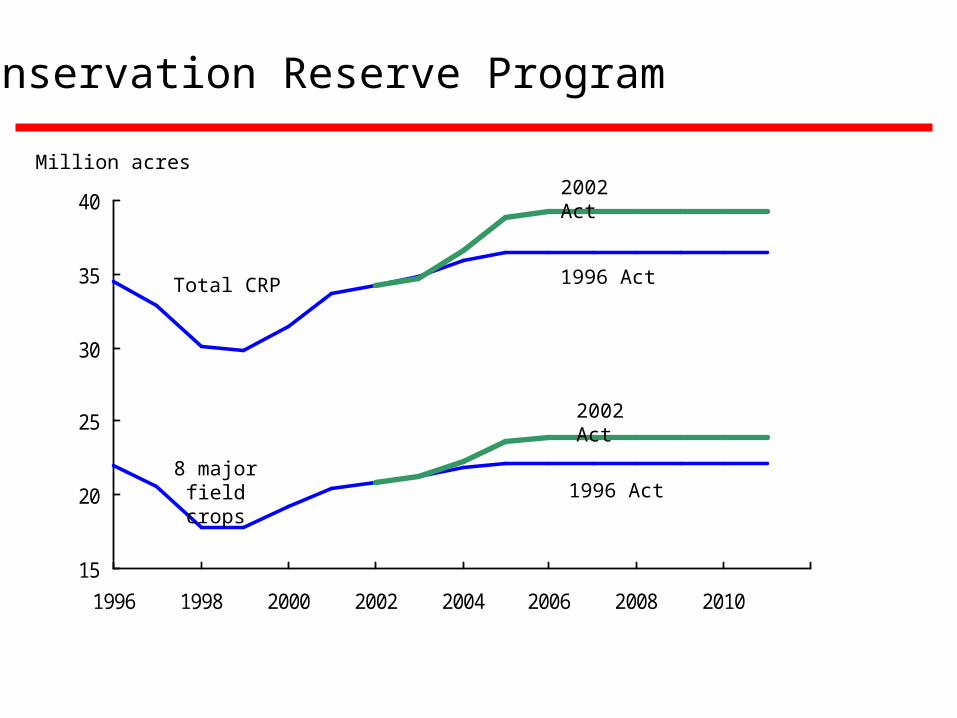
• Conservation Reserve Program increase
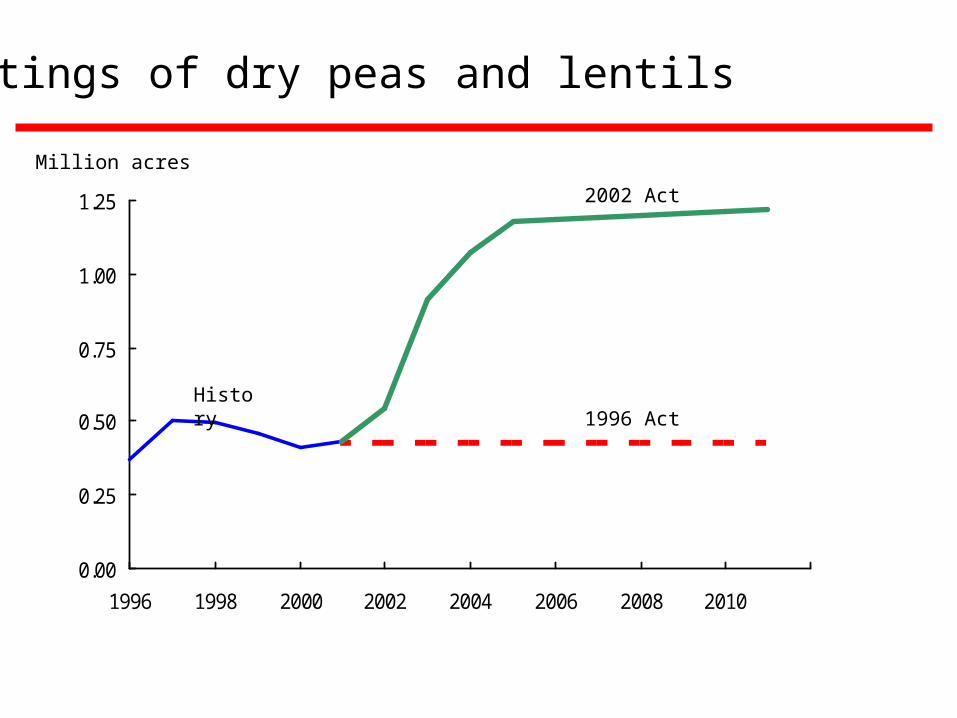
• Marketing loans for dry peas and lentils
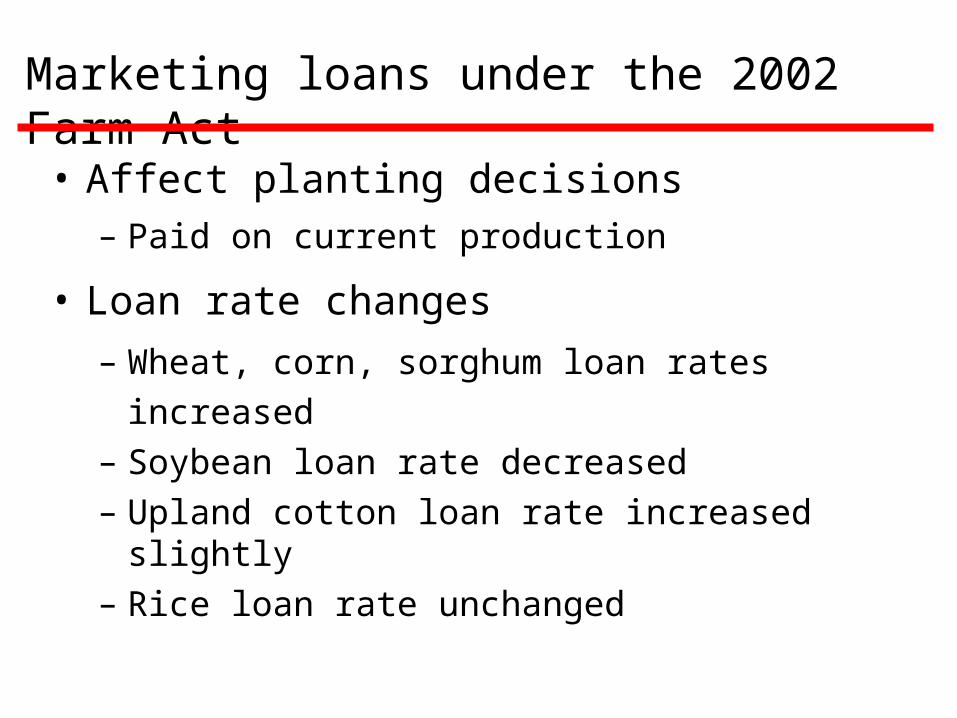
Marketing loans under the 2002 Farm Act
• Affect planting decisions– Paid on current production
• Loan rate changes
– Wheat, corn, sorghum loan rates increased
– Soybean loan rate decreased
– Upland cotton loan rate increased slightly
– Rice loan rate unchanged
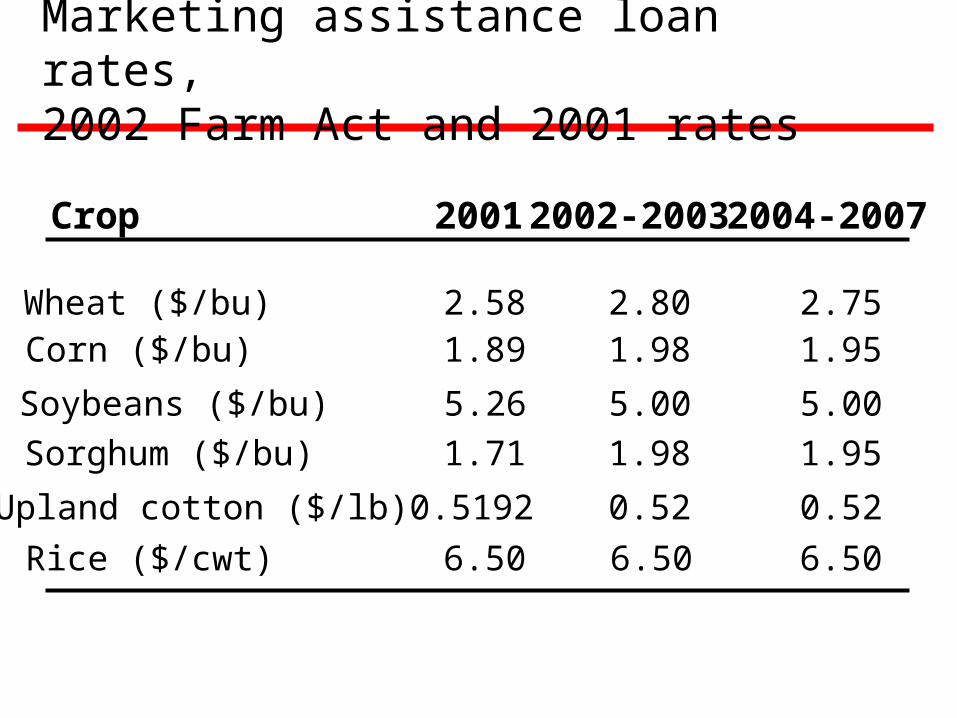
2001 2002-2003 2004-2007
Wheat ($/bu) 2.58 2.80 2.75Corn ($/bu) 1.89 1.98 1.95
Sorghum ($/bu) 1.71 1.98 1.95
Upland cotton ($/lb) 0.5192 0.52 0.52
Soybeans ($/bu) 5.26 5.00 5.00
Marketing assistance loan rates, 2002 Farm Act and 2001 rates
Crop
Rice ($/cwt) 6.50 6.50 6.50
15
20
25
30
35
40
1996 1998 2000 2002 2004 2006 2008 2010
Conservation Reserve Program
Million acres2002 Act
1996 Act
2002 Act
1996 Act8 major field
crops
Total CRP
0.00
0.25
0.50
0.75
1.00
1.25
1996 1998 2000 2002 2004 2006 2008 2010
Plantings of dry peas and lentils
Million acres
History
2002 Act
1996 Act
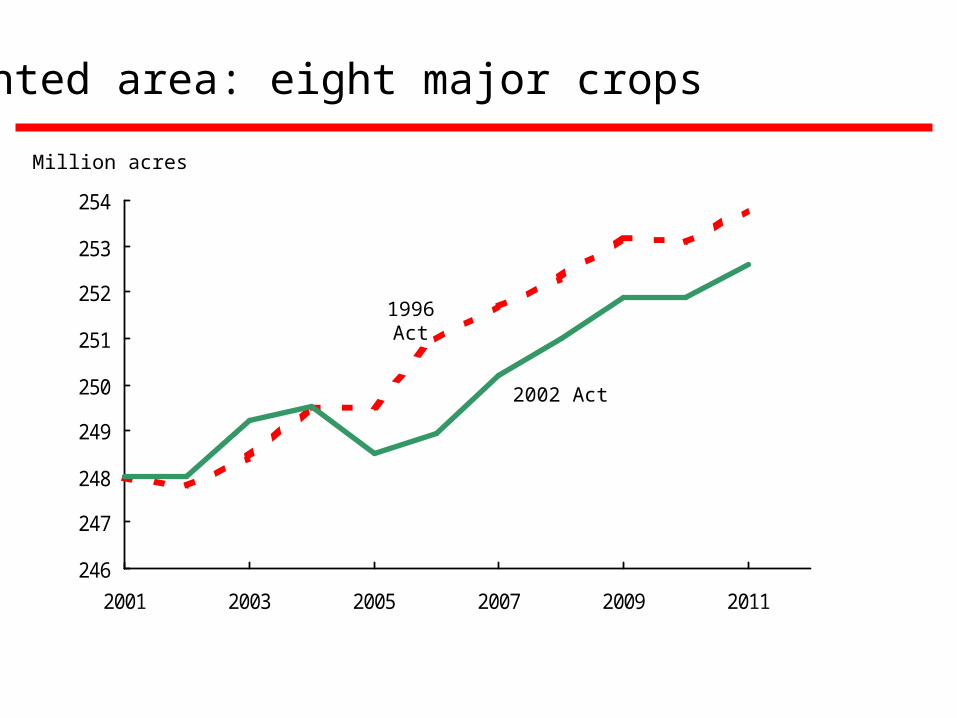
246
247
248
249
250
251
252
253
254
2001 2003 2005 2007 2009 2011
2002 Act
Planted area: eight major crops
Million acres
1996 Act

58
59
60
61
62
63
2001 2003 2005 2007 2009 2011
2002 Act
Million acres
Planted area: wheat
1996 Act
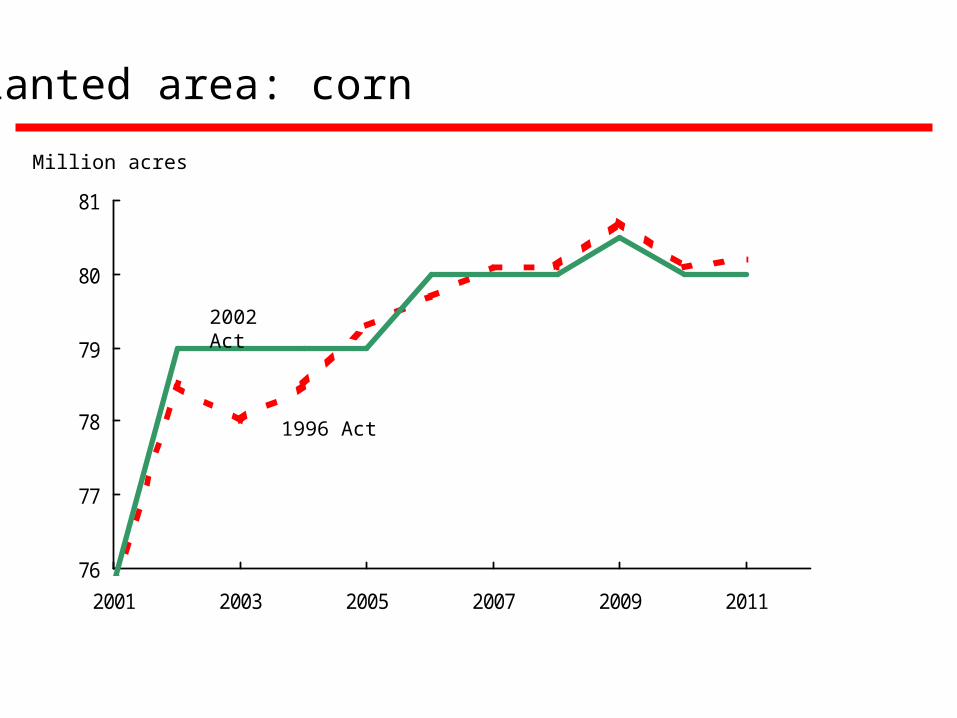
76
77
78
79
80
81
2001 2003 2005 2007 2009 2011
2002 Act
Million acres
Planted area: corn
1996 Act
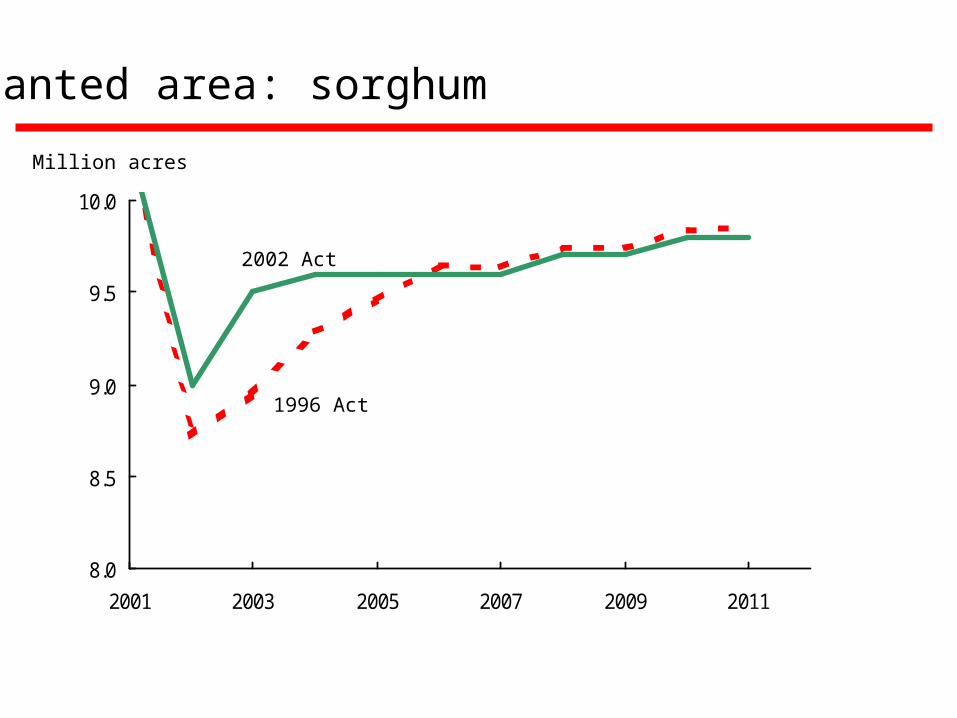
8.0
8.5
9.0
9.5
10.0
2001 2003 2005 2007 2009 2011
2002 Act
Million acres
Planted area: sorghum
1996 Act
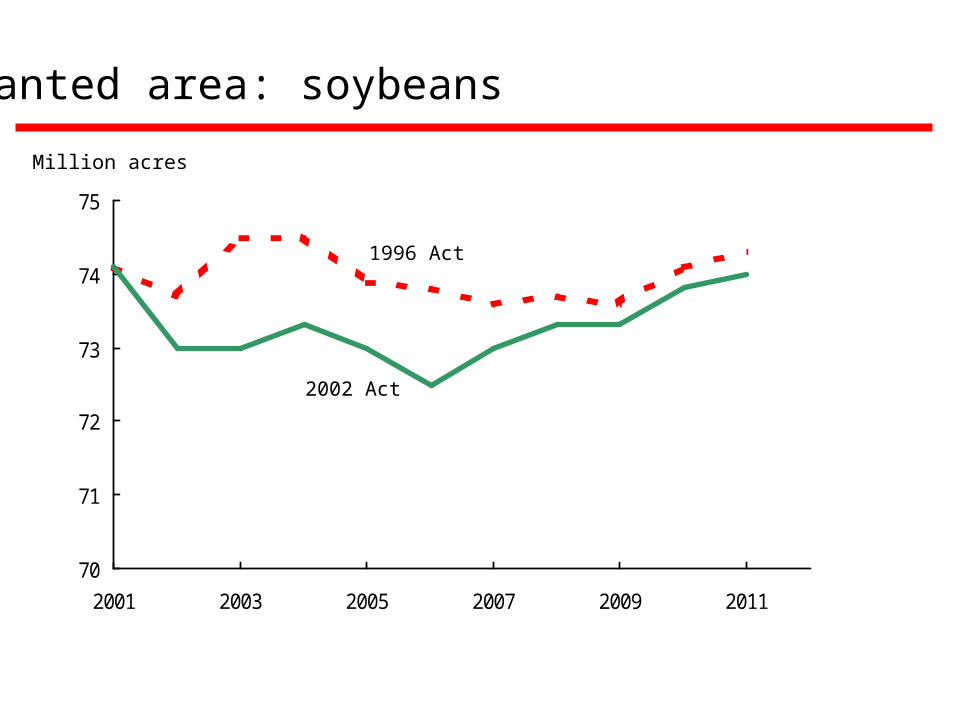
70
71
72
73
74
75
2001 2003 2005 2007 2009 2011
2002 Act
Million acres
Planted area: soybeans
1996 Act
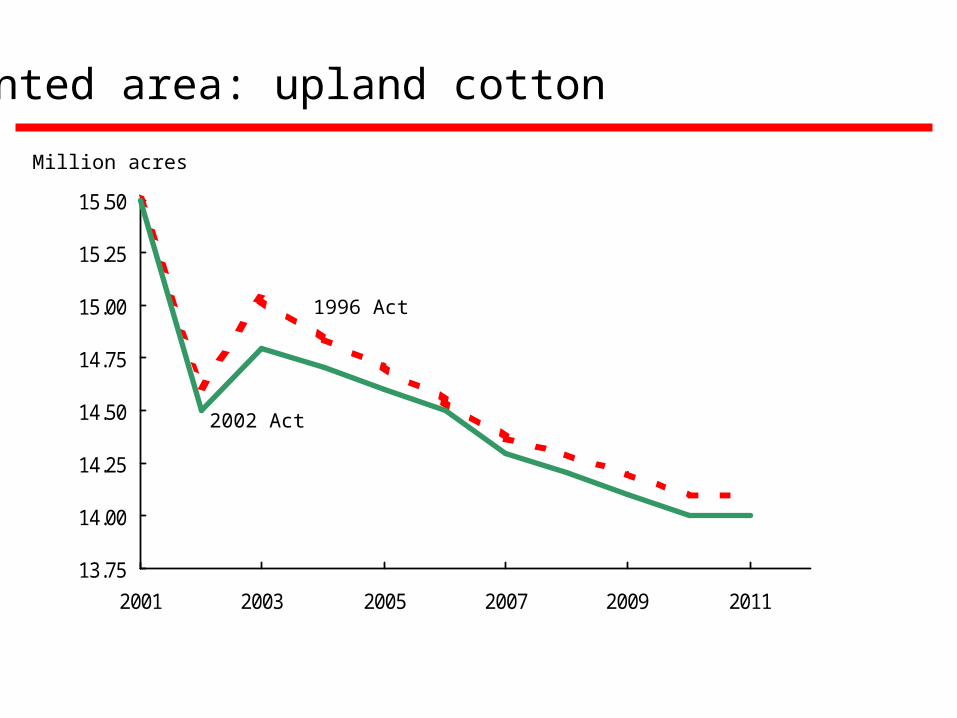
13.75
14.00
14.25
14.50
14.75
15.00
15.25
15.50
2001 2003 2005 2007 2009 2011
2002 Act
Million acres
Planted area: upland cotton
1996 Act
Potential Additional Marketing Loan Impacts
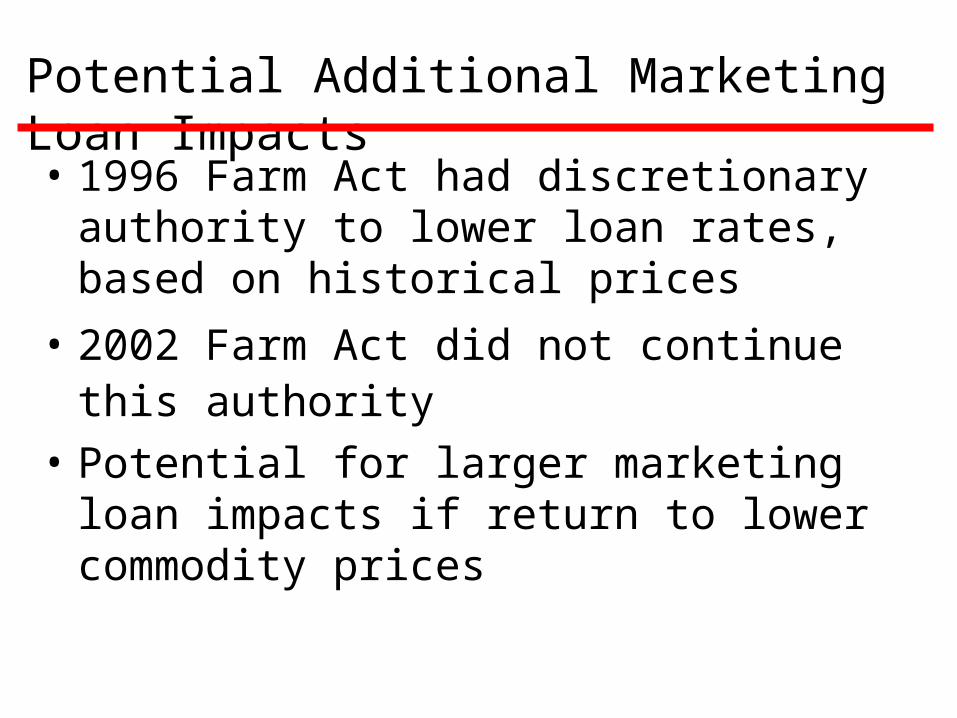
Potential Additional Marketing Loan Impacts
• 1996 Farm Act had discretionary authority to lower loan rates, based on historical prices
• 2002 Farm Act did not continue this authority
• Potential for larger marketing loan impacts if return to lower commodity prices
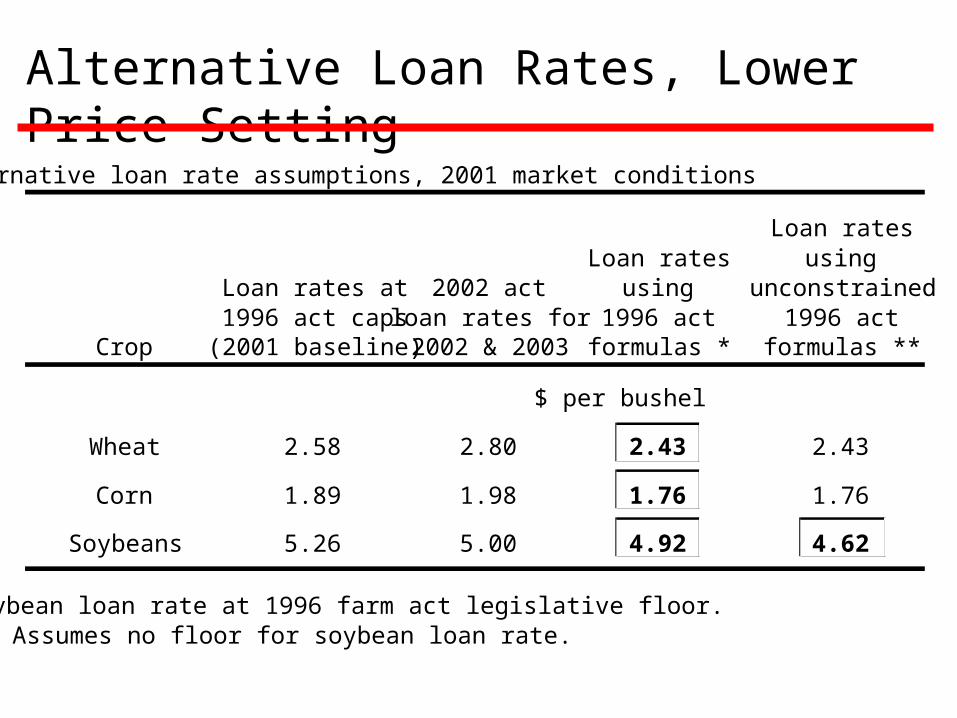
Alternative loan rate assumptions, 2001 market conditions
Loan ratesLoan rates using
Loan rates at 2002 act using unconstrained1996 act caps loan rates for 1996 act 1996 act
Crop (2001 baseline) 2002 & 2003 formulas * formulas **
$ per bushel
Wheat 2.58 2.80 2.43 2.43
Corn 1.89 1.98 1.76 1.76
Soybeans 5.26 5.00 4.92 4.62
* Soybean loan rate at 1996 farm act legislative floor.** Assumes no floor for soybean loan rate.
Alternative Loan Rates, Lower Price Setting
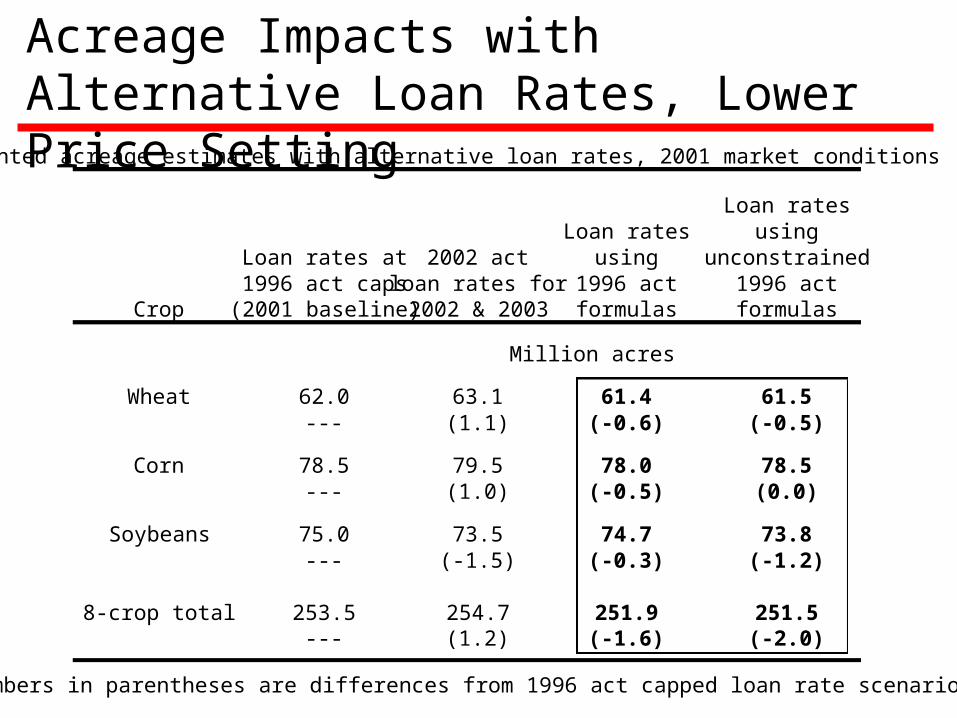
Acreage Impacts with Alternative Loan Rates, Lower Price Setting
Planted acreage estimates with alternative loan rates, 2001 market conditions
Loan ratesLoan rates using
Loan rates at 2002 act using unconstrained1996 act caps loan rates for 1996 act 1996 act
Crop (2001 baseline) 2002 & 2003 formulas formulas
Million acres
Wheat 62.0 63.1 61.4 61.5--- (1.1) (-0.6) (-0.5)
Corn 78.5 79.5 78.0 78.5--- (1.0) (-0.5) (0.0)
Soybeans 75.0 73.5 74.7 73.8--- (-1.5) (-0.3) (-1.2)
8-crop total 253.5 254.7 251.9 251.5--- (1.2) (-1.6) (-2.0)
Numbers in parentheses are differences from 1996 act capped loan rate scenario.
• If return to a low price setting, fixing loan rates when market-price-based, formula loan rates would be lower holds land in production
• Keeps long-run market price signals from being transmitted to producers
• Land resources shifted and economic efficiency reduced
Alternative Loan Rate Scenarios--Implications
Counter-cyclical Payment Effects
Counter-cyclical Payment Effects
• Paid on pre-determined quantity--decoupled from actual production
• Linked to market prices in range from loan rate to “effective target price”
• Affects revenue risk
• May encourage production of program crop for which producer has acreage base, if risk averse
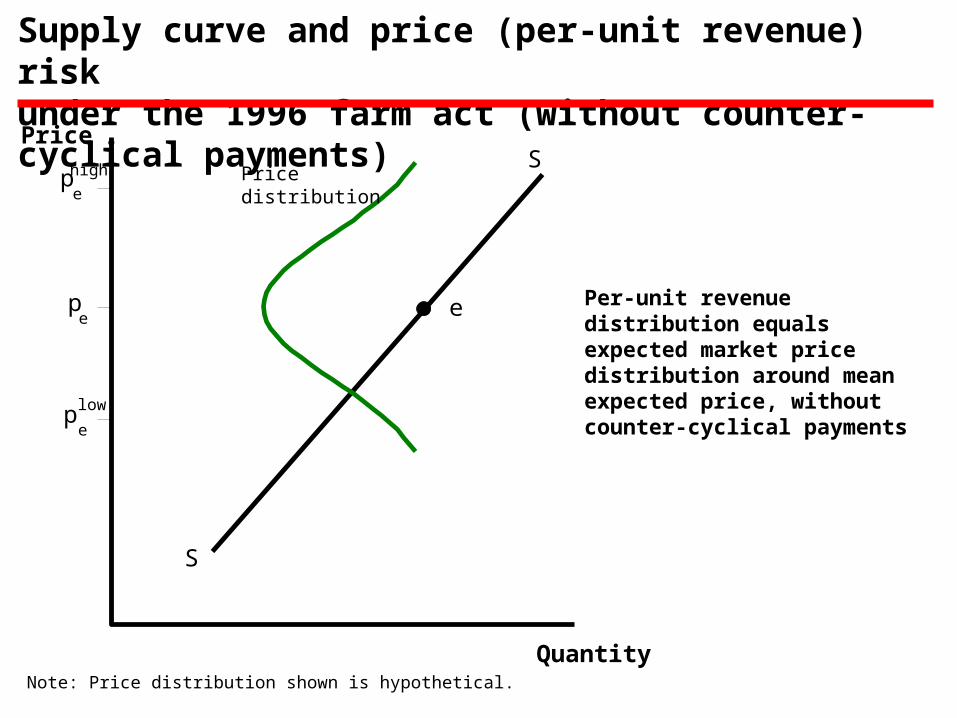
Supply curve and price (per-unit revenue) riskunder the 1996 farm act (without counter-cyclical payments)
Per-unit revenue distribution equals expected market price distribution around mean expected price, without counter-cyclical payments
S
S
ep
Price
Quantity
e
Price distribution
Note: Price distribution shown is hypothetical.
pe
high
pe
low
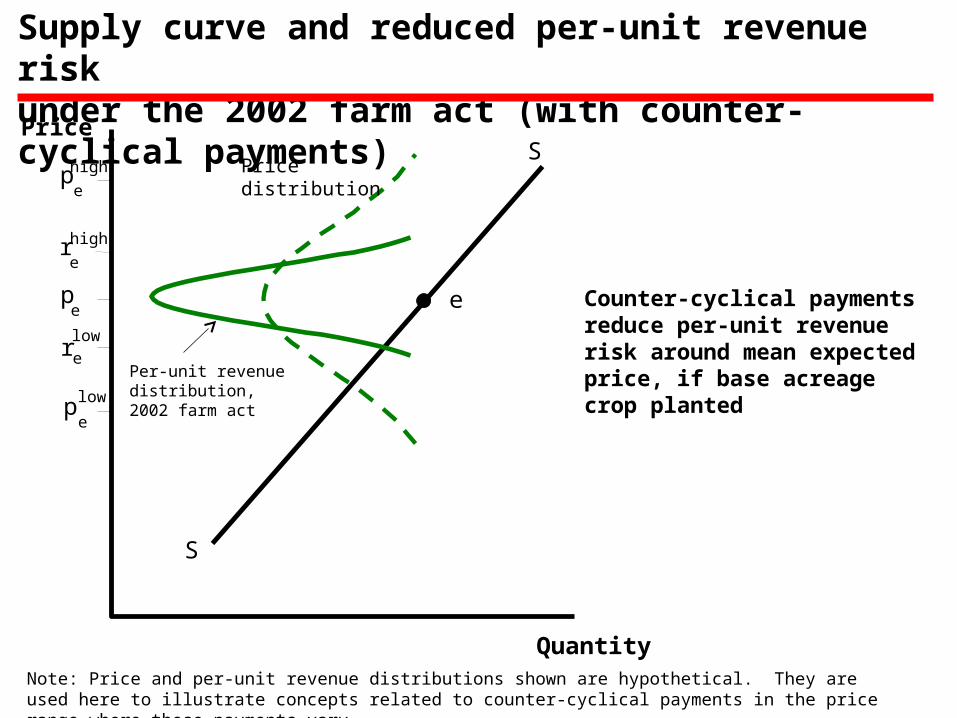
Supply curve and reduced per-unit revenue risk under the 2002 farm act (with counter-cyclical payments)
Counter-cyclical payments reduce per-unit revenue risk around mean expected price, if base acreage crop planted
S
S
ep
Price
Quantity
e
Per-unit revenue distribution, 2002 farm act
Price distribution
Note: Price and per-unit revenue distributions shown are hypothetical. They are used here to illustrate concepts related to counter-cyclical payments in the price range where these payments vary.
pe
high
re
high
re
low
pe
low
Direct Payments
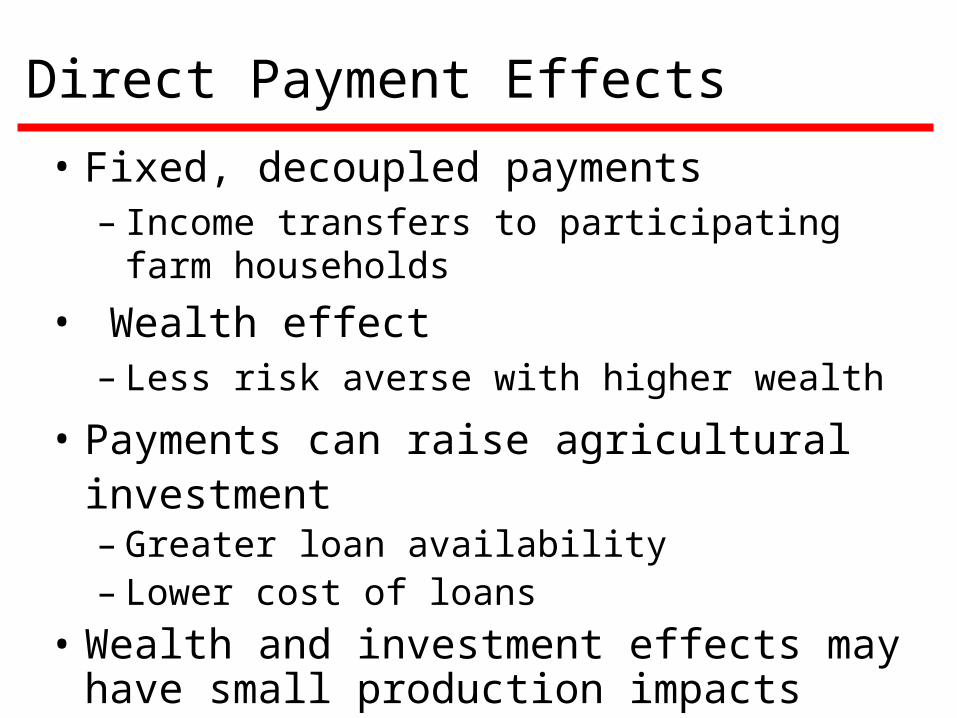
Direct Payment Effects
• Fixed, decoupled payments– Income transfers to participating farm households
• Wealth effect– Less risk averse with higher wealth
• Payments can raise agricultural investment – Greater loan availability– Lower cost of loans
• Wealth and investment effects may have small production impacts
Other Effects
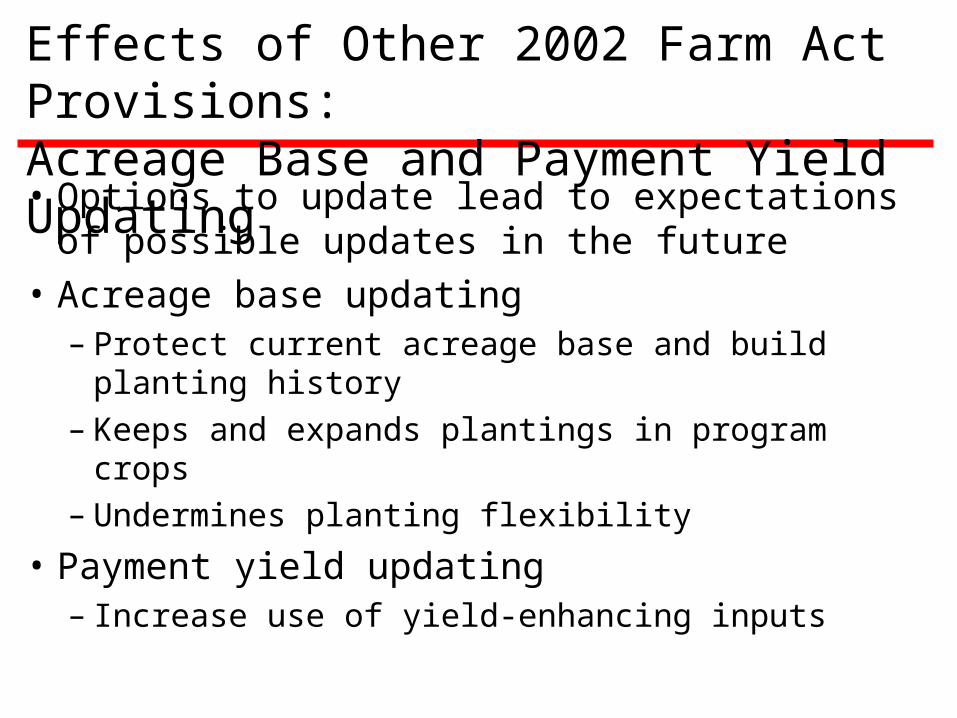
• Options to update lead to expectations of possible updates in the future
• Acreage base updating– Protect current acreage base and build planting history– Keeps and expands plantings in program crops– Undermines planting flexibility
• Payment yield updating– Increase use of yield-enhancing inputs
Effects of Other 2002 Farm Act Provisions:Acreage Base and Payment Yield Updating
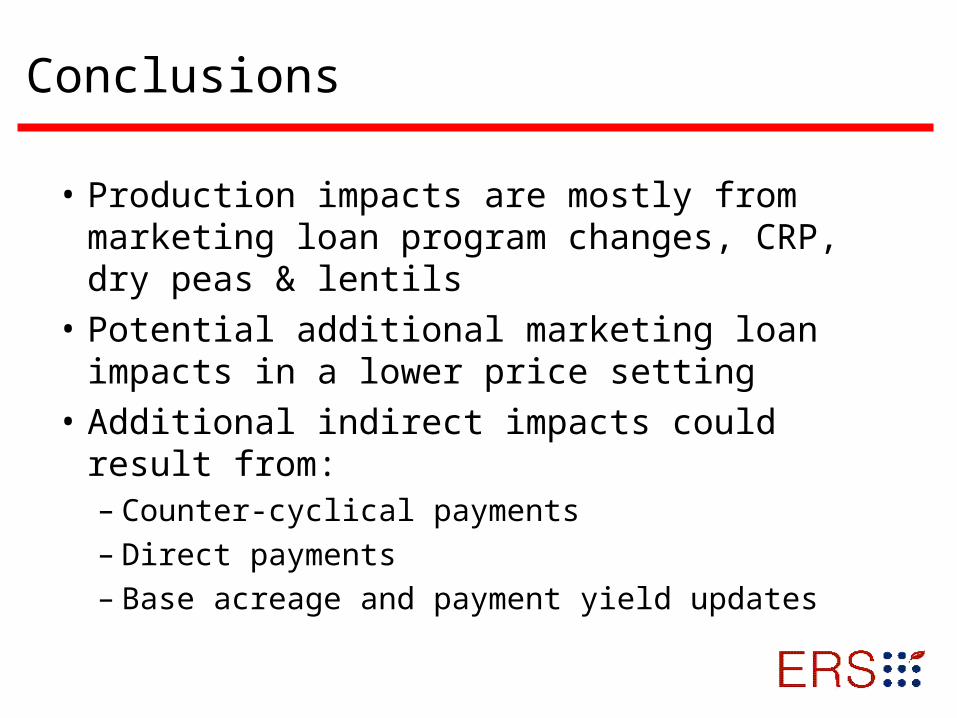
Conclusions
• Production impacts are mostly from marketing loan program changes, CRP, dry peas & lentils
• Potential additional marketing loan impacts in a lower price setting
• Additional indirect impacts could result from:– Counter-cyclical payments– Direct payments– Base acreage and payment yield updates
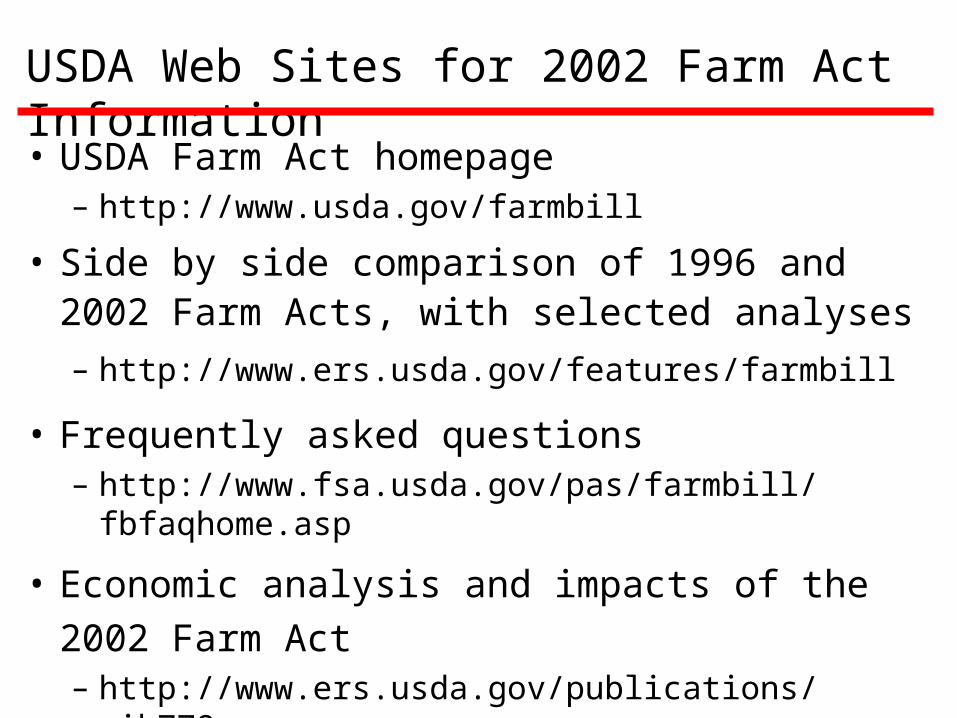
USDA Web Sites for 2002 Farm Act Information
• USDA Farm Act homepage– http://www.usda.gov/farmbill
• Side by side comparison of 1996 and 2002 Farm Acts, with selected analyses
– http://www.ers.usda.gov/features/farmbill
• Frequently asked questions– http://www.fsa.usda.gov/pas/farmbill/fbfaqhome.asp
• Economic analysis and impacts of the 2002 Farm Act– http://www.ers.usda.gov/publications/aib778


![Sepher Yetzirah [Westcott]](https://img.pdfslide.us/doc/110x75/577cdec11a28ab9e78afc207/sepher-yetzirah-westcott.jpg)