Embed Size (px)
Citation preview

© Institute for Clinical and Economic Review, 2019
Perspectives on cost-effectiveness thresholds in the United States
Moderated by: • Dr. Steven Pearson, President• Dr. Rick Chapman, Director of Health Economics
2© Institute for Clinical and Economic Review, 2019
Christopher McCabe, BA, MSc, PhD
CEO and Executive Director
Institute of Health Economics (IHE)
Webinar 2: Willingness to pay as a basis for a cost-effectiveness threshold in the United States
Main Presentation:
Dr. Christopher McCabe
July 24, 2019
ICER Webinar Series
Using per capita GDP and/or
individual surveys to determine a
specific threshold range in the US
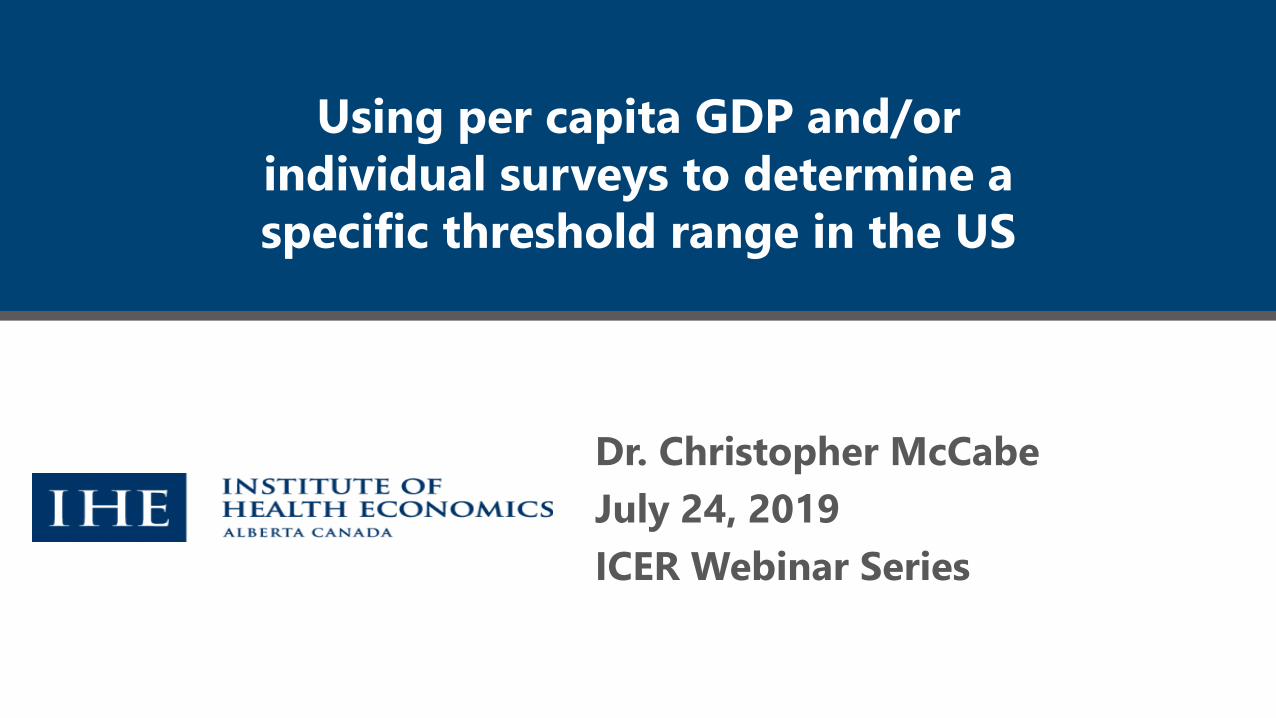
Demand (v) and Supply Side (k) Thresholds
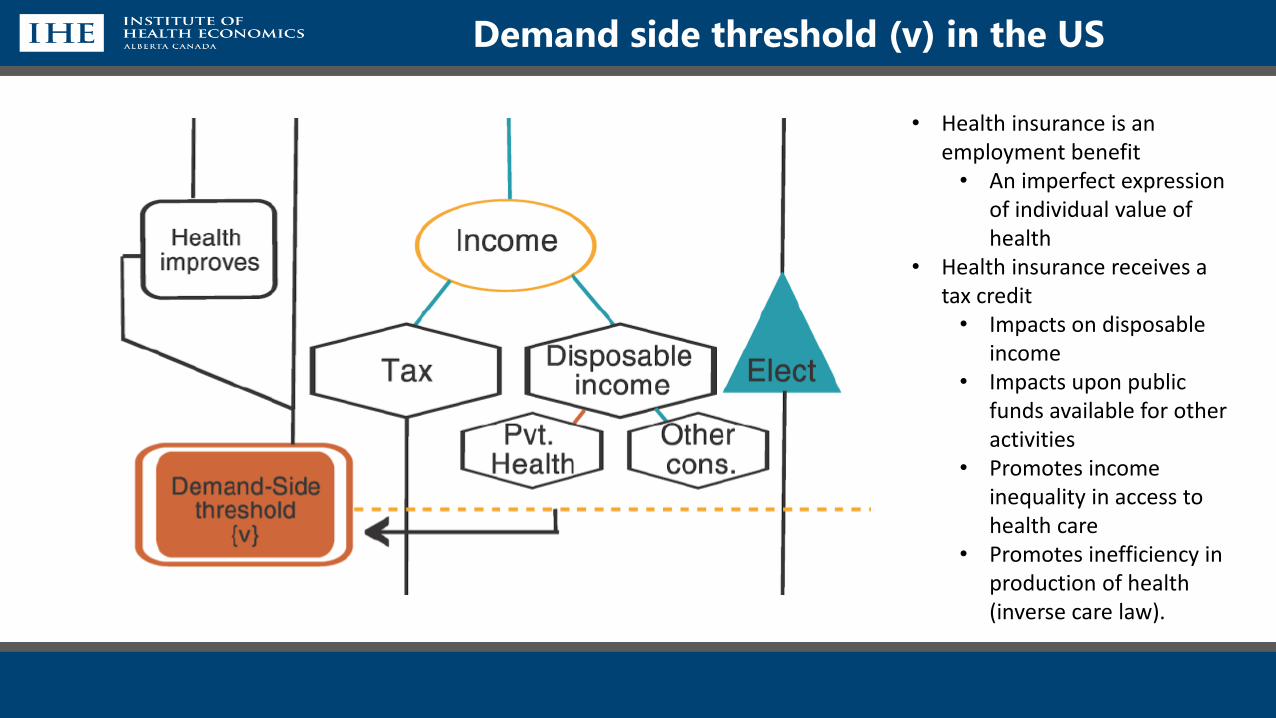
Demand side threshold (v) in the US
• Health insurance is an employment benefit• An imperfect expression
of individual value of health
• Health insurance receives a tax credit• Impacts on disposable
income• Impacts upon public
funds available for other activities
• Promotes income inequality in access to health care
• Promotes inefficiency in production of health (inverse care law).
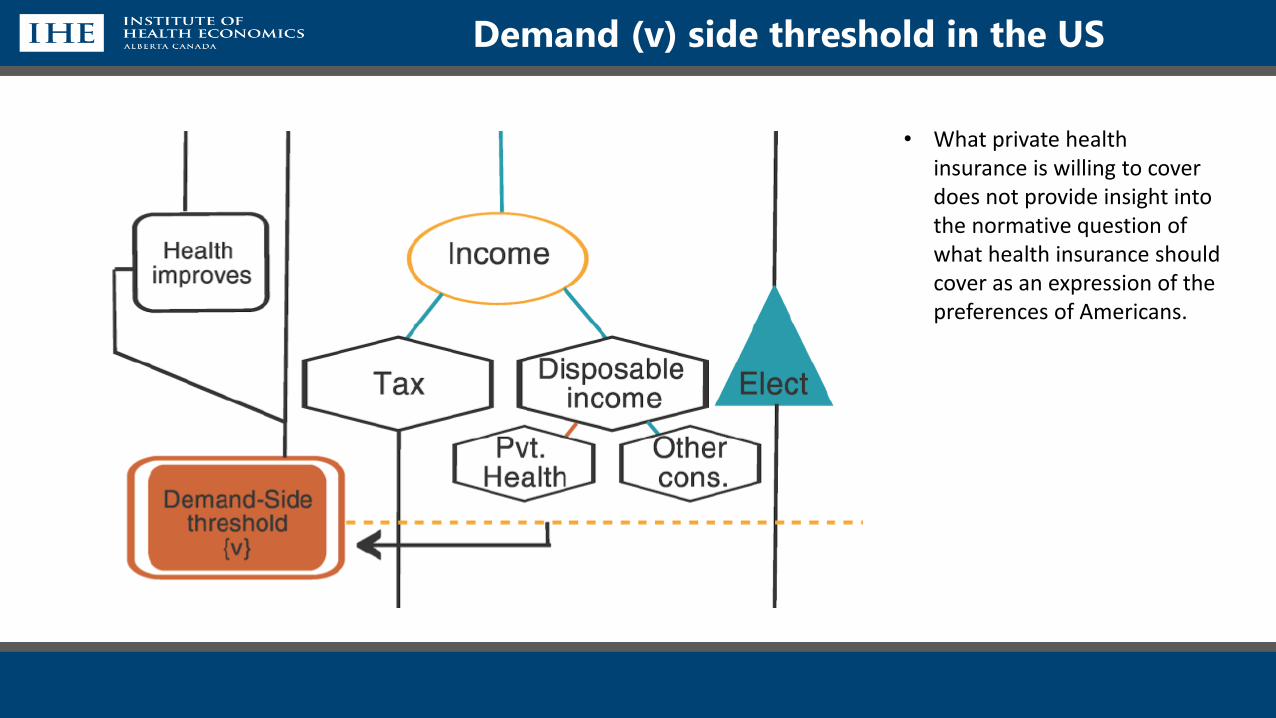
Demand (v) side threshold in the US
• What private health insurance is willing to cover does not provide insight into the normative question of what health insurance should cover as an expression of the preferences of Americans.
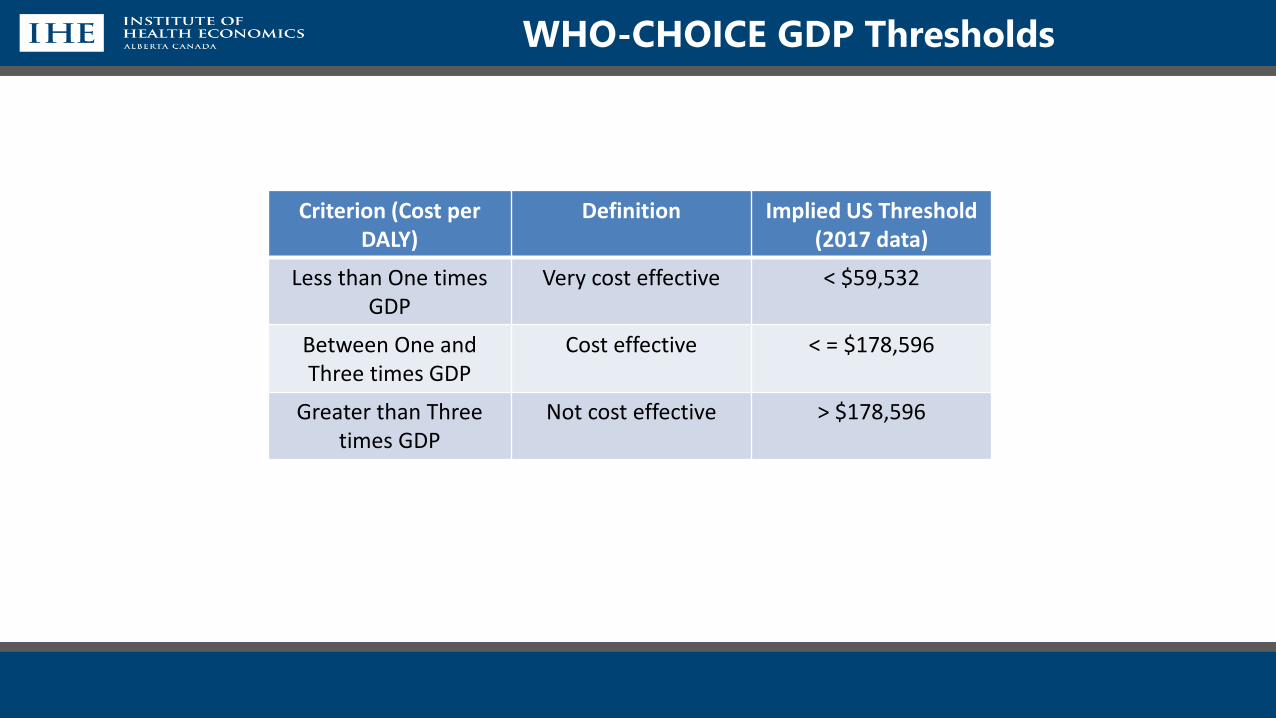
WHO-CHOICE GDP Thresholds
Criterion (Cost per DALY)
Definition Implied US Threshold (2017 data)
Less than One times GDP
Very cost effective < $59,532
Between One and Three times GDP
Cost effective < = $178,596
Greater than Three times GDP
Not cost effective > $178,596
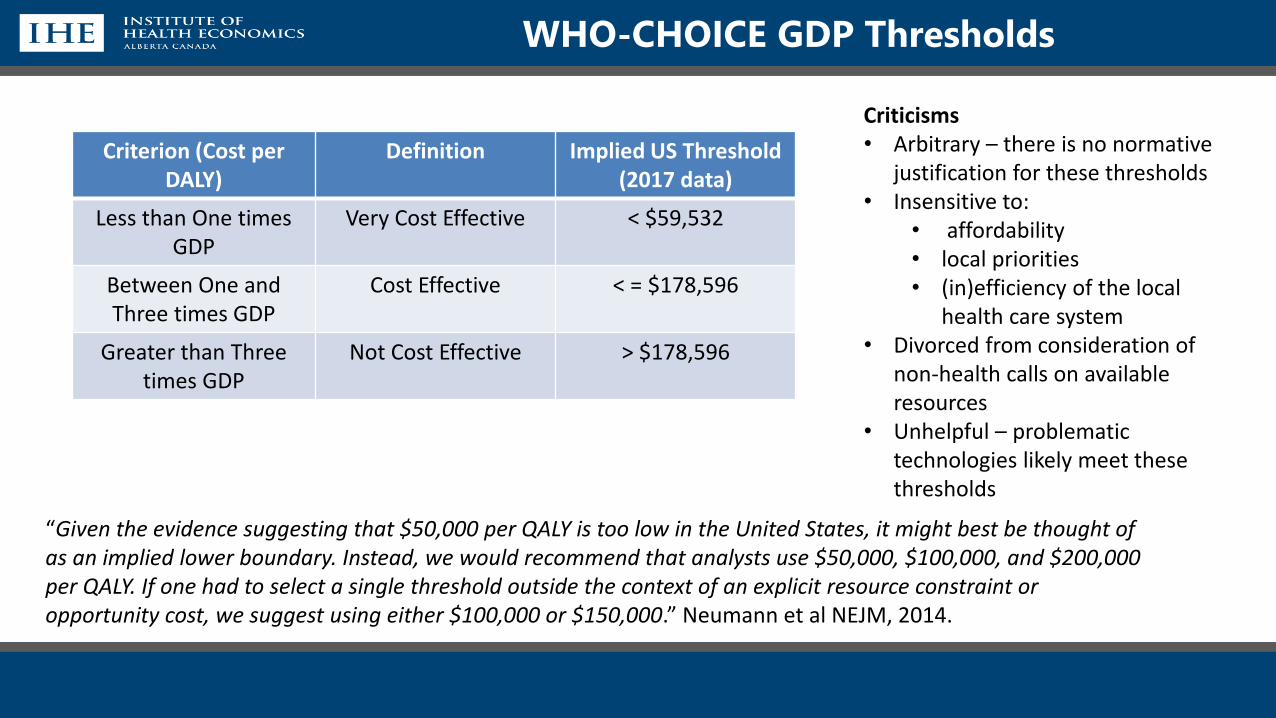
WHO-CHOICE GDP Thresholds
WHO-CHOICE GDP Thresholds
Criterion (Cost per DALY)
Definition Implied US Threshold (2017 data)
Less than One times GDP
Very Cost Effective < $59,532
Between One and Three times GDP
Cost Effective < = $178,596
Greater than Three times GDP
Not Cost Effective > $178,596
Criticisms• Arbitrary – there is no normative
justification for these thresholds• Insensitive to:
• affordability• local priorities• (in)efficiency of the local
health care system• Divorced from consideration of
non-health calls on available resources
• Unhelpful – problematic technologies likely meet these thresholds
“Given the evidence suggesting that $50,000 per QALY is too low in the United States, it might best be thought of as an implied lower boundary. Instead, we would recommend that analysts use $50,000, $100,000, and $200,000 per QALY. If one had to select a single threshold outside the context of an explicit resource constraint or opportunity cost, we suggest using either $100,000 or $150,000.” Neumann et al NEJM, 2014.
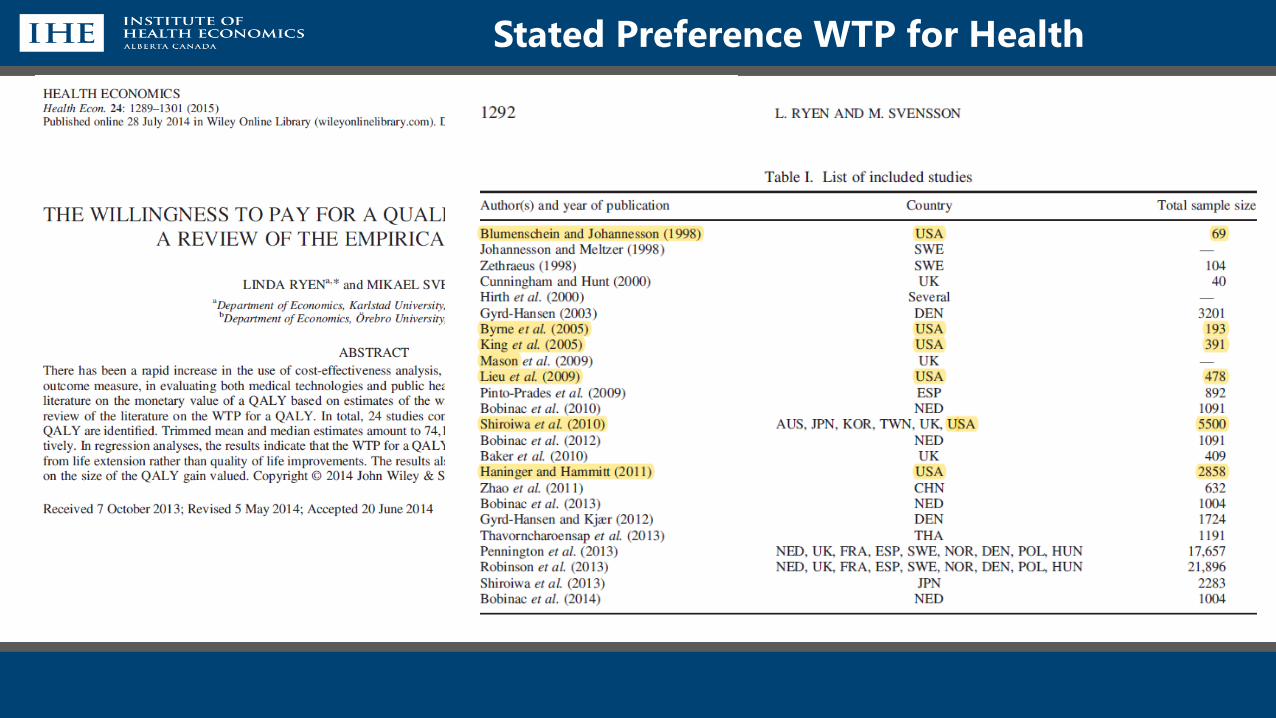
Stated Preference WTP for Health
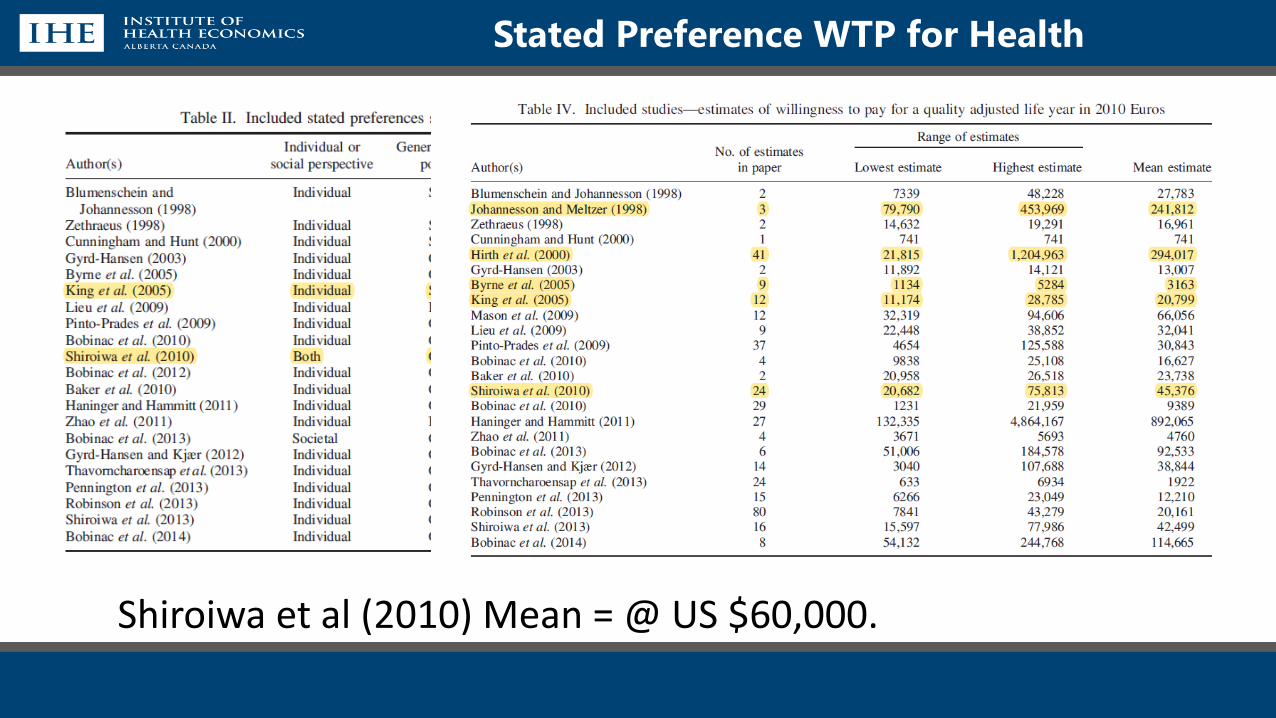
Stated Preference WTP for Health
Shiroiwa et al (2010) Mean = @ US $60,000.
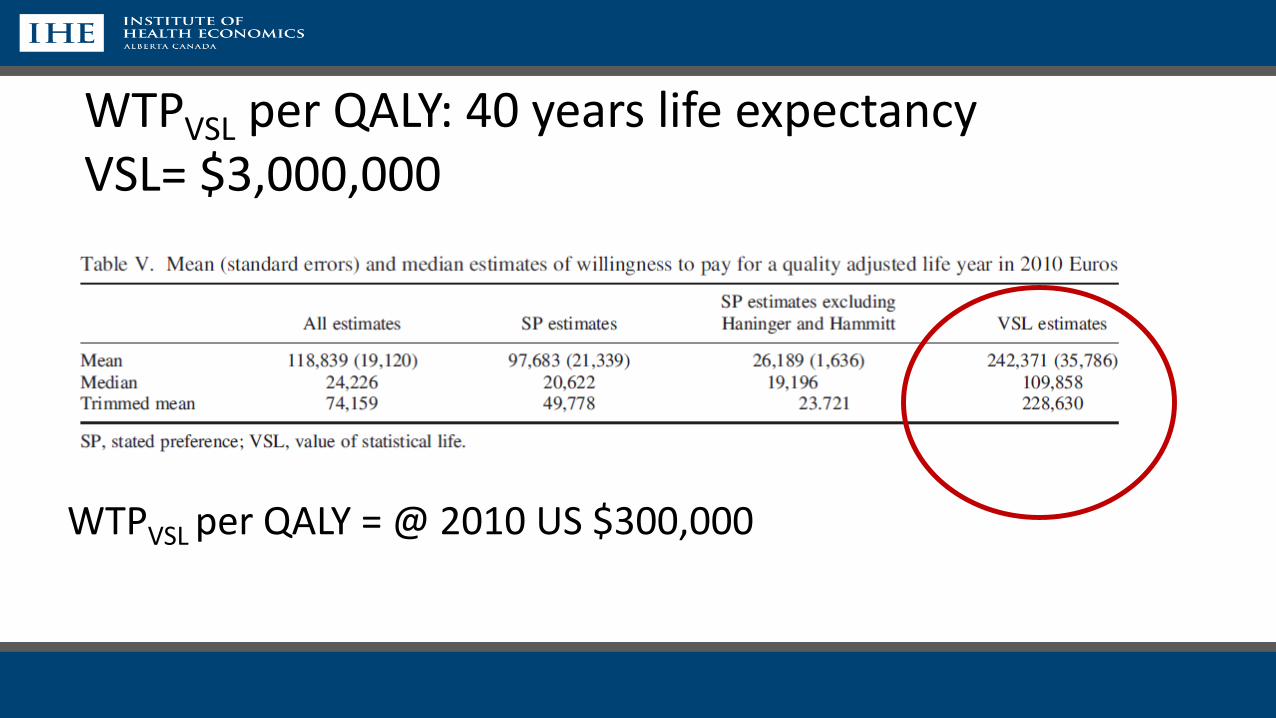
WTPVSL per QALY = @ 2010 US $300,000
WTPVSL per QALY: 40 years life expectancyVSL= $3,000,000
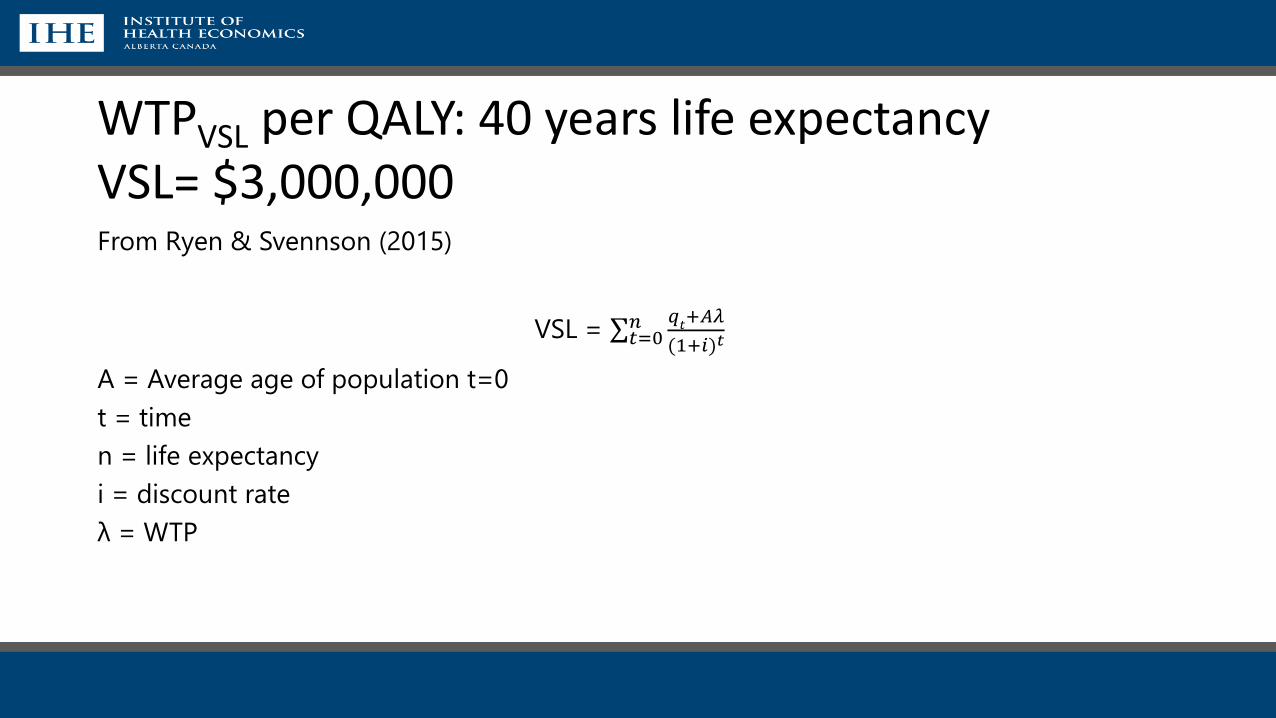
From Ryen & Svennson (2015)
VSL = σ𝑡=0𝑛 𝑞
𝑡+𝐴𝜆
(1+𝑖)𝑡
A = Average age of population t=0
t = time
n = life expectancy
i = discount rate
λ = WTP
WTPVSL per QALY: 40 years life expectancyVSL= $3,000,000
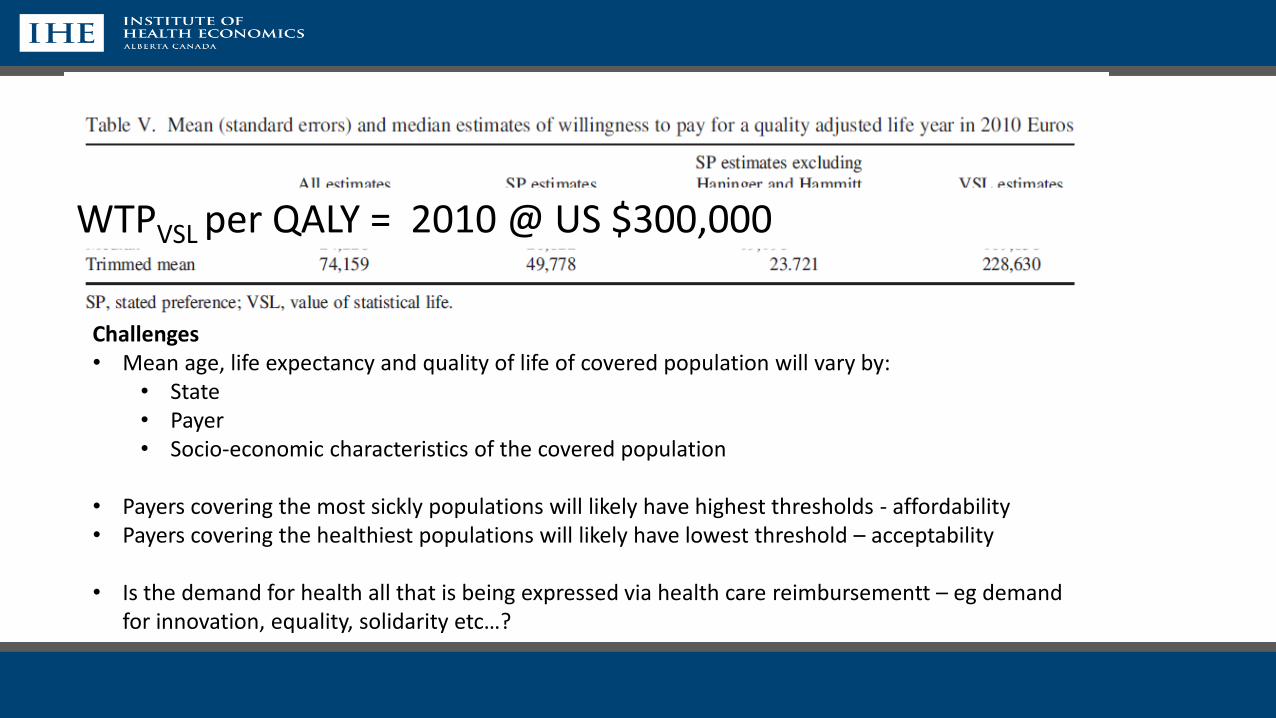
WTPVSL per QALY = 2010 @ US $300,000
Challenges• Mean age, life expectancy and quality of life of covered population will vary by:
• State• Payer• Socio-economic characteristics of the covered population
• Payers covering the most sickly populations will likely have highest thresholds - affordability• Payers covering the healthiest populations will likely have lowest threshold – acceptability
• Is the demand for health all that is being expressed via health care reimbursementt – eg demand for innovation, equality, solidarity etc…?
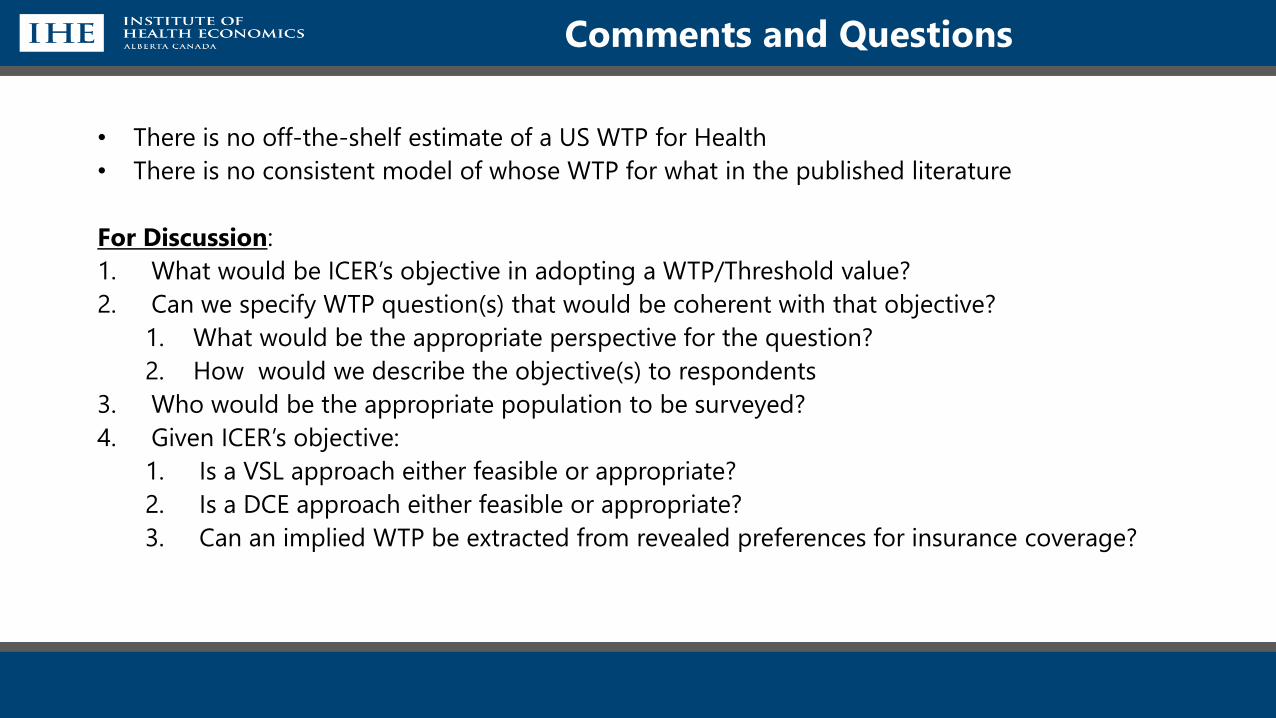
Comments and Questions
• There is no off-the-shelf estimate of a US WTP for Health
• There is no consistent model of whose WTP for what in the published literature
For Discussion:
1. What would be ICER’s objective in adopting a WTP/Threshold value?
2. Can we specify WTP question(s) that would be coherent with that objective?
1. What would be the appropriate perspective for the question?
2. How would we describe the objective(s) to respondents
3. Who would be the appropriate population to be surveyed?
4. Given ICER’s objective:
1. Is a VSL approach either feasible or appropriate?
2. Is a DCE approach either feasible or appropriate?
3. Can an implied WTP be extracted from revealed preferences for insurance coverage?

[email protected] 1.780.448.4881 www.ihe.ca

Responders: Jens Grueger, David Meltzer, Lou Garrison
Discussion
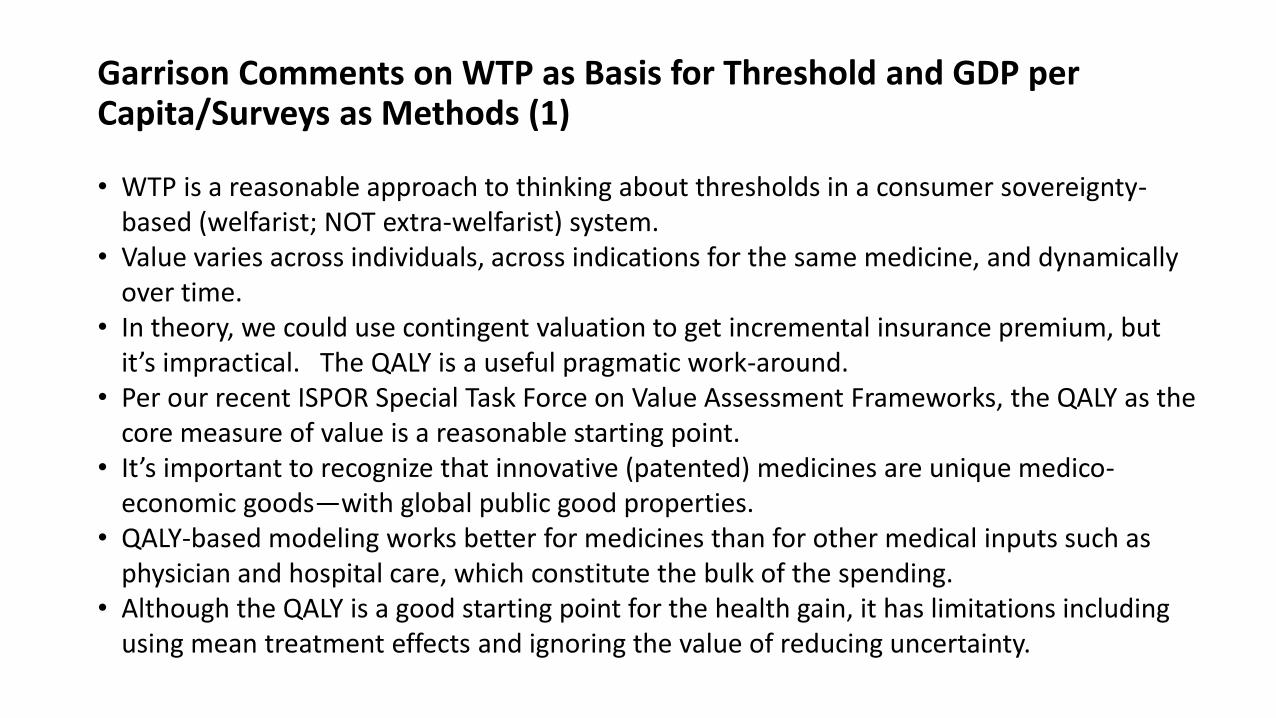
Garrison Comments on WTP as Basis for Threshold and GDP per Capita/Surveys as Methods (1)
• WTP is a reasonable approach to thinking about thresholds in a consumer sovereignty-based (welfarist; NOT extra-welfarist) system.
• Value varies across individuals, across indications for the same medicine, and dynamically over time.
• In theory, we could use contingent valuation to get incremental insurance premium, but it’s impractical. The QALY is a useful pragmatic work-around.
• Per our recent ISPOR Special Task Force on Value Assessment Frameworks, the QALY as the core measure of value is a reasonable starting point.
• It’s important to recognize that innovative (patented) medicines are unique medico-economic goods—with global public good properties.
• QALY-based modeling works better for medicines than for other medical inputs such as physician and hospital care, which constitute the bulk of the spending.
• Although the QALY is a good starting point for the health gain, it has limitations including using mean treatment effects and ignoring the value of reducing uncertainty.
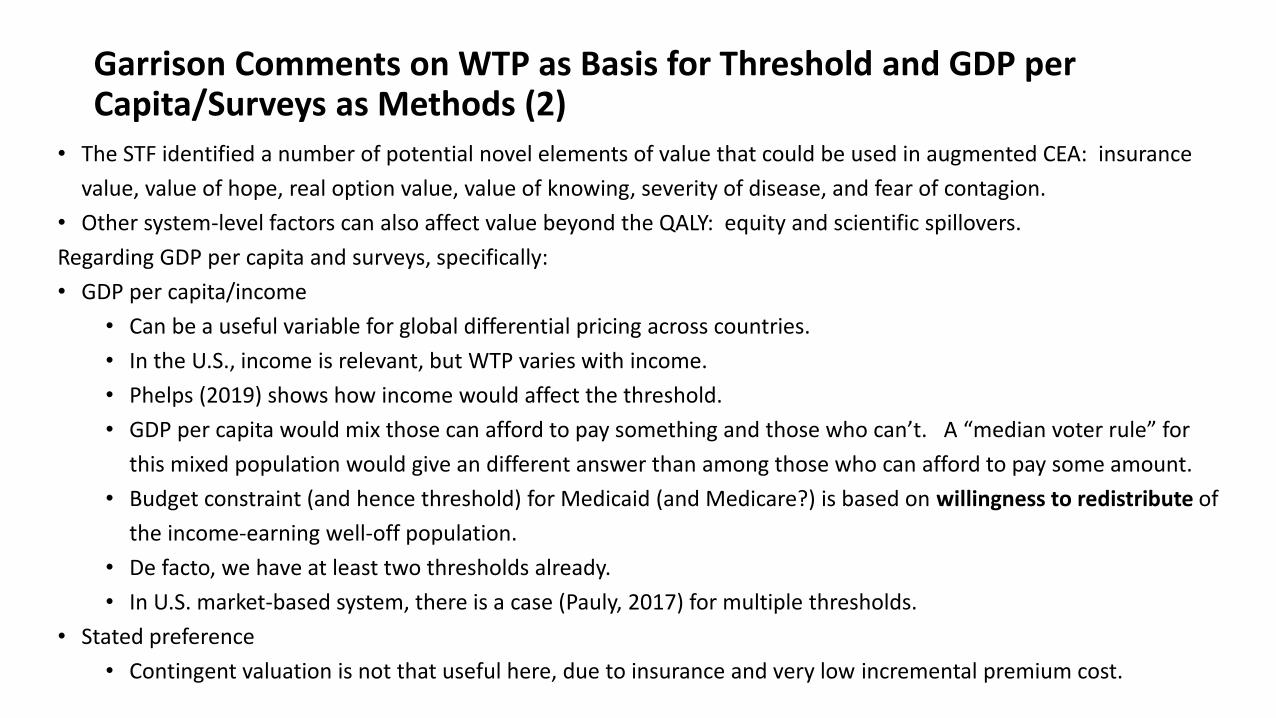
Garrison Comments on WTP as Basis for Threshold and GDP per Capita/Surveys as Methods (2)
• The STF identified a number of potential novel elements of value that could be used in augmented CEA: insurance
value, value of hope, real option value, value of knowing, severity of disease, and fear of contagion.
• Other system-level factors can also affect value beyond the QALY: equity and scientific spillovers.
Regarding GDP per capita and surveys, specifically:
• GDP per capita/income
• Can be a useful variable for global differential pricing across countries.
• In the U.S., income is relevant, but WTP varies with income.
• Phelps (2019) shows how income would affect the threshold.
• GDP per capita would mix those can afford to pay something and those who can’t. A “median voter rule” for
this mixed population would give an different answer than among those who can afford to pay some amount.
• Budget constraint (and hence threshold) for Medicaid (and Medicare?) is based on willingness to redistribute of
the income-earning well-off population.
• De facto, we have at least two thresholds already.
• In U.S. market-based system, there is a case (Pauly, 2017) for multiple thresholds.
• Stated preference
• Contingent valuation is not that useful here, due to insurance and very low incremental premium cost.
Next webinar:Fri, Jul 26, 2019 3:00 PM - 4:00 PM EDT
Webinar 3: Willingness to pay Part 2: Using past funding decisions, value of a statistical
life, and relative risk aversion as the basis for determining a cost-effectiveness threshold in
the US
Hosts: Steve Pearson and Rick Chapman
Lead Presentation: Sean Sullivan and Chuck Phelps (risk aversion)
Responders: Chris McCabe, Jason Wasfy