Embed Size (px)
Citation preview

Competent Person’s Report for Norio, West Rustavi and Satskhenisi Fields
Republic of Georgia
Date of this Report: January 1, 2018
Effective Date: January 1, 2018
Prepared for:
Block Energy, plc
And
SPARK Advisory Partners Limited
Prepared By:
Phone: 1-303-443-2209, Fax: 1-303-443-3156 E-mail: [email protected]

Competent Person’s Report for Norio, West Rustavi and Satskhenisi Fields
Republic of Georgia
Date of this Report: January 1, 2018
Effective Date: January 1, 2018
Prepared for:
Block Energy, plc
And
SPARK Advisory Partners Limited
Prepared By:
Letha C. Lencioni Registered Petroleum Engineer
State of Colorado #29506
Jan J. Tomanek
Certified Petroleum Geologist AAPG #6239
Phone: 1-303-443-2209, Fax: 1-303-443-3156 E-mail: [email protected]

1/1/2018 ver 051418 1 Gustavson Associates
1. EXECUTIVE SUMMARY
This report addresses the Norio, West Rustavi and Satskhenisi oil and gas assets owned by Block
Energy plc in the Republic of Georgia. These assets are summarized in Table 1-1.
Table 1-1 Summary of Assets owned by Block Energy plc
Asset Contractor Operator Working
Interest (%) Status
Expiry Date
License Area
(acres)1 Norio PSA
GOG Norioskhevi Ltd3
Norio Operating Company
100%2 3 wells producing 4/2026 5,570
Satskhenisi PSA
Satskhenisi Ltd/ GOG 3
Norio Operating Company
90% 3 wells producing 4/2026 6,024
West Rustavi PSA
GOG/GNV3 Norio Operating Company
Current 5% with option
to 75%4
2 wells with prior production, no
current production
3/2043 9,290
Oil and natural gas Reserves, Contingent Resources, and Prospective Resources have been
estimated for these assets, based on a probabilistic analysis. Reserves and future cash flows are
summarized for the total of all three blocks in Table 1-2. The summaries for the individual assets
are in Table 1-3 for the Norio Block, Table 1-4 for the West Rustavi Block and Table 1-5 for
Satskhenisi. Gross Unrisked Contingent Resources for the blocks are summarized in Table 1-6,
with Block Energy’s working interest share shown in Table 1-7. Gross Unrisked Prospective
Resources for the blocks are summarized in Table 1-8.5 Note that due to the nature of the
Production Sharing Agreement (PSA) with cost recovery based on expenses, it is not possible to
calculate net resources (after government share) due to the lack of a plan to develop the entire
accumulations.
1 Approximate 2 Block Energy currently holds 100% of the working interest in the Norio PSA, at the date of this report, having acquired 31% following the effective date of the report. 3 100% owned Georgian subsidiaries of Block Energy 4 Subject to completion of the the farm-in workplan in conjunction with the West Rustavi PSA. 5 Block’s working interest share is the same as the gross for the Prospective Resources.

1/1/2018 ver 051418 2 Gustavson Associates
Table 1-2 Reserves and Future Cash Flow Projections, Total
Oil Reserves, MBbl
Gross Net Net Cash Flow,
MM$
Net Present Value Discounted at 10%,
MM$
P90 P50 P10 P90 P50 P10 P90 P50 P10 P90 P50 P10 Reserve Classification (1P) (2P) (3P) (1P) (2P) (3P) (1P) (2P) (3P) (1P) (2P) (3P) Producing 32.5 37.0 41.6 19.1 24.0 30.8 0.18 0.27 0.39 0.16 0.23 0.31 Developed Non-Producing 543.9 1,009.2 1,786.6 277.8 436.0 709.0 7.4 16.2 31.7 4.8 11.3 22.5 Undeveloped 805.2 1,505.3 2,328.6 603.5 1,005.2 1,334.9 20.0 43.1 61.3 10.9 27.8 41.0 Total 1,381.6 2,551.5 4,156.8 900.4 1,465.2 2,074.8 27.5 59.5 93.4 15.9 39.3 63.8
(MBbl = thousand barrels of oil; MM$ = millions of US$)
Table 1-3 Reserves and Future Cash Flow Projections, Norio
Oil Reserves, MBbl
Gross Net Net Cash Flow,
MM$
Net Present Value Discounted at 10%,
MM$
Reserve Classification P90
(1P) P50 (2P)
P10
(3P) P90
(1P) P50
(2P) P10
(3P) P90
(1P) P50 (2P)
P10
(3P) P90
(1P) P50 (2P)
P10
(3P) Producing 28.1 32.7 37.2 16.7 21.7 28.5 0.2 0.2 0.4 0.1 0.2 0.3
Developed Non-Producing 65.8 93.0 167.5 61.6 80.9 133.5 1.0 2.3 5.7 0.6 1.5 3.8
Undeveloped 805.2 1,505.3 2,328.6 603.5 1,005.2 1,334.9 20.0 43.1 61.3 10.9 27.8 41.0
Total 899.2 1,630.9 2,533.3 681.8 1,107.8 1,496.9 21.2 45.6 67.4 11.6 29.5 45.1 For 100% Working Interest. Net is net of government share. (MBbl = thousand barrels of oil; MM$ = millions of US$)
1/1/2018 ver 051418 3 Gustavson Associates
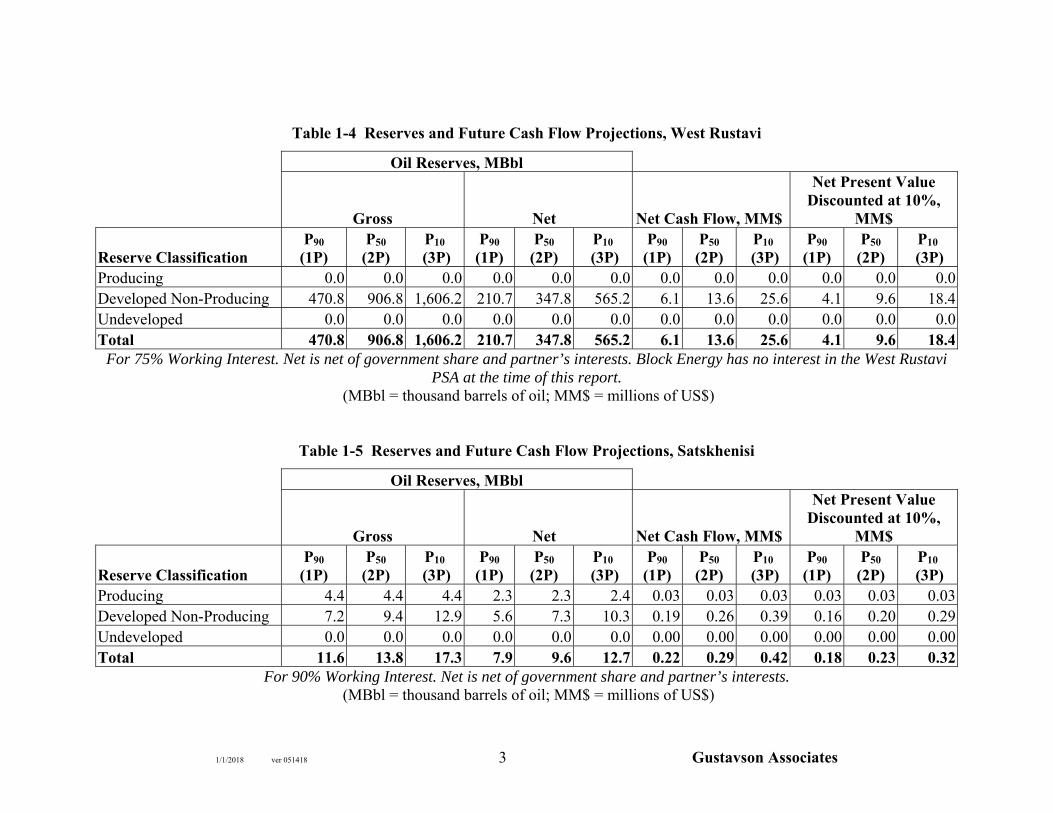
Table 1-4 Reserves and Future Cash Flow Projections, West Rustavi
Oil Reserves, MBbl
Gross Net Net Cash Flow, MM$
Net Present Value Discounted at 10%,
MM$
Reserve Classification P90
(1P) P50
(2P) P10
(3P) P90
(1P) P50 (2P)
P10
(3P) P90
(1P) P50 (2P)
P10
(3P) P90
(1P) P50 (2P)
P10
(3P) Producing 0.0 0.0 0.0 0.0 0.0 0.0 0.0 0.0 0.0 0.0 0.0 0.0 Developed Non-Producing 470.8 906.8 1,606.2 210.7 347.8 565.2 6.1 13.6 25.6 4.1 9.6 18.4 Undeveloped 0.0 0.0 0.0 0.0 0.0 0.0 0.0 0.0 0.0 0.0 0.0 0.0 Total 470.8 906.8 1,606.2 210.7 347.8 565.2 6.1 13.6 25.6 4.1 9.6 18.4
For 75% Working Interest. Net is net of government share and partner’s interests. Block Energy has no interest in the West Rustavi PSA at the time of this report.
(MBbl = thousand barrels of oil; MM$ = millions of US$)
Table 1-5 Reserves and Future Cash Flow Projections, Satskhenisi
Oil Reserves, MBbl
Gross Net Net Cash Flow, MM$
Net Present Value Discounted at 10%,
MM$
Reserve Classification P90
(1P) P50
(2P) P10
(3P) P90
(1P) P50 (2P)
P10
(3P) P90
(1P) P50 (2P)
P10
(3P) P90
(1P) P50 (2P)
P10
(3P) Producing 4.4 4.4 4.4 2.3 2.3 2.4 0.03 0.03 0.03 0.03 0.03 0.03 Developed Non-Producing 7.2 9.4 12.9 5.6 7.3 10.3 0.19 0.26 0.39 0.16 0.20 0.29 Undeveloped 0.0 0.0 0.0 0.0 0.0 0.0 0.00 0.00 0.00 0.00 0.00 0.00 Total 11.6 13.8 17.3 7.9 9.6 12.7 0.22 0.29 0.42 0.18 0.23 0.32
For 90% Working Interest. Net is net of government share and partner’s interests. (MBbl = thousand barrels of oil; MM$ = millions of US$)

1/1/2018 ver 051418 4 Gustavson Associates
Table 1-6 Gross Unrisked Contingent Resource Estimates by Area
(MMBbl = million barrels of oil; BCF = billion cubic feet)
Table 1-7 Block Energy WI Share Unrisked Contingent Resource Estimates by Area
(MMBbl = million barrels of oil; BCF = billion cubic feet)
Table 1-8 Gross Unrisked Prospective Resource Estimates by Area
(MMBbl = million barrels of oil; BCF = billion cubic feet)
Note that these estimates do not include consideration for the risk of failure in exploring for and
developing these resources.
BlockLow
Estimate(1C)
Best Estimate
(2C)
High Estimate
(3C)
Low Estimate
(1C)
Best Estimate
(2C)
High Estimate
(3C)
Norio 3.1 7.2 13.9 0.8 1.9 3.7 75%
Satskhenisi 16.4 27.8 43.7 9.3 16.4 26.5 75%
Subtotal 19.5 35 57.6 10.1 18.3 30.2
West Rustavi 18.6 37.9 69.3 314 608 1,000 75%
TOTAL 38.1 72.9 126.9 324 626 1,030
Contingent Oil/Condensate Resources, MMBbl
Contingent Associated/Free Gas Resources, Bcf
Risk Factor
BlockLow
Estimate(1C)
Best Estimate
(2C)
High Estimate
(3C)
Low Estimate
(1C)
Best Estimate
(2C)
High Estimate
(3C)
Norio 3.1 7.2 13.9 0.8 1.9 3.7 75%
Satskhenisi 14.7 25 39.3 8.4 14.7 23.9 75%
Subtotal 17.8 32.2 53.2 9.2 16.6 27.6
West Rustavi 13.9 28.4 52 235 456 750 75%
TOTAL 31.8 60.6 105.2 244 473 778
Contingent Oil/Condensate Resources, MMBbl
Contingent Associated/Free Gas Resources, Bcf
Risk Factor
BlockLow
EstimateBest
EstimateHigh
EstimateLow
EstimateBest
EstimateHigh
Estimate
Norio 1.4 3.1 5.2 1 2.2 3.7 60%
Satskhenisi 0 0 0 0 0 0 ---
Subtotal 1.4 3.1 5.2 1 2.2 3.7
West Rustavi 0 0 0 0 0 0 ---
TOTAL 1.4 3.1 5.2 1 2.2 3.7
Prospective Oil Resources, MMBbl
Prospective Associated Gas Resources, Bcf Risk
Factor
1/1/2018 ver 051418 5 Gustavson Associates
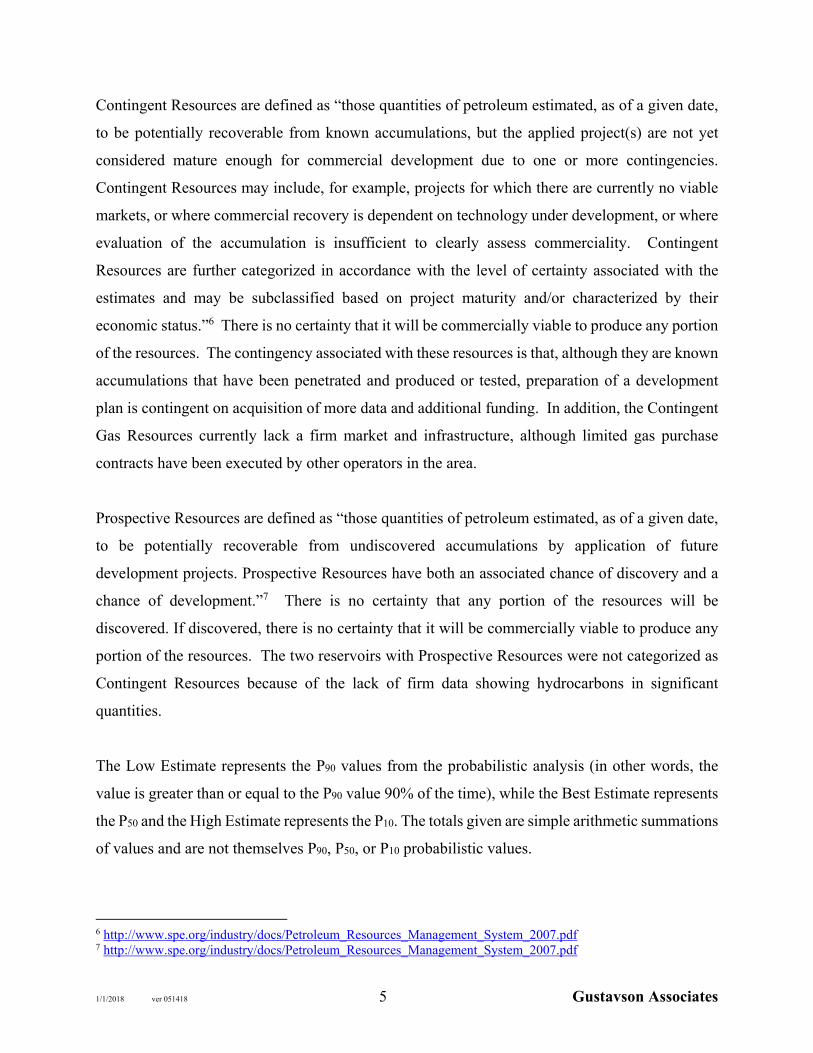
Contingent Resources are defined as “those quantities of petroleum estimated, as of a given date,
to be potentially recoverable from known accumulations, but the applied project(s) are not yet
considered mature enough for commercial development due to one or more contingencies.
Contingent Resources may include, for example, projects for which there are currently no viable
markets, or where commercial recovery is dependent on technology under development, or where
evaluation of the accumulation is insufficient to clearly assess commerciality. Contingent
Resources are further categorized in accordance with the level of certainty associated with the
estimates and may be subclassified based on project maturity and/or characterized by their
economic status.”6 There is no certainty that it will be commercially viable to produce any portion
of the resources. The contingency associated with these resources is that, although they are known
accumulations that have been penetrated and produced or tested, preparation of a development
plan is contingent on acquisition of more data and additional funding. In addition, the Contingent
Gas Resources currently lack a firm market and infrastructure, although limited gas purchase
contracts have been executed by other operators in the area.
Prospective Resources are defined as “those quantities of petroleum estimated, as of a given date,
to be potentially recoverable from undiscovered accumulations by application of future
development projects. Prospective Resources have both an associated chance of discovery and a
chance of development.”7 There is no certainty that any portion of the resources will be
discovered. If discovered, there is no certainty that it will be commercially viable to produce any
portion of the resources. The two reservoirs with Prospective Resources were not categorized as
Contingent Resources because of the lack of firm data showing hydrocarbons in significant
quantities.
The Low Estimate represents the P90 values from the probabilistic analysis (in other words, the
value is greater than or equal to the P90 value 90% of the time), while the Best Estimate represents
the P50 and the High Estimate represents the P10. The totals given are simple arithmetic summations
of values and are not themselves P90, P50, or P10 probabilistic values.
6 http://www.spe.org/industry/docs/Petroleum_Resources_Management_System_2007.pdf 7 http://www.spe.org/industry/docs/Petroleum_Resources_Management_System_2007.pdf

1/1/2018 ver 051418 6 Gustavson Associates
2. TABLE OF CONTENTS
PAGE
1. EXECUTIVE SUMMARY ...................................................................................................... 1
2. TABLE OF CONTENTS .......................................................................................................... 6
3. INTRODUCTION .................................................................................................................. 11
3.1 OVERVIEW .................................................................................................................. 11 3.2 SUMMARY ASSET DESCRIPTION ........................................................................... 11
3.2.1 Norio PSA License Block ......................................................................................... 13 3.2.2 Permit XIf (West Rustavi) ......................................................................................... 14 3.2.3 Satskhenisi PSA License Block ................................................................................ 14
3.3 SCOPE OF WORK ........................................................................................................ 14 3.4 DISCLAIMER ............................................................................................................... 16
4. DESCRIPTION OF ASSETS ................................................................................................. 17
4.1 LOCATION AND BASIN NAME ................................................................................ 17 4.2 NORIO PSA LICENSE BLOCK .................................................................................. 17
4.2.1 Geographic Description ............................................................................................. 17 4.2.2 PSA Contract Terms .................................................................................................. 18 4.2.3 Database .................................................................................................................... 19 4.2.4 Market and Infrastructure .......................................................................................... 21
4.3 WEST RUSTAVI BLOCK ............................................................................................ 22 4.3.1 Geographic Description ............................................................................................. 22 4.3.2 PSA Contract Terms .................................................................................................. 23 4.3.3 Database .................................................................................................................... 24 4.3.4 Market and Infrastructure .......................................................................................... 25
4.4 SATSKHENISI PSA LICENSE BLOCK ..................................................................... 25 4.4.1 Geographic Description ............................................................................................. 25 4.4.2 PSA Contract Terms .................................................................................................. 26 4.4.3 Database .................................................................................................................... 28 4.4.4 Market and Infrastructure .......................................................................................... 29
4.5 IDENTITY AND RELEVANT EXPERIENCE OF BLOCK ENERGY ...................... 30
5. PETROLEUM GEOLOGY .................................................................................................... 32
5.1 EXPLORATION HISTORY ......................................................................................... 32 5.2 REGIONAL GEOLOGY ............................................................................................... 34
5.2.1 Structure .................................................................................................................... 34 5.2.2 Stratigraphy ............................................................................................................... 36 5.2.3 Petroleum System ...................................................................................................... 39
5.2.3.1 Source Rocks ................................................................................................... 40 5.2.3.2 Maturation ....................................................................................................... 41 5.2.3.3 Reservoir Rocks ............................................................................................... 41 5.2.3.4 Traps and Seals ................................................................................................ 42
5.3 NORIO FIELD............................................................................................................... 43 5.3.1 Exploration and Development History ...................................................................... 43
1/1/2018 ver 051418 7 Gustavson Associates
5.3.2 Description of Reservoirs .......................................................................................... 45 5.3.2.1 Chokrak ........................................................................................................... 45 5.3.2.2 Maikop ............................................................................................................. 48 5.3.2.3 Sarmatian ......................................................................................................... 49
5.3.3 Analysis of Net Pay ................................................................................................... 49 5.3.4 Reservoir Limits ........................................................................................................ 49
5.3.4.1 Chokrak ........................................................................................................... 49 5.3.4.2 Maikop ............................................................................................................. 50 5.3.4.3 Sarmatian ......................................................................................................... 52
5.3.5 Conclusions ............................................................................................................... 53 5.4 WEST RUSTAVI FIELD .............................................................................................. 53
5.4.1 Exploration and Development History ...................................................................... 53 5.4.2 Description of Reservoirs .......................................................................................... 53
5.4.2.1 Upper Eocene .................................................................................................. 53 5.4.2.2 Middle Eocene ................................................................................................. 54 5.4.2.3 Lower Eocene .................................................................................................. 54 5.4.2.4 Upper Cretaceous ............................................................................................ 54
5.4.3 Analysis of Net Pay ................................................................................................... 55 5.4.4 Reservoir Limits ........................................................................................................ 55
5.4.4.1 Upper Eocene .................................................................................................. 56 5.4.4.2 Middle Eocene ................................................................................................. 57 5.4.4.3 Lower Eocene .................................................................................................. 58 5.4.4.4 Upper Cretaceous ............................................................................................ 59
5.4.5 Conclusions ............................................................................................................... 60 5.5 SATSKHENISI FIELD ................................................................................................. 61
5.5.1 Exploration and Development History ...................................................................... 61 5.5.2 Description of Reservoirs .......................................................................................... 64
5.5.2.1 Maikop ............................................................................................................. 65 5.5.2.2 Chokrak ........................................................................................................... 66
5.5.3 Gross Rock Volume .................................................................................................. 66 5.5.4 Net to Gross ............................................................................................................... 66 5.5.5 Conclusions ............................................................................................................... 67
6. PROBABILISTIC RESERVE ESTIMATE ........................................................................... 68
6.1 OVERVIEW .................................................................................................................. 68 6.1.1 Norio .......................................................................................................................... 68 6.1.2 West Rustavi .............................................................................................................. 71 6.1.3 Satskhenisi ................................................................................................................. 73
6.2 GENERAL ..................................................................................................................... 73 6.3 PROBABILISTIC SIMULATION ................................................................................ 74 6.4 INPUT PARAMETERS ................................................................................................ 74 6.5 ECONOMICS ................................................................................................................ 82
6.5.1 Assumptions .............................................................................................................. 82 6.5.2 Results ....................................................................................................................... 84
7. PROBABILISTIC RESOURCE ANALYSIS ........................................................................ 89
7.1 GENERAL ..................................................................................................................... 89

1/1/2018 ver 051418 8 Gustavson Associates
7.2 INPUT PARAMETERS ................................................................................................ 89 7.3 PROBABILISTIC SIMULATION ................................................................................ 94 7.4 GEOLOGIC RISKS AND PROBABILITY OF SUCCESS ......................................... 95 7.5 RESULTS ...................................................................................................................... 95
8. REFERENCES ..................................................................................................................... 100
9. CERTIFICATES OF QUALIFICATION ............................................................................ 101
LIST OF APPENDICES
A Probability Distributions of Resources B Excerpt from Petroleum Resources Management System C Glossary of Terms and Abbreviations D Detailed Cash Flow Sheets
1/1/2018 ver 051418 9 Gustavson Associates
LIST OF FIGURES FIGURE PAGE Figure 3-1 Index Map of the Republic of Georgia and the Area of Interest ................................. 12 Figure 3-2 Map of Georgia License Blocks with Block Energy License Areas .......................... 13 Figure 4-1 Outline of the Norio Block ......................................................................................... 18 Figure 4-2 Outline of the West Rustavi Block ............................................................................. 23 Figure 4-3 Outline and Coordinates of the Satskhenisi Block ..................................................... 26 Figure 5-1 Map of Oil and Gas Occurrences in Georgia .............................................................. 33 Figure 5-2 Map Showing Oil and Gas Fields, Basins, and Mountain Areas ............................... 34 Figure 5-3 Paleogeographic Reconstruction Maps of the Kartli Basin Region ............................ 35 Figure 5-4 Regional Structural Map Showing Major Faults ........................................................ 36 Figure 5-5 Stratigraphic Column of the Kura Basin Region ........................................................ 38 Figure 5-6 Norio Field Production History Plot .......................................................................... 43 Figure 5-7 Schematic Section of Norio Field ............................................................................... 44 Figure 5-8 Interpretation showing Multiple Fault Cuts in the NOR201 well (Iskander/HEF) ..... 46 Figure 5-9 Cross-section showing Correlation Issues .................................................................. 47 Figure 5-10 Map Depicting the Cumulative Production from the Chokrak (GOG) ..................... 47 Figure 5-11 Map Depicting the Initial Production Rates from the Chokrak (GOG) .................... 48 Figure 5-12 Chokrak Net Sand Isopachous Map Based on GOG Data in Petra Project .............. 50 Figure 5-13 Chokrak Reservoir Areas .......................................................................................... 51 Figure 5-14 Maikop Reservoir Area ............................................................................................. 52 Figure 5-15 Upper Eocene Reservoir Area ................................................................................... 56 Figure 5-16 Middle Eocene Reservoir Area ................................................................................. 57 Figure 5-17 Lower Eocene Reservoir Area .................................................................................. 58 Figure 5-18 Upper Cretaceous Reservoir Area ............................................................................. 59 Figure 5-19 Map of Satskhenisi Block with Shallow and Deep Well Locations ......................... 60 Figure 5-20 Satskhenisi Field Total Production Plot .................................................................... 62 Figure 5-21 Satskhenisi Cumulative Production by Well............................................................. 62 Figure 5-22 Map of Satskhenisi Field Wells with Block Outline ................................................. 63 Figure 5-23 Cross section of Satskhenisi Field............................................................................. 64 Figure 5-24 Satskhenisi Field Structure map of the Maikop horizon ........................................... 65 Figure 6-1 Map of Analog Fields with Local Infrastructure and Block License Areas ............... 68 Figure 6-2 Map Showing Planned Horizontal Well Locations, Norio ........................................ 70 Figure 6-3 Samgori South Dome Production Data with West Rustavi Sidetrack Forecasts ....... 72 Figure 6-4 Distribution Fit to Lateral Jetting Rate Improvement Data ....................................... 75 Figure 6-5 Production Forecasts, Norio Producing Reserves ...................................................... 77 Figure 6-6 Production Forecasts, Norio Developed Non-Producing, Behind Pipe Reserves ...... 78 Figure 6-7 Production Forecasts, Norio Developed Non-Producing, Lateral Jet Reserves......... 78 Figure 6-8 Production Forecasts, Norio Example New Horizontal Well .................................... 79 Figure 6-9 Production Forecasts, Norio Undeveloped Horizontal Well Reserves ...................... 79 Figure 6-10 Production Forecasts, West Rustavi Example Sidetrack ......................................... 80 Figure 6-11 Production Forecasts, West Rustavi Total Four Sidetracks ..................................... 80 Figure 6-12 Production Forecasts, Satskhenisi Producing Reserves ........................................... 81 Figure 6-13 Production Forecasts, Satskhenisi Workover Reserves, Three Wells ...................... 81
1/1/2018 ver 051418 10 Gustavson Associates
LIST OF TABLES TABLE PAGE Table 1-1 Summary of Assets owned by Block Energy plc ........................................................... 1 Table 1-2 Reserves and Future Cash Flow Projections, Total ....................................................... 2 Table 1-3 Reserves and Future Cash Flow Projections, Norio ...................................................... 2 Table 1-4 Reserves and Future Cash Flow Projections, West Rustavi .......................................... 3 Table 1-5 Reserves and Future Cash Flow Projections, Satskhenisi ............................................. 3 Table 1-6 Gross Unrisked Contingent Resource Estimates by Area ............................................. 4 Table 1-7 Block Energy WI Share Unrisked Contingent Resource Estimates by Area ................ 4 Table 1-8 Gross Unrisked Prospective Resource Estimates by Area ............................................ 4 Table 4-1 West Rustavi Minimum Work Program ...................................................................... 24 Table 4-2 Satskhenisi Cumulative Oil Production ....................................................................... 29 Table 5-1 Kura Basin Source Rock Maturity, TOC, and Age ..................................................... 41 Table 5-2 Summary of Norio Net Pay (feet) ................................................................................ 49 Table 5-3 Norio Reservoir Areas .................................................................................................. 52 Table 5-4 Net Pay Thickness for West Rustavi (feet) .................................................................. 55 Table 5-5 Reservoir Areas ............................................................................................................ 60 Table 5-6 Gross Rock Volume for Satskhenisi (acre-feet) ........................................................... 66 Table 5-7 Net to Gross Pay, %...................................................................................................... 67 Table 6-1 Norio Wells with Reserves Assigned .......................................................................... 70 Table 6-2 West Rustavi Wells with Reserves Assigned .............................................................. 72 Table 6-3 Satskhenisi Wells with Reserves Assigned ................................................................. 73 Table 6-4 Input Parameters, Norio ............................................................................................... 76 Table 6-5 Input Parameters, West Rustavi .................................................................................. 76 Table 6-6 Input Parameters, Satskhenisi ...................................................................................... 77 Table 6-7 Summary of Economic Assumptions, Norio ............................................................... 82 Table 6-8 Summary of Economic Assumptions, West Rustavi ................................................... 83 Table 6-9 Summary of Economic Assumptions, Satskhenisi ...................................................... 83 Table 6-10 Forecasts of Brent Oil Price ....................................................................................... 84 Table 6-11 Summary of Gross and Net Reserves, Norio ............................................................. 85 Table 6-12 Summary of Projected Cash Flow, Norio .................................................................. 86 Table 6-13 Summary of Gross and Net Reserves, West Rustavi ................................................ 87 Table 6-14 Summary of Projected Cash Flow, West Rustavi ..................................................... 87 Table 6-15 Summary of Gross and Net Reserves, Satskhenisi .................................................... 88 Table 6-16 Summary of Projected Cash Flow, Satskhenisi ......................................................... 88 Table 7-1 Norio Input Parameters ................................................................................................ 91 Table 7-2 West Rustavi Input Parameters, Oil Reservoirs .......................................................... 92 Table 7-3 West Rustavi Input Parameters, Gas Reservoirs ......................................................... 93 Table 7-4 Satskhenisi Input Parameters ....................................................................................... 94 Table 7-5 Gross Unrisked Contingent and Prospective Resource Estimates by Reservoir ......... 96 Table 7-6 Block Energy’s Working Interest Share Unrisked Contingent and Prospective
Resource Estimates by Reservoir .......................................................................................... 97

1/1/2018 ver 051418 11 Gustavson Associates
3. INTRODUCTION
3.1 OVERVIEW
Gustavson Associates LLC (the Consultant) has been retained by Block Energy plc and SPARK
Advisory Partners Limited to prepare a Competent Person’s Report for them in accordance with
the AIM Note for Mining and Oil and Gas Companies for the purposes of the Clients’ admission
to the AIM of the London Stock Exchange. The report covers the interests owned by Block Energy
plc in oil and gas license blocks located in the Republic of Georgia. The general location of the
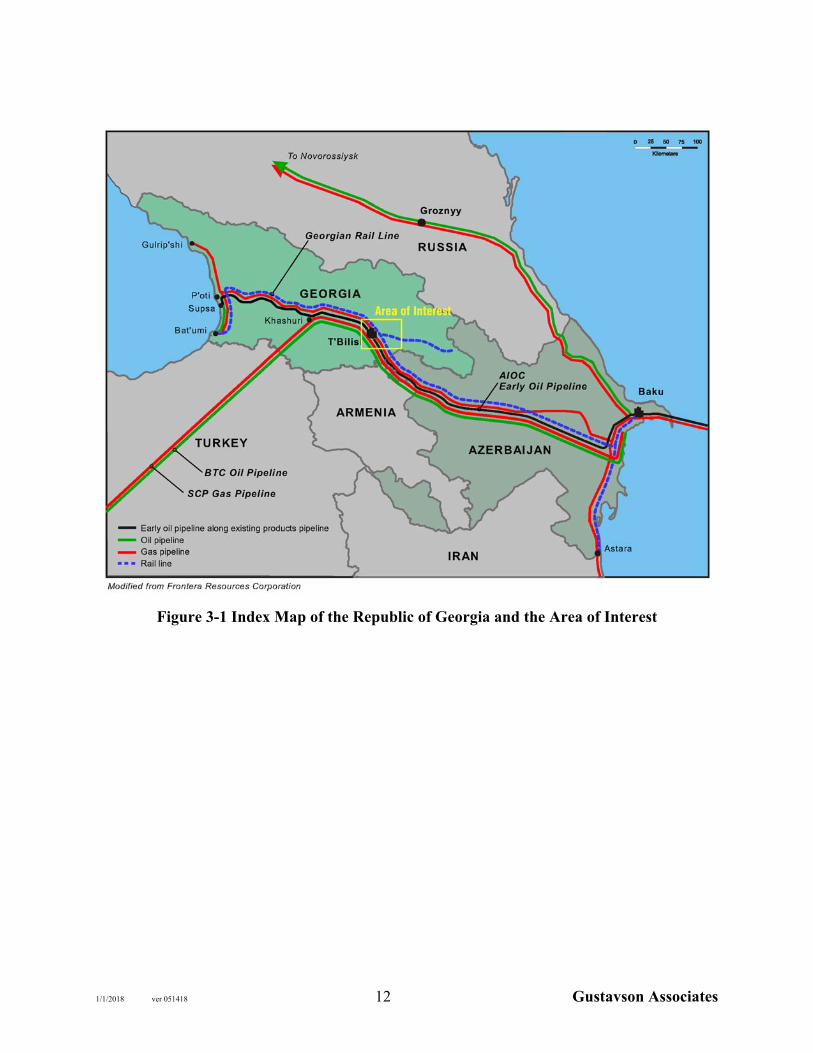
report study area is shown in Figure 3-1. The purpose of the report is to provide a baseline for the
company’s reserve and resource base and to support the Client’s admission to the AIM of the
London Stock Exchange (AIM).
The Block Energy assets that are the subject of this report include interests in the Norio and
Satskhenisi Production Sharing Agreement (PSA) contracts and Permit XIf (West Rustavi). The
report contains independent estimates of reserves and resources for the above described assets and
the effective date of this report is January 1, 2018. Reserves and resources have been estimated
according to the standards and resources definitions found in the Petroleum Resources
Management System (PRMS)8 and the AIM Rules for Companies which includes specifically the
Note for Mining and Oil and Gas Companies. This report also contains the results of a financial
model that projects future income from the production and development of the reserves and
resources. A site visit was not made, and inspection of the petroleum assets is judged not likely to
reveal information or data that is material to this Report.
3.2 SUMMARY ASSET DESCRIPTION
The three license blocks are located in the eastern part of the Republic of Georgia, in an area where
oil and gas exploration and development has been ongoing since the early part of the twentieth
century. Figure 3-2 shows the location of the three subject blocks relative to other license blocks
in the country.
8 http://www.spe.org/industry/docs/Petroleum_Resources_Management_System_2007.pdf
1/1/2018 ver 051418 12 Gustavson Associates
Figure 3-1 Index Map of the Republic of Georgia and the Area of Interest

1/1/2018 ver 051418 13 Gustavson Associates
Figure 3-2 Map of Georgia License Blocks with Block Energy License Areas
3.2.1 Norio PSA License Block
The Norio PSA license block contains the Norio Field, which was discovered in 1938. To date, a
total of 55 oil wells have been drilled on the block. Out of the 55 wells, 31 produced oil from the
Miocene age Chokrak formation. This reservoir is a fractured, volcanic-sourced arkosic sandstone
formation that has been subjected to complex thrust faulting that has created compartments of oil
accumulation. Production from the field commenced in 1939 with an estimated cumulative
production of 1.8 MMBbl and continues producing today from three wells at a total rate of 17.5
barrels of oil per day. The block area is approximately 5,570 acres (22.54 km2) and is located 22
miles (35 km) north of Tbilisi.
1/1/2018 ver 051418 14 Gustavson Associates
3.2.2 Permit XIf (West Rustavi)
Permit XIf contains the West Rustavi Field, which was discovered in 1988 by well 16a. A total
of 13 wells have been drilled on the block. The field has produced 41 MBbl and 41 MMcf from
two wells completed in the Middle Eocene horizon and is currently not producing. The block area
is approximately 9,328 acres (37.75 km2) and is located 6 miles (10 km) south-east of Tbilisi and
approximately 14 miles (23 km) south of Norio Field.
3.2.3 Satskhenisi PSA License Block
The Satskhenisi PSA license block contains the Satskhenisi Field, which was discovered in 1956.
To date, a total of 64 oil wells have been drilled on the block. Out of the 64 wells, 14 wells
produced oil from the Lower Miocene age Maikop formation. This reservoir is a fractured,
volcanic-sourced arkosic sandstone formation that has been subjected to complex thrust faulting
that has created compartments of oil accumulation similar to Norio. Production from the field
commenced in 1956 with an estimated cumulative production of 326.5 MBbl and continues
producing today from four wells at a total rate of 5 barrels of oil per day with very little water.
The block area is approximately 6,024 acres (24.38 km2) and is located 20 miles (32 km) north of
Tbilisi.
3.3 SCOPE OF WORK
The scope of work for this assignment included a review and analysis of technical information
provided by Block Energy and Georgia Oil and Gas for the Norio, West Rustavi and Satskhenisi
assets in Georgia for the purpose of estimating oil and natural reserves, contingent resources and
prospective resources. The dataset was made up of many different components that Gustavson had
to compile, reconcile and interpret. The Georgia Oil and Gas (GOG) data was the main source of
information relied upon for the interpretations of reservoir parameters. The principal pieces of data
relied upon were the Petra database, wellbore diagrams, the Schlumberger reports and well test
information.
1/1/2018 ver 051418 15 Gustavson Associates
Based on the GOG data in Norio field, it is our opinion that all of the reported production has come
from the Chokrak reservoir. Utilizing the GOG net sand estimates in the Petra database, a net sand
isopach was constructed for the Chokrak sand and this was the basis for the net sand parameters
used in the probabilistic analysis. The reservoir limits for the Chokrak, Maikop and Sarmatian
sands were generally based on well test information and well control data.
The West Rustavi field Petra database information was used with the well test information to
interpret and establish the reservoir limits. The fault pattern was based on well control and test
information as well as previous technical reports that were provided. The other reservoir
parameters such as porosity, water saturation, pressure, and net pay were obtained from technical
reports provided by Block Energy.
The Satskhenisi field parameters were based on the 2012 Schlumberger study and report. The
Schlumberger work was audited utilizing data from the Petra database, seismic database and
parameter limits and ranges were modified accordingly.
Gustavson was requested to prepare reserves and economics based on Block Energy owning 100
percent interest in the Norio, 90 percent interest in Satskhenisi and 75 percent interest in the West
Rustavi PSA License Blocks (assuming completion of the Farm-in workplan).
Resources were estimated using @Risk software for probabilistic simulation, and volumetric
parameters from the geologic analysis and all available reservoir data. Reserves were estimated
for producing wells and workovers and new drilling planned by the operator. Reserve forecasts
were based on a probabilistic analysis of initial rates and decline curve parameters based on all
available analogous data.
The results of this work are independent estimates of oil and natural gas reserves, contingent
resources, and prospective resources contained within Norio, West Rustavi and Satskhenisi Fields.
Reserves and resources have been evaluated in accordance with the Petroleum Resources
Management System (Society of Petroleum Engineers, American Association of Petroleum
Geologists, World Petroleum Council, and Society of Petroleum Evaluation Engineers) guidelines.

1/1/2018 ver 051418 16 Gustavson Associates
3.4 DISCLAIMER
Gustavson Associates LLC has acted independently in the preparation of this Report. The
company and its employees have no direct or indirect ownership in Block Energy, plc, the property
appraised or the area of study described. Ms. Letha Lencioni and Mr. Jan Tomanek are signing
this Competent Persons Report, which has been prepared by Ms. Lencioni as a Qualified Reserves
Evaluator and Mr. Tomanek as a Certified Petroleum Geologist, with the assistance of others on
Gustavson’s staff. Our fee for this Report and the other services that may be provided is not
dependent on the amount of resources or reserves estimated. The accuracy of any estimate is a
function of available time, data and of geological, engineering, and commercial interpretation and
judgment. While the interpretation and estimates presented herein are believed to be reasonable,
they should be viewed with the understanding that additional analysis or new data may justify their
revision. Gustavson Associates reserves the right to revise its opinions, if new information is
deemed sufficiently credible to do so. Gustavson Associates has not personally inspected the
subject properties.
1/1/2018 ver 051418 17 Gustavson Associates
4. DESCRIPTION OF ASSETS
4.1 LOCATION AND BASIN NAME
The subject license blocks are located east of the Black Sea in the Kartli Basin (also referred to as
the Kura Basin), an oil and gas province located in the eastern part of the country. Within the
Kartli Basin, approximately 15 oil and gas fields have been discovered over the years, amongst
which the 236 MMBbl Samgori-Patardzeuli and the 58 MMBbl Ninotsminda fields are the best
known. The Kartli Basin is coincident with the Kura River valley and is a tectonically complex
area situated to the south of the Greater Caucasus.
4.2 NORIO PSA LICENSE BLOCK
4.2.1 Geographic Description
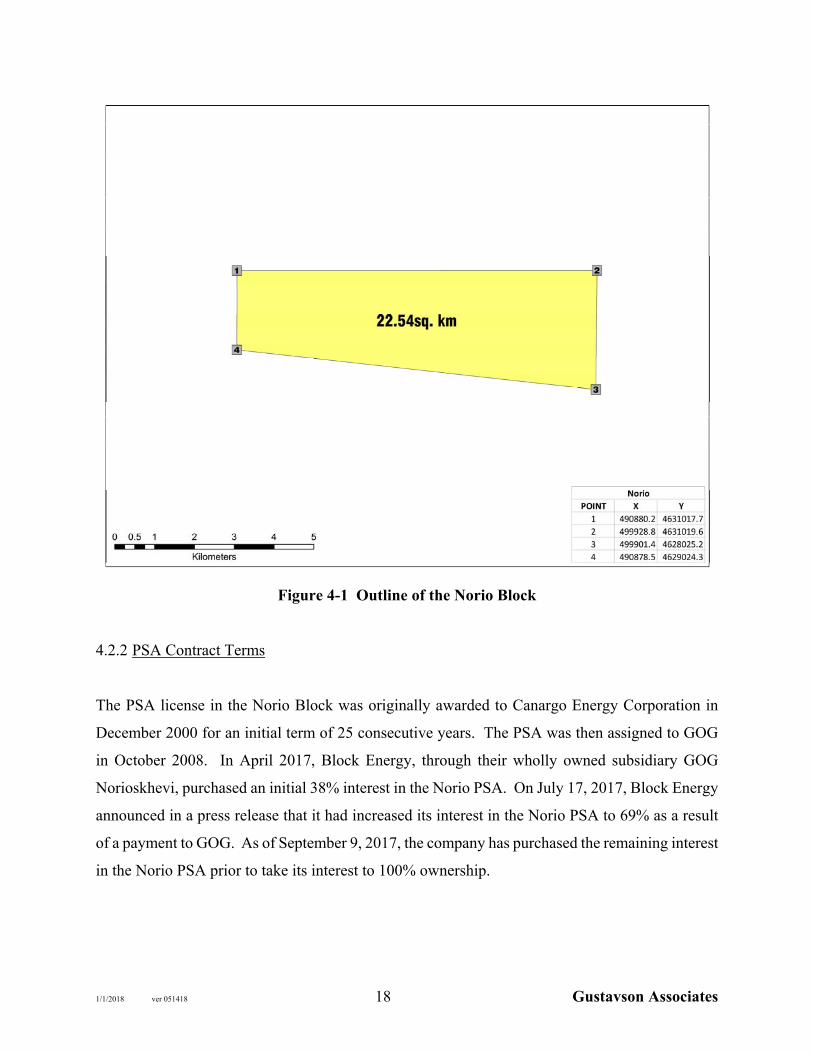
The Norio PSA license block encompasses an area of approximately 5,570 acres (22.54 km2). The
general outline of the block with the X, Y Coordinates in UTM WGS 1984 Zone 38N projection
are shown on Figure 4-1.
1/1/2018 ver 051418 18 Gustavson Associates
Figure 4-1 Outline of the Norio Block
4.2.2 PSA Contract Terms
The PSA license in the Norio Block was originally awarded to Canargo Energy Corporation in
December 2000 for an initial term of 25 consecutive years. The PSA was then assigned to GOG
in October 2008. In April 2017, Block Energy, through their wholly owned subsidiary GOG
Norioskhevi, purchased an initial 38% interest in the Norio PSA. On July 17, 2017, Block Energy
announced in a press release that it had increased its interest in the Norio PSA to 69% as a result
of a payment to GOG. As of September 9, 2017, the company has purchased the remaining interest
in the Norio PSA prior to take its interest to 100% ownership.

1/1/2018 ver 051418 19 Gustavson Associates
The Norio PSA is effective until April 2026 with an optional five-year renewal. According to
Block Energy, there are no outstanding work obligations related to the Permit. The provisions of
the agreement include that 100% of the revenue from sales of hydrocarbons are available for cost
recovery of operating costs before sharing with the government. Capital costs, including an
historic cost recovery pool of US$20 million, can be recovered from 50% of the production
revenue before sharing with the government. The government pays all taxes from their share of
Profit Oil. Profit Oil is split 50/50 until “Payment Date,” defined as the time when all cumulative
revenues from Cost Recovery and Profit Oil exceed cumulative capital expenditure, including the
historic cost recovery pool. After the Payment Date, the Profit Oil split is 60% for the Government
and 40% for the Block.
4.2.3 Database
As noted elsewhere in this report, the production history data provided for this field were found to
be incomplete as is the case with most permits and fields located in former Soviet Union states.
Gustavson attempted to reconcile and interpret these data, with the results presented in this report.
The database provided for Norio consisted of the following information:
Petra Database
This database included horizon tops (from several operators), several well logs, production, and
perforation data. This database was updated which was updated with additional information from
various reports and spreadsheets of production and test information.
Kingdom – SMT Database
The seismic database that contained 2D seismic data, well information and horizon interpretations
was provided. This database was updated with additional information as available. It was found,
as noted in the Schlumberger report, that the existing 2D seismic data over the Norio Field does
not have the resolution necessary to image and interpret with any certainty the multiple thrust faults
and horizon boundaries.
1/1/2018 ver 051418 20 Gustavson Associates
Reports
Several reports from Schlumberger and others with varying data, interpretations and conclusions
along with wellbore diagrams, well histories; production and test information were considered.
Production Data
Numerous partial production databases were provided that were consolidated into one master
production database which was used in the analysis. Production history data was provided by
Block Energy in several MS Excel format files and is described below.
Annual Production by Well from 1939 to 2011:
This file contained annual total production data for 32 Norio Field wells from 1939 through 2011.
There is an additional 24 Norio Field wells in the spreadsheet for which there is no production data
and these are assumed to never have been produced. The data for gas, oil and water were provided
in metric units, cubic meters for gas, tonnes for oil and water. Data were transposed from a years-
in-columns to years-in-rows format. The volumes were converted from metric to US units using
a conversion factor of 7.0 Bbl/tonne for oil and 6.3 Bbl/tonne for water. The annual volumes were
then converted to monthly volumes by dividing by 12 (an assumption was made that the volumes
were accumulated over an entire year). The monthly production volumes were imported into an
Aries™ database for analysis.
Monthly Production by Well from 2008 to June 2015:
This file contained monthly oil, gas and water production data in metric units for 16 Norio Field
wells from October 2008 to June 2015. The volumes were converted to US units using the
previously listed conversion factors and imported into the Aries™ database for analysis.
Daily Production, July – December 2015:
This file contains daily production data for six Norio Field wells from May 31, 2015 to December
31, 2015, in metric units for oil, gas, and water. The volumes were converted to US units using
the previously listed conversion factors, summed to the monthly level and imported into the
Aries™ database for analysis.
1/1/2018 ver 051418 21 Gustavson Associates
Daily Production, 2016:
This file contains daily production data for four Norio Field wells from January 1, 2016 to
December 31, 2016, in metric units for oil, gas, and water. The volumes were converted to US
units using the previously listed conversion factors, summed to the monthly level and imported
into the Aries™ database for analysis.
Daily Production, 2017:
This file contains daily production data for three Norio Field wells from January 1, 2017 to April
23, 2017, in metric units for oil, gas, and water. The volumes were converted to US units using
the previously listed conversion factors, summed to the monthly level and imported into the
Aries™ database for analysis.
4.2.4 Market and Infrastructure
The terrain in the area of the Norio Block is hilly and forested. Three-phase electrical power is
readily available from the grid that runs through the field. Images from Google Maps indicate that
there are numerous lease roads that run through the field. The surface is state owned and there are
no access issues.
Existing oil storage capacity in the Norio Field is 1,700 cubic meters (10,700 Bbls) in total. This
capacity is sufficient to handle production for the proposed plan of development. In addition to
the in-field storage, Georgia Oil and Gas rents 800 cubic meters (5,032 Bbl) of storage capacity at
a rail siding located at the town of Lilo. As of April 2017, three wells are being produced in the
Norio Block.
Oil production is sold to the local market or is transported by rail to the Black Sea port of Batumi.
Under agreement with local oil buyers (Lucky2 Oil Company, etc.), oil production from the
Satskhenisi field is sold to for Brent Crude Index minus US$9.00/Bbl. This differential includes
all marketing and transportation. Similar terms exist for oil produced from the Norio Field and it
is anticipated that similar terms will be negotiated for oil produced from the West Rustavi Field.
1/1/2018 ver 051418 22 Gustavson Associates
The Norio Field has an existing water disposal system with unknown current capacity. The system
consists of two tanks with 400 cubic meter (2,516 Bbl) capacity, a centrifugal pump and a disposal
well.
Any associated gas produced in the Norio Field is used on lease. Gas production volumes have
not justified the installation of gas gathering and processing infrastructure. Any future increases
in gas production resulting from the proposed development will be used to fuel field operations.
4.3 WEST RUSTAVI BLOCK
4.3.1 Geographic Description
The subject area is approximately 9,328 acres (37.75 km2) in size and is located 6 miles (10 km)
south-east of Tbilisi and approximately 14 miles (23 km) south of Norio Field. The general outline
of the block and X, Y Coordinates in UTM WGS 1984 Zone 38N projection are shown on Figure
4-2. Block Energy has an agreement with the co-owner of the PSA (Georgia Oil and Gas) to farm-
in from its current 5% interest up to a 75% interest in the West Rustavi Permit by completing and
paying 100% of the costs associated with a work program of the re-entry and sidetracking of two
existing wells, spending $1M on a program of 3-4 workovers and upgrading production facilities
as may be required from the enhanced production.

1/1/2018 ver 051418 23 Gustavson Associates
Figure 4-2 Outline of the West Rustavi Block
4.3.2 PSA Contract Terms
The West Rustavi PSA is effective for 25 years from the date on which it becomes effective with
an optional renewal. The West Rustavi PSA will become effective following the satisfaction of
routine conditions precedent. This asset will be held by GNV (Georgian New Ventures) which is
a wholly owned subsidiary of Block Energy. The Minimum Work Program is described in Table
4-1 below. The provisions of the agreement include that cost recovery of both capital and
operating costs is limited to 50% of the revenue from sales of hydrocarbons before sharing with
the government. The government pays all taxes from their share of Profit Oil. Profit Oil is split
50/50 until payout, defined as the time when all cumulative revenues from Cost Recovery and

1/1/2018 ver 051418 24 Gustavson Associates
Profit Oil exceed cumulative capital expenditure, including the historic cost recovery pool. After
payout, the Profit Oil split is 60% for the Government and 40% for the Contractor.
Table 4-1 West Rustavi Minimum Work Program
Stage I - within 6 (six) months from the effective date of the Contract;
1. To procure and obtain all necessary geological, geophysical (seismic) data and field geophysical data, transfer it to digital and standard format, reprocess and interpret.
2. The environmental assessment of the existed situation and elaboration of environmental recommendations due to the Oil and Gas operations (before commencement of oil and gas operations).
Stage II- within 24 (twenty-four) months from the effective date of the Contract:
Re-enter one deep well for field geophysical works and testing or side-track drilling to produce hydrocarbons; According to the results – 3D seismic-exploration activities of the selected area - not less than 30 km2.
Stage III - According to the data acquired from the II Stage and from the completion of
this II Stage within 24 (twenty-four) months, drill one deep well sufficient to test the deepest prospective horizon.
Note: The 1st and 2nd stages of the Minimum Work Program constitute the mandatory minimum of work to be completed. Any correction and update may be applied upon agreement by and between the Parties in accordance with the outcomes obtained at each completed stage of the minimum work program.
4.3.3 Database
The data provided for the West Rustavi field was found to be incomplete; however, the Consultant
relied upon several reports that were provided, the Petra database and a sparse 2D seismic dataset.
The Petra Database included horizon tops (from multiple operators) and well logs. This database
was updated with additional information from various reports and spreadsheets of wellbore and
test information. The production data provided was also incomplete. Cumulative production was
provided for the wells in the block and other nearby wells. Limited monthly data were also
provided for wells to the north of the block.
1/1/2018 ver 051418 25 Gustavson Associates
4.3.4 Market and Infrastructure
The terrain in the West Rustavi Block is very accessible with gravel and paved roads throughout
the permit area, with a major highway at the eastern boundary of the permit. Three-phase electrical
power is available throughout the area.
There are currently five shut-in wells within the permit area with wellheads intact - that will
facilitate wellbore re-entry and return to production. Eight other wells exist in the permit area
which were abandoned but potentially recoverable.
Most land surface in the permit is state owned making access quite simple and straight forward.
Water for drilling operations may have to be trucked or a water source well drilled. Kumisi Lake
at the western end of the permit is a saltwater lake and likely not suitable for drilling mud.
The terrain is suitable for 2D and 3D seismic operations. Population within the permit area is
relatively sparse with only one village in the permit area. The city of Rustavi is less than one
kilometer from the southern boundary of the West Rustavi Block.
Gas Market: A low-pressure 16-inch diameter gas pipeline runs through the West Rustavi Block,
which supplies the City of Rustavi and industrial customers. There are at least two major industrial
gas consumers in Rustavi, a fertilizer and a steel plant.
4.4 SATSKHENISI PSA LICENSE BLOCK
4.4.1 Geographic Description
The Satskhenisi PSA license block encompasses an area of approximately 6,024 acres (24.38 km2).
The general outline of the block and the X, Y Coordinates in UTM WGS 1984 Zone 38N projection
are shown on Figure 4-3.

1/1/2018 ver 051418 26 Gustavson Associates
Figure 4-3 Outline and Coordinates of the Satskhenisi Block
4.4.2 PSA Contract Terms
The PSA license in the Satskhenisi Block was originally awarded to Canargo Energy Corporation
in December 2000 for an initial term of 25 consecutive years. The PSA was then assigned to
Georgia Oil and Gas in October 2008. Iskander Energy entered into a farmout agreement dated
June 14, 2013 to earn a 50% working interest in the Satskhenisi Production Sharing Agreement
(the “Satskhenisi PSA”) from the holder of the license, Georgia Oil and Gas (“GOG”) (the
“Farmout Agreement”). In exchange, Iskander paid all of the costs associated with drilling and
hydraulic fracture stimulation (fracture) of multiple intervals in each of the three wells. On August
29, 2014, GOG and Iskander entered into an amendment agreement to the Farmout Agreement
which: (i) extended the deadline for drilling of the third well by 12 months such that the drilling
of the third well of the earn-in program should occur no later than October 9, 2015; and (ii)

1/1/2018 ver 051418 27 Gustavson Associates
extended the earn-in completion date to occur no later than December 31, 2015. In consideration
for this amendment, Iskander agreed to pay all the costs to recomplete four existing wells in the
fourth quarter of 2014 to the second quarter of 2015.
On April 23, 2015, Iskander negotiated with GOG to purchase the remaining 50% of the
Satskhenisi PSA for consideration of U.S. $1,000,000, thereby avoiding the obligation to drill the
third earning well. The payment for this acquisition was to be made in two installments, $650,000
in April 2015 and $350,000 by December 1, 2015. The second two wells in the recompletion
program were tested. Based on the low producing rates resulting from the two new wells drilled
and the subsequent recompletion program, GOG agreed to reduce the amount of the second
installment from $350,000 to $150,000. The additional working interest that Iskander purchased
was also reduced from 50% to 40%, with the result that Iskander through Satskhenisi Ltd, their
wholly owned subsidiary, had a 90% working interest in the Satskhenisi PSA. On Aug 1, 2017,
Block Energy purchased Satskhenisi Ltd, which holds the 90% interest in the Satskhenisi PSA,
from Iskander Energy Corp. Georgia Oil and Gas still owns the remaining 10% interest in the
PSA.
The Satskhenisi PSA is effective until April 2026 with an optional five-year renewal. According
to Block Energy, there are no outstanding work obligations related to the Permit. The provisions
of the agreement are identical to the terms for the Norio Permit that include that 100% of the
revenue from sales of hydrocarbons are available for cost recovery of operating costs before
sharing with the government. Capital costs, including an historic cost recovery pool of US$ 10.276
million, can be recovered from 50% of the production revenue before sharing with the government.
The government pays all taxes from their share of Profit Oil. Profit Oil is split 50/50 until
“Payment Date,” defined as the time when all cumulative revenues from Cost Recovery and Profit
Oil exceed cumulative capital expenditure, including the historic cost recovery pool. After the
Payment Date, the Profit Oil split is 60% for the Government and 40% for the Contractor.

1/1/2018 ver 051418 28 Gustavson Associates
4.4.3 Database
As noted elsewhere in this report, the production history data provided for this field were found to
be incomplete as is the case with most permits and fields located in former Soviet Union states.
Gustavson attempted to reconcile and interpret these data, with the results presented in this report.
The database provided for Satskhenisi consisted of the following information:
Petra Database
This database includes horizon tops (from several operators), several well logs, production, and
perforation data. This database was updated with additional information from various reports and
spreadsheets of production and test information.
Kingdom – SMT Database
A seismic database that contained 2D seismic data, well information and horizon interpretations
was provided. This database was updated with additional information as available. It was found
that the existing 2D seismic data over the Satskhenisi Field is too sparse to image and interpret
with any certainty the multiple thrust faults and horizon boundaries. It was useful to audit the
structural form of the field.
Reports
Several reports from Schlumberger and others with varying data, interpretations and conclusions
along with wellbore diagrams, well histories; production and test information were considered.
Schlumberger had consolidated the available data and created a model of the Gross Rock Volume
for the Maikop and the Chokrak horizons. These results were audited and found to be a reasonable
interpretation for the purposes of estimating resources.
Production
Numerous partial production databases were provided that were consolidated into one master
production database which was used in the analysis. Production history data was provided by
Block Energy in several MS Excel format files and is described below.

1/1/2018 ver 051418 29 Gustavson Associates
Production History Data
We were provided with production history data for the Satskhenisi Field in several Excel format
files. As is frequently the case in former Soviet states, the data was incomplete with monthly
production data missing for the years 1960 through 2007 and 2013 through the end of 2014. Data
time frames were daily for the years 1957 to 1959, monthly for 2008 to 2012 and daily from
January 2015 through August 2017. The previously mentioned report prepared by Schlumberger9
provided cumulative oil, gas and water production volumes through 2008. As shown below, we
have combined the cumulative production from the Schlumberger report with the other data
sources to arrive at an estimate of cumulative production volumes through 2017. The calculation
of cumulative oil production from the various sources is shown in Table 4-2 below.
Table 4-2 Satskhenisi Cumulative Oil Production
Data Source/File Name Reported Volume
Conversion Volume in
Bbl
Schlumberger report: Cumulative production to 01/01/2010
40,260 tonnes 7.6
Bbl/tonne 305,976
Sats Daily Well Production (Oct 1 2008 - Mar 4, 2014).xls:
Production from 01/01/2010 to 01/01/2014 1,133 m3
6.2898 Bbl/m3
7,126
SKN 2014 Monthly Summary production.xlsx:
Production for 2014 797 tonnes 7.6 Bbl/tonne 6,056
Satskhenisi Daily Production 2015 - 2017.xlsx Production from 01/01/2015 to 08/01/2017
7,338 Bbl ------ 7,338
Total Cumulative Oil Production as of 08/01/2017
------ ------ 326,496
4.4.4 Market and Infrastructure
The terrain in the area of the Satskhenisi Block is low relief terraces and ridges interspersed with
small valleys with intermittent streams. The northern portion of the field has topography typical
9 Schlumberger Data and Consulting Services, Almaty: “Geological and Hydrodynamic Modeling of Maikopian Formation and Field Development Plan, Satskhenisi oilfield, Georgia (Part II: Hydrodynamic Modeling)”, prepared for Norio Oil Company, 2010.

1/1/2018 ver 051418 30 Gustavson Associates
of low foothills with elevations ranging from 900 m to 1,100 m. The southern portion is more flat
with elevations ranging from 800 m to 1,100 m. The surface is a mix of pasture, cultivated fields
with shrubs and trees along the natural drainages. Three-phase electrical power is available in the
area. Google Earth imagery indicates that there are numerous paved or gravel lease roads that run
through the field. The village of Satskhenisi occupies the west central portion of the field area.
The surface is predominantly state owned and there are no access issues.
Existing oil storage capacity in the Satskhenisi Field is 750 Bbls (120 m3) in total. In addition to
the in-field storage, Block Energy through its operator Norio Operating Company rents 5,032 Bbl
(800 m3) of storage capacity at a rail siding located at the nearby town of Lilo. As of April 2017,
four wells are being produced (two intermittently) in the Satskhenisi Block.
Oil production is sold to the local market or is transported by rail to the Black Sea port of Batumi.
Under agreement with local oil buyers (Lucky2 Oil Company, etc.), oil production from the
Satskhenisi field is sold to for Brent Crude Index minus US$9.00/Bbl. This differential includes
all marketing and transportation. It is anticipated that similar terms will continue for oil produced
from the Satskhenisi Field.
The Satskhenisi Field produces small quantities of water and consequently has no need for water
disposal infrastructure.
Any associated gas production in the Satskhenisi Field is used on lease or vented. Gas production
volumes have not justified the installation of gas gathering and processing infrastructure. Any
future increases in gas production resulting from the proposed development will be used to fuel
field operations.
4.5 IDENTITY AND RELEVANT EXPERIENCE OF BLOCK ENERGY
Block Energy plc is an exploration and production company focused on the acquisition of
discovered oil fields in and around the Caucuses region. The company was formerly known as
Goldcrest Resources and previously focused on gold exploration. In May 2017, Goldcrest
1/1/2018 ver 051418 31 Gustavson Associates
Resources changed its name to Block Energy plc and shifted the company focus to petroleum
projects with an emphasis on opportunities in the Republic of Georgia. The company has made
strategic hires to bring expertise in the petroleum industry in order to manage its portfolio of
petroleum projects.
1/1/2018 ver 051418 32 Gustavson Associates
5. PETROLEUM GEOLOGY
5.1 EXPLORATION HISTORY
Numerous surface oil seeps have been known and utilized in Georgia (Nibladze and Janiashvili,
2014). Exploration in the country began in the late 19th century with shallow drilling beneath
surface seeps. By 1866, more than 100 shallow wells (less than 100 meters (328 feet)) had been
drilled in eastern Georgia. As oil production grew, two oil refineries were built.
Modern exploration began in 1928 with a deep oil well drilled to 540 meters. This oil discovery
opened the Mirzaani field located in southeast Georgia. Total production is reported at 7.9
MMBBL (Nibladze and Janiashvili, 2014).
After World War II, drilling targets were anticlines identified on seismic. More than 1,300 deep
wells were drilled during the Soviet Era and small discoveries were made.
The state company GruzNeft was the only license holder in the country between 1930 and 1994,
during which time 197 MMBBL were produced. Peak production was achieved in 1981 with rates
around 70 MBOPD. Also during this time, seventeen oil fields were discovered, but only 5 were
commercially successful.
Only two large discoveries were made in the Kura Basin, the Samgori-Patardzeuli-South Dome
(Samgori) Field and its eastward extension, the Ninotsminda Field. The Samgori Field was
discovered in 1974. It has a cumulative production of 210 MMBBL and is still producing. Initial
flow rates in the field were as high as 5,000 BOPD per well. The Ninotsminda Field has produced
12 MMBBL of oil and 8.5 BCF of gas to date and is still being developed. Well flow at rates
around 1,200-1,500 BOPD have been achieved. Performance in both these fields is dependent on
fractures and has been from the thick middle Eocene section. Ninotsminda is significant as 5
horizontal sidetrack re-entries were drilled in the mid/late ‘90’s by Canargo. According to GOG,
these horizontal wells intersected multiple natural fractures and in excess of 4 MMBbls was
1/1/2018 ver 051418 33 Gustavson Associates
produced from these five wells. The program was terminated by Canargo due to the very low oil
prices being realized during this period.
Approximately fifteen companies have held PSA’s in Georgia since 1994, with nine companies at
present. Between 1994 and 2012, 10.7 MMBBL of oil was produced from existing fields, but no
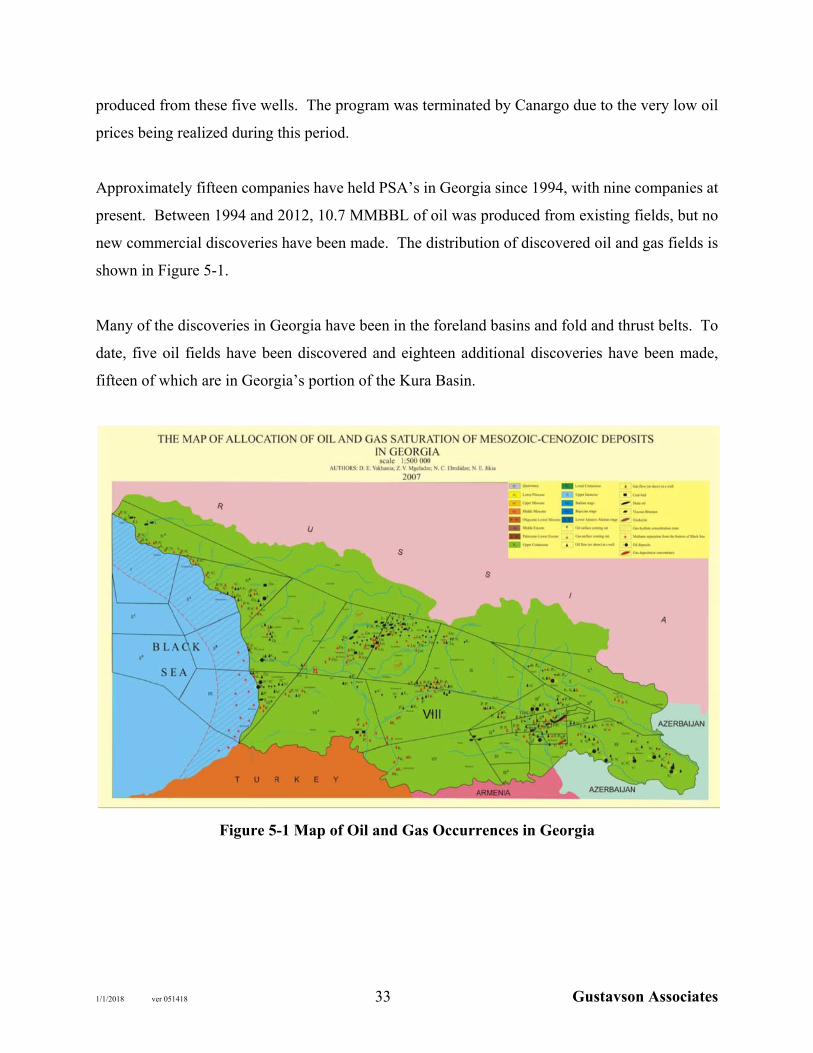
new commercial discoveries have been made. The distribution of discovered oil and gas fields is
shown in Figure 5-1.
Many of the discoveries in Georgia have been in the foreland basins and fold and thrust belts. To
date, five oil fields have been discovered and eighteen additional discoveries have been made,
fifteen of which are in Georgia’s portion of the Kura Basin.
Figure 5-1 Map of Oil and Gas Occurrences in Georgia

1/1/2018 ver 051418 34 Gustavson Associates
5.2 REGIONAL GEOLOGY
5.2.1 Structure
The subject fields are located east of the Black Sea in the Kartli Basin, which is a tectonically
complex area to the south of the Greater Caucasus and to the north of the Achara-Trialet Thrust
Belt or Lesser Caucasus. Oil and gas production has been established primarily from the Rioni
Basin near the Black Sea and the Kartli Basin (also referred to as the Kura Basin) on the eastern
side of Georgia (also known as the Karthaliny or Western or Upper Kura basin) which are flexural
foreland basins formed in Neogene time by loading of the Achara-Trialet Thrust Belt (Lesser
Caucasus) (Figure 5-2). Both basins are bounded on the north by the Greater Caucasus fold and
thrust area, which is composed of shallow marine carbonate rocks. The Achara-Trialet Thrust Belt
is composed of Paleogene age strata formed in a rifted extensional basin (Robinson et al., 1997).
This area is characterized by large anticlines and associated faulting involving Cretaceous through
Paleogene rocks and complex thrust faults. The pre-rift basement rocks include the Dziruli Massif
that now separates the Rioni Basin from the Kartli Basin. The basin complex extends eastward
through Azerbaijan to the Caspian Sea.
Figure 5-2 Map Showing Oil and Gas Fields, Basins, and Mountain Areas
1/1/2018 ver 051418 35 Gustavson Associates
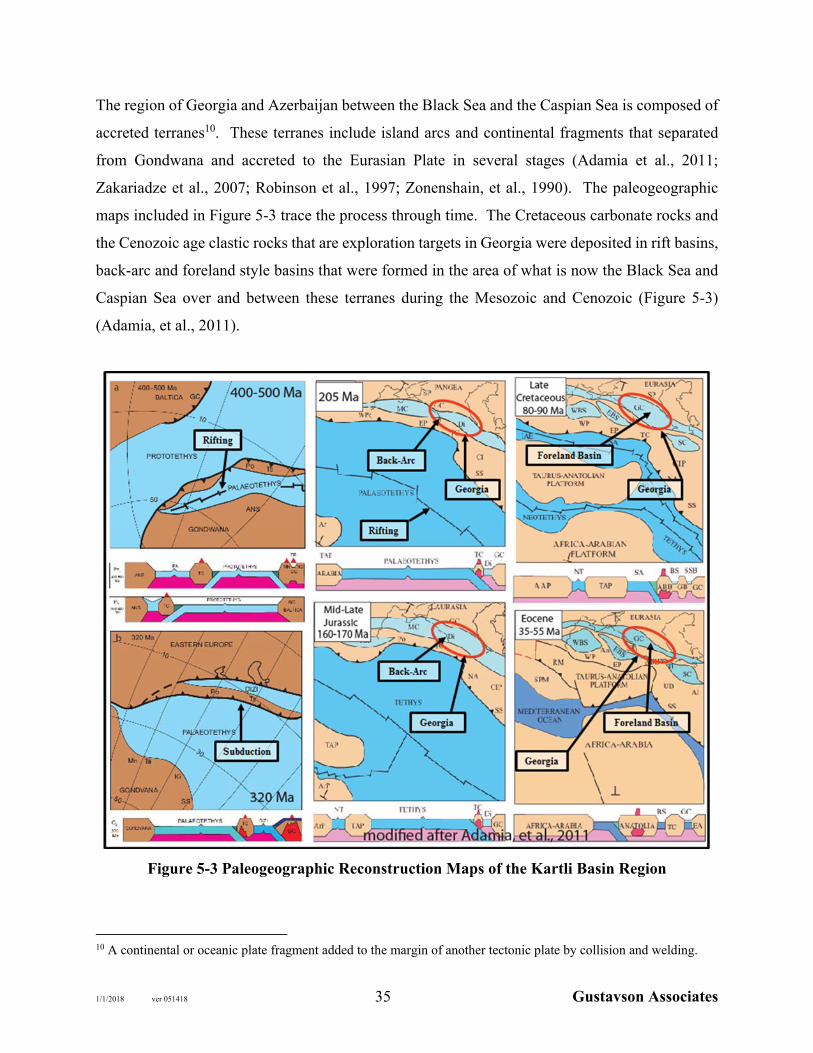
The region of Georgia and Azerbaijan between the Black Sea and the Caspian Sea is composed of
accreted terranes10. These terranes include island arcs and continental fragments that separated
from Gondwana and accreted to the Eurasian Plate in several stages (Adamia et al., 2011;
Zakariadze et al., 2007; Robinson et al., 1997; Zonenshain, et al., 1990). The paleogeographic
maps included in Figure 5-3 trace the process through time. The Cretaceous carbonate rocks and
the Cenozoic age clastic rocks that are exploration targets in Georgia were deposited in rift basins,
back-arc and foreland style basins that were formed in the area of what is now the Black Sea and
Caspian Sea over and between these terranes during the Mesozoic and Cenozoic (Figure 5-3)
(Adamia, et al., 2011).
Figure 5-3 Paleogeographic Reconstruction Maps of the Kartli Basin Region
10 A continental or oceanic plate fragment added to the margin of another tectonic plate by collision and welding.

1/1/2018 ver 051418 36 Gustavson Associates
The collision and rotation of the Africa-Arabian plate with the Eurasian Plate resulted in the Alpine
Orogeny, which formed the Rioni and Kartli basins and the folded and thrusted structural traps
that are being explored for hydrocarbons. The structural complexity of the area is shown in Figure
5-4.
Figure 5-4 Regional Structural Map Showing Major Faults
5.2.2 Stratigraphy
Paleozoic and Mesozoic rocks in the Kartli (Kura) Basin are dominated by marine carbonates.
Cretaceous age marine carbonates give way to marine sandy limestones and clastics during the
Paleocene (Figure 5-5). Cenozoic age sedimentary rocks consist of marine sandstone, clay, and
limestone that can total approximately 9 meters of section where present. Igneous intrusions are
also present on the surface as well as basement highs.
The Eocene was characterized by the advent of submarine volcanic eruptions that deposited lava,
tuffs and tuffaceous turbidites interbedded with marine clastic and marine carbonate deposits.
Reservoirs of Middle Eocene age are characterized as volcanoclastic interbedded with siltstones
and some volcanic andesitic flows. The volcanoclastic sandstones were deposited as gravity flows,
1/1/2018 ver 051418 37 Gustavson Associates
or turbidites, in deep marine settings. The reservoir quality of these volcanoclastic sandstones has
reportedly been improved by diagenetic alteration to laumontite and by fracturing (Robinson et al.,
1997). Volcanism decreased as shallow marine clastic and carbonate deposits dominated the Late
Eocene.
Oligocene age rocks contain interbedded sandstone and shale deposited in shallow marine
depositional settings in restricted basins. The Oligocene succession of sandstones and gypsiferous
clays continues into the Miocene. Oligocene through early Miocene is regionally known as
Maikopian.
Miocene age deposits range from marine turbidites to fluvial and deltaic deposits indicating a
change from marine to shallow marine to continental setting. The Maikop Series of Oligocene to
Early Miocene age contains both source rocks and reservoir rocks that produce oil in the Kura
Basin. The Chokrak Series consists of Middle Miocene rocks that are productive of oil in the Norio
Field and the Sarmatian Series consists of Upper Miocene rocks and are also productive in the
basin.
The Norio field produces from the Middle Miocene Chorak and has tested oil and gas from the
Maikop and the upper Miocene age Sarmatian rocks. This reservoir interval includes sandstones,
clays and some limestones, the Maikop typically grades into the Chokrak (from bottom up) with a
decrease in carbonate content. The productive interval in the Satskhenisi field, which is located to
the east of Norio field along strike of the structure, is currently only in the lower Miocene age
Maikop clastic reservoirs. The West Rustavi hydrocarbon production and occurrence is contained
within the Eocene and Upper Cretaceous aged rocks.

1/1/2018 ver 051418 38 Gustavson Associates
Figure 5-5 Stratigraphic Column of the Kura Basin Region (modified by Adamia et al., 2011; Alania et al., 2005; Papava, 1976)

1/1/2018 ver 051418 39 Gustavson Associates
5.2.3 Petroleum System
The Kura Basin has active petroleum systems as evidenced by the presence of natural surface oil
seeps, oil and gas shows and tests in wells, and oil and gas production.
A petroleum system is a pod of mature source rocks and all the discovered and undiscovered
hydrocarbon accumulations that are or can be sourced from it11. Petroleum systems are based on
the factors affecting hydrocarbon accumulations including the following:12
Trap: a structure or limit to the quality of the reservoir rock that is capable of holding
hydrocarbons
Seal: a layer or rock that is impermeable to hydrocarbon and prevents the hydrocarbon
from escaping the trap
Reservoir rock: one or more rock layers that has sufficient porosity and permeability to
store hydrocarbons
Source Rock: a rock layer in the region that has sufficient organic content to provide for
hydrocarbons
Maturation: the burial of the source rock sufficient to generate hydrocarbons from the
organic material within the source rock
Migration: the path of movement of the generated hydrocarbons from the source rock to a
trap
Timing: the events must occur in the correct order to create and preserve a hydrocarbon
accumulation. For example, the trap and seal of the reservoir rock must be present when
migration of the hydrocarbons occurs.
The Trap and Seal can be combined into a single aspect for evaluation since they are closely related
as are the Migration and Timing aspects can be combined into a single aspect.
11 Magoon and Dow, 1994 12 Magoon, 1988
1/1/2018 ver 051418 40 Gustavson Associates
5.2.3.1 Source Rocks
Intervals of potential source rock shown in Figure 5-5 were deposited as marine shale in the Tethys
Ocean during the Cretaceous period and marine shale deposited in back-arc-basins during the
Paleogene period, and the Neogene period, as depicted in Figure 5-3. The Vitrinite reflectance
(Ro) values shown in Figure 5-5 are a measure of maturity of the kerogen organic material within
a potential source rock and the stage of oil or gas generation the organic material has reached.
Numerous source rocks have been investigated for the oils found in the Kartli (Kura) Basin and
the Lesser Caucasus. These consist of shale, chalkstone, and mudrock of Cretaceous, Paleogene
and Neogene age (Gudushauri and Sanishvili, 2000) (Table 5-1). Cretaceous Aptian and Albian
age marl source rocks have also been identified. Jurassic rocks are also potential source rocks.
Much of the historic production from wells in eastern Georgia is considered to be sourced from
the Oligocene-Miocene age Maikop Series. The total organic carbon content typically ranges
between 0.3 and 1.6% (Strait and Georgian, 2011). Table 5-1 shows the organic content of some
source rocks of Neogene (N), Paleogene (P), and one Cretaceous (K) sample.
Oil typing was done on produced oils, well head seeps, and natural oil seep samples from the
Shromisubani, Natanebi, Guliani, and Okumi fields in West Georgia, the Uplistsikhe field and the
surface at Akhalkalaki in the Kartli Basin and Vedzebi North and Ninotsminda fields in East
Georgia (Robinson, et al., 1997). Comparison with extracts from upper Eocene rocks in two wells
in the Kavtiskhevi field in the Kartli basin indicated these upper Eocene rocks were the source of
the oil (Robinson, et al., 1997). Other oils were considered to be of mixed multi-migration origin,
interpreted as originating from source rocks of Tertiary to Late Cretaceous in age (Robinson, et
al., 1997). An analysis of oil from the Vedzebi North discovery suggests a Late Cretaceous age
source rock for this oil.
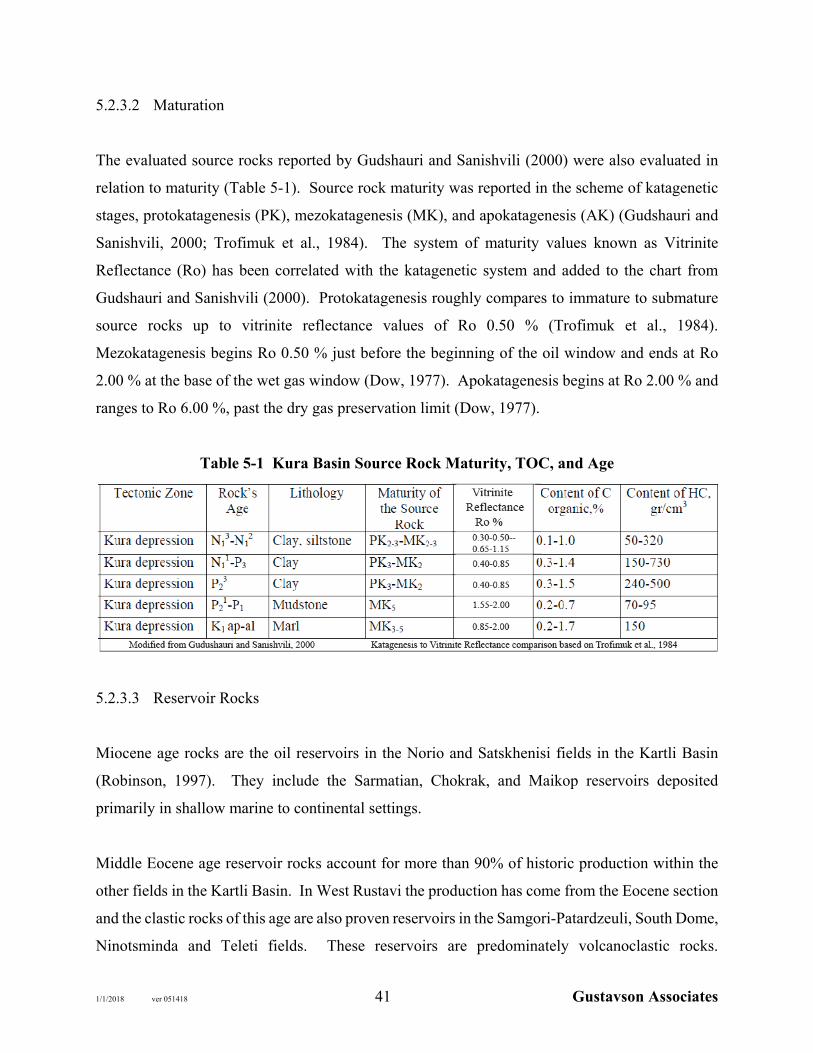
1/1/2018 ver 051418 41 Gustavson Associates
5.2.3.2 Maturation
The evaluated source rocks reported by Gudshauri and Sanishvili (2000) were also evaluated in
relation to maturity (Table 5-1). Source rock maturity was reported in the scheme of katagenetic
stages, protokatagenesis (PK), mezokatagenesis (MK), and apokatagenesis (AK) (Gudshauri and
Sanishvili, 2000; Trofimuk et al., 1984). The system of maturity values known as Vitrinite
Reflectance (Ro) has been correlated with the katagenetic system and added to the chart from
Gudshauri and Sanishvili (2000). Protokatagenesis roughly compares to immature to submature
source rocks up to vitrinite reflectance values of Ro 0.50 % (Trofimuk et al., 1984).
Mezokatagenesis begins Ro 0.50 % just before the beginning of the oil window and ends at Ro
2.00 % at the base of the wet gas window (Dow, 1977). Apokatagenesis begins at Ro 2.00 % and
ranges to Ro 6.00 %, past the dry gas preservation limit (Dow, 1977).
Table 5-1 Kura Basin Source Rock Maturity, TOC, and Age
5.2.3.3 Reservoir Rocks
Miocene age rocks are the oil reservoirs in the Norio and Satskhenisi fields in the Kartli Basin
(Robinson, 1997). They include the Sarmatian, Chokrak, and Maikop reservoirs deposited
primarily in shallow marine to continental settings.
Middle Eocene age reservoir rocks account for more than 90% of historic production within the
other fields in the Kartli Basin. In West Rustavi the production has come from the Eocene section
and the clastic rocks of this age are also proven reservoirs in the Samgori-Patardzeuli, South Dome,
Ninotsminda and Teleti fields. These reservoirs are predominately volcanoclastic rocks.
1/1/2018 ver 051418 42 Gustavson Associates
Reservoir properties are good where tuffaceous rocks have been partially altered to laumontite,
which has increased average porosity to 12 percent and average permeability to 15 millidarcies
(Robinson, 1997). Microfractures within the altered laumontite intervals and tectonic fractures
also enhance reservoir permeability.
Cretaceous reservoir rocks are productive in the North Caucasus, particularly the Terek-Caspian
Basin of Russia (Ulmishek, 2001). In the North Caucasus Cretaceous carbonate reservoirs produce
at rates from 3,000 to 15,000 barrels of oil per day. Recovery factors in these reservoirs are
reportedly 50 percent (Morariu and Noual, 2009). The Cretaceous reservoirs consist of carbonate
rocks where the normally low porosity and permeability have been enhanced by fracturing due to
tectonic movement (Ulmishek, 2001).
5.2.3.4 Traps and Seals
The historic exploration targets in Georgia have been traps involving Eocene strata (Robinson et
al., 1997). There are anticlines present that have been defined by surface mapping and have been
drilled. Some of these structures may also have exploration potential in deeper Cretaceous and
Jurassic age strata. Additional traps include sub-thrust anticlines and other thrust related traps that
are not detectable from surface geologic mapping. Seismic data are necessary to delineate these
traps and find exploration targets. The shallower Miocene reservoirs are cut by multiple faults
creating compartment traps sealed by the faults and overlying low permeability rocks.
Oil accumulations in the North Caucasus and in Georgia are mainly in brachia anticlines and
monoclines, complicated by thrust faults (Norio-Satskhenisi, Malgobek-Voznensk, Siazan-
Nardaran, etc.). Two reservoir types are developed in both areas: layered and lithologically trapped
ones. The most developed ones are roof deposits and layered-screened reservoirs. The Maikop and
Middle Miocene deposits are mainly multi-layered.

1/1/2018 ver 051418 43 Gustavson Associates
5.3 NORIO FIELD
5.3.1 Exploration and Development History
The exploration of Norio oil field area commenced in 1938. During 1938-40 the exploration efforts
were mainly focused on the oil-saturated Maikopian section on the north flank of the Norio-
Khashmi anticline. During this period, commercial oil was discovered in the Middle Miocene
Chokrak reservoirs on the northern limb of the anticline. After this, the entire exploration effort
concentrated on the oil-bearing features of the Middle Miocene. During World War II, through
1942-45, no drilling operations were conducted, but they were restarted in 1946.
During the time period of 1938-1958 a total of 52 exploration and development wells were drilled
in Norio. After the collapse of the Soviet Union, funding of oil and gas exploration and
development ceased followed by the civil wars in Georgia which completely ruined its oil and gas
industry.13 The production history of the Norio field is shown on Figure 5-6.
Figure 5-6 Norio Field Production History Plot
13 History of Petroleum Geology in Georgia; M. Nibladze and A. Janiashvili
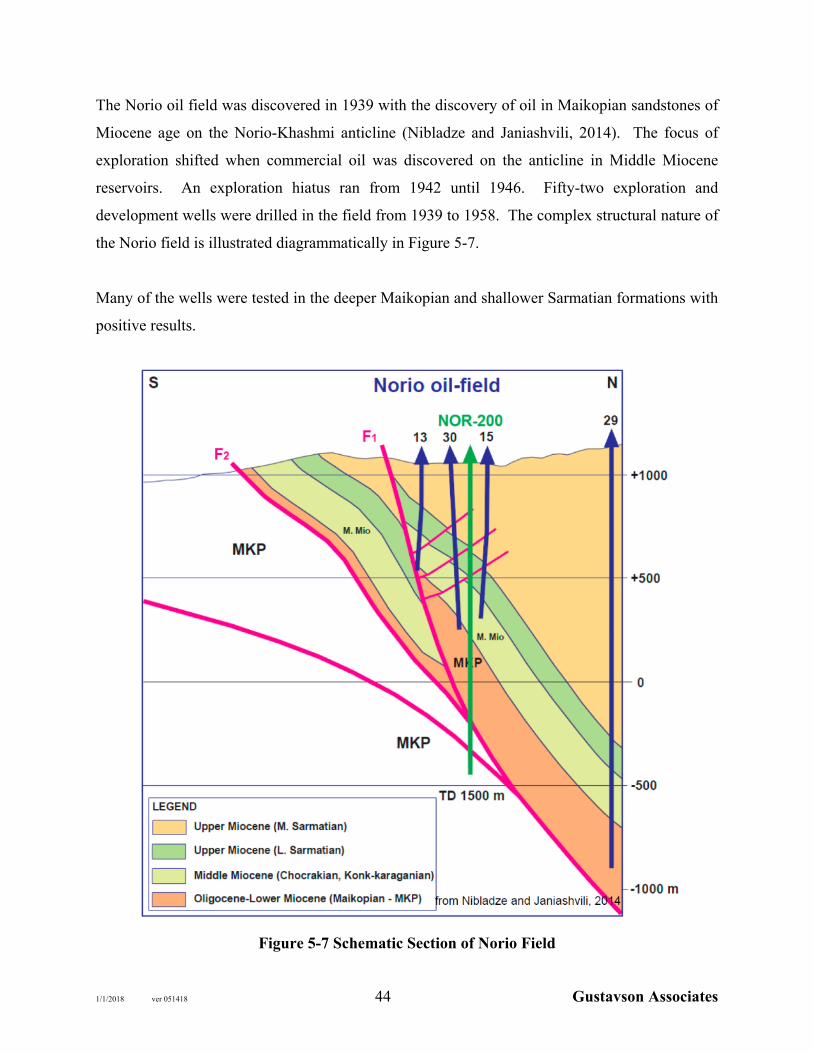
1/1/2018 ver 051418 44 Gustavson Associates
The Norio oil field was discovered in 1939 with the discovery of oil in Maikopian sandstones of
Miocene age on the Norio-Khashmi anticline (Nibladze and Janiashvili, 2014). The focus of
exploration shifted when commercial oil was discovered on the anticline in Middle Miocene
reservoirs. An exploration hiatus ran from 1942 until 1946. Fifty-two exploration and
development wells were drilled in the field from 1939 to 1958. The complex structural nature of
the Norio field is illustrated diagrammatically in Figure 5-7.
Many of the wells were tested in the deeper Maikopian and shallower Sarmatian formations with
positive results.
Figure 5-7 Schematic Section of Norio Field
1/1/2018 ver 051418 45 Gustavson Associates
The Satskhenisi oil field is located east of the Norio field and was discovered in 1956. This field
consists of 15 wells and produced from Maikop sandstones of Oligocene through Early Miocene
age. Total oil produced from the Norio and Satskhenisi fields is reported as approximately 2.1
MMBBL (Nibladze and Janiashvili, 2014.)
5.3.2 Description of Reservoirs
The target reservoir rocks for the Norio Field are the Chorak, Maikop and Sarmatian. The Norio
field is made up of volcanic rock sourced clastic sediments that have had multiple thrust faults
superimposed on the structure. These thrust faults are difficult to discern on the current 2D seismic
data set; however, they are apparent in the NOR201 well (Figure 5-8) image log. The presence of
multiple faults likely enhances production in the different reservoirs.
5.3.2.1 Chokrak
Based on the well information, which is incomplete, the Chokrak reservoir is compartmentalized
by the faulting and stratigraphic variations. The well test and production information and the
Georgia Oil and Gas (GOG) correlations indicate that all of the production in Norio has come from
the Chokrak.
The existing data is not adequate to determine the exact volume or geometry of the multiple
Chokrak reservoirs. There are disagreements by the various operators (Figure 5-9) and ambiguity
as to the proper well-to-well correlations of the Chokrak section. The well log and test data is
incomplete. Therefore, the methodology employed to estimate STOOIP volumes primarily used
the provided well data including logs, cross-sections, wellbore diagrams, test information and
production information. These data were pieced together in order to estimate the updip and
downdip reservoir limits as well as lateral extent.
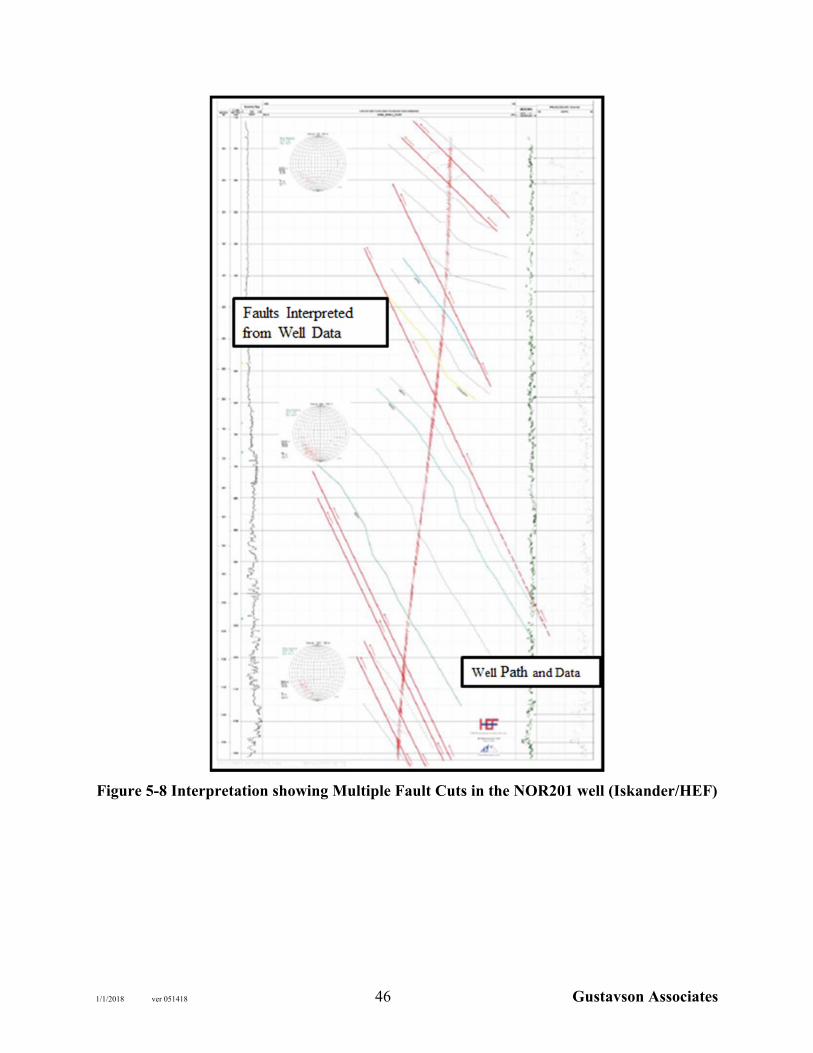
1/1/2018 ver 051418 46 Gustavson Associates
Figure 5-8 Interpretation showing Multiple Fault Cuts in the NOR201 well (Iskander/HEF)
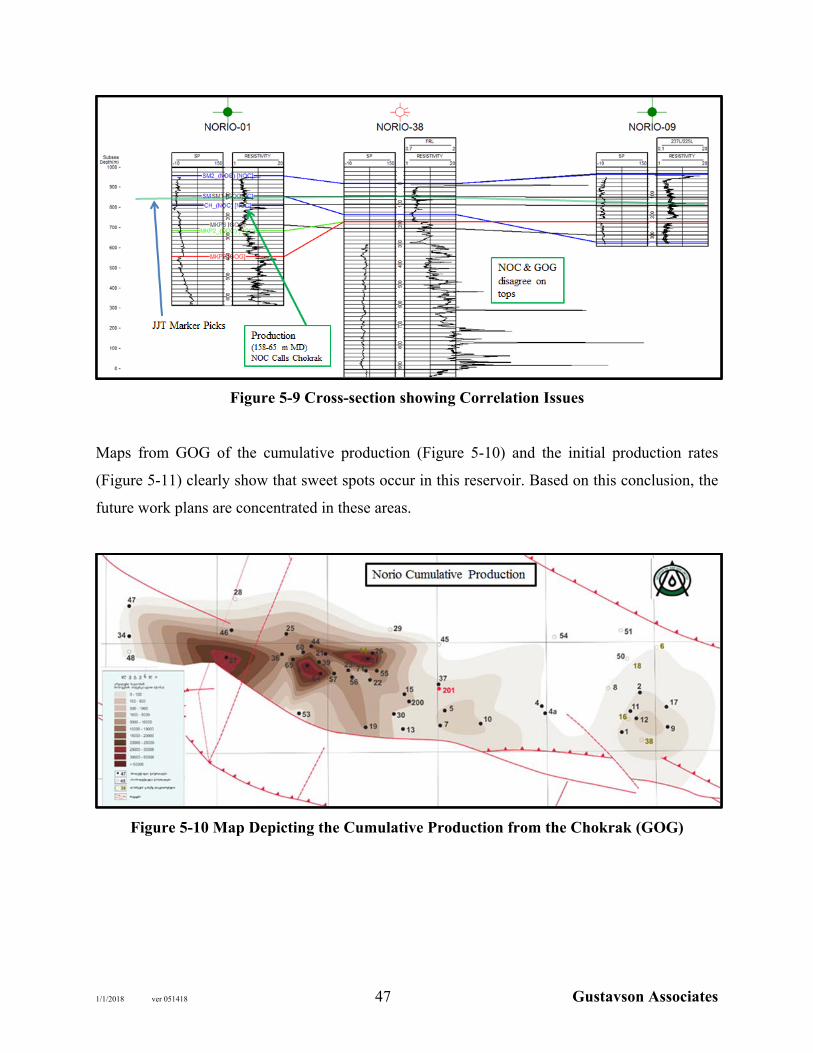
1/1/2018 ver 051418 47 Gustavson Associates
Figure 5-9 Cross-section showing Correlation Issues
Maps from GOG of the cumulative production (Figure 5-10) and the initial production rates
(Figure 5-11) clearly show that sweet spots occur in this reservoir. Based on this conclusion, the
future work plans are concentrated in these areas.
Figure 5-10 Map Depicting the Cumulative Production from the Chokrak (GOG)

1/1/2018 ver 051418 48 Gustavson Associates
Figure 5-11 Map Depicting the Initial Production Rates from the Chokrak (GOG)
The net sand data in the Petra Project attributed to Georgia Oil and Gas are the basis for the Net
Sand Map (Figure 5-12). This isopachous map was used to determine the average net reservoir
sand in the Chorak.
The reservoir area limits for the Chorak (Figure 5-13) were interpreted by using the well test and
log data that was available. The P90 area was estimated using the lowest known production
perforations and the P10 area was estimated by water and no-flow tests.
5.3.2.2 Maikop
The Maikop, based on an ambiguous report, apparently tested at a rate of 70 BO/D from the NOR
39 well in 1959 but the well production history starts in 1961. The Maikop produces in the nearby
Satskhenisi field to the east along the same trend.

1/1/2018 ver 051418 49 Gustavson Associates
5.3.2.3 Sarmatian
Oil and gas shows have been observed in the Sarmatian section in a number of wells in the field.
The NOR 37 well tested oil and gas, the NOR 9 well tested only gas and the well Nor 200 was
recompleted in the Sarmatian and fracture stimulated by Iskander energy producing 220 Bbls of
light oil and 900 Bbls of water. Other reported well tests indicated a tight or wet Sarmatian
formation.
5.3.3 Analysis of Net Pay
For the Chokrak reservoir, the net sand data in the Petra Project attributed to Georgia Oil and Gas
are the basis for the Net Sand Map (Figure 5-12). This isopach was used to determine the average
reservoir quality sand in the Chokrak.
For the Maikop and Sarmatian reservoirs, the net pay range was derived from reports in the
database and the petrophysical analysis from the NOR 201 well. The net pay ranges used in the
reserve and resources estimates for all three reservoirs are presented in Table 5-2.
Table 5-2 Summary of Norio Net Pay (feet)
Reservoir, feet Minimum Most Likely Maximum
Sarmatian 3.3 15.0 33.0
Chokrak 32.8 52.5 98.4
Maikop 36.0 72 105
5.3.4 Reservoir Limits
5.3.4.1 Chokrak
The reservoir area limits for the Chorak (Figure 5-13) was interpreted by using the well test and
log data that was available. The P90 area of 630.6 acres (Area A) was estimated using the lowest
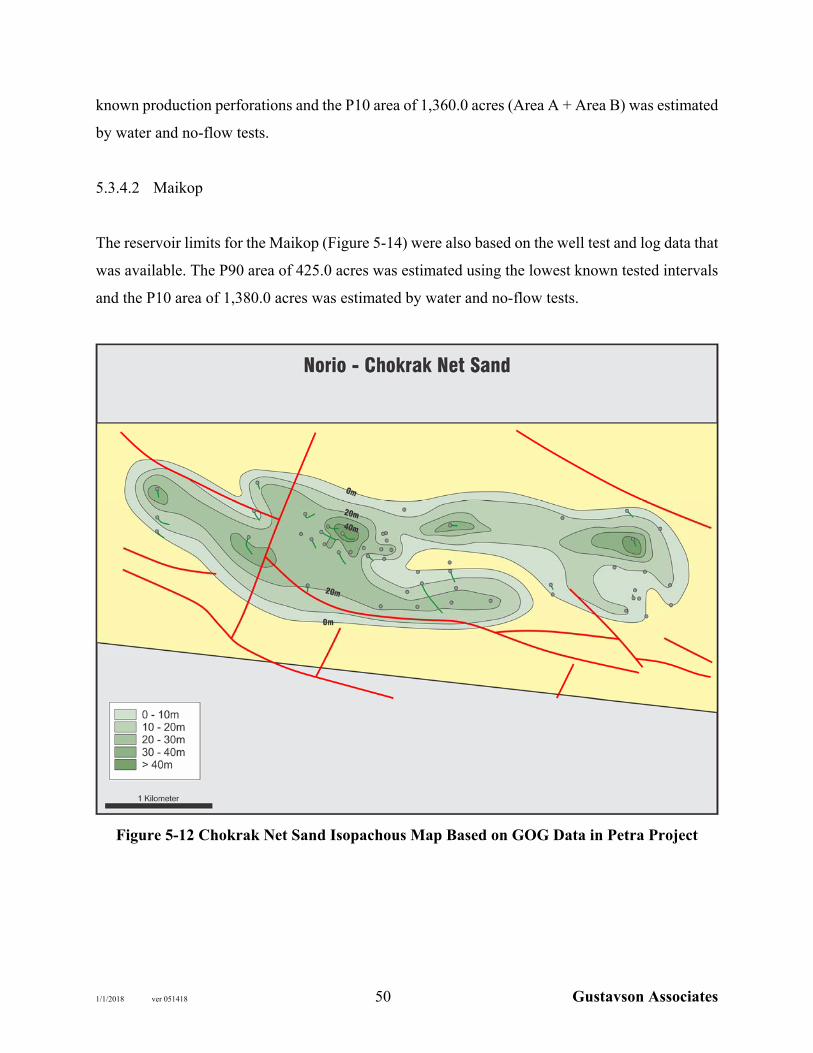
1/1/2018 ver 051418 50 Gustavson Associates
known production perforations and the P10 area of 1,360.0 acres (Area A + Area B) was estimated
by water and no-flow tests.
5.3.4.2 Maikop
The reservoir limits for the Maikop (Figure 5-14) were also based on the well test and log data that
was available. The P90 area of 425.0 acres was estimated using the lowest known tested intervals
and the P10 area of 1,380.0 acres was estimated by water and no-flow tests.
Figure 5-12 Chokrak Net Sand Isopachous Map Based on GOG Data in Petra Project
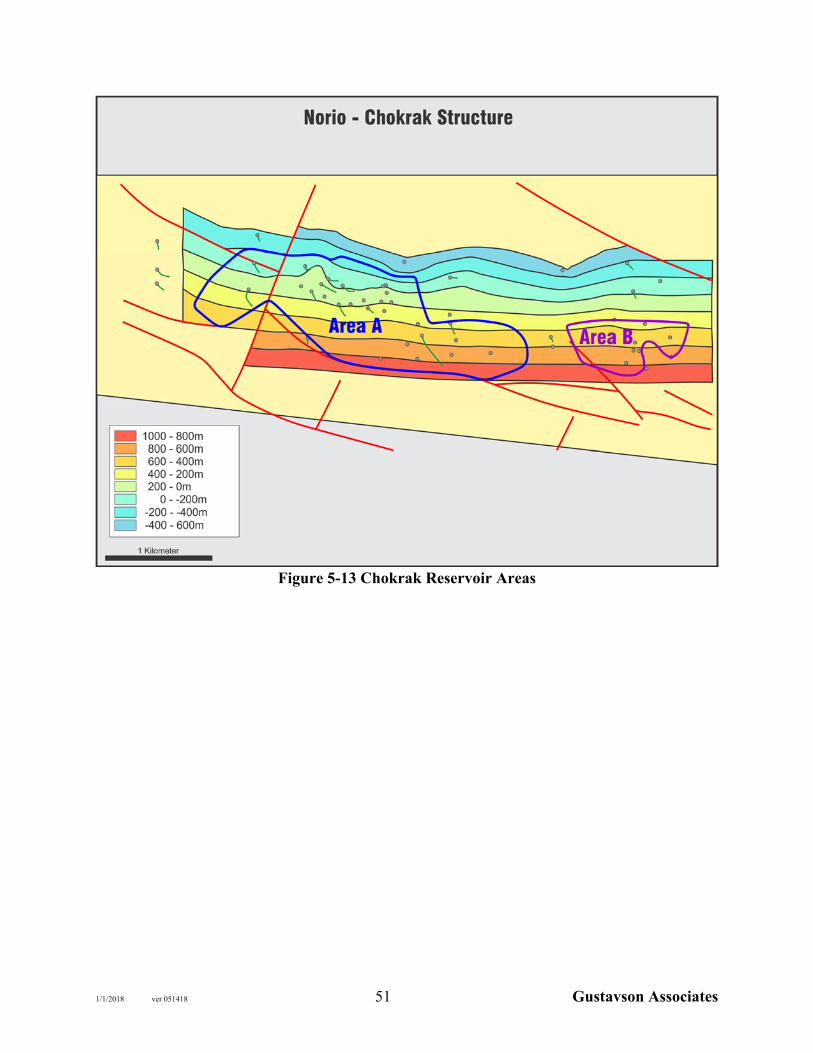
1/1/2018 ver 051418 51 Gustavson Associates
Figure 5-13 Chokrak Reservoir Areas
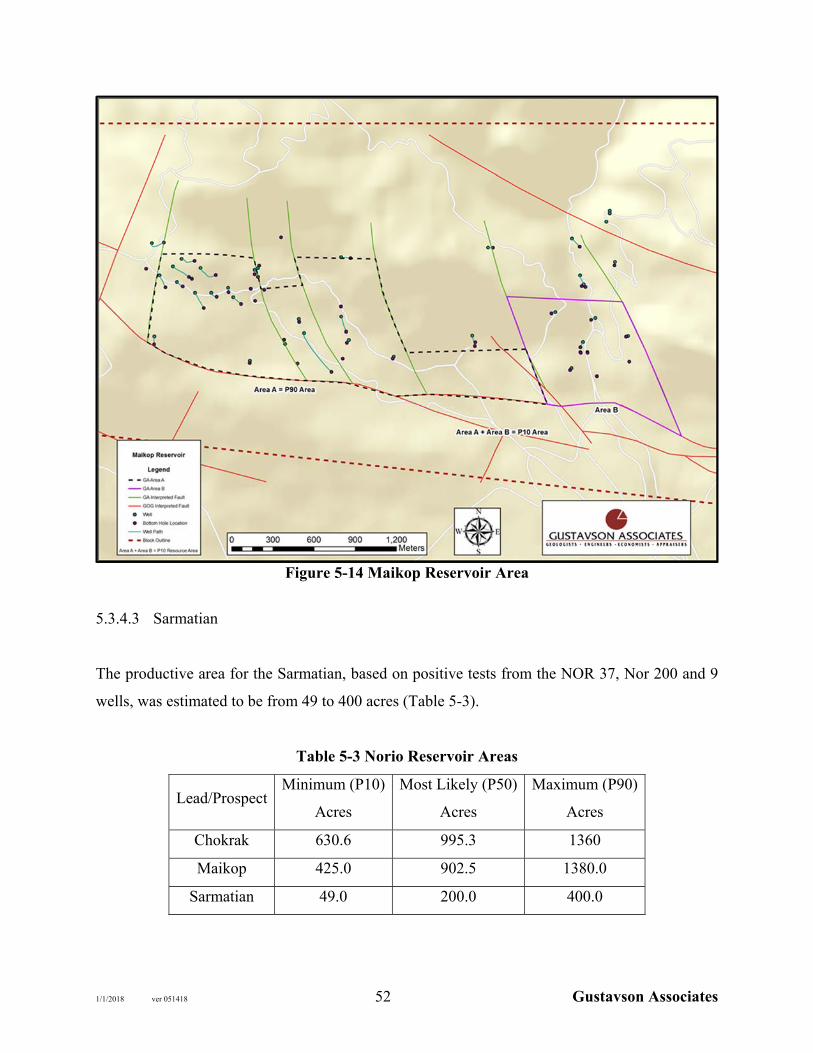
1/1/2018 ver 051418 52 Gustavson Associates
Figure 5-14 Maikop Reservoir Area
5.3.4.3 Sarmatian
The productive area for the Sarmatian, based on positive tests from the NOR 37, Nor 200 and 9
wells, was estimated to be from 49 to 400 acres (Table 5-3).
Table 5-3 Norio Reservoir Areas
Lead/Prospect Minimum (P10)
Acres
Most Likely (P50)
Acres
Maximum (P90)
Acres
Chokrak 630.6 995.3 1360
Maikop 425.0 902.5 1380.0
Sarmatian 49.0 200.0 400.0
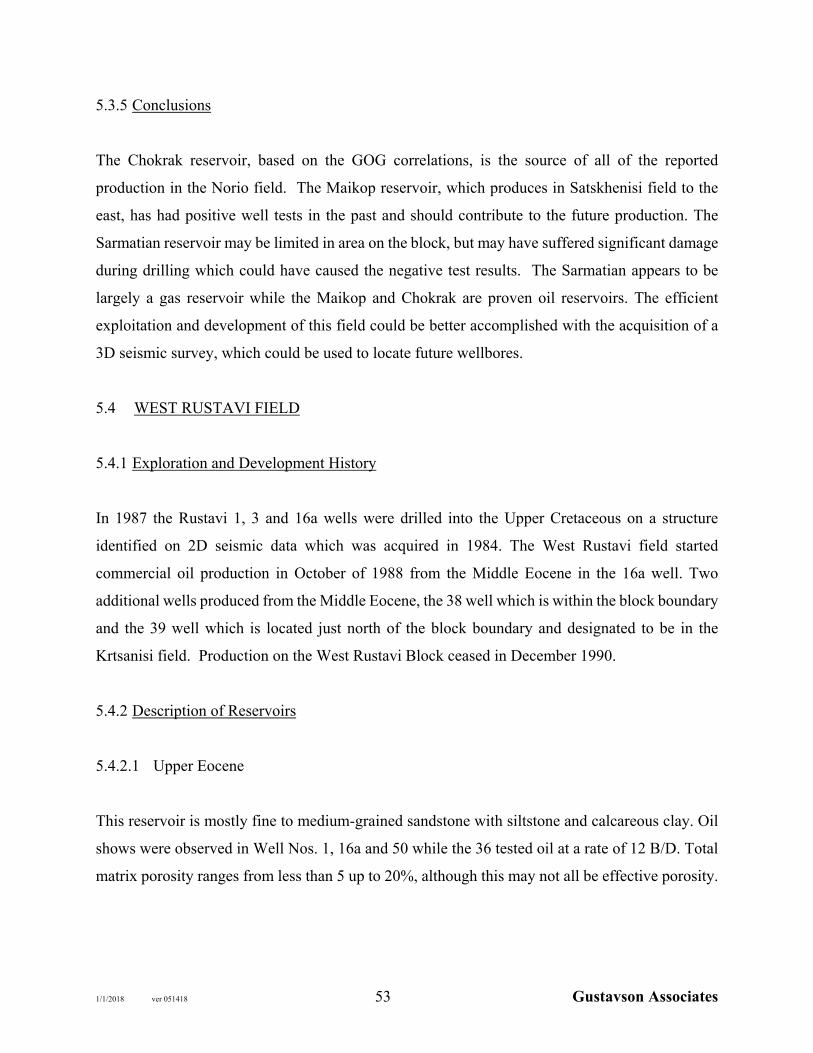
1/1/2018 ver 051418 53 Gustavson Associates
5.3.5 Conclusions
The Chokrak reservoir, based on the GOG correlations, is the source of all of the reported
production in the Norio field. The Maikop reservoir, which produces in Satskhenisi field to the
east, has had positive well tests in the past and should contribute to the future production. The
Sarmatian reservoir may be limited in area on the block, but may have suffered significant damage
during drilling which could have caused the negative test results. The Sarmatian appears to be
largely a gas reservoir while the Maikop and Chokrak are proven oil reservoirs. The efficient
exploitation and development of this field could be better accomplished with the acquisition of a
3D seismic survey, which could be used to locate future wellbores.
5.4 WEST RUSTAVI FIELD
5.4.1 Exploration and Development History
In 1987 the Rustavi 1, 3 and 16a wells were drilled into the Upper Cretaceous on a structure
identified on 2D seismic data which was acquired in 1984. The West Rustavi field started
commercial oil production in October of 1988 from the Middle Eocene in the 16a well. Two
additional wells produced from the Middle Eocene, the 38 well which is within the block boundary
and the 39 well which is located just north of the block boundary and designated to be in the
Krtsanisi field. Production on the West Rustavi Block ceased in December 1990.
5.4.2 Description of Reservoirs
5.4.2.1 Upper Eocene
This reservoir is mostly fine to medium-grained sandstone with siltstone and calcareous clay. Oil
shows were observed in Well Nos. 1, 16a and 50 while the 36 tested oil at a rate of 12 B/D. Total
matrix porosity ranges from less than 5 up to 20%, although this may not all be effective porosity.

1/1/2018 ver 051418 54 Gustavson Associates
5.4.2.2 Middle Eocene
The Middle Eocene is characterized by volcaniclastics with a total thickness that ranges from 194
meters to 287 meters thinning to the south. The fractured tuffaceous sandstone acts as the reservoir
portion of this interval. Porosities vary from 3.3% to 18.0% as seen in the 16a and 38 wells with
effective porosities reported from 1.6 to 14.0%. This reservoir produced oil from the 16a and 38
wells on the block and the 39 well just north of the block. In addition, the 31, 34, 36, 37, 50 and
51 wells on the block had tests at a rate of 3 to 9.4 B/D of oil. The 2 and 21 wells to the east, which
are fault separated from West Rustavi, produced gas and condensate from this horizon.
5.4.2.3 Lower Eocene
The Lower Eocene is described as two separate units. The lower section is characterized by
calcareous siltstone, mudstone, fine grained sandstone and occasional marl. The upper section
contains mostly sandstone, clay, siltstone and mudstone. Total thickness ranges from 1,150meters
in the west as seen in the Kumisi 1 well to 1,272 meters as seen in the 16a well. Matrix porosity is
approximately 6.0% and the zone was tested in the 1, 30 and 3 wells at rates of 1.0 MMcf/D, 0.9
MMcf/D and 0.3 MMcf/D respectively while gas shows were also noted in the 2 and other wells
in the area. An effective porosity of 14.5% has been reported in the 16a; however, there are no
reports of this interval being tested.
5.4.2.4 Upper Cretaceous
Only three wells in West Rustavi have penetrated the Upper Cretaceous, the 1, 3 and 16a. The 16a
well had been tested at a rate of 1 MMcf/D gas and the 3 well, which is fault separated from the
16a, had an oil show with a 38oAPI gravity. In addition, multiple gas shows were reported from
the Kumisi 1 well to the west. The horizon can be separated into two distinct units: the upper is
made up of calcareous sediments while the lower is made up of volcanoclastic sediments. Matrix
porosity ranges from less than 4.0% up to 8.4% based on information from the 16a well. Effective
porosities can be as low as 0.8% as seen in the Chechnya Field. Gas has been produced from the
nearby Teleti and Varketili fields from this horizon.

1/1/2018 ver 051418 55 Gustavson Associates
5.4.3 Analysis of Net Pay
The net pay limits for the West Rustavi field were derived from several reports which in turn
largely relied upon the core analysis summary from the Rustavi area. The summary of Net Pay
thickness for the West Rustavi reservoirs used in the reserve and resources estimates is in Table
5-4.
Table 5-4 Net Pay Thickness for West Rustavi (feet)
Reservoir, feet Minimum Most Likely Maximum
Upper Eocene 33 75 98
Middle Eocene 72 180 360
Lower Eocene 164 198 262
Upper Cretaceous 52 130 360
5.4.4 Reservoir Limits
The maps used for reserve and resource estimates were based on well control, test information and
seismic data. The field area is broken up into numerous fault blocks by nearly vertical faults that
apparently have contributed to a fracture system that enhances the low matrix porosity. The
conclusion from the interpretation is that the fault block that contains the 16a and 38 wells is high
relative to the east-west oriented fault blocks that occur to the north and south. This is the basis for
the determination of the Minimum areas for all of the reservoirs in this block. The reservoir quality
appears to deteriorate to the west based on results from the Kumisi wells, located off the block.
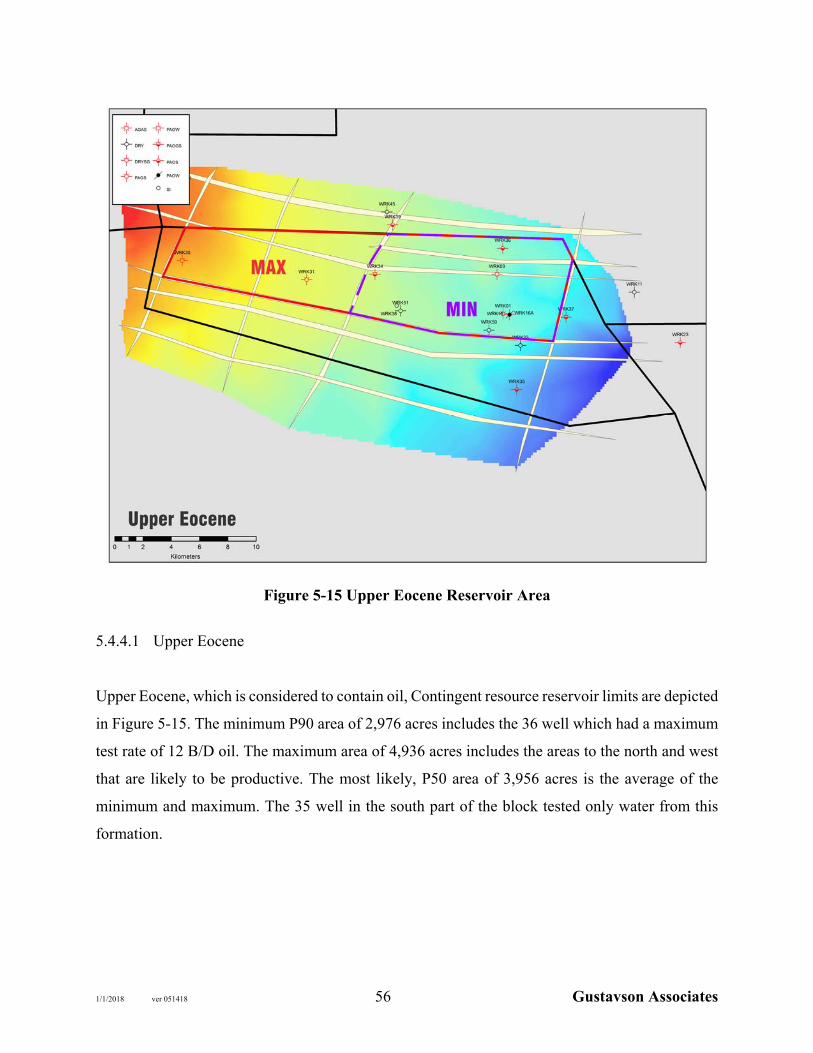
1/1/2018 ver 051418 56 Gustavson Associates
Figure 5-15 Upper Eocene Reservoir Area
5.4.4.1 Upper Eocene
Upper Eocene, which is considered to contain oil, Contingent resource reservoir limits are depicted
in Figure 5-15. The minimum P90 area of 2,976 acres includes the 36 well which had a maximum
test rate of 12 B/D oil. The maximum area of 4,936 acres includes the areas to the north and west
that are likely to be productive. The most likely, P50 area of 3,956 acres is the average of the
minimum and maximum. The 35 well in the south part of the block tested only water from this
formation.

1/1/2018 ver 051418 57 Gustavson Associates
Figure 5-16 Middle Eocene Reservoir Area
5.4.4.2 Middle Eocene
Middle Eocene reserve and contingent resource reservoir limits are depicted in Figure 5-16. The
minimum P90 area, 2,164 acres includes the 16a and 38 wells which produced a total of 32 MBbl
from 1986 to 2001. The most likely, P50, area of 4,577 acres includes the area just south of the 39
well which produced oil just off the block. The maximum, P10, area of 5,398 acres includes the
area to the west that is likely to be productive. The Middle Eocene is a proven oil reservoir in this
block.

1/1/2018 ver 051418 58 Gustavson Associates
Figure 5-17 Lower Eocene Reservoir Area
5.4.4.3 Lower Eocene
Lower Eocene contingent resource reservoir limits are depicted in Figure 5-17. The minimum,
P90, area of 2,660 acres includes the 1 and 3 wells which tested gas at rates of 1.8 MMcf/D and
0.32 MMcf/D, respectively. The maximum area of 4,598 acres includes the area to the west
considered to be productive. The most likely area of 3,629 acres is the average of the minimum
and maximum areas and contains the 30 well which had tested gas at a rate of 0.9 MMcf/D.
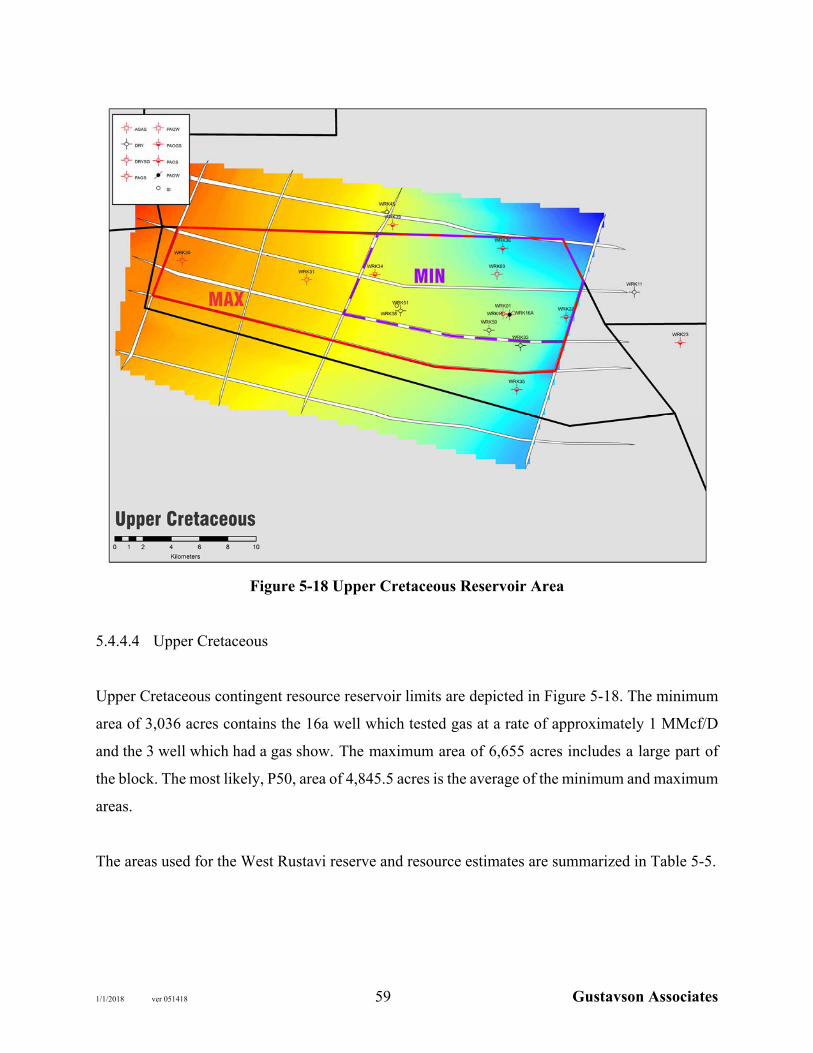
1/1/2018 ver 051418 59 Gustavson Associates
Figure 5-18 Upper Cretaceous Reservoir Area
5.4.4.4 Upper Cretaceous
Upper Cretaceous contingent resource reservoir limits are depicted in Figure 5-18. The minimum
area of 3,036 acres contains the 16a well which tested gas at a rate of approximately 1 MMcf/D
and the 3 well which had a gas show. The maximum area of 6,655 acres includes a large part of
the block. The most likely, P50, area of 4,845.5 acres is the average of the minimum and maximum
areas.
The areas used for the West Rustavi reserve and resource estimates are summarized in Table 5-5.
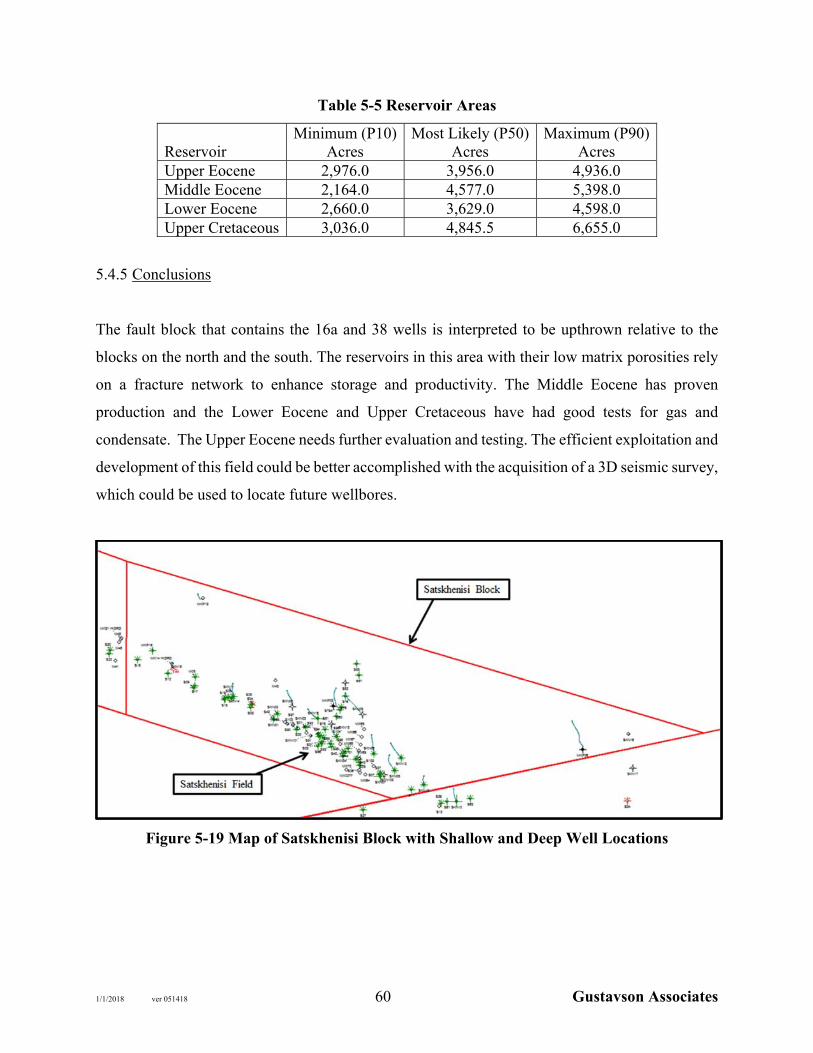
1/1/2018 ver 051418 60 Gustavson Associates
Table 5-5 Reservoir Areas
Reservoir Minimum (P10)
Acres Most Likely (P50)
Acres Maximum (P90)
Acres Upper Eocene 2,976.0 3,956.0 4,936.0 Middle Eocene 2,164.0 4,577.0 5,398.0 Lower Eocene 2,660.0 3,629.0 4,598.0 Upper Cretaceous 3,036.0 4,845.5 6,655.0
5.4.5 Conclusions
The fault block that contains the 16a and 38 wells is interpreted to be upthrown relative to the
blocks on the north and the south. The reservoirs in this area with their low matrix porosities rely
on a fracture network to enhance storage and productivity. The Middle Eocene has proven
production and the Lower Eocene and Upper Cretaceous have had good tests for gas and
condensate. The Upper Eocene needs further evaluation and testing. The efficient exploitation and
development of this field could be better accomplished with the acquisition of a 3D seismic survey,
which could be used to locate future wellbores.
Figure 5-19 Map of Satskhenisi Block with Shallow and Deep Well Locations

1/1/2018 ver 051418 61 Gustavson Associates
5.5 SATSKHENISI FIELD
5.5.1 Exploration and Development History
During the time period from 1934-1939 five structural test wells were drilled in the area which
found indications of oil in the Maikopian section. In 1956, the #1 well was drilled and discovered
the Satskhenisi Field and through 1959 a total of 51 wells were drilled by Georgian Oil. An
additional 9 wells were drilled from 1966 through the end of 1967. Numerous shallow wells were
also drilled over the years many of which flowed oil from the Maikop (Figure 5-19). Seismic data
was acquired starting in 1984 and again in 1986 through 1988 by Gruzneft-Geophysika and by
GOG in 1997 and in 2000 by Dagang Geophysical Company from China. A gravimetric survey
was conducted in 2001. Production from the field started in 1956 (Figure 5-20) and continues
today at a rate of 5 B/D. Production has come from up to 14 wells with the #4 well having the
highest cumulative production of 60.6 MBbl (Figure 5-21). Total cumulative production for the
field to date is 326,496 barrels of oil. (Figure 5-22)
On June 14, 2013, Iskander entered into a farmout agreement with Georgia Oil and Gas. In 2013
Iskander commenced a two well drilling program which was completed in the first quarter of 2014.
Both wells were subsequently fracked in multiple intervals (five intervals in one well and seven
intervals in the second well) and production tested. The results of both wells were sub-economic.
In the fourth quarter of 2014 to the second quarter of 2015, four existing wells were recompleted.
The first two existing wells were perforated both in existing and new zones and new pumping
equipment was installed. There was no increase in oil production resulting from these two
workovers. The second two wells were worked over in the first quarter of 2015 to repair the
primary cement integrity behind casing across one prospective zone in each well. The second two
wells in the recompletion program were then fractured in one zone in each well and then production
tested. One well produced oil at rates of 5 - 10 Bbls oil per day and the other produced 99% water
at very low total fluid rates.

1/1/2018 ver 051418 62 Gustavson Associates
Figure 5-20 Satskhenisi Field Total Production Plot
Figure 5-21 Satskhenisi Cumulative Production by Well

1/1/2018 ver 051418 63 Gustavson Associates
Figure 5-22 Map of Satskhenisi Field Wells with Block Outline
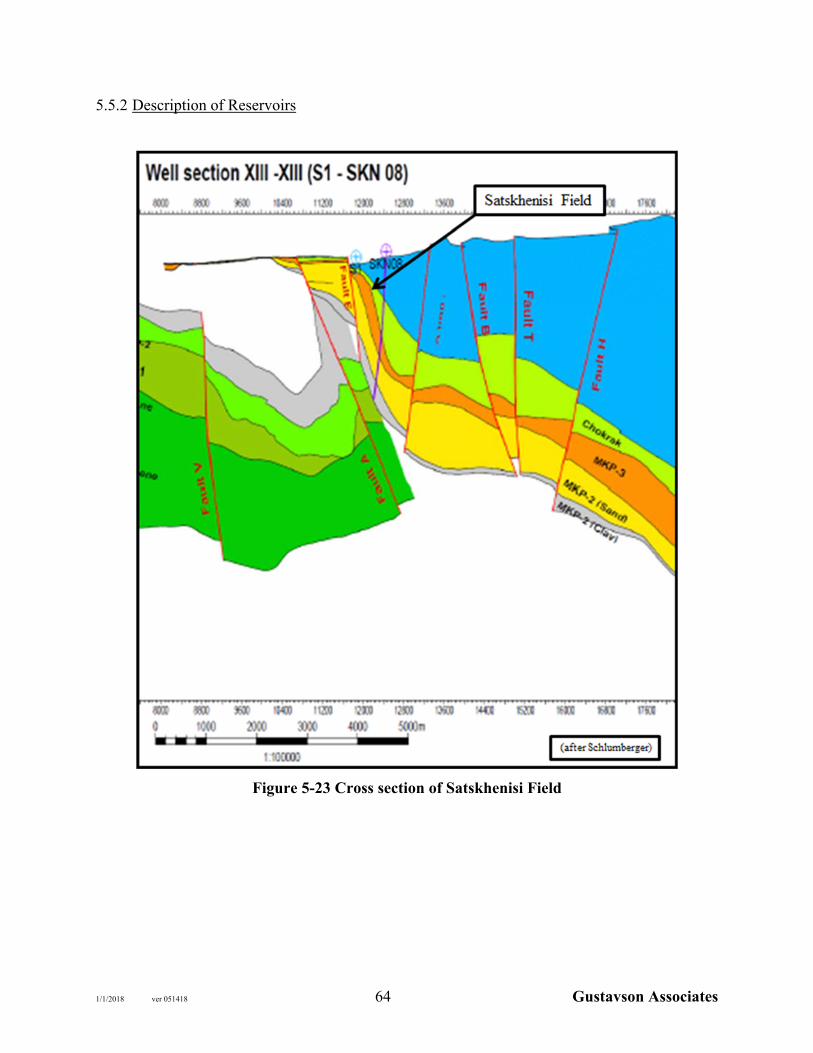
1/1/2018 ver 051418 64 Gustavson Associates
5.5.2 Description of Reservoirs
Figure 5-23 Cross section of Satskhenisi Field

1/1/2018 ver 051418 65 Gustavson Associates
The Satskhenisi Field (Figure 5-23) is a faulted and fractured steeply dipping structure similar to
the Norio Field. The proven pay here is the Maikop section while in Norio the production has
come from the Chorak.
5.5.2.1 Maikop
The Maikopian suite, based on lithologic characteristics, is subdivided into three major parts. The
deepest section of the Oligocene aged sediment consists of greenish-grey fine grained sandstones
and clays which can be up to 2,296 feet thick. The Lower Miocene aged Middle Maikop, which
contains the productive section, is made up of thick bedded quartz and feldspar sandstones and
interbedded clays which can be 1,640 to 1,800 feet thick. The upper part of this section, which is
mostly white sandstone with interbedded clays can be up to 590 feet thick, is the reservoir portion
of the Maikop. This part of the Maikop is commonly referred to as the Maikop 2 and is sometimes
subdivided into as many as nine sands. The Upper Maikop, up to 655 feet thick, is made up of
clays with occasional white sandstones. The Upper Maikop and bitumen filled sands form the seal
for the oil accumulation. The steep dip of the structure is illustrated in Figure 5-24.
Figure 5-24 Satskhenisi Field Structure map of the Maikop horizon

1/1/2018 ver 051418 66 Gustavson Associates
The porosity for the reservoir section of the Middle Maikop ranges from 12 to 20% and the water
saturation ranges from 30 to 50%.
5.5.2.2 Chokrak
The Chokrak is composed of marls with interspersed medium to coarse sandstones and calcareous
clays. The section thickens from west to east from 490 to 980 feet while less sand is encountered.
Many of the wells that were drilled in the field encountered shows in the Chokrak, but only the 10
well was reported to have been tested with minor rates. The porosity for the reservoir section of
the Middle Miocene ranges from 12 to 17% and the water saturation ranges from 30 to 52%.
5.5.3 Gross Rock Volume
The gross rock volume (GRV) limits for the Satskhenisi field were derived from the Schlumberger
model presented in the field study report. The GRV incorporates the gross interval thickness with
the areal extent of the reservoir. An audit of the Schlumberger work showed that the parameters
and results were reasonable. The available data in the Petra database and other reports and
spreadsheets provided was used for the audit. A summary of gross rock volume for the Satskhenisi
reservoirs used in the reserve and resources estimates is in Table 5-6.
Table 5-6 Gross Rock Volume for Satskhenisi (acre-feet)
Reservoir Minimum
Ac-ft Most Likely
Ac-ft Maximum
Ac-ft Maikop 1,199,531 1,332,812 1,466,093
Chokrak 700,464 1,663 1,300,862
5.5.4 Net to Gross
A Net to Gross ratio was used in the Schlumberger work. These values were reasonable based on
an audit of the information provided. Both of the subject reservoirs are interbedded sand and shale
sequences. Because of this characteristic it is reasonable to apply a net to gross ratio to the GRV
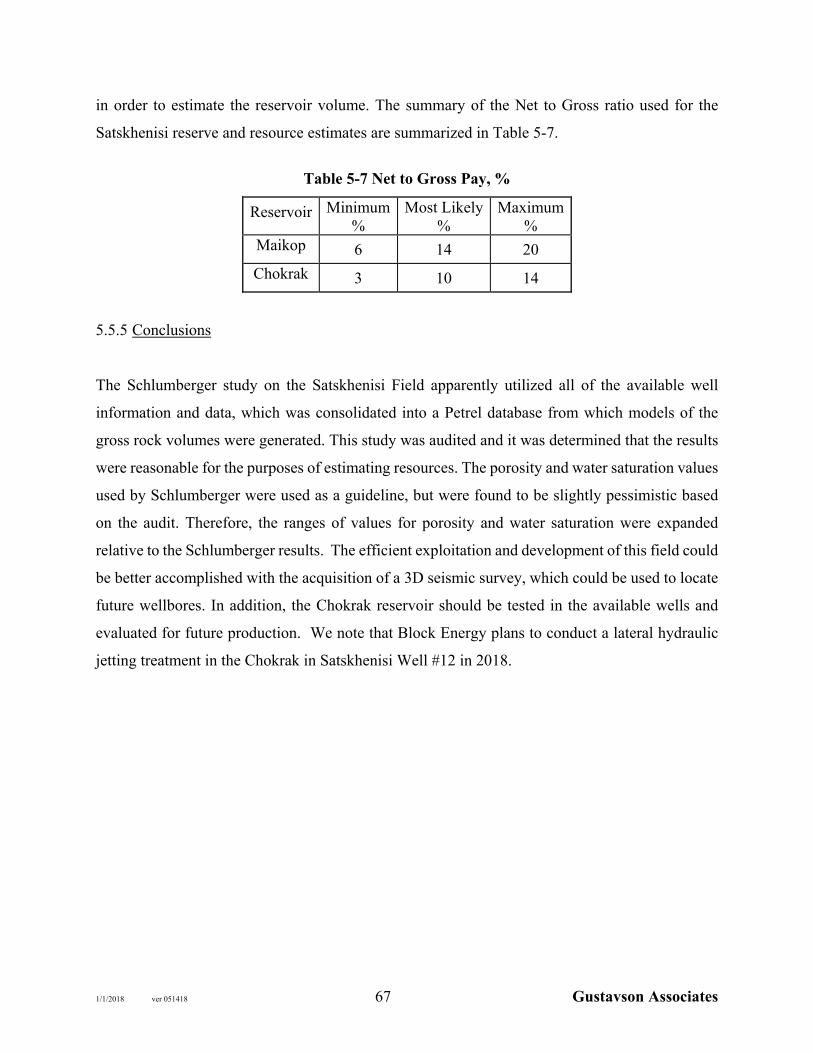
1/1/2018 ver 051418 67 Gustavson Associates
in order to estimate the reservoir volume. The summary of the Net to Gross ratio used for the
Satskhenisi reserve and resource estimates are summarized in Table 5-7.
Table 5-7 Net to Gross Pay, %
Reservoir Minimum %
Most Likely %
Maximum %
Maikop 6 14 20
Chokrak 3 10 14
5.5.5 Conclusions
The Schlumberger study on the Satskhenisi Field apparently utilized all of the available well
information and data, which was consolidated into a Petrel database from which models of the
gross rock volumes were generated. This study was audited and it was determined that the results
were reasonable for the purposes of estimating resources. The porosity and water saturation values
used by Schlumberger were used as a guideline, but were found to be slightly pessimistic based
on the audit. Therefore, the ranges of values for porosity and water saturation were expanded
relative to the Schlumberger results. The efficient exploitation and development of this field could
be better accomplished with the acquisition of a 3D seismic survey, which could be used to locate
future wellbores. In addition, the Chokrak reservoir should be tested in the available wells and
evaluated for future production. We note that Block Energy plans to conduct a lateral hydraulic
jetting treatment in the Chokrak in Satskhenisi Well #12 in 2018.

1/1/2018 ver 051418 68 Gustavson Associates
6. PROBABILISTIC RESERVE ESTIMATE
6.1 OVERVIEW
Gustavson Associates has performed an evaluation of the reserves associated with the Norio, West
Rustavi, and Satskhenisi PSAs located in the Kura Basin of the Republic of Georgia (Figure 6-1).
Figure 6-1 Map of Analog Fields with Local Infrastructure and Block License Areas
6.1.1 Norio
Reserves have been estimated for three producing wells based on production decline analysis.
Three wells that are currently shut-in have been assigned Developed Non-Producing reserves
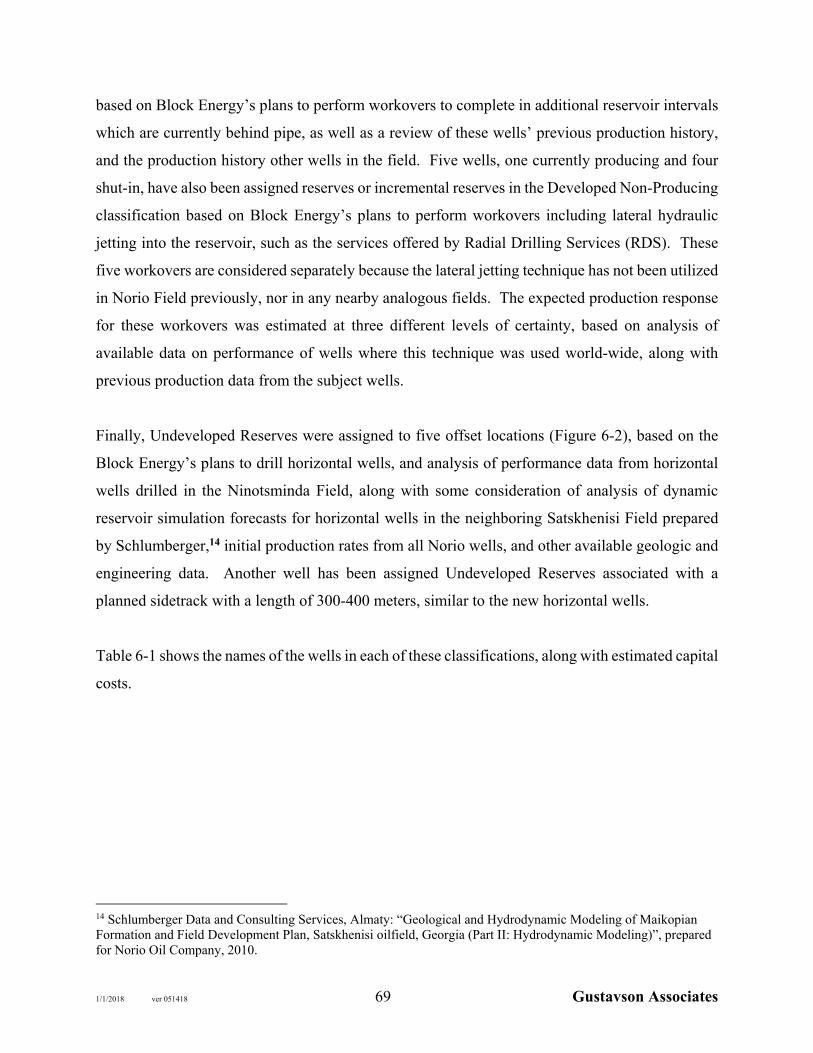
1/1/2018 ver 051418 69 Gustavson Associates
based on Block Energy’s plans to perform workovers to complete in additional reservoir intervals
which are currently behind pipe, as well as a review of these wells’ previous production history,
and the production history other wells in the field. Five wells, one currently producing and four
shut-in, have also been assigned reserves or incremental reserves in the Developed Non-Producing
classification based on Block Energy’s plans to perform workovers including lateral hydraulic
jetting into the reservoir, such as the services offered by Radial Drilling Services (RDS). These
five workovers are considered separately because the lateral jetting technique has not been utilized
in Norio Field previously, nor in any nearby analogous fields. The expected production response
for these workovers was estimated at three different levels of certainty, based on analysis of
available data on performance of wells where this technique was used world-wide, along with
previous production data from the subject wells.
Finally, Undeveloped Reserves were assigned to five offset locations (Figure 6-2), based on the
Block Energy’s plans to drill horizontal wells, and analysis of performance data from horizontal
wells drilled in the Ninotsminda Field, along with some consideration of analysis of dynamic
reservoir simulation forecasts for horizontal wells in the neighboring Satskhenisi Field prepared
by Schlumberger,14 initial production rates from all Norio wells, and other available geologic and
engineering data. Another well has been assigned Undeveloped Reserves associated with a
planned sidetrack with a length of 300-400 meters, similar to the new horizontal wells.
Table 6-1 shows the names of the wells in each of these classifications, along with estimated capital
costs.
14 Schlumberger Data and Consulting Services, Almaty: “Geological and Hydrodynamic Modeling of Maikopian Formation and Field Development Plan, Satskhenisi oilfield, Georgia (Part II: Hydrodynamic Modeling)”, prepared for Norio Oil Company, 2010.
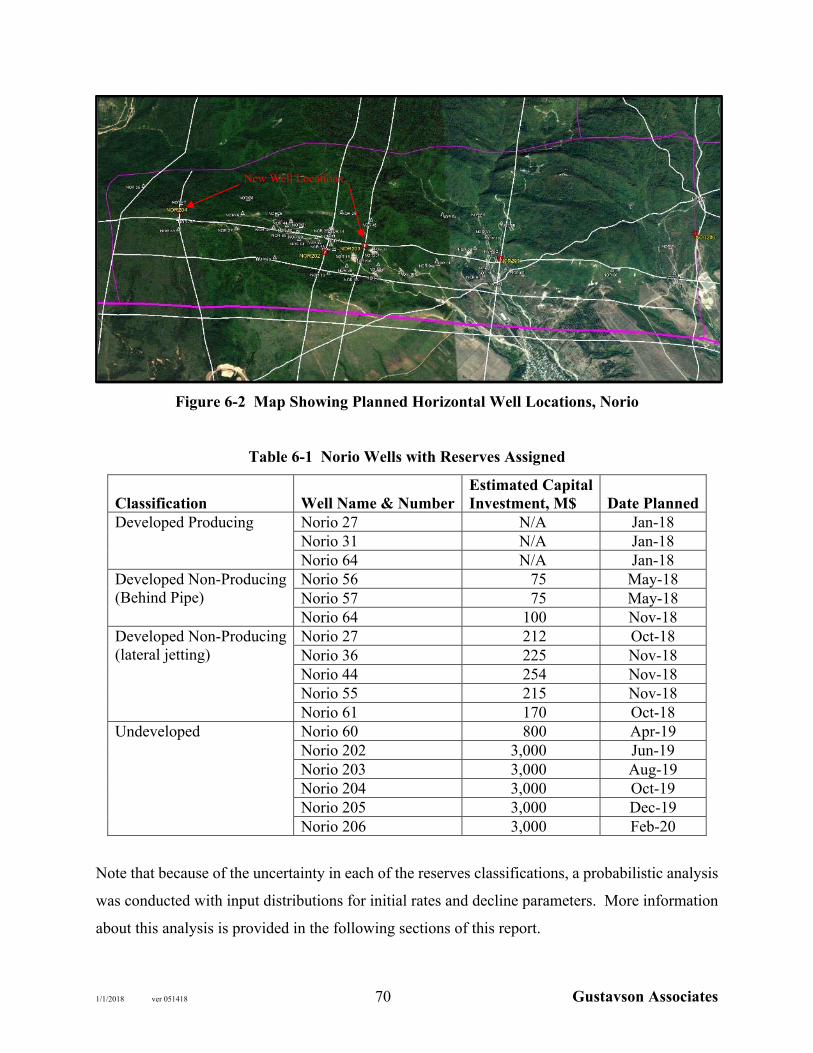
1/1/2018 ver 051418 70 Gustavson Associates
Figure 6-2 Map Showing Planned Horizontal Well Locations, Norio
Table 6-1 Norio Wells with Reserves Assigned
Classification Well Name & Number Estimated Capital Investment, M$ Date Planned
Developed Producing Norio 27 N/A Jan-18 Norio 31 N/A Jan-18 Norio 64 N/A Jan-18
Developed Non-Producing (Behind Pipe)
Norio 56 75 May-18 Norio 57 75 May-18 Norio 64 100 Nov-18
Developed Non-Producing (lateral jetting)
Norio 27 212 Oct-18 Norio 36 225 Nov-18 Norio 44 254 Nov-18 Norio 55 215 Nov-18 Norio 61 170 Oct-18
Undeveloped Norio 60 800 Apr-19 Norio 202 3,000 Jun-19 Norio 203 3,000 Aug-19 Norio 204 3,000 Oct-19 Norio 205 3,000 Dec-19 Norio 206 3,000 Feb-20
Note that because of the uncertainty in each of the reserves classifications, a probabilistic analysis
was conducted with input distributions for initial rates and decline parameters. More information
about this analysis is provided in the following sections of this report.
New Well Locations

1/1/2018 ver 051418 71 Gustavson Associates
6.1.2 West Rustavi
No wells in the West Rustavi license area are currently producing. Block Energy plans to perform
workovers to reactivate two Middle Eocene wells (#16a, 51) that are currently shut-in, including
changing perforation intervals to limit water production and increase oil production. Two
additional workovers are planned by the operator, in the West Rustavi #3 and #30 wells, with an
attempted re-completion into the Lower Eocene and/or Upper Cretaceous gas zones that tested
from 320 MCF/d up to about 1 MMCF/d during initial completion. Because of the lack of monthly
production history on these wells, and the current lack of a gas market and infrastructure, it is
difficult to prepare production forecasts and assign reserves at this time. However, these
workovers will serve to demonstrate the producibility of these wells, and establish gas production
in order to justify a gas sales contract and associated infrastructure.
Four shut-in wells (#3, 16a, 38, and 51) are planned for re-entry and drilling of deviated sidetracks
with a length of 400 meters at a cost of $1,500,000 per well. The expected production response
for these workovers was estimated at three different levels of certainty, based on of monthly
production data from the Samgori South Dome Field, which also produces from Middle Eocene
(Figure 6-3), along with all available monthly production and initial test data from West Rustavi.
Note that the P10 case assumes a one-year plateau at the initial rate to reflect high-end early
behavior at Samgori South Dome, and the possibility of a similar strong water drive at West
Rustavi.
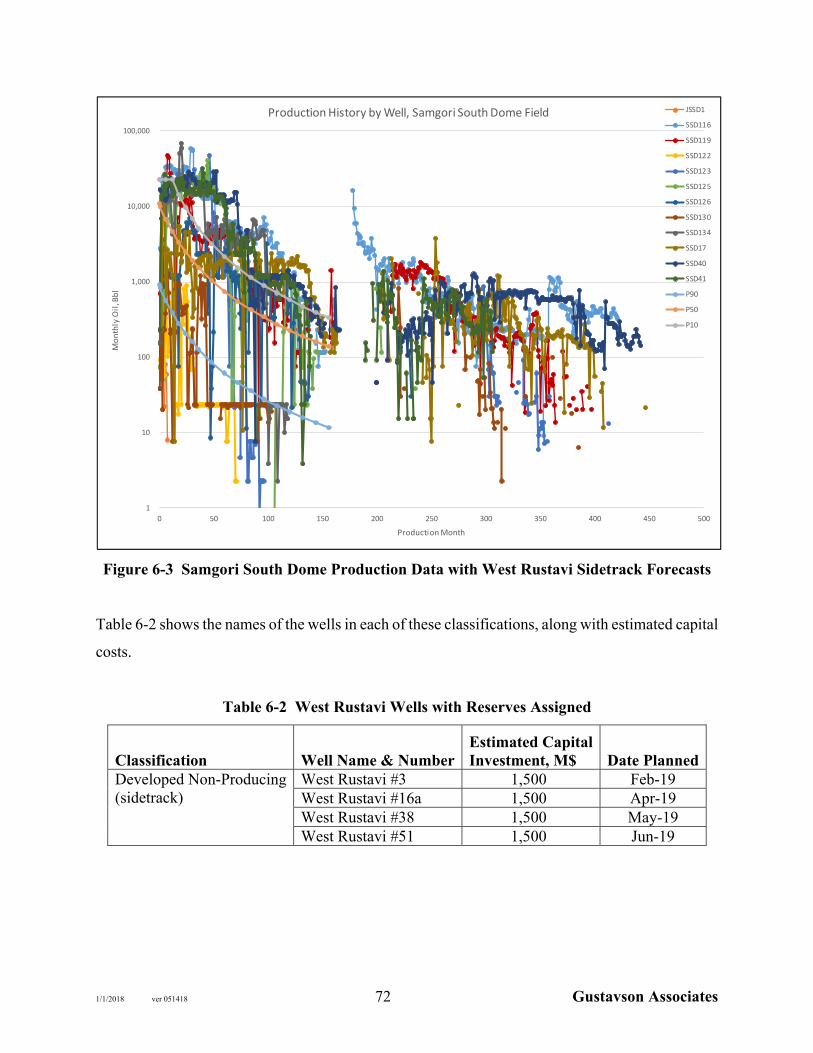
1/1/2018 ver 051418 72 Gustavson Associates
Figure 6-3 Samgori South Dome Production Data with West Rustavi Sidetrack Forecasts
Table 6-2 shows the names of the wells in each of these classifications, along with estimated capital
costs.
Table 6-2 West Rustavi Wells with Reserves Assigned
Classification Well Name & Number Estimated Capital Investment, M$ Date Planned
Developed Non-Producing (sidetrack)
West Rustavi #3 1,500 Feb-19 West Rustavi #16a 1,500 Apr-19 West Rustavi #38 1,500 May-19 West Rustavi #51 1,500 Jun-19
1
10
100
1,000
10,000
100,000
0 50 100 150 200 250 300 350 400 450 500
Monthly Oil, Bbl
Production Month
Production History by Well, Samgori South Dome Field JSSD1
SSD116
SSD119
SSD122
SSD123
SSD125
SSD126
SSD130
SSD134
SSD17
SSD40
SSD41
P90
P50
P10

1/1/2018 ver 051418 73 Gustavson Associates
6.1.3 Satskhenisi
Reserves have been estimated for five producing wells based on production decline analysis.
Three of these wells have been assigned additional Developed Non-Producing reserves based on
Block Energy’s plans to perform workovers to perform small workovers to repair tubing and install
or repair pumps, as well as a review of these wells’ previous production history, and the production
history other wells in the field. Table 6-3 shows the names of the wells in these classifications,
along with estimated capital costs.
Table 6-3 Satskhenisi Wells with Reserves Assigned
Classification Well Name & Number
Estimated Capital Investment, M$ Date Planned
Producing Satskhenisi #3 N/A Feb-18 Satskhenisi #11 N/A Feb-18 Satskhenisi #13 N/A Feb-18 Satskhenisi #14 N/A Feb-18 Satskhenisi #101 N/A Feb-18
Developed Non-Producing Satskhenisi #3 10 Apr-18 Satskhenisi #13 15 Apr-18 Satskhenisi #101 7 Apr-18
6.2 GENERAL
A probabilistic analysis is applicable for evaluating the reserves of any field where uncertainty
exists about future performance. Uncertainty in the reservoir or well performance data is
quantified by probability distributions, and an iterative approach yields a probability distribution
for reserves. This approach allows for consideration of the range of reserves and their relative
likelihood. The median estimate can be used for planning purposes, while the analysis also reveals
upside and downside potential. Uncertainty is expected to lessen as more wells are drilled and
more field data are available. As of the effective date, there were several wells in the Norio Field;
however, recent production data are limited, and available analog data for the planned lateral
jetting and horizontal drilling operations are not ideal analogs.
1/1/2018 ver 051418 74 Gustavson Associates
6.3 PROBABILISTIC SIMULATION
Probabilistic reserve analysis was performed using Monte Carlo simulation software called “@
Risk”. This software allows for input of a variety of probability distributions for any uncertain
parameter. The program performs a large number of iterations as specified by the user, to reach a
reasonable level of stability in the output. The number of iterations used in this analysis was 10.
The results include a probability distribution for the output and sampled probability for the inputs.
6.4 INPUT PARAMETERS
The approach taken involves estimating probability distributions for uncertain well performance
parameters, and performing a statistical risk analysis involving multiple iterations of reserves
calculations generated by random numbers and the reservoir parameter distributions. A triangular
distribution with specification of P90, most likely, and P10 values15 was used for all the parameters,
with the exception of the initial rates for the horizontal wells and lateral jetting at Norio, and
sidetracks at West Rustavi. The triangular distribution for the initial rates for the horizontal wells
and sidetracks yielded results below zero at the low end of the distribution; therefore, a cumulative
distribution was used with a minimum value of zero, P90, P10, and maximum values equal to those
from the triangular distribution, and P50 set at the most likely value from the triangular distribution.
For the initial rates for the lateral jetting, a different approach was taken. A distribution was fit to
the data on production improvement factors from the various world-wide analogs (Figure 6-4). A
factor determined from this distribution was then multiplied by the previous rate for each well
from its historic production data. For Norio 60, a higher base rate was assumed because of the
planned sidetrack. Table 6-4 shows the input parameters for Norio, with West Rustavi shown in
Table 6-5. Where only a most likely value is shown, the parameter was treated as a constant.
Where no b factor data are shown, an exponential decline was assumed. Other declines were
assumed to be modeled by a hyperbolic equation:
15 In this report, a designation of P90 indicates that 90 % of the input or output values are likely to be greater than or equal to that value. A designation of P10 indicates that 10 % of the input or output values are likely to be greater than or equal to that value. The most likely value is the mode of the distribution.

1/1/2018 ver 051418 75 Gustavson Associates
q = qi × (1+b×Di×t) (-1/b)
Figure 6-4 Distribution Fit to Lateral Jetting Rate Improvement Data

1/1/2018 ver 051418 76 Gustavson Associates
Table 6-4 Input Parameters, Norio
Initial Production Rate (Bbl/day) Initial Decline Factor (Di) b factor Category Well
Name
P90 Most
Likely P10 P90 Most
Likely P10 P90 Most
Likely P10 Producing Norio 27 4.5 0.16 0.20 0.29 Norio 31 11.4 0.08 0.11 0.16 Norio 64 0.6 1.0 1.7 0.027 0.03 0.04 Workover, SI or BP Norio 55 6 12 19 0.80 0.92 1.00 0.7 0.85 1.01
Norio 56 6 12 19 0.80 0.92 1.00 0.7 0.85 1.01
Norio 57 6 12 19 0.80 0.92 1.00 0.7 0.85 1.01
Rate Pre-
Workover P90 Most
Likely P10 Lateral Jetting
Norio 27 4.5 6.7 13.5 42.4 0.60 0.80 1.00 0.7 0.85 1.01
Norio 44 2.6 4.0 8.0 25.1 0.60 0.80 1.00 0.7 0.85 1.01
Norio 56 6.6 10.0 19.9 62.7 0.60 0.80 1.00 0.7 0.85 1.01
Norio 60 2.6 4.0 8.0 25.1 0.60 0.80 1.00 0.7 0.85 1.01
Norio 61 5.9 9.0 17.9 56.4 0.60 0.80 1.00 0.7 0.85 1.01
Norio 64 4.5 6.7 13.5 42.4 0.60 0.80 1.00 0.7 0.85 1.01
P90 Most
Likely P10 New Horizontal Wells
Norio 202 58 200 1,100 0.51 1.29 3.50 0.7 0.85 1.20
Norio 203 58 200 1,100 0.51 1.29 3.50 0.7 0.85 1.20
Norio 204 58 200 1,100 0.51 1.29 3.50 0.7 0.85 1.20
Norio 205 58 200 1,100 0.51 1.29 3.50 0.7 0.85 1.20
Norio 206 58 200 1,100 0.51 1.29 3.50 0.7 0.85 1.20
Table 6-5 Input Parameters, West Rustavi
Initial Production Rate (Bbl/day) Initial Decline Factor (Di) b factor
Category Well Name P90
Most Likely P10 P90
Most Likely P10 P90
Most Likely P10
Workover, SI or BP
WR16a 7 15 25 0.80 0.92 1.00 0.4 0.45 0.5
WR38 7 15 25 0.80 0.92 1.00 0.4 0.45 0.5
WR50 7 15 25 0.80 0.92 1.00 0.4 0.45 0.5 Sidetrack ST1 30 360 750 1.00 1.05 1.10 0.4 0.45 0.5
ST2 30 360 750 1.00 1.05 1.10 0.4 0.45 0.5
ST3 30 360 750 1.00 1.05 1.10 0.4 0.45 0.5
ST4 30 360 750 1.00 1.05 1.10 0.4 0.45 0.5

1/1/2018 ver 051418 77 Gustavson Associates
Table 6-6 Input Parameters, Satskhenisi
Initial Production Rate
(Bbl/day) Initial Decline Factor (Di) Category Well
Name P90 Most
Likely P10 P90 Most
Likely P10 Producing 3 1.9 2.1 2.3 0.17 0.33 0.45
11 1.3 1.4 1.4 0.17 0.29 0.43
13 0.26 0.30 0.33 0.13 0.20 0.29
14 0.53 0.59 0.66 0.13 0.20 0.29
101 0.79 0.82 0.86 0.17 0.29 0.43
Workover 3 4.0 4.9 6.0 0.17 0.33 0.45
13 0.5 0.6 1.0 0.17 0.29 0.43
101 1.7 2.5 3.1 0.17 0.29 0.43
Figure 6-5 through Figure 6-13 below show the forecast for each of the three categories of reserves,
for each classification, plus a single example new horizontal well and example sidetrack.
Figure 6-5 Production Forecasts, Norio Producing Reserves
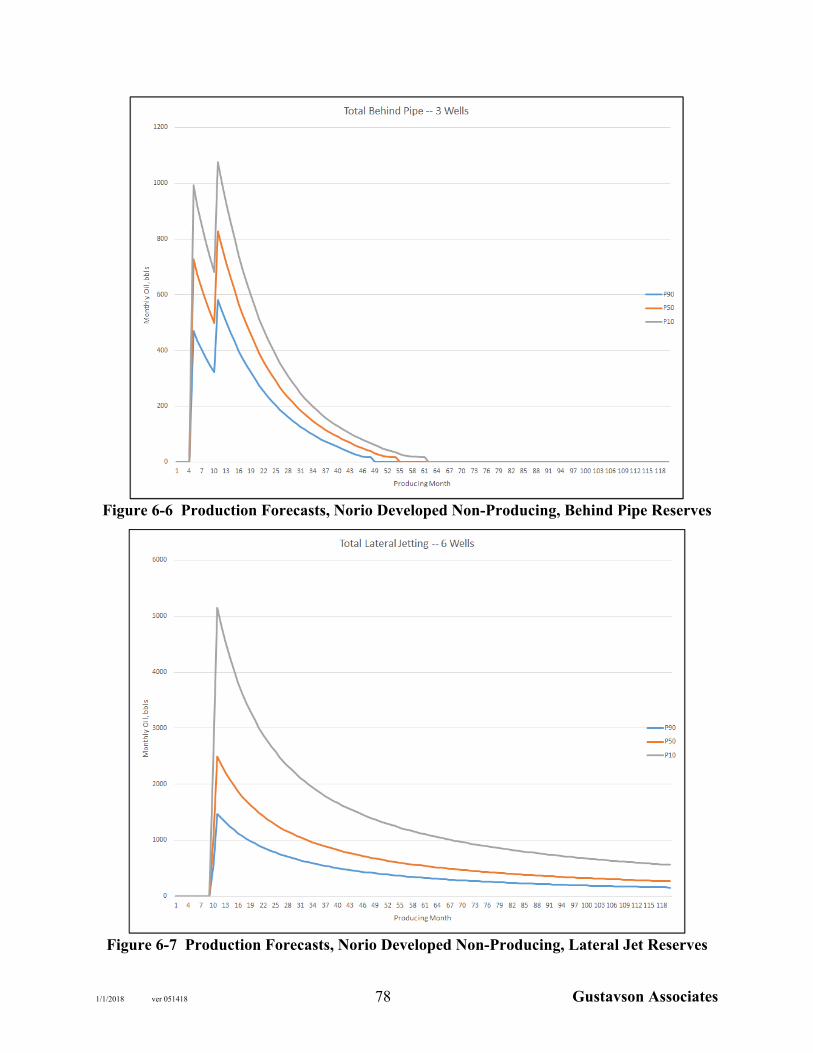
1/1/2018 ver 051418 78 Gustavson Associates
Figure 6-6 Production Forecasts, Norio Developed Non-Producing, Behind Pipe Reserves
Figure 6-7 Production Forecasts, Norio Developed Non-Producing, Lateral Jet Reserves

1/1/2018 ver 051418 79 Gustavson Associates
Figure 6-8 Production Forecasts, Norio Example New Horizontal Well
Figure 6-9 Production Forecasts, Norio Undeveloped Horizontal Well Reserves

1/1/2018 ver 051418 80 Gustavson Associates
Figure 6-10 Production Forecasts, West Rustavi Example Sidetrack
Figure 6-11 Production Forecasts, West Rustavi Total Four Sidetracks
0
5,000
10,000
15,000
20,000
25,000
1 3 5 7 9
11
13
15
17
19
21
23
25
27
29
31
33
35
37
39
41
43
45
47
49
51
53
55
57
59
61
63
65
67
69
71
73
75
77
79
81
83
85
87
89
91
93
95
97
99
101
103
105
107
Monthly Oil, bbls
Producing Month
Example Sidetrack
P90
P50
P10
0
10,000
20,000
30,000
40,000
50,000
60,000
70,000
1 3 5 7 911 13 15 17 19 21 23 25 27 29 31 33 35 37 39 41 43 45 47 49 51 53 55 57 59 61 63 65 67 69 71 73 75 77 79 81 83 85 87 89 91 93 95 97 99 101
103
105
107
Monthly Oil, bbls
Producing Month
Total Four Sidetracks
P90
P50
P10

1/1/2018 ver 051418 81 Gustavson Associates
Figure 6-12 Production Forecasts, Satskhenisi Producing Reserves
Figure 6-13 Production Forecasts, Satskhenisi Workover Reserves, Three Wells
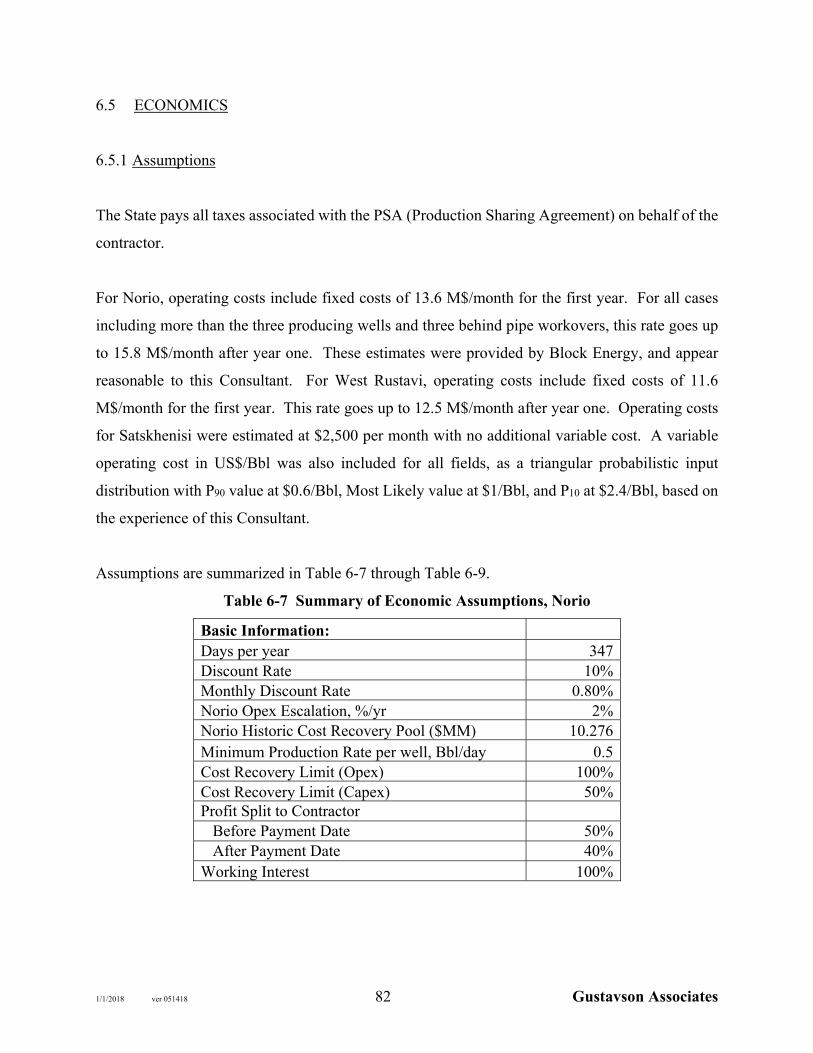
1/1/2018 ver 051418 82 Gustavson Associates
6.5 ECONOMICS
6.5.1 Assumptions
The State pays all taxes associated with the PSA (Production Sharing Agreement) on behalf of the
contractor.
For Norio, operating costs include fixed costs of 13.6 M$/month for the first year. For all cases
including more than the three producing wells and three behind pipe workovers, this rate goes up
to 15.8 M$/month after year one. These estimates were provided by Block Energy, and appear
reasonable to this Consultant. For West Rustavi, operating costs include fixed costs of 11.6
M$/month for the first year. This rate goes up to 12.5 M$/month after year one. Operating costs
for Satskhenisi were estimated at $2,500 per month with no additional variable cost. A variable
operating cost in US$/Bbl was also included for all fields, as a triangular probabilistic input
distribution with P90 value at $0.6/Bbl, Most Likely value at $1/Bbl, and P10 at $2.4/Bbl, based on
the experience of this Consultant.
Assumptions are summarized in Table 6-7 through Table 6-9.
Table 6-7 Summary of Economic Assumptions, Norio
Basic Information: Days per year 347 Discount Rate 10% Monthly Discount Rate 0.80% Norio Opex Escalation, %/yr 2% Norio Historic Cost Recovery Pool ($MM) 10.276 Minimum Production Rate per well, Bbl/day 0.5 Cost Recovery Limit (Opex) 100% Cost Recovery Limit (Capex) 50% Profit Split to Contractor
Before Payment Date 50% After Payment Date 40% Working Interest 100%

1/1/2018 ver 051418 83 Gustavson Associates
Table 6-8 Summary of Economic Assumptions, West Rustavi
Basic Information: Days per year 347 Discount Rate 10% Monthly Discount Rate 0.80% West Rustavi Opex Escalation, %/yr 2% West Rustavi Historic Cost Recovery Pool ($MM) 6.7 Minimum Production Rate per well, Bbl/day 0.5 Cost Recovery Limit (Opex) 50% Cost Recovery Limit (Capex) 50% Profit Split to Contractor
Before Payout 50% After Payout 40% Working Interest 75%
Table 6-9 Summary of Economic Assumptions, Satskhenisi
Basic Information: Days per year 347 Discount Rate 10% Monthly Discount Rate 0.80% Satskhenisi Opex Escalation, %/yr 2% Satskhenisi Historic Cost Recovery Pool ($M) 10.276 Minimum Production Rate per well, Bbl/day 0.05 Cost Recovery Limit (Opex) 100% Cost Recovery Limit (Capex) 50% Profit Split to Contractor Before Payout 50% After Payout 40% Working Interest 90%
There are two common international crude oil benchmarks: West Texas Intermediate and Brent.
Brent is often used to provide guidance for energy prices in Europe and Central Asia. Due to the
volatile nature of energy markets, it is rare that actual oil prices are aligned with previous forecasts
of those prices. However, it is essential to prepare forecasts in order to determine valuations.
Gustavson conducted a review of other forecasts of the price of Brent. The forecasts and their
average are shown on Table 6-10. The average is selected as a reasonable consensus forecast of
the price of Brent in the future.

1/1/2018 ver 051418 84 Gustavson Associates
Table 6-10 Forecasts of Brent Oil Price16
Year Sproule17 McDaniel18 Deloitte19 EIA STEO20 Average 2018 $58.00 $63.50 $61.00 $59.74 $60.56 2019 $67.00 $61.30 $61.50 $61.43 $62.81 2020 $72.00 $63.40 $62.00 $65.80 2021 $75.00 $70.10 $67.00 $70.70 2022 $76.50 $74.20 $72.00 $74.23 2023 $78.03 $75.60 $72.00 $75.21 2024 $79.59 $77.10 $72.00 $76.23 2025 $81.18 $78.60 $72.00 $77.26 2026 $82.81 $80.30 $72.00 $78.37 2027 $84.46 $81.90 $72.00 $79.45
Block Energy expects to receive a wellhead price of Brent minus 9 US$/Bbl for their blended oil
stream, which is supported by other purchase agreements in the area. We consider this to be
reasonable and have used the $9/Bbl differential.
6.5.2 Results
Reserves and economics results are summarized in Table 6-11 through Table 6-16. Detailed
spreadsheets showing cash flow for the mean case for each reserve classification are included in
Appendix D.
16 Blue numbers are extrapolations from the forecasts 17 12-2017-Escalated.xlsx 18 mcdan_180101.xlsx 19 ca-en-rea-price-forecast-12-31-2017_AODA.pdf 20 Table 2 Jan2018 Short Term Energy Outlook, EIA
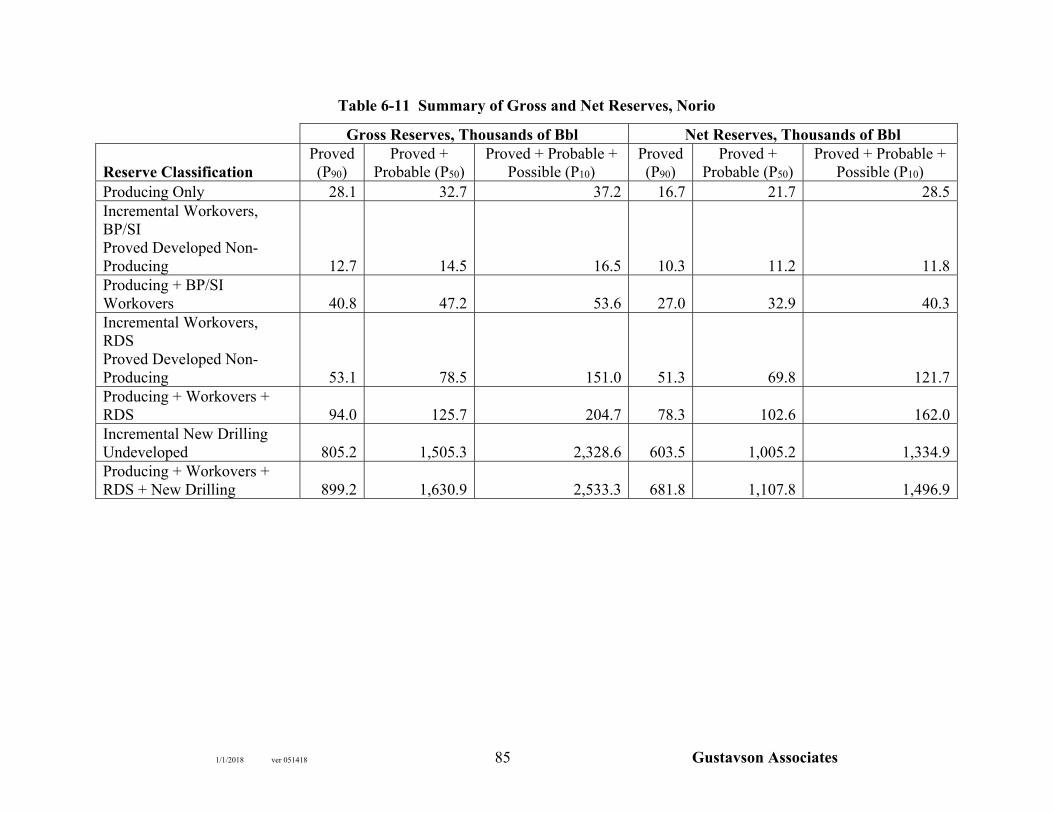
1/1/2018 ver 051418 85 Gustavson Associates
Table 6-11 Summary of Gross and Net Reserves, Norio
Gross Reserves, Thousands of Bbl Net Reserves, Thousands of Bbl
Reserve Classification Proved (P90)
Proved + Probable (P50)
Proved + Probable + Possible (P10)
Proved (P90)
Proved + Probable (P50)
Proved + Probable + Possible (P10)
Producing Only 28.1 32.7 37.2 16.7 21.7 28.5 Incremental Workovers, BP/SI Proved Developed Non-Producing 12.7 14.5 16.5 10.3 11.2 11.8 Producing + BP/SI Workovers 40.8 47.2 53.6 27.0 32.9 40.3 Incremental Workovers, RDS Proved Developed Non-Producing 53.1 78.5 151.0 51.3 69.8 121.7 Producing + Workovers + RDS 94.0 125.7 204.7 78.3 102.6 162.0 Incremental New Drilling Undeveloped 805.2 1,505.3 2,328.6 603.5 1,005.2 1,334.9 Producing + Workovers + RDS + New Drilling 899.2 1,630.9 2,533.3 681.8 1,107.8 1,496.9

1/1/2018 ver 051418 86 Gustavson Associates
Table 6-12 Summary of Projected Cash Flow, Norio
Cash Flow, MM$ NPV10, MM$
v Proved (P90)
Proved + Probable (P50)
Proved + Probable + Possible (P10)
Proved (P90)
Proved + Probable (P50)
Proved + Probable + Possible (P10)
Producing Only 0.15 0.24 0.36 0.13 0.20 0.28 Incremental Workovers, BP/SI Proved Developed Non-Producing 0.21 0.33 0.43 0.16 0.26 0.35 Producing + BP/SI Workovers 0.37 0.57 0.79 0.29 0.46 0.63 Incremental Workovers, RDS Proved Developed Non-Producing 0.83 2.02 5.28 0.42 1.22 3.45 Producing + Workovers + RDS 1.20 2.59 6.06 0.71 1.68 4.08 Incremental New Drilling Undeveloped 20.00 43.05 61.29 10.92 27.83 40.97 Producing + Workovers + RDS + New Drilling 21.19 45.64 67.35 11.63 29.51 45.06
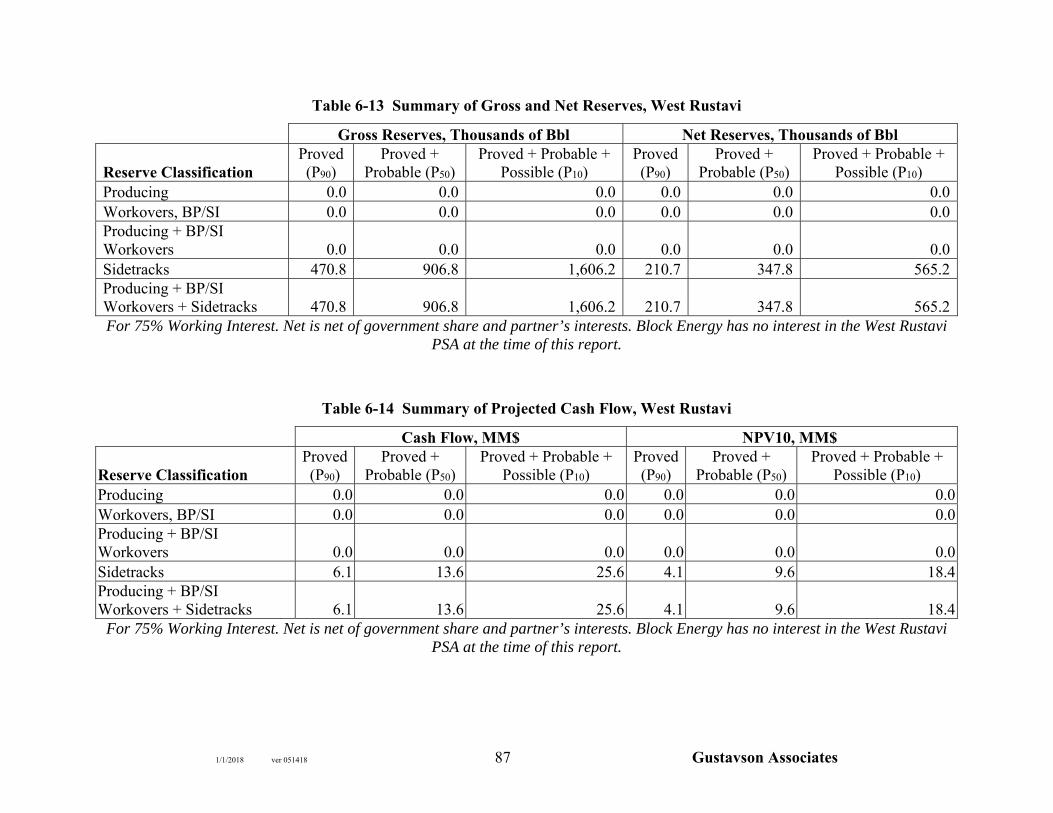
1/1/2018 ver 051418 87 Gustavson Associates
Table 6-13 Summary of Gross and Net Reserves, West Rustavi
Gross Reserves, Thousands of Bbl Net Reserves, Thousands of Bbl
Reserve Classification Proved (P90)
Proved + Probable (P50)
Proved + Probable + Possible (P10)
Proved (P90)
Proved + Probable (P50)
Proved + Probable + Possible (P10)
Producing 0.0 0.0 0.0 0.0 0.0 0.0 Workovers, BP/SI 0.0 0.0 0.0 0.0 0.0 0.0 Producing + BP/SI Workovers 0.0 0.0 0.0 0.0 0.0 0.0 Sidetracks 470.8 906.8 1,606.2 210.7 347.8 565.2 Producing + BP/SI Workovers + Sidetracks 470.8 906.8 1,606.2 210.7 347.8 565.2 For 75% Working Interest. Net is net of government share and partner’s interests. Block Energy has no interest in the West Rustavi
PSA at the time of this report.
Table 6-14 Summary of Projected Cash Flow, West Rustavi
Cash Flow, MM$ NPV10, MM$
Reserve Classification Proved (P90)
Proved + Probable (P50)
Proved + Probable + Possible (P10)
Proved (P90)
Proved + Probable (P50)
Proved + Probable + Possible (P10)
Producing 0.0 0.0 0.0 0.0 0.0 0.0 Workovers, BP/SI 0.0 0.0 0.0 0.0 0.0 0.0 Producing + BP/SI Workovers 0.0 0.0 0.0 0.0 0.0 0.0 Sidetracks 6.1 13.6 25.6 4.1 9.6 18.4 Producing + BP/SI Workovers + Sidetracks 6.1 13.6 25.6 4.1 9.6 18.4
For 75% Working Interest. Net is net of government share and partner’s interests. Block Energy has no interest in the West Rustavi PSA at the time of this report.

1/1/2018 ver 051418 88 Gustavson Associates
Table 6-15 Summary of Gross and Net Reserves, Satskhenisi
Gross Reserves, Thousands of Bbl Net Reserves, Thousands of Bbl Reserve Classification
Proved (P90)
Proved + Probable (P50)
Proved + Probable + Possible (P10)
Proved (P90)
Proved + Probable (P50)
Proved + Probable + Possible (P10)
Producing 4.4 4.4 4.4 2.3 2.3 2.4 Workovers 7.2 9.4 12.9 5.6 7.3 10.3 Producing + Workovers 11.6 13.8 17.3 7.9 9.6 12.7
For 90% Working Interest. Net is net of government share and partner’s interests.
Table 6-16 Summary of Projected Cash Flow, Satskhenisi
Cash Flow, MM$ NPV10, MM$ Reserve Classification
Proved (P90)
Proved + Probable (P50)
Proved + Probable + Possible (P10)
Proved (P90)
Proved + Probable (P50)
Proved + Probable + Possible (P10)
Producing 0.03 0.03 0.03 0.03 0.03 0.03 Workovers 0.19 0.26 0.39 0.16 0.20 0.29 Producing + Workovers 0.22 0.29 0.42 0.18 0.23 0.32
For 90% Working Interest. Net is net of government share and partner’s interests.

1/1/2018 ver 051418 89 Gustavson Associates
7. PROBABILISTIC RESOURCE ANALYSIS
7.1 GENERAL
A probabilistic resource analysis is highly applicable for projects such as evaluating the Contingent
and/or Prospective Resources of an exploratory area or an area with a relatively small portion of
the reservoir developed, where a range of values exists in the reservoir parameters. The range of
the expected reservoir data is quantified by probability distributions, and an iterative approach
yields an expected probability distribution for potential resources. This approach allows
consideration of most likely resources for planning purposes, while gaining an understanding of
what volumes of resources may have higher certainty, and what potential upside may exist for the
project.
The analysis for this project was carried out considering the range of values for all parameters in
the volumetric resource equations. Both Contingent and Prospective Resource estimates were
calculated for Norio and West Rustavi. Contingent Resources have been assigned to the Chokrak
and Sarmatian reservoirs at Norio, and the Upper, Middle, and Lower Eocene and the Upper
Cretaceous at West Rustavi, since they have been established as productive reservoirs. Prospective
Resources have been assigned to the Maikop reservoir at Norio, because the nature and quantity
of the available data regarding its productivity is not judged to be sufficient to quality as Contingent
Resources.
7.2 INPUT PARAMETERS
This method involves estimating probability distributions for the range of reservoir parameters and
performing a statistical risk analysis involving multiple iterations of resource calculations
generated by random numbers and the specified distributions of reservoir parameters. To do this,
each parameter incorporated in our resource calculation was evaluated for its expected probability
distribution.

1/1/2018 ver 051418 90 Gustavson Associates
Because few data are available regarding the likely distribution of the reservoir parameters, simple
triangular distributions with specification of minimum, most likely or mode, and maximum values
were used for most of the parameters. Note that these parameters represent average parameters
over the entire lead or prospect. So, for example, the porosity ranges do not represent the range of
what porosity might be in a particular well or a particular interval, but rather the reasonable range
of the average porosity for the whole lead or prospect. A summary of input parameters is shown
in Table 7-1 through Table 7-4.
In a probabilistic analysis, dependent relationships can be established between parameters if
appropriate. For example, portions of a reservoir with the lowest effective porosity generally may
be expected to have the highest connate water saturation, whereas higher porosity sections have
lower water saturation. In such a case, it is appropriate to establish an inverse relationship between
porosity and water saturation, such that if a high porosity is randomly estimated in a given iteration,
corresponding low water saturation is estimated. The degree of such a correlation can be controlled
to be very strong or weak. This type of dependency, with a medium strength of -0.7, was used in
this study for porosity with water saturation and with net/gross ratio. Similarly, the low end of the
gross thickness distributions for this prospective accumulation would generally be expected to
occur when the productive area is small; therefore, a positive correlation of 0.7 was assigned to
gross thickness and productive area.
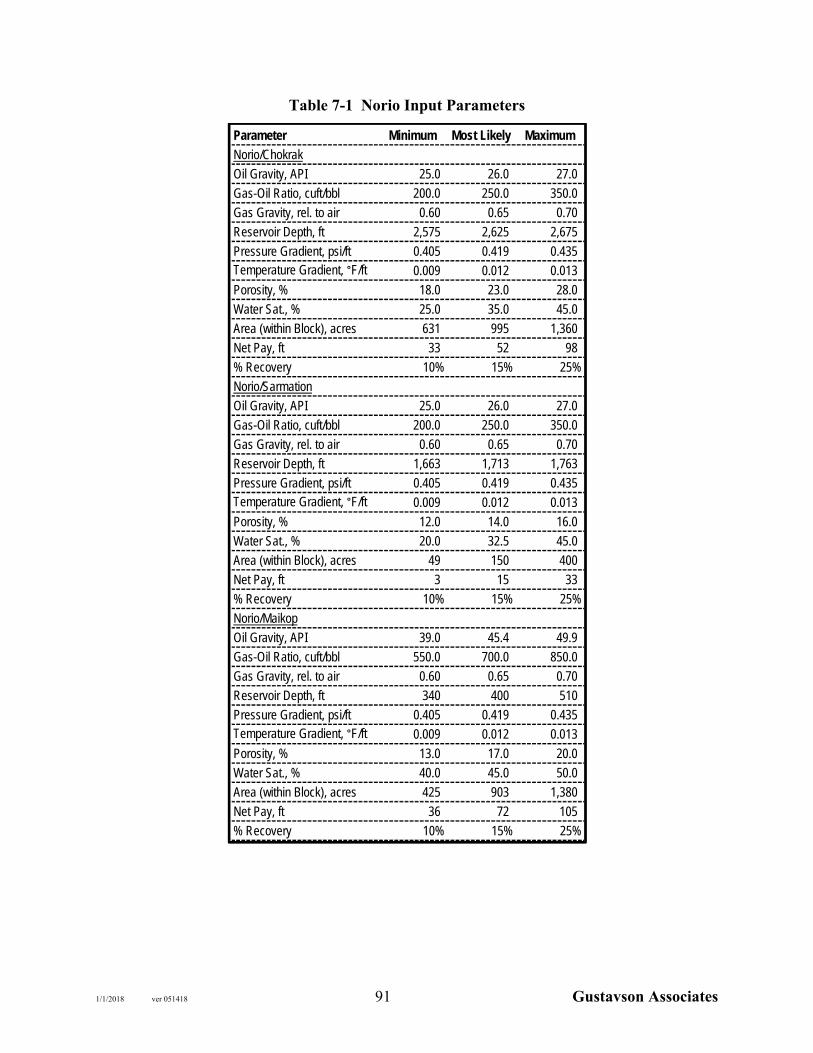
1/1/2018 ver 051418 91 Gustavson Associates
Table 7-1 Norio Input Parameters
Parameter Minimum Most Likely Maximum
Norio/Chokrak
Oil Gravity, API 25.0 26.0 27.0
Gas-Oil Ratio, cuft/bbl 200.0 250.0 350.0
Gas Gravity, rel. to air 0.60 0.65 0.70
Reservoir Depth, ft 2,575 2,625 2,675
Pressure Gradient, psi/ft 0.405 0.419 0.435Temperature Gradient, °F/ft 0.009 0.012 0.013
Porosity, % 18.0 23.0 28.0
Water Sat., % 25.0 35.0 45.0
Area (within Block), acres 631 995 1,360
Net Pay, ft 33 52 98
% Recovery 10% 15% 25%
Norio/Sarmation
Oil Gravity, API 25.0 26.0 27.0
Gas-Oil Ratio, cuft/bbl 200.0 250.0 350.0
Gas Gravity, rel. to air 0.60 0.65 0.70
Reservoir Depth, ft 1,663 1,713 1,763
Pressure Gradient, psi/ft 0.405 0.419 0.435Temperature Gradient, °F/ft 0.009 0.012 0.013
Porosity, % 12.0 14.0 16.0
Water Sat., % 20.0 32.5 45.0
Area (within Block), acres 49 150 400
Net Pay, ft 3 15 33
% Recovery 10% 15% 25%
Norio/Maikop
Oil Gravity, API 39.0 45.4 49.9
Gas-Oil Ratio, cuft/bbl 550.0 700.0 850.0
Gas Gravity, rel. to air 0.60 0.65 0.70
Reservoir Depth, ft 340 400 510
Pressure Gradient, psi/ft 0.405 0.419 0.435Temperature Gradient, °F/ft 0.009 0.012 0.013
Porosity, % 13.0 17.0 20.0
Water Sat., % 40.0 45.0 50.0
Area (within Block), acres 425 903 1,380
Net Pay, ft 36 72 105
% Recovery 10% 15% 25%
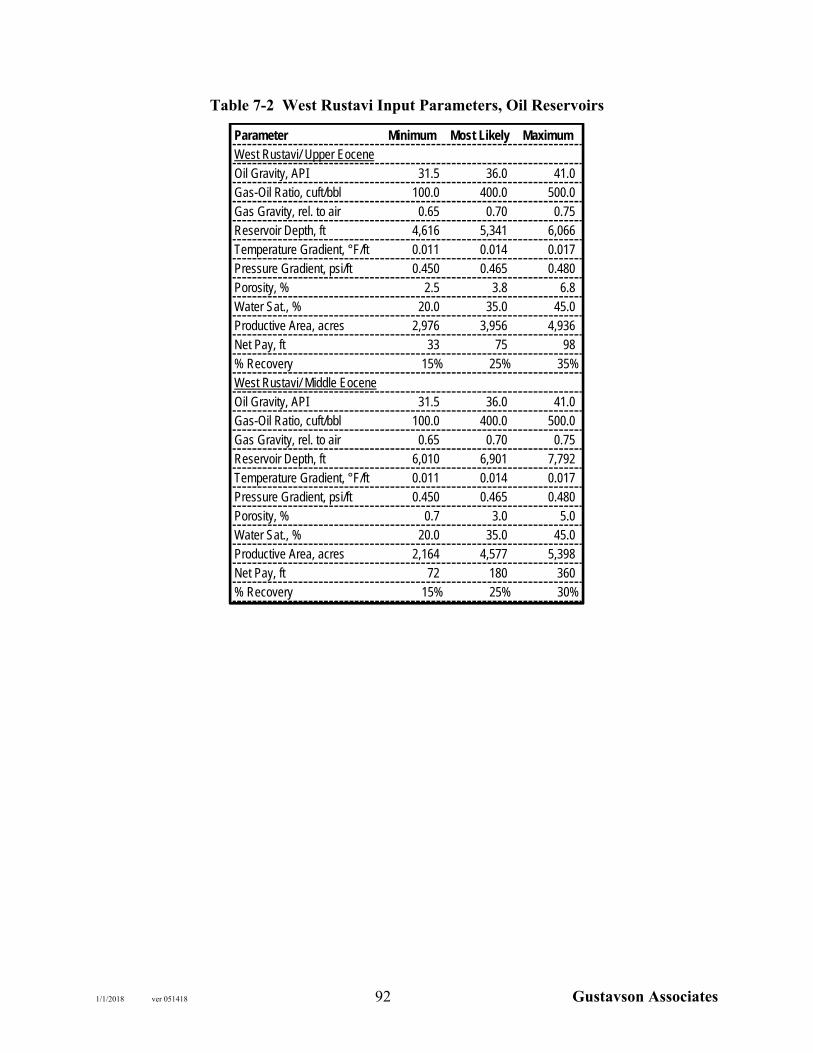
1/1/2018 ver 051418 92 Gustavson Associates
Table 7-2 West Rustavi Input Parameters, Oil Reservoirs
Parameter Minimum Most Likely MaximumWest Rustavi/ Upper Eocene
Oil Gravity, API 31.5 36.0 41.0Gas-Oil Ratio, cuft/bbl 100.0 400.0 500.0
Gas Gravity, rel. to air 0.65 0.70 0.75Reservoir Depth, ft 4,616 5,341 6,066
Temperature Gradient, °F/ft 0.011 0.014 0.017Pressure Gradient, psi/ft 0.450 0.465 0.480
Porosity, % 2.5 3.8 6.8Water Sat., % 20.0 35.0 45.0
Productive Area, acres 2,976 3,956 4,936Net Pay, ft 33 75 98
% Recovery 15% 25% 35%West Rustavi/ Middle Eocene
Oil Gravity, API 31.5 36.0 41.0Gas-Oil Ratio, cuft/bbl 100.0 400.0 500.0
Gas Gravity, rel. to air 0.65 0.70 0.75Reservoir Depth, ft 6,010 6,901 7,792
Temperature Gradient, °F/ft 0.011 0.014 0.017Pressure Gradient, psi/ft 0.450 0.465 0.480
Porosity, % 0.7 3.0 5.0Water Sat., % 20.0 35.0 45.0Productive Area, acres 2,164 4,577 5,398
Net Pay, ft 72 180 360% Recovery 15% 25% 30%

1/1/2018 ver 051418 93 Gustavson Associates
Table 7-3 West Rustavi Input Parameters, Gas Reservoirs
Parameter Minimum Most Likely MaximumWest Rustavi/ Lower EoceneGAS GRAVITY 0.6 0.7 0.7fraction N2 0.0 0.0 0.1fraction CO2 0.0 0.0 0.0fraction H2S 0.0 0.0 0.0Temperature Gradient, °F/ft 0.0 0.0 0.0Pressure Gradient, psi/ft 0.3 0.3 0.4Productive Area, acres 2,660 3,629 4,598Net Pay, ft 164 198 262WATER SAT, % 20 25 40POROSITY, % 2.8 12.0 14.5AVG. DEPTH, feet 8,484 9,337 10,190RECOVERY 0.7 0.8 0.9CGR, bbl/MMCF 0.0 17.0 20.6West Rustavi/ Upper CretaceousGAS GRAVITY 0.6 0.7 0.7fraction N2 0.0 0.0 0.1fraction CO2 0.0 0.0 0.0fraction H2S 0.0 0.0 0.0Temperature Gradient, °F/ft 0.0 0.0 0.0Pressure Gradient, psi/ft 0.3 0.4 0.4Productive Area, acres 3,036 4,846 6,655Net Pay, ft 52 130 360WATER SAT, % 20 25 40POROSITY, % 0.8 5.3 7.5AVG. DEPTH, feet 10,764 12,077 13,389RECOVERY 0.7 0.8 0.9CGR, bbl/MMCF 0.0 0.0 0.0
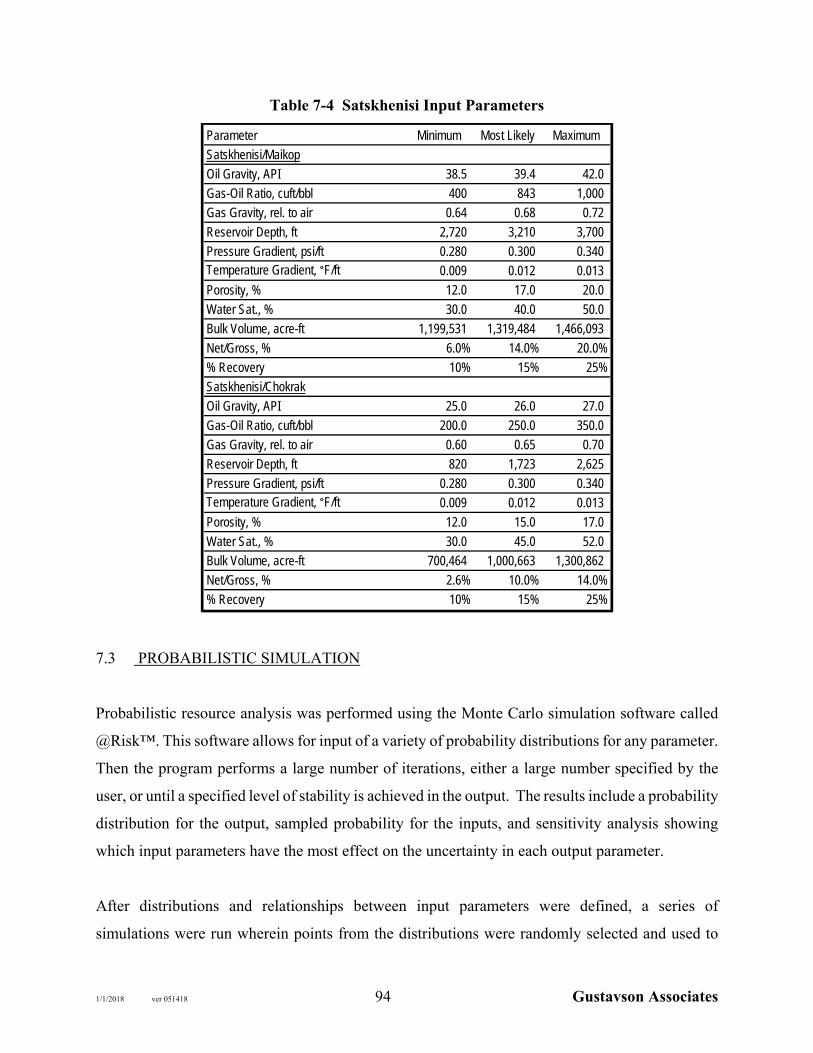
1/1/2018 ver 051418 94 Gustavson Associates
Table 7-4 Satskhenisi Input Parameters
7.3 PROBABILISTIC SIMULATION
Probabilistic resource analysis was performed using the Monte Carlo simulation software called
@Risk™. This software allows for input of a variety of probability distributions for any parameter.
Then the program performs a large number of iterations, either a large number specified by the
user, or until a specified level of stability is achieved in the output. The results include a probability
distribution for the output, sampled probability for the inputs, and sensitivity analysis showing
which input parameters have the most effect on the uncertainty in each output parameter.
After distributions and relationships between input parameters were defined, a series of
simulations were run wherein points from the distributions were randomly selected and used to
Parameter Minimum Most Likely Maximum
Satskhenisi/Maikop
Oil Gravity, API 38.5 39.4 42.0
Gas-Oil Ratio, cuft/bbl 400 843 1,000
Gas Gravity, rel. to air 0.64 0.68 0.72
Reservoir Depth, ft 2,720 3,210 3,700
Pressure Gradient, psi/ft 0.280 0.300 0.340Temperature Gradient, °F/ft 0.009 0.012 0.013
Porosity, % 12.0 17.0 20.0
Water Sat., % 30.0 40.0 50.0
Bulk Volume, acre-ft 1,199,531 1,319,484 1,466,093
Net/Gross, % 6.0% 14.0% 20.0%
% Recovery 10% 15% 25%
Satskhenisi/Chokrak
Oil Gravity, API 25.0 26.0 27.0
Gas-Oil Ratio, cuft/bbl 200.0 250.0 350.0
Gas Gravity, rel. to air 0.60 0.65 0.70
Reservoir Depth, ft 820 1,723 2,625
Pressure Gradient, psi/ft 0.280 0.300 0.340Temperature Gradient, °F/ft 0.009 0.012 0.013
Porosity, % 12.0 15.0 17.0
Water Sat., % 30.0 45.0 52.0
Bulk Volume, acre-ft 700,464 1,000,663 1,300,862
Net/Gross, % 2.6% 10.0% 14.0%
% Recovery 10% 15% 25%

1/1/2018 ver 051418 95 Gustavson Associates
calculate a single iteration of estimated potential resources. The iterations were repeated until
stable statistics (mean and standard deviation) result from the resulting output distribution. This
occurred after 10 iterations.
7.4 GEOLOGIC RISKS AND PROBABILITY OF SUCCESS
Since these are fields with established hydrocarbons, there is a 100% Probability of Success in
finding hydrocarbons in the Chokrak, Maikop and Sarmatian in Norio, the Upper, Middle, and
Lower Eocene and Upper Cretaceous in West Rustavi, and the Maikop and Chokrak in Satskhenisi.
The main risk in both of these areas is commercial. The probability of establishing commercial
production of all the Contingent Resources is estimated at 75%. The Probability of Success for
the Prospective Resources in the Maikop at Norio is estimated at 60%.
7.5 RESULTS
The output distributions were then used to characterize the Contingent and Prospective Resources.
The gross (8/8ths) results are summarized in Table 7-5, with Block’s working interest share in
Table 7-6. Note that these estimates do not include consideration for the risk of failure in exploring
for these resources. Also note that it is not possible to assign net resources to these areas, because
the net hydrocarbon volumes are determined by the cost and profit oil calculations as specified by
the PSA. A development plan is required for all recoverable hydrocarbon volumes for these
calculations.

1/1/2018 ver 051418 96 Gustavson Associates
Table 7-5 Gross Unrisked Contingent and Prospective Resource Estimates by Reservoir
P90 P50 P10 P90 P50 P10 P90 P50 P10 P90 P50 P10
Low Estimate
(C1)
Best Estimate
(C2)
High Estimate
(C3)
Low Estimate
(C1)
Best Estimate
(C2)
High Estimate
(C3)
Norio BlockContingent Resources
Chokrak Reservoir 36.2 62.0 99.4 5.7 10.2 17.2 0.8 1.5 2.3 1.85 1.88 1.92 3.0 6.8 12.9 0.8 1.8 3.5Sarmation Reservoir 0.6 2.2 5.5 0.1 0.4 0.9 0.0 0.0 0.0 0.0 0.0 0.0 0.1 0.4 0.9 0.03 0.09 0.25
Prospective ResourcesMaikop Reservoir 9.1 19.4 30.2 1.4 3.1 5.2 0.0 0.0 0.0 0.0 0.0 0.0 1.4 3.1 5.2 1.0 2.2 3.7
West Rustavi BlockContingent Resources
Middle Eocene Reservoir 44.8 95.6 177.5 10.0 22.1 42.4 0.5 0.8 1.3 0.04 0.04 0.04 9.5 21.2 41.1 2.9 6.8 14.1Upper Eocene Reservoir 30.6 49.0 77.2 7.2 12.1 19.9 0.0 0.0 0.0 0.0 0.0 0.0 7.2 12.1 19.9 2.1 3.9 7.0
Satskhenisi BlockContingent Resources
Maikop Reservoir 78.1 118.3 165.6 11.9 19.2 29.1 0.008 0.010 0.015 0.326 0.326 0.326 11.6 18.9 28.8 8.1 14.0 22.5Chokrak Reservoir 30.6 54.9 86.7 4.8 8.9 14.9 0.0 0.0 0.0 0.0 0.0 0.0 4.8 8.9 14.9 1.2 2.4 4.0
P90 P50 P10
Low Estimate
(C1)
Best Estimate
(C2)
High Estimate
(C3)
Low Estimate
(C1)
Best Estimate
(C2)
High Estimate
(C3)
West Rustavi Block
Contingent ResourcesLower Eocene Reservoir 281 502 728 217 388 565 1,848 4,617 8,341Upper Cretaceous Reservoir 119 270 535 92 209 414
Associated Gas Resources, BCF
Gas in Place, BCF Gas Resources, BCF Condensate Resources, MBbl
Oil in Place, MMBbl Oil Resources, MMBblOil Reserves, MMBblEstimated Ultimate Recovery, MMBbl Cumulative Production, MMBbl

1/1/2018 ver 051418 97 Gustavson Associates
Table 7-6 Block Energy’s Working Interest Share Unrisked Contingent and Prospective Resource Estimates by Reservoir
1/1/2018 ver 051418 98 Gustavson Associates
Contingent Resources are defined in the Petroleum Resource Management System as “those
quantities of petroleum estimated, as of a given date, to be potentially recoverable from known
accumulations, but the applied project(s) are not yet considered mature enough for commercial
development due to one or more contingencies. Contingent Resources may include, for example,
projects for which there are currently no viable markets, or where commercial recovery is
dependent on technology under development, or where evaluation of the accumulation is
insufficient to clearly assess commerciality.”21
There is no certainty that any portion of the resources will be produced. The contingency for the
oil and gas resources is generally, the lack of a full-field development plan, and uncertainty in the
economic producibility of some of the reservoirs.
Prospective Resources are defined as “those quantities of petroleum estimated, as of a given date,
to be potentially recoverable from undiscovered accumulations by application of future
development projects. Prospective Resources have both an associated chance of discovery and a
chance of development. Prospective Resources are further subdivided in accordance with the level
of certainty associated with recoverable estimates assuming their discovery and development and
may be sub-classified based on project maturity.”22 There is no certainty that any portion of the
resources will be discovered. If discovered, there is no certainty that it will be commercially viable
to produce any portion of the resources. The Low Estimate represents the P90 values from the
probabilistic analysis (in other words, the value is greater than or equal to the P90 value 90% of the
time), while the Best Estimate represents the P50 and the High Estimate represents the P10.23
Note that a deterministic calculation with any set of the input parameters will not necessarily be
close to any of the results shown in Table 7-5. Specifically, the most likely input parameters do
not necessarily yield a result very close to the Best Estimate. This is because some of the
distributions are skewed towards the minimum value rather than the maximum value where the
21 http://www.spe.org/industry/docs/Petroleum_Resources_Management_System_2007.pdf 22 http://www.spe.org/industry/docs/Petroleum_Resources_Management_System_2007.pdf 23 http://www.spe.org/industry/docs/Petroleum_Resources_Management_System_2007.pdf

1/1/2018 ver 051418 99 Gustavson Associates
minimum to maximum range is large, so that the mean is rather different from the most likely
value.
The distribution graphs for the resource estimates can be found in Appendix B. It should be noted
that the shape of the probability distributions all result in wide spacing between the minimum and
maximum expected resources. This is reflective of the high degree of uncertainty associated with
any evaluation such as this one prior to actual field discovery, development, and production. Also
note that, in general, the high probability resource estimates at the left side of these distributions
represents downside risk, while the low probability estimates on the right side of the distributions
represent upside potential. These distributions do not include consideration of the probability of
success of discovering commercial quantities of oil, but rather represent the likely distribution of
oil discoveries, if successfully found.
1/1/2018 ver 051418 100 Gustavson Associates
8. REFERENCES
Adamia, Shota, Guram Zakariadze, Tamar Chkhotua, Nino Sadradze, Nini Tsereteli, Aleksandre
Chabukiani, and Aleksandre Gventsadze, 2011, Geology of the Caucasus: A Review: Turkish Journal of Earth Sciences, Vol. 20, p 489-544.
Dow, W. G., 1977, Kerogen Studies and Geological Interpretations: Journal of Geochemical
Exploration, Vol. 7, p. 79-99. Georgia Oil and Gas Limited, 2013, GOG drilling and seismic plan 2013-2016; pp 39 & 42 Gudushauri, Soso V., and Sanishvili, Artem V., 2000, Geological and Geochemical Promises of
Oil and Gas Prospects of the West Georgia and Georgian Sector of the Black Sea Basin: AAPG Search and Discovery Article #90024.
Nibladze, Michael, and Alexander Janiashvili, 2014, History of Petroleum Geology in Georgia:
AAPG Search and Discovery Article #20273. Robinson, Andrew G., Eric T. Griffith, Andrew R. Gardiner, and Andrew K. Home, 1997,
Petroleum Geology of the Georgian Fold and Thrust Belts and Foreland Basins, in A. G. Robinson, ed., Regional and Petroleum Geology of the Black Sea and surrounding Region: AAPG Memoir 68, p. 347-367.
Trofimuk, A. A, V. S. Vyshemirsky, A. E. Kontorovich, S. G. Neruchev, E. A. Rogozina, B. A.
Sokolov, V. L. Sokolov, 1984, Stages and Deep Zoning of Oil and Gas Generation in Basins of Different Type and Their Impact Upon Oil and Gas Distribution: Proceedings 27th International Geological Congress, Vol. 13, pp. 193-210.
Ulmishek, Gregory F., 2001, Petroleum Geology and Resources of the Middle Caspian Basin,
Former Soviet Union: U. S. Geological Survey, Bull. 2201-A, 42 p. Zakariadze, Guram S., Yildirim Dilek, S. A. Adamia, R. E. Oberhansli, S. F. Karpendo, B. A.
Bazylev, and N. Soloveva, 2007, Geochemistry and geochronology of the Neoproterozoic Pan-African Transcaucasian Massif (Republic of Georgia) and implications for island arc evolution of the late Precambrian Arabian-Nubian Shield: Gondwana Research, Vol. 11, 1-1, p. 92-108.
Zonenshain, Lev P., Michael I. Kuzmin, and Lev M Natapov, 1990, Geology of the USSR: A
Plate-Tectonic Synthesis: American Geophysical Union, Geodynamics Series, Vol 21, 242 p.

1/1/2018 ver 051418 101 Gustavson Associates
9. CERTIFICATES OF QUALIFICATION
I, Letha Chapman Lencioni, Professional Engineer of 5757 Central Avenue, Suite D, Boulder,
Colorado, 80301, USA, hereby certify:
1. I am an employee of Gustavson Associates, which prepared a detailed analysis of the oil
and gas properties of Block Energy, plc. The effective date of this evaluation is January 1,
2018.
2. I do not have, nor do I expect to receive, any direct or indirect interest in the securities of
Block Energy, plc or their affiliated companies, nor any interest in the subject property.
3. I attended the University of Tulsa and I graduated with a Bachelor of Science Degree in
Petroleum Engineering in 1980; I am a Registered Professional Engineer in the State of
Colorado, and I have in excess of 35 years’ experience in the conduct of evaluation and
engineering studies relating to oil and gas fields.
4. A personal field inspection of the properties was not made; however, such an inspection
was not considered necessary in view of information available from public information and
records, and the files of Block Energy, plc.
Letha Chapman Lencioni
Chief Reservoir Engineer/ Vice-President, Petroleum Engineering
Gustavson Associates, LLC Colorado Registered Engineer #29506

1/1/2018 ver 051418 102 Gustavson Associates
I, Jan Joseph Tomanek, Certified Petroleum Geologist of 5757 Central Avenue, Suite D, Boulder,
Colorado, 80301, USA, hereby certify:
1. I am an employee of Gustavson Associates, which prepared a detailed analysis of the oil
and gas properties of Block Energy, plc. The effective date of this evaluation is January 1,
2018.
2. I do not have, nor do I expect to receive, any direct or indirect interest in the securities of
Block Energy, plc or their affiliated companies, nor any interest in the subject property.
3. I attended the University of Connecticut and I graduated with a Bachelor of Science Degree
in Geology in 1975; I am an American Association of Petroleum Geologists Certified
Petroleum Geologist and an American Institute of Professional Geologist Certified
Professional Geologist, and I have in excess of 35 years’ experience in the oil and gas field.
4. A personal field inspection of the properties was not made; however, such an inspection
was not considered necessary in view of information available from public information and
records, and the files of Block Energy, plc.
Jan Joseph Tomanek
Vice-President, Oil and Gas Gustavson Associates, LLC
AIPG CPG #11566 AAPG CPG # 6239
1/1/2018 ver 051418 103 Gustavson Associates
Additional Professional Personnel who contributed to this Report: Michele G. Bishop
Chief Geologist - Master of Science Degree in Geology from Duke University. Professional
Geologist of the State of Wyoming and an American Institute of Professional Geologists Certified
Professional Geologist with over 30 years of experience in studies relating to oil and gas fields,
including estimating quantities of reserves and resources. She is a member in good standing of the
following professional organizations: Society for Sedimentary Geology (SEPM), Rocky Mountain
Association of Geologists (RMAG), The Research Society (Sigma Xi), and the American Institute
of Professional Geologists (AIPG).
Credentials include: Wyoming Professional Geologist PG-783 and AIPG Certified Professional
Geologist CPG-11291.
Kevin S. Weller
Executive Vice-President and Registered Professional Petroleum Engineer earned a BSc
Geological Engineering from Colorado School of Mines with over 35 years of experience in
reservoir evaluation, production engineering and field operations. He is a member in good
standing of the following professional organizations: Society of Petroleum Evaluation Engineers
(SPEE), Society of Petroleum Engineers (SPE), and American Association of Petroleum
Geologists (AAPG).
Credentials include: Registered Engineer in the states of Colorado, Texas, Wyoming, Utah and
New Mexico.
Appendix A
Probability Distributions of Contingent and Prospective
Oil Resources
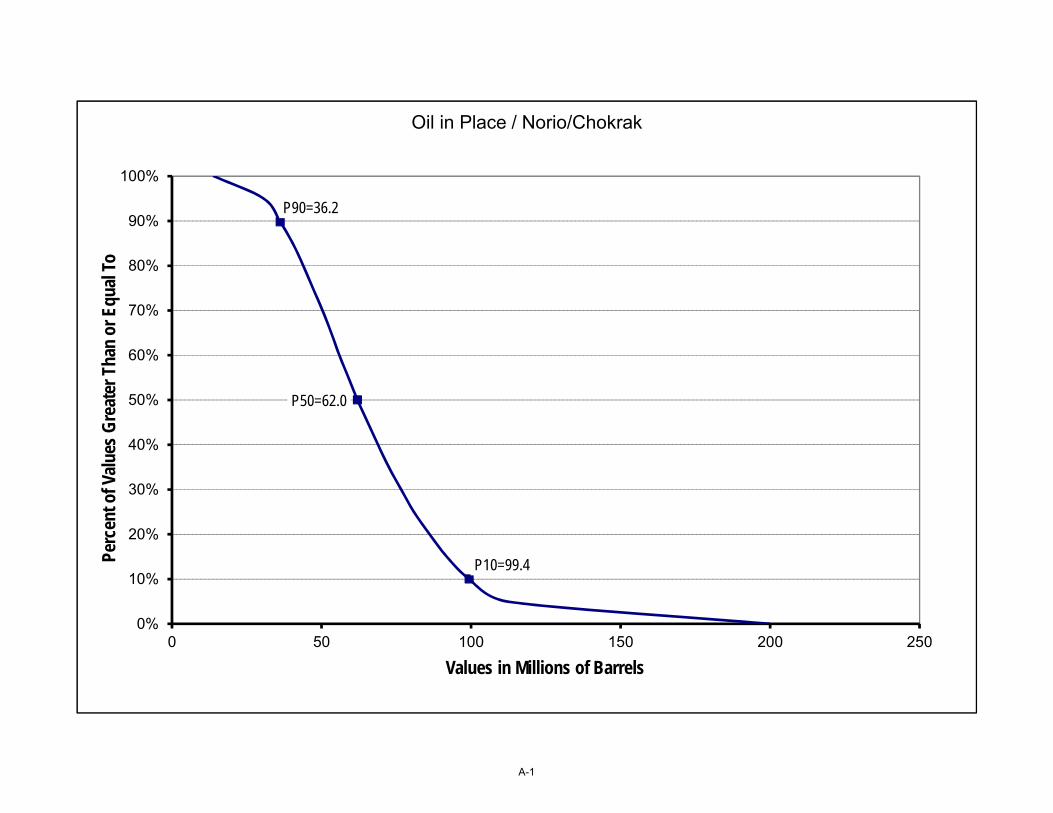
P90=36.2
P50=62.0
P10=99.4
0%
10%
20%
30%
40%
50%
60%
70%
80%
90%
100%
0 50 100 150 200 250
Perc
ent o
f Val
ues
Gre
ater
Tha
n or
Equ
al T
o
Values in Millions of Barrels
Oil in Place / Norio/Chokrak
A-1

P90=5.7
P50=10.2
P10=17.2
0%
10%
20%
30%
40%
50%
60%
70%
80%
90%
100%
0 5 10 15 20 25 30 35 40 45
Perc
ent o
f Val
ues
Gre
ater
Tha
n or
Equ
al T
o
Values in Millions of Barrels
Estimated Ultimate Recovery, Oil / Norio/Chokrak
A-2
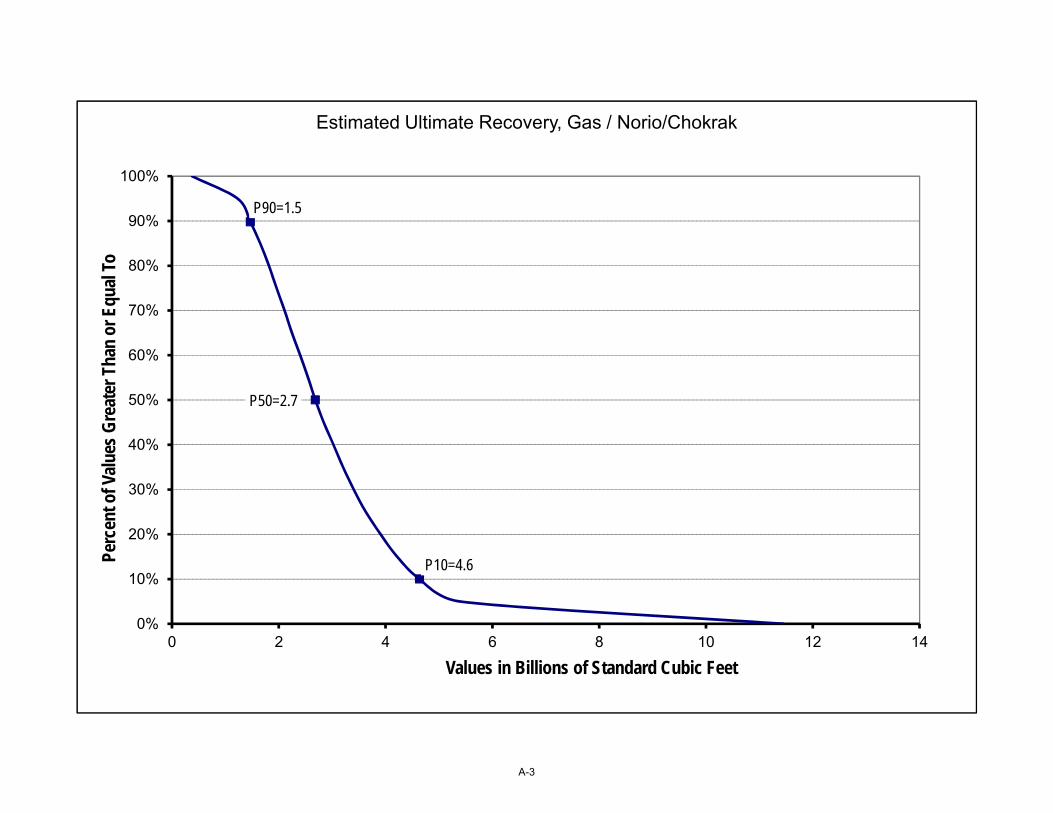
P90=1.5
P50=2.7
P10=4.6
0%
10%
20%
30%
40%
50%
60%
70%
80%
90%
100%
0 2 4 6 8 10 12 14
Perc
ent o
f Val
ues
Gre
ater
Tha
n or
Equ
al T
o
Values in Billions of Standard Cubic Feet
Estimated Ultimate Recovery, Gas / Norio/Chokrak
A-3

P90=0.6
P50=2.2
P10=5.5
0%
10%
20%
30%
40%
50%
60%
70%
80%
90%
100%
0 2 4 6 8 10 12 14 16
Perc
ent o
f Val
ues
Gre
ater
Tha
n or
Equ
al T
o
Values in Millions of Barrels
Oil in Place / Norio/Sarmatian
A-4
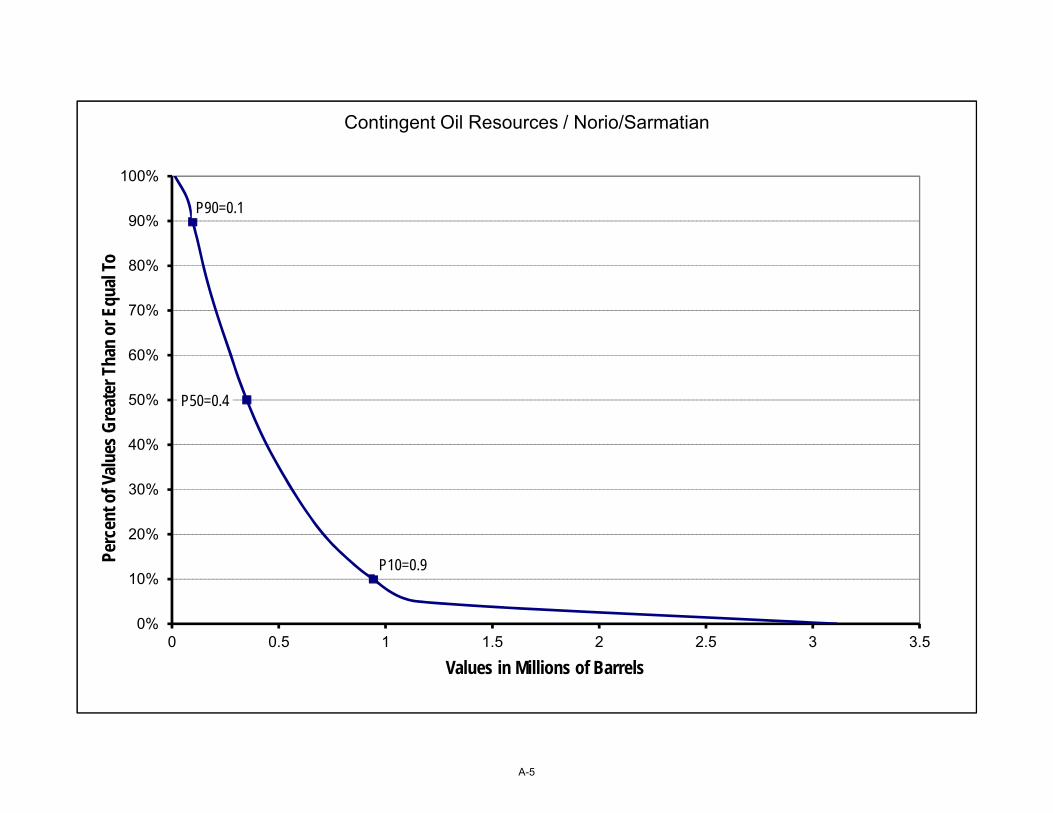
P90=0.1
P50=0.4
P10=0.9
0%
10%
20%
30%
40%
50%
60%
70%
80%
90%
100%
0 0.5 1 1.5 2 2.5 3 3.5
Perc
ent o
f Val
ues
Gre
ater
Tha
n or
Equ
al T
o
Values in Millions of Barrels
Contingent Oil Resources / Norio/Sarmatian
A-5
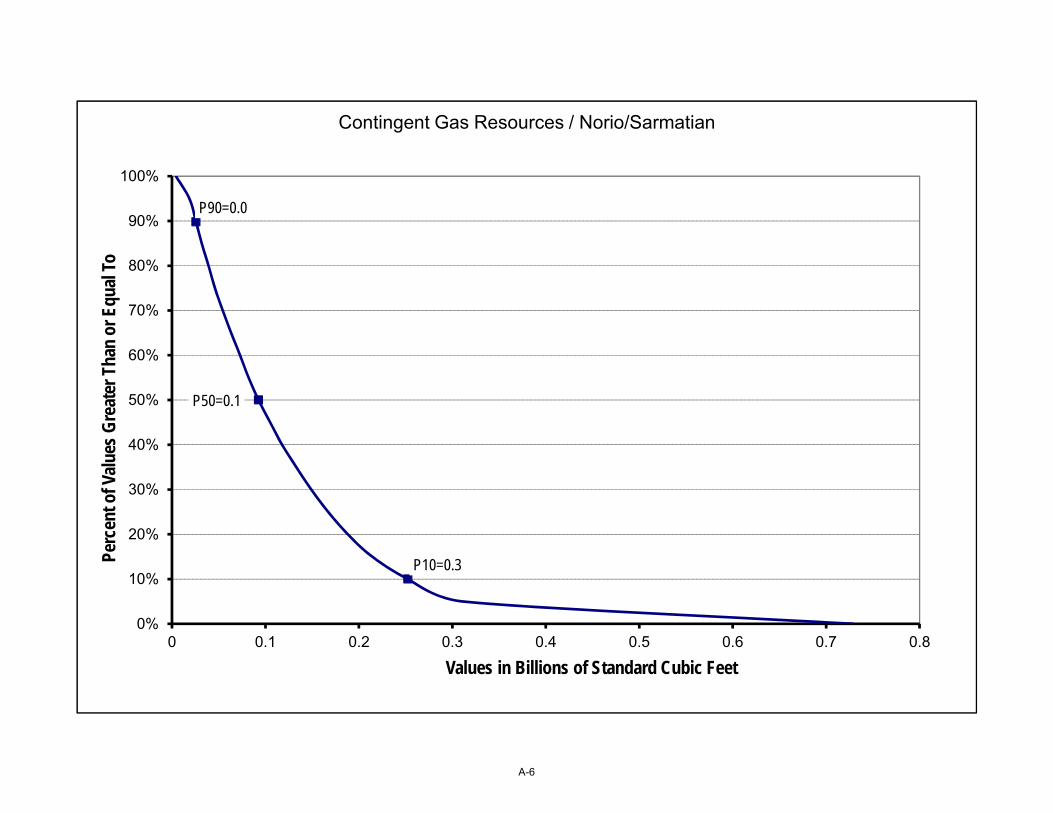
P90=0.0
P50=0.1
P10=0.3
0%
10%
20%
30%
40%
50%
60%
70%
80%
90%
100%
0 0.1 0.2 0.3 0.4 0.5 0.6 0.7 0.8
Perc
ent o
f Val
ues
Gre
ater
Tha
n or
Equ
al T
o
Values in Billions of Standard Cubic Feet
Contingent Gas Resources / Norio/Sarmatian
A-6
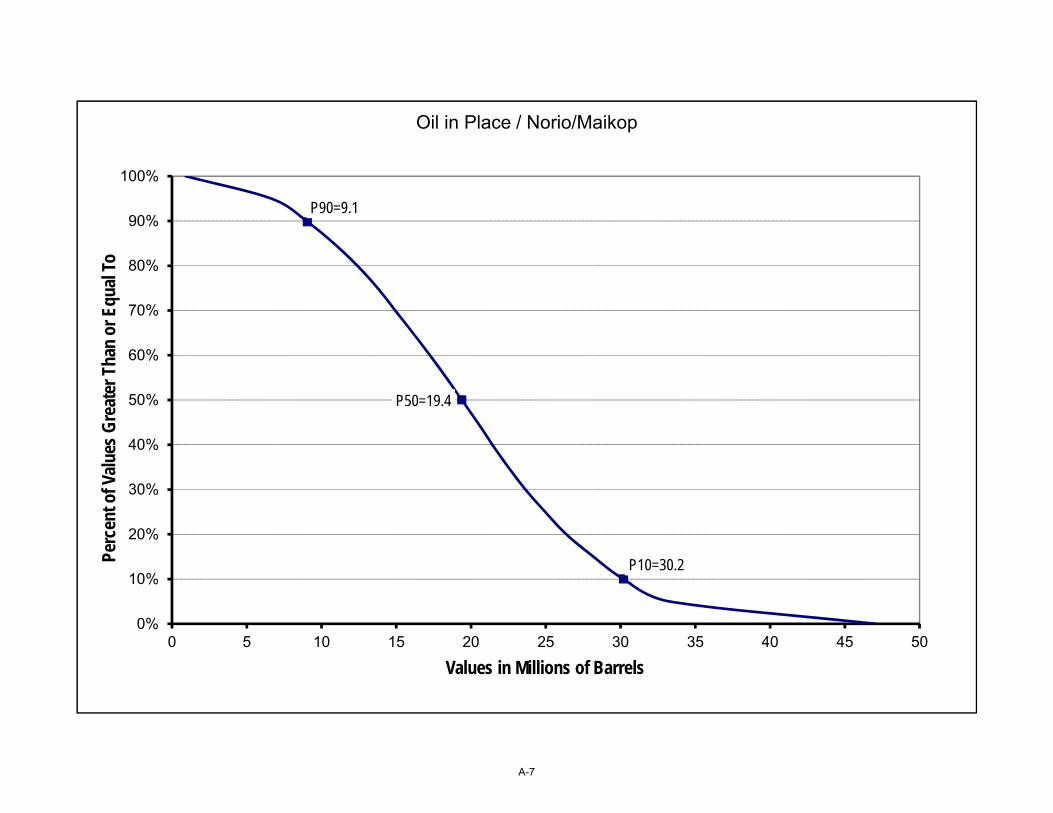
P90=9.1
P50=19.4
P10=30.2
0%
10%
20%
30%
40%
50%
60%
70%
80%
90%
100%
0 5 10 15 20 25 30 35 40 45 50
Perc
ent o
f Val
ues
Gre
ater
Tha
n or
Equ
al T
o
Values in Millions of Barrels
Oil in Place / Norio/Maikop
A-7

P90=1.4
P50=3.1
P10=5.2
0%
10%
20%
30%
40%
50%
60%
70%
80%
90%
100%
0 2 4 6 8 10 12
Perc
ent o
f Val
ues
Gre
ater
Tha
n or
Equ
al T
o
Values in Millions of Barrels
Prospective Oil Resources / Norio/Maikop
A-8
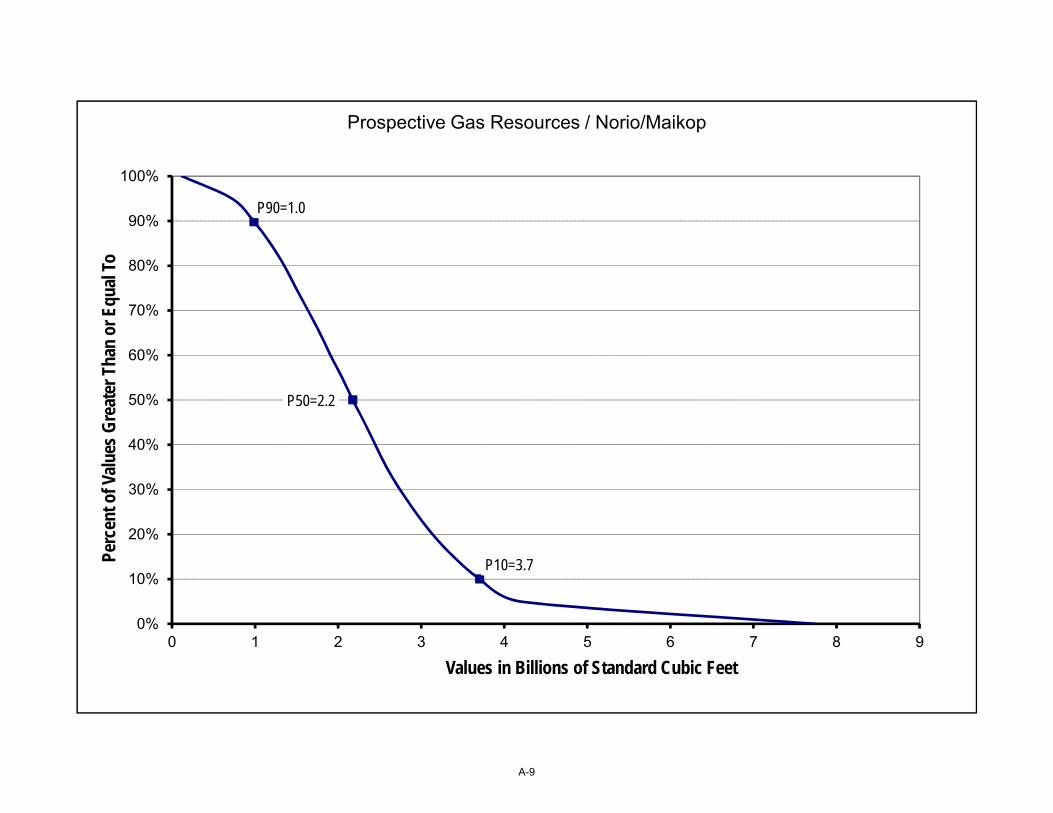
P90=1.0
P50=2.2
P10=3.7
0%
10%
20%
30%
40%
50%
60%
70%
80%
90%
100%
0 1 2 3 4 5 6 7 8 9
Perc
ent o
f Val
ues
Gre
ater
Tha
n or
Equ
al T
o
Values in Billions of Standard Cubic Feet
Prospective Gas Resources / Norio/Maikop
A-9

P90=30.607
P50=48.967
P10=77.214
0%
10%
20%
30%
40%
50%
60%
70%
80%
90%
100%
0 20 40 60 80 100 120 140 160
Perc
ent o
f Val
ues
Gre
ater
Tha
n or
Equ
al T
o
Values in Millions of Barrels
Oil In Place / W Rustavi/Upper Eocene
A-10

P90=7.2
P50=12.1
P10=19.9
0%
10%
20%
30%
40%
50%
60%
70%
80%
90%
100%
0 5 10 15 20 25 30 35 40 45
Perc
ent o
f Val
ues
Gre
ater
Tha
n or
Equ
al T
o
Values in Millions of Barrels
Contingent Oil Resources / W Rustavi/Upper Eocene
A-11

P90=2.1
P50=3.9
P10=7.0
0%
10%
20%
30%
40%
50%
60%
70%
80%
90%
100%
0 2 4 6 8 10 12 14 16
Perc
ent o
f Val
ues
Gre
ater
Tha
n or
Equ
al T
o
Values in Billions of Standard Cubic Feet
Contingent Gas Resources / W Rustavi/Upper Eocene
A-12
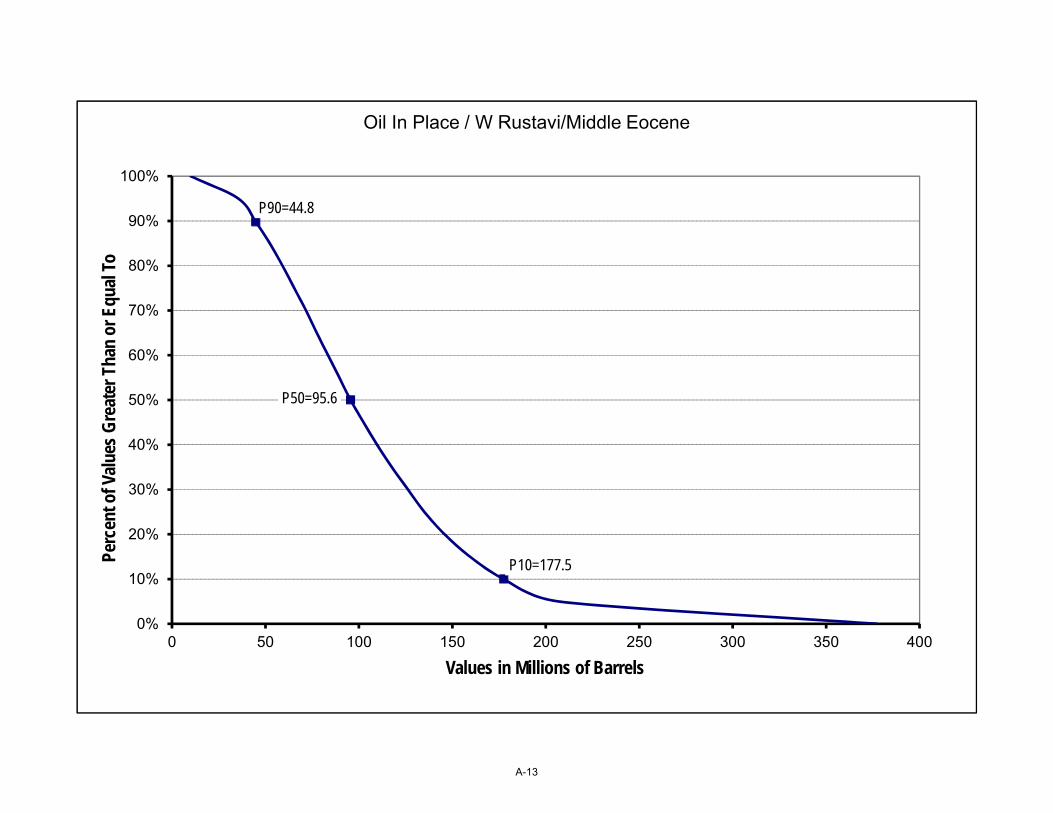
P90=44.8
P50=95.6
P10=177.5
0%
10%
20%
30%
40%
50%
60%
70%
80%
90%
100%
0 50 100 150 200 250 300 350 400
Perc
ent o
f Val
ues
Gre
ater
Tha
n or
Equ
al T
o
Values in Millions of Barrels
Oil In Place / W Rustavi/Middle Eocene
A-13
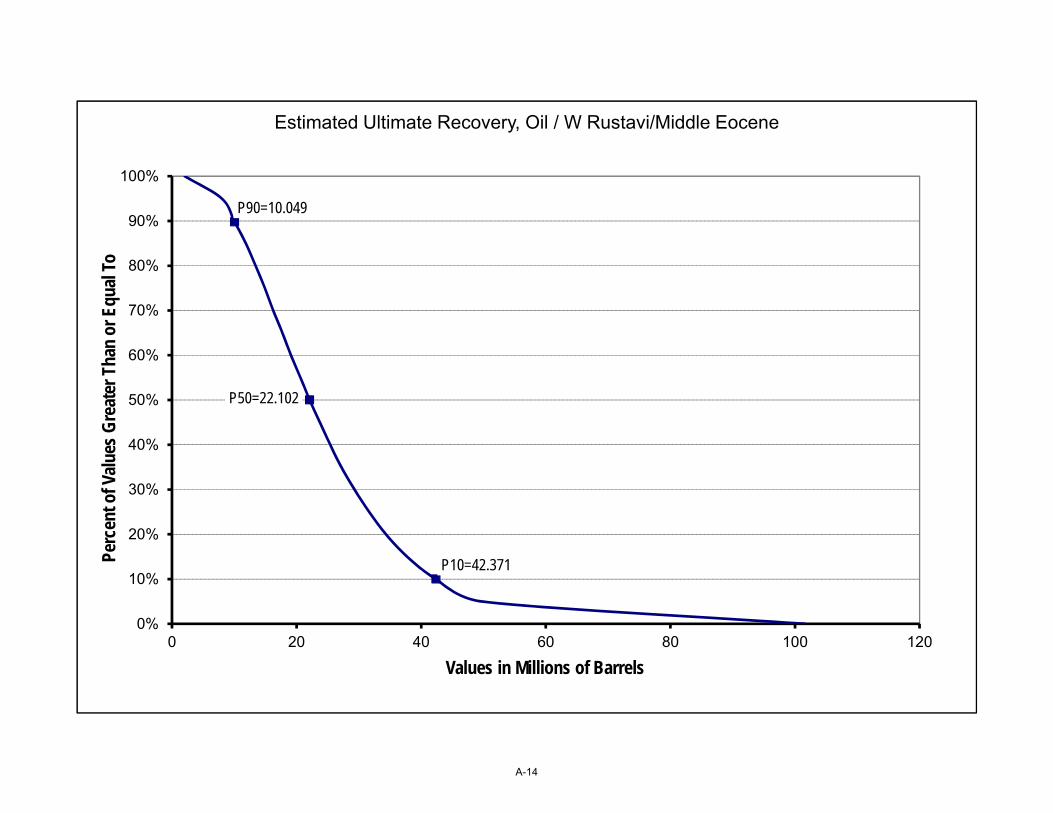
P90=10.049
P50=22.102
P10=42.371
0%
10%
20%
30%
40%
50%
60%
70%
80%
90%
100%
0 20 40 60 80 100 120
Perc
ent o
f Val
ues
Gre
ater
Tha
n or
Equ
al T
o
Values in Millions of Barrels
Estimated Ultimate Recovery, Oil / W Rustavi/Middle Eocene
A-14
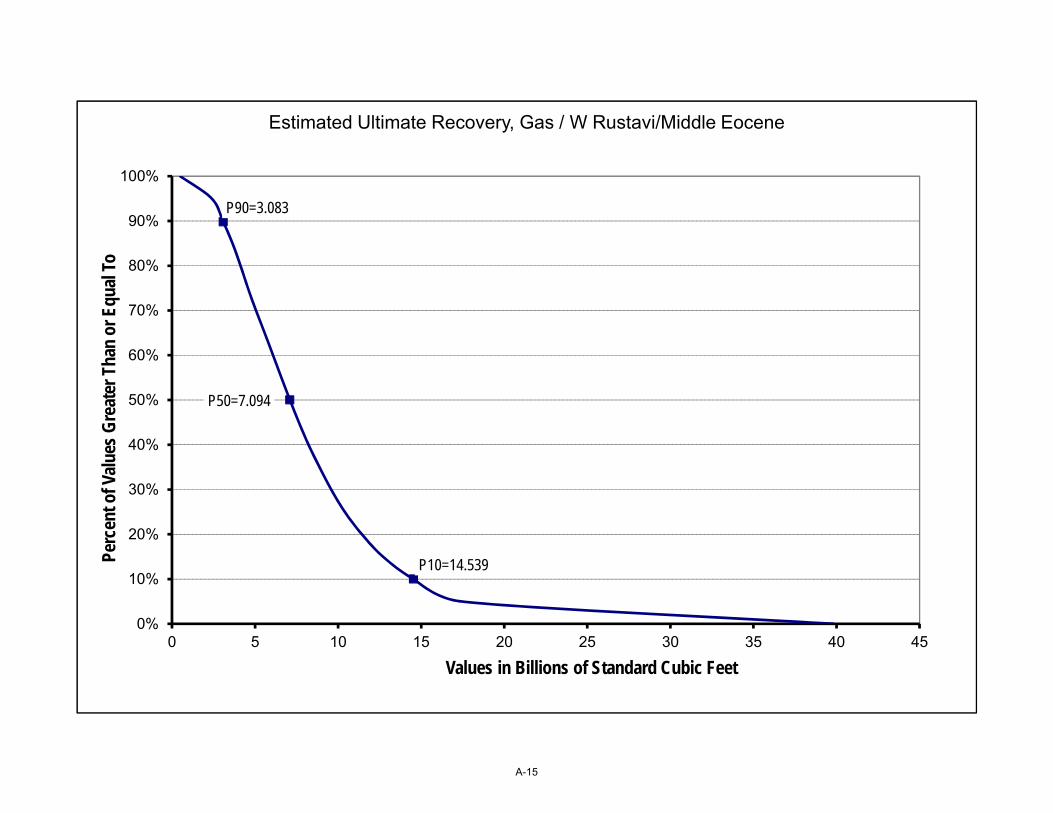
P90=3.083
P50=7.094
P10=14.539
0%
10%
20%
30%
40%
50%
60%
70%
80%
90%
100%
0 5 10 15 20 25 30 35 40 45
Perc
ent o
f Val
ues
Gre
ater
Tha
n or
Equ
al T
o
Values in Billions of Standard Cubic Feet
Estimated Ultimate Recovery, Gas / W Rustavi/Middle Eocene
A-15
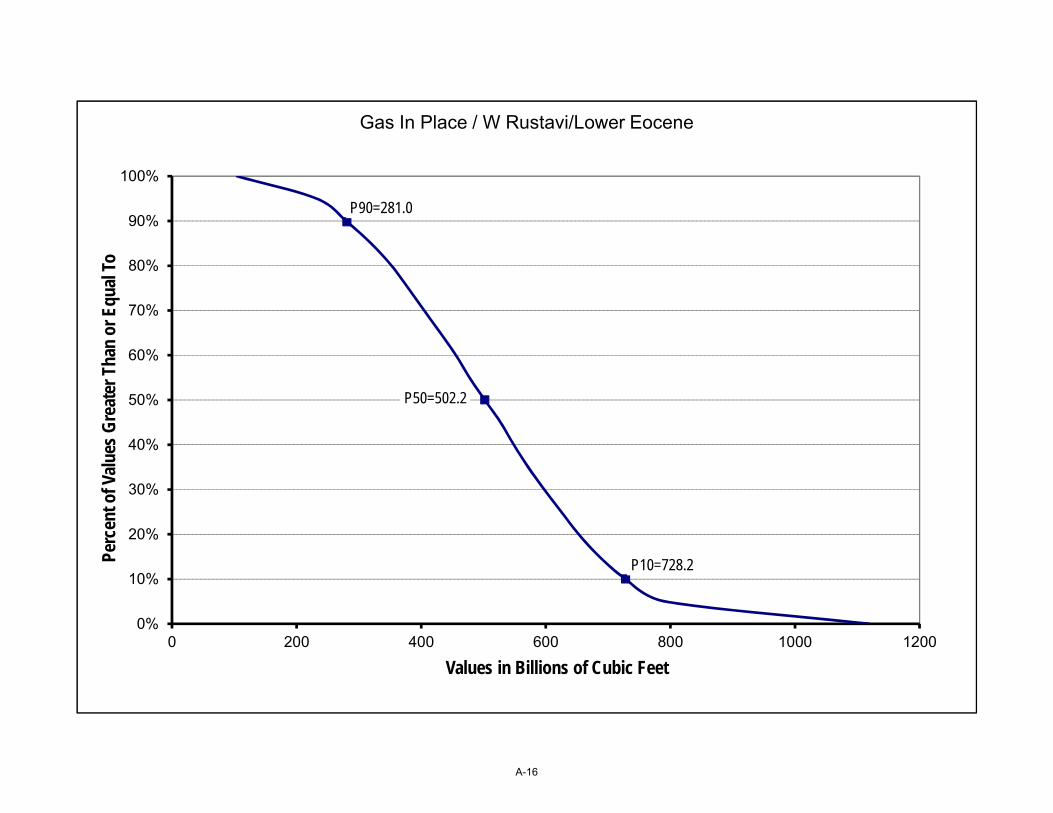
P90=281.0
P50=502.2
P10=728.2
0%
10%
20%
30%
40%
50%
60%
70%
80%
90%
100%
0 200 400 600 800 1000 1200
Perc
ent o
f Val
ues
Gre
ater
Tha
n or
Equ
al T
o
Values in Billions of Cubic Feet
Gas In Place / W Rustavi/Lower Eocene
A-16

P90=216.7
P50=388.1
P10=564.9
0%
10%
20%
30%
40%
50%
60%
70%
80%
90%
100%
0 100 200 300 400 500 600 700 800 900 1000
Perc
ent o
f Val
ues
Gre
ater
Tha
n or
Equ
al T
o
Values in Billions of Cubic Feet
Contingent Gas Resources / W Rustavi/Lower Eocene
A-17
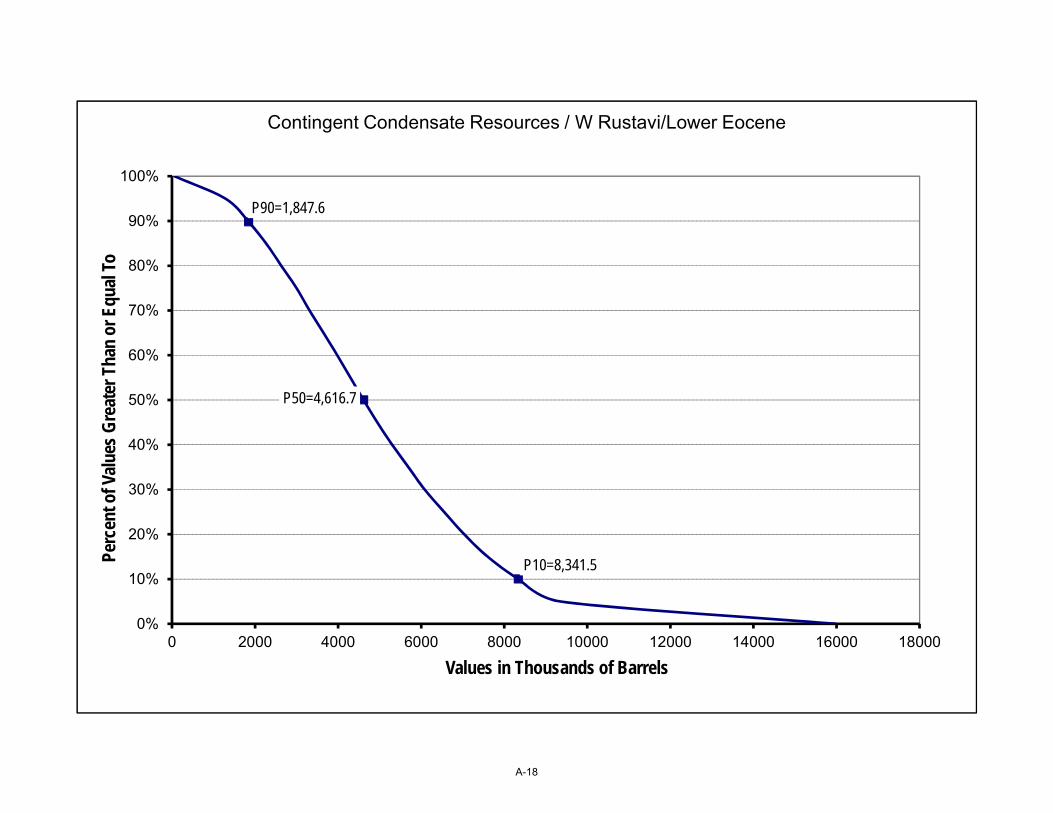
P90=1,847.6
P50=4,616.7
P10=8,341.5
0%
10%
20%
30%
40%
50%
60%
70%
80%
90%
100%
0 2000 4000 6000 8000 10000 12000 14000 16000 18000
Perc
ent o
f Val
ues
Gre
ater
Tha
n or
Equ
al T
o
Values in Thousands of Barrels
Contingent Condensate Resources / W Rustavi/Lower Eocene
A-18

P90=119.4
P50=270.0
P10=534.9
0%
10%
20%
30%
40%
50%
60%
70%
80%
90%
100%
0 200 400 600 800 1000 1200 1400
Perc
ent o
f Val
ues
Gre
ater
Tha
n or
Equ
al T
o
Values in Billions of Cubic Feet
Gas In Place / W Rustavi/Upper Cretaceous
A-19

P90=91.9
P50=209.0
P10=414.0
0%
10%
20%
30%
40%
50%
60%
70%
80%
90%
100%
0 200 400 600 800 1000 1200
Perc
ent o
f Val
ues
Gre
ater
Tha
n or
Equ
al T
o
Values in Billions of Cubic Feet
Contingent Gas Resources / W Rustavi/Upper Cretaceous
A-20

P90=78.1
P50=118.3
P10=165.6
0%
10%
20%
30%
40%
50%
60%
70%
80%
90%
100%
0 50 100 150 200 250 300
Perc
ent o
f Val
ues
Gre
ater
Tha
n or
Equ
al T
o
Values in Millions of Barrels
Oil in Place / Satskhenisi/Maikop
A-21

P90=11.9
P50=19.2
P10=29.1
0%
10%
20%
30%
40%
50%
60%
70%
80%
90%
100%
0 10 20 30 40 50 60
Perc
ent o
f Val
ues
Gre
ater
Tha
n or
Equ
al T
o
Values in Millions of Barrels
EUR / Satskhenisi/Maikop
A-22

P90=11.6
P50=18.9
P10=28.8
0%
10%
20%
30%
40%
50%
60%
70%
80%
90%
100%
0 10 20 30 40 50 60
Perc
ent o
f Val
ues
Gre
ater
Tha
n or
Equ
al T
o
Values in Millions of Barrels
Contingent Oil Resources / Satskhenisi/Maikop
A-23
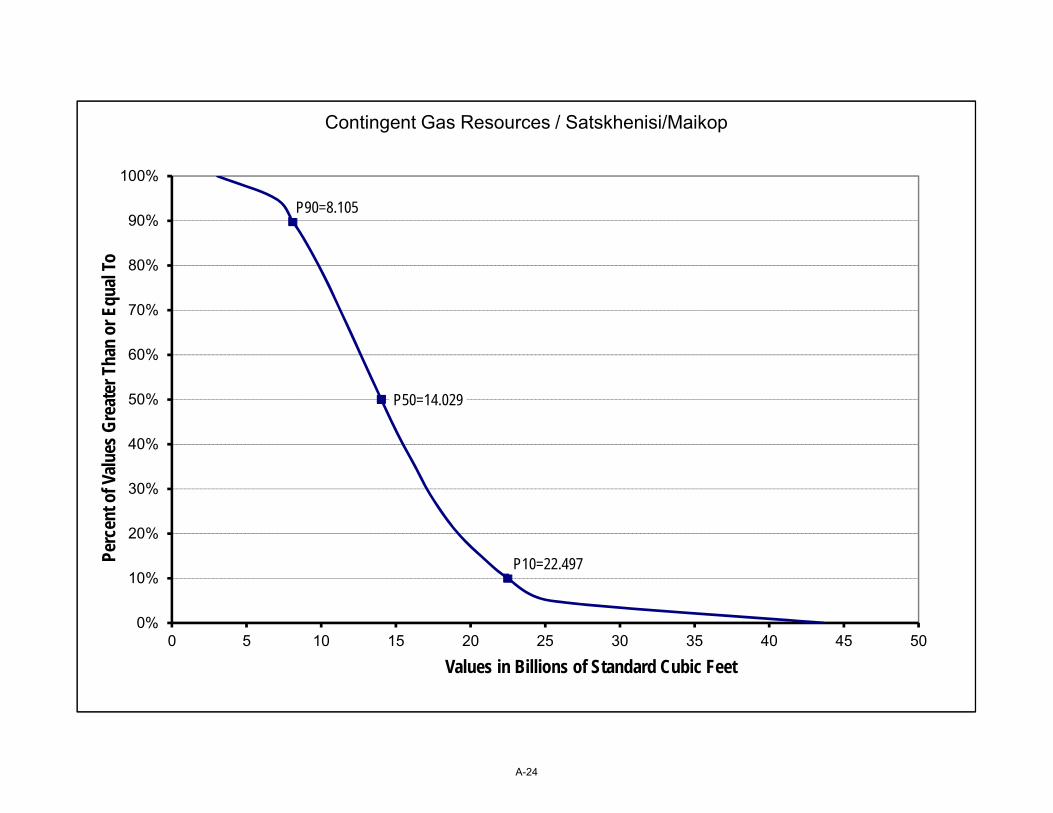
P90=8.105
P50=14.029
P10=22.497
0%
10%
20%
30%
40%
50%
60%
70%
80%
90%
100%
0 5 10 15 20 25 30 35 40 45 50
Perc
ent o
f Val
ues
Gre
ater
Tha
n or
Equ
al T
o
Values in Billions of Standard Cubic Feet
Contingent Gas Resources / Satskhenisi/Maikop
A-24
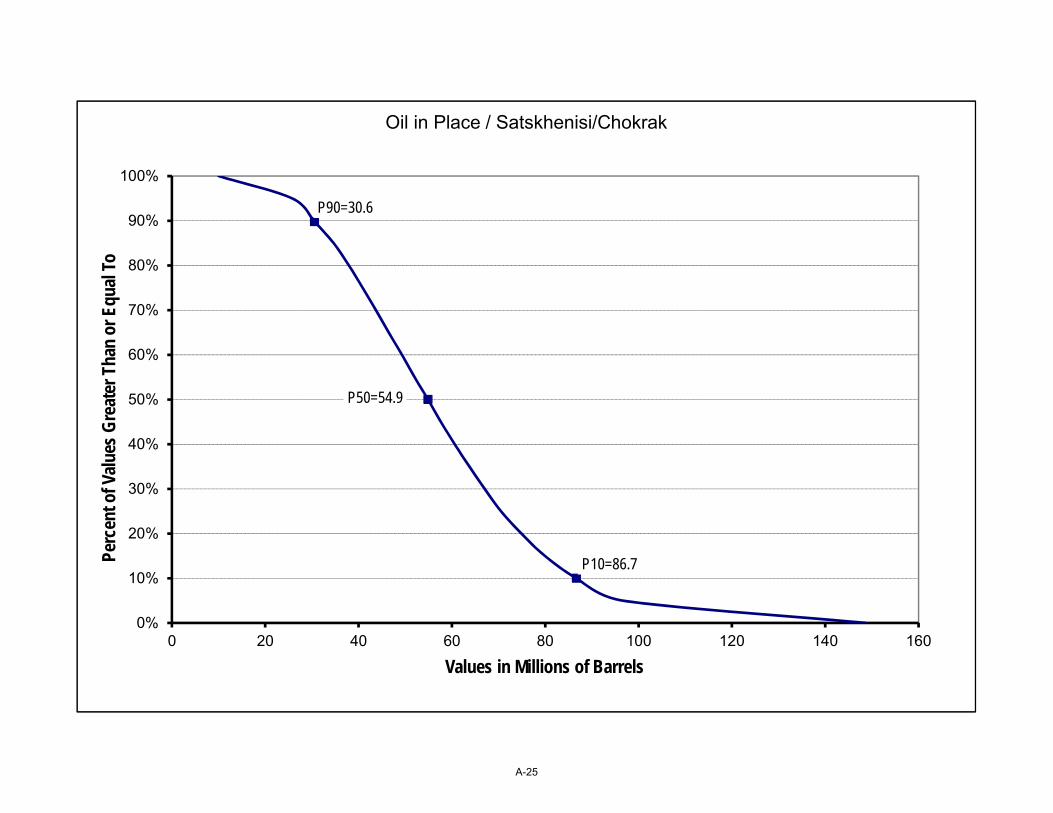
P90=30.6
P50=54.9
P10=86.7
0%
10%
20%
30%
40%
50%
60%
70%
80%
90%
100%
0 20 40 60 80 100 120 140 160
Perc
ent o
f Val
ues
Gre
ater
Tha
n or
Equ
al T
o
Values in Millions of Barrels
Oil in Place / Satskhenisi/Chokrak
A-25

P90=4.8
P50=8.9
P10=14.9
0%
10%
20%
30%
40%
50%
60%
70%
80%
90%
100%
0 5 10 15 20 25 30 35
Perc
ent o
f Val
ues
Gre
ater
Tha
n or
Equ
al T
o
Values in Millions of Barrels
Contingent Oil Resources / Satskhenisi/Chokrak
A-26

P90=1.2
P50=2.4
P10=4.0
0%
10%
20%
30%
40%
50%
60%
70%
80%
90%
100%
0 1 2 3 4 5 6 7 8 9
Perc
ent o
f Val
ues
Gre
ater
Tha
n or
Equ
al T
o
Values in Billions of Standard Cubic Feet
Contingent Gas Resources / Satskhenisi/Chokrak
A-27
Appendix B
Excerpt from Petroleum Resources Management
System

The following are select terms or phrases as defined by Society of Petroleum Engineers (SPE),
American Association of Petroleum Geologists (AAPG), World Petroleum Council (WPC), and
Society of Petroleum Evaluation Engineers (SPEE) in Petroleum Resources Management System,
2007, see figures below. Note that these figures and definitions are consistent with the figures and
definitions provided in the COGEH24: the PRMS versions are reproduced here due to their
completeness.
Resources Classification Framework
24 Canadian Oil and Gas Evaluation Handbook as referenced earlier in this report.

Sub-Classes based on Project Maturity
An Accumulation is an individual body of naturally occurring petroleum in a reservoir.
Contingent Resources are those quantities of petroleum estimated, as of a given date, to be
potentially recoverable from known accumulations by application of development projects, but
which are not currently considered to be commercially recoverable due to one or more
contingencies.

Conventional Resources exist in discrete petroleum accumulations related to localized geological
structural features and/or stratigraphic conditions, typically with each accumulation bounded by a
downdip contact with an aquifer, and which is significantly affected by hydrodynamic influences
such as buoyancy of petroleum in water.
Developed Reserves are expected quantities to be recovered from existing wells and facilities.
Developed Producing Reserves are expected to be recovered from completion intervals that are
open and producing at the time of estimate.
Developed Non-Producing Reserves include shut-in and behind-pipe Reserves.
Estimated Ultimate Recovery (EUR) are those quantities of petroleum which are estimated, on
a given date, to be potentially recoverable from an accumulation, plus those quantities already
produced therefrom.
A Lead is a project associated with a potential accumulation that is currently poorly defined and
requires more data acquisition and/or evaluation in order to be classified as a prospect.
Low/Best/High Estimates are the range of uncertainty that reflects a reasonable range of
estimated potentially recoverable volumes at varying degrees of uncertainty (using the cumulative
scenario approach) for an individual accumulation or a project.
A Play is a project associated with a prospective trend of potential prospects, but which requires
more data acquisition and/or evaluation in order to define specific leads or prospects. A Pool is
an individual and separate accumulation of petroleum in a reservoir.
Possible Reserves are those additional Reserves which analysis of geoscience and engineering
data indicate are less likely to be recoverable that Probable Reserves.
Probable Reserves are those additional Reserves which analysis of geoscience and engineering
data indicate are less likely to be recovered than Proved Reserves but more certain to be recovered
than Possible Reserves.

Probabilistic Estimate is the method of estimation used when the known geoscience, engineering,
and economic data are used to generate a continuous range of estimates and their associated
probabilities.
A Prospect is a project associated with a potential accumulation that is sufficiently well defined
to represent a viable drilling target.
Prospective Resources are those quantities of petroleum which are estimated, as of a given date,
to be potentially recoverable from undiscovered accumulations.
Proved Reserves are those quantities of petroleum, which by analysis of geoscience and
engineering data, can be estimated with reasonable certainty to be commercially recoverable, from
a given date forward, from known reservoirs and under defined economic conditions, operating
methods, and government regulations.
Reserves are those quantities of petroleum anticipated to be commercially recoverable by
application of development projects to known accumulations from a given date forward under
defined conditions. Reserves must further satisfy four criteria: they must be discovered,
recoverable, commercial, and remaining (as of the evaluation date) based on the development
project(s) applied.
Unconventional Resources exist in petroleum accumulations that are pervasive throughout a large
area and that are not significantly affected by hydrodynamic influences (also called “continuous-
type deposits”). Examples include coalbed methane (CBM), basic-centered gas, shale gas, gas
hydrate, natural bitumen (tar sands), and oil shale deposits. Typically, such accumulations require
specialized extraction technology (e.g., dewatering of CBM, massive fracturing programs for shale
gas, steam and/or solvents to mobilize bitumen for in-situ recovery, and, in some cases, mining
activities). Moreover, the extracted petroleum may require significant processing prior to sale
(e.g., bitumen upgraders). (Also termed “Non-Conventional” Resources and “Continuous
Deposits”.)
Undeveloped Reserves are quantities expected to be recovered through future investments.

Appendix C
Glossary of Terms and Abbreviations

The following are abbreviations and definitions for common petroleum terms. 103m3 thousands of cubic meters AVO amplitude versus offset Bbl, Bbls barrel, barrels BCF billions of cubic feet BCM billions of cubic meters Bg gas formation volume factor BHT bottom hole temperature BHP bottom hole pressure Bo oil formation volume factor BOE barrels of oil equivalent BOPD barrels of oil per day BPD barrels per day Btu British thermal units BV bulk volume CNG compressed natural gas CO2 carbon dioxide DHI direct hydrocarbon indicators DHC dry hole cost DST drill-stem test E & P exploration and production EOR enhanced oil recovery EUR estimated ultimate recovery ft feet ft2 square feet FVF formation volume factor G & A general and administrative G & G geological and geophysical g/cm3 grams per cubic centimeter Ga billion (109) years GIIP gas initially in place GOC gas-oil contact GOR gas-oil ratio GR gamma ray (log) GRV gross rock volume GWC gas-water contact ha hectare Hz hertz IDC intangible drilling cost IOR improved oil recovery IRR internal rate of return J & A junked and abandoned km kilometers km2 square kilometers LoF life of field M & A mergers and acquisitions

m meters M thousands MM million m3/day cubic meters per day Ma million years (before present) max maximum MBOPD thousand barrels of oil per day MCFD thousand cubic feet per day MCFGD thousand cubic feet of gas per day MD measured depth mD millidarcies MDSS measured depth subsea min minimum ML most likely MBbl thousand barrels of oil MMBbl million barrels of oil MMBOE million barrels of oil equivalent MMBOPD million barrels of oil per day MMCFGD million cubic feet of gas per day MMTOE million tons of oil equivalent mSS meters subsea NGL natural gas liquids NPV net present value NTG net-to-gross ratio OGIP original gas in place OOIP original oil in place OWC oil-water contact P10 high estimate P50 best estimate P90 low estimate P & A plugged and abandoned ppm parts per million PRMS Petroleum Resources Management System psi pounds per square inch RB reservoir barrels RCF reservoir cubic feet RF recovery factor ROI return on investment ROP rate of penetration SCF standard cubic feet SS subsea STB stock tank barrel STOIIP stock tank oil initially in place Sg gas saturation So oil saturation Sw water saturation

TCF trillion cubic feet TD total depth TDC tangible drilling cost TVD true vertical depth TVDSS true vertical depth subsea TWT two-way time US$ US dollar
Appendix D
Detailed Cash Flow Sheets

NORIO

Yr‐Mo Units Total Jan‐18 Feb‐18 Mar‐18 Apr‐18 May‐18 Jun‐18 Jul‐18 Aug‐18 Sep‐18 Oct‐18 Nov‐18 Dec‐18 Jan‐19 Feb‐19 Mar‐19 Apr‐19 May‐19 Jun‐19
Oil VolumeExisting Production Bbl 32,417 485 480 474 469 463 458 453 448 443 438 433 428 423 418 413 409 404 399
Workovers ‐ SI or BP Bbl 0 0 0 0 0 0 0 0 0 0 0 0 0 0 0 0 0 0 0
Workovers ‐ RDS Bbl 0 0 0 0 0 0 0 0 0 0 0 0 0 0 0 0 0 0 0
Undeveloped Bbl 0 0 0 0 0 0 0 0 0 0 0 0 0 0 0 0 0 0 0
Number of Producing Wells Wells 3 3 3 3 3 3 3 3 3 3 3 3 3 3 3 3 3 3
Existing Production Wells 3 3 3 3 3 3 3 3 3 3 3 3 3 3 3 3 3 3
SI Wells Wells 0 0 0 0 0 0 0 0 0 0 0 0 0 0 0 0 0 0
Lateral Jetting 0 0 0 0 0 0 0 0 0 0 0 0 0 0 0 0 0 0
Undeveloped Wells 0 0 0 0 0 0 0 0 0 0 0 0 0 0 0 0 0 0
$/Bbl 60.56 60.56 60.56 60.56 60.56 60.56 60.56 60.56 60.56 60.56 60.56 60.56 62.81 62.81 62.81 62.81 62.81 62.81
Norio Oil Production BOPM 32,417 485 480 474 469 463 458 453 448 443 438 433 428 423 418 413 409 404 399
Daily Production BOPD 17 17 16 16 16 16 16 15 15 15 15 15 15 14 14 14 14 14
Monthly Oil MMbbls MMBbl 0.0324 0.0005 0.0005 0.0005 0.0005 0.0005 0.0005 0.0005 0.0004 0.0004 0.0004 0.0004 0.0004 0.0004 0.0004 0.0004 0.0004 0.0004 0.0004
Norio Revenue M$ 2.0 0.03 0.02 0.02 0.02 0.02 0.02 0.02 0.02 0.02 0.02 0.02 0.02 0.02 0.02 0.02 0.02 0.02
Total Production Bbl 32,417 485 480 474 469 463 458 453 448 443 438 433 428 423 418 413 409 404 399
Total Project Revenue M$ M$ 2.0 0.00 0.03 0.02 0.02 0.02 0.02 0.02 0.02 0.02 0.02 0.02 0.02 0.02 0.02 0.02 0.02 0.02 0.02
Workovers MM$ 0.0 0 0 0 0 0 0 0 0 0 0 0 0 0 0 0 0 0 0
New Wells MM$ 0.0 0 0 0 0 0 0 0 0 0 0 0 0 0 0 0 0 0 0
CAPEX TOTAL MM$ 0.0 0.00 0.00 0.00 0.00 0.00 0.00 0.00 0.00 0.00 0.00 0.00 0.00 0.00 0.00 0.00 0.00 0.00 0.00
Fixed Opex+OH MM$ 1.8 0.014 0.014 0.014 0.014 0.014 0.014 0.014 0.014 0.014 0.014 0.014 0.014 0.014 0.014 0.014 0.014 0.014 0.014
Floating Opex MM$ 0.0 0.00 0.00 0.00 0.00 0.00 0.00 0.00 0.00 0.00 0.00 0.00 0.00 0.00 0.00 0.00 0.00 0.00 0.00
Workovers MM$ 0.0 0.00 0.00 0.00 0.00 0.00 0.00 0.00 0.00 0.00 0.00 0.00 0.00 0.00 0.00 0.00 0.00 0.00 0.00
Total Norio Opex MM$ 1.8 0.01 0.01 0.01 0.01 0.01 0.01 0.01 0.01 0.01 0.01 0.01 0.01 0.01 0.01 0.01 0.01 0.01 0.01
OPEX TOTAL MM$ 1.8 0.01 0.01 0.01 0.01 0.01 0.01 0.01 0.01 0.01 0.01 0.01 0.01 0.01 0.01 0.01 0.01 0.01 0.01
Recoverable Opex MM$ 0.99 0.0143 0.0143 0.0143 0.0143 0.0143 0.0143 0.0143 0.0143 0.0142 0.0142 0.0142 0.0142 0.0145 0.0145 0.0145 0.0145 0.0146 0.0146
Contractor Opex Cost Oil MM$ 0.99 0.0000 0.0250 0.0179 0.0143 0.0143 0.0143 0.0143 0.0143 0.0142 0.0142 0.0142 0.0142 0.0145 0.0145 0.0145 0.0145 0.0146 0.0146
Unrecovered Opex MM$ 0.0143 0.0036 0.0000 0.0000 0.0000 0.0000 0.0000 0.0000 0.0000 0.0000 0.0000 0.0000 0.0000 0.0000 0.0000 0.0000 0.0000 0.0000
Capex recovery Limit MM$ 0.00 0.00 0.00 0.01 0.00 0.00 0.00 0.00 0.00 0.00 0.00 0.00 0.00 0.00 0.00 0.00 0.00 0.00
Recoverable Capex MM$ 20.00 20.00 20.00 20.00 19.99 19.99 19.98 19.98 19.97 19.97 19.96 19.96 19.96 19.95 19.95 19.94 19.94 19.94
Contractor Capex Cost Oil MM$ 0.16 0.00 0.00 0.00 0.01 0.00 0.00 0.00 0.00 0.00 0.00 0.00 0.00 0.00 0.00 0.00 0.00 0.00 0.00
Unrecovered Capex MM$ 20.00 20.00 20.00 19.99 19.99 19.98 19.98 19.97 19.97 19.96 19.96 19.96 19.95 19.95 19.94 19.94 19.94 19.93
Total Cost Oil MM$ 0.00 0.03 0.02 0.02 0.02 0.02 0.02 0.02 0.02 0.02 0.02 0.02 0.02 0.02 0.02 0.02 0.02 0.02
Total Profit Oil MM$ 0.1561 0.0000 0.0000 0.0034 0.0051 0.0049 0.0048 0.0047 0.0045 0.0044 0.0043 0.0042 0.0040 0.0038 0.0041 0.0040 0.0038 0.0037 0.0036
Contractor Profit Oil MM$ 0.0780 0.0000 0.0000 0.0017 0.0025 0.0025 0.0024 0.0023 0.0023 0.0022 0.0021 0.0021 0.0020 0.0019 0.0021 0.0020 0.0019 0.0019 0.0018
Govt. Profit Oil MM$ 0.0780 0.0000 0.0000 0.0017 0.0025 0.0025 0.0024 0.0023 0.0023 0.0022 0.0021 0.0021 0.0020 0.0019 0.0021 0.0020 0.0019 0.0019 0.0018
Total Contrctr Cost and Profit Oil, MMBbl MMBbl 0.0213 0.0000 0.0005 0.0004 0.0004 0.0004 0.0004 0.0004 0.0004 0.0004 0.0004 0.0004 0.0004 0.0004 0.0004 0.0004 0.0004 0.0004 0.0004
Evaluated Net Oil, MMBbl MMBbl 0.0213 0.0000 0.0005 0.0004 0.0004 0.0004 0.0004 0.0004 0.0004 0.0004 0.0004 0.0004 0.0004 0.0004 0.0004 0.0004 0.0004 0.0004 0.0004
Cash Flow MM$ 0.23 ‐0.01 0.01 0.01 0.01 0.01 0.01 0.01 0.01 0.01 0.01 0.01 0.01 0.01 0.01 0.01 0.01 0.01 0.01
DCF @10% MM$ 0.19 ‐0.01 0.01 0.01 0.01 0.01 0.01 0.01 0.01 0.01 0.01 0.01 0.01 0.01 0.01 0.01 0.01 0.00 0.00
Cumulative CF ‐0.01 0.00 0.01 0.01 0.02 0.03 0.03 0.04 0.05 0.05 0.06 0.07 0.07 0.08 0.08 0.09 0.10 0.10
Total Costs Incurred for Production, MM$ MM$ 21.85 20.01 0.01 0.01 0.01 0.01 0.01 0.01 0.01 0.01 0.01 0.01 0.01 0.01 0.01 0.01 0.01 0.01 0.01
Cumulative Total Costs, MM$ MM$ 21.85 20.01 20.03 20.04 20.06 20.07 20.09 20.10 20.11 20.13 20.14 20.16 20.17 20.19 20.20 20.21 20.23 20.24 20.26
Cntrctr's Total Profit from Sales of Oil, MM$ MM$ 1.23 0.00 0.03 0.02 0.02 0.02 0.02 0.02 0.02 0.02 0.02 0.02 0.02 0.02 0.02 0.02 0.02 0.02 0.02
Cumulative Total Profit, MM$ MM$ 1.23 0.00 0.03 0.05 0.07 0.09 0.11 0.13 0.16 0.18 0.20 0.22 0.24 0.26 0.28 0.30 0.32 0.34 0.36
Payout? 1=yes, 0=no 0 0 0 0 0 0 0 0 0 0 0 0 0 0 0 0 0 0
Producing Wells Only Case, Mean Values
Norio
Profit Sh
are
Norio
CAPE
X
Brent Oil Price
Reve
nue
NORIO
Prod
uctio
n
Norio
Ope
x
Norio
Cost Recov
ery
Norio
Norio
Paym
ent
Date
Norio
Cash
Flow
Page 1 of 6 5/14/201810:26 PM
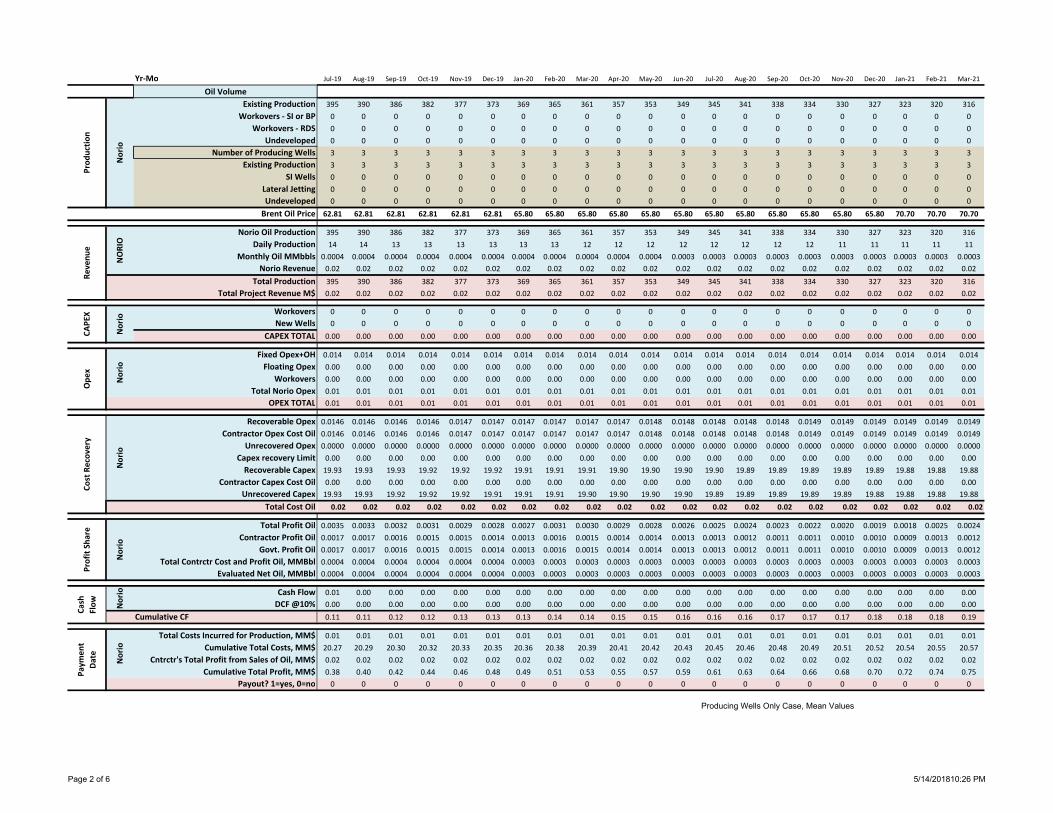
Yr‐MoOil Volume
Existing ProductionWorkovers ‐ SI or BP
Workovers ‐ RDSUndeveloped
Number of Producing WellsExisting Production
SI WellsLateral JettingUndeveloped
Norio Oil ProductionDaily Production
Monthly Oil MMbblsNorio Revenue
Total ProductionTotal Project Revenue M$
WorkoversNew Wells
CAPEX TOTAL
Fixed Opex+OHFloating Opex
WorkoversTotal Norio Opex
OPEX TOTAL
Recoverable OpexContractor Opex Cost Oil
Unrecovered OpexCapex recovery LimitRecoverable Capex
Contractor Capex Cost OilUnrecovered Capex
Total Cost Oil
Total Profit OilContractor Profit Oil
Govt. Profit OilTotal Contrctr Cost and Profit Oil, MMBbl
Evaluated Net Oil, MMBbl
Cash FlowDCF @10%
Cumulative CF
Total Costs Incurred for Production, MM$Cumulative Total Costs, MM$
Cntrctr's Total Profit from Sales of Oil, MM$Cumulative Total Profit, MM$
Payout? 1=yes, 0=no
Norio
Profit Sh
are
Norio
CAPE
X
Brent Oil Price
Reve
nue
NORIO
Prod
uctio
n
Norio
Ope
x
Norio
Cost Recov
ery
Norio
Norio
Paym
ent
Date
Norio
Cash
Flow
Jul‐19 Aug‐19 Sep‐19 Oct‐19 Nov‐19 Dec‐19 Jan‐20 Feb‐20 Mar‐20 Apr‐20 May‐20 Jun‐20 Jul‐20 Aug‐20 Sep‐20 Oct‐20 Nov‐20 Dec‐20 Jan‐21 Feb‐21 Mar‐21
395 390 386 382 377 373 369 365 361 357 353 349 345 341 338 334 330 327 323 320 316
0 0 0 0 0 0 0 0 0 0 0 0 0 0 0 0 0 0 0 0 0
0 0 0 0 0 0 0 0 0 0 0 0 0 0 0 0 0 0 0 0 0
0 0 0 0 0 0 0 0 0 0 0 0 0 0 0 0 0 0 0 0 0
3 3 3 3 3 3 3 3 3 3 3 3 3 3 3 3 3 3 3 3 3
3 3 3 3 3 3 3 3 3 3 3 3 3 3 3 3 3 3 3 3 3
0 0 0 0 0 0 0 0 0 0 0 0 0 0 0 0 0 0 0 0 0
0 0 0 0 0 0 0 0 0 0 0 0 0 0 0 0 0 0 0 0 0
0 0 0 0 0 0 0 0 0 0 0 0 0 0 0 0 0 0 0 0 0
62.81 62.81 62.81 62.81 62.81 62.81 65.80 65.80 65.80 65.80 65.80 65.80 65.80 65.80 65.80 65.80 65.80 65.80 70.70 70.70 70.70
395 390 386 382 377 373 369 365 361 357 353 349 345 341 338 334 330 327 323 320 316
14 14 13 13 13 13 13 13 12 12 12 12 12 12 12 12 11 11 11 11 11
0.0004 0.0004 0.0004 0.0004 0.0004 0.0004 0.0004 0.0004 0.0004 0.0004 0.0004 0.0003 0.0003 0.0003 0.0003 0.0003 0.0003 0.0003 0.0003 0.0003 0.0003
0.02 0.02 0.02 0.02 0.02 0.02 0.02 0.02 0.02 0.02 0.02 0.02 0.02 0.02 0.02 0.02 0.02 0.02 0.02 0.02 0.02
395 390 386 382 377 373 369 365 361 357 353 349 345 341 338 334 330 327 323 320 316
0.02 0.02 0.02 0.02 0.02 0.02 0.02 0.02 0.02 0.02 0.02 0.02 0.02 0.02 0.02 0.02 0.02 0.02 0.02 0.02 0.02
0 0 0 0 0 0 0 0 0 0 0 0 0 0 0 0 0 0 0 0 0
0 0 0 0 0 0 0 0 0 0 0 0 0 0 0 0 0 0 0 0 0
0.00 0.00 0.00 0.00 0.00 0.00 0.00 0.00 0.00 0.00 0.00 0.00 0.00 0.00 0.00 0.00 0.00 0.00 0.00 0.00 0.00
0.014 0.014 0.014 0.014 0.014 0.014 0.014 0.014 0.014 0.014 0.014 0.014 0.014 0.014 0.014 0.014 0.014 0.014 0.014 0.014 0.014
0.00 0.00 0.00 0.00 0.00 0.00 0.00 0.00 0.00 0.00 0.00 0.00 0.00 0.00 0.00 0.00 0.00 0.00 0.00 0.00 0.00
0.00 0.00 0.00 0.00 0.00 0.00 0.00 0.00 0.00 0.00 0.00 0.00 0.00 0.00 0.00 0.00 0.00 0.00 0.00 0.00 0.00
0.01 0.01 0.01 0.01 0.01 0.01 0.01 0.01 0.01 0.01 0.01 0.01 0.01 0.01 0.01 0.01 0.01 0.01 0.01 0.01 0.01
0.01 0.01 0.01 0.01 0.01 0.01 0.01 0.01 0.01 0.01 0.01 0.01 0.01 0.01 0.01 0.01 0.01 0.01 0.01 0.01 0.01
0.0146 0.0146 0.0146 0.0146 0.0147 0.0147 0.0147 0.0147 0.0147 0.0147 0.0148 0.0148 0.0148 0.0148 0.0148 0.0149 0.0149 0.0149 0.0149 0.0149 0.0149
0.0146 0.0146 0.0146 0.0146 0.0147 0.0147 0.0147 0.0147 0.0147 0.0147 0.0148 0.0148 0.0148 0.0148 0.0148 0.0149 0.0149 0.0149 0.0149 0.0149 0.0149
0.0000 0.0000 0.0000 0.0000 0.0000 0.0000 0.0000 0.0000 0.0000 0.0000 0.0000 0.0000 0.0000 0.0000 0.0000 0.0000 0.0000 0.0000 0.0000 0.0000 0.0000
0.00 0.00 0.00 0.00 0.00 0.00 0.00 0.00 0.00 0.00 0.00 0.00 0.00 0.00 0.00 0.00 0.00 0.00 0.00 0.00 0.00
19.93 19.93 19.93 19.92 19.92 19.92 19.91 19.91 19.91 19.90 19.90 19.90 19.90 19.89 19.89 19.89 19.89 19.89 19.88 19.88 19.88
0.00 0.00 0.00 0.00 0.00 0.00 0.00 0.00 0.00 0.00 0.00 0.00 0.00 0.00 0.00 0.00 0.00 0.00 0.00 0.00 0.00
19.93 19.93 19.92 19.92 19.92 19.91 19.91 19.91 19.90 19.90 19.90 19.90 19.89 19.89 19.89 19.89 19.89 19.88 19.88 19.88 19.88
0.02 0.02 0.02 0.02 0.02 0.02 0.02 0.02 0.02 0.02 0.02 0.02 0.02 0.02 0.02 0.02 0.02 0.02 0.02 0.02 0.02
0.0035 0.0033 0.0032 0.0031 0.0029 0.0028 0.0027 0.0031 0.0030 0.0029 0.0028 0.0026 0.0025 0.0024 0.0023 0.0022 0.0020 0.0019 0.0018 0.0025 0.0024
0.0017 0.0017 0.0016 0.0015 0.0015 0.0014 0.0013 0.0016 0.0015 0.0014 0.0014 0.0013 0.0013 0.0012 0.0011 0.0011 0.0010 0.0010 0.0009 0.0013 0.0012
0.0017 0.0017 0.0016 0.0015 0.0015 0.0014 0.0013 0.0016 0.0015 0.0014 0.0014 0.0013 0.0013 0.0012 0.0011 0.0011 0.0010 0.0010 0.0009 0.0013 0.0012
0.0004 0.0004 0.0004 0.0004 0.0004 0.0004 0.0003 0.0003 0.0003 0.0003 0.0003 0.0003 0.0003 0.0003 0.0003 0.0003 0.0003 0.0003 0.0003 0.0003 0.0003
0.0004 0.0004 0.0004 0.0004 0.0004 0.0004 0.0003 0.0003 0.0003 0.0003 0.0003 0.0003 0.0003 0.0003 0.0003 0.0003 0.0003 0.0003 0.0003 0.0003 0.0003
0.01 0.00 0.00 0.00 0.00 0.00 0.00 0.00 0.00 0.00 0.00 0.00 0.00 0.00 0.00 0.00 0.00 0.00 0.00 0.00 0.00
0.00 0.00 0.00 0.00 0.00 0.00 0.00 0.00 0.00 0.00 0.00 0.00 0.00 0.00 0.00 0.00 0.00 0.00 0.00 0.00 0.00
0.11 0.11 0.12 0.12 0.13 0.13 0.13 0.14 0.14 0.15 0.15 0.16 0.16 0.16 0.17 0.17 0.17 0.18 0.18 0.18 0.19
0.01 0.01 0.01 0.01 0.01 0.01 0.01 0.01 0.01 0.01 0.01 0.01 0.01 0.01 0.01 0.01 0.01 0.01 0.01 0.01 0.01
20.27 20.29 20.30 20.32 20.33 20.35 20.36 20.38 20.39 20.41 20.42 20.43 20.45 20.46 20.48 20.49 20.51 20.52 20.54 20.55 20.57
0.02 0.02 0.02 0.02 0.02 0.02 0.02 0.02 0.02 0.02 0.02 0.02 0.02 0.02 0.02 0.02 0.02 0.02 0.02 0.02 0.02
0.38 0.40 0.42 0.44 0.46 0.48 0.49 0.51 0.53 0.55 0.57 0.59 0.61 0.63 0.64 0.66 0.68 0.70 0.72 0.74 0.75
0 0 0 0 0 0 0 0 0 0 0 0 0 0 0 0 0 0 0 0 0
Producing Wells Only Case, Mean Values
Page 2 of 6 5/14/201810:26 PM
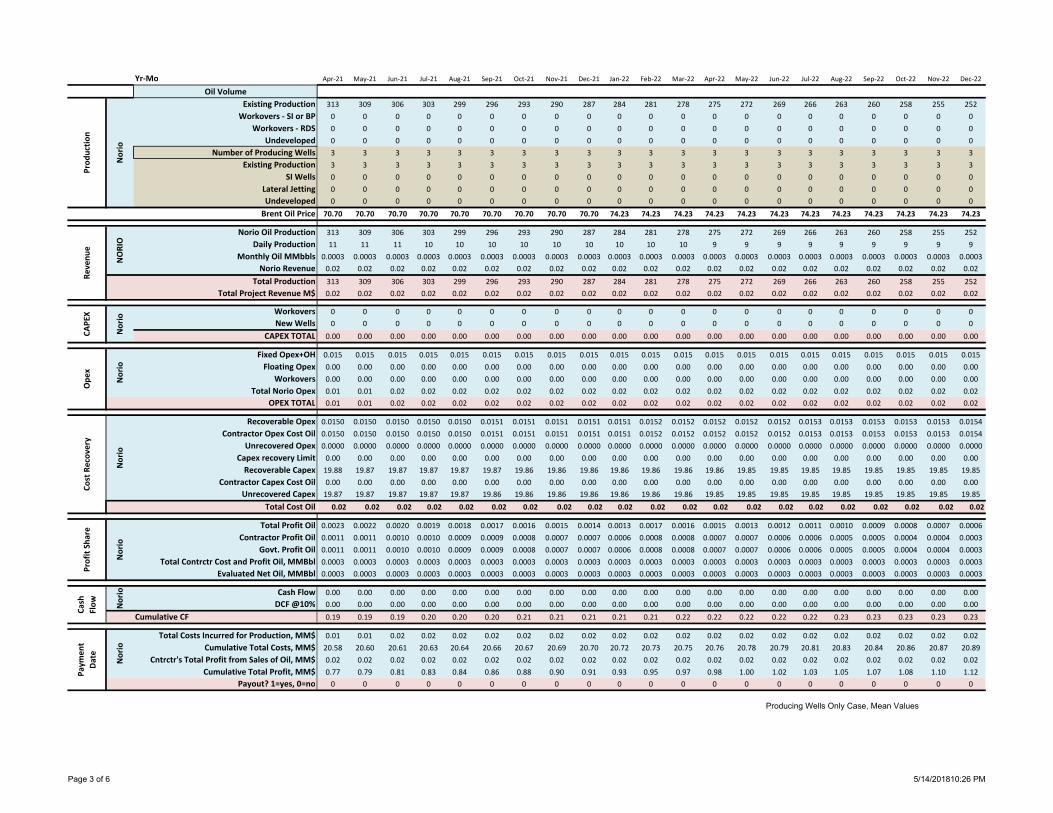
Yr‐MoOil Volume
Existing ProductionWorkovers ‐ SI or BP
Workovers ‐ RDSUndeveloped
Number of Producing WellsExisting Production
SI WellsLateral JettingUndeveloped
Norio Oil ProductionDaily Production
Monthly Oil MMbblsNorio Revenue
Total ProductionTotal Project Revenue M$
WorkoversNew Wells
CAPEX TOTAL
Fixed Opex+OHFloating Opex
WorkoversTotal Norio Opex
OPEX TOTAL
Recoverable OpexContractor Opex Cost Oil
Unrecovered OpexCapex recovery LimitRecoverable Capex
Contractor Capex Cost OilUnrecovered Capex
Total Cost Oil
Total Profit OilContractor Profit Oil
Govt. Profit OilTotal Contrctr Cost and Profit Oil, MMBbl
Evaluated Net Oil, MMBbl
Cash FlowDCF @10%
Cumulative CF
Total Costs Incurred for Production, MM$Cumulative Total Costs, MM$
Cntrctr's Total Profit from Sales of Oil, MM$Cumulative Total Profit, MM$
Payout? 1=yes, 0=no
Norio
Profit Sh
are
Norio
CAPE
X
Brent Oil Price
Reve
nue
NORIO
Prod
uctio
n
Norio
Ope
x
Norio
Cost Recov
ery
Norio
Norio
Paym
ent
Date
Norio
Cash
Flow
Apr‐21 May‐21 Jun‐21 Jul‐21 Aug‐21 Sep‐21 Oct‐21 Nov‐21 Dec‐21 Jan‐22 Feb‐22 Mar‐22 Apr‐22 May‐22 Jun‐22 Jul‐22 Aug‐22 Sep‐22 Oct‐22 Nov‐22 Dec‐22
313 309 306 303 299 296 293 290 287 284 281 278 275 272 269 266 263 260 258 255 252
0 0 0 0 0 0 0 0 0 0 0 0 0 0 0 0 0 0 0 0 0
0 0 0 0 0 0 0 0 0 0 0 0 0 0 0 0 0 0 0 0 0
0 0 0 0 0 0 0 0 0 0 0 0 0 0 0 0 0 0 0 0 0
3 3 3 3 3 3 3 3 3 3 3 3 3 3 3 3 3 3 3 3 3
3 3 3 3 3 3 3 3 3 3 3 3 3 3 3 3 3 3 3 3 3
0 0 0 0 0 0 0 0 0 0 0 0 0 0 0 0 0 0 0 0 0
0 0 0 0 0 0 0 0 0 0 0 0 0 0 0 0 0 0 0 0 0
0 0 0 0 0 0 0 0 0 0 0 0 0 0 0 0 0 0 0 0 0
70.70 70.70 70.70 70.70 70.70 70.70 70.70 70.70 70.70 74.23 74.23 74.23 74.23 74.23 74.23 74.23 74.23 74.23 74.23 74.23 74.23
313 309 306 303 299 296 293 290 287 284 281 278 275 272 269 266 263 260 258 255 252
11 11 11 10 10 10 10 10 10 10 10 10 9 9 9 9 9 9 9 9 9
0.0003 0.0003 0.0003 0.0003 0.0003 0.0003 0.0003 0.0003 0.0003 0.0003 0.0003 0.0003 0.0003 0.0003 0.0003 0.0003 0.0003 0.0003 0.0003 0.0003 0.0003
0.02 0.02 0.02 0.02 0.02 0.02 0.02 0.02 0.02 0.02 0.02 0.02 0.02 0.02 0.02 0.02 0.02 0.02 0.02 0.02 0.02
313 309 306 303 299 296 293 290 287 284 281 278 275 272 269 266 263 260 258 255 252
0.02 0.02 0.02 0.02 0.02 0.02 0.02 0.02 0.02 0.02 0.02 0.02 0.02 0.02 0.02 0.02 0.02 0.02 0.02 0.02 0.02
0 0 0 0 0 0 0 0 0 0 0 0 0 0 0 0 0 0 0 0 0
0 0 0 0 0 0 0 0 0 0 0 0 0 0 0 0 0 0 0 0 0
0.00 0.00 0.00 0.00 0.00 0.00 0.00 0.00 0.00 0.00 0.00 0.00 0.00 0.00 0.00 0.00 0.00 0.00 0.00 0.00 0.00
0.015 0.015 0.015 0.015 0.015 0.015 0.015 0.015 0.015 0.015 0.015 0.015 0.015 0.015 0.015 0.015 0.015 0.015 0.015 0.015 0.015
0.00 0.00 0.00 0.00 0.00 0.00 0.00 0.00 0.00 0.00 0.00 0.00 0.00 0.00 0.00 0.00 0.00 0.00 0.00 0.00 0.00
0.00 0.00 0.00 0.00 0.00 0.00 0.00 0.00 0.00 0.00 0.00 0.00 0.00 0.00 0.00 0.00 0.00 0.00 0.00 0.00 0.00
0.01 0.01 0.02 0.02 0.02 0.02 0.02 0.02 0.02 0.02 0.02 0.02 0.02 0.02 0.02 0.02 0.02 0.02 0.02 0.02 0.02
0.01 0.01 0.02 0.02 0.02 0.02 0.02 0.02 0.02 0.02 0.02 0.02 0.02 0.02 0.02 0.02 0.02 0.02 0.02 0.02 0.02
0.0150 0.0150 0.0150 0.0150 0.0150 0.0151 0.0151 0.0151 0.0151 0.0151 0.0152 0.0152 0.0152 0.0152 0.0152 0.0153 0.0153 0.0153 0.0153 0.0153 0.0154
0.0150 0.0150 0.0150 0.0150 0.0150 0.0151 0.0151 0.0151 0.0151 0.0151 0.0152 0.0152 0.0152 0.0152 0.0152 0.0153 0.0153 0.0153 0.0153 0.0153 0.0154
0.0000 0.0000 0.0000 0.0000 0.0000 0.0000 0.0000 0.0000 0.0000 0.0000 0.0000 0.0000 0.0000 0.0000 0.0000 0.0000 0.0000 0.0000 0.0000 0.0000 0.0000
0.00 0.00 0.00 0.00 0.00 0.00 0.00 0.00 0.00 0.00 0.00 0.00 0.00 0.00 0.00 0.00 0.00 0.00 0.00 0.00 0.00
19.88 19.87 19.87 19.87 19.87 19.87 19.86 19.86 19.86 19.86 19.86 19.86 19.86 19.85 19.85 19.85 19.85 19.85 19.85 19.85 19.85
0.00 0.00 0.00 0.00 0.00 0.00 0.00 0.00 0.00 0.00 0.00 0.00 0.00 0.00 0.00 0.00 0.00 0.00 0.00 0.00 0.00
19.87 19.87 19.87 19.87 19.87 19.86 19.86 19.86 19.86 19.86 19.86 19.86 19.85 19.85 19.85 19.85 19.85 19.85 19.85 19.85 19.85
0.02 0.02 0.02 0.02 0.02 0.02 0.02 0.02 0.02 0.02 0.02 0.02 0.02 0.02 0.02 0.02 0.02 0.02 0.02 0.02 0.02
0.0023 0.0022 0.0020 0.0019 0.0018 0.0017 0.0016 0.0015 0.0014 0.0013 0.0017 0.0016 0.0015 0.0013 0.0012 0.0011 0.0010 0.0009 0.0008 0.0007 0.0006
0.0011 0.0011 0.0010 0.0010 0.0009 0.0009 0.0008 0.0007 0.0007 0.0006 0.0008 0.0008 0.0007 0.0007 0.0006 0.0006 0.0005 0.0005 0.0004 0.0004 0.0003
0.0011 0.0011 0.0010 0.0010 0.0009 0.0009 0.0008 0.0007 0.0007 0.0006 0.0008 0.0008 0.0007 0.0007 0.0006 0.0006 0.0005 0.0005 0.0004 0.0004 0.0003
0.0003 0.0003 0.0003 0.0003 0.0003 0.0003 0.0003 0.0003 0.0003 0.0003 0.0003 0.0003 0.0003 0.0003 0.0003 0.0003 0.0003 0.0003 0.0003 0.0003 0.0003
0.0003 0.0003 0.0003 0.0003 0.0003 0.0003 0.0003 0.0003 0.0003 0.0003 0.0003 0.0003 0.0003 0.0003 0.0003 0.0003 0.0003 0.0003 0.0003 0.0003 0.0003
0.00 0.00 0.00 0.00 0.00 0.00 0.00 0.00 0.00 0.00 0.00 0.00 0.00 0.00 0.00 0.00 0.00 0.00 0.00 0.00 0.00
0.00 0.00 0.00 0.00 0.00 0.00 0.00 0.00 0.00 0.00 0.00 0.00 0.00 0.00 0.00 0.00 0.00 0.00 0.00 0.00 0.00
0.19 0.19 0.19 0.20 0.20 0.20 0.21 0.21 0.21 0.21 0.21 0.22 0.22 0.22 0.22 0.22 0.23 0.23 0.23 0.23 0.23
0.01 0.01 0.02 0.02 0.02 0.02 0.02 0.02 0.02 0.02 0.02 0.02 0.02 0.02 0.02 0.02 0.02 0.02 0.02 0.02 0.02
20.58 20.60 20.61 20.63 20.64 20.66 20.67 20.69 20.70 20.72 20.73 20.75 20.76 20.78 20.79 20.81 20.83 20.84 20.86 20.87 20.89
0.02 0.02 0.02 0.02 0.02 0.02 0.02 0.02 0.02 0.02 0.02 0.02 0.02 0.02 0.02 0.02 0.02 0.02 0.02 0.02 0.02
0.77 0.79 0.81 0.83 0.84 0.86 0.88 0.90 0.91 0.93 0.95 0.97 0.98 1.00 1.02 1.03 1.05 1.07 1.08 1.10 1.12
0 0 0 0 0 0 0 0 0 0 0 0 0 0 0 0 0 0 0 0 0
Producing Wells Only Case, Mean Values
Page 3 of 6 5/14/201810:26 PM

Yr‐MoOil Volume
Existing ProductionWorkovers ‐ SI or BP
Workovers ‐ RDSUndeveloped
Number of Producing WellsExisting Production
SI WellsLateral JettingUndeveloped
Norio Oil ProductionDaily Production
Monthly Oil MMbblsNorio Revenue
Total ProductionTotal Project Revenue M$
WorkoversNew Wells
CAPEX TOTAL
Fixed Opex+OHFloating Opex
WorkoversTotal Norio Opex
OPEX TOTAL
Recoverable OpexContractor Opex Cost Oil
Unrecovered OpexCapex recovery LimitRecoverable Capex
Contractor Capex Cost OilUnrecovered Capex
Total Cost Oil
Total Profit OilContractor Profit Oil
Govt. Profit OilTotal Contrctr Cost and Profit Oil, MMBbl
Evaluated Net Oil, MMBbl
Cash FlowDCF @10%
Cumulative CF
Total Costs Incurred for Production, MM$Cumulative Total Costs, MM$
Cntrctr's Total Profit from Sales of Oil, MM$Cumulative Total Profit, MM$
Payout? 1=yes, 0=no
Norio
Profit Sh
are
Norio
CAPE
X
Brent Oil Price
Reve
nue
NORIO
Prod
uctio
n
Norio
Ope
x
Norio
Cost Recov
ery
Norio
Norio
Paym
ent
Date
Norio
Cash
Flow
Jan‐23 Feb‐23 Mar‐23 Apr‐23 May‐23 Jun‐23 Jul‐23 Aug‐23 Sep‐23 Oct‐23 Nov‐23 Dec‐23 Jan‐24 Feb‐24 Mar‐24 Apr‐24 May‐24 Jun‐24 Jul‐24 Aug‐24
250 247 244 242 239 237 234 232 230 227 225 222 220 218 216 213 211 209 207 205
0 0 0 0 0 0 0 0 0 0 0 0 0 0 0 0 0 0 0 0
0 0 0 0 0 0 0 0 0 0 0 0 0 0 0 0 0 0 0 0
0 0 0 0 0 0 0 0 0 0 0 0 0 0 0 0 0 0 0 0
3 3 3 3 3 3 3 3 3 3 3 3 3 3 3 3 3 3 3 3
3 3 3 3 3 3 3 3 3 3 3 3 3 3 3 3 3 3 3 3
0 0 0 0 0 0 0 0 0 0 0 0 0 0 0 0 0 0 0 0
0 0 0 0 0 0 0 0 0 0 0 0 0 0 0 0 0 0 0 0
0 0 0 0 0 0 0 0 0 0 0 0 0 0 0 0 0 0 0 0
75.21 75.21 75.21 75.21 75.21 75.21 75.21 75.21 75.21 75.21 75.21 75.21 76.23 76.23 76.23 76.23 76.23 76.23 76.23 76.23
250 247 244 242 239 237 234 232 230 227 225 222 220 218 216 213 211 209 207 205
9 9 8 8 8 8 8 8 8 8 8 8 8 8 7 7 7 7 7 7
0.0002 0.0002 0.0002 0.0002 0.0002 0.0002 0.0002 0.0002 0.0002 0.0002 0.0002 0.0002 0.0002 0.0002 0.0002 0.0002 0.0002 0.0002 0.0002 0.0002
0.02 0.02 0.02 0.02 0.02 0.02 0.02 0.02 0.02 0.02 0.02 0.01 0.01 0.01 0.01 0.01 0.01 0.01 0.01 0.01
250 247 244 242 239 237 234 232 230 227 225 222 220 218 216 213 211 209 207 205
0.02 0.02 0.02 0.02 0.02 0.02 0.02 0.02 0.02 0.02 0.02 0.01 0.01 0.01 0.01 0.01 0.01 0.01 0.01 0.01
0 0 0 0 0 0 0 0 0 0 0 0 0 0 0 0 0 0 0 0
0 0 0 0 0 0 0 0 0 0 0 0 0 0 0 0 0 0 0 0
0.00 0.00 0.00 0.00 0.00 0.00 0.00 0.00 0.00 0.00 0.00 0.00 0.00 0.00 0.00 0.00 0.00 0.00 0.00 0.00
0.015 0.015 0.015 0.015 0.015 0.015 0.015 0.015 0.015 0.015 0.015 0.015 0.015 0.015 0.015 0.015 0.015 0.015 0.015 0.016
0.00 0.00 0.00 0.00 0.00 0.00 0.00 0.00 0.00 0.00 0.00 0.00 0.00 0.00 0.00 0.00 0.00 0.00 0.00 0.00
0.00 0.00 0.00 0.00 0.00 0.00 0.00 0.00 0.00 0.00 0.00 0.00 0.00 0.00 0.00 0.00 0.00 0.00 0.00 0.00
0.02 0.02 0.02 0.02 0.02 0.02 0.02 0.02 0.02 0.02 0.02 0.02 0.02 0.02 0.02 0.02 0.02 0.02 0.02 0.02
0.02 0.02 0.02 0.02 0.02 0.02 0.02 0.02 0.02 0.02 0.02 0.02 0.02 0.02 0.02 0.02 0.02 0.02 0.02 0.02
0.0154 0.0154 0.0154 0.0155 0.0155 0.0155 0.0155 0.0000 0.0000 0.0000 0.0000 0.0000 0.0000 0.0000 0.0000 0.0000 0.0000 0.0000 0.0000 0.0000
0.0154 0.0154 0.0154 0.0155 0.0155 0.0155 0.0155 0.0000 0.0000 0.0000 0.0000 0.0000 0.0000 0.0000 0.0000 0.0000 0.0000 0.0000 0.0000 0.0000
0.0000 0.0000 0.0000 0.0000 0.0000 0.0000 0.0000 0.0000 0.0000 0.0000 0.0000 0.0000 0.0000 0.0000 0.0000 0.0000 0.0000 0.0000 0.0000 0.0000
0.00 0.00 0.00 0.00 0.00 0.00 0.00 0.00 0.00 0.00 0.00 0.00 0.00 0.00 0.00 0.00 0.00 0.00 0.00 0.00
19.85 19.85 19.85 19.84 19.84 19.84 19.84 0.00 0.00 0.00 0.00 0.00 0.00 0.00 0.00 0.00 0.00 0.00 0.00 0.00
0.00 0.00 0.00 0.00 0.00 0.00 0.00 0.00 0.00 0.00 0.00 0.00 0.00 0.00 0.00 0.00 0.00 0.00 0.00 0.00
19.85 19.85 19.84 19.84 19.84 19.84 19.84 0.00 0.00 0.00 0.00 0.00 0.00 0.00 0.00 0.00 0.00 0.00 0.00 0.00
0.02 0.02 0.02 0.02 0.02 0.02 0.02 0.00 0.00 0.00 0.00 0.00 0.00 0.00 0.00 0.00 0.00 0.00 0.00 0.00
0.0005 0.0006 0.0005 0.0004 0.0003 0.0002 0.0001 0.0000 0.0000 0.0000 0.0000 0.0000 0.0000 0.0000 0.0000 0.0000 0.0000 0.0000 0.0000 0.0000
0.0003 0.0003 0.0002 0.0002 0.0001 0.0001 0.0000 0.0000 0.0000 0.0000 0.0000 0.0000 0.0000 0.0000 0.0000 0.0000 0.0000 0.0000 0.0000 0.0000
0.0003 0.0003 0.0002 0.0002 0.0001 0.0001 0.0000 0.0000 0.0000 0.0000 0.0000 0.0000 0.0000 0.0000 0.0000 0.0000 0.0000 0.0000 0.0000 0.0000
0.0002 0.0002 0.0002 0.0002 0.0002 0.0002 0.0002 0.0000 0.0000 0.0000 0.0000 0.0000 0.0000 0.0000 0.0000 0.0000 0.0000 0.0000 0.0000 0.0000
0.0002 0.0002 0.0002 0.0002 0.0002 0.0002 0.0002 0.0000 0.0000 0.0000 0.0000 0.0000 0.0000 0.0000 0.0000 0.0000 0.0000 0.0000 0.0000 0.0000
0.00 0.00 0.00 0.00 0.00 0.00 0.00 0.00 0.00 0.00 0.00 0.00 0.00 0.00 0.00 0.00 0.00 0.00 0.00 0.00
0.00 0.00 0.00 0.00 0.00 0.00 0.00 0.00 0.00 0.00 0.00 0.00 0.00 0.00 0.00 0.00 0.00 0.00 0.00 0.00
0.23 0.23 0.23 0.23 0.23 0.23 0.23 0.23 0.23 0.23 0.23 0.23 0.23 0.23 0.23 0.23 0.23 0.23 0.23 0.23
0.02 0.02 0.02 0.02 0.02 0.02 0.02 0.02 0.02 0.02 0.02 0.02 0.02 0.02 0.02 0.02 0.02 0.02 0.02 0.02
20.90 20.92 20.93 20.95 20.96 20.98 20.99 21.01 21.03 21.04 21.06 21.07 21.09 21.10 21.12 21.14 21.15 21.17 21.18 21.20
0.02 0.02 0.02 0.02 0.02 0.02 0.02 0.00 0.00 0.00 0.00 0.00 0.00 0.00 0.00 0.00 0.00 0.00 0.00 0.00
1.13 1.15 1.17 1.18 1.20 1.21 1.23 1.23 1.23 1.23 1.23 1.23 1.23 1.23 1.23 1.23 1.23 1.23 1.23 1.23
0 0 0 0 0 0 0 0 0 0 0 0 0 0 0 0 0 0 0 0
Producing Wells Only Case, Mean
Page 4 of 6 5/14/201810:26 PM

Yr‐MoOil Volume
Existing ProductionWorkovers ‐ SI or BP
Workovers ‐ RDSUndeveloped
Number of Producing WellsExisting Production
SI WellsLateral JettingUndeveloped
Norio Oil ProductionDaily Production
Monthly Oil MMbblsNorio Revenue
Total ProductionTotal Project Revenue M$
WorkoversNew Wells
CAPEX TOTAL
Fixed Opex+OHFloating Opex
WorkoversTotal Norio Opex
OPEX TOTAL
Recoverable OpexContractor Opex Cost Oil
Unrecovered OpexCapex recovery LimitRecoverable Capex
Contractor Capex Cost OilUnrecovered Capex
Total Cost Oil
Total Profit OilContractor Profit Oil
Govt. Profit OilTotal Contrctr Cost and Profit Oil, MMBbl
Evaluated Net Oil, MMBbl
Cash FlowDCF @10%
Cumulative CF
Total Costs Incurred for Production, MM$Cumulative Total Costs, MM$
Cntrctr's Total Profit from Sales of Oil, MM$Cumulative Total Profit, MM$
Payout? 1=yes, 0=no
Norio
Profit Sh
are
Norio
CAPE
X
Brent Oil Price
Reve
nue
NORIO
Prod
uctio
n
Norio
Ope
x
Norio
Cost Recov
ery
Norio
Norio
Paym
ent
Date
Norio
Cash
Flow
Sep‐24 Oct‐24 Nov‐24 Dec‐24 Jan‐25 Feb‐25 Mar‐25 Apr‐25 May‐25 Jun‐25 Jul‐25 Aug‐25 Sep‐25 Oct‐25 Nov‐25 Dec‐25 Jan‐26 Feb‐26 Mar‐26 Apr‐26
203 201 199 197 195 193 191 189 187 185 183 181 180 178 176 174 173 171 169 168
0 0 0 0 0 0 0 0 0 0 0 0 0 0 0 0 0 0 0 0
0 0 0 0 0 0 0 0 0 0 0 0 0 0 0 0 0 0 0 0
0 0 0 0 0 0 0 0 0 0 0 0 0 0 0 0 0 0 0 0
3 3 3 3 3 3 3 3 3 3 3 3 3 3 3 3 3 3 3 3
3 3 3 3 3 3 3 3 3 3 3 3 3 3 3 3 3 3 3 3
0 0 0 0 0 0 0 0 0 0 0 0 0 0 0 0 0 0 0 0
0 0 0 0 0 0 0 0 0 0 0 0 0 0 0 0 0 0 0 0
0 0 0 0 0 0 0 0 0 0 0 0 0 0 0 0 0 0 0 0
76.23 76.23 76.23 76.23 77.26 77.26 77.26 77.26 77.26 77.26 77.26 77.26 77.26 77.26 77.26 77.26 78.37 78.37 78.37 78.37
203 201 199 197 195 193 191 189 187 185 183 181 180 178 176 174 173 171 169 168
7 7 7 7 7 7 7 7 6 6 6 6 6 6 6 6 6 6 6 6
0.0002 0.0002 0.0002 0.0002 0.0002 0.0002 0.0002 0.0002 0.0002 0.0002 0.0002 0.0002 0.0002 0.0002 0.0002 0.0002 0.0002 0.0002 0.0002 0.0002
0.01 0.01 0.01 0.01 0.01 0.01 0.01 0.01 0.01 0.01 0.01 0.01 0.01 0.01 0.01 0.01 0.01 0.01 0.01 0.01
203 201 199 197 195 193 191 189 187 185 183 181 180 178 176 174 173 171 169 168
0.01 0.01 0.01 0.01 0.01 0.01 0.01 0.01 0.01 0.01 0.01 0.01 0.01 0.01 0.01 0.01 0.01 0.01 0.01 0.01
0 0 0 0 0 0 0 0 0 0 0 0 0 0 0 0 0 0 0 0
0 0 0 0 0 0 0 0 0 0 0 0 0 0 0 0 0 0 0 0
0.00 0.00 0.00 0.00 0.00 0.00 0.00 0.00 0.00 0.00 0.00 0.00 0.00 0.00 0.00 0.00 0.00 0.00 0.00 0.00
0.016 0.016 0.016 0.016 0.016 0.016 0.016 0.016 0.016 0.016 0.016 0.016 0.016 0.016 0.016 0.016 0.016 0.016 0.016 0.016
0.00 0.00 0.00 0.00 0.00 0.00 0.00 0.00 0.00 0.00 0.00 0.00 0.00 0.00 0.00 0.00 0.00 0.00 0.00 0.00
0.00 0.00 0.00 0.00 0.00 0.00 0.00 0.00 0.00 0.00 0.00 0.00 0.00 0.00 0.00 0.00 0.00 0.00 0.00 0.00
0.02 0.02 0.02 0.02 0.02 0.02 0.02 0.02 0.02 0.02 0.02 0.02 0.02 0.02 0.02 0.02 0.02 0.02 0.02 0.02
0.02 0.02 0.02 0.02 0.02 0.02 0.02 0.02 0.02 0.02 0.02 0.02 0.02 0.02 0.02 0.02 0.02 0.02 0.02 0.02
0.0000 0.0000 0.0000 0.0000 0.0000 0.0000 0.0000 0.0000 0.0000 0.0000 0.0000 0.0000 0.0000 0.0000 0.0000 0.0000 0.0000 0.0000 0.0000 0.0000
0.0000 0.0000 0.0000 0.0000 0.0000 0.0000 0.0000 0.0000 0.0000 0.0000 0.0000 0.0000 0.0000 0.0000 0.0000 0.0000 0.0000 0.0000 0.0000 0.0000
0.0000 0.0000 0.0000 0.0000 0.0000 0.0000 0.0000 0.0000 0.0000 0.0000 0.0000 0.0000 0.0000 0.0000 0.0000 0.0000 0.0000 0.0000 0.0000 0.0000
0.00 0.00 0.00 0.00 0.00 0.00 0.00 0.00 0.00 0.00 0.00 0.00 0.00 0.00 0.00 0.00 0.00 0.00 0.00 0.00
0.00 0.00 0.00 0.00 0.00 0.00 0.00 0.00 0.00 0.00 0.00 0.00 0.00 0.00 0.00 0.00 0.00 0.00 0.00 0.00
0.00 0.00 0.00 0.00 0.00 0.00 0.00 0.00 0.00 0.00 0.00 0.00 0.00 0.00 0.00 0.00 0.00 0.00 0.00 0.00
0.00 0.00 0.00 0.00 0.00 0.00 0.00 0.00 0.00 0.00 0.00 0.00 0.00 0.00 0.00 0.00 0.00 0.00 0.00 0.00
0.00 0.00 0.00 0.00 0.00 0.00 0.00 0.00 0.00 0.00 0.00 0.00 0.00 0.00 0.00 0.00 0.00 0.00 0.00 0.00
0.0000 0.0000 0.0000 0.0000 0.0000 0.0000 0.0000 0.0000 0.0000 0.0000 0.0000 0.0000 0.0000 0.0000 0.0000 0.0000 0.0000 0.0000 0.0000 0.0000
0.0000 0.0000 0.0000 0.0000 0.0000 0.0000 0.0000 0.0000 0.0000 0.0000 0.0000 0.0000 0.0000 0.0000 0.0000 0.0000 0.0000 0.0000 0.0000 0.0000
0.0000 0.0000 0.0000 0.0000 0.0000 0.0000 0.0000 0.0000 0.0000 0.0000 0.0000 0.0000 0.0000 0.0000 0.0000 0.0000 0.0000 0.0000 0.0000 0.0000
0.0000 0.0000 0.0000 0.0000 0.0000 0.0000 0.0000 0.0000 0.0000 0.0000 0.0000 0.0000 0.0000 0.0000 0.0000 0.0000 0.0000 0.0000 0.0000 0.0000
0.0000 0.0000 0.0000 0.0000 0.0000 0.0000 0.0000 0.0000 0.0000 0.0000 0.0000 0.0000 0.0000 0.0000 0.0000 0.0000 0.0000 0.0000 0.0000 0.0000
0.00 0.00 0.00 0.00 0.00 0.00 0.00 0.00 0.00 0.00 0.00 0.00 0.00 0.00 0.00 0.00 0.00 0.00 0.00 0.00
0.00 0.00 0.00 0.00 0.00 0.00 0.00 0.00 0.00 0.00 0.00 0.00 0.00 0.00 0.00 0.00 0.00 0.00 0.00 0.00
0.23 0.23 0.23 0.23 0.23 0.23 0.23 0.23 0.23 0.23 0.23 0.23 0.23 0.23 0.23 0.23 0.23 0.23 0.23 0.23
0.02 0.02 0.02 0.02 0.02 0.02 0.02 0.02 0.02 0.02 0.02 0.02 0.02 0.02 0.02 0.02 0.02 0.02 0.02 0.02
21.21 21.23 21.25 21.26 21.28 21.29 21.31 21.33 21.34 21.36 21.37 21.39 21.41 21.42 21.44 21.45 21.47 21.49 21.50 21.52
0.00 0.00 0.00 0.00 0.00 0.00 0.00 0.00 0.00 0.00 0.00 0.00 0.00 0.00 0.00 0.00 0.00 0.00 0.00 0.00
1.23 1.23 1.23 1.23 1.23 1.23 1.23 1.23 1.23 1.23 1.23 1.23 1.23 1.23 1.23 1.23 1.23 1.23 1.23 1.23
0 0 0 0 0 0 0 0 0 0 0 0 0 0 0 0 0 0 0 0
Values Produc
Page 5 of 6 5/14/201810:26 PM
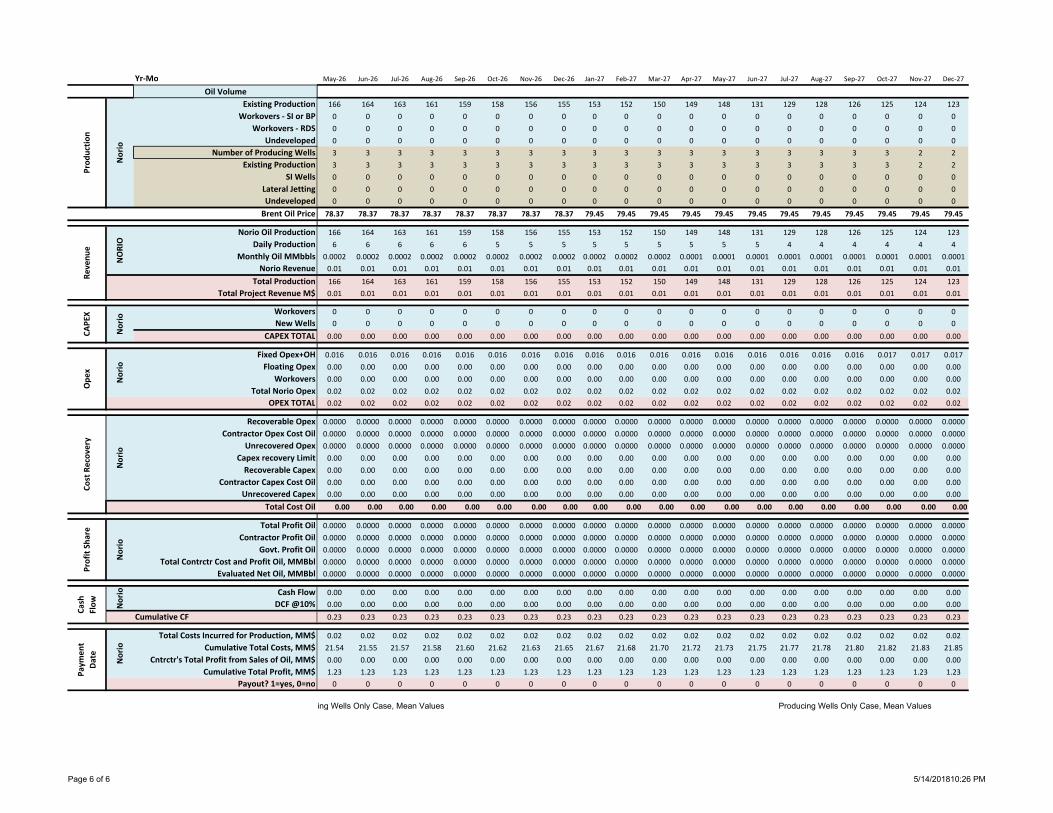
Yr‐MoOil Volume
Existing ProductionWorkovers ‐ SI or BP
Workovers ‐ RDSUndeveloped
Number of Producing WellsExisting Production
SI WellsLateral JettingUndeveloped
Norio Oil ProductionDaily Production
Monthly Oil MMbblsNorio Revenue
Total ProductionTotal Project Revenue M$
WorkoversNew Wells
CAPEX TOTAL
Fixed Opex+OHFloating Opex
WorkoversTotal Norio Opex
OPEX TOTAL
Recoverable OpexContractor Opex Cost Oil
Unrecovered OpexCapex recovery LimitRecoverable Capex
Contractor Capex Cost OilUnrecovered Capex
Total Cost Oil
Total Profit OilContractor Profit Oil
Govt. Profit OilTotal Contrctr Cost and Profit Oil, MMBbl
Evaluated Net Oil, MMBbl
Cash FlowDCF @10%
Cumulative CF
Total Costs Incurred for Production, MM$Cumulative Total Costs, MM$
Cntrctr's Total Profit from Sales of Oil, MM$Cumulative Total Profit, MM$
Payout? 1=yes, 0=no
Norio
Profit Sh
are
Norio
CAPE
X
Brent Oil Price
Reve
nue
NORIO
Prod
uctio
n
Norio
Ope
x
Norio
Cost Recov
ery
Norio
Norio
Paym
ent
Date
Norio
Cash
Flow
May‐26 Jun‐26 Jul‐26 Aug‐26 Sep‐26 Oct‐26 Nov‐26 Dec‐26 Jan‐27 Feb‐27 Mar‐27 Apr‐27 May‐27 Jun‐27 Jul‐27 Aug‐27 Sep‐27 Oct‐27 Nov‐27 Dec‐27
166 164 163 161 159 158 156 155 153 152 150 149 148 131 129 128 126 125 124 123
0 0 0 0 0 0 0 0 0 0 0 0 0 0 0 0 0 0 0 0
0 0 0 0 0 0 0 0 0 0 0 0 0 0 0 0 0 0 0 0
0 0 0 0 0 0 0 0 0 0 0 0 0 0 0 0 0 0 0 0
3 3 3 3 3 3 3 3 3 3 3 3 3 3 3 3 3 3 2 2
3 3 3 3 3 3 3 3 3 3 3 3 3 3 3 3 3 3 2 2
0 0 0 0 0 0 0 0 0 0 0 0 0 0 0 0 0 0 0 0
0 0 0 0 0 0 0 0 0 0 0 0 0 0 0 0 0 0 0 0
0 0 0 0 0 0 0 0 0 0 0 0 0 0 0 0 0 0 0 0
78.37 78.37 78.37 78.37 78.37 78.37 78.37 78.37 79.45 79.45 79.45 79.45 79.45 79.45 79.45 79.45 79.45 79.45 79.45 79.45
166 164 163 161 159 158 156 155 153 152 150 149 148 131 129 128 126 125 124 123
6 6 6 6 6 5 5 5 5 5 5 5 5 5 4 4 4 4 4 4
0.0002 0.0002 0.0002 0.0002 0.0002 0.0002 0.0002 0.0002 0.0002 0.0002 0.0002 0.0001 0.0001 0.0001 0.0001 0.0001 0.0001 0.0001 0.0001 0.0001
0.01 0.01 0.01 0.01 0.01 0.01 0.01 0.01 0.01 0.01 0.01 0.01 0.01 0.01 0.01 0.01 0.01 0.01 0.01 0.01
166 164 163 161 159 158 156 155 153 152 150 149 148 131 129 128 126 125 124 123
0.01 0.01 0.01 0.01 0.01 0.01 0.01 0.01 0.01 0.01 0.01 0.01 0.01 0.01 0.01 0.01 0.01 0.01 0.01 0.01
0 0 0 0 0 0 0 0 0 0 0 0 0 0 0 0 0 0 0 0
0 0 0 0 0 0 0 0 0 0 0 0 0 0 0 0 0 0 0 0
0.00 0.00 0.00 0.00 0.00 0.00 0.00 0.00 0.00 0.00 0.00 0.00 0.00 0.00 0.00 0.00 0.00 0.00 0.00 0.00
0.016 0.016 0.016 0.016 0.016 0.016 0.016 0.016 0.016 0.016 0.016 0.016 0.016 0.016 0.016 0.016 0.016 0.017 0.017 0.017
0.00 0.00 0.00 0.00 0.00 0.00 0.00 0.00 0.00 0.00 0.00 0.00 0.00 0.00 0.00 0.00 0.00 0.00 0.00 0.00
0.00 0.00 0.00 0.00 0.00 0.00 0.00 0.00 0.00 0.00 0.00 0.00 0.00 0.00 0.00 0.00 0.00 0.00 0.00 0.00
0.02 0.02 0.02 0.02 0.02 0.02 0.02 0.02 0.02 0.02 0.02 0.02 0.02 0.02 0.02 0.02 0.02 0.02 0.02 0.02
0.02 0.02 0.02 0.02 0.02 0.02 0.02 0.02 0.02 0.02 0.02 0.02 0.02 0.02 0.02 0.02 0.02 0.02 0.02 0.02
0.0000 0.0000 0.0000 0.0000 0.0000 0.0000 0.0000 0.0000 0.0000 0.0000 0.0000 0.0000 0.0000 0.0000 0.0000 0.0000 0.0000 0.0000 0.0000 0.0000
0.0000 0.0000 0.0000 0.0000 0.0000 0.0000 0.0000 0.0000 0.0000 0.0000 0.0000 0.0000 0.0000 0.0000 0.0000 0.0000 0.0000 0.0000 0.0000 0.0000
0.0000 0.0000 0.0000 0.0000 0.0000 0.0000 0.0000 0.0000 0.0000 0.0000 0.0000 0.0000 0.0000 0.0000 0.0000 0.0000 0.0000 0.0000 0.0000 0.0000
0.00 0.00 0.00 0.00 0.00 0.00 0.00 0.00 0.00 0.00 0.00 0.00 0.00 0.00 0.00 0.00 0.00 0.00 0.00 0.00
0.00 0.00 0.00 0.00 0.00 0.00 0.00 0.00 0.00 0.00 0.00 0.00 0.00 0.00 0.00 0.00 0.00 0.00 0.00 0.00
0.00 0.00 0.00 0.00 0.00 0.00 0.00 0.00 0.00 0.00 0.00 0.00 0.00 0.00 0.00 0.00 0.00 0.00 0.00 0.00
0.00 0.00 0.00 0.00 0.00 0.00 0.00 0.00 0.00 0.00 0.00 0.00 0.00 0.00 0.00 0.00 0.00 0.00 0.00 0.00
0.00 0.00 0.00 0.00 0.00 0.00 0.00 0.00 0.00 0.00 0.00 0.00 0.00 0.00 0.00 0.00 0.00 0.00 0.00 0.00
0.0000 0.0000 0.0000 0.0000 0.0000 0.0000 0.0000 0.0000 0.0000 0.0000 0.0000 0.0000 0.0000 0.0000 0.0000 0.0000 0.0000 0.0000 0.0000 0.0000
0.0000 0.0000 0.0000 0.0000 0.0000 0.0000 0.0000 0.0000 0.0000 0.0000 0.0000 0.0000 0.0000 0.0000 0.0000 0.0000 0.0000 0.0000 0.0000 0.0000
0.0000 0.0000 0.0000 0.0000 0.0000 0.0000 0.0000 0.0000 0.0000 0.0000 0.0000 0.0000 0.0000 0.0000 0.0000 0.0000 0.0000 0.0000 0.0000 0.0000
0.0000 0.0000 0.0000 0.0000 0.0000 0.0000 0.0000 0.0000 0.0000 0.0000 0.0000 0.0000 0.0000 0.0000 0.0000 0.0000 0.0000 0.0000 0.0000 0.0000
0.0000 0.0000 0.0000 0.0000 0.0000 0.0000 0.0000 0.0000 0.0000 0.0000 0.0000 0.0000 0.0000 0.0000 0.0000 0.0000 0.0000 0.0000 0.0000 0.0000
0.00 0.00 0.00 0.00 0.00 0.00 0.00 0.00 0.00 0.00 0.00 0.00 0.00 0.00 0.00 0.00 0.00 0.00 0.00 0.00
0.00 0.00 0.00 0.00 0.00 0.00 0.00 0.00 0.00 0.00 0.00 0.00 0.00 0.00 0.00 0.00 0.00 0.00 0.00 0.00
0.23 0.23 0.23 0.23 0.23 0.23 0.23 0.23 0.23 0.23 0.23 0.23 0.23 0.23 0.23 0.23 0.23 0.23 0.23 0.23
0.02 0.02 0.02 0.02 0.02 0.02 0.02 0.02 0.02 0.02 0.02 0.02 0.02 0.02 0.02 0.02 0.02 0.02 0.02 0.02
21.54 21.55 21.57 21.58 21.60 21.62 21.63 21.65 21.67 21.68 21.70 21.72 21.73 21.75 21.77 21.78 21.80 21.82 21.83 21.85
0.00 0.00 0.00 0.00 0.00 0.00 0.00 0.00 0.00 0.00 0.00 0.00 0.00 0.00 0.00 0.00 0.00 0.00 0.00 0.00
1.23 1.23 1.23 1.23 1.23 1.23 1.23 1.23 1.23 1.23 1.23 1.23 1.23 1.23 1.23 1.23 1.23 1.23 1.23 1.23
0 0 0 0 0 0 0 0 0 0 0 0 0 0 0 0 0 0 0 0
ing Wells Only Case, Mean Values Producing Wells Only Case, Mean Values
Page 6 of 6 5/14/201810:26 PM

Yr‐Mo Units Total Jan‐18 Feb‐18 Mar‐18 Apr‐18 May‐18 Jun‐18 Jul‐18 Aug‐18 Sep‐18 Oct‐18 Nov‐18 Dec‐18 Jan‐19 Feb‐19 Mar‐19 Apr‐19 May‐19 Jun‐19
Oil VolumeExisting Production Bbl 32,417 485 480 474 469 463 458 453 448 443 438 433 428 423 418 413 409 404 399
Workovers ‐ SI or BP Bbl 14,436 0 0 0 0 728 676 627 581 539 500 828 768 712 661 613 568 527 489
Workovers ‐ RDS Bbl 0 0 0 0 0 0 0 0 0 0 0 0 0 0 0 0 0 0 0
Undeveloped Bbl 0 0 0 0 0 0 0 0 0 0 0 0 0 0 0 0 0 0 0
Number of Producing Wells Wells 3 3 3 3 5 5 5 5 5 5 6 6 6 6 6 6 6 6
Existing Production Wells 3 3 3 3 3 3 3 3 3 3 3 3 3 3 3 3 3 3
SI Wells Wells 0 0 0 0 2 2 2 2 2 2 3 3 3 3 3 3 3 3
Lateral Jetting 0 0 0 0 0 0 0 0 0 0 0 0 0 0 0 0 0 0
Undeveloped Wells 0 0 0 0 0 0 0 0 0 0 0 0 0 0 0 0 0 0
$/Bbl 60.56 60.56 60.56 60.56 60.56 60.56 60.56 60.56 60.56 60.56 60.56 60.56 62.81 62.81 62.81 62.81 62.81 62.81
Norio Oil Production BOPM 46,853 485 480 474 469 1,192 1,134 1,080 1,029 982 938 1,261 1,196 1,135 1,079 1,026 977 931 888
Daily Production BOPD 17 17 16 16 41 39 37 36 34 32 44 41 39 37 35 34 32 31
Monthly Oil MMbbls MMBbl 0.0469 0.0005 0.0005 0.0005 0.0005 0.0012 0.0011 0.0011 0.0010 0.0010 0.0009 0.0013 0.0012 0.0011 0.0011 0.0010 0.0010 0.0009 0.0009
Norio Revenue M$ 2.7 0.03 0.02 0.02 0.02 0.06 0.06 0.06 0.05 0.05 0.05 0.06 0.06 0.06 0.06 0.06 0.05 0.05
Total Production Bbl 46,853 485 480 474 469 1,192 1,134 1,080 1,029 982 938 1,261 1,196 1,135 1,079 1,026 977 931 888
Total Project Revenue M$ M$ 2.7 0.00 0.03 0.02 0.02 0.02 0.06 0.06 0.06 0.05 0.05 0.05 0.06 0.06 0.06 0.06 0.06 0.05 0.05
Workovers MM$ 0.3 0 0 0 0 0.15 0 0 0 0 0 0.1 0 0 0 0 0 0 0
New Wells MM$ 0.0 0 0 0 0 0 0 0 0 0 0 0 0 0 0 0 0 0 0
CAPEX TOTAL MM$ 0.3 0.00 0.00 0.00 0.00 0.15 0.00 0.00 0.00 0.00 0.00 0.10 0.00 0.00 0.00 0.00 0.00 0.00 0.00
Fixed Opex+OH MM$ 1.8 0.014 0.014 0.014 0.014 0.014 0.014 0.014 0.014 0.014 0.014 0.014 0.014 0.014 0.014 0.014 0.014 0.014 0.014
Floating Opex MM$ 0.1 0.00 0.00 0.00 0.00 0.00 0.00 0.00 0.00 0.00 0.00 0.00 0.00 0.00 0.00 0.00 0.00 0.00 0.00
Workovers MM$ 0.0 0.00 0.00 0.00 0.00 0.00 0.00 0.00 0.00 0.00 0.00 0.00 0.00 0.00 0.00 0.00 0.00 0.00 0.00
Total Norio Opex MM$ 1.9 0.01 0.01 0.01 0.01 0.02 0.02 0.02 0.02 0.02 0.01 0.02 0.02 0.02 0.02 0.02 0.02 0.02 0.02
OPEX TOTAL MM$ 1.9 0.01 0.01 0.01 0.01 0.02 0.02 0.02 0.02 0.02 0.01 0.02 0.02 0.02 0.02 0.02 0.02 0.02 0.02
Recoverable Opex MM$ 1.02 0.0143 0.0143 0.0143 0.0143 0.0153 0.0152 0.0152 0.0151 0.0150 0.0150 0.0154 0.0153 0.0155 0.0155 0.0154 0.0154 0.0153 0.0153
Contractor Opex Cost Oil MM$ 1.02 0.0000 0.0250 0.0179 0.0143 0.0153 0.0152 0.0152 0.0151 0.0150 0.0150 0.0154 0.0153 0.0155 0.0155 0.0154 0.0154 0.0153 0.0153
Unrecovered Opex MM$ 0.0143 0.0036 0.0000 0.0000 0.0000 0.0000 0.0000 0.0000 0.0000 0.0000 0.0000 0.0000 0.0000 0.0000 0.0000 0.0000 0.0000 0.0000
Capex recovery Limit MM$ 0.00 0.00 0.00 0.01 0.00 0.02 0.02 0.02 0.02 0.02 0.02 0.02 0.02 0.02 0.02 0.02 0.02 0.02
Recoverable Capex MM$ 20.00 20.00 20.00 20.00 20.14 20.14 20.11 20.09 20.07 20.05 20.14 20.12 20.09 20.07 20.05 20.03 20.01 19.99
Contractor Capex Cost Oil MM$ 0.54 0.00 0.00 0.00 0.01 0.00 0.02 0.02 0.02 0.02 0.02 0.02 0.02 0.02 0.02 0.02 0.02 0.02 0.02
Unrecovered Capex MM$ 20.00 20.00 20.00 19.99 20.14 20.11 20.09 20.07 20.05 20.04 20.12 20.09 20.07 20.05 20.03 20.01 19.99 19.97
Total Cost Oil MM$ 0.00 0.03 0.02 0.02 0.02 0.04 0.04 0.04 0.03 0.03 0.03 0.04 0.04 0.04 0.04 0.04 0.03 0.03
Total Profit Oil MM$ 0.5357 0.0000 0.0000 0.0034 0.0051 0.0044 0.0231 0.0216 0.0203 0.0190 0.0178 0.0165 0.0248 0.0231 0.0228 0.0213 0.0199 0.0186 0.0174
Contractor Profit Oil MM$ 0.2679 0.0000 0.0000 0.0017 0.0025 0.0022 0.0116 0.0108 0.0101 0.0095 0.0089 0.0082 0.0124 0.0115 0.0114 0.0107 0.0100 0.0093 0.0087
Govt. Profit Oil MM$ 0.2679 0.0000 0.0000 0.0017 0.0025 0.0022 0.0116 0.0108 0.0101 0.0095 0.0089 0.0082 0.0124 0.0115 0.0114 0.0107 0.0100 0.0093 0.0087
Total Contrctr Cost and Profit Oil, MMBbl MMBbl 0.0321 0.0000 0.0005 0.0004 0.0004 0.0004 0.0010 0.0009 0.0009 0.0008 0.0008 0.0008 0.0010 0.0009 0.0009 0.0009 0.0008 0.0008 0.0008
Evaluated Net Oil, MMBbl MMBbl 0.0321 0.0000 0.0005 0.0004 0.0004 0.0004 0.0010 0.0009 0.0009 0.0008 0.0008 0.0008 0.0010 0.0009 0.0009 0.0009 0.0008 0.0008 0.0008
Cash Flow MM$ 0.55 ‐0.01 0.01 0.01 0.01 ‐0.14 0.03 0.03 0.03 0.03 0.03 ‐0.08 0.04 0.03 0.03 0.03 0.03 0.03 0.03
DCF @10% MM$ 0.45 ‐0.01 0.01 0.01 0.01 ‐0.14 0.03 0.03 0.03 0.03 0.02 ‐0.07 0.03 0.03 0.03 0.03 0.03 0.02 0.02
Cumulative CF ‐0.01 0.00 0.01 0.01 ‐0.13 ‐0.10 ‐0.06 ‐0.03 0.00 0.02 ‐0.05 ‐0.02 0.02 0.05 0.08 0.11 0.14 0.17
Total Costs Incurred for Production, MM$ MM$ 22.12 20.01 0.01 0.01 0.01 0.17 0.02 0.02 0.02 0.02 0.01 0.12 0.02 0.02 0.02 0.02 0.02 0.02 0.02
Cumulative Total Costs, MM$ MM$ 22.12 20.01 20.03 20.04 20.06 20.22 20.24 20.25 20.27 20.28 20.30 20.41 20.43 20.44 20.46 20.48 20.49 20.51 20.52
Cntrctr's Total Profit from Sales of Oil, MM$ MM$ 1.82 0.00 0.03 0.02 0.02 0.02 0.05 0.05 0.05 0.04 0.04 0.04 0.05 0.05 0.05 0.05 0.05 0.04 0.04
Cumulative Total Profit, MM$ MM$ 1.82 0.00 0.03 0.05 0.07 0.09 0.14 0.19 0.23 0.28 0.32 0.36 0.41 0.46 0.51 0.56 0.61 0.65 0.69
Payout? 1=yes, 0=no 0 0 0 0 0 0 0 0 0 0 0 0 0 0 0 0 0 0
Producing Wells + Workovers, Mean Values
Norio
Profit Sh
are
Norio
CAPE
X
Brent Oil Price
Reve
nue
NORIO
Prod
uctio
n
Norio
Ope
x
Norio
Cost Recov
ery
Norio
Norio
Paym
ent
Date
Norio
Cash
Flow
Page 1 of 6 5/14/201810:36 PM

Yr‐MoOil Volume
Existing ProductionWorkovers ‐ SI or BP
Workovers ‐ RDSUndeveloped
Number of Producing WellsExisting Production
SI WellsLateral JettingUndeveloped
Norio Oil ProductionDaily Production
Monthly Oil MMbblsNorio Revenue
Total ProductionTotal Project Revenue M$
WorkoversNew Wells
CAPEX TOTAL
Fixed Opex+OHFloating Opex
WorkoversTotal Norio Opex
OPEX TOTAL
Recoverable OpexContractor Opex Cost Oil
Unrecovered OpexCapex recovery LimitRecoverable Capex
Contractor Capex Cost OilUnrecovered Capex
Total Cost Oil
Total Profit OilContractor Profit Oil
Govt. Profit OilTotal Contrctr Cost and Profit Oil, MMBbl
Evaluated Net Oil, MMBbl
Cash FlowDCF @10%
Cumulative CF
Total Costs Incurred for Production, MM$Cumulative Total Costs, MM$
Cntrctr's Total Profit from Sales of Oil, MM$Cumulative Total Profit, MM$
Payout? 1=yes, 0=no
Norio
Profit Sh
are
Norio
CAPE
X
Brent Oil Price
Reve
nue
NORIO
Prod
uctio
n
Norio
Ope
x
Norio
Cost Recov
ery
Norio
Norio
Paym
ent
Date
Norio
Cash
Flow
Jul‐19 Aug‐19 Sep‐19 Oct‐19 Nov‐19 Dec‐19 Jan‐20 Feb‐20 Mar‐20 Apr‐20 May‐20 Jun‐20 Jul‐20 Aug‐20 Sep‐20 Oct‐20 Nov‐20 Dec‐20 Jan‐21 Feb‐21 Mar‐21
395 390 386 382 377 373 369 365 361 357 353 349 345 341 338 334 330 327 323 320 316
454 421 390 362 336 311 289 268 248 230 214 198 184 171 158 147 136 126 117 109 101
0 0 0 0 0 0 0 0 0 0 0 0 0 0 0 0 0 0 0 0 0
0 0 0 0 0 0 0 0 0 0 0 0 0 0 0 0 0 0 0 0 0
6 6 6 6 6 6 6 6 6 6 6 6 6 6 6 6 6 6 6 6 6
3 3 3 3 3 3 3 3 3 3 3 3 3 3 3 3 3 3 3 3 3
3 3 3 3 3 3 3 3 3 3 3 3 3 3 3 3 3 3 3 3 3
0 0 0 0 0 0 0 0 0 0 0 0 0 0 0 0 0 0 0 0 0
0 0 0 0 0 0 0 0 0 0 0 0 0 0 0 0 0 0 0 0 0
62.81 62.81 62.81 62.81 62.81 62.81 65.80 65.80 65.80 65.80 65.80 65.80 65.80 65.80 65.80 65.80 65.80 65.80 70.70 70.70 70.70
848 811 776 744 713 685 658 633 609 587 567 547 529 512 496 481 466 453 440 428 417
29 28 27 26 25 24 23 22 21 20 20 19 18 18 17 17 16 16 15 15 14
0.0008 0.0008 0.0008 0.0007 0.0007 0.0007 0.0007 0.0006 0.0006 0.0006 0.0006 0.0005 0.0005 0.0005 0.0005 0.0005 0.0005 0.0005 0.0004 0.0004 0.0004
0.05 0.05 0.04 0.04 0.04 0.04 0.04 0.04 0.04 0.03 0.03 0.03 0.03 0.03 0.03 0.03 0.03 0.03 0.03 0.03 0.03
848 811 776 744 713 685 658 633 609 587 567 547 529 512 496 481 466 453 440 428 417
0.05 0.05 0.04 0.04 0.04 0.04 0.04 0.04 0.04 0.03 0.03 0.03 0.03 0.03 0.03 0.03 0.03 0.03 0.03 0.03 0.03
0 0 0 0 0 0 0 0 0 0 0 0 0 0 0 0 0 0 0 0 0
0 0 0 0 0 0 0 0 0 0 0 0 0 0 0 0 0 0 0 0 0
0.00 0.00 0.00 0.00 0.00 0.00 0.00 0.00 0.00 0.00 0.00 0.00 0.00 0.00 0.00 0.00 0.00 0.00 0.00 0.00 0.00
0.014 0.014 0.014 0.014 0.014 0.014 0.014 0.014 0.014 0.014 0.014 0.014 0.014 0.014 0.014 0.014 0.014 0.014 0.014 0.014 0.014
0.00 0.00 0.00 0.00 0.00 0.00 0.00 0.00 0.00 0.00 0.00 0.00 0.00 0.00 0.00 0.00 0.00 0.00 0.00 0.00 0.00
0.00 0.00 0.00 0.00 0.00 0.00 0.00 0.00 0.00 0.00 0.00 0.00 0.00 0.00 0.00 0.00 0.00 0.00 0.00 0.00 0.00
0.02 0.02 0.02 0.02 0.02 0.02 0.02 0.02 0.02 0.02 0.02 0.02 0.02 0.02 0.02 0.02 0.02 0.02 0.02 0.02 0.02
0.02 0.02 0.02 0.02 0.02 0.02 0.02 0.02 0.02 0.02 0.02 0.02 0.02 0.02 0.02 0.02 0.02 0.02 0.02 0.02 0.02
0.0152 0.0152 0.0152 0.0152 0.0151 0.0151 0.0151 0.0151 0.0151 0.0151 0.0151 0.0151 0.0151 0.0151 0.0151 0.0151 0.0151 0.0151 0.0151 0.0151 0.0151
0.0152 0.0152 0.0152 0.0152 0.0151 0.0151 0.0151 0.0151 0.0151 0.0151 0.0151 0.0151 0.0151 0.0151 0.0151 0.0151 0.0151 0.0151 0.0151 0.0151 0.0151
0.0000 0.0000 0.0000 0.0000 0.0000 0.0000 0.0000 0.0000 0.0000 0.0000 0.0000 0.0000 0.0000 0.0000 0.0000 0.0000 0.0000 0.0000 0.0000 0.0000 0.0000
0.02 0.02 0.01 0.01 0.01 0.01 0.01 0.01 0.01 0.01 0.01 0.01 0.01 0.01 0.01 0.01 0.01 0.01 0.01 0.01 0.01
19.97 19.95 19.94 19.92 19.91 19.90 19.89 19.88 19.87 19.86 19.85 19.84 19.83 19.82 19.81 19.81 19.80 19.79 19.79 19.78 19.78
0.02 0.02 0.01 0.01 0.01 0.01 0.01 0.01 0.01 0.01 0.01 0.01 0.01 0.01 0.01 0.01 0.01 0.01 0.01 0.01 0.01
19.95 19.94 19.92 19.91 19.90 19.89 19.88 19.87 19.86 19.85 19.84 19.83 19.82 19.81 19.81 19.80 19.79 19.79 19.78 19.78 19.77
0.03 0.03 0.03 0.03 0.03 0.03 0.03 0.03 0.03 0.02 0.02 0.02 0.02 0.02 0.02 0.02 0.02 0.02 0.02 0.02 0.02
0.0163 0.0152 0.0142 0.0133 0.0124 0.0116 0.0109 0.0111 0.0104 0.0098 0.0091 0.0086 0.0080 0.0075 0.0070 0.0066 0.0061 0.0057 0.0053 0.0060 0.0057
0.0081 0.0076 0.0071 0.0067 0.0062 0.0058 0.0054 0.0056 0.0052 0.0049 0.0046 0.0043 0.0040 0.0037 0.0035 0.0033 0.0031 0.0029 0.0027 0.0030 0.0028
0.0081 0.0076 0.0071 0.0067 0.0062 0.0058 0.0054 0.0056 0.0052 0.0049 0.0046 0.0043 0.0040 0.0037 0.0035 0.0033 0.0031 0.0029 0.0027 0.0030 0.0028
0.0007 0.0007 0.0007 0.0007 0.0006 0.0006 0.0006 0.0006 0.0005 0.0005 0.0005 0.0005 0.0005 0.0005 0.0005 0.0004 0.0004 0.0004 0.0004 0.0004 0.0004
0.0007 0.0007 0.0007 0.0007 0.0006 0.0006 0.0006 0.0006 0.0005 0.0005 0.0005 0.0005 0.0005 0.0005 0.0005 0.0004 0.0004 0.0004 0.0004 0.0004 0.0004
0.02 0.02 0.02 0.02 0.02 0.02 0.02 0.02 0.02 0.01 0.01 0.01 0.01 0.01 0.01 0.01 0.01 0.01 0.01 0.01 0.01
0.02 0.02 0.02 0.02 0.02 0.01 0.01 0.01 0.01 0.01 0.01 0.01 0.01 0.01 0.01 0.01 0.01 0.01 0.01 0.01 0.01
0.19 0.22 0.24 0.26 0.28 0.29 0.31 0.33 0.34 0.36 0.37 0.38 0.40 0.41 0.42 0.43 0.44 0.44 0.45 0.46 0.47
0.02 0.02 0.02 0.02 0.02 0.02 0.02 0.02 0.02 0.02 0.02 0.02 0.02 0.02 0.02 0.02 0.02 0.02 0.02 0.02 0.02
20.54 20.55 20.57 20.58 20.60 20.61 20.63 20.64 20.66 20.67 20.69 20.70 20.72 20.73 20.75 20.76 20.78 20.79 20.81 20.82 20.84
0.04 0.04 0.04 0.04 0.03 0.03 0.03 0.03 0.03 0.03 0.03 0.03 0.03 0.03 0.03 0.02 0.02 0.02 0.02 0.02 0.02
0.73 0.77 0.80 0.84 0.87 0.91 0.94 0.97 1.00 1.03 1.06 1.09 1.11 1.14 1.16 1.19 1.21 1.24 1.26 1.28 1.31
0 0 0 0 0 0 0 0 0 0 0 0 0 0 0 0 0 0 0 0 0
Producing Wells + Workovers, Mean Values
Page 2 of 6 5/14/201810:36 PM
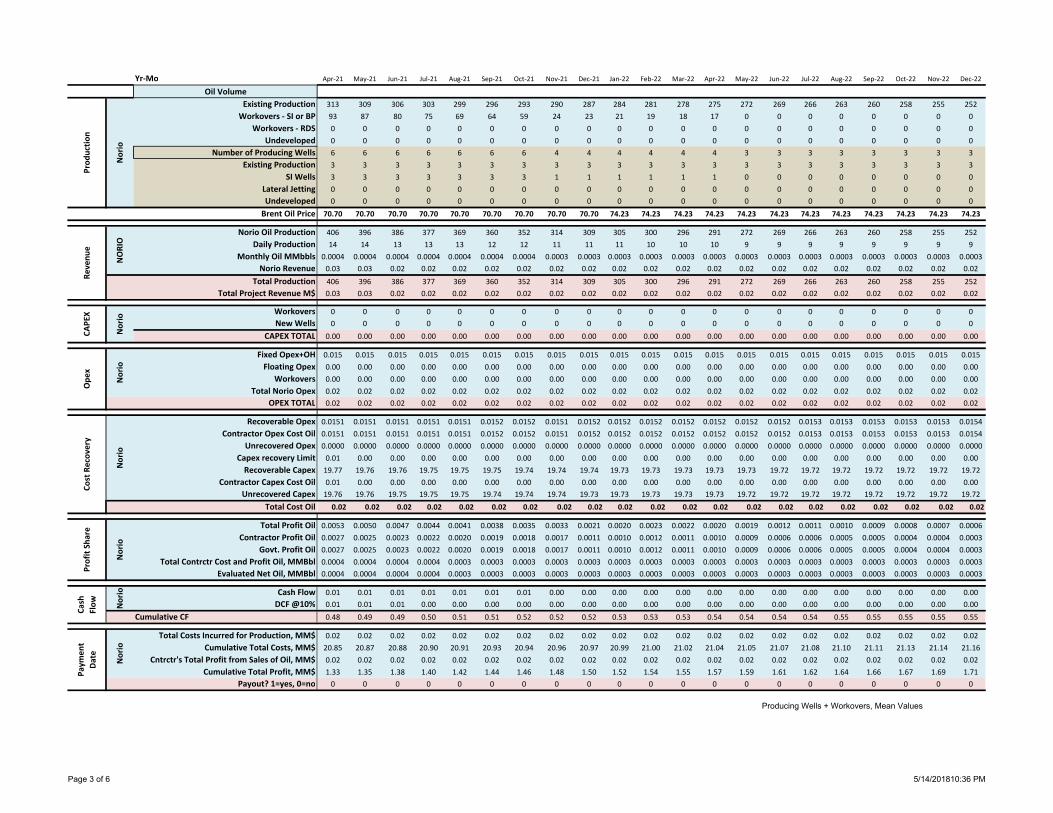
Yr‐MoOil Volume
Existing ProductionWorkovers ‐ SI or BP
Workovers ‐ RDSUndeveloped
Number of Producing WellsExisting Production
SI WellsLateral JettingUndeveloped
Norio Oil ProductionDaily Production
Monthly Oil MMbblsNorio Revenue
Total ProductionTotal Project Revenue M$
WorkoversNew Wells
CAPEX TOTAL
Fixed Opex+OHFloating Opex
WorkoversTotal Norio Opex
OPEX TOTAL
Recoverable OpexContractor Opex Cost Oil
Unrecovered OpexCapex recovery LimitRecoverable Capex
Contractor Capex Cost OilUnrecovered Capex
Total Cost Oil
Total Profit OilContractor Profit Oil
Govt. Profit OilTotal Contrctr Cost and Profit Oil, MMBbl
Evaluated Net Oil, MMBbl
Cash FlowDCF @10%
Cumulative CF
Total Costs Incurred for Production, MM$Cumulative Total Costs, MM$
Cntrctr's Total Profit from Sales of Oil, MM$Cumulative Total Profit, MM$
Payout? 1=yes, 0=no
Norio
Profit Sh
are
Norio
CAPE
X
Brent Oil Price
Reve
nue
NORIO
Prod
uctio
n
Norio
Ope
x
Norio
Cost Recov
ery
Norio
Norio
Paym
ent
Date
Norio
Cash
Flow
Apr‐21 May‐21 Jun‐21 Jul‐21 Aug‐21 Sep‐21 Oct‐21 Nov‐21 Dec‐21 Jan‐22 Feb‐22 Mar‐22 Apr‐22 May‐22 Jun‐22 Jul‐22 Aug‐22 Sep‐22 Oct‐22 Nov‐22 Dec‐22
313 309 306 303 299 296 293 290 287 284 281 278 275 272 269 266 263 260 258 255 252
93 87 80 75 69 64 59 24 23 21 19 18 17 0 0 0 0 0 0 0 0
0 0 0 0 0 0 0 0 0 0 0 0 0 0 0 0 0 0 0 0 0
0 0 0 0 0 0 0 0 0 0 0 0 0 0 0 0 0 0 0 0 0
6 6 6 6 6 6 6 4 4 4 4 4 4 3 3 3 3 3 3 3 3
3 3 3 3 3 3 3 3 3 3 3 3 3 3 3 3 3 3 3 3 3
3 3 3 3 3 3 3 1 1 1 1 1 1 0 0 0 0 0 0 0 0
0 0 0 0 0 0 0 0 0 0 0 0 0 0 0 0 0 0 0 0 0
0 0 0 0 0 0 0 0 0 0 0 0 0 0 0 0 0 0 0 0 0
70.70 70.70 70.70 70.70 70.70 70.70 70.70 70.70 70.70 74.23 74.23 74.23 74.23 74.23 74.23 74.23 74.23 74.23 74.23 74.23 74.23
406 396 386 377 369 360 352 314 309 305 300 296 291 272 269 266 263 260 258 255 252
14 14 13 13 13 12 12 11 11 11 10 10 10 9 9 9 9 9 9 9 9
0.0004 0.0004 0.0004 0.0004 0.0004 0.0004 0.0004 0.0003 0.0003 0.0003 0.0003 0.0003 0.0003 0.0003 0.0003 0.0003 0.0003 0.0003 0.0003 0.0003 0.0003
0.03 0.03 0.02 0.02 0.02 0.02 0.02 0.02 0.02 0.02 0.02 0.02 0.02 0.02 0.02 0.02 0.02 0.02 0.02 0.02 0.02
406 396 386 377 369 360 352 314 309 305 300 296 291 272 269 266 263 260 258 255 252
0.03 0.03 0.02 0.02 0.02 0.02 0.02 0.02 0.02 0.02 0.02 0.02 0.02 0.02 0.02 0.02 0.02 0.02 0.02 0.02 0.02
0 0 0 0 0 0 0 0 0 0 0 0 0 0 0 0 0 0 0 0 0
0 0 0 0 0 0 0 0 0 0 0 0 0 0 0 0 0 0 0 0 0
0.00 0.00 0.00 0.00 0.00 0.00 0.00 0.00 0.00 0.00 0.00 0.00 0.00 0.00 0.00 0.00 0.00 0.00 0.00 0.00 0.00
0.015 0.015 0.015 0.015 0.015 0.015 0.015 0.015 0.015 0.015 0.015 0.015 0.015 0.015 0.015 0.015 0.015 0.015 0.015 0.015 0.015
0.00 0.00 0.00 0.00 0.00 0.00 0.00 0.00 0.00 0.00 0.00 0.00 0.00 0.00 0.00 0.00 0.00 0.00 0.00 0.00 0.00
0.00 0.00 0.00 0.00 0.00 0.00 0.00 0.00 0.00 0.00 0.00 0.00 0.00 0.00 0.00 0.00 0.00 0.00 0.00 0.00 0.00
0.02 0.02 0.02 0.02 0.02 0.02 0.02 0.02 0.02 0.02 0.02 0.02 0.02 0.02 0.02 0.02 0.02 0.02 0.02 0.02 0.02
0.02 0.02 0.02 0.02 0.02 0.02 0.02 0.02 0.02 0.02 0.02 0.02 0.02 0.02 0.02 0.02 0.02 0.02 0.02 0.02 0.02
0.0151 0.0151 0.0151 0.0151 0.0151 0.0152 0.0152 0.0151 0.0152 0.0152 0.0152 0.0152 0.0152 0.0152 0.0152 0.0153 0.0153 0.0153 0.0153 0.0153 0.0154
0.0151 0.0151 0.0151 0.0151 0.0151 0.0152 0.0152 0.0151 0.0152 0.0152 0.0152 0.0152 0.0152 0.0152 0.0152 0.0153 0.0153 0.0153 0.0153 0.0153 0.0154
0.0000 0.0000 0.0000 0.0000 0.0000 0.0000 0.0000 0.0000 0.0000 0.0000 0.0000 0.0000 0.0000 0.0000 0.0000 0.0000 0.0000 0.0000 0.0000 0.0000 0.0000
0.01 0.00 0.00 0.00 0.00 0.00 0.00 0.00 0.00 0.00 0.00 0.00 0.00 0.00 0.00 0.00 0.00 0.00 0.00 0.00 0.00
19.77 19.76 19.76 19.75 19.75 19.75 19.74 19.74 19.74 19.73 19.73 19.73 19.73 19.73 19.72 19.72 19.72 19.72 19.72 19.72 19.72
0.01 0.00 0.00 0.00 0.00 0.00 0.00 0.00 0.00 0.00 0.00 0.00 0.00 0.00 0.00 0.00 0.00 0.00 0.00 0.00 0.00
19.76 19.76 19.75 19.75 19.75 19.74 19.74 19.74 19.73 19.73 19.73 19.73 19.73 19.72 19.72 19.72 19.72 19.72 19.72 19.72 19.72
0.02 0.02 0.02 0.02 0.02 0.02 0.02 0.02 0.02 0.02 0.02 0.02 0.02 0.02 0.02 0.02 0.02 0.02 0.02 0.02 0.02
0.0053 0.0050 0.0047 0.0044 0.0041 0.0038 0.0035 0.0033 0.0021 0.0020 0.0023 0.0022 0.0020 0.0019 0.0012 0.0011 0.0010 0.0009 0.0008 0.0007 0.0006
0.0027 0.0025 0.0023 0.0022 0.0020 0.0019 0.0018 0.0017 0.0011 0.0010 0.0012 0.0011 0.0010 0.0009 0.0006 0.0006 0.0005 0.0005 0.0004 0.0004 0.0003
0.0027 0.0025 0.0023 0.0022 0.0020 0.0019 0.0018 0.0017 0.0011 0.0010 0.0012 0.0011 0.0010 0.0009 0.0006 0.0006 0.0005 0.0005 0.0004 0.0004 0.0003
0.0004 0.0004 0.0004 0.0004 0.0003 0.0003 0.0003 0.0003 0.0003 0.0003 0.0003 0.0003 0.0003 0.0003 0.0003 0.0003 0.0003 0.0003 0.0003 0.0003 0.0003
0.0004 0.0004 0.0004 0.0004 0.0003 0.0003 0.0003 0.0003 0.0003 0.0003 0.0003 0.0003 0.0003 0.0003 0.0003 0.0003 0.0003 0.0003 0.0003 0.0003 0.0003
0.01 0.01 0.01 0.01 0.01 0.01 0.01 0.00 0.00 0.00 0.00 0.00 0.00 0.00 0.00 0.00 0.00 0.00 0.00 0.00 0.00
0.01 0.01 0.01 0.00 0.00 0.00 0.00 0.00 0.00 0.00 0.00 0.00 0.00 0.00 0.00 0.00 0.00 0.00 0.00 0.00 0.00
0.48 0.49 0.49 0.50 0.51 0.51 0.52 0.52 0.52 0.53 0.53 0.53 0.54 0.54 0.54 0.54 0.55 0.55 0.55 0.55 0.55
0.02 0.02 0.02 0.02 0.02 0.02 0.02 0.02 0.02 0.02 0.02 0.02 0.02 0.02 0.02 0.02 0.02 0.02 0.02 0.02 0.02
20.85 20.87 20.88 20.90 20.91 20.93 20.94 20.96 20.97 20.99 21.00 21.02 21.04 21.05 21.07 21.08 21.10 21.11 21.13 21.14 21.16
0.02 0.02 0.02 0.02 0.02 0.02 0.02 0.02 0.02 0.02 0.02 0.02 0.02 0.02 0.02 0.02 0.02 0.02 0.02 0.02 0.02
1.33 1.35 1.38 1.40 1.42 1.44 1.46 1.48 1.50 1.52 1.54 1.55 1.57 1.59 1.61 1.62 1.64 1.66 1.67 1.69 1.71
0 0 0 0 0 0 0 0 0 0 0 0 0 0 0 0 0 0 0 0 0
Producing Wells + Workovers, Mean Values
Page 3 of 6 5/14/201810:36 PM

Yr‐MoOil Volume
Existing ProductionWorkovers ‐ SI or BP
Workovers ‐ RDSUndeveloped
Number of Producing WellsExisting Production
SI WellsLateral JettingUndeveloped
Norio Oil ProductionDaily Production
Monthly Oil MMbblsNorio Revenue
Total ProductionTotal Project Revenue M$
WorkoversNew Wells
CAPEX TOTAL
Fixed Opex+OHFloating Opex
WorkoversTotal Norio Opex
OPEX TOTAL
Recoverable OpexContractor Opex Cost Oil
Unrecovered OpexCapex recovery LimitRecoverable Capex
Contractor Capex Cost OilUnrecovered Capex
Total Cost Oil
Total Profit OilContractor Profit Oil
Govt. Profit OilTotal Contrctr Cost and Profit Oil, MMBbl
Evaluated Net Oil, MMBbl
Cash FlowDCF @10%
Cumulative CF
Total Costs Incurred for Production, MM$Cumulative Total Costs, MM$
Cntrctr's Total Profit from Sales of Oil, MM$Cumulative Total Profit, MM$
Payout? 1=yes, 0=no
Norio
Profit Sh
are
Norio
CAPE
X
Brent Oil Price
Reve
nue
NORIO
Prod
uctio
n
Norio
Ope
x
Norio
Cost Recov
ery
Norio
Norio
Paym
ent
Date
Norio
Cash
Flow
Jan‐23 Feb‐23 Mar‐23 Apr‐23 May‐23 Jun‐23 Jul‐23 Aug‐23 Sep‐23 Oct‐23 Nov‐23 Dec‐23 Jan‐24 Feb‐24 Mar‐24 Apr‐24 May‐24 Jun‐24 Jul‐24 Aug‐24
250 247 244 242 239 237 234 232 230 227 225 222 220 218 216 213 211 209 207 205
0 0 0 0 0 0 0 0 0 0 0 0 0 0 0 0 0 0 0 0
0 0 0 0 0 0 0 0 0 0 0 0 0 0 0 0 0 0 0 0
0 0 0 0 0 0 0 0 0 0 0 0 0 0 0 0 0 0 0 0
3 3 3 3 3 3 3 3 3 3 3 3 3 3 3 3 3 3 3 3
3 3 3 3 3 3 3 3 3 3 3 3 3 3 3 3 3 3 3 3
0 0 0 0 0 0 0 0 0 0 0 0 0 0 0 0 0 0 0 0
0 0 0 0 0 0 0 0 0 0 0 0 0 0 0 0 0 0 0 0
0 0 0 0 0 0 0 0 0 0 0 0 0 0 0 0 0 0 0 0
75.21 75.21 75.21 75.21 75.21 75.21 75.21 75.21 75.21 75.21 75.21 75.21 76.23 76.23 76.23 76.23 76.23 76.23 76.23 76.23
250 247 244 242 239 237 234 232 230 227 225 222 220 218 216 213 211 209 207 205
9 9 8 8 8 8 8 8 8 8 8 8 8 8 7 7 7 7 7 7
0.0002 0.0002 0.0002 0.0002 0.0002 0.0002 0.0002 0.0002 0.0002 0.0002 0.0002 0.0002 0.0002 0.0002 0.0002 0.0002 0.0002 0.0002 0.0002 0.0002
0.02 0.02 0.02 0.02 0.02 0.02 0.02 0.02 0.02 0.02 0.02 0.01 0.01 0.01 0.01 0.01 0.01 0.01 0.01 0.01
250 247 244 242 239 237 234 232 230 227 225 222 220 218 216 213 211 209 207 205
0.02 0.02 0.02 0.02 0.02 0.02 0.02 0.02 0.02 0.02 0.02 0.01 0.01 0.01 0.01 0.01 0.01 0.01 0.01 0.01
0 0 0 0 0 0 0 0 0 0 0 0 0 0 0 0 0 0 0 0
0 0 0 0 0 0 0 0 0 0 0 0 0 0 0 0 0 0 0 0
0.00 0.00 0.00 0.00 0.00 0.00 0.00 0.00 0.00 0.00 0.00 0.00 0.00 0.00 0.00 0.00 0.00 0.00 0.00 0.00
0.015 0.015 0.015 0.015 0.015 0.015 0.015 0.015 0.015 0.015 0.015 0.015 0.015 0.015 0.015 0.015 0.015 0.015 0.015 0.016
0.00 0.00 0.00 0.00 0.00 0.00 0.00 0.00 0.00 0.00 0.00 0.00 0.00 0.00 0.00 0.00 0.00 0.00 0.00 0.00
0.00 0.00 0.00 0.00 0.00 0.00 0.00 0.00 0.00 0.00 0.00 0.00 0.00 0.00 0.00 0.00 0.00 0.00 0.00 0.00
0.02 0.02 0.02 0.02 0.02 0.02 0.02 0.02 0.02 0.02 0.02 0.02 0.02 0.02 0.02 0.02 0.02 0.02 0.02 0.02
0.02 0.02 0.02 0.02 0.02 0.02 0.02 0.02 0.02 0.02 0.02 0.02 0.02 0.02 0.02 0.02 0.02 0.02 0.02 0.02
0.0154 0.0154 0.0154 0.0155 0.0155 0.0155 0.0155 0.0000 0.0000 0.0000 0.0000 0.0000 0.0000 0.0000 0.0000 0.0000 0.0000 0.0000 0.0000 0.0000
0.0154 0.0154 0.0154 0.0155 0.0155 0.0155 0.0155 0.0000 0.0000 0.0000 0.0000 0.0000 0.0000 0.0000 0.0000 0.0000 0.0000 0.0000 0.0000 0.0000
0.0000 0.0000 0.0000 0.0000 0.0000 0.0000 0.0000 0.0000 0.0000 0.0000 0.0000 0.0000 0.0000 0.0000 0.0000 0.0000 0.0000 0.0000 0.0000 0.0000
0.00 0.00 0.00 0.00 0.00 0.00 0.00 0.00 0.00 0.00 0.00 0.00 0.00 0.00 0.00 0.00 0.00 0.00 0.00 0.00
19.72 19.72 19.72 19.72 19.71 19.71 19.71 0.00 0.00 0.00 0.00 0.00 0.00 0.00 0.00 0.00 0.00 0.00 0.00 0.00
0.00 0.00 0.00 0.00 0.00 0.00 0.00 0.00 0.00 0.00 0.00 0.00 0.00 0.00 0.00 0.00 0.00 0.00 0.00 0.00
19.72 19.72 19.72 19.71 19.71 19.71 19.71 0.00 0.00 0.00 0.00 0.00 0.00 0.00 0.00 0.00 0.00 0.00 0.00 0.00
0.02 0.02 0.02 0.02 0.02 0.02 0.02 0.00 0.00 0.00 0.00 0.00 0.00 0.00 0.00 0.00 0.00 0.00 0.00 0.00
0.0005 0.0006 0.0005 0.0004 0.0003 0.0002 0.0001 0.0000 0.0000 0.0000 0.0000 0.0000 0.0000 0.0000 0.0000 0.0000 0.0000 0.0000 0.0000 0.0000
0.0003 0.0003 0.0002 0.0002 0.0001 0.0001 0.0000 0.0000 0.0000 0.0000 0.0000 0.0000 0.0000 0.0000 0.0000 0.0000 0.0000 0.0000 0.0000 0.0000
0.0003 0.0003 0.0002 0.0002 0.0001 0.0001 0.0000 0.0000 0.0000 0.0000 0.0000 0.0000 0.0000 0.0000 0.0000 0.0000 0.0000 0.0000 0.0000 0.0000
0.0002 0.0002 0.0002 0.0002 0.0002 0.0002 0.0002 0.0000 0.0000 0.0000 0.0000 0.0000 0.0000 0.0000 0.0000 0.0000 0.0000 0.0000 0.0000 0.0000
0.0002 0.0002 0.0002 0.0002 0.0002 0.0002 0.0002 0.0000 0.0000 0.0000 0.0000 0.0000 0.0000 0.0000 0.0000 0.0000 0.0000 0.0000 0.0000 0.0000
0.00 0.00 0.00 0.00 0.00 0.00 0.00 0.00 0.00 0.00 0.00 0.00 0.00 0.00 0.00 0.00 0.00 0.00 0.00 0.00
0.00 0.00 0.00 0.00 0.00 0.00 0.00 0.00 0.00 0.00 0.00 0.00 0.00 0.00 0.00 0.00 0.00 0.00 0.00 0.00
0.55 0.55 0.55 0.55 0.55 0.55 0.55 0.55 0.55 0.55 0.55 0.55 0.55 0.55 0.55 0.55 0.55 0.55 0.55 0.55
0.02 0.02 0.02 0.02 0.02 0.02 0.02 0.02 0.02 0.02 0.02 0.02 0.02 0.02 0.02 0.02 0.02 0.02 0.02 0.02
21.17 21.19 21.20 21.22 21.23 21.25 21.27 21.28 21.30 21.31 21.33 21.34 21.36 21.37 21.39 21.41 21.42 21.44 21.45 21.47
0.02 0.02 0.02 0.02 0.02 0.02 0.02 0.00 0.00 0.00 0.00 0.00 0.00 0.00 0.00 0.00 0.00 0.00 0.00 0.00
1.72 1.74 1.76 1.77 1.79 1.80 1.82 1.82 1.82 1.82 1.82 1.82 1.82 1.82 1.82 1.82 1.82 1.82 1.82 1.82
0 0 0 0 0 0 0 0 0 0 0 0 0 0 0 0 0 0 0 0
Producing Wells + Workovers, Mea
Page 4 of 6 5/14/201810:36 PM

Yr‐MoOil Volume
Existing ProductionWorkovers ‐ SI or BP
Workovers ‐ RDSUndeveloped
Number of Producing WellsExisting Production
SI WellsLateral JettingUndeveloped
Norio Oil ProductionDaily Production
Monthly Oil MMbblsNorio Revenue
Total ProductionTotal Project Revenue M$
WorkoversNew Wells
CAPEX TOTAL
Fixed Opex+OHFloating Opex
WorkoversTotal Norio Opex
OPEX TOTAL
Recoverable OpexContractor Opex Cost Oil
Unrecovered OpexCapex recovery LimitRecoverable Capex
Contractor Capex Cost OilUnrecovered Capex
Total Cost Oil
Total Profit OilContractor Profit Oil
Govt. Profit OilTotal Contrctr Cost and Profit Oil, MMBbl
Evaluated Net Oil, MMBbl
Cash FlowDCF @10%
Cumulative CF
Total Costs Incurred for Production, MM$Cumulative Total Costs, MM$
Cntrctr's Total Profit from Sales of Oil, MM$Cumulative Total Profit, MM$
Payout? 1=yes, 0=no
Norio
Profit Sh
are
Norio
CAPE
X
Brent Oil Price
Reve
nue
NORIO
Prod
uctio
n
Norio
Ope
x
Norio
Cost Recov
ery
Norio
Norio
Paym
ent
Date
Norio
Cash
Flow
Sep‐24 Oct‐24 Nov‐24 Dec‐24 Jan‐25 Feb‐25 Mar‐25 Apr‐25 May‐25 Jun‐25 Jul‐25 Aug‐25 Sep‐25 Oct‐25 Nov‐25 Dec‐25 Jan‐26 Feb‐26 Mar‐26 Apr‐26
203 201 199 197 195 193 191 189 187 185 183 181 180 178 176 174 173 171 169 168
0 0 0 0 0 0 0 0 0 0 0 0 0 0 0 0 0 0 0 0
0 0 0 0 0 0 0 0 0 0 0 0 0 0 0 0 0 0 0 0
0 0 0 0 0 0 0 0 0 0 0 0 0 0 0 0 0 0 0 0
3 3 3 3 3 3 3 3 3 3 3 3 3 3 3 3 3 3 3 3
3 3 3 3 3 3 3 3 3 3 3 3 3 3 3 3 3 3 3 3
0 0 0 0 0 0 0 0 0 0 0 0 0 0 0 0 0 0 0 0
0 0 0 0 0 0 0 0 0 0 0 0 0 0 0 0 0 0 0 0
0 0 0 0 0 0 0 0 0 0 0 0 0 0 0 0 0 0 0 0
76.23 76.23 76.23 76.23 77.26 77.26 77.26 77.26 77.26 77.26 77.26 77.26 77.26 77.26 77.26 77.26 78.37 78.37 78.37 78.37
203 201 199 197 195 193 191 189 187 185 183 181 180 178 176 174 173 171 169 168
7 7 7 7 7 7 7 7 6 6 6 6 6 6 6 6 6 6 6 6
0.0002 0.0002 0.0002 0.0002 0.0002 0.0002 0.0002 0.0002 0.0002 0.0002 0.0002 0.0002 0.0002 0.0002 0.0002 0.0002 0.0002 0.0002 0.0002 0.0002
0.01 0.01 0.01 0.01 0.01 0.01 0.01 0.01 0.01 0.01 0.01 0.01 0.01 0.01 0.01 0.01 0.01 0.01 0.01 0.01
203 201 199 197 195 193 191 189 187 185 183 181 180 178 176 174 173 171 169 168
0.01 0.01 0.01 0.01 0.01 0.01 0.01 0.01 0.01 0.01 0.01 0.01 0.01 0.01 0.01 0.01 0.01 0.01 0.01 0.01
0 0 0 0 0 0 0 0 0 0 0 0 0 0 0 0 0 0 0 0
0 0 0 0 0 0 0 0 0 0 0 0 0 0 0 0 0 0 0 0
0.00 0.00 0.00 0.00 0.00 0.00 0.00 0.00 0.00 0.00 0.00 0.00 0.00 0.00 0.00 0.00 0.00 0.00 0.00 0.00
0.016 0.016 0.016 0.016 0.016 0.016 0.016 0.016 0.016 0.016 0.016 0.016 0.016 0.016 0.016 0.016 0.016 0.016 0.016 0.016
0.00 0.00 0.00 0.00 0.00 0.00 0.00 0.00 0.00 0.00 0.00 0.00 0.00 0.00 0.00 0.00 0.00 0.00 0.00 0.00
0.00 0.00 0.00 0.00 0.00 0.00 0.00 0.00 0.00 0.00 0.00 0.00 0.00 0.00 0.00 0.00 0.00 0.00 0.00 0.00
0.02 0.02 0.02 0.02 0.02 0.02 0.02 0.02 0.02 0.02 0.02 0.02 0.02 0.02 0.02 0.02 0.02 0.02 0.02 0.02
0.02 0.02 0.02 0.02 0.02 0.02 0.02 0.02 0.02 0.02 0.02 0.02 0.02 0.02 0.02 0.02 0.02 0.02 0.02 0.02
0.0000 0.0000 0.0000 0.0000 0.0000 0.0000 0.0000 0.0000 0.0000 0.0000 0.0000 0.0000 0.0000 0.0000 0.0000 0.0000 0.0000 0.0000 0.0000 0.0000
0.0000 0.0000 0.0000 0.0000 0.0000 0.0000 0.0000 0.0000 0.0000 0.0000 0.0000 0.0000 0.0000 0.0000 0.0000 0.0000 0.0000 0.0000 0.0000 0.0000
0.0000 0.0000 0.0000 0.0000 0.0000 0.0000 0.0000 0.0000 0.0000 0.0000 0.0000 0.0000 0.0000 0.0000 0.0000 0.0000 0.0000 0.0000 0.0000 0.0000
0.00 0.00 0.00 0.00 0.00 0.00 0.00 0.00 0.00 0.00 0.00 0.00 0.00 0.00 0.00 0.00 0.00 0.00 0.00 0.00
0.00 0.00 0.00 0.00 0.00 0.00 0.00 0.00 0.00 0.00 0.00 0.00 0.00 0.00 0.00 0.00 0.00 0.00 0.00 0.00
0.00 0.00 0.00 0.00 0.00 0.00 0.00 0.00 0.00 0.00 0.00 0.00 0.00 0.00 0.00 0.00 0.00 0.00 0.00 0.00
0.00 0.00 0.00 0.00 0.00 0.00 0.00 0.00 0.00 0.00 0.00 0.00 0.00 0.00 0.00 0.00 0.00 0.00 0.00 0.00
0.00 0.00 0.00 0.00 0.00 0.00 0.00 0.00 0.00 0.00 0.00 0.00 0.00 0.00 0.00 0.00 0.00 0.00 0.00 0.00
0.0000 0.0000 0.0000 0.0000 0.0000 0.0000 0.0000 0.0000 0.0000 0.0000 0.0000 0.0000 0.0000 0.0000 0.0000 0.0000 0.0000 0.0000 0.0000 0.0000
0.0000 0.0000 0.0000 0.0000 0.0000 0.0000 0.0000 0.0000 0.0000 0.0000 0.0000 0.0000 0.0000 0.0000 0.0000 0.0000 0.0000 0.0000 0.0000 0.0000
0.0000 0.0000 0.0000 0.0000 0.0000 0.0000 0.0000 0.0000 0.0000 0.0000 0.0000 0.0000 0.0000 0.0000 0.0000 0.0000 0.0000 0.0000 0.0000 0.0000
0.0000 0.0000 0.0000 0.0000 0.0000 0.0000 0.0000 0.0000 0.0000 0.0000 0.0000 0.0000 0.0000 0.0000 0.0000 0.0000 0.0000 0.0000 0.0000 0.0000
0.0000 0.0000 0.0000 0.0000 0.0000 0.0000 0.0000 0.0000 0.0000 0.0000 0.0000 0.0000 0.0000 0.0000 0.0000 0.0000 0.0000 0.0000 0.0000 0.0000
0.00 0.00 0.00 0.00 0.00 0.00 0.00 0.00 0.00 0.00 0.00 0.00 0.00 0.00 0.00 0.00 0.00 0.00 0.00 0.00
0.00 0.00 0.00 0.00 0.00 0.00 0.00 0.00 0.00 0.00 0.00 0.00 0.00 0.00 0.00 0.00 0.00 0.00 0.00 0.00
0.55 0.55 0.55 0.55 0.55 0.55 0.55 0.55 0.55 0.55 0.55 0.55 0.55 0.55 0.55 0.55 0.55 0.55 0.55 0.55
0.02 0.02 0.02 0.02 0.02 0.02 0.02 0.02 0.02 0.02 0.02 0.02 0.02 0.02 0.02 0.02 0.02 0.02 0.02 0.02
21.49 21.50 21.52 21.53 21.55 21.56 21.58 21.60 21.61 21.63 21.64 21.66 21.68 21.69 21.71 21.73 21.74 21.76 21.77 21.79
0.00 0.00 0.00 0.00 0.00 0.00 0.00 0.00 0.00 0.00 0.00 0.00 0.00 0.00 0.00 0.00 0.00 0.00 0.00 0.00
1.82 1.82 1.82 1.82 1.82 1.82 1.82 1.82 1.82 1.82 1.82 1.82 1.82 1.82 1.82 1.82 1.82 1.82 1.82 1.82
0 0 0 0 0 0 0 0 0 0 0 0 0 0 0 0 0 0 0 0
n Values Producin
Page 5 of 6 5/14/201810:36 PM

Yr‐MoOil Volume
Existing ProductionWorkovers ‐ SI or BP
Workovers ‐ RDSUndeveloped
Number of Producing WellsExisting Production
SI WellsLateral JettingUndeveloped
Norio Oil ProductionDaily Production
Monthly Oil MMbblsNorio Revenue
Total ProductionTotal Project Revenue M$
WorkoversNew Wells
CAPEX TOTAL
Fixed Opex+OHFloating Opex
WorkoversTotal Norio Opex
OPEX TOTAL
Recoverable OpexContractor Opex Cost Oil
Unrecovered OpexCapex recovery LimitRecoverable Capex
Contractor Capex Cost OilUnrecovered Capex
Total Cost Oil
Total Profit OilContractor Profit Oil
Govt. Profit OilTotal Contrctr Cost and Profit Oil, MMBbl
Evaluated Net Oil, MMBbl
Cash FlowDCF @10%
Cumulative CF
Total Costs Incurred for Production, MM$Cumulative Total Costs, MM$
Cntrctr's Total Profit from Sales of Oil, MM$Cumulative Total Profit, MM$
Payout? 1=yes, 0=no
Norio
Profit Sh
are
Norio
CAPE
X
Brent Oil Price
Reve
nue
NORIO
Prod
uctio
n
Norio
Ope
x
Norio
Cost Recov
ery
Norio
Norio
Paym
ent
Date
Norio
Cash
Flow
May‐26 Jun‐26 Jul‐26 Aug‐26 Sep‐26 Oct‐26 Nov‐26 Dec‐26 Jan‐27 Feb‐27 Mar‐27 Apr‐27 May‐27 Jun‐27 Jul‐27 Aug‐27 Sep‐27 Oct‐27 Nov‐27 Dec‐27
166 164 163 161 159 158 156 155 153 152 150 149 148 131 129 128 126 125 124 123
0 0 0 0 0 0 0 0 0 0 0 0 0 0 0 0 0 0 0 0
0 0 0 0 0 0 0 0 0 0 0 0 0 0 0 0 0 0 0 0
0 0 0 0 0 0 0 0 0 0 0 0 0 0 0 0 0 0 0 0
3 3 3 3 3 3 3 3 3 3 3 3 3 3 3 3 3 3 2 2
3 3 3 3 3 3 3 3 3 3 3 3 3 3 3 3 3 3 2 2
0 0 0 0 0 0 0 0 0 0 0 0 0 0 0 0 0 0 0 0
0 0 0 0 0 0 0 0 0 0 0 0 0 0 0 0 0 0 0 0
0 0 0 0 0 0 0 0 0 0 0 0 0 0 0 0 0 0 0 0
78.37 78.37 78.37 78.37 78.37 78.37 78.37 78.37 79.45 79.45 79.45 79.45 79.45 79.45 79.45 79.45 79.45 79.45 79.45 79.45
166 164 163 161 159 158 156 155 153 152 150 149 148 131 129 128 126 125 124 123
6 6 6 6 6 5 5 5 5 5 5 5 5 5 4 4 4 4 4 4
0.0002 0.0002 0.0002 0.0002 0.0002 0.0002 0.0002 0.0002 0.0002 0.0002 0.0002 0.0001 0.0001 0.0001 0.0001 0.0001 0.0001 0.0001 0.0001 0.0001
0.01 0.01 0.01 0.01 0.01 0.01 0.01 0.01 0.01 0.01 0.01 0.01 0.01 0.01 0.01 0.01 0.01 0.01 0.01 0.01
166 164 163 161 159 158 156 155 153 152 150 149 148 131 129 128 126 125 124 123
0.01 0.01 0.01 0.01 0.01 0.01 0.01 0.01 0.01 0.01 0.01 0.01 0.01 0.01 0.01 0.01 0.01 0.01 0.01 0.01
0 0 0 0 0 0 0 0 0 0 0 0 0 0 0 0 0 0 0 0
0 0 0 0 0 0 0 0 0 0 0 0 0 0 0 0 0 0 0 0
0.00 0.00 0.00 0.00 0.00 0.00 0.00 0.00 0.00 0.00 0.00 0.00 0.00 0.00 0.00 0.00 0.00 0.00 0.00 0.00
0.016 0.016 0.016 0.016 0.016 0.016 0.016 0.016 0.016 0.016 0.016 0.016 0.016 0.016 0.016 0.016 0.016 0.017 0.017 0.017
0.00 0.00 0.00 0.00 0.00 0.00 0.00 0.00 0.00 0.00 0.00 0.00 0.00 0.00 0.00 0.00 0.00 0.00 0.00 0.00
0.00 0.00 0.00 0.00 0.00 0.00 0.00 0.00 0.00 0.00 0.00 0.00 0.00 0.00 0.00 0.00 0.00 0.00 0.00 0.00
0.02 0.02 0.02 0.02 0.02 0.02 0.02 0.02 0.02 0.02 0.02 0.02 0.02 0.02 0.02 0.02 0.02 0.02 0.02 0.02
0.02 0.02 0.02 0.02 0.02 0.02 0.02 0.02 0.02 0.02 0.02 0.02 0.02 0.02 0.02 0.02 0.02 0.02 0.02 0.02
0.0000 0.0000 0.0000 0.0000 0.0000 0.0000 0.0000 0.0000 0.0000 0.0000 0.0000 0.0000 0.0000 0.0000 0.0000 0.0000 0.0000 0.0000 0.0000 0.0000
0.0000 0.0000 0.0000 0.0000 0.0000 0.0000 0.0000 0.0000 0.0000 0.0000 0.0000 0.0000 0.0000 0.0000 0.0000 0.0000 0.0000 0.0000 0.0000 0.0000
0.0000 0.0000 0.0000 0.0000 0.0000 0.0000 0.0000 0.0000 0.0000 0.0000 0.0000 0.0000 0.0000 0.0000 0.0000 0.0000 0.0000 0.0000 0.0000 0.0000
0.00 0.00 0.00 0.00 0.00 0.00 0.00 0.00 0.00 0.00 0.00 0.00 0.00 0.00 0.00 0.00 0.00 0.00 0.00 0.00
0.00 0.00 0.00 0.00 0.00 0.00 0.00 0.00 0.00 0.00 0.00 0.00 0.00 0.00 0.00 0.00 0.00 0.00 0.00 0.00
0.00 0.00 0.00 0.00 0.00 0.00 0.00 0.00 0.00 0.00 0.00 0.00 0.00 0.00 0.00 0.00 0.00 0.00 0.00 0.00
0.00 0.00 0.00 0.00 0.00 0.00 0.00 0.00 0.00 0.00 0.00 0.00 0.00 0.00 0.00 0.00 0.00 0.00 0.00 0.00
0.00 0.00 0.00 0.00 0.00 0.00 0.00 0.00 0.00 0.00 0.00 0.00 0.00 0.00 0.00 0.00 0.00 0.00 0.00 0.00
0.0000 0.0000 0.0000 0.0000 0.0000 0.0000 0.0000 0.0000 0.0000 0.0000 0.0000 0.0000 0.0000 0.0000 0.0000 0.0000 0.0000 0.0000 0.0000 0.0000
0.0000 0.0000 0.0000 0.0000 0.0000 0.0000 0.0000 0.0000 0.0000 0.0000 0.0000 0.0000 0.0000 0.0000 0.0000 0.0000 0.0000 0.0000 0.0000 0.0000
0.0000 0.0000 0.0000 0.0000 0.0000 0.0000 0.0000 0.0000 0.0000 0.0000 0.0000 0.0000 0.0000 0.0000 0.0000 0.0000 0.0000 0.0000 0.0000 0.0000
0.0000 0.0000 0.0000 0.0000 0.0000 0.0000 0.0000 0.0000 0.0000 0.0000 0.0000 0.0000 0.0000 0.0000 0.0000 0.0000 0.0000 0.0000 0.0000 0.0000
0.0000 0.0000 0.0000 0.0000 0.0000 0.0000 0.0000 0.0000 0.0000 0.0000 0.0000 0.0000 0.0000 0.0000 0.0000 0.0000 0.0000 0.0000 0.0000 0.0000
0.00 0.00 0.00 0.00 0.00 0.00 0.00 0.00 0.00 0.00 0.00 0.00 0.00 0.00 0.00 0.00 0.00 0.00 0.00 0.00
0.00 0.00 0.00 0.00 0.00 0.00 0.00 0.00 0.00 0.00 0.00 0.00 0.00 0.00 0.00 0.00 0.00 0.00 0.00 0.00
0.55 0.55 0.55 0.55 0.55 0.55 0.55 0.55 0.55 0.55 0.55 0.55 0.55 0.55 0.55 0.55 0.55 0.55 0.55 0.55
0.02 0.02 0.02 0.02 0.02 0.02 0.02 0.02 0.02 0.02 0.02 0.02 0.02 0.02 0.02 0.02 0.02 0.02 0.02 0.02
21.81 21.82 21.84 21.86 21.87 21.89 21.90 21.92 21.94 21.95 21.97 21.99 22.00 22.02 22.04 22.05 22.07 22.09 22.10 22.12
0.00 0.00 0.00 0.00 0.00 0.00 0.00 0.00 0.00 0.00 0.00 0.00 0.00 0.00 0.00 0.00 0.00 0.00 0.00 0.00
1.82 1.82 1.82 1.82 1.82 1.82 1.82 1.82 1.82 1.82 1.82 1.82 1.82 1.82 1.82 1.82 1.82 1.82 1.82 1.82
0 0 0 0 0 0 0 0 0 0 0 0 0 0 0 0 0 0 0 0
ng Wells + Workovers, Mean Values Producing Wells + Workovers, Mean Values
Page 6 of 6 5/14/201810:36 PM

Yr‐Mo Units Total Jan‐18 Feb‐18 Mar‐18 Apr‐18 May‐18 Jun‐18 Jul‐18 Aug‐18 Sep‐18 Oct‐18 Nov‐18 Dec‐18 Jan‐19 Feb‐19 Mar‐19 Apr‐19 May‐19 Jun‐19
Oil VolumeExisting Production Bbl 32,417 485 480 474 469 463 458 453 448 443 438 433 428 423 418 413 409 404 399
Workovers ‐ SI or BP Bbl 14,436 0 0 0 0 728 676 627 581 539 500 828 768 712 661 613 568 527 489
Workovers ‐ RDS Bbl 96,440 0 0 0 0 0 0 0 0 0 1,473 3,065 2,882 2,718 2,570 2,437 2,316 2,206 2,105
Undeveloped Bbl 0 0 0 0 0 0 0 0 0 0 0 0 0 0 0 0 0 0 0
Number of Producing Wells Wells 3 3 3 3 5 5 5 5 5 7 11 11 11 11 11 11 11 11
Existing Production Wells 3 3 3 3 3 3 3 3 3 3 3 3 3 3 3 3 3 3
SI Wells Wells 0 0 0 0 2 2 2 2 2 2 3 3 3 3 3 3 3 3
Lateral Jetting 0 0 0 0 0 0 0 0 0 2 5 5 5 5 5 5 5 5
Undeveloped Wells 0 0 0 0 0 0 0 0 0 0 0 0 0 0 0 0 0 0
$/Bbl 60.56 60.56 60.56 60.56 60.56 60.56 60.56 60.56 60.56 60.56 60.56 60.56 62.81 62.81 62.81 62.81 62.81 62.81
Norio Oil Production BOPM 143,292 485 480 474 469 1,192 1,134 1,080 1,029 982 2,410 4,326 4,077 3,853 3,649 3,463 3,293 3,137 2,993
Daily Production BOPD 17 17 16 16 41 39 37 36 34 83 150 141 133 126 120 114 108 104
Monthly Oil MMbbls MMBbl 0.1433 0.0005 0.0005 0.0005 0.0005 0.0012 0.0011 0.0011 0.0010 0.0010 0.0024 0.0043 0.0041 0.0039 0.0036 0.0035 0.0033 0.0031 0.0030
Norio Revenue M$ 8.5 0.03 0.02 0.02 0.02 0.06 0.06 0.06 0.05 0.05 0.12 0.22 0.21 0.21 0.20 0.19 0.18 0.17
Total Production Bbl 143,292 485 480 474 469 1,192 1,134 1,080 1,029 982 2,410 4,326 4,077 3,853 3,649 3,463 3,293 3,137 2,993
Total Project Revenue M$ M$ 8.5 0.00 0.03 0.02 0.02 0.02 0.06 0.06 0.06 0.05 0.05 0.12 0.22 0.21 0.21 0.20 0.19 0.18 0.17
Workovers MM$ 1.3 0 0 0 0 0.15 0 0 0 0 0.382 0.794 0 0 0 0 0 0 0
New Wells MM$ 0.0 0 0 0 0 0 0 0 0 0 0 0 0 0 0 0 0 0 0
CAPEX TOTAL MM$ 1.3 0.00 0.00 0.00 0.00 0.15 0.00 0.00 0.00 0.00 0.38 0.79 0.00 0.00 0.00 0.00 0.00 0.00 0.00
Fixed Opex+OH MM$ 2.1 0.014 0.014 0.014 0.014 0.014 0.014 0.014 0.014 0.014 0.014 0.014 0.014 0.016 0.016 0.016 0.016 0.016 0.016
Floating Opex MM$ 0.2 0.00 0.00 0.00 0.00 0.00 0.00 0.00 0.00 0.00 0.00 0.01 0.01 0.01 0.01 0.00 0.00 0.00 0.00
Workovers MM$ 0.0 0.00 0.00 0.00 0.00 0.00 0.00 0.00 0.00 0.00 0.00 0.00 0.00 0.00 0.00 0.00 0.00 0.00 0.00
Total Norio Opex MM$ 2.3 0.01 0.01 0.01 0.01 0.02 0.02 0.02 0.02 0.02 0.02 0.02 0.02 0.02 0.02 0.02 0.02 0.02 0.02
OPEX TOTAL MM$ 2.3 0.01 0.01 0.01 0.01 0.02 0.02 0.02 0.02 0.02 0.02 0.02 0.02 0.02 0.02 0.02 0.02 0.02 0.02
Recoverable Opex MM$ 2.27 0.0143 0.0143 0.0143 0.0143 0.0153 0.0152 0.0152 0.0151 0.0150 0.0171 0.0198 0.0195 0.0216 0.0214 0.0211 0.0209 0.0207 0.0205
Contractor Opex Cost Oil MM$ 2.27 0.0000 0.0250 0.0179 0.0143 0.0153 0.0152 0.0152 0.0151 0.0150 0.0171 0.0198 0.0195 0.0216 0.0214 0.0211 0.0209 0.0207 0.0205
Unrecovered Opex MM$ 0.0143 0.0036 0.0000 0.0000 0.0000 0.0000 0.0000 0.0000 0.0000 0.0000 0.0000 0.0000 0.0000 0.0000 0.0000 0.0000 0.0000 0.0000
Capex recovery Limit MM$ 0.00 0.00 0.00 0.01 0.00 0.02 0.02 0.02 0.02 0.02 0.05 0.10 0.09 0.09 0.09 0.08 0.08 0.07
Recoverable Capex MM$ 20.00 20.00 20.00 20.00 20.14 20.14 20.11 20.09 20.07 20.43 21.21 21.16 21.06 20.96 20.87 20.78 20.70 20.62
Contractor Capex Cost Oil MM$ 3.12 0.00 0.00 0.00 0.01 0.00 0.02 0.02 0.02 0.02 0.02 0.05 0.10 0.09 0.09 0.09 0.08 0.08 0.07
Unrecovered Capex MM$ 20.00 20.00 20.00 19.99 20.14 20.11 20.09 20.07 20.05 20.42 21.16 21.06 20.96 20.87 20.78 20.70 20.62 20.55
Total Cost Oil MM$ 0.00 0.03 0.02 0.02 0.02 0.04 0.04 0.04 0.03 0.03 0.07 0.12 0.12 0.11 0.11 0.10 0.10 0.09
Total Profit Oil MM$ 3.1219 0.0000 0.0000 0.0034 0.0051 0.0044 0.0231 0.0216 0.0203 0.0190 0.0168 0.0522 0.1018 0.0943 0.0930 0.0876 0.0827 0.0782 0.0741
Contractor Profit Oil MM$ 1.5610 0.0000 0.0000 0.0017 0.0025 0.0022 0.0116 0.0108 0.0101 0.0095 0.0084 0.0261 0.0509 0.0471 0.0465 0.0438 0.0414 0.0391 0.0371
Govt. Profit Oil MM$ 1.5610 0.0000 0.0000 0.0017 0.0025 0.0022 0.0116 0.0108 0.0101 0.0095 0.0084 0.0261 0.0509 0.0471 0.0465 0.0438 0.0414 0.0391 0.0371
Total Contrctr Cost and Profit Oil, MMBbl MMBbl 0.1158 0.0000 0.0005 0.0004 0.0004 0.0004 0.0010 0.0009 0.0009 0.0008 0.0008 0.0019 0.0033 0.0030 0.0030 0.0028 0.0027 0.0026 0.0024
Evaluated Net Oil, MMBbl MMBbl 0.1158 0.0000 0.0005 0.0004 0.0004 0.0004 0.0010 0.0009 0.0009 0.0008 0.0008 0.0019 0.0033 0.0030 0.0030 0.0028 0.0027 0.0026 0.0024
Cash Flow MM$ 3.36 ‐0.01 0.01 0.01 0.01 ‐0.14 0.03 0.03 0.03 0.03 ‐0.36 ‐0.72 0.15 0.14 0.14 0.13 0.12 0.12 0.11
DCF @10% MM$ 2.22 ‐0.01 0.01 0.01 0.01 ‐0.14 0.03 0.03 0.03 0.03 ‐0.33 ‐0.66 0.14 0.13 0.12 0.12 0.11 0.10 0.10
Cumulative CF ‐0.01 0.00 0.01 0.01 ‐0.13 ‐0.10 ‐0.06 ‐0.03 0.00 ‐0.36 ‐1.08 ‐0.92 ‐0.78 ‐0.64 ‐0.51 ‐0.39 ‐0.27 ‐0.16
Total Costs Incurred for Production, MM$ MM$ 23.60 20.01 0.01 0.01 0.01 0.17 0.02 0.02 0.02 0.02 0.40 0.81 0.02 0.02 0.02 0.02 0.02 0.02 0.02
Cumulative Total Costs, MM$ MM$ 23.60 20.01 20.03 20.04 20.06 20.22 20.24 20.25 20.27 20.28 20.68 21.50 21.52 21.54 21.56 21.58 21.60 21.62 21.64
Cntrctr's Total Profit from Sales of Oil, MM$ MM$ 6.96 0.00 0.03 0.02 0.02 0.02 0.05 0.05 0.05 0.04 0.04 0.10 0.17 0.16 0.16 0.15 0.14 0.14 0.13
Cumulative Total Profit, MM$ MM$ 6.96 0.00 0.03 0.05 0.07 0.09 0.14 0.19 0.23 0.28 0.32 0.42 0.59 0.75 0.91 1.07 1.21 1.35 1.48
Payout? 1=yes, 0=no 0 0 0 0 0 0 0 0 0 0 0 0 0 0 0 0 0 0
Producing Wells + Workovers + Lateral Jetting, Mean Values
Norio
Profit Sh
are
Norio
CAPE
X
Brent Oil Price
Reve
nue
NORIO
Prod
uctio
n
Norio
Ope
x
Norio
Cost Recov
ery
Norio
Norio
Paym
ent
Date
Norio
Cash
Flow
Page 1 of 6 5/14/201810:36 PM
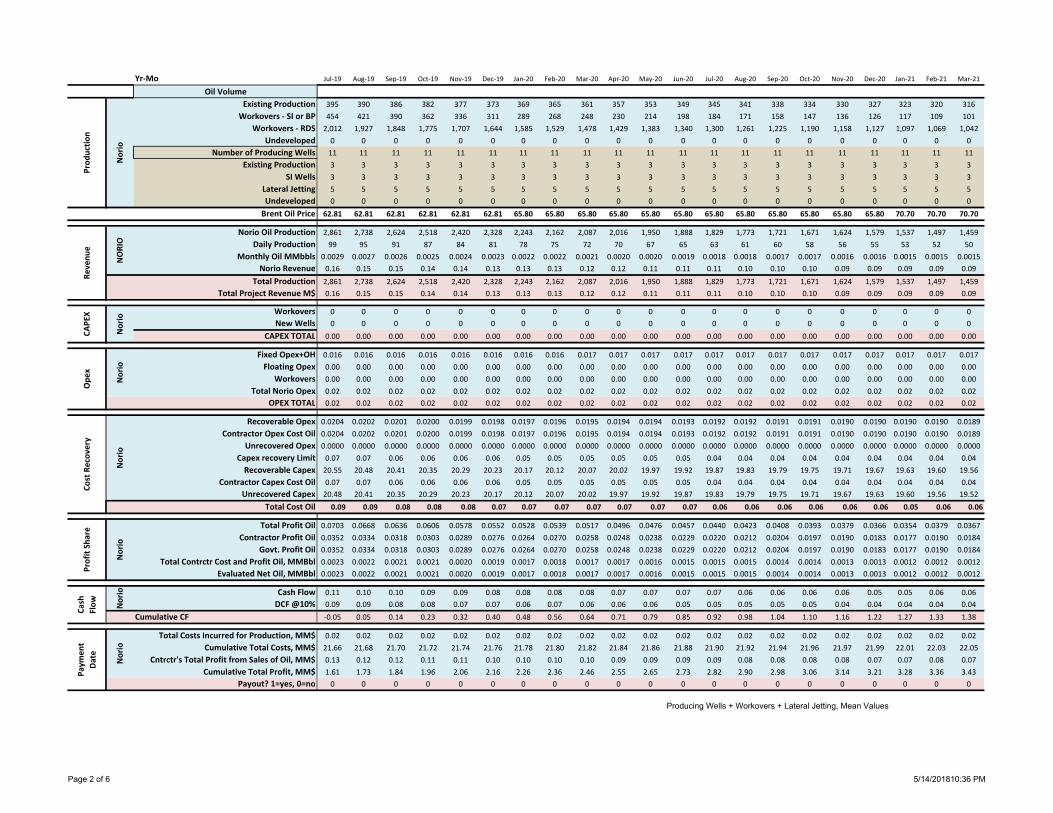
Yr‐MoOil Volume
Existing ProductionWorkovers ‐ SI or BP
Workovers ‐ RDSUndeveloped
Number of Producing WellsExisting Production
SI WellsLateral JettingUndeveloped
Norio Oil ProductionDaily Production
Monthly Oil MMbblsNorio Revenue
Total ProductionTotal Project Revenue M$
WorkoversNew Wells
CAPEX TOTAL
Fixed Opex+OHFloating Opex
WorkoversTotal Norio Opex
OPEX TOTAL
Recoverable OpexContractor Opex Cost Oil
Unrecovered OpexCapex recovery LimitRecoverable Capex
Contractor Capex Cost OilUnrecovered Capex
Total Cost Oil
Total Profit OilContractor Profit Oil
Govt. Profit OilTotal Contrctr Cost and Profit Oil, MMBbl
Evaluated Net Oil, MMBbl
Cash FlowDCF @10%
Cumulative CF
Total Costs Incurred for Production, MM$Cumulative Total Costs, MM$
Cntrctr's Total Profit from Sales of Oil, MM$Cumulative Total Profit, MM$
Payout? 1=yes, 0=no
Norio
Profit Sh
are
Norio
CAPE
X
Brent Oil Price
Reve
nue
NORIO
Prod
uctio
n
Norio
Ope
x
Norio
Cost Recov
ery
Norio
Norio
Paym
ent
Date
Norio
Cash
Flow
Jul‐19 Aug‐19 Sep‐19 Oct‐19 Nov‐19 Dec‐19 Jan‐20 Feb‐20 Mar‐20 Apr‐20 May‐20 Jun‐20 Jul‐20 Aug‐20 Sep‐20 Oct‐20 Nov‐20 Dec‐20 Jan‐21 Feb‐21 Mar‐21
395 390 386 382 377 373 369 365 361 357 353 349 345 341 338 334 330 327 323 320 316
454 421 390 362 336 311 289 268 248 230 214 198 184 171 158 147 136 126 117 109 101
2,012 1,927 1,848 1,775 1,707 1,644 1,585 1,529 1,478 1,429 1,383 1,340 1,300 1,261 1,225 1,190 1,158 1,127 1,097 1,069 1,042
0 0 0 0 0 0 0 0 0 0 0 0 0 0 0 0 0 0 0 0 0
11 11 11 11 11 11 11 11 11 11 11 11 11 11 11 11 11 11 11 11 11
3 3 3 3 3 3 3 3 3 3 3 3 3 3 3 3 3 3 3 3 3
3 3 3 3 3 3 3 3 3 3 3 3 3 3 3 3 3 3 3 3 3
5 5 5 5 5 5 5 5 5 5 5 5 5 5 5 5 5 5 5 5 5
0 0 0 0 0 0 0 0 0 0 0 0 0 0 0 0 0 0 0 0 0
62.81 62.81 62.81 62.81 62.81 62.81 65.80 65.80 65.80 65.80 65.80 65.80 65.80 65.80 65.80 65.80 65.80 65.80 70.70 70.70 70.70
2,861 2,738 2,624 2,518 2,420 2,328 2,243 2,162 2,087 2,016 1,950 1,888 1,829 1,773 1,721 1,671 1,624 1,579 1,537 1,497 1,459
99 95 91 87 84 81 78 75 72 70 67 65 63 61 60 58 56 55 53 52 50
0.0029 0.0027 0.0026 0.0025 0.0024 0.0023 0.0022 0.0022 0.0021 0.0020 0.0020 0.0019 0.0018 0.0018 0.0017 0.0017 0.0016 0.0016 0.0015 0.0015 0.0015
0.16 0.15 0.15 0.14 0.14 0.13 0.13 0.13 0.12 0.12 0.11 0.11 0.11 0.10 0.10 0.10 0.09 0.09 0.09 0.09 0.09
2,861 2,738 2,624 2,518 2,420 2,328 2,243 2,162 2,087 2,016 1,950 1,888 1,829 1,773 1,721 1,671 1,624 1,579 1,537 1,497 1,459
0.16 0.15 0.15 0.14 0.14 0.13 0.13 0.13 0.12 0.12 0.11 0.11 0.11 0.10 0.10 0.10 0.09 0.09 0.09 0.09 0.09
0 0 0 0 0 0 0 0 0 0 0 0 0 0 0 0 0 0 0 0 0
0 0 0 0 0 0 0 0 0 0 0 0 0 0 0 0 0 0 0 0 0
0.00 0.00 0.00 0.00 0.00 0.00 0.00 0.00 0.00 0.00 0.00 0.00 0.00 0.00 0.00 0.00 0.00 0.00 0.00 0.00 0.00
0.016 0.016 0.016 0.016 0.016 0.016 0.016 0.016 0.017 0.017 0.017 0.017 0.017 0.017 0.017 0.017 0.017 0.017 0.017 0.017 0.017
0.00 0.00 0.00 0.00 0.00 0.00 0.00 0.00 0.00 0.00 0.00 0.00 0.00 0.00 0.00 0.00 0.00 0.00 0.00 0.00 0.00
0.00 0.00 0.00 0.00 0.00 0.00 0.00 0.00 0.00 0.00 0.00 0.00 0.00 0.00 0.00 0.00 0.00 0.00 0.00 0.00 0.00
0.02 0.02 0.02 0.02 0.02 0.02 0.02 0.02 0.02 0.02 0.02 0.02 0.02 0.02 0.02 0.02 0.02 0.02 0.02 0.02 0.02
0.02 0.02 0.02 0.02 0.02 0.02 0.02 0.02 0.02 0.02 0.02 0.02 0.02 0.02 0.02 0.02 0.02 0.02 0.02 0.02 0.02
0.0204 0.0202 0.0201 0.0200 0.0199 0.0198 0.0197 0.0196 0.0195 0.0194 0.0194 0.0193 0.0192 0.0192 0.0191 0.0191 0.0190 0.0190 0.0190 0.0190 0.0189
0.0204 0.0202 0.0201 0.0200 0.0199 0.0198 0.0197 0.0196 0.0195 0.0194 0.0194 0.0193 0.0192 0.0192 0.0191 0.0191 0.0190 0.0190 0.0190 0.0190 0.0189
0.0000 0.0000 0.0000 0.0000 0.0000 0.0000 0.0000 0.0000 0.0000 0.0000 0.0000 0.0000 0.0000 0.0000 0.0000 0.0000 0.0000 0.0000 0.0000 0.0000 0.0000
0.07 0.07 0.06 0.06 0.06 0.06 0.05 0.05 0.05 0.05 0.05 0.05 0.04 0.04 0.04 0.04 0.04 0.04 0.04 0.04 0.04
20.55 20.48 20.41 20.35 20.29 20.23 20.17 20.12 20.07 20.02 19.97 19.92 19.87 19.83 19.79 19.75 19.71 19.67 19.63 19.60 19.56
0.07 0.07 0.06 0.06 0.06 0.06 0.05 0.05 0.05 0.05 0.05 0.05 0.04 0.04 0.04 0.04 0.04 0.04 0.04 0.04 0.04
20.48 20.41 20.35 20.29 20.23 20.17 20.12 20.07 20.02 19.97 19.92 19.87 19.83 19.79 19.75 19.71 19.67 19.63 19.60 19.56 19.52
0.09 0.09 0.08 0.08 0.08 0.07 0.07 0.07 0.07 0.07 0.07 0.07 0.06 0.06 0.06 0.06 0.06 0.06 0.05 0.06 0.06
0.0703 0.0668 0.0636 0.0606 0.0578 0.0552 0.0528 0.0539 0.0517 0.0496 0.0476 0.0457 0.0440 0.0423 0.0408 0.0393 0.0379 0.0366 0.0354 0.0379 0.0367
0.0352 0.0334 0.0318 0.0303 0.0289 0.0276 0.0264 0.0270 0.0258 0.0248 0.0238 0.0229 0.0220 0.0212 0.0204 0.0197 0.0190 0.0183 0.0177 0.0190 0.0184
0.0352 0.0334 0.0318 0.0303 0.0289 0.0276 0.0264 0.0270 0.0258 0.0248 0.0238 0.0229 0.0220 0.0212 0.0204 0.0197 0.0190 0.0183 0.0177 0.0190 0.0184
0.0023 0.0022 0.0021 0.0021 0.0020 0.0019 0.0017 0.0018 0.0017 0.0017 0.0016 0.0015 0.0015 0.0015 0.0014 0.0014 0.0013 0.0013 0.0012 0.0012 0.0012
0.0023 0.0022 0.0021 0.0021 0.0020 0.0019 0.0017 0.0018 0.0017 0.0017 0.0016 0.0015 0.0015 0.0015 0.0014 0.0014 0.0013 0.0013 0.0012 0.0012 0.0012
0.11 0.10 0.10 0.09 0.09 0.08 0.08 0.08 0.08 0.07 0.07 0.07 0.07 0.06 0.06 0.06 0.06 0.05 0.05 0.06 0.06
0.09 0.09 0.08 0.08 0.07 0.07 0.06 0.07 0.06 0.06 0.06 0.05 0.05 0.05 0.05 0.05 0.04 0.04 0.04 0.04 0.04
‐0.05 0.05 0.14 0.23 0.32 0.40 0.48 0.56 0.64 0.71 0.79 0.85 0.92 0.98 1.04 1.10 1.16 1.22 1.27 1.33 1.38
0.02 0.02 0.02 0.02 0.02 0.02 0.02 0.02 0.02 0.02 0.02 0.02 0.02 0.02 0.02 0.02 0.02 0.02 0.02 0.02 0.02
21.66 21.68 21.70 21.72 21.74 21.76 21.78 21.80 21.82 21.84 21.86 21.88 21.90 21.92 21.94 21.96 21.97 21.99 22.01 22.03 22.05
0.13 0.12 0.12 0.11 0.11 0.10 0.10 0.10 0.10 0.09 0.09 0.09 0.09 0.08 0.08 0.08 0.08 0.07 0.07 0.08 0.07
1.61 1.73 1.84 1.96 2.06 2.16 2.26 2.36 2.46 2.55 2.65 2.73 2.82 2.90 2.98 3.06 3.14 3.21 3.28 3.36 3.43
0 0 0 0 0 0 0 0 0 0 0 0 0 0 0 0 0 0 0 0 0
Producing Wells + Workovers + Lateral Jetting, Mean Values
Page 2 of 6 5/14/201810:36 PM
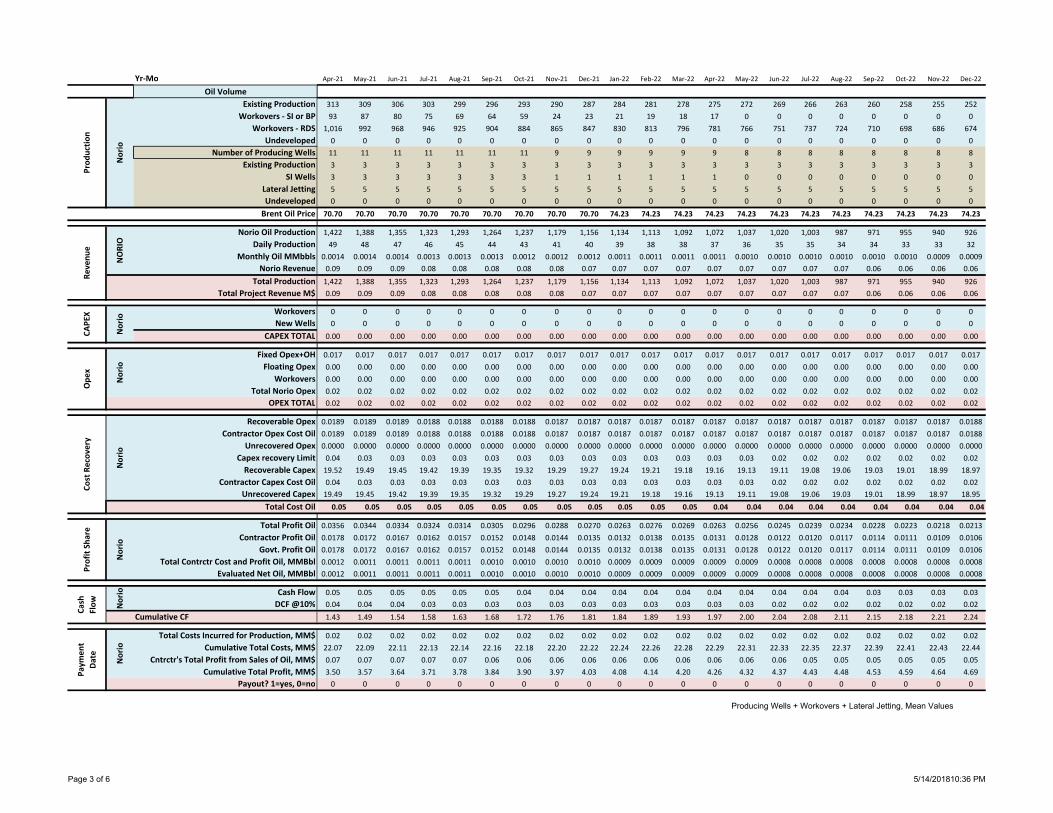
Yr‐MoOil Volume
Existing ProductionWorkovers ‐ SI or BP
Workovers ‐ RDSUndeveloped
Number of Producing WellsExisting Production
SI WellsLateral JettingUndeveloped
Norio Oil ProductionDaily Production
Monthly Oil MMbblsNorio Revenue
Total ProductionTotal Project Revenue M$
WorkoversNew Wells
CAPEX TOTAL
Fixed Opex+OHFloating Opex
WorkoversTotal Norio Opex
OPEX TOTAL
Recoverable OpexContractor Opex Cost Oil
Unrecovered OpexCapex recovery LimitRecoverable Capex
Contractor Capex Cost OilUnrecovered Capex
Total Cost Oil
Total Profit OilContractor Profit Oil
Govt. Profit OilTotal Contrctr Cost and Profit Oil, MMBbl
Evaluated Net Oil, MMBbl
Cash FlowDCF @10%
Cumulative CF
Total Costs Incurred for Production, MM$Cumulative Total Costs, MM$
Cntrctr's Total Profit from Sales of Oil, MM$Cumulative Total Profit, MM$
Payout? 1=yes, 0=no
Norio
Profit Sh
are
Norio
CAPE
X
Brent Oil Price
Reve
nue
NORIO
Prod
uctio
n
Norio
Ope
x
Norio
Cost Recov
ery
Norio
Norio
Paym
ent
Date
Norio
Cash
Flow
Apr‐21 May‐21 Jun‐21 Jul‐21 Aug‐21 Sep‐21 Oct‐21 Nov‐21 Dec‐21 Jan‐22 Feb‐22 Mar‐22 Apr‐22 May‐22 Jun‐22 Jul‐22 Aug‐22 Sep‐22 Oct‐22 Nov‐22 Dec‐22
313 309 306 303 299 296 293 290 287 284 281 278 275 272 269 266 263 260 258 255 252
93 87 80 75 69 64 59 24 23 21 19 18 17 0 0 0 0 0 0 0 0
1,016 992 968 946 925 904 884 865 847 830 813 796 781 766 751 737 724 710 698 686 674
0 0 0 0 0 0 0 0 0 0 0 0 0 0 0 0 0 0 0 0 0
11 11 11 11 11 11 11 9 9 9 9 9 9 8 8 8 8 8 8 8 8
3 3 3 3 3 3 3 3 3 3 3 3 3 3 3 3 3 3 3 3 3
3 3 3 3 3 3 3 1 1 1 1 1 1 0 0 0 0 0 0 0 0
5 5 5 5 5 5 5 5 5 5 5 5 5 5 5 5 5 5 5 5 5
0 0 0 0 0 0 0 0 0 0 0 0 0 0 0 0 0 0 0 0 0
70.70 70.70 70.70 70.70 70.70 70.70 70.70 70.70 70.70 74.23 74.23 74.23 74.23 74.23 74.23 74.23 74.23 74.23 74.23 74.23 74.23
1,422 1,388 1,355 1,323 1,293 1,264 1,237 1,179 1,156 1,134 1,113 1,092 1,072 1,037 1,020 1,003 987 971 955 940 926
49 48 47 46 45 44 43 41 40 39 38 38 37 36 35 35 34 34 33 33 32
0.0014 0.0014 0.0014 0.0013 0.0013 0.0013 0.0012 0.0012 0.0012 0.0011 0.0011 0.0011 0.0011 0.0010 0.0010 0.0010 0.0010 0.0010 0.0010 0.0009 0.0009
0.09 0.09 0.09 0.08 0.08 0.08 0.08 0.08 0.07 0.07 0.07 0.07 0.07 0.07 0.07 0.07 0.07 0.06 0.06 0.06 0.06
1,422 1,388 1,355 1,323 1,293 1,264 1,237 1,179 1,156 1,134 1,113 1,092 1,072 1,037 1,020 1,003 987 971 955 940 926
0.09 0.09 0.09 0.08 0.08 0.08 0.08 0.08 0.07 0.07 0.07 0.07 0.07 0.07 0.07 0.07 0.07 0.06 0.06 0.06 0.06
0 0 0 0 0 0 0 0 0 0 0 0 0 0 0 0 0 0 0 0 0
0 0 0 0 0 0 0 0 0 0 0 0 0 0 0 0 0 0 0 0 0
0.00 0.00 0.00 0.00 0.00 0.00 0.00 0.00 0.00 0.00 0.00 0.00 0.00 0.00 0.00 0.00 0.00 0.00 0.00 0.00 0.00
0.017 0.017 0.017 0.017 0.017 0.017 0.017 0.017 0.017 0.017 0.017 0.017 0.017 0.017 0.017 0.017 0.017 0.017 0.017 0.017 0.017
0.00 0.00 0.00 0.00 0.00 0.00 0.00 0.00 0.00 0.00 0.00 0.00 0.00 0.00 0.00 0.00 0.00 0.00 0.00 0.00 0.00
0.00 0.00 0.00 0.00 0.00 0.00 0.00 0.00 0.00 0.00 0.00 0.00 0.00 0.00 0.00 0.00 0.00 0.00 0.00 0.00 0.00
0.02 0.02 0.02 0.02 0.02 0.02 0.02 0.02 0.02 0.02 0.02 0.02 0.02 0.02 0.02 0.02 0.02 0.02 0.02 0.02 0.02
0.02 0.02 0.02 0.02 0.02 0.02 0.02 0.02 0.02 0.02 0.02 0.02 0.02 0.02 0.02 0.02 0.02 0.02 0.02 0.02 0.02
0.0189 0.0189 0.0189 0.0188 0.0188 0.0188 0.0188 0.0187 0.0187 0.0187 0.0187 0.0187 0.0187 0.0187 0.0187 0.0187 0.0187 0.0187 0.0187 0.0187 0.0188
0.0189 0.0189 0.0189 0.0188 0.0188 0.0188 0.0188 0.0187 0.0187 0.0187 0.0187 0.0187 0.0187 0.0187 0.0187 0.0187 0.0187 0.0187 0.0187 0.0187 0.0188
0.0000 0.0000 0.0000 0.0000 0.0000 0.0000 0.0000 0.0000 0.0000 0.0000 0.0000 0.0000 0.0000 0.0000 0.0000 0.0000 0.0000 0.0000 0.0000 0.0000 0.0000
0.04 0.03 0.03 0.03 0.03 0.03 0.03 0.03 0.03 0.03 0.03 0.03 0.03 0.03 0.02 0.02 0.02 0.02 0.02 0.02 0.02
19.52 19.49 19.45 19.42 19.39 19.35 19.32 19.29 19.27 19.24 19.21 19.18 19.16 19.13 19.11 19.08 19.06 19.03 19.01 18.99 18.97
0.04 0.03 0.03 0.03 0.03 0.03 0.03 0.03 0.03 0.03 0.03 0.03 0.03 0.03 0.02 0.02 0.02 0.02 0.02 0.02 0.02
19.49 19.45 19.42 19.39 19.35 19.32 19.29 19.27 19.24 19.21 19.18 19.16 19.13 19.11 19.08 19.06 19.03 19.01 18.99 18.97 18.95
0.05 0.05 0.05 0.05 0.05 0.05 0.05 0.05 0.05 0.05 0.05 0.05 0.04 0.04 0.04 0.04 0.04 0.04 0.04 0.04 0.04
0.0356 0.0344 0.0334 0.0324 0.0314 0.0305 0.0296 0.0288 0.0270 0.0263 0.0276 0.0269 0.0263 0.0256 0.0245 0.0239 0.0234 0.0228 0.0223 0.0218 0.0213
0.0178 0.0172 0.0167 0.0162 0.0157 0.0152 0.0148 0.0144 0.0135 0.0132 0.0138 0.0135 0.0131 0.0128 0.0122 0.0120 0.0117 0.0114 0.0111 0.0109 0.0106
0.0178 0.0172 0.0167 0.0162 0.0157 0.0152 0.0148 0.0144 0.0135 0.0132 0.0138 0.0135 0.0131 0.0128 0.0122 0.0120 0.0117 0.0114 0.0111 0.0109 0.0106
0.0012 0.0011 0.0011 0.0011 0.0011 0.0010 0.0010 0.0010 0.0010 0.0009 0.0009 0.0009 0.0009 0.0009 0.0008 0.0008 0.0008 0.0008 0.0008 0.0008 0.0008
0.0012 0.0011 0.0011 0.0011 0.0011 0.0010 0.0010 0.0010 0.0010 0.0009 0.0009 0.0009 0.0009 0.0009 0.0008 0.0008 0.0008 0.0008 0.0008 0.0008 0.0008
0.05 0.05 0.05 0.05 0.05 0.05 0.04 0.04 0.04 0.04 0.04 0.04 0.04 0.04 0.04 0.04 0.04 0.03 0.03 0.03 0.03
0.04 0.04 0.04 0.03 0.03 0.03 0.03 0.03 0.03 0.03 0.03 0.03 0.03 0.03 0.02 0.02 0.02 0.02 0.02 0.02 0.02
1.43 1.49 1.54 1.58 1.63 1.68 1.72 1.76 1.81 1.84 1.89 1.93 1.97 2.00 2.04 2.08 2.11 2.15 2.18 2.21 2.24
0.02 0.02 0.02 0.02 0.02 0.02 0.02 0.02 0.02 0.02 0.02 0.02 0.02 0.02 0.02 0.02 0.02 0.02 0.02 0.02 0.02
22.07 22.09 22.11 22.13 22.14 22.16 22.18 22.20 22.22 22.24 22.26 22.28 22.29 22.31 22.33 22.35 22.37 22.39 22.41 22.43 22.44
0.07 0.07 0.07 0.07 0.07 0.06 0.06 0.06 0.06 0.06 0.06 0.06 0.06 0.06 0.06 0.05 0.05 0.05 0.05 0.05 0.05
3.50 3.57 3.64 3.71 3.78 3.84 3.90 3.97 4.03 4.08 4.14 4.20 4.26 4.32 4.37 4.43 4.48 4.53 4.59 4.64 4.69
0 0 0 0 0 0 0 0 0 0 0 0 0 0 0 0 0 0 0 0 0
Producing Wells + Workovers + Lateral Jetting, Mean Values
Page 3 of 6 5/14/201810:36 PM

Yr‐MoOil Volume
Existing ProductionWorkovers ‐ SI or BP
Workovers ‐ RDSUndeveloped
Number of Producing WellsExisting Production
SI WellsLateral JettingUndeveloped
Norio Oil ProductionDaily Production
Monthly Oil MMbblsNorio Revenue
Total ProductionTotal Project Revenue M$
WorkoversNew Wells
CAPEX TOTAL
Fixed Opex+OHFloating Opex
WorkoversTotal Norio Opex
OPEX TOTAL
Recoverable OpexContractor Opex Cost Oil
Unrecovered OpexCapex recovery LimitRecoverable Capex
Contractor Capex Cost OilUnrecovered Capex
Total Cost Oil
Total Profit OilContractor Profit Oil
Govt. Profit OilTotal Contrctr Cost and Profit Oil, MMBbl
Evaluated Net Oil, MMBbl
Cash FlowDCF @10%
Cumulative CF
Total Costs Incurred for Production, MM$Cumulative Total Costs, MM$
Cntrctr's Total Profit from Sales of Oil, MM$Cumulative Total Profit, MM$
Payout? 1=yes, 0=no
Norio
Profit Sh
are
Norio
CAPE
X
Brent Oil Price
Reve
nue
NORIO
Prod
uctio
n
Norio
Ope
x
Norio
Cost Recov
ery
Norio
Norio
Paym
ent
Date
Norio
Cash
Flow
Jan‐23 Feb‐23 Mar‐23 Apr‐23 May‐23 Jun‐23 Jul‐23 Aug‐23 Sep‐23 Oct‐23 Nov‐23 Dec‐23 Jan‐24 Feb‐24 Mar‐24 Apr‐24 May‐24 Jun‐24 Jul‐24 Aug‐24
250 247 244 242 239 237 234 232 230 227 225 222 220 218 216 213 211 209 207 205
0 0 0 0 0 0 0 0 0 0 0 0 0 0 0 0 0 0 0 0
662 651 640 630 620 610 600 591 582 573 565 556 548 540 533 525 518 511 504 497
0 0 0 0 0 0 0 0 0 0 0 0 0 0 0 0 0 0 0 0
8 8 8 8 8 8 8 8 8 8 8 8 8 8 8 8 8 8 8 8
3 3 3 3 3 3 3 3 3 3 3 3 3 3 3 3 3 3 3 3
0 0 0 0 0 0 0 0 0 0 0 0 0 0 0 0 0 0 0 0
5 5 5 5 5 5 5 5 5 5 5 5 5 5 5 5 5 5 5 5
0 0 0 0 0 0 0 0 0 0 0 0 0 0 0 0 0 0 0 0
75.21 75.21 75.21 75.21 75.21 75.21 75.21 75.21 75.21 75.21 75.21 75.21 76.23 76.23 76.23 76.23 76.23 76.23 76.23 76.23
912 898 885 872 859 847 835 823 811 800 789 779 768 758 748 739 729 720 711 702
32 31 31 30 30 29 29 28 28 28 27 27 27 26 26 26 25 25 25 24
0.0009 0.0009 0.0009 0.0009 0.0009 0.0008 0.0008 0.0008 0.0008 0.0008 0.0008 0.0008 0.0008 0.0008 0.0007 0.0007 0.0007 0.0007 0.0007 0.0007
0.06 0.06 0.06 0.06 0.06 0.06 0.06 0.06 0.05 0.05 0.05 0.05 0.05 0.05 0.05 0.05 0.05 0.05 0.05 0.05
912 898 885 872 859 847 835 823 811 800 789 779 768 758 748 739 729 720 711 702
0.06 0.06 0.06 0.06 0.06 0.06 0.06 0.06 0.05 0.05 0.05 0.05 0.05 0.05 0.05 0.05 0.05 0.05 0.05 0.05
0 0 0 0 0 0 0 0 0 0 0 0 0 0 0 0 0 0 0 0
0 0 0 0 0 0 0 0 0 0 0 0 0 0 0 0 0 0 0 0
0.00 0.00 0.00 0.00 0.00 0.00 0.00 0.00 0.00 0.00 0.00 0.00 0.00 0.00 0.00 0.00 0.00 0.00 0.00 0.00
0.017 0.017 0.018 0.018 0.018 0.018 0.018 0.018 0.018 0.018 0.018 0.018 0.018 0.018 0.018 0.018 0.018 0.018 0.018 0.018
0.00 0.00 0.00 0.00 0.00 0.00 0.00 0.00 0.00 0.00 0.00 0.00 0.00 0.00 0.00 0.00 0.00 0.00 0.00 0.00
0.00 0.00 0.00 0.00 0.00 0.00 0.00 0.00 0.00 0.00 0.00 0.00 0.00 0.00 0.00 0.00 0.00 0.00 0.00 0.00
0.02 0.02 0.02 0.02 0.02 0.02 0.02 0.02 0.02 0.02 0.02 0.02 0.02 0.02 0.02 0.02 0.02 0.02 0.02 0.02
0.02 0.02 0.02 0.02 0.02 0.02 0.02 0.02 0.02 0.02 0.02 0.02 0.02 0.02 0.02 0.02 0.02 0.02 0.02 0.02
0.0188 0.0188 0.0188 0.0188 0.0188 0.0188 0.0188 0.0188 0.0189 0.0189 0.0189 0.0189 0.0189 0.0189 0.0189 0.0190 0.0190 0.0190 0.0190 0.0190
0.0188 0.0188 0.0188 0.0188 0.0188 0.0188 0.0188 0.0188 0.0189 0.0189 0.0189 0.0189 0.0189 0.0189 0.0189 0.0190 0.0190 0.0190 0.0190 0.0190
0.0000 0.0000 0.0000 0.0000 0.0000 0.0000 0.0000 0.0000 0.0000 0.0000 0.0000 0.0000 0.0000 0.0000 0.0000 0.0000 0.0000 0.0000 0.0000 0.0000
0.02 0.02 0.02 0.02 0.02 0.02 0.02 0.02 0.02 0.02 0.02 0.02 0.02 0.02 0.02 0.02 0.02 0.02 0.01 0.01
18.95 18.92 18.90 18.88 18.86 18.84 18.83 18.81 18.79 18.77 18.75 18.74 18.72 18.70 18.69 18.67 18.66 18.64 18.62 18.61
0.02 0.02 0.02 0.02 0.02 0.02 0.02 0.02 0.02 0.02 0.02 0.02 0.02 0.02 0.02 0.02 0.02 0.02 0.01 0.01
18.92 18.90 18.88 18.86 18.84 18.83 18.81 18.79 18.77 18.75 18.74 18.72 18.70 18.69 18.67 18.66 18.64 18.62 18.61 18.60
0.04 0.04 0.04 0.04 0.04 0.04 0.04 0.04 0.04 0.04 0.04 0.04 0.04 0.04 0.03 0.03 0.03 0.03 0.03 0.03
0.0208 0.0208 0.0203 0.0199 0.0195 0.0190 0.0186 0.0182 0.0178 0.0174 0.0171 0.0167 0.0163 0.0164 0.0160 0.0157 0.0153 0.0150 0.0147 0.0144
0.0104 0.0104 0.0102 0.0099 0.0097 0.0095 0.0093 0.0091 0.0089 0.0087 0.0085 0.0083 0.0082 0.0082 0.0080 0.0078 0.0077 0.0075 0.0074 0.0072
0.0104 0.0104 0.0102 0.0099 0.0097 0.0095 0.0093 0.0091 0.0089 0.0087 0.0085 0.0083 0.0082 0.0082 0.0080 0.0078 0.0077 0.0075 0.0074 0.0072
0.0008 0.0008 0.0007 0.0007 0.0007 0.0007 0.0007 0.0007 0.0007 0.0007 0.0007 0.0007 0.0006 0.0006 0.0006 0.0006 0.0006 0.0006 0.0006 0.0006
0.0008 0.0008 0.0007 0.0007 0.0007 0.0007 0.0007 0.0007 0.0007 0.0007 0.0007 0.0007 0.0006 0.0006 0.0006 0.0006 0.0006 0.0006 0.0006 0.0006
0.03 0.03 0.03 0.03 0.03 0.03 0.03 0.03 0.03 0.03 0.03 0.03 0.02 0.02 0.02 0.02 0.02 0.02 0.02 0.02
0.02 0.02 0.02 0.02 0.02 0.02 0.02 0.02 0.02 0.01 0.01 0.01 0.01 0.01 0.01 0.01 0.01 0.01 0.01 0.01
2.28 2.31 2.34 2.37 2.40 2.42 2.45 2.48 2.51 2.53 2.56 2.58 2.61 2.63 2.66 2.68 2.70 2.73 2.75 2.77
0.02 0.02 0.02 0.02 0.02 0.02 0.02 0.02 0.02 0.02 0.02 0.02 0.02 0.02 0.02 0.02 0.02 0.02 0.02 0.02
22.46 22.48 22.50 22.52 22.54 22.56 22.58 22.59 22.61 22.63 22.65 22.67 22.69 22.71 22.73 22.75 22.77 22.78 22.80 22.82
0.05 0.05 0.05 0.05 0.05 0.05 0.05 0.05 0.05 0.05 0.04 0.04 0.04 0.04 0.04 0.04 0.04 0.04 0.04 0.04
4.74 4.79 4.84 4.89 4.93 4.98 5.03 5.07 5.12 5.17 5.21 5.25 5.30 5.34 5.38 5.43 5.47 5.51 5.55 5.59
0 0 0 0 0 0 0 0 0 0 0 0 0 0 0 0 0 0 0 0
Producing Wells + Workovers + Lateral Jetti
Page 4 of 6 5/14/201810:36 PM
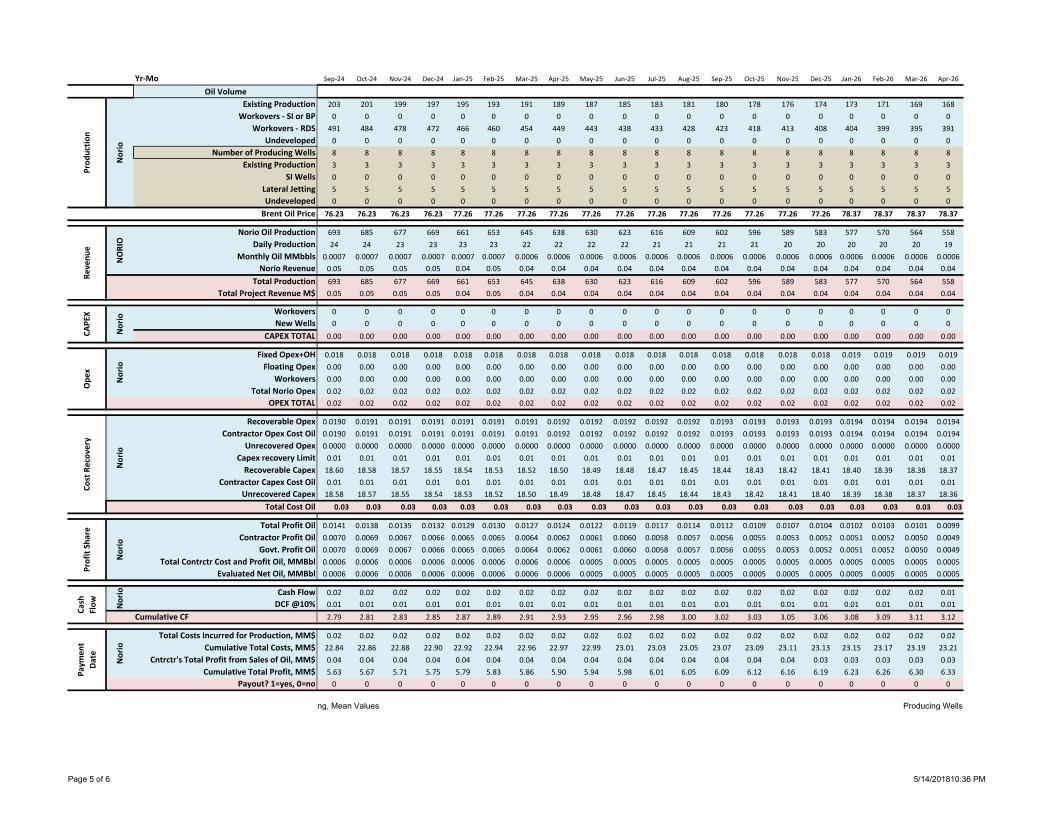
Yr‐MoOil Volume
Existing ProductionWorkovers ‐ SI or BP
Workovers ‐ RDSUndeveloped
Number of Producing WellsExisting Production
SI WellsLateral JettingUndeveloped
Norio Oil ProductionDaily Production
Monthly Oil MMbblsNorio Revenue
Total ProductionTotal Project Revenue M$
WorkoversNew Wells
CAPEX TOTAL
Fixed Opex+OHFloating Opex
WorkoversTotal Norio Opex
OPEX TOTAL
Recoverable OpexContractor Opex Cost Oil
Unrecovered OpexCapex recovery LimitRecoverable Capex
Contractor Capex Cost OilUnrecovered Capex
Total Cost Oil
Total Profit OilContractor Profit Oil
Govt. Profit OilTotal Contrctr Cost and Profit Oil, MMBbl
Evaluated Net Oil, MMBbl
Cash FlowDCF @10%
Cumulative CF
Total Costs Incurred for Production, MM$Cumulative Total Costs, MM$
Cntrctr's Total Profit from Sales of Oil, MM$Cumulative Total Profit, MM$
Payout? 1=yes, 0=no
Norio
Profit Sh
are
Norio
CAPE
X
Brent Oil Price
Reve
nue
NORIO
Prod
uctio
n
Norio
Ope
x
Norio
Cost Recov
ery
Norio
Norio
Paym
ent
Date
Norio
Cash
Flow
Sep‐24 Oct‐24 Nov‐24 Dec‐24 Jan‐25 Feb‐25 Mar‐25 Apr‐25 May‐25 Jun‐25 Jul‐25 Aug‐25 Sep‐25 Oct‐25 Nov‐25 Dec‐25 Jan‐26 Feb‐26 Mar‐26 Apr‐26
203 201 199 197 195 193 191 189 187 185 183 181 180 178 176 174 173 171 169 168
0 0 0 0 0 0 0 0 0 0 0 0 0 0 0 0 0 0 0 0
491 484 478 472 466 460 454 449 443 438 433 428 423 418 413 408 404 399 395 391
0 0 0 0 0 0 0 0 0 0 0 0 0 0 0 0 0 0 0 0
8 8 8 8 8 8 8 8 8 8 8 8 8 8 8 8 8 8 8 8
3 3 3 3 3 3 3 3 3 3 3 3 3 3 3 3 3 3 3 3
0 0 0 0 0 0 0 0 0 0 0 0 0 0 0 0 0 0 0 0
5 5 5 5 5 5 5 5 5 5 5 5 5 5 5 5 5 5 5 5
0 0 0 0 0 0 0 0 0 0 0 0 0 0 0 0 0 0 0 0
76.23 76.23 76.23 76.23 77.26 77.26 77.26 77.26 77.26 77.26 77.26 77.26 77.26 77.26 77.26 77.26 78.37 78.37 78.37 78.37
693 685 677 669 661 653 645 638 630 623 616 609 602 596 589 583 577 570 564 558
24 24 23 23 23 23 22 22 22 22 21 21 21 21 20 20 20 20 20 19
0.0007 0.0007 0.0007 0.0007 0.0007 0.0007 0.0006 0.0006 0.0006 0.0006 0.0006 0.0006 0.0006 0.0006 0.0006 0.0006 0.0006 0.0006 0.0006 0.0006
0.05 0.05 0.05 0.05 0.04 0.05 0.04 0.04 0.04 0.04 0.04 0.04 0.04 0.04 0.04 0.04 0.04 0.04 0.04 0.04
693 685 677 669 661 653 645 638 630 623 616 609 602 596 589 583 577 570 564 558
0.05 0.05 0.05 0.05 0.04 0.05 0.04 0.04 0.04 0.04 0.04 0.04 0.04 0.04 0.04 0.04 0.04 0.04 0.04 0.04
0 0 0 0 0 0 0 0 0 0 0 0 0 0 0 0 0 0 0 0
0 0 0 0 0 0 0 0 0 0 0 0 0 0 0 0 0 0 0 0
0.00 0.00 0.00 0.00 0.00 0.00 0.00 0.00 0.00 0.00 0.00 0.00 0.00 0.00 0.00 0.00 0.00 0.00 0.00 0.00
0.018 0.018 0.018 0.018 0.018 0.018 0.018 0.018 0.018 0.018 0.018 0.018 0.018 0.018 0.018 0.018 0.019 0.019 0.019 0.019
0.00 0.00 0.00 0.00 0.00 0.00 0.00 0.00 0.00 0.00 0.00 0.00 0.00 0.00 0.00 0.00 0.00 0.00 0.00 0.00
0.00 0.00 0.00 0.00 0.00 0.00 0.00 0.00 0.00 0.00 0.00 0.00 0.00 0.00 0.00 0.00 0.00 0.00 0.00 0.00
0.02 0.02 0.02 0.02 0.02 0.02 0.02 0.02 0.02 0.02 0.02 0.02 0.02 0.02 0.02 0.02 0.02 0.02 0.02 0.02
0.02 0.02 0.02 0.02 0.02 0.02 0.02 0.02 0.02 0.02 0.02 0.02 0.02 0.02 0.02 0.02 0.02 0.02 0.02 0.02
0.0190 0.0191 0.0191 0.0191 0.0191 0.0191 0.0191 0.0192 0.0192 0.0192 0.0192 0.0192 0.0193 0.0193 0.0193 0.0193 0.0194 0.0194 0.0194 0.0194
0.0190 0.0191 0.0191 0.0191 0.0191 0.0191 0.0191 0.0192 0.0192 0.0192 0.0192 0.0192 0.0193 0.0193 0.0193 0.0193 0.0194 0.0194 0.0194 0.0194
0.0000 0.0000 0.0000 0.0000 0.0000 0.0000 0.0000 0.0000 0.0000 0.0000 0.0000 0.0000 0.0000 0.0000 0.0000 0.0000 0.0000 0.0000 0.0000 0.0000
0.01 0.01 0.01 0.01 0.01 0.01 0.01 0.01 0.01 0.01 0.01 0.01 0.01 0.01 0.01 0.01 0.01 0.01 0.01 0.01
18.60 18.58 18.57 18.55 18.54 18.53 18.52 18.50 18.49 18.48 18.47 18.45 18.44 18.43 18.42 18.41 18.40 18.39 18.38 18.37
0.01 0.01 0.01 0.01 0.01 0.01 0.01 0.01 0.01 0.01 0.01 0.01 0.01 0.01 0.01 0.01 0.01 0.01 0.01 0.01
18.58 18.57 18.55 18.54 18.53 18.52 18.50 18.49 18.48 18.47 18.45 18.44 18.43 18.42 18.41 18.40 18.39 18.38 18.37 18.36
0.03 0.03 0.03 0.03 0.03 0.03 0.03 0.03 0.03 0.03 0.03 0.03 0.03 0.03 0.03 0.03 0.03 0.03 0.03 0.03
0.0141 0.0138 0.0135 0.0132 0.0129 0.0130 0.0127 0.0124 0.0122 0.0119 0.0117 0.0114 0.0112 0.0109 0.0107 0.0104 0.0102 0.0103 0.0101 0.0099
0.0070 0.0069 0.0067 0.0066 0.0065 0.0065 0.0064 0.0062 0.0061 0.0060 0.0058 0.0057 0.0056 0.0055 0.0053 0.0052 0.0051 0.0052 0.0050 0.0049
0.0070 0.0069 0.0067 0.0066 0.0065 0.0065 0.0064 0.0062 0.0061 0.0060 0.0058 0.0057 0.0056 0.0055 0.0053 0.0052 0.0051 0.0052 0.0050 0.0049
0.0006 0.0006 0.0006 0.0006 0.0006 0.0006 0.0006 0.0006 0.0005 0.0005 0.0005 0.0005 0.0005 0.0005 0.0005 0.0005 0.0005 0.0005 0.0005 0.0005
0.0006 0.0006 0.0006 0.0006 0.0006 0.0006 0.0006 0.0006 0.0005 0.0005 0.0005 0.0005 0.0005 0.0005 0.0005 0.0005 0.0005 0.0005 0.0005 0.0005
0.02 0.02 0.02 0.02 0.02 0.02 0.02 0.02 0.02 0.02 0.02 0.02 0.02 0.02 0.02 0.02 0.02 0.02 0.02 0.01
0.01 0.01 0.01 0.01 0.01 0.01 0.01 0.01 0.01 0.01 0.01 0.01 0.01 0.01 0.01 0.01 0.01 0.01 0.01 0.01
2.79 2.81 2.83 2.85 2.87 2.89 2.91 2.93 2.95 2.96 2.98 3.00 3.02 3.03 3.05 3.06 3.08 3.09 3.11 3.12
0.02 0.02 0.02 0.02 0.02 0.02 0.02 0.02 0.02 0.02 0.02 0.02 0.02 0.02 0.02 0.02 0.02 0.02 0.02 0.02
22.84 22.86 22.88 22.90 22.92 22.94 22.96 22.97 22.99 23.01 23.03 23.05 23.07 23.09 23.11 23.13 23.15 23.17 23.19 23.21
0.04 0.04 0.04 0.04 0.04 0.04 0.04 0.04 0.04 0.04 0.04 0.04 0.04 0.04 0.04 0.03 0.03 0.03 0.03 0.03
5.63 5.67 5.71 5.75 5.79 5.83 5.86 5.90 5.94 5.98 6.01 6.05 6.09 6.12 6.16 6.19 6.23 6.26 6.30 6.33
0 0 0 0 0 0 0 0 0 0 0 0 0 0 0 0 0 0 0 0
ng, Mean Values Producing Wells
Page 5 of 6 5/14/201810:36 PM
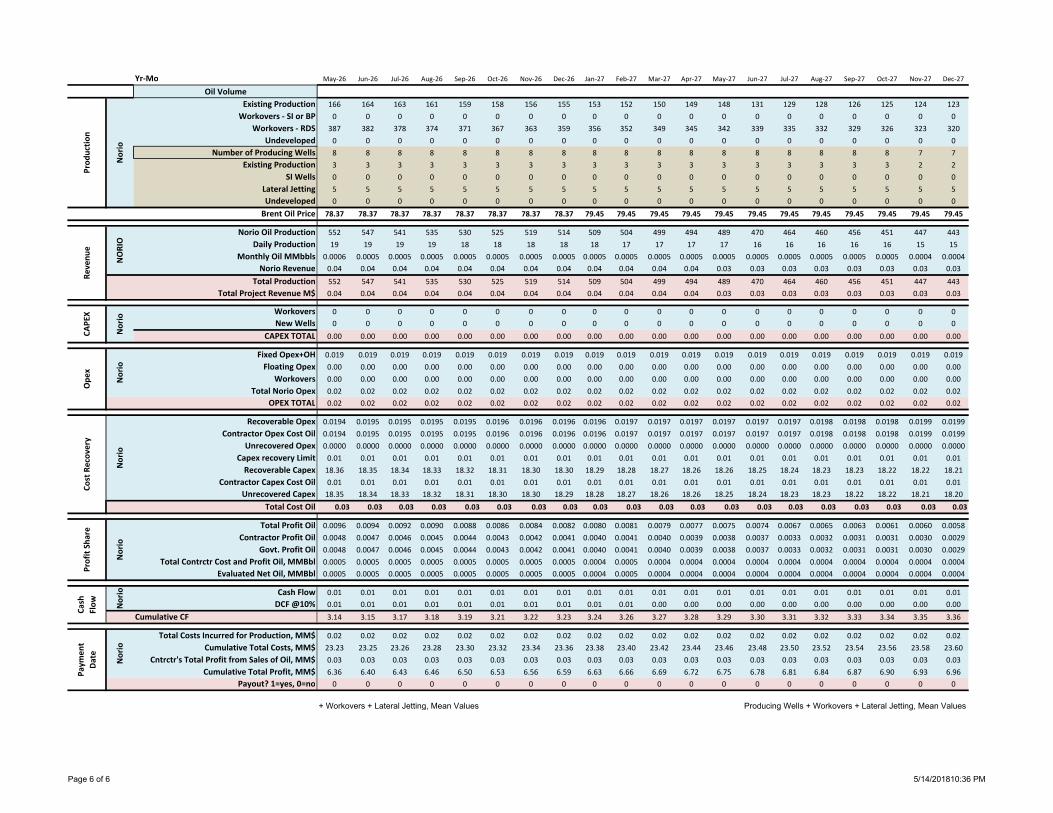
Yr‐MoOil Volume
Existing ProductionWorkovers ‐ SI or BP
Workovers ‐ RDSUndeveloped
Number of Producing WellsExisting Production
SI WellsLateral JettingUndeveloped
Norio Oil ProductionDaily Production
Monthly Oil MMbblsNorio Revenue
Total ProductionTotal Project Revenue M$
WorkoversNew Wells
CAPEX TOTAL
Fixed Opex+OHFloating Opex
WorkoversTotal Norio Opex
OPEX TOTAL
Recoverable OpexContractor Opex Cost Oil
Unrecovered OpexCapex recovery LimitRecoverable Capex
Contractor Capex Cost OilUnrecovered Capex
Total Cost Oil
Total Profit OilContractor Profit Oil
Govt. Profit OilTotal Contrctr Cost and Profit Oil, MMBbl
Evaluated Net Oil, MMBbl
Cash FlowDCF @10%
Cumulative CF
Total Costs Incurred for Production, MM$Cumulative Total Costs, MM$
Cntrctr's Total Profit from Sales of Oil, MM$Cumulative Total Profit, MM$
Payout? 1=yes, 0=no
Norio
Profit Sh
are
Norio
CAPE
X
Brent Oil Price
Reve
nue
NORIO
Prod
uctio
n
Norio
Ope
x
Norio
Cost Recov
ery
Norio
Norio
Paym
ent
Date
Norio
Cash
Flow
May‐26 Jun‐26 Jul‐26 Aug‐26 Sep‐26 Oct‐26 Nov‐26 Dec‐26 Jan‐27 Feb‐27 Mar‐27 Apr‐27 May‐27 Jun‐27 Jul‐27 Aug‐27 Sep‐27 Oct‐27 Nov‐27 Dec‐27
166 164 163 161 159 158 156 155 153 152 150 149 148 131 129 128 126 125 124 123
0 0 0 0 0 0 0 0 0 0 0 0 0 0 0 0 0 0 0 0
387 382 378 374 371 367 363 359 356 352 349 345 342 339 335 332 329 326 323 320
0 0 0 0 0 0 0 0 0 0 0 0 0 0 0 0 0 0 0 0
8 8 8 8 8 8 8 8 8 8 8 8 8 8 8 8 8 8 7 7
3 3 3 3 3 3 3 3 3 3 3 3 3 3 3 3 3 3 2 2
0 0 0 0 0 0 0 0 0 0 0 0 0 0 0 0 0 0 0 0
5 5 5 5 5 5 5 5 5 5 5 5 5 5 5 5 5 5 5 5
0 0 0 0 0 0 0 0 0 0 0 0 0 0 0 0 0 0 0 0
78.37 78.37 78.37 78.37 78.37 78.37 78.37 78.37 79.45 79.45 79.45 79.45 79.45 79.45 79.45 79.45 79.45 79.45 79.45 79.45
552 547 541 535 530 525 519 514 509 504 499 494 489 470 464 460 456 451 447 443
19 19 19 19 18 18 18 18 18 17 17 17 17 16 16 16 16 16 15 15
0.0006 0.0005 0.0005 0.0005 0.0005 0.0005 0.0005 0.0005 0.0005 0.0005 0.0005 0.0005 0.0005 0.0005 0.0005 0.0005 0.0005 0.0005 0.0004 0.0004
0.04 0.04 0.04 0.04 0.04 0.04 0.04 0.04 0.04 0.04 0.04 0.04 0.03 0.03 0.03 0.03 0.03 0.03 0.03 0.03
552 547 541 535 530 525 519 514 509 504 499 494 489 470 464 460 456 451 447 443
0.04 0.04 0.04 0.04 0.04 0.04 0.04 0.04 0.04 0.04 0.04 0.04 0.03 0.03 0.03 0.03 0.03 0.03 0.03 0.03
0 0 0 0 0 0 0 0 0 0 0 0 0 0 0 0 0 0 0 0
0 0 0 0 0 0 0 0 0 0 0 0 0 0 0 0 0 0 0 0
0.00 0.00 0.00 0.00 0.00 0.00 0.00 0.00 0.00 0.00 0.00 0.00 0.00 0.00 0.00 0.00 0.00 0.00 0.00 0.00
0.019 0.019 0.019 0.019 0.019 0.019 0.019 0.019 0.019 0.019 0.019 0.019 0.019 0.019 0.019 0.019 0.019 0.019 0.019 0.019
0.00 0.00 0.00 0.00 0.00 0.00 0.00 0.00 0.00 0.00 0.00 0.00 0.00 0.00 0.00 0.00 0.00 0.00 0.00 0.00
0.00 0.00 0.00 0.00 0.00 0.00 0.00 0.00 0.00 0.00 0.00 0.00 0.00 0.00 0.00 0.00 0.00 0.00 0.00 0.00
0.02 0.02 0.02 0.02 0.02 0.02 0.02 0.02 0.02 0.02 0.02 0.02 0.02 0.02 0.02 0.02 0.02 0.02 0.02 0.02
0.02 0.02 0.02 0.02 0.02 0.02 0.02 0.02 0.02 0.02 0.02 0.02 0.02 0.02 0.02 0.02 0.02 0.02 0.02 0.02
0.0194 0.0195 0.0195 0.0195 0.0195 0.0196 0.0196 0.0196 0.0196 0.0197 0.0197 0.0197 0.0197 0.0197 0.0197 0.0198 0.0198 0.0198 0.0199 0.0199
0.0194 0.0195 0.0195 0.0195 0.0195 0.0196 0.0196 0.0196 0.0196 0.0197 0.0197 0.0197 0.0197 0.0197 0.0197 0.0198 0.0198 0.0198 0.0199 0.0199
0.0000 0.0000 0.0000 0.0000 0.0000 0.0000 0.0000 0.0000 0.0000 0.0000 0.0000 0.0000 0.0000 0.0000 0.0000 0.0000 0.0000 0.0000 0.0000 0.0000
0.01 0.01 0.01 0.01 0.01 0.01 0.01 0.01 0.01 0.01 0.01 0.01 0.01 0.01 0.01 0.01 0.01 0.01 0.01 0.01
18.36 18.35 18.34 18.33 18.32 18.31 18.30 18.30 18.29 18.28 18.27 18.26 18.26 18.25 18.24 18.23 18.23 18.22 18.22 18.21
0.01 0.01 0.01 0.01 0.01 0.01 0.01 0.01 0.01 0.01 0.01 0.01 0.01 0.01 0.01 0.01 0.01 0.01 0.01 0.01
18.35 18.34 18.33 18.32 18.31 18.30 18.30 18.29 18.28 18.27 18.26 18.26 18.25 18.24 18.23 18.23 18.22 18.22 18.21 18.20
0.03 0.03 0.03 0.03 0.03 0.03 0.03 0.03 0.03 0.03 0.03 0.03 0.03 0.03 0.03 0.03 0.03 0.03 0.03 0.03
0.0096 0.0094 0.0092 0.0090 0.0088 0.0086 0.0084 0.0082 0.0080 0.0081 0.0079 0.0077 0.0075 0.0074 0.0067 0.0065 0.0063 0.0061 0.0060 0.0058
0.0048 0.0047 0.0046 0.0045 0.0044 0.0043 0.0042 0.0041 0.0040 0.0041 0.0040 0.0039 0.0038 0.0037 0.0033 0.0032 0.0031 0.0031 0.0030 0.0029
0.0048 0.0047 0.0046 0.0045 0.0044 0.0043 0.0042 0.0041 0.0040 0.0041 0.0040 0.0039 0.0038 0.0037 0.0033 0.0032 0.0031 0.0031 0.0030 0.0029
0.0005 0.0005 0.0005 0.0005 0.0005 0.0005 0.0005 0.0005 0.0004 0.0005 0.0004 0.0004 0.0004 0.0004 0.0004 0.0004 0.0004 0.0004 0.0004 0.0004
0.0005 0.0005 0.0005 0.0005 0.0005 0.0005 0.0005 0.0005 0.0004 0.0005 0.0004 0.0004 0.0004 0.0004 0.0004 0.0004 0.0004 0.0004 0.0004 0.0004
0.01 0.01 0.01 0.01 0.01 0.01 0.01 0.01 0.01 0.01 0.01 0.01 0.01 0.01 0.01 0.01 0.01 0.01 0.01 0.01
0.01 0.01 0.01 0.01 0.01 0.01 0.01 0.01 0.01 0.01 0.00 0.00 0.00 0.00 0.00 0.00 0.00 0.00 0.00 0.00
3.14 3.15 3.17 3.18 3.19 3.21 3.22 3.23 3.24 3.26 3.27 3.28 3.29 3.30 3.31 3.32 3.33 3.34 3.35 3.36
0.02 0.02 0.02 0.02 0.02 0.02 0.02 0.02 0.02 0.02 0.02 0.02 0.02 0.02 0.02 0.02 0.02 0.02 0.02 0.02
23.23 23.25 23.26 23.28 23.30 23.32 23.34 23.36 23.38 23.40 23.42 23.44 23.46 23.48 23.50 23.52 23.54 23.56 23.58 23.60
0.03 0.03 0.03 0.03 0.03 0.03 0.03 0.03 0.03 0.03 0.03 0.03 0.03 0.03 0.03 0.03 0.03 0.03 0.03 0.03
6.36 6.40 6.43 6.46 6.50 6.53 6.56 6.59 6.63 6.66 6.69 6.72 6.75 6.78 6.81 6.84 6.87 6.90 6.93 6.96
0 0 0 0 0 0 0 0 0 0 0 0 0 0 0 0 0 0 0 0
+ Workovers + Lateral Jetting, Mean Values Producing Wells + Workovers + Lateral Jetting, Mean Values
Page 6 of 6 5/14/201810:36 PM
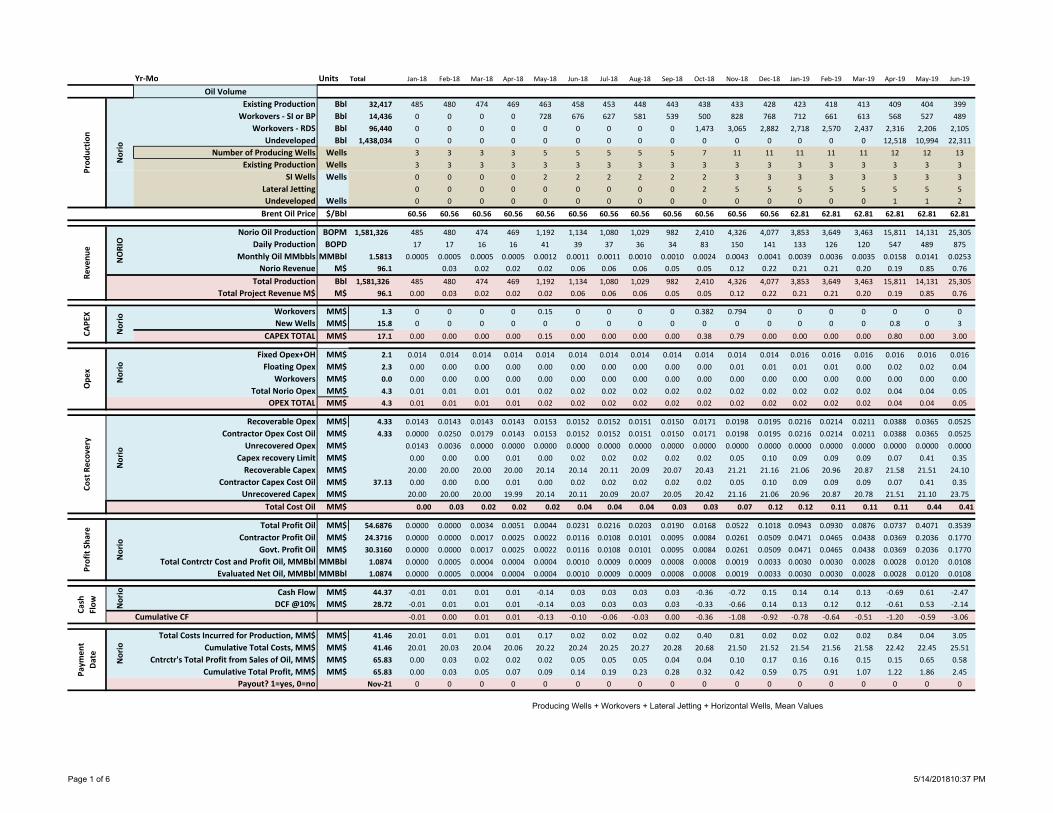
Yr‐Mo Units Total Jan‐18 Feb‐18 Mar‐18 Apr‐18 May‐18 Jun‐18 Jul‐18 Aug‐18 Sep‐18 Oct‐18 Nov‐18 Dec‐18 Jan‐19 Feb‐19 Mar‐19 Apr‐19 May‐19 Jun‐19
Oil VolumeExisting Production Bbl 32,417 485 480 474 469 463 458 453 448 443 438 433 428 423 418 413 409 404 399
Workovers ‐ SI or BP Bbl 14,436 0 0 0 0 728 676 627 581 539 500 828 768 712 661 613 568 527 489
Workovers ‐ RDS Bbl 96,440 0 0 0 0 0 0 0 0 0 1,473 3,065 2,882 2,718 2,570 2,437 2,316 2,206 2,105
Undeveloped Bbl 1,438,034 0 0 0 0 0 0 0 0 0 0 0 0 0 0 0 12,518 10,994 22,311
Number of Producing Wells Wells 3 3 3 3 5 5 5 5 5 7 11 11 11 11 11 12 12 13
Existing Production Wells 3 3 3 3 3 3 3 3 3 3 3 3 3 3 3 3 3 3
SI Wells Wells 0 0 0 0 2 2 2 2 2 2 3 3 3 3 3 3 3 3
Lateral Jetting 0 0 0 0 0 0 0 0 0 2 5 5 5 5 5 5 5 5
Undeveloped Wells 0 0 0 0 0 0 0 0 0 0 0 0 0 0 0 1 1 2
$/Bbl 60.56 60.56 60.56 60.56 60.56 60.56 60.56 60.56 60.56 60.56 60.56 60.56 62.81 62.81 62.81 62.81 62.81 62.81
Norio Oil Production BOPM 1,581,326 485 480 474 469 1,192 1,134 1,080 1,029 982 2,410 4,326 4,077 3,853 3,649 3,463 15,811 14,131 25,305
Daily Production BOPD 17 17 16 16 41 39 37 36 34 83 150 141 133 126 120 547 489 875
Monthly Oil MMbbls MMBbl 1.5813 0.0005 0.0005 0.0005 0.0005 0.0012 0.0011 0.0011 0.0010 0.0010 0.0024 0.0043 0.0041 0.0039 0.0036 0.0035 0.0158 0.0141 0.0253
Norio Revenue M$ 96.1 0.03 0.02 0.02 0.02 0.06 0.06 0.06 0.05 0.05 0.12 0.22 0.21 0.21 0.20 0.19 0.85 0.76
Total Production Bbl 1,581,326 485 480 474 469 1,192 1,134 1,080 1,029 982 2,410 4,326 4,077 3,853 3,649 3,463 15,811 14,131 25,305
Total Project Revenue M$ M$ 96.1 0.00 0.03 0.02 0.02 0.02 0.06 0.06 0.06 0.05 0.05 0.12 0.22 0.21 0.21 0.20 0.19 0.85 0.76
Workovers MM$ 1.3 0 0 0 0 0.15 0 0 0 0 0.382 0.794 0 0 0 0 0 0 0
New Wells MM$ 15.8 0 0 0 0 0 0 0 0 0 0 0 0 0 0 0 0.8 0 3
CAPEX TOTAL MM$ 17.1 0.00 0.00 0.00 0.00 0.15 0.00 0.00 0.00 0.00 0.38 0.79 0.00 0.00 0.00 0.00 0.80 0.00 3.00
Fixed Opex+OH MM$ 2.1 0.014 0.014 0.014 0.014 0.014 0.014 0.014 0.014 0.014 0.014 0.014 0.014 0.016 0.016 0.016 0.016 0.016 0.016
Floating Opex MM$ 2.3 0.00 0.00 0.00 0.00 0.00 0.00 0.00 0.00 0.00 0.00 0.01 0.01 0.01 0.01 0.00 0.02 0.02 0.04
Workovers MM$ 0.0 0.00 0.00 0.00 0.00 0.00 0.00 0.00 0.00 0.00 0.00 0.00 0.00 0.00 0.00 0.00 0.00 0.00 0.00
Total Norio Opex MM$ 4.3 0.01 0.01 0.01 0.01 0.02 0.02 0.02 0.02 0.02 0.02 0.02 0.02 0.02 0.02 0.02 0.04 0.04 0.05
OPEX TOTAL MM$ 4.3 0.01 0.01 0.01 0.01 0.02 0.02 0.02 0.02 0.02 0.02 0.02 0.02 0.02 0.02 0.02 0.04 0.04 0.05
Recoverable Opex MM$ 4.33 0.0143 0.0143 0.0143 0.0143 0.0153 0.0152 0.0152 0.0151 0.0150 0.0171 0.0198 0.0195 0.0216 0.0214 0.0211 0.0388 0.0365 0.0525
Contractor Opex Cost Oil MM$ 4.33 0.0000 0.0250 0.0179 0.0143 0.0153 0.0152 0.0152 0.0151 0.0150 0.0171 0.0198 0.0195 0.0216 0.0214 0.0211 0.0388 0.0365 0.0525
Unrecovered Opex MM$ 0.0143 0.0036 0.0000 0.0000 0.0000 0.0000 0.0000 0.0000 0.0000 0.0000 0.0000 0.0000 0.0000 0.0000 0.0000 0.0000 0.0000 0.0000
Capex recovery Limit MM$ 0.00 0.00 0.00 0.01 0.00 0.02 0.02 0.02 0.02 0.02 0.05 0.10 0.09 0.09 0.09 0.07 0.41 0.35
Recoverable Capex MM$ 20.00 20.00 20.00 20.00 20.14 20.14 20.11 20.09 20.07 20.43 21.21 21.16 21.06 20.96 20.87 21.58 21.51 24.10
Contractor Capex Cost Oil MM$ 37.13 0.00 0.00 0.00 0.01 0.00 0.02 0.02 0.02 0.02 0.02 0.05 0.10 0.09 0.09 0.09 0.07 0.41 0.35
Unrecovered Capex MM$ 20.00 20.00 20.00 19.99 20.14 20.11 20.09 20.07 20.05 20.42 21.16 21.06 20.96 20.87 20.78 21.51 21.10 23.75
Total Cost Oil MM$ 0.00 0.03 0.02 0.02 0.02 0.04 0.04 0.04 0.03 0.03 0.07 0.12 0.12 0.11 0.11 0.11 0.44 0.41
Total Profit Oil MM$ 54.6876 0.0000 0.0000 0.0034 0.0051 0.0044 0.0231 0.0216 0.0203 0.0190 0.0168 0.0522 0.1018 0.0943 0.0930 0.0876 0.0737 0.4071 0.3539
Contractor Profit Oil MM$ 24.3716 0.0000 0.0000 0.0017 0.0025 0.0022 0.0116 0.0108 0.0101 0.0095 0.0084 0.0261 0.0509 0.0471 0.0465 0.0438 0.0369 0.2036 0.1770
Govt. Profit Oil MM$ 30.3160 0.0000 0.0000 0.0017 0.0025 0.0022 0.0116 0.0108 0.0101 0.0095 0.0084 0.0261 0.0509 0.0471 0.0465 0.0438 0.0369 0.2036 0.1770
Total Contrctr Cost and Profit Oil, MMBbl MMBbl 1.0874 0.0000 0.0005 0.0004 0.0004 0.0004 0.0010 0.0009 0.0009 0.0008 0.0008 0.0019 0.0033 0.0030 0.0030 0.0028 0.0028 0.0120 0.0108
Evaluated Net Oil, MMBbl MMBbl 1.0874 0.0000 0.0005 0.0004 0.0004 0.0004 0.0010 0.0009 0.0009 0.0008 0.0008 0.0019 0.0033 0.0030 0.0030 0.0028 0.0028 0.0120 0.0108
Cash Flow MM$ 44.37 ‐0.01 0.01 0.01 0.01 ‐0.14 0.03 0.03 0.03 0.03 ‐0.36 ‐0.72 0.15 0.14 0.14 0.13 ‐0.69 0.61 ‐2.47
DCF @10% MM$ 28.72 ‐0.01 0.01 0.01 0.01 ‐0.14 0.03 0.03 0.03 0.03 ‐0.33 ‐0.66 0.14 0.13 0.12 0.12 ‐0.61 0.53 ‐2.14
Cumulative CF ‐0.01 0.00 0.01 0.01 ‐0.13 ‐0.10 ‐0.06 ‐0.03 0.00 ‐0.36 ‐1.08 ‐0.92 ‐0.78 ‐0.64 ‐0.51 ‐1.20 ‐0.59 ‐3.06
Total Costs Incurred for Production, MM$ MM$ 41.46 20.01 0.01 0.01 0.01 0.17 0.02 0.02 0.02 0.02 0.40 0.81 0.02 0.02 0.02 0.02 0.84 0.04 3.05
Cumulative Total Costs, MM$ MM$ 41.46 20.01 20.03 20.04 20.06 20.22 20.24 20.25 20.27 20.28 20.68 21.50 21.52 21.54 21.56 21.58 22.42 22.45 25.51
Cntrctr's Total Profit from Sales of Oil, MM$ MM$ 65.83 0.00 0.03 0.02 0.02 0.02 0.05 0.05 0.05 0.04 0.04 0.10 0.17 0.16 0.16 0.15 0.15 0.65 0.58
Cumulative Total Profit, MM$ MM$ 65.83 0.00 0.03 0.05 0.07 0.09 0.14 0.19 0.23 0.28 0.32 0.42 0.59 0.75 0.91 1.07 1.22 1.86 2.45
Payout? 1=yes, 0=no Nov‐21 0 0 0 0 0 0 0 0 0 0 0 0 0 0 0 0 0 0
Producing Wells + Workovers + Lateral Jetting + Horizontal Wells, Mean Values
Norio
Profit Sh
are
Norio
CAPE
X
Brent Oil Price
Reve
nue
NORIO
Prod
uctio
n
Norio
Ope
x
Norio
Cost Recov
ery
Norio
Norio
Paym
ent
Date
Norio
Cash
Flow
Page 1 of 6 5/14/201810:37 PM

Yr‐MoOil Volume
Existing ProductionWorkovers ‐ SI or BP
Workovers ‐ RDSUndeveloped
Number of Producing WellsExisting Production
SI WellsLateral JettingUndeveloped
Norio Oil ProductionDaily Production
Monthly Oil MMbblsNorio Revenue
Total ProductionTotal Project Revenue M$
WorkoversNew Wells
CAPEX TOTAL
Fixed Opex+OHFloating Opex
WorkoversTotal Norio Opex
OPEX TOTAL
Recoverable OpexContractor Opex Cost Oil
Unrecovered OpexCapex recovery LimitRecoverable Capex
Contractor Capex Cost OilUnrecovered Capex
Total Cost Oil
Total Profit OilContractor Profit Oil
Govt. Profit OilTotal Contrctr Cost and Profit Oil, MMBbl
Evaluated Net Oil, MMBbl
Cash FlowDCF @10%
Cumulative CF
Total Costs Incurred for Production, MM$Cumulative Total Costs, MM$
Cntrctr's Total Profit from Sales of Oil, MM$Cumulative Total Profit, MM$
Payout? 1=yes, 0=no
Norio
Profit Sh
are
Norio
CAPE
X
Brent Oil Price
Reve
nue
NORIO
Prod
uctio
n
Norio
Ope
x
Norio
Cost Recov
ery
Norio
Norio
Paym
ent
Date
Norio
Cash
Flow
Jul‐19 Aug‐19 Sep‐19 Oct‐19 Nov‐19 Dec‐19 Jan‐20 Feb‐20 Mar‐20 Apr‐20 May‐20 Jun‐20 Jul‐20 Aug‐20 Sep‐20 Oct‐20 Nov‐20 Dec‐20 Jan‐21 Feb‐21 Mar‐21
395 390 386 382 377 373 369 365 361 357 353 349 345 341 338 334 330 327 323 320 316
454 421 390 362 336 311 289 268 248 230 214 198 184 171 158 147 136 126 117 109 101
2,012 1,927 1,848 1,775 1,707 1,644 1,585 1,529 1,478 1,429 1,383 1,340 1,300 1,261 1,225 1,190 1,158 1,127 1,097 1,069 1,042
19,817 30,334 27,170 37,117 33,462 42,983 38,955 48,147 43,825 40,236 37,201 34,598 32,339 30,359 28,607 27,046 25,647 24,384 23,238 22,195 21,240
13 14 14 15 15 16 16 17 17 17 17 17 17 17 17 17 17 17 17 17 17
3 3 3 3 3 3 3 3 3 3 3 3 3 3 3 3 3 3 3 3 3
3 3 3 3 3 3 3 3 3 3 3 3 3 3 3 3 3 3 3 3 3
5 5 5 5 5 5 5 5 5 5 5 5 5 5 5 5 5 5 5 5 5
2 3 3 4 4 5 5 6 6 6 6 6 6 6 6 6 6 6 6 6 6
62.81 62.81 62.81 62.81 62.81 62.81 65.80 65.80 65.80 65.80 65.80 65.80 65.80 65.80 65.80 65.80 65.80 65.80 70.70 70.70 70.70
22,678 33,072 29,794 39,635 35,882 45,312 41,198 50,309 45,912 42,252 39,151 36,486 34,168 32,132 30,328 28,718 27,271 25,963 24,775 23,692 22,698
784 1,144 1,030 1,371 1,241 1,567 1,425 1,740 1,588 1,461 1,354 1,262 1,182 1,111 1,049 993 943 898 857 819 785
0.0227 0.0331 0.0298 0.0396 0.0359 0.0453 0.0412 0.0503 0.0459 0.0423 0.0392 0.0365 0.0342 0.0321 0.0303 0.0287 0.0273 0.0260 0.0248 0.0237 0.0227
1.36 1.22 1.78 1.60 2.13 1.93 2.44 2.34 2.86 2.61 2.40 2.22 2.07 1.94 1.83 1.72 1.63 1.55 1.47 1.53 1.46
22,678 33,072 29,794 39,635 35,882 45,312 41,198 50,309 45,912 42,252 39,151 36,486 34,168 32,132 30,328 28,718 27,271 25,963 24,775 23,692 22,698
1.36 1.22 1.78 1.60 2.13 1.93 2.44 2.34 2.86 2.61 2.40 2.22 2.07 1.94 1.83 1.72 1.63 1.55 1.47 1.53 1.46
0 0 0 0 0 0 0 0 0 0 0 0 0 0 0 0 0 0 0 0 0
0 3 0 3 0 3 0 3 0 0 0 0 0 0 0 0 0 0 0 0 0
0.00 3.00 0.00 3.00 0.00 3.00 0.00 3.00 0.00 0.00 0.00 0.00 0.00 0.00 0.00 0.00 0.00 0.00 0.00 0.00 0.00
0.016 0.016 0.016 0.016 0.016 0.016 0.016 0.016 0.017 0.017 0.017 0.017 0.017 0.017 0.017 0.017 0.017 0.017 0.017 0.017 0.017
0.03 0.05 0.04 0.06 0.05 0.06 0.06 0.07 0.07 0.06 0.06 0.05 0.05 0.05 0.04 0.04 0.04 0.04 0.04 0.03 0.03
0.00 0.00 0.00 0.00 0.00 0.00 0.00 0.00 0.00 0.00 0.00 0.00 0.00 0.00 0.00 0.00 0.00 0.00 0.00 0.00 0.00
0.05 0.06 0.06 0.07 0.07 0.08 0.08 0.09 0.08 0.08 0.07 0.07 0.07 0.06 0.06 0.06 0.06 0.05 0.05 0.05 0.05
0.05 0.06 0.06 0.07 0.07 0.08 0.08 0.09 0.08 0.08 0.07 0.07 0.07 0.06 0.06 0.06 0.06 0.05 0.05 0.05 0.05
0.0488 0.0637 0.0590 0.0731 0.0678 0.0813 0.0754 0.0885 0.0823 0.0770 0.0726 0.0688 0.0655 0.0627 0.0601 0.0578 0.0558 0.0539 0.0523 0.0507 0.0493
0.0488 0.0637 0.0590 0.0731 0.0678 0.0813 0.0754 0.0885 0.0823 0.0770 0.0726 0.0688 0.0655 0.0627 0.0601 0.0578 0.0558 0.0539 0.0523 0.0507 0.0493
0.0000 0.0000 0.0000 0.0000 0.0000 0.0000 0.0000 0.0000 0.0000 0.0000 0.0000 0.0000 0.0000 0.0000 0.0000 0.0000 0.0000 0.0000 0.0000 0.0000 0.0000
0.66 0.58 0.86 0.76 1.03 0.92 1.18 1.13 1.39 1.27 1.16 1.08 1.00 0.94 0.88 0.83 0.79 0.75 0.71 0.74 0.71
23.75 26.09 25.51 27.65 26.89 28.86 27.93 29.75 28.62 27.24 25.97 24.81 23.73 22.73 21.79 20.91 20.07 19.29 18.54 17.83 17.09
0.66 0.58 0.86 0.76 1.03 0.92 1.18 1.13 1.39 1.27 1.16 1.08 1.00 0.94 0.88 0.83 0.79 0.75 0.71 0.74 0.71
23.09 25.51 24.65 26.89 25.86 27.93 26.75 28.62 27.24 25.97 24.81 23.73 22.73 21.79 20.91 20.07 19.29 18.54 17.83 17.09 16.38
0.71 0.64 0.92 0.84 1.10 1.01 1.26 1.21 1.47 1.34 1.24 1.15 1.07 1.00 0.94 0.89 0.84 0.80 0.76 0.79 0.76
0.6564 0.5783 0.8603 0.7650 1.0324 0.9247 1.1813 1.1258 1.3876 1.2654 1.1636 1.0775 1.0034 0.9390 0.8825 0.8324 0.7877 0.7475 0.7112 0.7390 0.7062
0.3282 0.2891 0.4301 0.3825 0.5162 0.4624 0.5907 0.5629 0.6938 0.6327 0.5818 0.5387 0.5017 0.4695 0.4412 0.4162 0.3938 0.3738 0.3556 0.3695 0.3531
0.3282 0.2891 0.4301 0.3825 0.5162 0.4624 0.5907 0.5629 0.6938 0.6327 0.5818 0.5387 0.5017 0.4695 0.4412 0.4162 0.3938 0.3738 0.3556 0.3695 0.3531
0.0192 0.0173 0.0251 0.0227 0.0300 0.0273 0.0325 0.0313 0.0381 0.0348 0.0320 0.0297 0.0277 0.0259 0.0244 0.0230 0.0218 0.0207 0.0181 0.0188 0.0180
0.0192 0.0173 0.0251 0.0227 0.0300 0.0273 0.0325 0.0313 0.0381 0.0348 0.0320 0.0297 0.0277 0.0259 0.0244 0.0230 0.0218 0.0207 0.0181 0.0188 0.0180
0.98 ‐2.13 1.29 ‐1.85 1.55 ‐1.61 1.77 ‐1.31 2.08 1.90 1.75 1.62 1.51 1.41 1.32 1.25 1.18 1.12 1.07 1.11 1.06
0.85 ‐1.82 1.09 ‐1.56 1.29 ‐1.33 1.45 ‐1.07 1.68 1.52 1.39 1.27 1.18 1.09 1.02 0.95 0.89 0.84 0.80 0.82 0.78
‐2.08 ‐4.21 ‐2.92 ‐4.77 ‐3.22 ‐4.83 ‐3.06 ‐4.37 ‐2.29 ‐0.39 1.35 2.97 4.47 5.88 7.21 8.45 9.64 10.76 11.82 12.93 13.99
0.05 3.06 0.06 3.07 0.07 3.08 0.08 3.09 0.08 0.08 0.07 0.07 0.07 0.06 0.06 0.06 0.06 0.05 0.05 0.05 0.05
25.56 28.62 28.68 31.75 31.82 34.90 34.98 38.06 38.15 38.22 38.30 38.37 38.43 38.49 38.55 38.61 38.67 38.72 38.77 38.82 38.87
1.03 0.93 1.35 1.22 1.62 1.47 1.85 1.78 2.16 1.98 1.82 1.69 1.57 1.47 1.38 1.31 1.24 1.18 1.12 1.16 1.11
3.48 4.41 5.76 6.98 8.60 10.07 11.91 13.69 15.86 17.83 19.65 21.33 22.90 24.38 25.76 27.07 28.30 29.48 30.60 31.76 32.87
0 0 0 0 0 0 0 0 0 0 0 0 0 0 0 0 0 0 0 0 0
Producing Wells + Workovers + Lateral Jetting + Horizontal Wells, Mean Values
Page 2 of 6 5/14/201810:37 PM

Yr‐MoOil Volume
Existing ProductionWorkovers ‐ SI or BP
Workovers ‐ RDSUndeveloped
Number of Producing WellsExisting Production
SI WellsLateral JettingUndeveloped
Norio Oil ProductionDaily Production
Monthly Oil MMbblsNorio Revenue
Total ProductionTotal Project Revenue M$
WorkoversNew Wells
CAPEX TOTAL
Fixed Opex+OHFloating Opex
WorkoversTotal Norio Opex
OPEX TOTAL
Recoverable OpexContractor Opex Cost Oil
Unrecovered OpexCapex recovery LimitRecoverable Capex
Contractor Capex Cost OilUnrecovered Capex
Total Cost Oil
Total Profit OilContractor Profit Oil
Govt. Profit OilTotal Contrctr Cost and Profit Oil, MMBbl
Evaluated Net Oil, MMBbl
Cash FlowDCF @10%
Cumulative CF
Total Costs Incurred for Production, MM$Cumulative Total Costs, MM$
Cntrctr's Total Profit from Sales of Oil, MM$Cumulative Total Profit, MM$
Payout? 1=yes, 0=no
Norio
Profit Sh
are
Norio
CAPE
X
Brent Oil Price
Reve
nue
NORIO
Prod
uctio
n
Norio
Ope
x
Norio
Cost Recov
ery
Norio
Norio
Paym
ent
Date
Norio
Cash
Flow
Apr‐21 May‐21 Jun‐21 Jul‐21 Aug‐21 Sep‐21 Oct‐21 Nov‐21 Dec‐21 Jan‐22 Feb‐22 Mar‐22 Apr‐22 May‐22 Jun‐22 Jul‐22 Aug‐22 Sep‐22 Oct‐22 Nov‐22 Dec‐22
313 309 306 303 299 296 293 290 287 284 281 278 275 272 269 266 263 260 258 255 252
93 87 80 75 69 64 59 24 23 21 19 18 17 0 0 0 0 0 0 0 0
1,016 992 968 946 925 904 884 865 847 830 813 796 781 766 751 737 724 710 698 686 674
20,362 19,554 18,806 18,112 17,467 16,865 16,303 15,776 15,282 14,817 14,379 13,965 13,574 13,204 12,853 12,520 12,203 11,901 11,614 11,340 11,078
17 17 17 17 17 17 17 15 15 15 15 15 15 14 14 14 14 14 14 14 14
3 3 3 3 3 3 3 3 3 3 3 3 3 3 3 3 3 3 3 3 3
3 3 3 3 3 3 3 1 1 1 1 1 1 0 0 0 0 0 0 0 0
5 5 5 5 5 5 5 5 5 5 5 5 5 5 5 5 5 5 5 5 5
6 6 6 6 6 6 6 6 6 6 6 6 6 6 6 6 6 6 6 6 6
70.70 70.70 70.70 70.70 70.70 70.70 70.70 70.70 70.70 74.23 74.23 74.23 74.23 74.23 74.23 74.23 74.23 74.23 74.23 74.23 74.23
21,785 20,941 20,160 19,435 18,760 18,130 17,540 16,956 16,438 15,951 15,491 15,057 14,646 14,241 13,873 13,523 13,190 12,872 12,570 12,280 12,004
753 724 697 672 649 627 607 586 568 552 536 521 506 492 480 468 456 445 435 425 415
0.0218 0.0209 0.0202 0.0194 0.0188 0.0181 0.0175 0.0170 0.0164 0.0160 0.0155 0.0151 0.0146 0.0142 0.0139 0.0135 0.0132 0.0129 0.0126 0.0123 0.0120
1.40 1.34 1.29 1.24 1.20 1.16 1.12 1.08 1.05 1.01 1.04 1.01 0.98 0.96 0.93 0.90 0.88 0.86 0.84 0.82 0.80
21,785 20,941 20,160 19,435 18,760 18,130 17,540 16,956 16,438 15,951 15,491 15,057 14,646 14,241 13,873 13,523 13,190 12,872 12,570 12,280 12,004
1.40 1.34 1.29 1.24 1.20 1.16 1.12 1.08 1.05 1.01 1.04 1.01 0.98 0.96 0.93 0.90 0.88 0.86 0.84 0.82 0.80
0 0 0 0 0 0 0 0 0 0 0 0 0 0 0 0 0 0 0 0 0
0 0 0 0 0 0 0 0 0 0 0 0 0 0 0 0 0 0 0 0 0
0.00 0.00 0.00 0.00 0.00 0.00 0.00 0.00 0.00 0.00 0.00 0.00 0.00 0.00 0.00 0.00 0.00 0.00 0.00 0.00 0.00
0.017 0.017 0.017 0.017 0.017 0.017 0.017 0.017 0.017 0.017 0.017 0.017 0.017 0.017 0.017 0.017 0.017 0.017 0.017 0.017 0.017
0.03 0.03 0.03 0.03 0.03 0.03 0.03 0.02 0.02 0.02 0.02 0.02 0.02 0.02 0.02 0.02 0.02 0.02 0.02 0.02 0.02
0.00 0.00 0.00 0.00 0.00 0.00 0.00 0.00 0.00 0.00 0.00 0.00 0.00 0.00 0.00 0.00 0.00 0.00 0.00 0.00 0.00
0.05 0.05 0.05 0.04 0.04 0.04 0.04 0.04 0.04 0.04 0.04 0.04 0.04 0.04 0.04 0.04 0.04 0.04 0.04 0.03 0.03
0.05 0.05 0.05 0.04 0.04 0.04 0.04 0.04 0.04 0.04 0.04 0.04 0.04 0.04 0.04 0.04 0.04 0.04 0.04 0.03 0.03
0.0481 0.0469 0.0458 0.0448 0.0438 0.0430 0.0421 0.0413 0.0406 0.0400 0.0393 0.0387 0.0382 0.0376 0.0371 0.0366 0.0362 0.0358 0.0354 0.0350 0.0346
0.0481 0.0469 0.0458 0.0448 0.0438 0.0430 0.0421 0.0413 0.0406 0.0400 0.0393 0.0387 0.0382 0.0376 0.0371 0.0366 0.0362 0.0358 0.0354 0.0350 0.0346
0.0000 0.0000 0.0000 0.0000 0.0000 0.0000 0.0000 0.0000 0.0000 0.0000 0.0000 0.0000 0.0000 0.0000 0.0000 0.0000 0.0000 0.0000 0.0000 0.0000 0.0000
0.68 0.65 0.62 0.60 0.58 0.56 0.54 0.52 0.50 0.49 0.50 0.49 0.47 0.46 0.45 0.43 0.42 0.41 0.40 0.39 0.38
16.38 15.70 15.06 14.43 13.83 13.26 12.70 12.16 11.64 11.14 10.65 10.15 9.66 9.19 8.73 8.29 7.85 7.43 7.02 6.62 6.22
0.68 0.65 0.62 0.60 0.58 0.56 0.54 0.52 0.50 0.49 0.50 0.49 0.47 0.46 0.45 0.43 0.42 0.41 0.40 0.39 0.38
15.70 15.06 14.43 13.83 13.26 12.70 12.16 11.64 11.14 10.65 10.15 9.66 9.19 8.73 8.29 7.85 7.43 7.02 6.62 6.22 5.84
0.72 0.70 0.67 0.64 0.62 0.60 0.58 0.56 0.54 0.53 0.54 0.52 0.51 0.50 0.48 0.47 0.46 0.45 0.44 0.43 0.42
0.6762 0.6486 0.6231 0.5996 0.5777 0.5573 0.5382 0.5204 0.5028 0.4871 0.5006 0.4859 0.4720 0.4589 0.4459 0.4342 0.4230 0.4123 0.4022 0.3925 0.3832
0.3381 0.3243 0.3116 0.2998 0.2888 0.2786 0.2691 0.2082 0.2011 0.1949 0.2002 0.1944 0.1888 0.1836 0.1784 0.1737 0.1692 0.1649 0.1609 0.1570 0.1533
0.3381 0.3243 0.3116 0.2998 0.2888 0.2786 0.2691 0.3123 0.3017 0.2923 0.3004 0.2915 0.2832 0.2753 0.2676 0.2605 0.2538 0.2474 0.2413 0.2355 0.2299
0.0172 0.0165 0.0159 0.0153 0.0148 0.0142 0.0138 0.0125 0.0121 0.0111 0.0113 0.0110 0.0107 0.0104 0.0101 0.0099 0.0096 0.0094 0.0092 0.0090 0.0088
0.0172 0.0165 0.0159 0.0153 0.0148 0.0142 0.0138 0.0125 0.0121 0.0111 0.0113 0.0110 0.0107 0.0104 0.0101 0.0099 0.0096 0.0094 0.0092 0.0090 0.0088
1.01 0.97 0.93 0.90 0.87 0.84 0.81 0.73 0.70 0.68 0.70 0.68 0.66 0.64 0.62 0.61 0.59 0.58 0.56 0.55 0.54
0.74 0.70 0.67 0.64 0.61 0.58 0.56 0.50 0.48 0.46 0.47 0.45 0.44 0.42 0.41 0.39 0.38 0.37 0.36 0.34 0.33
15.01 15.98 16.91 17.81 18.68 19.51 20.32 21.05 21.75 22.44 23.14 23.82 24.48 25.12 25.75 26.35 26.95 27.52 28.09 28.64 29.17
0.05 0.05 0.05 0.04 0.04 0.04 0.04 0.04 0.04 0.04 0.04 0.04 0.04 0.04 0.04 0.04 0.04 0.04 0.04 0.03 0.03
38.92 38.97 39.01 39.06 39.10 39.15 39.19 39.23 39.27 39.31 39.35 39.39 39.43 39.46 39.50 39.54 39.57 39.61 39.65 39.68 39.71
1.06 1.02 0.98 0.94 0.91 0.88 0.85 0.77 0.74 0.72 0.74 0.72 0.70 0.68 0.66 0.64 0.63 0.61 0.60 0.58 0.57
33.93 34.95 35.93 36.87 37.78 38.66 39.51 40.28 41.02 41.75 42.49 43.21 43.91 44.59 45.25 45.89 46.52 47.13 47.73 48.32 48.89
0 0 0 0 0 0 0 1 1 1 1 1 1 1 1 1 1 1 1 1 1
Nov-21 Nov-21 Nov-21 Nov-21 Nov-21 Nov-21 Nov-21 Nov-21 Nov-21 Nov-21 Nov-21 Nov-21 Nov-21 Nov-21Producing Wells + Workovers + Lateral Jetting + Horizontal Wells, Mean Values
Page 3 of 6 5/14/201810:37 PM

Yr‐MoOil Volume
Existing ProductionWorkovers ‐ SI or BP
Workovers ‐ RDSUndeveloped
Number of Producing WellsExisting Production
SI WellsLateral JettingUndeveloped
Norio Oil ProductionDaily Production
Monthly Oil MMbblsNorio Revenue
Total ProductionTotal Project Revenue M$
WorkoversNew Wells
CAPEX TOTAL
Fixed Opex+OHFloating Opex
WorkoversTotal Norio Opex
OPEX TOTAL
Recoverable OpexContractor Opex Cost Oil
Unrecovered OpexCapex recovery LimitRecoverable Capex
Contractor Capex Cost OilUnrecovered Capex
Total Cost Oil
Total Profit OilContractor Profit Oil
Govt. Profit OilTotal Contrctr Cost and Profit Oil, MMBbl
Evaluated Net Oil, MMBbl
Cash FlowDCF @10%
Cumulative CF
Total Costs Incurred for Production, MM$Cumulative Total Costs, MM$
Cntrctr's Total Profit from Sales of Oil, MM$Cumulative Total Profit, MM$
Payout? 1=yes, 0=no
Norio
Profit Sh
are
Norio
CAPE
X
Brent Oil Price
Reve
nue
NORIO
Prod
uctio
n
Norio
Ope
x
Norio
Cost Recov
ery
Norio
Norio
Paym
ent
Date
Norio
Cash
Flow
Jan‐23 Feb‐23 Mar‐23 Apr‐23 May‐23 Jun‐23 Jul‐23 Aug‐23 Sep‐23 Oct‐23 Nov‐23 Dec‐23 Jan‐24 Feb‐24 Mar‐24 Apr‐24 May‐24 Jun‐24 Jul‐24 Aug‐24
250 247 244 242 239 237 234 232 230 227 225 222 220 218 216 213 211 209 207 205
0 0 0 0 0 0 0 0 0 0 0 0 0 0 0 0 0 0 0 0
662 651 640 630 620 610 600 591 582 573 565 556 548 540 533 525 518 511 504 497
10,828 10,588 10,359 10,139 9,928 9,725 9,531 9,343 9,163 8,989 8,822 8,660 8,505 8,354 8,209 8,068 7,932 7,801 7,674 7,550
14 14 14 14 14 14 14 14 14 14 14 14 14 14 14 14 14 14 14 14
3 3 3 3 3 3 3 3 3 3 3 3 3 3 3 3 3 3 3 3
0 0 0 0 0 0 0 0 0 0 0 0 0 0 0 0 0 0 0 0
5 5 5 5 5 5 5 5 5 5 5 5 5 5 5 5 5 5 5 5
6 6 6 6 6 6 6 6 6 6 6 6 6 6 6 6 6 6 6 6
75.21 75.21 75.21 75.21 75.21 75.21 75.21 75.21 75.21 75.21 75.21 75.21 76.23 76.23 76.23 76.23 76.23 76.23 76.23 76.23
11,740 11,486 11,244 11,011 10,787 10,572 10,365 10,166 9,974 9,789 9,611 9,439 9,273 9,112 8,957 8,807 8,662 8,521 8,384 8,252
406 397 389 381 373 366 358 352 345 339 332 326 321 315 310 305 300 295 290 285
0.0117 0.0115 0.0112 0.0110 0.0108 0.0106 0.0104 0.0102 0.0100 0.0098 0.0096 0.0094 0.0093 0.0091 0.0090 0.0088 0.0087 0.0085 0.0084 0.0083
0.78 0.78 0.76 0.74 0.73 0.71 0.70 0.69 0.67 0.66 0.65 0.64 0.62 0.62 0.61 0.60 0.59 0.58 0.57 0.56
11,740 11,486 11,244 11,011 10,787 10,572 10,365 10,166 9,974 9,789 9,611 9,439 9,273 9,112 8,957 8,807 8,662 8,521 8,384 8,252
0.78 0.78 0.76 0.74 0.73 0.71 0.70 0.69 0.67 0.66 0.65 0.64 0.62 0.62 0.61 0.60 0.59 0.58 0.57 0.56
0 0 0 0 0 0 0 0 0 0 0 0 0 0 0 0 0 0 0 0
0 0 0 0 0 0 0 0 0 0 0 0 0 0 0 0 0 0 0 0
0.00 0.00 0.00 0.00 0.00 0.00 0.00 0.00 0.00 0.00 0.00 0.00 0.00 0.00 0.00 0.00 0.00 0.00 0.00 0.00
0.017 0.017 0.018 0.018 0.018 0.018 0.018 0.018 0.018 0.018 0.018 0.018 0.018 0.018 0.018 0.018 0.018 0.018 0.018 0.018
0.02 0.02 0.02 0.02 0.02 0.02 0.01 0.01 0.01 0.01 0.01 0.01 0.01 0.01 0.01 0.01 0.01 0.01 0.01 0.01
0.00 0.00 0.00 0.00 0.00 0.00 0.00 0.00 0.00 0.00 0.00 0.00 0.00 0.00 0.00 0.00 0.00 0.00 0.00 0.00
0.03 0.03 0.03 0.03 0.03 0.03 0.03 0.03 0.03 0.03 0.03 0.03 0.03 0.03 0.03 0.03 0.03 0.03 0.03 0.03
0.03 0.03 0.03 0.03 0.03 0.03 0.03 0.03 0.03 0.03 0.03 0.03 0.03 0.03 0.03 0.03 0.03 0.03 0.03 0.03
0.0343 0.0339 0.0336 0.0333 0.0330 0.0327 0.0325 0.0322 0.0320 0.0317 0.0315 0.0313 0.0311 0.0309 0.0307 0.0305 0.0303 0.0302 0.0300 0.0298
0.0343 0.0339 0.0336 0.0333 0.0330 0.0327 0.0325 0.0322 0.0320 0.0317 0.0315 0.0313 0.0311 0.0309 0.0307 0.0305 0.0303 0.0302 0.0300 0.0298
0.0000 0.0000 0.0000 0.0000 0.0000 0.0000 0.0000 0.0000 0.0000 0.0000 0.0000 0.0000 0.0000 0.0000 0.0000 0.0000 0.0000 0.0000 0.0000 0.0000
0.37 0.37 0.36 0.36 0.35 0.34 0.33 0.33 0.32 0.31 0.31 0.30 0.30 0.30 0.29 0.29 0.28 0.28 0.27 0.27
5.84 5.47 5.09 4.73 4.37 4.03 3.69 3.35 3.02 2.70 2.39 2.08 1.78 1.48 1.19 0.89 0.61 0.33 0.05 0.00
0.37 0.37 0.36 0.36 0.35 0.34 0.33 0.33 0.32 0.31 0.31 0.30 0.30 0.30 0.29 0.29 0.28 0.28 0.05 0.00
5.47 5.09 4.73 4.37 4.03 3.69 3.35 3.02 2.70 2.39 2.08 1.78 1.48 1.19 0.89 0.61 0.33 0.05 0.00 0.00
0.41 0.41 0.40 0.39 0.38 0.37 0.37 0.36 0.35 0.35 0.34 0.33 0.33 0.33 0.32 0.32 0.31 0.31 0.08 0.03
0.3744 0.3717 0.3634 0.3556 0.3480 0.3407 0.3337 0.3270 0.3206 0.3143 0.3083 0.3025 0.2969 0.2963 0.2910 0.2858 0.2809 0.2761 0.4907 0.5339
0.1498 0.1487 0.1454 0.1422 0.1392 0.1363 0.1335 0.1308 0.1282 0.1257 0.1233 0.1210 0.1188 0.1185 0.1164 0.1143 0.1124 0.1104 0.1963 0.2135
0.2246 0.2230 0.2181 0.2133 0.2088 0.2044 0.2002 0.1962 0.1923 0.1886 0.1850 0.1815 0.1782 0.1778 0.1746 0.1715 0.1685 0.1657 0.2944 0.3203
0.0084 0.0084 0.0082 0.0080 0.0079 0.0077 0.0075 0.0074 0.0073 0.0071 0.0070 0.0069 0.0066 0.0066 0.0065 0.0064 0.0063 0.0062 0.0041 0.0036
0.0084 0.0084 0.0082 0.0080 0.0079 0.0077 0.0075 0.0074 0.0073 0.0071 0.0070 0.0069 0.0066 0.0066 0.0065 0.0064 0.0063 0.0062 0.0041 0.0036
0.52 0.52 0.51 0.50 0.49 0.48 0.47 0.46 0.45 0.44 0.43 0.42 0.42 0.41 0.41 0.40 0.39 0.39 0.25 0.21
0.32 0.32 0.31 0.30 0.29 0.28 0.27 0.27 0.26 0.25 0.25 0.24 0.23 0.23 0.22 0.22 0.21 0.21 0.13 0.11
29.70 30.22 30.72 31.22 31.71 32.19 32.65 33.11 33.56 34.00 34.43 34.86 35.27 35.69 36.09 36.49 36.89 37.27 37.52 37.74
0.03 0.03 0.03 0.03 0.03 0.03 0.03 0.03 0.03 0.03 0.03 0.03 0.03 0.03 0.03 0.03 0.03 0.03 0.03 0.03
39.75 39.78 39.82 39.85 39.88 39.92 39.95 39.98 40.01 40.04 40.08 40.11 40.14 40.17 40.20 40.23 40.26 40.29 40.32 40.35
0.56 0.55 0.54 0.53 0.52 0.51 0.50 0.49 0.48 0.47 0.46 0.45 0.45 0.45 0.44 0.43 0.42 0.42 0.28 0.24
49.44 50.00 50.54 51.07 51.59 52.10 52.60 53.09 53.57 54.05 54.51 54.96 55.41 55.86 56.29 56.72 57.15 57.56 57.84 58.09
1 1 1 1 1 1 1 1 1 1 1 1 1 1 1 1 1 1 1 1
Nov-21 Nov-21 Nov-21 Nov-21 Nov-21 Nov-21 Nov-21 Nov-21 Nov-21 Nov-21 Nov-21 Nov-21 Nov-21 Nov-21 Nov-21 Nov-21 Nov-21 Nov-21 Nov-21 Nov-21s Producing Wells + Workovers + Lateral Jetting + Hori
Page 4 of 6 5/14/201810:37 PM

Yr‐MoOil Volume
Existing ProductionWorkovers ‐ SI or BP
Workovers ‐ RDSUndeveloped
Number of Producing WellsExisting Production
SI WellsLateral JettingUndeveloped
Norio Oil ProductionDaily Production
Monthly Oil MMbblsNorio Revenue
Total ProductionTotal Project Revenue M$
WorkoversNew Wells
CAPEX TOTAL
Fixed Opex+OHFloating Opex
WorkoversTotal Norio Opex
OPEX TOTAL
Recoverable OpexContractor Opex Cost Oil
Unrecovered OpexCapex recovery LimitRecoverable Capex
Contractor Capex Cost OilUnrecovered Capex
Total Cost Oil
Total Profit OilContractor Profit Oil
Govt. Profit OilTotal Contrctr Cost and Profit Oil, MMBbl
Evaluated Net Oil, MMBbl
Cash FlowDCF @10%
Cumulative CF
Total Costs Incurred for Production, MM$Cumulative Total Costs, MM$
Cntrctr's Total Profit from Sales of Oil, MM$Cumulative Total Profit, MM$
Payout? 1=yes, 0=no
Norio
Profit Sh
are
Norio
CAPE
X
Brent Oil Price
Reve
nue
NORIO
Prod
uctio
n
Norio
Ope
x
Norio
Cost Recov
ery
Norio
Norio
Paym
ent
Date
Norio
Cash
Flow
Sep‐24 Oct‐24 Nov‐24 Dec‐24 Jan‐25 Feb‐25 Mar‐25 Apr‐25 May‐25 Jun‐25 Jul‐25 Aug‐25 Sep‐25 Oct‐25 Nov‐25 Dec‐25 Jan‐26 Feb‐26 Mar‐26 Apr‐26
203 201 199 197 195 193 191 189 187 185 183 181 180 178 176 174 173 171 169 168
0 0 0 0 0 0 0 0 0 0 0 0 0 0 0 0 0 0 0 0
491 484 478 472 466 460 454 449 443 438 433 428 423 418 413 408 404 399 395 391
7,431 7,315 7,202 7,093 6,987 6,884 6,784 6,686 6,592 6,500 6,410 6,323 6,238 6,155 6,074 5,996 5,919 5,844 5,771 5,700
14 14 14 14 14 14 14 14 14 14 14 14 14 14 14 14 14 14 14 14
3 3 3 3 3 3 3 3 3 3 3 3 3 3 3 3 3 3 3 3
0 0 0 0 0 0 0 0 0 0 0 0 0 0 0 0 0 0 0 0
5 5 5 5 5 5 5 5 5 5 5 5 5 5 5 5 5 5 5 5
6 6 6 6 6 6 6 6 6 6 6 6 6 6 6 6 6 6 6 6
76.23 76.23 76.23 76.23 77.26 77.26 77.26 77.26 77.26 77.26 77.26 77.26 77.26 77.26 77.26 77.26 78.37 78.37 78.37 78.37
8,124 8,000 7,879 7,761 7,647 7,537 7,429 7,324 7,222 7,123 7,026 6,932 6,840 6,751 6,664 6,579 6,496 6,415 6,335 6,258
281 277 272 268 264 261 257 253 250 246 243 240 237 233 230 228 225 222 219 216
0.0081 0.0080 0.0079 0.0078 0.0076 0.0075 0.0074 0.0073 0.0072 0.0071 0.0070 0.0069 0.0068 0.0068 0.0067 0.0066 0.0065 0.0064 0.0063 0.0063
0.55 0.55 0.54 0.53 0.52 0.52 0.51 0.51 0.50 0.49 0.49 0.48 0.47 0.47 0.46 0.45 0.45 0.45 0.44 0.44
8,124 8,000 7,879 7,761 7,647 7,537 7,429 7,324 7,222 7,123 7,026 6,932 6,840 6,751 6,664 6,579 6,496 6,415 6,335 6,258
0.55 0.55 0.54 0.53 0.52 0.52 0.51 0.51 0.50 0.49 0.49 0.48 0.47 0.47 0.46 0.45 0.45 0.45 0.44 0.44
0 0 0 0 0 0 0 0 0 0 0 0 0 0 0 0 0 0 0 0
0 0 0 0 0 0 0 0 0 0 0 0 0 0 0 0 0 0 0 0
0.00 0.00 0.00 0.00 0.00 0.00 0.00 0.00 0.00 0.00 0.00 0.00 0.00 0.00 0.00 0.00 0.00 0.00 0.00 0.00
0.018 0.018 0.018 0.018 0.018 0.018 0.018 0.018 0.018 0.018 0.018 0.018 0.018 0.018 0.018 0.018 0.019 0.019 0.019 0.019
0.01 0.01 0.01 0.01 0.01 0.01 0.01 0.01 0.01 0.01 0.01 0.01 0.01 0.01 0.01 0.01 0.01 0.01 0.01 0.01
0.00 0.00 0.00 0.00 0.00 0.00 0.00 0.00 0.00 0.00 0.00 0.00 0.00 0.00 0.00 0.00 0.00 0.00 0.00 0.00
0.03 0.03 0.03 0.03 0.03 0.03 0.03 0.03 0.03 0.03 0.03 0.03 0.03 0.03 0.03 0.03 0.03 0.03 0.03 0.03
0.03 0.03 0.03 0.03 0.03 0.03 0.03 0.03 0.03 0.03 0.03 0.03 0.03 0.03 0.03 0.03 0.03 0.03 0.03 0.03
0.0297 0.0295 0.0294 0.0292 0.0291 0.0290 0.0289 0.0287 0.0286 0.0285 0.0284 0.0283 0.0282 0.0281 0.0280 0.0279 0.0278 0.0277 0.0277 0.0276
0.0297 0.0295 0.0294 0.0292 0.0291 0.0290 0.0289 0.0287 0.0286 0.0285 0.0284 0.0283 0.0282 0.0281 0.0280 0.0279 0.0278 0.0277 0.0277 0.0276
0.0000 0.0000 0.0000 0.0000 0.0000 0.0000 0.0000 0.0000 0.0000 0.0000 0.0000 0.0000 0.0000 0.0000 0.0000 0.0000 0.0000 0.0000 0.0000 0.0000
0.26 0.26 0.25 0.25 0.25 0.25 0.24 0.24 0.24 0.23 0.23 0.23 0.22 0.22 0.22 0.21 0.21 0.21 0.21 0.21
0.00 0.00 0.00 0.00 0.00 0.00 0.00 0.00 0.00 0.00 0.00 0.00 0.00 0.00 0.00 0.00 0.00 0.00 0.00 0.00
0.00 0.00 0.00 0.00 0.00 0.00 0.00 0.00 0.00 0.00 0.00 0.00 0.00 0.00 0.00 0.00 0.00 0.00 0.00 0.00
0.00 0.00 0.00 0.00 0.00 0.00 0.00 0.00 0.00 0.00 0.00 0.00 0.00 0.00 0.00 0.00 0.00 0.00 0.00 0.00
0.03 0.03 0.03 0.03 0.03 0.03 0.03 0.03 0.03 0.03 0.03 0.03 0.03 0.03 0.03 0.03 0.03 0.03 0.03 0.03
0.5251 0.5166 0.5084 0.5004 0.4927 0.4930 0.4856 0.4784 0.4713 0.4645 0.4578 0.4513 0.4450 0.4388 0.4328 0.4269 0.4212 0.4228 0.4173 0.4119
0.2100 0.2067 0.2034 0.2002 0.1971 0.1972 0.1942 0.1913 0.1885 0.1858 0.1831 0.1805 0.1780 0.1755 0.1731 0.1708 0.1685 0.1691 0.1669 0.1648
0.3151 0.3100 0.3051 0.3003 0.2956 0.2958 0.2914 0.2870 0.2828 0.2787 0.2747 0.2708 0.2670 0.2633 0.2597 0.2562 0.2527 0.2537 0.2504 0.2471
0.0036 0.0035 0.0035 0.0034 0.0033 0.0033 0.0033 0.0032 0.0032 0.0031 0.0031 0.0031 0.0030 0.0030 0.0029 0.0029 0.0028 0.0028 0.0028 0.0028
0.0036 0.0035 0.0035 0.0034 0.0033 0.0033 0.0033 0.0032 0.0032 0.0031 0.0031 0.0031 0.0030 0.0030 0.0029 0.0029 0.0028 0.0028 0.0028 0.0028
0.21 0.21 0.20 0.20 0.20 0.20 0.19 0.19 0.19 0.19 0.18 0.18 0.18 0.18 0.17 0.17 0.17 0.17 0.17 0.16
0.11 0.11 0.11 0.10 0.10 0.10 0.10 0.10 0.09 0.09 0.09 0.09 0.09 0.08 0.08 0.08 0.08 0.08 0.08 0.07
37.95 38.15 38.36 38.56 38.75 38.95 39.14 39.34 39.52 39.71 39.89 40.07 40.25 40.43 40.60 40.77 40.94 41.11 41.28 41.44
0.03 0.03 0.03 0.03 0.03 0.03 0.03 0.03 0.03 0.03 0.03 0.03 0.03 0.03 0.03 0.03 0.03 0.03 0.03 0.03
40.38 40.41 40.44 40.47 40.50 40.53 40.56 40.58 40.61 40.64 40.67 40.70 40.73 40.75 40.78 40.81 40.84 40.87 40.89 40.92
0.24 0.24 0.23 0.23 0.23 0.23 0.22 0.22 0.22 0.21 0.21 0.21 0.21 0.20 0.20 0.20 0.20 0.20 0.19 0.19
58.33 58.56 58.80 59.02 59.25 59.48 59.70 59.92 60.14 60.35 60.56 60.77 60.98 61.18 61.38 61.58 61.78 61.97 62.17 62.36
1 1 1 1 1 1 1 1 1 1 1 1 1 1 1 1 1 1 1 1
Nov-21 Nov-21 Nov-21 Nov-21 ##### Nov-21 Nov-21 Nov-21 Nov-21 Nov-21 Nov-21 Nov-21 Nov-21 Nov-21 Nov-21 Nov-21 Nov-21 Nov-21 Nov-21 Nov-21zontal Wells, Mean Values Producing Wells + Workov
Page 5 of 6 5/14/201810:37 PM
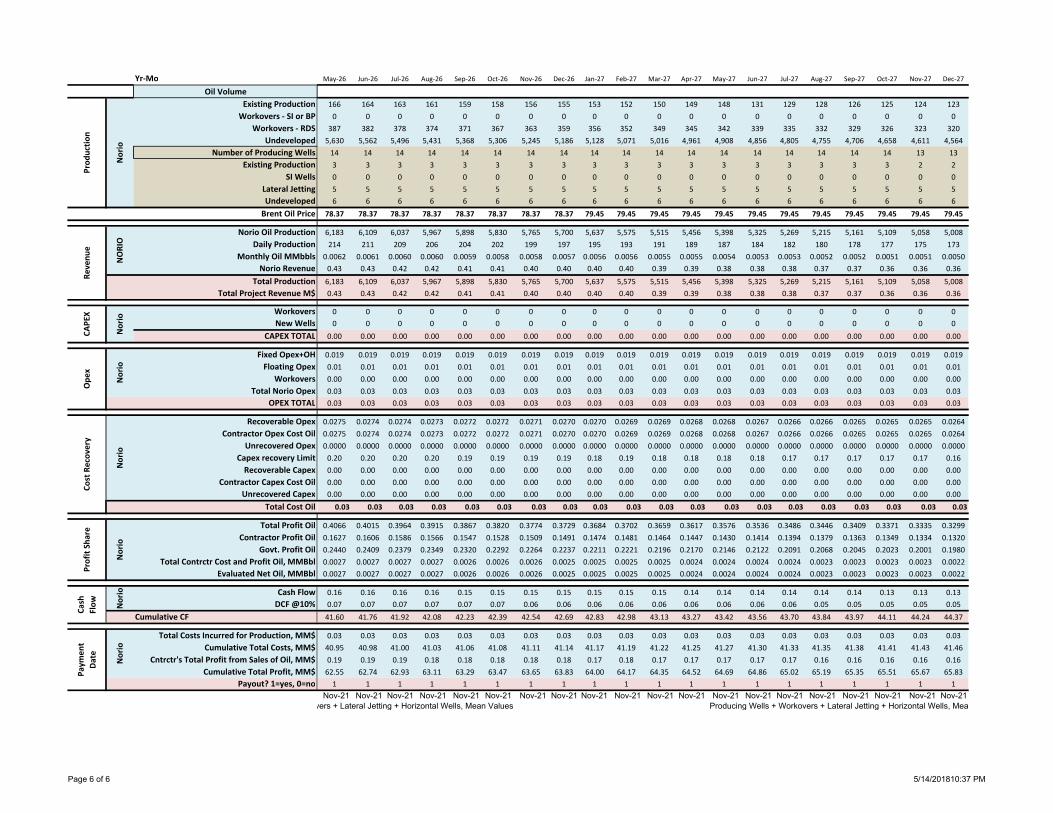
Yr‐MoOil Volume
Existing ProductionWorkovers ‐ SI or BP
Workovers ‐ RDSUndeveloped
Number of Producing WellsExisting Production
SI WellsLateral JettingUndeveloped
Norio Oil ProductionDaily Production
Monthly Oil MMbblsNorio Revenue
Total ProductionTotal Project Revenue M$
WorkoversNew Wells
CAPEX TOTAL
Fixed Opex+OHFloating Opex
WorkoversTotal Norio Opex
OPEX TOTAL
Recoverable OpexContractor Opex Cost Oil
Unrecovered OpexCapex recovery LimitRecoverable Capex
Contractor Capex Cost OilUnrecovered Capex
Total Cost Oil
Total Profit OilContractor Profit Oil
Govt. Profit OilTotal Contrctr Cost and Profit Oil, MMBbl
Evaluated Net Oil, MMBbl
Cash FlowDCF @10%
Cumulative CF
Total Costs Incurred for Production, MM$Cumulative Total Costs, MM$
Cntrctr's Total Profit from Sales of Oil, MM$Cumulative Total Profit, MM$
Payout? 1=yes, 0=no
Norio
Profit Sh
are
Norio
CAPE
X
Brent Oil Price
Reve
nue
NORIO
Prod
uctio
n
Norio
Ope
x
Norio
Cost Recov
ery
Norio
Norio
Paym
ent
Date
Norio
Cash
Flow
May‐26 Jun‐26 Jul‐26 Aug‐26 Sep‐26 Oct‐26 Nov‐26 Dec‐26 Jan‐27 Feb‐27 Mar‐27 Apr‐27 May‐27 Jun‐27 Jul‐27 Aug‐27 Sep‐27 Oct‐27 Nov‐27 Dec‐27
166 164 163 161 159 158 156 155 153 152 150 149 148 131 129 128 126 125 124 123
0 0 0 0 0 0 0 0 0 0 0 0 0 0 0 0 0 0 0 0
387 382 378 374 371 367 363 359 356 352 349 345 342 339 335 332 329 326 323 320
5,630 5,562 5,496 5,431 5,368 5,306 5,245 5,186 5,128 5,071 5,016 4,961 4,908 4,856 4,805 4,755 4,706 4,658 4,611 4,564
14 14 14 14 14 14 14 14 14 14 14 14 14 14 14 14 14 14 13 13
3 3 3 3 3 3 3 3 3 3 3 3 3 3 3 3 3 3 2 2
0 0 0 0 0 0 0 0 0 0 0 0 0 0 0 0 0 0 0 0
5 5 5 5 5 5 5 5 5 5 5 5 5 5 5 5 5 5 5 5
6 6 6 6 6 6 6 6 6 6 6 6 6 6 6 6 6 6 6 6
78.37 78.37 78.37 78.37 78.37 78.37 78.37 78.37 79.45 79.45 79.45 79.45 79.45 79.45 79.45 79.45 79.45 79.45 79.45 79.45
6,183 6,109 6,037 5,967 5,898 5,830 5,765 5,700 5,637 5,575 5,515 5,456 5,398 5,325 5,269 5,215 5,161 5,109 5,058 5,008
214 211 209 206 204 202 199 197 195 193 191 189 187 184 182 180 178 177 175 173
0.0062 0.0061 0.0060 0.0060 0.0059 0.0058 0.0058 0.0057 0.0056 0.0056 0.0055 0.0055 0.0054 0.0053 0.0053 0.0052 0.0052 0.0051 0.0051 0.0050
0.43 0.43 0.42 0.42 0.41 0.41 0.40 0.40 0.40 0.40 0.39 0.39 0.38 0.38 0.38 0.37 0.37 0.36 0.36 0.36
6,183 6,109 6,037 5,967 5,898 5,830 5,765 5,700 5,637 5,575 5,515 5,456 5,398 5,325 5,269 5,215 5,161 5,109 5,058 5,008
0.43 0.43 0.42 0.42 0.41 0.41 0.40 0.40 0.40 0.40 0.39 0.39 0.38 0.38 0.38 0.37 0.37 0.36 0.36 0.36
0 0 0 0 0 0 0 0 0 0 0 0 0 0 0 0 0 0 0 0
0 0 0 0 0 0 0 0 0 0 0 0 0 0 0 0 0 0 0 0
0.00 0.00 0.00 0.00 0.00 0.00 0.00 0.00 0.00 0.00 0.00 0.00 0.00 0.00 0.00 0.00 0.00 0.00 0.00 0.00
0.019 0.019 0.019 0.019 0.019 0.019 0.019 0.019 0.019 0.019 0.019 0.019 0.019 0.019 0.019 0.019 0.019 0.019 0.019 0.019
0.01 0.01 0.01 0.01 0.01 0.01 0.01 0.01 0.01 0.01 0.01 0.01 0.01 0.01 0.01 0.01 0.01 0.01 0.01 0.01
0.00 0.00 0.00 0.00 0.00 0.00 0.00 0.00 0.00 0.00 0.00 0.00 0.00 0.00 0.00 0.00 0.00 0.00 0.00 0.00
0.03 0.03 0.03 0.03 0.03 0.03 0.03 0.03 0.03 0.03 0.03 0.03 0.03 0.03 0.03 0.03 0.03 0.03 0.03 0.03
0.03 0.03 0.03 0.03 0.03 0.03 0.03 0.03 0.03 0.03 0.03 0.03 0.03 0.03 0.03 0.03 0.03 0.03 0.03 0.03
0.0275 0.0274 0.0274 0.0273 0.0272 0.0272 0.0271 0.0270 0.0270 0.0269 0.0269 0.0268 0.0268 0.0267 0.0266 0.0266 0.0265 0.0265 0.0265 0.0264
0.0275 0.0274 0.0274 0.0273 0.0272 0.0272 0.0271 0.0270 0.0270 0.0269 0.0269 0.0268 0.0268 0.0267 0.0266 0.0266 0.0265 0.0265 0.0265 0.0264
0.0000 0.0000 0.0000 0.0000 0.0000 0.0000 0.0000 0.0000 0.0000 0.0000 0.0000 0.0000 0.0000 0.0000 0.0000 0.0000 0.0000 0.0000 0.0000 0.0000
0.20 0.20 0.20 0.20 0.19 0.19 0.19 0.19 0.18 0.19 0.18 0.18 0.18 0.18 0.17 0.17 0.17 0.17 0.17 0.16
0.00 0.00 0.00 0.00 0.00 0.00 0.00 0.00 0.00 0.00 0.00 0.00 0.00 0.00 0.00 0.00 0.00 0.00 0.00 0.00
0.00 0.00 0.00 0.00 0.00 0.00 0.00 0.00 0.00 0.00 0.00 0.00 0.00 0.00 0.00 0.00 0.00 0.00 0.00 0.00
0.00 0.00 0.00 0.00 0.00 0.00 0.00 0.00 0.00 0.00 0.00 0.00 0.00 0.00 0.00 0.00 0.00 0.00 0.00 0.00
0.03 0.03 0.03 0.03 0.03 0.03 0.03 0.03 0.03 0.03 0.03 0.03 0.03 0.03 0.03 0.03 0.03 0.03 0.03 0.03
0.4066 0.4015 0.3964 0.3915 0.3867 0.3820 0.3774 0.3729 0.3684 0.3702 0.3659 0.3617 0.3576 0.3536 0.3486 0.3446 0.3409 0.3371 0.3335 0.3299
0.1627 0.1606 0.1586 0.1566 0.1547 0.1528 0.1509 0.1491 0.1474 0.1481 0.1464 0.1447 0.1430 0.1414 0.1394 0.1379 0.1363 0.1349 0.1334 0.1320
0.2440 0.2409 0.2379 0.2349 0.2320 0.2292 0.2264 0.2237 0.2211 0.2221 0.2196 0.2170 0.2146 0.2122 0.2091 0.2068 0.2045 0.2023 0.2001 0.1980
0.0027 0.0027 0.0027 0.0027 0.0026 0.0026 0.0026 0.0025 0.0025 0.0025 0.0025 0.0024 0.0024 0.0024 0.0024 0.0023 0.0023 0.0023 0.0023 0.0022
0.0027 0.0027 0.0027 0.0027 0.0026 0.0026 0.0026 0.0025 0.0025 0.0025 0.0025 0.0024 0.0024 0.0024 0.0024 0.0023 0.0023 0.0023 0.0023 0.0022
0.16 0.16 0.16 0.16 0.15 0.15 0.15 0.15 0.15 0.15 0.15 0.14 0.14 0.14 0.14 0.14 0.14 0.13 0.13 0.13
0.07 0.07 0.07 0.07 0.07 0.07 0.06 0.06 0.06 0.06 0.06 0.06 0.06 0.06 0.06 0.05 0.05 0.05 0.05 0.05
41.60 41.76 41.92 42.08 42.23 42.39 42.54 42.69 42.83 42.98 43.13 43.27 43.42 43.56 43.70 43.84 43.97 44.11 44.24 44.37
0.03 0.03 0.03 0.03 0.03 0.03 0.03 0.03 0.03 0.03 0.03 0.03 0.03 0.03 0.03 0.03 0.03 0.03 0.03 0.03
40.95 40.98 41.00 41.03 41.06 41.08 41.11 41.14 41.17 41.19 41.22 41.25 41.27 41.30 41.33 41.35 41.38 41.41 41.43 41.46
0.19 0.19 0.19 0.18 0.18 0.18 0.18 0.18 0.17 0.18 0.17 0.17 0.17 0.17 0.17 0.16 0.16 0.16 0.16 0.16
62.55 62.74 62.93 63.11 63.29 63.47 63.65 63.83 64.00 64.17 64.35 64.52 64.69 64.86 65.02 65.19 65.35 65.51 65.67 65.83
1 1 1 1 1 1 1 1 1 1 1 1 1 1 1 1 1 1 1 1
Nov-21 Nov-21 Nov-21 Nov-21 Nov-21 Nov-21 Nov-21 Nov-21 Nov-21 Nov-21 Nov-21 Nov-21 Nov-21 Nov-21 Nov-21 Nov-21 Nov-21 Nov-21 Nov-21 Nov-21vers + Lateral Jetting + Horizontal Wells, Mean Values Producing Wells + Workovers + Lateral Jetting + Horizontal Wells, Mea
Page 6 of 6 5/14/201810:37 PM

SATSKHENISI
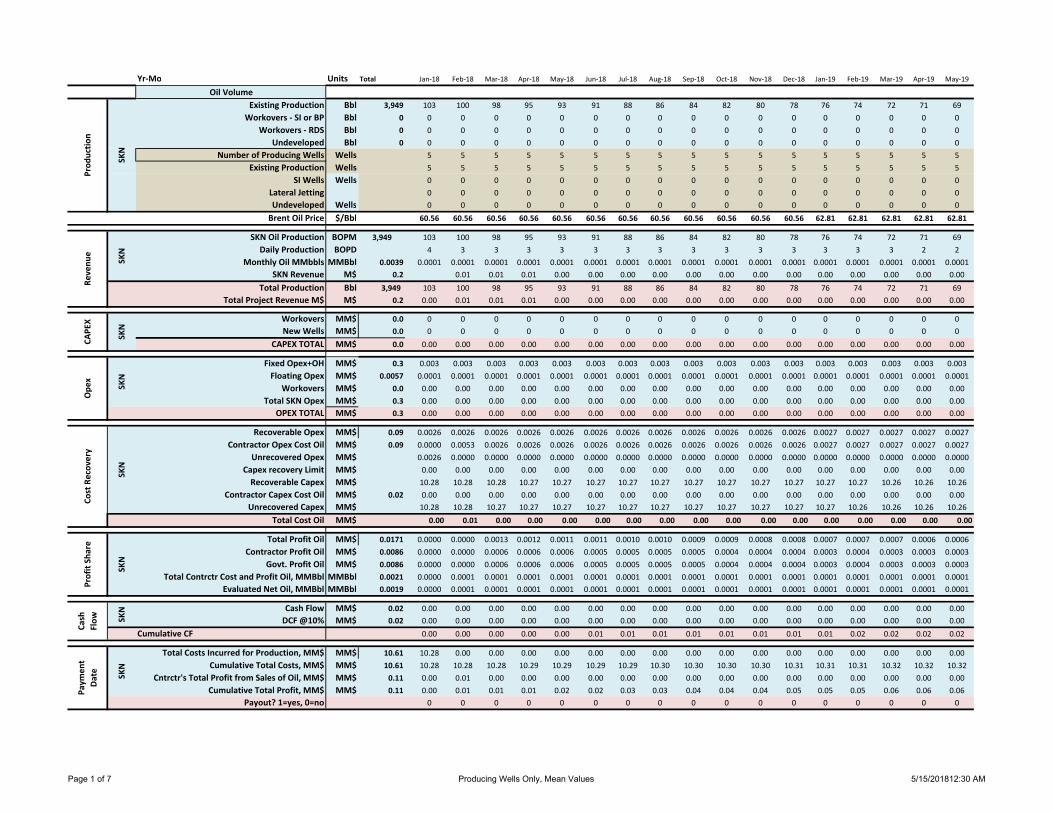
Yr‐Mo Units Total Jan‐18 Feb‐18 Mar‐18 Apr‐18 May‐18 Jun‐18 Jul‐18 Aug‐18 Sep‐18 Oct‐18 Nov‐18 Dec‐18 Jan‐19 Feb‐19 Mar‐19 Apr‐19 May‐19
Oil VolumeExisting Production Bbl 3,949 103 100 98 95 93 91 88 86 84 82 80 78 76 74 72 71 69
Workovers ‐ SI or BP Bbl 0 0 0 0 0 0 0 0 0 0 0 0 0 0 0 0 0 0
Workovers ‐ RDS Bbl 0 0 0 0 0 0 0 0 0 0 0 0 0 0 0 0 0 0
Undeveloped Bbl 0 0 0 0 0 0 0 0 0 0 0 0 0 0 0 0 0 0
Number of Producing Wells Wells 5 5 5 5 5 5 5 5 5 5 5 5 5 5 5 5 5
Existing Production Wells 5 5 5 5 5 5 5 5 5 5 5 5 5 5 5 5 5
SI Wells Wells 0 0 0 0 0 0 0 0 0 0 0 0 0 0 0 0 0
Lateral Jetting 0 0 0 0 0 0 0 0 0 0 0 0 0 0 0 0 0
Undeveloped Wells 0 0 0 0 0 0 0 0 0 0 0 0 0 0 0 0 0
$/Bbl 60.56 60.56 60.56 60.56 60.56 60.56 60.56 60.56 60.56 60.56 60.56 60.56 62.81 62.81 62.81 62.81 62.81
SKN Oil Production BOPM 3,949 103 100 98 95 93 91 88 86 84 82 80 78 76 74 72 71 69
Daily Production BOPD 4 3 3 3 3 3 3 3 3 3 3 3 3 3 3 2 2
Monthly Oil MMbbls MMBbl 0.0039 0.0001 0.0001 0.0001 0.0001 0.0001 0.0001 0.0001 0.0001 0.0001 0.0001 0.0001 0.0001 0.0001 0.0001 0.0001 0.0001 0.0001
SKN Revenue M$ 0.2 0.01 0.01 0.01 0.00 0.00 0.00 0.00 0.00 0.00 0.00 0.00 0.00 0.00 0.00 0.00 0.00
Total Production Bbl 3,949 103 100 98 95 93 91 88 86 84 82 80 78 76 74 72 71 69
Total Project Revenue M$ M$ 0.2 0.00 0.01 0.01 0.01 0.00 0.00 0.00 0.00 0.00 0.00 0.00 0.00 0.00 0.00 0.00 0.00 0.00
Workovers MM$ 0.0 0 0 0 0 0 0 0 0 0 0 0 0 0 0 0 0 0
New Wells MM$ 0.0 0 0 0 0 0 0 0 0 0 0 0 0 0 0 0 0 0
CAPEX TOTAL MM$ 0.0 0.00 0.00 0.00 0.00 0.00 0.00 0.00 0.00 0.00 0.00 0.00 0.00 0.00 0.00 0.00 0.00 0.00
Fixed Opex+OH MM$ 0.3 0.003 0.003 0.003 0.003 0.003 0.003 0.003 0.003 0.003 0.003 0.003 0.003 0.003 0.003 0.003 0.003 0.003
Floating Opex MM$ 0.0057 0.0001 0.0001 0.0001 0.0001 0.0001 0.0001 0.0001 0.0001 0.0001 0.0001 0.0001 0.0001 0.0001 0.0001 0.0001 0.0001 0.0001
Workovers MM$ 0.0 0.00 0.00 0.00 0.00 0.00 0.00 0.00 0.00 0.00 0.00 0.00 0.00 0.00 0.00 0.00 0.00 0.00
Total SKN Opex MM$ 0.3 0.00 0.00 0.00 0.00 0.00 0.00 0.00 0.00 0.00 0.00 0.00 0.00 0.00 0.00 0.00 0.00 0.00
OPEX TOTAL MM$ 0.3 0.00 0.00 0.00 0.00 0.00 0.00 0.00 0.00 0.00 0.00 0.00 0.00 0.00 0.00 0.00 0.00 0.00
Recoverable Opex MM$ 0.09 0.0026 0.0026 0.0026 0.0026 0.0026 0.0026 0.0026 0.0026 0.0026 0.0026 0.0026 0.0026 0.0027 0.0027 0.0027 0.0027 0.0027
Contractor Opex Cost Oil MM$ 0.09 0.0000 0.0053 0.0026 0.0026 0.0026 0.0026 0.0026 0.0026 0.0026 0.0026 0.0026 0.0026 0.0027 0.0027 0.0027 0.0027 0.0027
Unrecovered Opex MM$ 0.0026 0.0000 0.0000 0.0000 0.0000 0.0000 0.0000 0.0000 0.0000 0.0000 0.0000 0.0000 0.0000 0.0000 0.0000 0.0000 0.0000
Capex recovery Limit MM$ 0.00 0.00 0.00 0.00 0.00 0.00 0.00 0.00 0.00 0.00 0.00 0.00 0.00 0.00 0.00 0.00 0.00
Recoverable Capex MM$ 10.28 10.28 10.28 10.27 10.27 10.27 10.27 10.27 10.27 10.27 10.27 10.27 10.27 10.27 10.26 10.26 10.26
Contractor Capex Cost Oil MM$ 0.02 0.00 0.00 0.00 0.00 0.00 0.00 0.00 0.00 0.00 0.00 0.00 0.00 0.00 0.00 0.00 0.00 0.00
Unrecovered Capex MM$ 10.28 10.28 10.27 10.27 10.27 10.27 10.27 10.27 10.27 10.27 10.27 10.27 10.27 10.26 10.26 10.26 10.26
Total Cost Oil MM$ 0.00 0.01 0.00 0.00 0.00 0.00 0.00 0.00 0.00 0.00 0.00 0.00 0.00 0.00 0.00 0.00 0.00
Total Profit Oil MM$ 0.0171 0.0000 0.0000 0.0013 0.0012 0.0011 0.0011 0.0010 0.0010 0.0009 0.0009 0.0008 0.0008 0.0007 0.0007 0.0007 0.0006 0.0006
Contractor Profit Oil MM$ 0.0086 0.0000 0.0000 0.0006 0.0006 0.0006 0.0005 0.0005 0.0005 0.0005 0.0004 0.0004 0.0004 0.0003 0.0004 0.0003 0.0003 0.0003
Govt. Profit Oil MM$ 0.0086 0.0000 0.0000 0.0006 0.0006 0.0006 0.0005 0.0005 0.0005 0.0005 0.0004 0.0004 0.0004 0.0003 0.0004 0.0003 0.0003 0.0003
Total Contrctr Cost and Profit Oil, MMBbl MMBbl 0.0021 0.0000 0.0001 0.0001 0.0001 0.0001 0.0001 0.0001 0.0001 0.0001 0.0001 0.0001 0.0001 0.0001 0.0001 0.0001 0.0001 0.0001
Evaluated Net Oil, MMBbl MMBbl 0.0019 0.0000 0.0001 0.0001 0.0001 0.0001 0.0001 0.0001 0.0001 0.0001 0.0001 0.0001 0.0001 0.0001 0.0001 0.0001 0.0001 0.0001
Cash Flow MM$ 0.02 0.00 0.00 0.00 0.00 0.00 0.00 0.00 0.00 0.00 0.00 0.00 0.00 0.00 0.00 0.00 0.00 0.00
DCF @10% MM$ 0.02 0.00 0.00 0.00 0.00 0.00 0.00 0.00 0.00 0.00 0.00 0.00 0.00 0.00 0.00 0.00 0.00 0.00
Cumulative CF 0.00 0.00 0.00 0.00 0.00 0.01 0.01 0.01 0.01 0.01 0.01 0.01 0.01 0.02 0.02 0.02 0.02
Total Costs Incurred for Production, MM$ MM$ 10.61 10.28 0.00 0.00 0.00 0.00 0.00 0.00 0.00 0.00 0.00 0.00 0.00 0.00 0.00 0.00 0.00 0.00
Cumulative Total Costs, MM$ MM$ 10.61 10.28 10.28 10.28 10.29 10.29 10.29 10.29 10.30 10.30 10.30 10.30 10.31 10.31 10.31 10.32 10.32 10.32
Cntrctr's Total Profit from Sales of Oil, MM$ MM$ 0.11 0.00 0.01 0.00 0.00 0.00 0.00 0.00 0.00 0.00 0.00 0.00 0.00 0.00 0.00 0.00 0.00 0.00
Cumulative Total Profit, MM$ MM$ 0.11 0.00 0.01 0.01 0.01 0.02 0.02 0.03 0.03 0.04 0.04 0.04 0.05 0.05 0.05 0.06 0.06 0.06
Payout? 1=yes, 0=no 0 0 0 0 0 0 0 0 0 0 0 0 0 0 0 0 0
SKN
Profit Sh
are
SKN
CAPE
X
Brent Oil Price
Reve
nue
SKN
Prod
uctio
n
SKN
Ope
x
SKN
Cost Recov
ery
SKN
SKN
Paym
ent
Date SKN
Cash
Flow
Page 1 of 7 Producing Wells Only, Mean Values 5/15/201812:30 AM

Yr‐MoOil Volume
Existing ProductionWorkovers ‐ SI or BP
Workovers ‐ RDSUndeveloped
Number of Producing WellsExisting Production
SI WellsLateral JettingUndeveloped
SKN Oil ProductionDaily Production
Monthly Oil MMbblsSKN Revenue
Total ProductionTotal Project Revenue M$
WorkoversNew Wells
CAPEX TOTAL
Fixed Opex+OHFloating Opex
WorkoversTotal SKN Opex
OPEX TOTAL
Recoverable OpexContractor Opex Cost Oil
Unrecovered OpexCapex recovery LimitRecoverable Capex
Contractor Capex Cost OilUnrecovered Capex
Total Cost Oil
Total Profit OilContractor Profit Oil
Govt. Profit OilTotal Contrctr Cost and Profit Oil, MMBbl
Evaluated Net Oil, MMBbl
Cash FlowDCF @10%
Cumulative CF
Total Costs Incurred for Production, MM$Cumulative Total Costs, MM$
Cntrctr's Total Profit from Sales of Oil, MM$Cumulative Total Profit, MM$
Payout? 1=yes, 0=no
SKN
Profit Sh
are
SKN
CAPE
X
Brent Oil Price
Reve
nue
SKN
Prod
uctio
n
SKN
Ope
x
SKN
Cost Recov
ery
SKN
SKN
Paym
ent
Date SKN
Cash
Flow
Jun‐19 Jul‐19 Aug‐19 Sep‐19 Oct‐19 Nov‐19 Dec‐19 Jan‐20 Feb‐20 Mar‐20 Apr‐20 May‐20 Jun‐20 Jul‐20 Aug‐20 Sep‐20 Oct‐20 Nov‐20 Dec‐20 Jan‐21
67 65 64 62 61 59 58 56 55 54 52 51 50 49 47 46 45 44 43 42
0 0 0 0 0 0 0 0 0 0 0 0 0 0 0 0 0 0 0 0
0 0 0 0 0 0 0 0 0 0 0 0 0 0 0 0 0 0 0 0
0 0 0 0 0 0 0 0 0 0 0 0 0 0 0 0 0 0 0 0
5 5 5 5 5 5 5 5 5 5 5 5 5 5 5 5 5 5 5 5
5 5 5 5 5 5 5 5 5 5 5 5 5 5 5 5 5 5 5 5
0 0 0 0 0 0 0 0 0 0 0 0 0 0 0 0 0 0 0 0
0 0 0 0 0 0 0 0 0 0 0 0 0 0 0 0 0 0 0 0
0 0 0 0 0 0 0 0 0 0 0 0 0 0 0 0 0 0 0 0
62.81 62.81 62.81 62.81 62.81 62.81 62.81 65.80 65.80 65.80 65.80 65.80 65.80 65.80 65.80 65.80 65.80 65.80 65.80 70.70
67 65 64 62 61 59 58 56 55 54 52 51 50 49 47 46 45 44 43 42
2 2 2 2 2 2 2 2 2 2 2 2 2 2 2 2 2 2 1 1
0.0001 0.0001 0.0001 0.0001 0.0001 0.0001 0.0001 0.0001 0.0001 0.0001 0.0001 0.0001 0.0000 0.0000 0.0000 0.0000 0.0000 0.0000 0.0000 0.0000
0.00 0.00 0.00 0.00 0.00 0.00 0.00 0.00 0.00 0.00 0.00 0.00 0.00 0.00 0.00 0.00 0.00 0.00 0.00 0.00
67 65 64 62 61 59 58 56 55 54 52 51 50 49 47 46 45 44 43 42
0.00 0.00 0.00 0.00 0.00 0.00 0.00 0.00 0.00 0.00 0.00 0.00 0.00 0.00 0.00 0.00 0.00 0.00 0.00 0.00
0 0 0 0 0 0 0 0 0 0 0 0 0 0 0 0 0 0 0 0
0 0 0 0 0 0 0 0 0 0 0 0 0 0 0 0 0 0 0 0
0.00 0.00 0.00 0.00 0.00 0.00 0.00 0.00 0.00 0.00 0.00 0.00 0.00 0.00 0.00 0.00 0.00 0.00 0.00 0.00
0.003 0.003 0.003 0.003 0.003 0.003 0.003 0.003 0.003 0.003 0.003 0.003 0.003 0.003 0.003 0.003 0.003 0.003 0.003 0.003
0.0001 0.0001 0.0001 0.0001 0.0001 0.0001 0.0001 0.0001 0.0001 0.0001 0.0001 0.0001 0.0001 0.0001 0.0001 0.0001 0.0001 0.0001 0.0001 0.0001
0.00 0.00 0.00 0.00 0.00 0.00 0.00 0.00 0.00 0.00 0.00 0.00 0.00 0.00 0.00 0.00 0.00 0.00 0.00 0.00
0.00 0.00 0.00 0.00 0.00 0.00 0.00 0.00 0.00 0.00 0.00 0.00 0.00 0.00 0.00 0.00 0.00 0.00 0.00 0.00
0.00 0.00 0.00 0.00 0.00 0.00 0.00 0.00 0.00 0.00 0.00 0.00 0.00 0.00 0.00 0.00 0.00 0.00 0.00 0.00
0.0027 0.0027 0.0027 0.0027 0.0027 0.0027 0.0027 0.0027 0.0027 0.0027 0.0027 0.0027 0.0027 0.0027 0.0027 0.0000 0.0000 0.0000 0.0000 0.0000
0.0027 0.0027 0.0027 0.0027 0.0027 0.0027 0.0027 0.0027 0.0027 0.0027 0.0027 0.0027 0.0027 0.0027 0.0027 0.0000 0.0000 0.0000 0.0000 0.0000
0.0000 0.0000 0.0000 0.0000 0.0000 0.0000 0.0000 0.0000 0.0000 0.0000 0.0000 0.0000 0.0000 0.0000 0.0000 0.0000 0.0000 0.0000 0.0000 0.0000
0.00 0.00 0.00 0.00 0.00 0.00 0.00 0.00 0.00 0.00 0.00 0.00 0.00 0.00 0.00 0.00 0.00 0.00 0.00 0.00
10.26 10.26 10.26 10.26 10.26 10.26 10.26 10.26 10.26 10.26 10.26 10.26 10.26 10.26 10.26 0.00 0.00 0.00 0.00 0.00
0.00 0.00 0.00 0.00 0.00 0.00 0.00 0.00 0.00 0.00 0.00 0.00 0.00 0.00 0.00 0.00 0.00 0.00 0.00 0.00
10.26 10.26 10.26 10.26 10.26 10.26 10.26 10.26 10.26 10.26 10.26 10.26 10.26 10.26 10.26 0.00 0.00 0.00 0.00 0.00
0.00 0.00 0.00 0.00 0.00 0.00 0.00 0.00 0.00 0.00 0.00 0.00 0.00 0.00 0.00 0.00 0.00 0.00 0.00 0.00
0.0005 0.0005 0.0004 0.0004 0.0003 0.0003 0.0003 0.0002 0.0003 0.0002 0.0002 0.0001 0.0001 0.0001 0.0000 0.0000 0.0000 0.0000 0.0000 0.0000
0.0003 0.0002 0.0002 0.0002 0.0002 0.0001 0.0001 0.0001 0.0001 0.0001 0.0001 0.0001 0.0001 0.0000 0.0000 0.0000 0.0000 0.0000 0.0000 0.0000
0.0003 0.0002 0.0002 0.0002 0.0002 0.0001 0.0001 0.0001 0.0001 0.0001 0.0001 0.0001 0.0001 0.0000 0.0000 0.0000 0.0000 0.0000 0.0000 0.0000
0.0001 0.0001 0.0001 0.0001 0.0001 0.0001 0.0001 0.0001 0.0001 0.0001 0.0001 0.0001 0.0001 0.0000 0.0000 0.0000 0.0000 0.0000 0.0000 0.0000
0.0001 0.0001 0.0001 0.0001 0.0001 0.0001 0.0001 0.0000 0.0000 0.0000 0.0000 0.0000 0.0000 0.0000 0.0000 0.0000 0.0000 0.0000 0.0000 0.0000
0.00 0.00 0.00 0.00 0.00 0.00 0.00 0.00 0.00 0.00 0.00 0.00 0.00 0.00 0.00 0.00 0.00 0.00 0.00 0.00
0.00 0.00 0.00 0.00 0.00 0.00 0.00 0.00 0.00 0.00 0.00 0.00 0.00 0.00 0.00 0.00 0.00 0.00 0.00 0.00
0.02 0.02 0.02 0.02 0.02 0.02 0.02 0.02 0.02 0.02 0.02 0.02 0.02 0.02 0.02 0.02 0.02 0.02 0.02 0.02
0.00 0.00 0.00 0.00 0.00 0.00 0.00 0.00 0.00 0.00 0.00 0.00 0.00 0.00 0.00 0.00 0.00 0.00 0.00 0.00
10.32 10.33 10.33 10.33 10.33 10.34 10.34 10.34 10.34 10.35 10.35 10.35 10.36 10.36 10.36 10.36 10.37 10.37 10.37 10.37
0.00 0.00 0.00 0.00 0.00 0.00 0.00 0.00 0.00 0.00 0.00 0.00 0.00 0.00 0.00 0.00 0.00 0.00 0.00 0.00
0.07 0.07 0.07 0.08 0.08 0.08 0.09 0.09 0.09 0.10 0.10 0.10 0.11 0.11 0.11 0.11 0.11 0.11 0.11 0.11
0 0 0 0 0 0 0 0 0 0 0 0 0 0 0 0 0 0 0 0
Page 2 of 7 Producing Wells Only, Mean Values 5/15/201812:30 AM

Yr‐MoOil Volume
Existing ProductionWorkovers ‐ SI or BP
Workovers ‐ RDSUndeveloped
Number of Producing WellsExisting Production
SI WellsLateral JettingUndeveloped
SKN Oil ProductionDaily Production
Monthly Oil MMbblsSKN Revenue
Total ProductionTotal Project Revenue M$
WorkoversNew Wells
CAPEX TOTAL
Fixed Opex+OHFloating Opex
WorkoversTotal SKN Opex
OPEX TOTAL
Recoverable OpexContractor Opex Cost Oil
Unrecovered OpexCapex recovery LimitRecoverable Capex
Contractor Capex Cost OilUnrecovered Capex
Total Cost Oil
Total Profit OilContractor Profit Oil
Govt. Profit OilTotal Contrctr Cost and Profit Oil, MMBbl
Evaluated Net Oil, MMBbl
Cash FlowDCF @10%
Cumulative CF
Total Costs Incurred for Production, MM$Cumulative Total Costs, MM$
Cntrctr's Total Profit from Sales of Oil, MM$Cumulative Total Profit, MM$
Payout? 1=yes, 0=no
SKN
Profit Sh
are
SKN
CAPE
X
Brent Oil Price
Reve
nue
SKN
Prod
uctio
n
SKN
Ope
x
SKN
Cost Recov
ery
SKN
SKN
Paym
ent
Date SKN
Cash
Flow
Feb‐21 Mar‐21 Apr‐21 May‐21 Jun‐21 Jul‐21 Aug‐21 Sep‐21 Oct‐21 Nov‐21 Dec‐21 Jan‐22 Feb‐22 Mar‐22 Apr‐22 May‐22 Jun‐22 Jul‐22 Aug‐22 Sep‐22
41 40 39 38 37 36 35 34 34 33 32 31 30 30 29 28 28 27 26 26
0 0 0 0 0 0 0 0 0 0 0 0 0 0 0 0 0 0 0 0
0 0 0 0 0 0 0 0 0 0 0 0 0 0 0 0 0 0 0 0
0 0 0 0 0 0 0 0 0 0 0 0 0 0 0 0 0 0 0 0
5 5 5 5 5 5 5 5 5 5 5 5 5 5 5 5 5 5 5 5
5 5 5 5 5 5 5 5 5 5 5 5 5 5 5 5 5 5 5 5
0 0 0 0 0 0 0 0 0 0 0 0 0 0 0 0 0 0 0 0
0 0 0 0 0 0 0 0 0 0 0 0 0 0 0 0 0 0 0 0
0 0 0 0 0 0 0 0 0 0 0 0 0 0 0 0 0 0 0 0
70.70 70.70 70.70 70.70 70.70 70.70 70.70 70.70 70.70 70.70 70.70 74.23 74.23 74.23 74.23 74.23 74.23 74.23 74.23 74.23
41 40 39 38 37 36 35 34 34 33 32 31 30 30 29 28 28 27 26 26
1 1 1 1 1 1 1 1 1 1 1 1 1 1 1 1 1 1 1 1
0.0000 0.0000 0.0000 0.0000 0.0000 0.0000 0.0000 0.0000 0.0000 0.0000 0.0000 0.0000 0.0000 0.0000 0.0000 0.0000 0.0000 0.0000 0.0000 0.0000
0.00 0.00 0.00 0.00 0.00 0.00 0.00 0.00 0.00 0.00 0.00 0.00 0.00 0.00 0.00 0.00 0.00 0.00 0.00 0.00
41 40 39 38 37 36 35 34 34 33 32 31 30 30 29 28 28 27 26 26
0.00 0.00 0.00 0.00 0.00 0.00 0.00 0.00 0.00 0.00 0.00 0.00 0.00 0.00 0.00 0.00 0.00 0.00 0.00 0.00
0 0 0 0 0 0 0 0 0 0 0 0 0 0 0 0 0 0 0 0
0 0 0 0 0 0 0 0 0 0 0 0 0 0 0 0 0 0 0 0
0.00 0.00 0.00 0.00 0.00 0.00 0.00 0.00 0.00 0.00 0.00 0.00 0.00 0.00 0.00 0.00 0.00 0.00 0.00 0.00
0.003 0.003 0.003 0.003 0.003 0.003 0.003 0.003 0.003 0.003 0.003 0.003 0.003 0.003 0.003 0.003 0.003 0.003 0.003 0.003
0.0001 0.0001 0.0001 0.0001 0.0001 0.0001 0.0001 0.0000 0.0000 0.0000 0.0000 0.0000 0.0000 0.0000 0.0000 0.0000 0.0000 0.0000 0.0000 0.0000
0.00 0.00 0.00 0.00 0.00 0.00 0.00 0.00 0.00 0.00 0.00 0.00 0.00 0.00 0.00 0.00 0.00 0.00 0.00 0.00
0.00 0.00 0.00 0.00 0.00 0.00 0.00 0.00 0.00 0.00 0.00 0.00 0.00 0.00 0.00 0.00 0.00 0.00 0.00 0.00
0.00 0.00 0.00 0.00 0.00 0.00 0.00 0.00 0.00 0.00 0.00 0.00 0.00 0.00 0.00 0.00 0.00 0.00 0.00 0.00
0.0000 0.0000 0.0000 0.0000 0.0000 0.0000 0.0000 0.0000 0.0000 0.0000 0.0000 0.0000 0.0000 0.0000 0.0000 0.0000 0.0000 0.0000 0.0000 0.0000
0.0000 0.0000 0.0000 0.0000 0.0000 0.0000 0.0000 0.0000 0.0000 0.0000 0.0000 0.0000 0.0000 0.0000 0.0000 0.0000 0.0000 0.0000 0.0000 0.0000
0.0000 0.0000 0.0000 0.0000 0.0000 0.0000 0.0000 0.0000 0.0000 0.0000 0.0000 0.0000 0.0000 0.0000 0.0000 0.0000 0.0000 0.0000 0.0000 0.0000
0.00 0.00 0.00 0.00 0.00 0.00 0.00 0.00 0.00 0.00 0.00 0.00 0.00 0.00 0.00 0.00 0.00 0.00 0.00 0.00
0.00 0.00 0.00 0.00 0.00 0.00 0.00 0.00 0.00 0.00 0.00 0.00 0.00 0.00 0.00 0.00 0.00 0.00 0.00 0.00
0.00 0.00 0.00 0.00 0.00 0.00 0.00 0.00 0.00 0.00 0.00 0.00 0.00 0.00 0.00 0.00 0.00 0.00 0.00 0.00
0.00 0.00 0.00 0.00 0.00 0.00 0.00 0.00 0.00 0.00 0.00 0.00 0.00 0.00 0.00 0.00 0.00 0.00 0.00 0.00
0.00 0.00 0.00 0.00 0.00 0.00 0.00 0.00 0.00 0.00 0.00 0.00 0.00 0.00 0.00 0.00 0.00 0.00 0.00 0.00
0.0000 0.0000 0.0000 0.0000 0.0000 0.0000 0.0000 0.0000 0.0000 0.0000 0.0000 0.0000 0.0000 0.0000 0.0000 0.0000 0.0000 0.0000 0.0000 0.0000
0.0000 0.0000 0.0000 0.0000 0.0000 0.0000 0.0000 0.0000 0.0000 0.0000 0.0000 0.0000 0.0000 0.0000 0.0000 0.0000 0.0000 0.0000 0.0000 0.0000
0.0000 0.0000 0.0000 0.0000 0.0000 0.0000 0.0000 0.0000 0.0000 0.0000 0.0000 0.0000 0.0000 0.0000 0.0000 0.0000 0.0000 0.0000 0.0000 0.0000
0.0000 0.0000 0.0000 0.0000 0.0000 0.0000 0.0000 0.0000 0.0000 0.0000 0.0000 0.0000 0.0000 0.0000 0.0000 0.0000 0.0000 0.0000 0.0000 0.0000
0.0000 0.0000 0.0000 0.0000 0.0000 0.0000 0.0000 0.0000 0.0000 0.0000 0.0000 0.0000 0.0000 0.0000 0.0000 0.0000 0.0000 0.0000 0.0000 0.0000
0.00 0.00 0.00 0.00 0.00 0.00 0.00 0.00 0.00 0.00 0.00 0.00 0.00 0.00 0.00 0.00 0.00 0.00 0.00 0.00
0.00 0.00 0.00 0.00 0.00 0.00 0.00 0.00 0.00 0.00 0.00 0.00 0.00 0.00 0.00 0.00 0.00 0.00 0.00 0.00
0.02 0.02 0.02 0.02 0.02 0.02 0.02 0.02 0.02 0.02 0.02 0.02 0.02 0.02 0.02 0.02 0.02 0.02 0.02 0.02
0.00 0.00 0.00 0.00 0.00 0.00 0.00 0.00 0.00 0.00 0.00 0.00 0.00 0.00 0.00 0.00 0.00 0.00 0.00 0.00
10.38 10.38 10.38 10.39 10.39 10.39 10.39 10.40 10.40 10.40 10.40 10.41 10.41 10.41 10.42 10.42 10.42 10.42 10.43 10.43
0.00 0.00 0.00 0.00 0.00 0.00 0.00 0.00 0.00 0.00 0.00 0.00 0.00 0.00 0.00 0.00 0.00 0.00 0.00 0.00
0.11 0.11 0.11 0.11 0.11 0.11 0.11 0.11 0.11 0.11 0.11 0.11 0.11 0.11 0.11 0.11 0.11 0.11 0.11 0.11
0 0 0 0 0 0 0 0 0 0 0 0 0 0 0 0 0 0 0 0
Page 3 of 7 Producing Wells Only, Mean Values 5/15/201812:30 AM

Yr‐MoOil Volume
Existing ProductionWorkovers ‐ SI or BP
Workovers ‐ RDSUndeveloped
Number of Producing WellsExisting Production
SI WellsLateral JettingUndeveloped
SKN Oil ProductionDaily Production
Monthly Oil MMbblsSKN Revenue
Total ProductionTotal Project Revenue M$
WorkoversNew Wells
CAPEX TOTAL
Fixed Opex+OHFloating Opex
WorkoversTotal SKN Opex
OPEX TOTAL
Recoverable OpexContractor Opex Cost Oil
Unrecovered OpexCapex recovery LimitRecoverable Capex
Contractor Capex Cost OilUnrecovered Capex
Total Cost Oil
Total Profit OilContractor Profit Oil
Govt. Profit OilTotal Contrctr Cost and Profit Oil, MMBbl
Evaluated Net Oil, MMBbl
Cash FlowDCF @10%
Cumulative CF
Total Costs Incurred for Production, MM$Cumulative Total Costs, MM$
Cntrctr's Total Profit from Sales of Oil, MM$Cumulative Total Profit, MM$
Payout? 1=yes, 0=no
SKN
Profit Sh
are
SKN
CAPE
X
Brent Oil Price
Reve
nue
SKN
Prod
uctio
n
SKN
Ope
x
SKN
Cost Recov
ery
SKN
SKN
Paym
ent
Date SKN
Cash
Flow
Oct‐22 Nov‐22 Dec‐22 Jan‐23 Feb‐23 Mar‐23 Apr‐23 May‐23 Jun‐23 Jul‐23 Aug‐23 Sep‐23 Oct‐23 Nov‐23 Dec‐23 Jan‐24 Feb‐24 Mar‐24 Apr‐24
25 24 24 23 23 22 22 21 21 20 20 19 19 18 18 17 17 16 16
0 0 0 0 0 0 0 0 0 0 0 0 0 0 0 0 0 0 0
0 0 0 0 0 0 0 0 0 0 0 0 0 0 0 0 0 0 0
0 0 0 0 0 0 0 0 0 0 0 0 0 0 0 0 0 0 0
5 5 5 5 5 5 5 5 5 5 5 5 5 5 5 5 5 5 5
5 5 5 5 5 5 5 5 5 5 5 5 5 5 5 5 5 5 5
0 0 0 0 0 0 0 0 0 0 0 0 0 0 0 0 0 0 0
0 0 0 0 0 0 0 0 0 0 0 0 0 0 0 0 0 0 0
0 0 0 0 0 0 0 0 0 0 0 0 0 0 0 0 0 0 0
74.23 74.23 74.23 75.21 75.21 75.21 75.21 75.21 75.21 75.21 75.21 75.21 75.21 75.21 75.21 76.23 76.23 76.23 76.23
25 24 24 23 23 22 22 21 21 20 20 19 19 18 18 17 17 16 16
1 1 1 1 1 1 1 1 1 1 1 1 1 1 1 1 1 1 1
0.0000 0.0000 0.0000 0.0000 0.0000 0.0000 0.0000 0.0000 0.0000 0.0000 0.0000 0.0000 0.0000 0.0000 0.0000 0.0000 0.0000 0.0000 0.0000
0.00 0.00 0.00 0.00 0.00 0.00 0.00 0.00 0.00 0.00 0.00 0.00 0.00 0.00 0.00 0.00 0.00 0.00 0.00
25 24 24 23 23 22 22 21 21 20 20 19 19 18 18 17 17 16 16
0.00 0.00 0.00 0.00 0.00 0.00 0.00 0.00 0.00 0.00 0.00 0.00 0.00 0.00 0.00 0.00 0.00 0.00 0.00
0 0 0 0 0 0 0 0 0 0 0 0 0 0 0 0 0 0 0
0 0 0 0 0 0 0 0 0 0 0 0 0 0 0 0 0 0 0
0.00 0.00 0.00 0.00 0.00 0.00 0.00 0.00 0.00 0.00 0.00 0.00 0.00 0.00 0.00 0.00 0.00 0.00 0.00
0.003 0.003 0.003 0.003 0.003 0.003 0.003 0.003 0.003 0.003 0.003 0.003 0.003 0.003 0.003 0.003 0.003 0.003 0.003
0.0000 0.0000 0.0000 0.0000 0.0000 0.0000 0.0000 0.0000 0.0000 0.0000 0.0000 0.0000 0.0000 0.0000 0.0000 0.0000 0.0000 0.0000 0.0000
0.00 0.00 0.00 0.00 0.00 0.00 0.00 0.00 0.00 0.00 0.00 0.00 0.00 0.00 0.00 0.00 0.00 0.00 0.00
0.00 0.00 0.00 0.00 0.00 0.00 0.00 0.00 0.00 0.00 0.00 0.00 0.00 0.00 0.00 0.00 0.00 0.00 0.00
0.00 0.00 0.00 0.00 0.00 0.00 0.00 0.00 0.00 0.00 0.00 0.00 0.00 0.00 0.00 0.00 0.00 0.00 0.00
0.0000 0.0000 0.0000 0.0000 0.0000 0.0000 0.0000 0.0000 0.0000 0.0000 0.0000 0.0000 0.0000 0.0000 0.0000 0.0000 0.0000 0.0000 0.0000
0.0000 0.0000 0.0000 0.0000 0.0000 0.0000 0.0000 0.0000 0.0000 0.0000 0.0000 0.0000 0.0000 0.0000 0.0000 0.0000 0.0000 0.0000 0.0000
0.0000 0.0000 0.0000 0.0000 0.0000 0.0000 0.0000 0.0000 0.0000 0.0000 0.0000 0.0000 0.0000 0.0000 0.0000 0.0000 0.0000 0.0000 0.0000
0.00 0.00 0.00 0.00 0.00 0.00 0.00 0.00 0.00 0.00 0.00 0.00 0.00 0.00 0.00 0.00 0.00 0.00 0.00
0.00 0.00 0.00 0.00 0.00 0.00 0.00 0.00 0.00 0.00 0.00 0.00 0.00 0.00 0.00 0.00 0.00 0.00 0.00
0.00 0.00 0.00 0.00 0.00 0.00 0.00 0.00 0.00 0.00 0.00 0.00 0.00 0.00 0.00 0.00 0.00 0.00 0.00
0.00 0.00 0.00 0.00 0.00 0.00 0.00 0.00 0.00 0.00 0.00 0.00 0.00 0.00 0.00 0.00 0.00 0.00 0.00
0.00 0.00 0.00 0.00 0.00 0.00 0.00 0.00 0.00 0.00 0.00 0.00 0.00 0.00 0.00 0.00 0.00 0.00 0.00
0.0000 0.0000 0.0000 0.0000 0.0000 0.0000 0.0000 0.0000 0.0000 0.0000 0.0000 0.0000 0.0000 0.0000 0.0000 0.0000 0.0000 0.0000 0.0000
0.0000 0.0000 0.0000 0.0000 0.0000 0.0000 0.0000 0.0000 0.0000 0.0000 0.0000 0.0000 0.0000 0.0000 0.0000 0.0000 0.0000 0.0000 0.0000
0.0000 0.0000 0.0000 0.0000 0.0000 0.0000 0.0000 0.0000 0.0000 0.0000 0.0000 0.0000 0.0000 0.0000 0.0000 0.0000 0.0000 0.0000 0.0000
0.0000 0.0000 0.0000 0.0000 0.0000 0.0000 0.0000 0.0000 0.0000 0.0000 0.0000 0.0000 0.0000 0.0000 0.0000 0.0000 0.0000 0.0000 0.0000
0.0000 0.0000 0.0000 0.0000 0.0000 0.0000 0.0000 0.0000 0.0000 0.0000 0.0000 0.0000 0.0000 0.0000 0.0000 0.0000 0.0000 0.0000 0.0000
0.00 0.00 0.00 0.00 0.00 0.00 0.00 0.00 0.00 0.00 0.00 0.00 0.00 0.00 0.00 0.00 0.00 0.00 0.00
0.00 0.00 0.00 0.00 0.00 0.00 0.00 0.00 0.00 0.00 0.00 0.00 0.00 0.00 0.00 0.00 0.00 0.00 0.00
0.02 0.02 0.02 0.02 0.02 0.02 0.02 0.02 0.02 0.02 0.02 0.02 0.02 0.02 0.02 0.02 0.02 0.02 0.02
0.00 0.00 0.00 0.00 0.00 0.00 0.00 0.00 0.00 0.00 0.00 0.00 0.00 0.00 0.00 0.00 0.00 0.00 0.00
10.43 10.44 10.44 10.44 10.44 10.45 10.45 10.45 10.45 10.46 10.46 10.46 10.47 10.47 10.47 10.47 10.48 10.48 10.48
0.00 0.00 0.00 0.00 0.00 0.00 0.00 0.00 0.00 0.00 0.00 0.00 0.00 0.00 0.00 0.00 0.00 0.00 0.00
0.11 0.11 0.11 0.11 0.11 0.11 0.11 0.11 0.11 0.11 0.11 0.11 0.11 0.11 0.11 0.11 0.11 0.11 0.11
0 0 0 0 0 0 0 0 0 0 0 0 0 0 0 0 0 0 0
Page 4 of 7 Producing Wells Only, Mean Values 5/15/201812:30 AM

Yr‐MoOil Volume
Existing ProductionWorkovers ‐ SI or BP
Workovers ‐ RDSUndeveloped
Number of Producing WellsExisting Production
SI WellsLateral JettingUndeveloped
SKN Oil ProductionDaily Production
Monthly Oil MMbblsSKN Revenue
Total ProductionTotal Project Revenue M$
WorkoversNew Wells
CAPEX TOTAL
Fixed Opex+OHFloating Opex
WorkoversTotal SKN Opex
OPEX TOTAL
Recoverable OpexContractor Opex Cost Oil
Unrecovered OpexCapex recovery LimitRecoverable Capex
Contractor Capex Cost OilUnrecovered Capex
Total Cost Oil
Total Profit OilContractor Profit Oil
Govt. Profit OilTotal Contrctr Cost and Profit Oil, MMBbl
Evaluated Net Oil, MMBbl
Cash FlowDCF @10%
Cumulative CF
Total Costs Incurred for Production, MM$Cumulative Total Costs, MM$
Cntrctr's Total Profit from Sales of Oil, MM$Cumulative Total Profit, MM$
Payout? 1=yes, 0=no
SKN
Profit Sh
are
SKN
CAPE
X
Brent Oil Price
Reve
nue
SKN
Prod
uctio
n
SKN
Ope
x
SKN
Cost Recov
ery
SKN
SKN
Paym
ent
Date SKN
Cash
Flow
May‐24 Jun‐24 Jul‐24 Aug‐24 Sep‐24 Oct‐24 Nov‐24 Dec‐24 Jan‐25 Feb‐25 Mar‐25 Apr‐25 May‐25 Jun‐25 Jul‐25 Aug‐25 Sep‐25 Oct‐25 Nov‐25
16 15 15 15 14 14 14 13 13 13 12 12 12 11 11 11 11 10 10
0 0 0 0 0 0 0 0 0 0 0 0 0 0 0 0 0 0 0
0 0 0 0 0 0 0 0 0 0 0 0 0 0 0 0 0 0 0
0 0 0 0 0 0 0 0 0 0 0 0 0 0 0 0 0 0 0
5 5 5 5 5 5 5 5 5 5 5 5 5 5 5 5 5 5 5
5 5 5 5 5 5 5 5 5 5 5 5 5 5 5 5 5 5 5
0 0 0 0 0 0 0 0 0 0 0 0 0 0 0 0 0 0 0
0 0 0 0 0 0 0 0 0 0 0 0 0 0 0 0 0 0 0
0 0 0 0 0 0 0 0 0 0 0 0 0 0 0 0 0 0 0
76.23 76.23 76.23 76.23 76.23 76.23 76.23 76.23 77.26 77.26 77.26 77.26 77.26 77.26 77.26 77.26 77.26 77.26 77.26
16 15 15 15 14 14 14 13 13 13 12 12 12 11 11 11 11 10 10
1 1 1 1 0 0 0 0 0 0 0 0 0 0 0 0 0 0 0
0.0000 0.0000 0.0000 0.0000 0.0000 0.0000 0.0000 0.0000 0.0000 0.0000 0.0000 0.0000 0.0000 0.0000 0.0000 0.0000 0.0000 0.0000 0.0000
0.00 0.00 0.00 0.00 0.00 0.00 0.00 0.00 0.00 0.00 0.00 0.00 0.00 0.00 0.00 0.00 0.00 0.00 0.00
16 15 15 15 14 14 14 13 13 13 12 12 12 11 11 11 11 10 10
0.00 0.00 0.00 0.00 0.00 0.00 0.00 0.00 0.00 0.00 0.00 0.00 0.00 0.00 0.00 0.00 0.00 0.00 0.00
0 0 0 0 0 0 0 0 0 0 0 0 0 0 0 0 0 0 0
0 0 0 0 0 0 0 0 0 0 0 0 0 0 0 0 0 0 0
0.00 0.00 0.00 0.00 0.00 0.00 0.00 0.00 0.00 0.00 0.00 0.00 0.00 0.00 0.00 0.00 0.00 0.00 0.00
0.003 0.003 0.003 0.003 0.003 0.003 0.003 0.003 0.003 0.003 0.003 0.003 0.003 0.003 0.003 0.003 0.003 0.003 0.003
0.0000 0.0000 0.0000 0.0000 0.0000 0.0000 0.0000 0.0000 0.0000 0.0000 0.0000 0.0000 0.0000 0.0000 0.0000 0.0000 0.0000 0.0000 0.0000
0.00 0.00 0.00 0.00 0.00 0.00 0.00 0.00 0.00 0.00 0.00 0.00 0.00 0.00 0.00 0.00 0.00 0.00 0.00
0.00 0.00 0.00 0.00 0.00 0.00 0.00 0.00 0.00 0.00 0.00 0.00 0.00 0.00 0.00 0.00 0.00 0.00 0.00
0.00 0.00 0.00 0.00 0.00 0.00 0.00 0.00 0.00 0.00 0.00 0.00 0.00 0.00 0.00 0.00 0.00 0.00 0.00
0.0000 0.0000 0.0000 0.0000 0.0000 0.0000 0.0000 0.0000 0.0000 0.0000 0.0000 0.0000 0.0000 0.0000 0.0000 0.0000 0.0000 0.0000 0.0000
0.0000 0.0000 0.0000 0.0000 0.0000 0.0000 0.0000 0.0000 0.0000 0.0000 0.0000 0.0000 0.0000 0.0000 0.0000 0.0000 0.0000 0.0000 0.0000
0.0000 0.0000 0.0000 0.0000 0.0000 0.0000 0.0000 0.0000 0.0000 0.0000 0.0000 0.0000 0.0000 0.0000 0.0000 0.0000 0.0000 0.0000 0.0000
0.00 0.00 0.00 0.00 0.00 0.00 0.00 0.00 0.00 0.00 0.00 0.00 0.00 0.00 0.00 0.00 0.00 0.00 0.00
0.00 0.00 0.00 0.00 0.00 0.00 0.00 0.00 0.00 0.00 0.00 0.00 0.00 0.00 0.00 0.00 0.00 0.00 0.00
0.00 0.00 0.00 0.00 0.00 0.00 0.00 0.00 0.00 0.00 0.00 0.00 0.00 0.00 0.00 0.00 0.00 0.00 0.00
0.00 0.00 0.00 0.00 0.00 0.00 0.00 0.00 0.00 0.00 0.00 0.00 0.00 0.00 0.00 0.00 0.00 0.00 0.00
0.00 0.00 0.00 0.00 0.00 0.00 0.00 0.00 0.00 0.00 0.00 0.00 0.00 0.00 0.00 0.00 0.00 0.00 0.00
0.0000 0.0000 0.0000 0.0000 0.0000 0.0000 0.0000 0.0000 0.0000 0.0000 0.0000 0.0000 0.0000 0.0000 0.0000 0.0000 0.0000 0.0000 0.0000
0.0000 0.0000 0.0000 0.0000 0.0000 0.0000 0.0000 0.0000 0.0000 0.0000 0.0000 0.0000 0.0000 0.0000 0.0000 0.0000 0.0000 0.0000 0.0000
0.0000 0.0000 0.0000 0.0000 0.0000 0.0000 0.0000 0.0000 0.0000 0.0000 0.0000 0.0000 0.0000 0.0000 0.0000 0.0000 0.0000 0.0000 0.0000
0.0000 0.0000 0.0000 0.0000 0.0000 0.0000 0.0000 0.0000 0.0000 0.0000 0.0000 0.0000 0.0000 0.0000 0.0000 0.0000 0.0000 0.0000 0.0000
0.0000 0.0000 0.0000 0.0000 0.0000 0.0000 0.0000 0.0000 0.0000 0.0000 0.0000 0.0000 0.0000 0.0000 0.0000 0.0000 0.0000 0.0000 0.0000
0.00 0.00 0.00 0.00 0.00 0.00 0.00 0.00 0.00 0.00 0.00 0.00 0.00 0.00 0.00 0.00 0.00 0.00 0.00
0.00 0.00 0.00 0.00 0.00 0.00 0.00 0.00 0.00 0.00 0.00 0.00 0.00 0.00 0.00 0.00 0.00 0.00 0.00
0.02 0.02 0.02 0.02 0.02 0.02 0.02 0.02 0.02 0.02 0.02 0.02 0.02 0.02 0.02 0.02 0.02 0.02 0.02
0.00 0.00 0.00 0.00 0.00 0.00 0.00 0.00 0.00 0.00 0.00 0.00 0.00 0.00 0.00 0.00 0.00 0.00 0.00
10.49 10.49 10.49 10.49 10.50 10.50 10.50 10.51 10.51 10.51 10.51 10.52 10.52 10.52 10.53 10.53 10.53 10.54 10.54
0.00 0.00 0.00 0.00 0.00 0.00 0.00 0.00 0.00 0.00 0.00 0.00 0.00 0.00 0.00 0.00 0.00 0.00 0.00
0.11 0.11 0.11 0.11 0.11 0.11 0.11 0.11 0.11 0.11 0.11 0.11 0.11 0.11 0.11 0.11 0.11 0.11 0.11
0 0 0 0 0 0 0 0 0 0 0 0 0 0 0 0 0 0 0
Page 5 of 7 Producing Wells Only, Mean Values 5/15/201812:30 AM

Yr‐MoOil Volume
Existing ProductionWorkovers ‐ SI or BP
Workovers ‐ RDSUndeveloped
Number of Producing WellsExisting Production
SI WellsLateral JettingUndeveloped
SKN Oil ProductionDaily Production
Monthly Oil MMbblsSKN Revenue
Total ProductionTotal Project Revenue M$
WorkoversNew Wells
CAPEX TOTAL
Fixed Opex+OHFloating Opex
WorkoversTotal SKN Opex
OPEX TOTAL
Recoverable OpexContractor Opex Cost Oil
Unrecovered OpexCapex recovery LimitRecoverable Capex
Contractor Capex Cost OilUnrecovered Capex
Total Cost Oil
Total Profit OilContractor Profit Oil
Govt. Profit OilTotal Contrctr Cost and Profit Oil, MMBbl
Evaluated Net Oil, MMBbl
Cash FlowDCF @10%
Cumulative CF
Total Costs Incurred for Production, MM$Cumulative Total Costs, MM$
Cntrctr's Total Profit from Sales of Oil, MM$Cumulative Total Profit, MM$
Payout? 1=yes, 0=no
SKN
Profit Sh
are
SKN
CAPE
X
Brent Oil Price
Reve
nue
SKN
Prod
uctio
n
SKN
Ope
x
SKN
Cost Recov
ery
SKN
SKN
Paym
ent
Date SKN
Cash
Flow
Dec‐25 Jan‐26 Feb‐26 Mar‐26 Apr‐26 May‐26 Jun‐26 Jul‐26 Aug‐26 Sep‐26 Oct‐26 Nov‐26 Dec‐26 Jan‐27 Feb‐27 Mar‐27 Apr‐27 May‐27 Jun‐27
10 10 9 9 7 7 7 7 7 7 6 6 6 6 6 6 5 5 5
0 0 0 0 0 0 0 0 0 0 0 0 0 0 0 0 0 0 0
0 0 0 0 0 0 0 0 0 0 0 0 0 0 0 0 0 0 0
0 0 0 0 0 0 0 0 0 0 0 0 0 0 0 0 0 0 0
5 5 5 5 5 5 5 5 4 4 4 4 4 4 4 4 3 3 3
5 5 5 5 5 5 5 5 4 4 4 4 4 4 4 4 3 3 3
0 0 0 0 0 0 0 0 0 0 0 0 0 0 0 0 0 0 0
0 0 0 0 0 0 0 0 0 0 0 0 0 0 0 0 0 0 0
0 0 0 0 0 0 0 0 0 0 0 0 0 0 0 0 0 0 0
77.26 78.37 78.37 78.37 78.37 78.37 78.37 78.37 78.37 78.37 78.37 78.37 78.37 79.45 79.45 79.45 79.45 79.45 79.45
10 10 9 9 7 7 7 7 7 7 6 6 6 6 6 6 5 5 5
0 0 0 0 0 0 0 0 0 0 0 0 0 0 0 0 0 0 0
0.0000 0.0000 0.0000 0.0000 0.0000 0.0000 0.0000 0.0000 0.0000 0.0000 0.0000 0.0000 0.0000 0.0000 0.0000 0.0000 0.0000 0.0000 0.0000
0.00 0.00 0.00 0.00 0.00 0.00 0.00 0.00 0.00 0.00 0.00 0.00 0.00 0.00 0.00 0.00 0.00 0.00 0.00
10 10 9 9 7 7 7 7 7 7 6 6 6 6 6 6 5 5 5
0.00 0.00 0.00 0.00 0.00 0.00 0.00 0.00 0.00 0.00 0.00 0.00 0.00 0.00 0.00 0.00 0.00 0.00 0.00
0 0 0 0 0 0 0 0 0 0 0 0 0 0 0 0 0 0 0
0 0 0 0 0 0 0 0 0 0 0 0 0 0 0 0 0 0 0
0.00 0.00 0.00 0.00 0.00 0.00 0.00 0.00 0.00 0.00 0.00 0.00 0.00 0.00 0.00 0.00 0.00 0.00 0.00
0.003 0.003 0.003 0.003 0.003 0.003 0.003 0.003 0.003 0.003 0.003 0.003 0.003 0.003 0.003 0.003 0.003 0.003 0.003
0.0000 0.0000 0.0000 0.0000 0.0000 0.0000 0.0000 0.0000 0.0000 0.0000 0.0000 0.0000 0.0000 0.0000 0.0000 0.0000 0.0000 0.0000 0.0000
0.00 0.00 0.00 0.00 0.00 0.00 0.00 0.00 0.00 0.00 0.00 0.00 0.00 0.00 0.00 0.00 0.00 0.00 0.00
0.00 0.00 0.00 0.00 0.00 0.00 0.00 0.00 0.00 0.00 0.00 0.00 0.00 0.00 0.00 0.00 0.00 0.00 0.00
0.00 0.00 0.00 0.00 0.00 0.00 0.00 0.00 0.00 0.00 0.00 0.00 0.00 0.00 0.00 0.00 0.00 0.00 0.00
0.0000 0.0000 0.0000 0.0000 0.0000 0.0000 0.0000 0.0000 0.0000 0.0000 0.0000 0.0000 0.0000 0.0000 0.0000 0.0000 0.0000 0.0000 0.0000
0.0000 0.0000 0.0000 0.0000 0.0000 0.0000 0.0000 0.0000 0.0000 0.0000 0.0000 0.0000 0.0000 0.0000 0.0000 0.0000 0.0000 0.0000 0.0000
0.0000 0.0000 0.0000 0.0000 0.0000 0.0000 0.0000 0.0000 0.0000 0.0000 0.0000 0.0000 0.0000 0.0000 0.0000 0.0000 0.0000 0.0000 0.0000
0.00 0.00 0.00 0.00 0.00 0.00 0.00 0.00 0.00 0.00 0.00 0.00 0.00 0.00 0.00 0.00 0.00 0.00 0.00
0.00 0.00 0.00 0.00 0.00 0.00 0.00 0.00 0.00 0.00 0.00 0.00 0.00 0.00 0.00 0.00 0.00 0.00 0.00
0.00 0.00 0.00 0.00 0.00 0.00 0.00 0.00 0.00 0.00 0.00 0.00 0.00 0.00 0.00 0.00 0.00 0.00 0.00
0.00 0.00 0.00 0.00 0.00 0.00 0.00 0.00 0.00 0.00 0.00 0.00 0.00 0.00 0.00 0.00 0.00 0.00 0.00
0.00 0.00 0.00 0.00 0.00 0.00 0.00 0.00 0.00 0.00 0.00 0.00 0.00 0.00 0.00 0.00 0.00 0.00 0.00
0.0000 0.0000 0.0000 0.0000 0.0000 0.0000 0.0000 0.0000 0.0000 0.0000 0.0000 0.0000 0.0000 0.0000 0.0000 0.0000 0.0000 0.0000 0.0000
0.0000 0.0000 0.0000 0.0000 0.0000 0.0000 0.0000 0.0000 0.0000 0.0000 0.0000 0.0000 0.0000 0.0000 0.0000 0.0000 0.0000 0.0000 0.0000
0.0000 0.0000 0.0000 0.0000 0.0000 0.0000 0.0000 0.0000 0.0000 0.0000 0.0000 0.0000 0.0000 0.0000 0.0000 0.0000 0.0000 0.0000 0.0000
0.0000 0.0000 0.0000 0.0000 0.0000 0.0000 0.0000 0.0000 0.0000 0.0000 0.0000 0.0000 0.0000 0.0000 0.0000 0.0000 0.0000 0.0000 0.0000
0.0000 0.0000 0.0000 0.0000 0.0000 0.0000 0.0000 0.0000 0.0000 0.0000 0.0000 0.0000 0.0000 0.0000 0.0000 0.0000 0.0000 0.0000 0.0000
0.00 0.00 0.00 0.00 0.00 0.00 0.00 0.00 0.00 0.00 0.00 0.00 0.00 0.00 0.00 0.00 0.00 0.00 0.00
0.00 0.00 0.00 0.00 0.00 0.00 0.00 0.00 0.00 0.00 0.00 0.00 0.00 0.00 0.00 0.00 0.00 0.00 0.00
0.02 0.02 0.02 0.02 0.02 0.02 0.02 0.02 0.02 0.02 0.02 0.02 0.02 0.02 0.02 0.02 0.02 0.02 0.02
0.00 0.00 0.00 0.00 0.00 0.00 0.00 0.00 0.00 0.00 0.00 0.00 0.00 0.00 0.00 0.00 0.00 0.00 0.00
10.54 10.54 10.55 10.55 10.55 10.56 10.56 10.56 10.56 10.57 10.57 10.57 10.58 10.58 10.58 10.59 10.59 10.59 10.59
0.00 0.00 0.00 0.00 0.00 0.00 0.00 0.00 0.00 0.00 0.00 0.00 0.00 0.00 0.00 0.00 0.00 0.00 0.00
0.11 0.11 0.11 0.11 0.11 0.11 0.11 0.11 0.11 0.11 0.11 0.11 0.11 0.11 0.11 0.11 0.11 0.11 0.11
0 0 0 0 0 0 0 0 0 0 0 0 0 0 0 0 0 0 0
Page 6 of 7 Producing Wells Only, Mean Values 5/15/201812:30 AM

Yr‐MoOil Volume
Existing ProductionWorkovers ‐ SI or BP
Workovers ‐ RDSUndeveloped
Number of Producing WellsExisting Production
SI WellsLateral JettingUndeveloped
SKN Oil ProductionDaily Production
Monthly Oil MMbblsSKN Revenue
Total ProductionTotal Project Revenue M$
WorkoversNew Wells
CAPEX TOTAL
Fixed Opex+OHFloating Opex
WorkoversTotal SKN Opex
OPEX TOTAL
Recoverable OpexContractor Opex Cost Oil
Unrecovered OpexCapex recovery LimitRecoverable Capex
Contractor Capex Cost OilUnrecovered Capex
Total Cost Oil
Total Profit OilContractor Profit Oil
Govt. Profit OilTotal Contrctr Cost and Profit Oil, MMBbl
Evaluated Net Oil, MMBbl
Cash FlowDCF @10%
Cumulative CF
Total Costs Incurred for Production, MM$Cumulative Total Costs, MM$
Cntrctr's Total Profit from Sales of Oil, MM$Cumulative Total Profit, MM$
Payout? 1=yes, 0=no
SKN
Profit Sh
are
SKN
CAPE
X
Brent Oil Price
Reve
nue
SKN
Prod
uctio
n
SKN
Ope
x
SKN
Cost Recov
ery
SKN
SKN
Paym
ent
Date SKN
Cash
Flow
Jul‐27 Aug‐27 Sep‐27 Oct‐27 Nov‐27 Dec‐27
5 5 5 5 5 4
0 0 0 0 0 0
0 0 0 0 0 0
0 0 0 0 0 0
3 3 3 3 3 3
3 3 3 3 3 3
0 0 0 0 0 0
0 0 0 0 0 0
0 0 0 0 0 0
79.45 79.45 79.45 79.45 79.45 79.45
5 5 5 5 5 4
0 0 0 0 0 0
0.0000 0.0000 0.0000 0.0000 0.0000 0.0000
0.00 0.00 0.00 0.00 0.00 0.00
5 5 5 5 5 4
0.00 0.00 0.00 0.00 0.00 0.00
0 0 0 0 0 0
0 0 0 0 0 0
0.00 0.00 0.00 0.00 0.00 0.00
0.003 0.003 0.003 0.003 0.003 0.003
0.0000 0.0000 0.0000 0.0000 0.0000 0.0000
0.00 0.00 0.00 0.00 0.00 0.00
0.00 0.00 0.00 0.00 0.00 0.00
0.00 0.00 0.00 0.00 0.00 0.00
0.0000 0.0000 0.0000 0.0000 0.0000 0.0000
0.0000 0.0000 0.0000 0.0000 0.0000 0.0000
0.0000 0.0000 0.0000 0.0000 0.0000 0.0000
0.00 0.00 0.00 0.00 0.00 0.00
0.00 0.00 0.00 0.00 0.00 0.00
0.00 0.00 0.00 0.00 0.00 0.00
0.00 0.00 0.00 0.00 0.00 0.00
0.00 0.00 0.00 0.00 0.00 0.00
0.0000 0.0000 0.0000 0.0000 0.0000 0.0000
0.0000 0.0000 0.0000 0.0000 0.0000 0.0000
0.0000 0.0000 0.0000 0.0000 0.0000 0.0000
0.0000 0.0000 0.0000 0.0000 0.0000 0.0000
0.0000 0.0000 0.0000 0.0000 0.0000 0.0000
0.00 0.00 0.00 0.00 0.00 0.00
0.00 0.00 0.00 0.00 0.00 0.00
0.02 0.02 0.02 0.02 0.02 0.02
0.00 0.00 0.00 0.00 0.00 0.00
10.60 10.60 10.60 10.61 10.61 10.61
0.00 0.00 0.00 0.00 0.00 0.00
0.11 0.11 0.11 0.11 0.11 0.11
0 0 0 0 0 0
Page 7 of 7 Producing Wells Only, Mean Values 5/15/201812:30 AM

Yr‐Mo Units Total Jan‐18 Feb‐18 Mar‐18 Apr‐18 May‐18 Jun‐18 Jul‐18 Aug‐18 Sep‐18 Oct‐18 Nov‐18 Dec‐18 Jan‐19 Feb‐19 Mar‐19 Apr‐19 May‐19
Oil VolumeExisting Production Bbl 1,443 38 37 36 35 34 33 32 32 31 30 29 29 28 27 26 26 25
Workovers ‐ SI or BP Bbl 9,177 0 0 245 239 232 227 221 215 210 204 199 194 189 185 180 175 171
Workovers ‐ RDS Bbl 0 0 0 0 0 0 0 0 0 0 0 0 0 0 0 0 0 0
Undeveloped Bbl 0 0 0 0 0 0 0 0 0 0 0 0 0 0 0 0 0 0
Number of Producing Wells Wells 5 5 5 5 5 5 5 5 5 5 5 5 5 5 5 5 5
Existing Production Wells 5 5 2 2 2 2 2 2 2 2 2 2 2 2 2 2 2
SI Wells Wells 0 0 3 3 3 3 3 3 3 3 3 3 3 3 3 3 3
Lateral Jetting 0 0 0 0 0 0 0 0 0 0 0 0 0 0 0 0 0
Undeveloped Wells 0 0 0 0 0 0 0 0 0 0 0 0 0 0 0 0 0
$/Bbl 60.56 60.56 60.56 60.56 60.56 60.56 60.56 60.56 60.56 60.56 60.56 60.56 62.81 62.81 62.81 62.81 62.81
SKN Oil Production BOPM 10,620 38 37 280 273 266 260 253 247 241 234 229 223 217 212 206 201 196
Daily Production BOPD 1 1 10 9 9 9 9 9 8 8 8 8 8 7 7 7 7
Monthly Oil MMbbls MMBbl 0.0106 0.0000 0.0000 0.0003 0.0003 0.0003 0.0003 0.0003 0.0002 0.0002 0.0002 0.0002 0.0002 0.0002 0.0002 0.0002 0.0002 0.0002
SKN Revenue M$ 0.6 0.00 0.00 0.01 0.01 0.01 0.01 0.01 0.01 0.01 0.01 0.01 0.01 0.01 0.01 0.01 0.01
Total Production Bbl 10,620 38 37 280 273 266 260 253 247 241 234 229 223 217 212 206 201 196
Total Project Revenue M$ M$ 0.6 0.00 0.00 0.00 0.01 0.01 0.01 0.01 0.01 0.01 0.01 0.01 0.01 0.01 0.01 0.01 0.01 0.01
Workovers MM$ 0.0 0 0 0.032 0 0 0 0 0 0 0 0 0 0 0 0 0 0
New Wells MM$ 0.0 0 0 0 0 0 0 0 0 0 0 0 0 0 0 0 0 0
CAPEX TOTAL MM$ 0.0 0.00 0.00 0.03 0.00 0.00 0.00 0.00 0.00 0.00 0.00 0.00 0.00 0.00 0.00 0.00 0.00 0.00
Fixed Opex+OH MM$ 0.3 0.003 0.003 0.003 0.003 0.003 0.003 0.003 0.003 0.003 0.003 0.003 0.003 0.003 0.003 0.003 0.003 0.003
Floating Opex MM$ 0.0152 0.0001 0.0001 0.0004 0.0004 0.0004 0.0004 0.0004 0.0004 0.0003 0.0003 0.0003 0.0003 0.0003 0.0003 0.0003 0.0003 0.0003
Workovers MM$ 0.0 0.00 0.00 0.00 0.00 0.00 0.00 0.00 0.00 0.00 0.00 0.00 0.00 0.00 0.00 0.00 0.00 0.00
Total SKN Opex MM$ 0.3 0.00 0.00 0.00 0.00 0.00 0.00 0.00 0.00 0.00 0.00 0.00 0.00 0.00 0.00 0.00 0.00 0.00
OPEX TOTAL MM$ 0.3 0.00 0.00 0.00 0.00 0.00 0.00 0.00 0.00 0.00 0.00 0.00 0.00 0.00 0.00 0.00 0.00 0.00
Recoverable Opex MM$ 0.22 0.0026 0.0026 0.0029 0.0029 0.0029 0.0029 0.0029 0.0029 0.0028 0.0028 0.0028 0.0028 0.0029 0.0029 0.0029 0.0029 0.0028
Contractor Opex Cost Oil MM$ 0.22 0.0000 0.0019 0.0019 0.0071 0.0029 0.0029 0.0029 0.0029 0.0028 0.0028 0.0028 0.0028 0.0029 0.0029 0.0029 0.0029 0.0028
Unrecovered Opex MM$ 0.0026 0.0032 0.0042 0.0000 0.0000 0.0000 0.0000 0.0000 0.0000 0.0000 0.0000 0.0000 0.0000 0.0000 0.0000 0.0000 0.0000
Capex recovery Limit MM$ 0.00 0.00 0.00 0.00 0.01 0.01 0.01 0.01 0.00 0.00 0.00 0.00 0.00 0.00 0.00 0.00 0.00
Recoverable Capex MM$ 10.28 10.28 10.31 10.31 10.30 10.30 10.29 10.29 10.28 10.28 10.27 10.27 10.26 10.26 10.26 10.25 10.25
Contractor Capex Cost Oil MM$ 0.16 0.00 0.00 0.00 0.00 0.01 0.01 0.01 0.01 0.00 0.00 0.00 0.00 0.00 0.00 0.00 0.00 0.00
Unrecovered Capex MM$ 10.28 10.28 10.31 10.30 10.30 10.29 10.29 10.28 10.28 10.27 10.27 10.26 10.26 10.26 10.25 10.25 10.24
Total Cost Oil MM$ 0.00 0.00 0.00 0.01 0.01 0.01 0.01 0.01 0.01 0.01 0.01 0.01 0.01 0.01 0.01 0.01 0.01
Total Profit Oil MM$ 0.1614 0.0000 0.0000 0.0000 0.0037 0.0056 0.0054 0.0053 0.0051 0.0049 0.0048 0.0046 0.0045 0.0043 0.0044 0.0043 0.0041 0.0040
Contractor Profit Oil MM$ 0.0807 0.0000 0.0000 0.0000 0.0018 0.0028 0.0027 0.0026 0.0025 0.0025 0.0024 0.0023 0.0022 0.0022 0.0022 0.0021 0.0021 0.0020
Govt. Profit Oil MM$ 0.0807 0.0000 0.0000 0.0000 0.0018 0.0028 0.0027 0.0026 0.0025 0.0025 0.0024 0.0023 0.0022 0.0022 0.0022 0.0021 0.0021 0.0020
Total Contrctr Cost and Profit Oil, MMBbl MMBbl 0.0080 0.0000 0.0000 0.0000 0.0002 0.0002 0.0002 0.0002 0.0002 0.0002 0.0002 0.0002 0.0002 0.0002 0.0002 0.0002 0.0002 0.0002
Evaluated Net Oil, MMBbl MMBbl 0.0072 0.0000 0.0000 0.0000 0.0002 0.0002 0.0002 0.0002 0.0002 0.0002 0.0002 0.0002 0.0002 0.0002 0.0002 0.0002 0.0002 0.0001
Cash Flow MM$ 0.19 0.00 0.00 ‐0.03 0.01 0.01 0.01 0.01 0.01 0.01 0.01 0.01 0.01 0.01 0.01 0.01 0.01 0.01
DCF @10% MM$ 0.15 0.00 0.00 ‐0.03 0.01 0.01 0.01 0.01 0.01 0.01 0.01 0.01 0.01 0.01 0.01 0.01 0.00 0.00
Cumulative CF 0.00 0.00 ‐0.04 ‐0.03 ‐0.02 ‐0.01 0.00 0.00 0.01 0.02 0.02 0.03 0.04 0.04 0.05 0.05 0.06
Total Costs Incurred for Production, MM$ MM$ 10.65 10.28 0.00 0.03 0.00 0.00 0.00 0.00 0.00 0.00 0.00 0.00 0.00 0.00 0.00 0.00 0.00 0.00
Cumulative Total Costs, MM$ MM$ 10.65 10.28 10.28 10.32 10.32 10.32 10.32 10.33 10.33 10.33 10.34 10.34 10.34 10.34 10.35 10.35 10.35 10.36
Cntrctr's Total Profit from Sales of Oil, MM$ MM$ 0.46 0.00 0.00 0.00 0.01 0.01 0.01 0.01 0.01 0.01 0.01 0.01 0.01 0.01 0.01 0.01 0.01 0.01
Cumulative Total Profit, MM$ MM$ 0.46 0.00 0.00 0.00 0.02 0.03 0.04 0.05 0.06 0.07 0.08 0.09 0.10 0.11 0.12 0.13 0.14 0.15
Payout? 1=yes, 0=no 0 0 0 0 0 0 0 0 0 0 0 0 0 0 0 0 0
SKN
Profit Sh
are
SKN
CAPE
X
Brent Oil Price
Reve
nue
SKN
Prod
uctio
n
SKN
Ope
x
SKN
Cost Recov
ery
SKN
SKN
Paym
ent
Date SKN
Cash
Flow
Page 1 of 7 Producing Wells + Workovers, Mean Values 5/15/201812:28 AM

Yr‐MoOil Volume
Existing ProductionWorkovers ‐ SI or BP
Workovers ‐ RDSUndeveloped
Number of Producing WellsExisting Production
SI WellsLateral JettingUndeveloped
SKN Oil ProductionDaily Production
Monthly Oil MMbblsSKN Revenue
Total ProductionTotal Project Revenue M$
WorkoversNew Wells
CAPEX TOTAL
Fixed Opex+OHFloating Opex
WorkoversTotal SKN Opex
OPEX TOTAL
Recoverable OpexContractor Opex Cost Oil
Unrecovered OpexCapex recovery LimitRecoverable Capex
Contractor Capex Cost OilUnrecovered Capex
Total Cost Oil
Total Profit OilContractor Profit Oil
Govt. Profit OilTotal Contrctr Cost and Profit Oil, MMBbl
Evaluated Net Oil, MMBbl
Cash FlowDCF @10%
Cumulative CF
Total Costs Incurred for Production, MM$Cumulative Total Costs, MM$
Cntrctr's Total Profit from Sales of Oil, MM$Cumulative Total Profit, MM$
Payout? 1=yes, 0=no
SKN
Profit Sh
are
SKN
CAPE
X
Brent Oil Price
Reve
nue
SKN
Prod
uctio
n
SKN
Ope
x
SKN
Cost Recov
ery
SKN
SKN
Paym
ent
Date SKN
Cash
Flow
Jun‐19 Jul‐19 Aug‐19 Sep‐19 Oct‐19 Nov‐19 Dec‐19 Jan‐20 Feb‐20 Mar‐20 Apr‐20 May‐20 Jun‐20 Jul‐20 Aug‐20 Sep‐20 Oct‐20 Nov‐20 Dec‐20 Jan‐21
25 24 23 23 22 22 21 21 20 20 19 19 18 18 17 17 16 16 16 15
167 162 158 154 150 146 143 139 136 132 129 126 122 119 116 113 110 108 105 102
0 0 0 0 0 0 0 0 0 0 0 0 0 0 0 0 0 0 0 0
0 0 0 0 0 0 0 0 0 0 0 0 0 0 0 0 0 0 0 0
5 5 5 5 5 5 5 5 5 5 5 5 5 5 5 5 5 5 5 5
2 2 2 2 2 2 2 2 2 2 2 2 2 2 2 2 2 2 2 2
3 3 3 3 3 3 3 3 3 3 3 3 3 3 3 3 3 3 3 3
0 0 0 0 0 0 0 0 0 0 0 0 0 0 0 0 0 0 0 0
0 0 0 0 0 0 0 0 0 0 0 0 0 0 0 0 0 0 0 0
62.81 62.81 62.81 62.81 62.81 62.81 62.81 65.80 65.80 65.80 65.80 65.80 65.80 65.80 65.80 65.80 65.80 65.80 65.80 70.70
191 186 182 177 172 168 164 160 156 152 148 144 141 137 134 130 127 124 121 117
7 6 6 6 6 6 6 6 5 5 5 5 5 5 5 5 4 4 4 4
0.0002 0.0002 0.0002 0.0002 0.0002 0.0002 0.0002 0.0002 0.0002 0.0002 0.0001 0.0001 0.0001 0.0001 0.0001 0.0001 0.0001 0.0001 0.0001 0.0001
0.01 0.01 0.01 0.01 0.01 0.01 0.01 0.01 0.01 0.01 0.01 0.01 0.01 0.01 0.01 0.01 0.01 0.01 0.01 0.01
191 186 182 177 172 168 164 160 156 152 148 144 141 137 134 130 127 124 121 117
0.01 0.01 0.01 0.01 0.01 0.01 0.01 0.01 0.01 0.01 0.01 0.01 0.01 0.01 0.01 0.01 0.01 0.01 0.01 0.01
0 0 0 0 0 0 0 0 0 0 0 0 0 0 0 0 0 0 0 0
0 0 0 0 0 0 0 0 0 0 0 0 0 0 0 0 0 0 0 0
0.00 0.00 0.00 0.00 0.00 0.00 0.00 0.00 0.00 0.00 0.00 0.00 0.00 0.00 0.00 0.00 0.00 0.00 0.00 0.00
0.003 0.003 0.003 0.003 0.003 0.003 0.003 0.003 0.003 0.003 0.003 0.003 0.003 0.003 0.003 0.003 0.003 0.003 0.003 0.003
0.0003 0.0003 0.0003 0.0003 0.0002 0.0002 0.0002 0.0002 0.0002 0.0002 0.0002 0.0002 0.0002 0.0002 0.0002 0.0002 0.0002 0.0002 0.0002 0.0002
0.00 0.00 0.00 0.00 0.00 0.00 0.00 0.00 0.00 0.00 0.00 0.00 0.00 0.00 0.00 0.00 0.00 0.00 0.00 0.00
0.00 0.00 0.00 0.00 0.00 0.00 0.00 0.00 0.00 0.00 0.00 0.00 0.00 0.00 0.00 0.00 0.00 0.00 0.00 0.00
0.00 0.00 0.00 0.00 0.00 0.00 0.00 0.00 0.00 0.00 0.00 0.00 0.00 0.00 0.00 0.00 0.00 0.00 0.00 0.00
0.0028 0.0028 0.0028 0.0028 0.0028 0.0028 0.0028 0.0028 0.0028 0.0028 0.0028 0.0028 0.0028 0.0028 0.0028 0.0028 0.0028 0.0028 0.0028 0.0028
0.0028 0.0028 0.0028 0.0028 0.0028 0.0028 0.0028 0.0028 0.0028 0.0028 0.0028 0.0028 0.0028 0.0028 0.0028 0.0028 0.0028 0.0028 0.0028 0.0028
0.0000 0.0000 0.0000 0.0000 0.0000 0.0000 0.0000 0.0000 0.0000 0.0000 0.0000 0.0000 0.0000 0.0000 0.0000 0.0000 0.0000 0.0000 0.0000 0.0000
0.00 0.00 0.00 0.00 0.00 0.00 0.00 0.00 0.00 0.00 0.00 0.00 0.00 0.00 0.00 0.00 0.00 0.00 0.00 0.00
10.24 10.24 10.24 10.23 10.23 10.22 10.22 10.22 10.22 10.21 10.21 10.21 10.20 10.20 10.20 10.20 10.19 10.19 10.19 10.19
0.00 0.00 0.00 0.00 0.00 0.00 0.00 0.00 0.00 0.00 0.00 0.00 0.00 0.00 0.00 0.00 0.00 0.00 0.00 0.00
10.24 10.24 10.23 10.23 10.22 10.22 10.22 10.22 10.21 10.21 10.21 10.20 10.20 10.20 10.20 10.19 10.19 10.19 10.19 10.19
0.01 0.01 0.01 0.01 0.01 0.01 0.01 0.01 0.01 0.01 0.01 0.01 0.01 0.01 0.01 0.01 0.01 0.01 0.00 0.00
0.0039 0.0037 0.0036 0.0035 0.0033 0.0032 0.0031 0.0030 0.0031 0.0030 0.0029 0.0028 0.0027 0.0026 0.0025 0.0024 0.0023 0.0022 0.0021 0.0020
0.0019 0.0019 0.0018 0.0017 0.0017 0.0016 0.0016 0.0015 0.0016 0.0015 0.0014 0.0014 0.0013 0.0013 0.0012 0.0012 0.0011 0.0011 0.0011 0.0010
0.0019 0.0019 0.0018 0.0017 0.0017 0.0016 0.0016 0.0015 0.0016 0.0015 0.0014 0.0014 0.0013 0.0013 0.0012 0.0012 0.0011 0.0011 0.0011 0.0010
0.0002 0.0002 0.0002 0.0001 0.0001 0.0001 0.0001 0.0001 0.0001 0.0001 0.0001 0.0001 0.0001 0.0001 0.0001 0.0001 0.0001 0.0001 0.0001 0.0001
0.0001 0.0001 0.0001 0.0001 0.0001 0.0001 0.0001 0.0001 0.0001 0.0001 0.0001 0.0001 0.0001 0.0001 0.0001 0.0001 0.0001 0.0001 0.0001 0.0001
0.01 0.01 0.00 0.00 0.00 0.00 0.00 0.00 0.00 0.00 0.00 0.00 0.00 0.00 0.00 0.00 0.00 0.00 0.00 0.00
0.00 0.00 0.00 0.00 0.00 0.00 0.00 0.00 0.00 0.00 0.00 0.00 0.00 0.00 0.00 0.00 0.00 0.00 0.00 0.00
0.06 0.07 0.07 0.08 0.08 0.09 0.09 0.10 0.10 0.10 0.11 0.11 0.12 0.12 0.12 0.13 0.13 0.13 0.13 0.14
0.00 0.00 0.00 0.00 0.00 0.00 0.00 0.00 0.00 0.00 0.00 0.00 0.00 0.00 0.00 0.00 0.00 0.00 0.00 0.00
10.36 10.36 10.36 10.37 10.37 10.37 10.38 10.38 10.38 10.38 10.39 10.39 10.39 10.40 10.40 10.40 10.40 10.41 10.41 10.41
0.01 0.01 0.01 0.01 0.01 0.01 0.01 0.01 0.01 0.01 0.01 0.01 0.01 0.01 0.01 0.01 0.01 0.01 0.01 0.01
0.15 0.16 0.17 0.18 0.19 0.19 0.20 0.21 0.22 0.22 0.23 0.24 0.25 0.25 0.26 0.26 0.27 0.28 0.28 0.29
0 0 0 0 0 0 0 0 0 0 0 0 0 0 0 0 0 0 0 0
Page 2 of 7 Producing Wells + Workovers, Mean Values 5/15/201812:28 AM
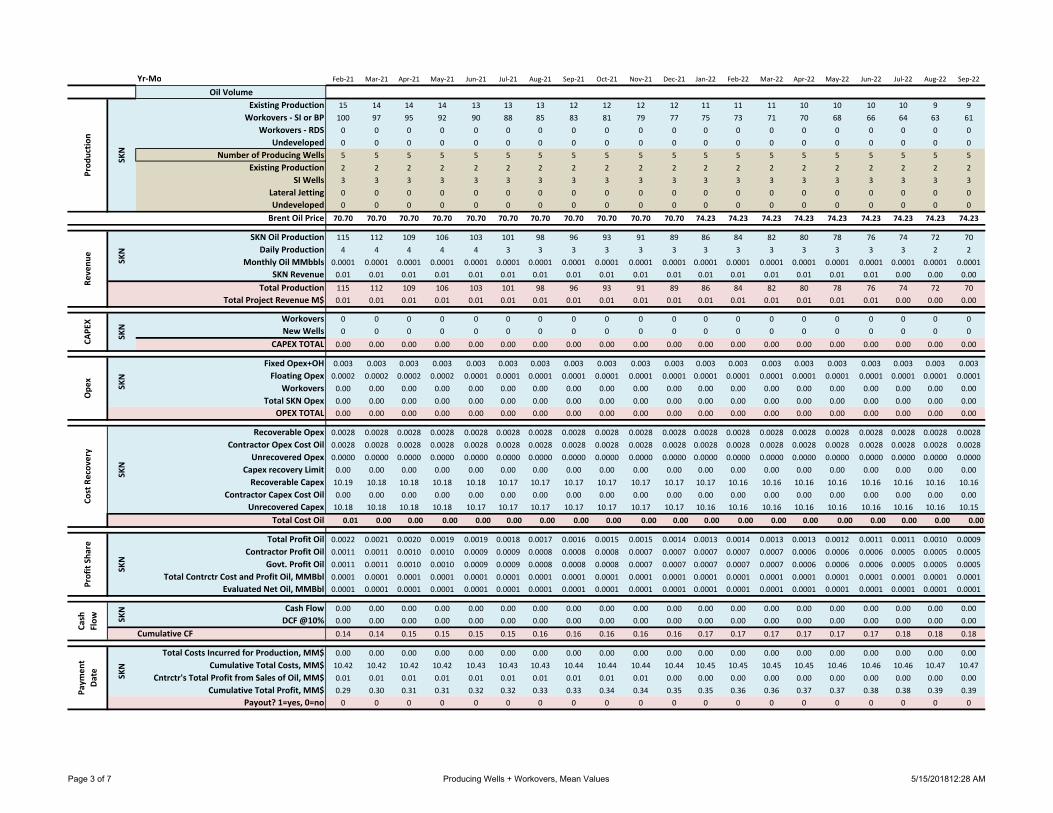
Yr‐MoOil Volume
Existing ProductionWorkovers ‐ SI or BP
Workovers ‐ RDSUndeveloped
Number of Producing WellsExisting Production
SI WellsLateral JettingUndeveloped
SKN Oil ProductionDaily Production
Monthly Oil MMbblsSKN Revenue
Total ProductionTotal Project Revenue M$
WorkoversNew Wells
CAPEX TOTAL
Fixed Opex+OHFloating Opex
WorkoversTotal SKN Opex
OPEX TOTAL
Recoverable OpexContractor Opex Cost Oil
Unrecovered OpexCapex recovery LimitRecoverable Capex
Contractor Capex Cost OilUnrecovered Capex
Total Cost Oil
Total Profit OilContractor Profit Oil
Govt. Profit OilTotal Contrctr Cost and Profit Oil, MMBbl
Evaluated Net Oil, MMBbl
Cash FlowDCF @10%
Cumulative CF
Total Costs Incurred for Production, MM$Cumulative Total Costs, MM$
Cntrctr's Total Profit from Sales of Oil, MM$Cumulative Total Profit, MM$
Payout? 1=yes, 0=no
SKN
Profit Sh
are
SKN
CAPE
X
Brent Oil Price
Reve
nue
SKN
Prod
uctio
n
SKN
Ope
x
SKN
Cost Recov
ery
SKN
SKN
Paym
ent
Date SKN
Cash
Flow
Feb‐21 Mar‐21 Apr‐21 May‐21 Jun‐21 Jul‐21 Aug‐21 Sep‐21 Oct‐21 Nov‐21 Dec‐21 Jan‐22 Feb‐22 Mar‐22 Apr‐22 May‐22 Jun‐22 Jul‐22 Aug‐22 Sep‐22
15 14 14 14 13 13 13 12 12 12 12 11 11 11 10 10 10 10 9 9
100 97 95 92 90 88 85 83 81 79 77 75 73 71 70 68 66 64 63 61
0 0 0 0 0 0 0 0 0 0 0 0 0 0 0 0 0 0 0 0
0 0 0 0 0 0 0 0 0 0 0 0 0 0 0 0 0 0 0 0
5 5 5 5 5 5 5 5 5 5 5 5 5 5 5 5 5 5 5 5
2 2 2 2 2 2 2 2 2 2 2 2 2 2 2 2 2 2 2 2
3 3 3 3 3 3 3 3 3 3 3 3 3 3 3 3 3 3 3 3
0 0 0 0 0 0 0 0 0 0 0 0 0 0 0 0 0 0 0 0
0 0 0 0 0 0 0 0 0 0 0 0 0 0 0 0 0 0 0 0
70.70 70.70 70.70 70.70 70.70 70.70 70.70 70.70 70.70 70.70 70.70 74.23 74.23 74.23 74.23 74.23 74.23 74.23 74.23 74.23
115 112 109 106 103 101 98 96 93 91 89 86 84 82 80 78 76 74 72 70
4 4 4 4 4 3 3 3 3 3 3 3 3 3 3 3 3 3 2 2
0.0001 0.0001 0.0001 0.0001 0.0001 0.0001 0.0001 0.0001 0.0001 0.0001 0.0001 0.0001 0.0001 0.0001 0.0001 0.0001 0.0001 0.0001 0.0001 0.0001
0.01 0.01 0.01 0.01 0.01 0.01 0.01 0.01 0.01 0.01 0.01 0.01 0.01 0.01 0.01 0.01 0.01 0.00 0.00 0.00
115 112 109 106 103 101 98 96 93 91 89 86 84 82 80 78 76 74 72 70
0.01 0.01 0.01 0.01 0.01 0.01 0.01 0.01 0.01 0.01 0.01 0.01 0.01 0.01 0.01 0.01 0.01 0.00 0.00 0.00
0 0 0 0 0 0 0 0 0 0 0 0 0 0 0 0 0 0 0 0
0 0 0 0 0 0 0 0 0 0 0 0 0 0 0 0 0 0 0 0
0.00 0.00 0.00 0.00 0.00 0.00 0.00 0.00 0.00 0.00 0.00 0.00 0.00 0.00 0.00 0.00 0.00 0.00 0.00 0.00
0.003 0.003 0.003 0.003 0.003 0.003 0.003 0.003 0.003 0.003 0.003 0.003 0.003 0.003 0.003 0.003 0.003 0.003 0.003 0.003
0.0002 0.0002 0.0002 0.0002 0.0001 0.0001 0.0001 0.0001 0.0001 0.0001 0.0001 0.0001 0.0001 0.0001 0.0001 0.0001 0.0001 0.0001 0.0001 0.0001
0.00 0.00 0.00 0.00 0.00 0.00 0.00 0.00 0.00 0.00 0.00 0.00 0.00 0.00 0.00 0.00 0.00 0.00 0.00 0.00
0.00 0.00 0.00 0.00 0.00 0.00 0.00 0.00 0.00 0.00 0.00 0.00 0.00 0.00 0.00 0.00 0.00 0.00 0.00 0.00
0.00 0.00 0.00 0.00 0.00 0.00 0.00 0.00 0.00 0.00 0.00 0.00 0.00 0.00 0.00 0.00 0.00 0.00 0.00 0.00
0.0028 0.0028 0.0028 0.0028 0.0028 0.0028 0.0028 0.0028 0.0028 0.0028 0.0028 0.0028 0.0028 0.0028 0.0028 0.0028 0.0028 0.0028 0.0028 0.0028
0.0028 0.0028 0.0028 0.0028 0.0028 0.0028 0.0028 0.0028 0.0028 0.0028 0.0028 0.0028 0.0028 0.0028 0.0028 0.0028 0.0028 0.0028 0.0028 0.0028
0.0000 0.0000 0.0000 0.0000 0.0000 0.0000 0.0000 0.0000 0.0000 0.0000 0.0000 0.0000 0.0000 0.0000 0.0000 0.0000 0.0000 0.0000 0.0000 0.0000
0.00 0.00 0.00 0.00 0.00 0.00 0.00 0.00 0.00 0.00 0.00 0.00 0.00 0.00 0.00 0.00 0.00 0.00 0.00 0.00
10.19 10.18 10.18 10.18 10.18 10.17 10.17 10.17 10.17 10.17 10.17 10.17 10.16 10.16 10.16 10.16 10.16 10.16 10.16 10.16
0.00 0.00 0.00 0.00 0.00 0.00 0.00 0.00 0.00 0.00 0.00 0.00 0.00 0.00 0.00 0.00 0.00 0.00 0.00 0.00
10.18 10.18 10.18 10.18 10.17 10.17 10.17 10.17 10.17 10.17 10.17 10.16 10.16 10.16 10.16 10.16 10.16 10.16 10.16 10.15
0.01 0.00 0.00 0.00 0.00 0.00 0.00 0.00 0.00 0.00 0.00 0.00 0.00 0.00 0.00 0.00 0.00 0.00 0.00 0.00
0.0022 0.0021 0.0020 0.0019 0.0019 0.0018 0.0017 0.0016 0.0015 0.0015 0.0014 0.0013 0.0014 0.0013 0.0013 0.0012 0.0011 0.0011 0.0010 0.0009
0.0011 0.0011 0.0010 0.0010 0.0009 0.0009 0.0008 0.0008 0.0008 0.0007 0.0007 0.0007 0.0007 0.0007 0.0006 0.0006 0.0006 0.0005 0.0005 0.0005
0.0011 0.0011 0.0010 0.0010 0.0009 0.0009 0.0008 0.0008 0.0008 0.0007 0.0007 0.0007 0.0007 0.0007 0.0006 0.0006 0.0006 0.0005 0.0005 0.0005
0.0001 0.0001 0.0001 0.0001 0.0001 0.0001 0.0001 0.0001 0.0001 0.0001 0.0001 0.0001 0.0001 0.0001 0.0001 0.0001 0.0001 0.0001 0.0001 0.0001
0.0001 0.0001 0.0001 0.0001 0.0001 0.0001 0.0001 0.0001 0.0001 0.0001 0.0001 0.0001 0.0001 0.0001 0.0001 0.0001 0.0001 0.0001 0.0001 0.0001
0.00 0.00 0.00 0.00 0.00 0.00 0.00 0.00 0.00 0.00 0.00 0.00 0.00 0.00 0.00 0.00 0.00 0.00 0.00 0.00
0.00 0.00 0.00 0.00 0.00 0.00 0.00 0.00 0.00 0.00 0.00 0.00 0.00 0.00 0.00 0.00 0.00 0.00 0.00 0.00
0.14 0.14 0.15 0.15 0.15 0.15 0.16 0.16 0.16 0.16 0.16 0.17 0.17 0.17 0.17 0.17 0.17 0.18 0.18 0.18
0.00 0.00 0.00 0.00 0.00 0.00 0.00 0.00 0.00 0.00 0.00 0.00 0.00 0.00 0.00 0.00 0.00 0.00 0.00 0.00
10.42 10.42 10.42 10.42 10.43 10.43 10.43 10.44 10.44 10.44 10.44 10.45 10.45 10.45 10.45 10.46 10.46 10.46 10.47 10.47
0.01 0.01 0.01 0.01 0.01 0.01 0.01 0.01 0.01 0.01 0.00 0.00 0.00 0.00 0.00 0.00 0.00 0.00 0.00 0.00
0.29 0.30 0.31 0.31 0.32 0.32 0.33 0.33 0.34 0.34 0.35 0.35 0.36 0.36 0.37 0.37 0.38 0.38 0.39 0.39
0 0 0 0 0 0 0 0 0 0 0 0 0 0 0 0 0 0 0 0
Page 3 of 7 Producing Wells + Workovers, Mean Values 5/15/201812:28 AM
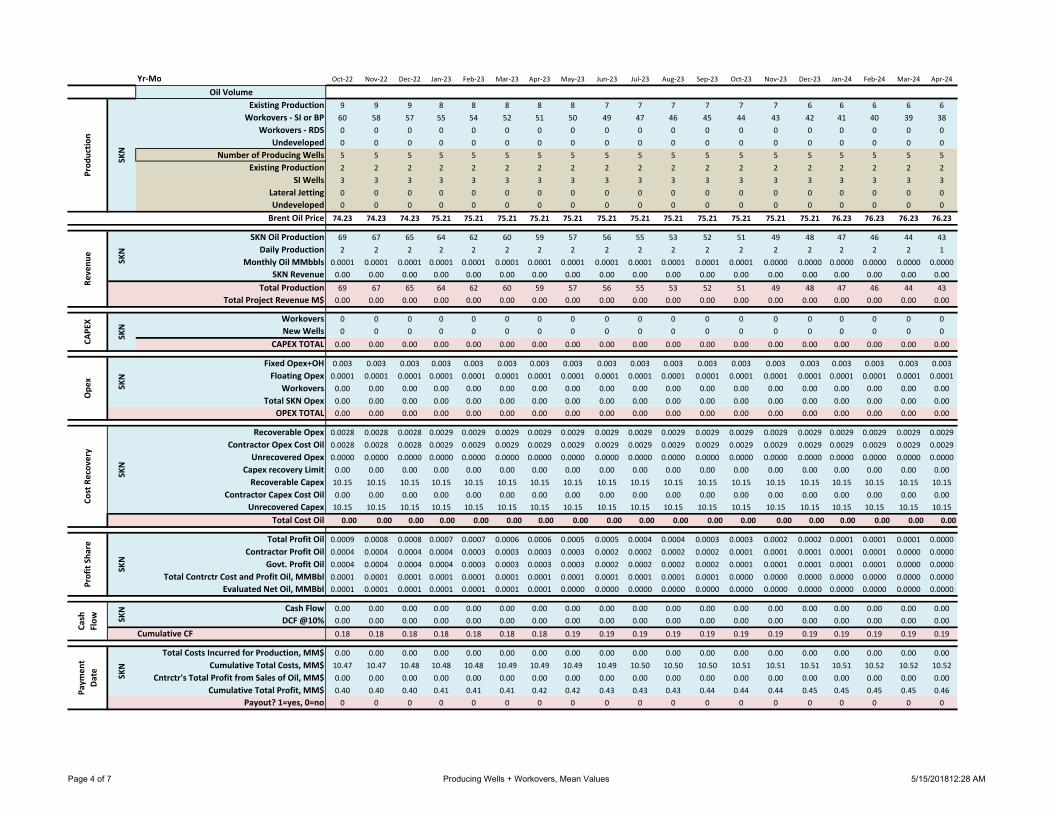
Yr‐MoOil Volume
Existing ProductionWorkovers ‐ SI or BP
Workovers ‐ RDSUndeveloped
Number of Producing WellsExisting Production
SI WellsLateral JettingUndeveloped
SKN Oil ProductionDaily Production
Monthly Oil MMbblsSKN Revenue
Total ProductionTotal Project Revenue M$
WorkoversNew Wells
CAPEX TOTAL
Fixed Opex+OHFloating Opex
WorkoversTotal SKN Opex
OPEX TOTAL
Recoverable OpexContractor Opex Cost Oil
Unrecovered OpexCapex recovery LimitRecoverable Capex
Contractor Capex Cost OilUnrecovered Capex
Total Cost Oil
Total Profit OilContractor Profit Oil
Govt. Profit OilTotal Contrctr Cost and Profit Oil, MMBbl
Evaluated Net Oil, MMBbl
Cash FlowDCF @10%
Cumulative CF
Total Costs Incurred for Production, MM$Cumulative Total Costs, MM$
Cntrctr's Total Profit from Sales of Oil, MM$Cumulative Total Profit, MM$
Payout? 1=yes, 0=no
SKN
Profit Sh
are
SKN
CAPE
X
Brent Oil Price
Reve
nue
SKN
Prod
uctio
n
SKN
Ope
x
SKN
Cost Recov
ery
SKN
SKN
Paym
ent
Date SKN
Cash
Flow
Oct‐22 Nov‐22 Dec‐22 Jan‐23 Feb‐23 Mar‐23 Apr‐23 May‐23 Jun‐23 Jul‐23 Aug‐23 Sep‐23 Oct‐23 Nov‐23 Dec‐23 Jan‐24 Feb‐24 Mar‐24 Apr‐24
9 9 9 8 8 8 8 8 7 7 7 7 7 7 6 6 6 6 6
60 58 57 55 54 52 51 50 49 47 46 45 44 43 42 41 40 39 38
0 0 0 0 0 0 0 0 0 0 0 0 0 0 0 0 0 0 0
0 0 0 0 0 0 0 0 0 0 0 0 0 0 0 0 0 0 0
5 5 5 5 5 5 5 5 5 5 5 5 5 5 5 5 5 5 5
2 2 2 2 2 2 2 2 2 2 2 2 2 2 2 2 2 2 2
3 3 3 3 3 3 3 3 3 3 3 3 3 3 3 3 3 3 3
0 0 0 0 0 0 0 0 0 0 0 0 0 0 0 0 0 0 0
0 0 0 0 0 0 0 0 0 0 0 0 0 0 0 0 0 0 0
74.23 74.23 74.23 75.21 75.21 75.21 75.21 75.21 75.21 75.21 75.21 75.21 75.21 75.21 75.21 76.23 76.23 76.23 76.23
69 67 65 64 62 60 59 57 56 55 53 52 51 49 48 47 46 44 43
2 2 2 2 2 2 2 2 2 2 2 2 2 2 2 2 2 2 1
0.0001 0.0001 0.0001 0.0001 0.0001 0.0001 0.0001 0.0001 0.0001 0.0001 0.0001 0.0001 0.0001 0.0000 0.0000 0.0000 0.0000 0.0000 0.0000
0.00 0.00 0.00 0.00 0.00 0.00 0.00 0.00 0.00 0.00 0.00 0.00 0.00 0.00 0.00 0.00 0.00 0.00 0.00
69 67 65 64 62 60 59 57 56 55 53 52 51 49 48 47 46 44 43
0.00 0.00 0.00 0.00 0.00 0.00 0.00 0.00 0.00 0.00 0.00 0.00 0.00 0.00 0.00 0.00 0.00 0.00 0.00
0 0 0 0 0 0 0 0 0 0 0 0 0 0 0 0 0 0 0
0 0 0 0 0 0 0 0 0 0 0 0 0 0 0 0 0 0 0
0.00 0.00 0.00 0.00 0.00 0.00 0.00 0.00 0.00 0.00 0.00 0.00 0.00 0.00 0.00 0.00 0.00 0.00 0.00
0.003 0.003 0.003 0.003 0.003 0.003 0.003 0.003 0.003 0.003 0.003 0.003 0.003 0.003 0.003 0.003 0.003 0.003 0.003
0.0001 0.0001 0.0001 0.0001 0.0001 0.0001 0.0001 0.0001 0.0001 0.0001 0.0001 0.0001 0.0001 0.0001 0.0001 0.0001 0.0001 0.0001 0.0001
0.00 0.00 0.00 0.00 0.00 0.00 0.00 0.00 0.00 0.00 0.00 0.00 0.00 0.00 0.00 0.00 0.00 0.00 0.00
0.00 0.00 0.00 0.00 0.00 0.00 0.00 0.00 0.00 0.00 0.00 0.00 0.00 0.00 0.00 0.00 0.00 0.00 0.00
0.00 0.00 0.00 0.00 0.00 0.00 0.00 0.00 0.00 0.00 0.00 0.00 0.00 0.00 0.00 0.00 0.00 0.00 0.00
0.0028 0.0028 0.0028 0.0029 0.0029 0.0029 0.0029 0.0029 0.0029 0.0029 0.0029 0.0029 0.0029 0.0029 0.0029 0.0029 0.0029 0.0029 0.0029
0.0028 0.0028 0.0028 0.0029 0.0029 0.0029 0.0029 0.0029 0.0029 0.0029 0.0029 0.0029 0.0029 0.0029 0.0029 0.0029 0.0029 0.0029 0.0029
0.0000 0.0000 0.0000 0.0000 0.0000 0.0000 0.0000 0.0000 0.0000 0.0000 0.0000 0.0000 0.0000 0.0000 0.0000 0.0000 0.0000 0.0000 0.0000
0.00 0.00 0.00 0.00 0.00 0.00 0.00 0.00 0.00 0.00 0.00 0.00 0.00 0.00 0.00 0.00 0.00 0.00 0.00
10.15 10.15 10.15 10.15 10.15 10.15 10.15 10.15 10.15 10.15 10.15 10.15 10.15 10.15 10.15 10.15 10.15 10.15 10.15
0.00 0.00 0.00 0.00 0.00 0.00 0.00 0.00 0.00 0.00 0.00 0.00 0.00 0.00 0.00 0.00 0.00 0.00 0.00
10.15 10.15 10.15 10.15 10.15 10.15 10.15 10.15 10.15 10.15 10.15 10.15 10.15 10.15 10.15 10.15 10.15 10.15 10.15
0.00 0.00 0.00 0.00 0.00 0.00 0.00 0.00 0.00 0.00 0.00 0.00 0.00 0.00 0.00 0.00 0.00 0.00 0.00
0.0009 0.0008 0.0008 0.0007 0.0007 0.0006 0.0006 0.0005 0.0005 0.0004 0.0004 0.0003 0.0003 0.0002 0.0002 0.0001 0.0001 0.0001 0.0000
0.0004 0.0004 0.0004 0.0004 0.0003 0.0003 0.0003 0.0003 0.0002 0.0002 0.0002 0.0002 0.0001 0.0001 0.0001 0.0001 0.0001 0.0000 0.0000
0.0004 0.0004 0.0004 0.0004 0.0003 0.0003 0.0003 0.0003 0.0002 0.0002 0.0002 0.0002 0.0001 0.0001 0.0001 0.0001 0.0001 0.0000 0.0000
0.0001 0.0001 0.0001 0.0001 0.0001 0.0001 0.0001 0.0001 0.0001 0.0001 0.0001 0.0001 0.0000 0.0000 0.0000 0.0000 0.0000 0.0000 0.0000
0.0001 0.0001 0.0001 0.0001 0.0001 0.0001 0.0001 0.0000 0.0000 0.0000 0.0000 0.0000 0.0000 0.0000 0.0000 0.0000 0.0000 0.0000 0.0000
0.00 0.00 0.00 0.00 0.00 0.00 0.00 0.00 0.00 0.00 0.00 0.00 0.00 0.00 0.00 0.00 0.00 0.00 0.00
0.00 0.00 0.00 0.00 0.00 0.00 0.00 0.00 0.00 0.00 0.00 0.00 0.00 0.00 0.00 0.00 0.00 0.00 0.00
0.18 0.18 0.18 0.18 0.18 0.18 0.18 0.19 0.19 0.19 0.19 0.19 0.19 0.19 0.19 0.19 0.19 0.19 0.19
0.00 0.00 0.00 0.00 0.00 0.00 0.00 0.00 0.00 0.00 0.00 0.00 0.00 0.00 0.00 0.00 0.00 0.00 0.00
10.47 10.47 10.48 10.48 10.48 10.49 10.49 10.49 10.49 10.50 10.50 10.50 10.51 10.51 10.51 10.51 10.52 10.52 10.52
0.00 0.00 0.00 0.00 0.00 0.00 0.00 0.00 0.00 0.00 0.00 0.00 0.00 0.00 0.00 0.00 0.00 0.00 0.00
0.40 0.40 0.40 0.41 0.41 0.41 0.42 0.42 0.43 0.43 0.43 0.44 0.44 0.44 0.45 0.45 0.45 0.45 0.46
0 0 0 0 0 0 0 0 0 0 0 0 0 0 0 0 0 0 0
Page 4 of 7 Producing Wells + Workovers, Mean Values 5/15/201812:28 AM
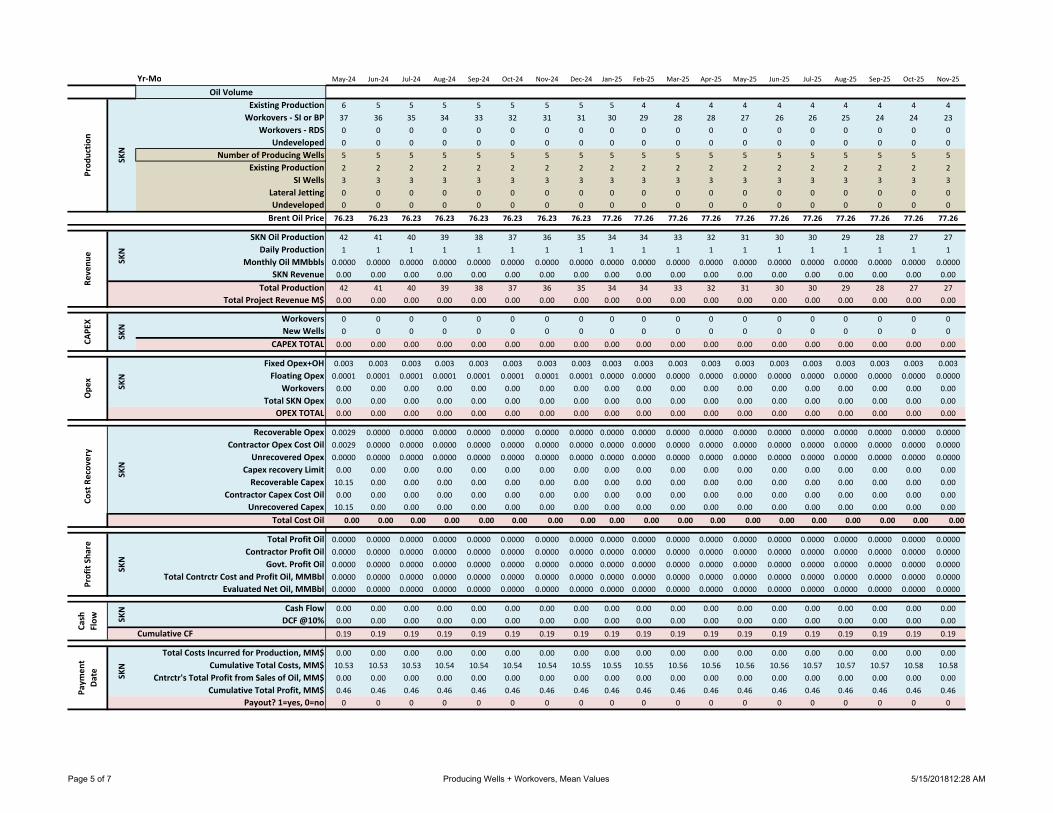
Yr‐MoOil Volume
Existing ProductionWorkovers ‐ SI or BP
Workovers ‐ RDSUndeveloped
Number of Producing WellsExisting Production
SI WellsLateral JettingUndeveloped
SKN Oil ProductionDaily Production
Monthly Oil MMbblsSKN Revenue
Total ProductionTotal Project Revenue M$
WorkoversNew Wells
CAPEX TOTAL
Fixed Opex+OHFloating Opex
WorkoversTotal SKN Opex
OPEX TOTAL
Recoverable OpexContractor Opex Cost Oil
Unrecovered OpexCapex recovery LimitRecoverable Capex
Contractor Capex Cost OilUnrecovered Capex
Total Cost Oil
Total Profit OilContractor Profit Oil
Govt. Profit OilTotal Contrctr Cost and Profit Oil, MMBbl
Evaluated Net Oil, MMBbl
Cash FlowDCF @10%
Cumulative CF
Total Costs Incurred for Production, MM$Cumulative Total Costs, MM$
Cntrctr's Total Profit from Sales of Oil, MM$Cumulative Total Profit, MM$
Payout? 1=yes, 0=no
SKN
Profit Sh
are
SKN
CAPE
X
Brent Oil Price
Reve
nue
SKN
Prod
uctio
n
SKN
Ope
x
SKN
Cost Recov
ery
SKN
SKN
Paym
ent
Date SKN
Cash
Flow
May‐24 Jun‐24 Jul‐24 Aug‐24 Sep‐24 Oct‐24 Nov‐24 Dec‐24 Jan‐25 Feb‐25 Mar‐25 Apr‐25 May‐25 Jun‐25 Jul‐25 Aug‐25 Sep‐25 Oct‐25 Nov‐25
6 5 5 5 5 5 5 5 5 4 4 4 4 4 4 4 4 4 4
37 36 35 34 33 32 31 31 30 29 28 28 27 26 26 25 24 24 23
0 0 0 0 0 0 0 0 0 0 0 0 0 0 0 0 0 0 0
0 0 0 0 0 0 0 0 0 0 0 0 0 0 0 0 0 0 0
5 5 5 5 5 5 5 5 5 5 5 5 5 5 5 5 5 5 5
2 2 2 2 2 2 2 2 2 2 2 2 2 2 2 2 2 2 2
3 3 3 3 3 3 3 3 3 3 3 3 3 3 3 3 3 3 3
0 0 0 0 0 0 0 0 0 0 0 0 0 0 0 0 0 0 0
0 0 0 0 0 0 0 0 0 0 0 0 0 0 0 0 0 0 0
76.23 76.23 76.23 76.23 76.23 76.23 76.23 76.23 77.26 77.26 77.26 77.26 77.26 77.26 77.26 77.26 77.26 77.26 77.26
42 41 40 39 38 37 36 35 34 34 33 32 31 30 30 29 28 27 27
1 1 1 1 1 1 1 1 1 1 1 1 1 1 1 1 1 1 1
0.0000 0.0000 0.0000 0.0000 0.0000 0.0000 0.0000 0.0000 0.0000 0.0000 0.0000 0.0000 0.0000 0.0000 0.0000 0.0000 0.0000 0.0000 0.0000
0.00 0.00 0.00 0.00 0.00 0.00 0.00 0.00 0.00 0.00 0.00 0.00 0.00 0.00 0.00 0.00 0.00 0.00 0.00
42 41 40 39 38 37 36 35 34 34 33 32 31 30 30 29 28 27 27
0.00 0.00 0.00 0.00 0.00 0.00 0.00 0.00 0.00 0.00 0.00 0.00 0.00 0.00 0.00 0.00 0.00 0.00 0.00
0 0 0 0 0 0 0 0 0 0 0 0 0 0 0 0 0 0 0
0 0 0 0 0 0 0 0 0 0 0 0 0 0 0 0 0 0 0
0.00 0.00 0.00 0.00 0.00 0.00 0.00 0.00 0.00 0.00 0.00 0.00 0.00 0.00 0.00 0.00 0.00 0.00 0.00
0.003 0.003 0.003 0.003 0.003 0.003 0.003 0.003 0.003 0.003 0.003 0.003 0.003 0.003 0.003 0.003 0.003 0.003 0.003
0.0001 0.0001 0.0001 0.0001 0.0001 0.0001 0.0001 0.0001 0.0000 0.0000 0.0000 0.0000 0.0000 0.0000 0.0000 0.0000 0.0000 0.0000 0.0000
0.00 0.00 0.00 0.00 0.00 0.00 0.00 0.00 0.00 0.00 0.00 0.00 0.00 0.00 0.00 0.00 0.00 0.00 0.00
0.00 0.00 0.00 0.00 0.00 0.00 0.00 0.00 0.00 0.00 0.00 0.00 0.00 0.00 0.00 0.00 0.00 0.00 0.00
0.00 0.00 0.00 0.00 0.00 0.00 0.00 0.00 0.00 0.00 0.00 0.00 0.00 0.00 0.00 0.00 0.00 0.00 0.00
0.0029 0.0000 0.0000 0.0000 0.0000 0.0000 0.0000 0.0000 0.0000 0.0000 0.0000 0.0000 0.0000 0.0000 0.0000 0.0000 0.0000 0.0000 0.0000
0.0029 0.0000 0.0000 0.0000 0.0000 0.0000 0.0000 0.0000 0.0000 0.0000 0.0000 0.0000 0.0000 0.0000 0.0000 0.0000 0.0000 0.0000 0.0000
0.0000 0.0000 0.0000 0.0000 0.0000 0.0000 0.0000 0.0000 0.0000 0.0000 0.0000 0.0000 0.0000 0.0000 0.0000 0.0000 0.0000 0.0000 0.0000
0.00 0.00 0.00 0.00 0.00 0.00 0.00 0.00 0.00 0.00 0.00 0.00 0.00 0.00 0.00 0.00 0.00 0.00 0.00
10.15 0.00 0.00 0.00 0.00 0.00 0.00 0.00 0.00 0.00 0.00 0.00 0.00 0.00 0.00 0.00 0.00 0.00 0.00
0.00 0.00 0.00 0.00 0.00 0.00 0.00 0.00 0.00 0.00 0.00 0.00 0.00 0.00 0.00 0.00 0.00 0.00 0.00
10.15 0.00 0.00 0.00 0.00 0.00 0.00 0.00 0.00 0.00 0.00 0.00 0.00 0.00 0.00 0.00 0.00 0.00 0.00
0.00 0.00 0.00 0.00 0.00 0.00 0.00 0.00 0.00 0.00 0.00 0.00 0.00 0.00 0.00 0.00 0.00 0.00 0.00
0.0000 0.0000 0.0000 0.0000 0.0000 0.0000 0.0000 0.0000 0.0000 0.0000 0.0000 0.0000 0.0000 0.0000 0.0000 0.0000 0.0000 0.0000 0.0000
0.0000 0.0000 0.0000 0.0000 0.0000 0.0000 0.0000 0.0000 0.0000 0.0000 0.0000 0.0000 0.0000 0.0000 0.0000 0.0000 0.0000 0.0000 0.0000
0.0000 0.0000 0.0000 0.0000 0.0000 0.0000 0.0000 0.0000 0.0000 0.0000 0.0000 0.0000 0.0000 0.0000 0.0000 0.0000 0.0000 0.0000 0.0000
0.0000 0.0000 0.0000 0.0000 0.0000 0.0000 0.0000 0.0000 0.0000 0.0000 0.0000 0.0000 0.0000 0.0000 0.0000 0.0000 0.0000 0.0000 0.0000
0.0000 0.0000 0.0000 0.0000 0.0000 0.0000 0.0000 0.0000 0.0000 0.0000 0.0000 0.0000 0.0000 0.0000 0.0000 0.0000 0.0000 0.0000 0.0000
0.00 0.00 0.00 0.00 0.00 0.00 0.00 0.00 0.00 0.00 0.00 0.00 0.00 0.00 0.00 0.00 0.00 0.00 0.00
0.00 0.00 0.00 0.00 0.00 0.00 0.00 0.00 0.00 0.00 0.00 0.00 0.00 0.00 0.00 0.00 0.00 0.00 0.00
0.19 0.19 0.19 0.19 0.19 0.19 0.19 0.19 0.19 0.19 0.19 0.19 0.19 0.19 0.19 0.19 0.19 0.19 0.19
0.00 0.00 0.00 0.00 0.00 0.00 0.00 0.00 0.00 0.00 0.00 0.00 0.00 0.00 0.00 0.00 0.00 0.00 0.00
10.53 10.53 10.53 10.54 10.54 10.54 10.54 10.55 10.55 10.55 10.56 10.56 10.56 10.56 10.57 10.57 10.57 10.58 10.58
0.00 0.00 0.00 0.00 0.00 0.00 0.00 0.00 0.00 0.00 0.00 0.00 0.00 0.00 0.00 0.00 0.00 0.00 0.00
0.46 0.46 0.46 0.46 0.46 0.46 0.46 0.46 0.46 0.46 0.46 0.46 0.46 0.46 0.46 0.46 0.46 0.46 0.46
0 0 0 0 0 0 0 0 0 0 0 0 0 0 0 0 0 0 0
Page 5 of 7 Producing Wells + Workovers, Mean Values 5/15/201812:28 AM

Yr‐MoOil Volume
Existing ProductionWorkovers ‐ SI or BP
Workovers ‐ RDSUndeveloped
Number of Producing WellsExisting Production
SI WellsLateral JettingUndeveloped
SKN Oil ProductionDaily Production
Monthly Oil MMbblsSKN Revenue
Total ProductionTotal Project Revenue M$
WorkoversNew Wells
CAPEX TOTAL
Fixed Opex+OHFloating Opex
WorkoversTotal SKN Opex
OPEX TOTAL
Recoverable OpexContractor Opex Cost Oil
Unrecovered OpexCapex recovery LimitRecoverable Capex
Contractor Capex Cost OilUnrecovered Capex
Total Cost Oil
Total Profit OilContractor Profit Oil
Govt. Profit OilTotal Contrctr Cost and Profit Oil, MMBbl
Evaluated Net Oil, MMBbl
Cash FlowDCF @10%
Cumulative CF
Total Costs Incurred for Production, MM$Cumulative Total Costs, MM$
Cntrctr's Total Profit from Sales of Oil, MM$Cumulative Total Profit, MM$
Payout? 1=yes, 0=no
SKN
Profit Sh
are
SKN
CAPE
X
Brent Oil Price
Reve
nue
SKN
Prod
uctio
n
SKN
Ope
x
SKN
Cost Recov
ery
SKN
SKN
Paym
ent
Date SKN
Cash
Flow
Dec‐25 Jan‐26 Feb‐26 Mar‐26 Apr‐26 May‐26 Jun‐26 Jul‐26 Aug‐26 Sep‐26 Oct‐26 Nov‐26 Dec‐26 Jan‐27 Feb‐27 Mar‐27 Apr‐27 May‐27 Jun‐27
3 3 3 3 3 3 3 3 3 3 3 3 3 3 2 2 2 2 2
23 22 21 21 20 20 19 19 18 18 17 17 17 16 14 14 13 13 13
0 0 0 0 0 0 0 0 0 0 0 0 0 0 0 0 0 0 0
0 0 0 0 0 0 0 0 0 0 0 0 0 0 0 0 0 0 0
5 5 5 5 5 5 5 5 5 5 5 5 5 5 4 4 4 4 4
2 2 2 2 2 2 2 2 2 2 2 2 2 2 2 2 2 2 2
3 3 3 3 3 3 3 3 3 3 3 3 3 3 2 2 2 2 2
0 0 0 0 0 0 0 0 0 0 0 0 0 0 0 0 0 0 0
0 0 0 0 0 0 0 0 0 0 0 0 0 0 0 0 0 0 0
77.26 78.37 78.37 78.37 78.37 78.37 78.37 78.37 78.37 78.37 78.37 78.37 78.37 79.45 79.45 79.45 79.45 79.45 79.45
26 25 25 24 23 23 22 22 21 21 20 20 19 19 17 16 16 15 15
1 1 1 1 1 1 1 1 1 1 1 1 1 1 1 1 1 1 1
0.0000 0.0000 0.0000 0.0000 0.0000 0.0000 0.0000 0.0000 0.0000 0.0000 0.0000 0.0000 0.0000 0.0000 0.0000 0.0000 0.0000 0.0000 0.0000
0.00 0.00 0.00 0.00 0.00 0.00 0.00 0.00 0.00 0.00 0.00 0.00 0.00 0.00 0.00 0.00 0.00 0.00 0.00
26 25 25 24 23 23 22 22 21 21 20 20 19 19 17 16 16 15 15
0.00 0.00 0.00 0.00 0.00 0.00 0.00 0.00 0.00 0.00 0.00 0.00 0.00 0.00 0.00 0.00 0.00 0.00 0.00
0 0 0 0 0 0 0 0 0 0 0 0 0 0 0 0 0 0 0
0 0 0 0 0 0 0 0 0 0 0 0 0 0 0 0 0 0 0
0.00 0.00 0.00 0.00 0.00 0.00 0.00 0.00 0.00 0.00 0.00 0.00 0.00 0.00 0.00 0.00 0.00 0.00 0.00
0.003 0.003 0.003 0.003 0.003 0.003 0.003 0.003 0.003 0.003 0.003 0.003 0.003 0.003 0.003 0.003 0.003 0.003 0.003
0.0000 0.0000 0.0000 0.0000 0.0000 0.0000 0.0000 0.0000 0.0000 0.0000 0.0000 0.0000 0.0000 0.0000 0.0000 0.0000 0.0000 0.0000 0.0000
0.00 0.00 0.00 0.00 0.00 0.00 0.00 0.00 0.00 0.00 0.00 0.00 0.00 0.00 0.00 0.00 0.00 0.00 0.00
0.00 0.00 0.00 0.00 0.00 0.00 0.00 0.00 0.00 0.00 0.00 0.00 0.00 0.00 0.00 0.00 0.00 0.00 0.00
0.00 0.00 0.00 0.00 0.00 0.00 0.00 0.00 0.00 0.00 0.00 0.00 0.00 0.00 0.00 0.00 0.00 0.00 0.00
0.0000 0.0000 0.0000 0.0000 0.0000 0.0000 0.0000 0.0000 0.0000 0.0000 0.0000 0.0000 0.0000 0.0000 0.0000 0.0000 0.0000 0.0000 0.0000
0.0000 0.0000 0.0000 0.0000 0.0000 0.0000 0.0000 0.0000 0.0000 0.0000 0.0000 0.0000 0.0000 0.0000 0.0000 0.0000 0.0000 0.0000 0.0000
0.0000 0.0000 0.0000 0.0000 0.0000 0.0000 0.0000 0.0000 0.0000 0.0000 0.0000 0.0000 0.0000 0.0000 0.0000 0.0000 0.0000 0.0000 0.0000
0.00 0.00 0.00 0.00 0.00 0.00 0.00 0.00 0.00 0.00 0.00 0.00 0.00 0.00 0.00 0.00 0.00 0.00 0.00
0.00 0.00 0.00 0.00 0.00 0.00 0.00 0.00 0.00 0.00 0.00 0.00 0.00 0.00 0.00 0.00 0.00 0.00 0.00
0.00 0.00 0.00 0.00 0.00 0.00 0.00 0.00 0.00 0.00 0.00 0.00 0.00 0.00 0.00 0.00 0.00 0.00 0.00
0.00 0.00 0.00 0.00 0.00 0.00 0.00 0.00 0.00 0.00 0.00 0.00 0.00 0.00 0.00 0.00 0.00 0.00 0.00
0.00 0.00 0.00 0.00 0.00 0.00 0.00 0.00 0.00 0.00 0.00 0.00 0.00 0.00 0.00 0.00 0.00 0.00 0.00
0.0000 0.0000 0.0000 0.0000 0.0000 0.0000 0.0000 0.0000 0.0000 0.0000 0.0000 0.0000 0.0000 0.0000 0.0000 0.0000 0.0000 0.0000 0.0000
0.0000 0.0000 0.0000 0.0000 0.0000 0.0000 0.0000 0.0000 0.0000 0.0000 0.0000 0.0000 0.0000 0.0000 0.0000 0.0000 0.0000 0.0000 0.0000
0.0000 0.0000 0.0000 0.0000 0.0000 0.0000 0.0000 0.0000 0.0000 0.0000 0.0000 0.0000 0.0000 0.0000 0.0000 0.0000 0.0000 0.0000 0.0000
0.0000 0.0000 0.0000 0.0000 0.0000 0.0000 0.0000 0.0000 0.0000 0.0000 0.0000 0.0000 0.0000 0.0000 0.0000 0.0000 0.0000 0.0000 0.0000
0.0000 0.0000 0.0000 0.0000 0.0000 0.0000 0.0000 0.0000 0.0000 0.0000 0.0000 0.0000 0.0000 0.0000 0.0000 0.0000 0.0000 0.0000 0.0000
0.00 0.00 0.00 0.00 0.00 0.00 0.00 0.00 0.00 0.00 0.00 0.00 0.00 0.00 0.00 0.00 0.00 0.00 0.00
0.00 0.00 0.00 0.00 0.00 0.00 0.00 0.00 0.00 0.00 0.00 0.00 0.00 0.00 0.00 0.00 0.00 0.00 0.00
0.19 0.19 0.19 0.19 0.19 0.19 0.19 0.19 0.19 0.19 0.19 0.19 0.19 0.19 0.19 0.19 0.19 0.19 0.19
0.00 0.00 0.00 0.00 0.00 0.00 0.00 0.00 0.00 0.00 0.00 0.00 0.00 0.00 0.00 0.00 0.00 0.00 0.00
10.58 10.59 10.59 10.59 10.59 10.60 10.60 10.60 10.61 10.61 10.61 10.61 10.62 10.62 10.62 10.63 10.63 10.63 10.64
0.00 0.00 0.00 0.00 0.00 0.00 0.00 0.00 0.00 0.00 0.00 0.00 0.00 0.00 0.00 0.00 0.00 0.00 0.00
0.46 0.46 0.46 0.46 0.46 0.46 0.46 0.46 0.46 0.46 0.46 0.46 0.46 0.46 0.46 0.46 0.46 0.46 0.46
0 0 0 0 0 0 0 0 0 0 0 0 0 0 0 0 0 0 0
Page 6 of 7 Producing Wells + Workovers, Mean Values 5/15/201812:28 AM

Yr‐MoOil Volume
Existing ProductionWorkovers ‐ SI or BP
Workovers ‐ RDSUndeveloped
Number of Producing WellsExisting Production
SI WellsLateral JettingUndeveloped
SKN Oil ProductionDaily Production
Monthly Oil MMbblsSKN Revenue
Total ProductionTotal Project Revenue M$
WorkoversNew Wells
CAPEX TOTAL
Fixed Opex+OHFloating Opex
WorkoversTotal SKN Opex
OPEX TOTAL
Recoverable OpexContractor Opex Cost Oil
Unrecovered OpexCapex recovery LimitRecoverable Capex
Contractor Capex Cost OilUnrecovered Capex
Total Cost Oil
Total Profit OilContractor Profit Oil
Govt. Profit OilTotal Contrctr Cost and Profit Oil, MMBbl
Evaluated Net Oil, MMBbl
Cash FlowDCF @10%
Cumulative CF
Total Costs Incurred for Production, MM$Cumulative Total Costs, MM$
Cntrctr's Total Profit from Sales of Oil, MM$Cumulative Total Profit, MM$
Payout? 1=yes, 0=no
SKN
Profit Sh
are
SKN
CAPE
X
Brent Oil Price
Reve
nue
SKN
Prod
uctio
n
SKN
Ope
x
SKN
Cost Recov
ery
SKN
SKN
Paym
ent
Date SKN
Cash
Flow
Jul‐27 Aug‐27 Sep‐27 Oct‐27 Nov‐27 Dec‐27
2 2 2 2 2 2
12 12 12 12 11 11
0 0 0 0 0 0
0 0 0 0 0 0
4 4 4 4 4 4
2 2 2 2 2 2
2 2 2 2 2 2
0 0 0 0 0 0
0 0 0 0 0 0
79.45 79.45 79.45 79.45 79.45 79.45
15 14 14 14 13 13
1 0 0 0 0 0
0.0000 0.0000 0.0000 0.0000 0.0000 0.0000
0.00 0.00 0.00 0.00 0.00 0.00
15 14 14 14 13 13
0.00 0.00 0.00 0.00 0.00 0.00
0 0 0 0 0 0
0 0 0 0 0 0
0.00 0.00 0.00 0.00 0.00 0.00
0.003 0.003 0.003 0.003 0.003 0.003
0.0000 0.0000 0.0000 0.0000 0.0000 0.0000
0.00 0.00 0.00 0.00 0.00 0.00
0.00 0.00 0.00 0.00 0.00 0.00
0.00 0.00 0.00 0.00 0.00 0.00
0.0000 0.0000 0.0000 0.0000 0.0000 0.0000
0.0000 0.0000 0.0000 0.0000 0.0000 0.0000
0.0000 0.0000 0.0000 0.0000 0.0000 0.0000
0.00 0.00 0.00 0.00 0.00 0.00
0.00 0.00 0.00 0.00 0.00 0.00
0.00 0.00 0.00 0.00 0.00 0.00
0.00 0.00 0.00 0.00 0.00 0.00
0.00 0.00 0.00 0.00 0.00 0.00
0.0000 0.0000 0.0000 0.0000 0.0000 0.0000
0.0000 0.0000 0.0000 0.0000 0.0000 0.0000
0.0000 0.0000 0.0000 0.0000 0.0000 0.0000
0.0000 0.0000 0.0000 0.0000 0.0000 0.0000
0.0000 0.0000 0.0000 0.0000 0.0000 0.0000
0.00 0.00 0.00 0.00 0.00 0.00
0.00 0.00 0.00 0.00 0.00 0.00
0.19 0.19 0.19 0.19 0.19 0.19
0.00 0.00 0.00 0.00 0.00 0.00
10.64 10.64 10.65 10.65 10.65 10.65
0.00 0.00 0.00 0.00 0.00 0.00
0.46 0.46 0.46 0.46 0.46 0.46
0 0 0 0 0 0
Page 7 of 7 Producing Wells + Workovers, Mean Values 5/15/201812:28 AM

WEST RUSTAVI

Yr‐Mo Units Total 01/18 02/18 03/18 04/18 05/18 06/18 07/18 08/18 09/18 10/18 11/18 12/18 01/19 02/19 03/19 04/19 05/19 06/19 07/19 08/19
1 1 1 1 1 1 1 1 1 1 1 1 2 2 2 2 2 2 2 2Total 1 2 3 4 5 6 7 8 9 10 11 12 13 14 15 16 17 18 19 20
Oil VolumeExisting Production Bbl 0 0 0 0 0 0 0 0 0 0 0 0 0 0 0 0 0 0 0 0 0
Workovers ‐ SI or BP Bbl 0 0 0 0 0 0 0 0 0 0 0 0 0 0 0 0 0 0 0 0 0
Sidetracks Bbl 855,302 0 0 0 0 0 0 0 0 0 0 0 0 0 11,407 10,485 21,075 30,832 39,849 36,798 34,075
Number of Producing Wells Wells 0 0 0 0 0 0 0 0 0 0 0 0 0 1 1 2 3 4 4 4
Existing Production Wells 0 0 0 0 0 0 0 0 0 0 0 0 0 0 0 0 0 0 0 0
Workovers ‐ SI or BP Wells 0 0 0 0 0 0 0 0 0 0 0 0 0 0 0 0 0 0 0 0
Sidetracks Wells 0 0 0 0 0 0 0 0 0 0 0 0 0 1 1 2 3 4 4 4
$/Bbl 60.56 60.56 60.56 60.56 60.56 60.56 60.56 60.56 60.56 60.56 60.56 60.56 62.81 62.81 62.81 62.81 62.81 62.81 62.81 62.81
W Rustavi Oil Production BOPM 855,302 0 0 0 0 0 0 0 0 0 0 0 0 0 11,407 10,485 21,075 30,832 39,849 36,798 34,075
Daily Production BOPD 0 0 0 0 0 0 0 0 0 0 0 0 0 394 363 729 1,066 1,378 1,273 1,178
Monthly Oil MMbbls MMBbl 0.8553 0.0000 0.0000 0.0000 0.0000 0.0000 0.0000 0.0000 0.0000 0.0000 0.0000 0.0000 0.0000 0.0000 0.0114 0.0105 0.0211 0.0308 0.0398 0.0368 0.0341
W Rustavi Revenue M$ 50.5 0.00 0.00 0.00 0.00 0.00 0.00 0.00 0.00 0.00 0.00 0.00 0.00 0.00 0.61 0.56 1.13 1.66 2.14 1.98
Total Production Bbl 855,302 0 0 0 0 0 0 0 0 0 0 0 0 0 11,407 10,485 21,075 30,832 39,849 36,798 34,075
Total Project Revenue M$ M$ 50.5 0.00 0.00 0.00 0.00 0.00 0.00 0.00 0.00 0.00 0.00 0.00 0.00 0.00 0.00 0.61 0.56 1.13 1.66 2.14 1.98
Workovers MM$ 0.0 0 0 0 0 0 0 0 0 0 0 0 0 0 0 0 0 0 0 0 0
New Wells MM$ 6.0 0 0 0 0 0 0 0 0 0 0 0 0 0 1.5 0 1.5 1.5 1.5 0 0
CAPEX TOTAL MM$ 6.0 0.00 0.00 0.00 0.00 0.00 0.00 0.00 0.00 0.00 0.00 0.00 0.00 0.00 1.50 0.00 1.50 1.50 1.50 0.00 0.00
Fixed Opex+OH MM$ 1.5 0.000 0.000 0.000 0.000 0.000 0.000 0.000 0.000 0.000 0.000 0.000 0.000 0.000 0.013 0.013 0.013 0.013 0.013 0.013 0.013
Floating Opex MM$ 1.2 0.00 0.00 0.00 0.00 0.00 0.00 0.00 0.00 0.00 0.00 0.00 0.00 0.00 0.02 0.02 0.03 0.04 0.06 0.05 0.05
Workovers MM$ 0.0 0.00 0.00 0.00 0.00 0.00 0.00 0.00 0.00 0.00 0.00 0.00 0.00 0.00 0.00 0.00 0.00 0.00 0.00 0.00 0.00
Total W Rustavi Opex MM$ 2.7 0.00 0.00 0.00 0.00 0.00 0.00 0.00 0.00 0.00 0.00 0.00 0.00 0.00 0.03 0.03 0.04 0.06 0.07 0.07 0.06
OPEX TOTAL MM$ 2.7 0.00 0.00 0.00 0.00 0.00 0.00 0.00 0.00 0.00 0.00 0.00 0.00 0.00 0.03 0.03 0.04 0.06 0.07 0.07 0.06
Recoverable Opex MM$ 2.71 0.000 0.000 0.000 0.000 0.000 0.000 0.000 0.000 0.000 0.000 0.000 0.000 0.000 0.029 0.028 0.043 0.057 0.070 0.066 0.062
Contractor Opex Cost Oil MM$ 2.71 0.000 0.000 0.000 0.000 0.000 0.000 0.000 0.000 0.000 0.000 0.000 0.000 0.000 0.000 0.057 0.043 0.057 0.070 0.066 0.062
Unrecovered Opex MM$ 0.000 0.000 0.000 0.000 0.000 0.000 0.000 0.000 0.000 0.000 0.000 0.000 0.000 0.029 0.000 0.000 0.000 0.000 0.000 0.000
Capex recovery Limit MM$ 0.00 0.00 0.00 0.00 0.00 0.00 0.00 0.00 0.00 0.00 0.00 0.00 0.00 0.00 0.28 0.26 0.54 0.79 1.04 0.96
Recoverable Capex MM$ 0.00 0.00 0.00 0.00 0.00 0.00 0.00 0.00 0.00 0.00 0.00 0.00 0.00 1.50 1.50 2.72 3.96 4.92 4.13 3.09
Contractor Capex Cost Oil MM$ 6.00 0.00 0.00 0.00 0.00 0.00 0.00 0.00 0.00 0.00 0.00 0.00 0.00 0.00 0.00 0.28 0.26 0.54 0.79 1.04 0.96
Unrecovered Capex MM$ 0.00 0.00 0.00 0.00 0.00 0.00 0.00 0.00 0.00 0.00 0.00 0.00 0.00 1.50 1.22 2.46 3.42 4.13 3.09 2.13
Total Cost Oil MM$ 0.00 0.00 0.00 0.00 0.00 0.00 0.00 0.00 0.00 0.00 0.00 0.00 0.00 0.00 0.34 0.30 0.60 0.86 1.10 1.02
Total Profit Oil MM$ 41.7426 0.0000 0.0000 0.0000 0.0000 0.0000 0.0000 0.0000 0.0000 0.0000 0.0000 0.0000 0.0000 0.0000 0.0000 0.2785 0.2606 0.5385 0.7946 1.0393 0.9592
Contractor Profit Oil MM$ 17.1729 0.0000 0.0000 0.0000 0.0000 0.0000 0.0000 0.0000 0.0000 0.0000 0.0000 0.0000 0.0000 0.0000 0.0000 0.1392 0.1303 0.2693 0.3973 0.5197 0.4796
Govt. Profit Oil MM$ 24.5697 0.0000 0.0000 0.0000 0.0000 0.0000 0.0000 0.0000 0.0000 0.0000 0.0000 0.0000 0.0000 0.0000 0.0000 0.1392 0.1303 0.2693 0.3973 0.5197 0.4796
Total Contrctr Cost and Profit Oil, MMBbl MMBbl 0.4426 0.0000 0.0000 0.0000 0.0000 0.0000 0.0000 0.0000 0.0000 0.0000 0.0000 0.0000 0.0000 0.0000 0.0000 0.0088 0.0081 0.0161 0.0234 0.0302 0.0279
Evaluated Net Oil, MMBbl MMBbl 0.3319 0.0000 0.0000 0.0000 0.0000 0.0000 0.0000 0.0000 0.0000 0.0000 0.0000 0.0000 0.0000 0.0000 0.0000 0.0066 0.0060 0.0121 0.0176 0.0226 0.0209
Cash Flow MM$ 12.83 0.00 0.00 0.00 0.00 0.00 0.00 0.00 0.00 0.00 0.00 0.00 0.00 0.00 ‐1.53 0.45 ‐1.11 ‐0.69 ‐0.31 1.56 1.44
DCF @10% MM$ 9.06 0.00 0.00 0.00 0.00 0.00 0.00 0.00 0.00 0.00 0.00 0.00 0.00 0.00 ‐1.37 0.40 ‐0.98 ‐0.60 ‐0.27 1.34 1.23
Cumulative CF 0.00 0.00 0.00 0.00 0.00 0.00 0.00 0.00 0.00 0.00 0.00 0.00 0.00 ‐1.53 ‐1.08 ‐2.19 ‐2.88 ‐3.19 ‐1.63 ‐0.19
Total Costs Incurred for Production, MM$ MM$ 8.71 0.00 0.00 0.00 0.00 0.00 0.00 0.00 0.00 0.00 0.00 0.00 0.00 0.00 1.53 0.03 1.54 1.56 1.57 0.07 0.06
Cumulative Total Costs, MM$ MM$ 8.71 0.00 0.00 0.00 0.00 0.00 0.00 0.00 0.00 0.00 0.00 0.00 0.00 0.00 1.53 1.56 3.10 4.66 6.23 6.29 6.35
Cntrctr's Total Profit from Sales of Oil, MM$ MM$ 25.89 0.00 0.00 0.00 0.00 0.00 0.00 0.00 0.00 0.00 0.00 0.00 0.00 0.00 0.00 0.47 0.43 0.86 1.26 1.62 1.50
Cumulative Total Profit, MM$ MM$ 25.89 0.00 0.00 0.00 0.00 0.00 0.00 0.00 0.00 0.00 0.00 0.00 0.00 0.00 0.00 0.47 0.91 1.77 3.03 4.66 6.16
Payout? 1=yes, 0=no 10/2019 0 0 0 0 0 0 0 0 0 0 0 0 0 0 0 0 0 0 0 0
Ope
x
W Rustavi
Cost Recov
ery
Profit Sh
are
YearMonth
Brent Oil Price
Reve
nue
W Rustavi
Prod
uctio
n
W Rustavi
CAPE
X
W
Rustavi
W Rustavi
Payo
utDate
W Rustavi
W Rustavi
WRu
stavi
Cash
Flow
Page 1 of 6 Sidetracks Only Case 5/15/201812:00 AM
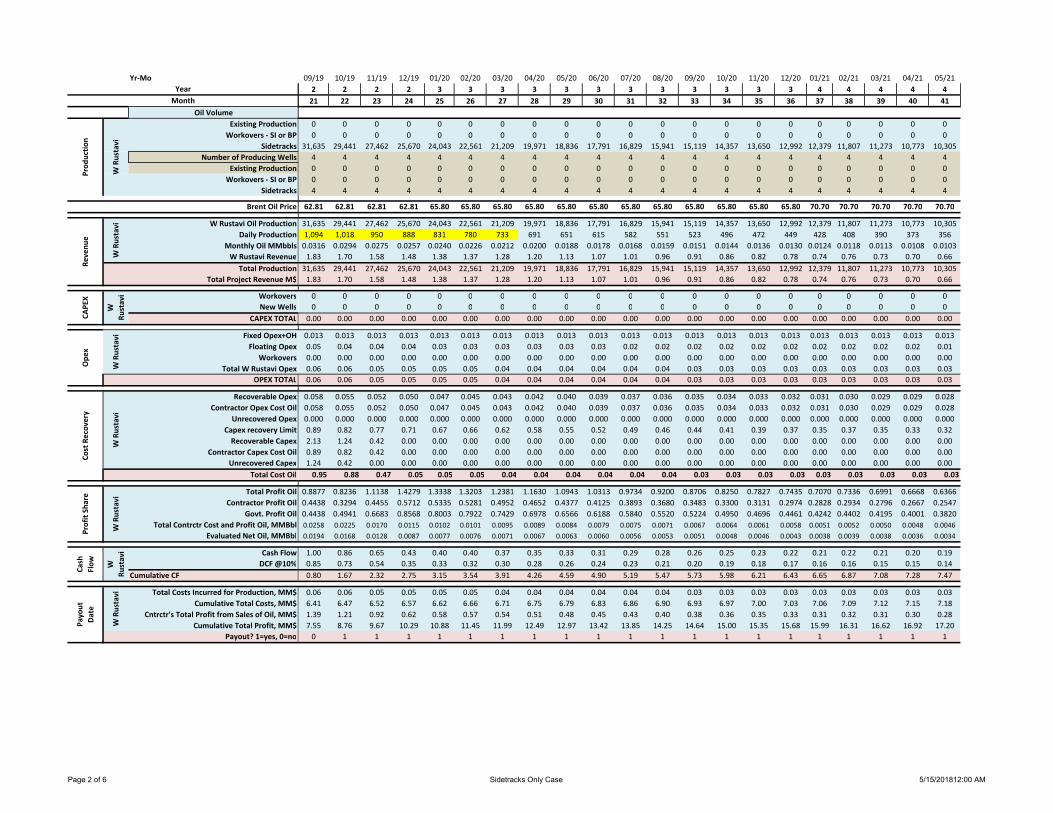
Yr‐Mo
Oil VolumeExisting ProductionWorkovers ‐ SI or BP
SidetracksNumber of Producing Wells
Existing ProductionWorkovers ‐ SI or BP
Sidetracks
W Rustavi Oil ProductionDaily Production
Monthly Oil MMbblsW Rustavi Revenue
Total ProductionTotal Project Revenue M$
WorkoversNew Wells
CAPEX TOTAL
Fixed Opex+OHFloating Opex
WorkoversTotal W Rustavi Opex
OPEX TOTAL
Recoverable OpexContractor Opex Cost Oil
Unrecovered OpexCapex recovery LimitRecoverable Capex
Contractor Capex Cost OilUnrecovered Capex
Total Cost Oil
Total Profit OilContractor Profit Oil
Govt. Profit OilTotal Contrctr Cost and Profit Oil, MMBbl
Evaluated Net Oil, MMBbl
Cash FlowDCF @10%
Cumulative CF
Total Costs Incurred for Production, MM$Cumulative Total Costs, MM$
Cntrctr's Total Profit from Sales of Oil, MM$Cumulative Total Profit, MM$
Payout? 1=yes, 0=no
Ope
x
W Rustavi
Cost Recov
ery
Profit Sh
are
YearMonth
Brent Oil Price
Reve
nue
W Rustavi
Prod
uctio
n
W Rustavi
CAPE
X
W
Rustavi
W Rustavi
Payo
utDate
W Rustavi
W Rustavi
WRu
stavi
Cash
Flow
09/19 10/19 11/19 12/19 01/20 02/20 03/20 04/20 05/20 06/20 07/20 08/20 09/20 10/20 11/20 12/20 01/21 02/21 03/21 04/21 05/21
2 2 2 2 3 3 3 3 3 3 3 3 3 3 3 3 4 4 4 4 421 22 23 24 25 26 27 28 29 30 31 32 33 34 35 36 37 38 39 40 41
0 0 0 0 0 0 0 0 0 0 0 0 0 0 0 0 0 0 0 0 0
0 0 0 0 0 0 0 0 0 0 0 0 0 0 0 0 0 0 0 0 0
31,635 29,441 27,462 25,670 24,043 22,561 21,209 19,971 18,836 17,791 16,829 15,941 15,119 14,357 13,650 12,992 12,379 11,807 11,273 10,773 10,305
4 4 4 4 4 4 4 4 4 4 4 4 4 4 4 4 4 4 4 4 4
0 0 0 0 0 0 0 0 0 0 0 0 0 0 0 0 0 0 0 0 0
0 0 0 0 0 0 0 0 0 0 0 0 0 0 0 0 0 0 0 0 0
4 4 4 4 4 4 4 4 4 4 4 4 4 4 4 4 4 4 4 4 4
62.81 62.81 62.81 62.81 65.80 65.80 65.80 65.80 65.80 65.80 65.80 65.80 65.80 65.80 65.80 65.80 70.70 70.70 70.70 70.70 70.70
31,635 29,441 27,462 25,670 24,043 22,561 21,209 19,971 18,836 17,791 16,829 15,941 15,119 14,357 13,650 12,992 12,379 11,807 11,273 10,773 10,305
1,094 1,018 950 888 831 780 733 691 651 615 582 551 523 496 472 449 428 408 390 373 356
0.0316 0.0294 0.0275 0.0257 0.0240 0.0226 0.0212 0.0200 0.0188 0.0178 0.0168 0.0159 0.0151 0.0144 0.0136 0.0130 0.0124 0.0118 0.0113 0.0108 0.0103
1.83 1.70 1.58 1.48 1.38 1.37 1.28 1.20 1.13 1.07 1.01 0.96 0.91 0.86 0.82 0.78 0.74 0.76 0.73 0.70 0.66
31,635 29,441 27,462 25,670 24,043 22,561 21,209 19,971 18,836 17,791 16,829 15,941 15,119 14,357 13,650 12,992 12,379 11,807 11,273 10,773 10,305
1.83 1.70 1.58 1.48 1.38 1.37 1.28 1.20 1.13 1.07 1.01 0.96 0.91 0.86 0.82 0.78 0.74 0.76 0.73 0.70 0.66
0 0 0 0 0 0 0 0 0 0 0 0 0 0 0 0 0 0 0 0 0
0 0 0 0 0 0 0 0 0 0 0 0 0 0 0 0 0 0 0 0 0
0.00 0.00 0.00 0.00 0.00 0.00 0.00 0.00 0.00 0.00 0.00 0.00 0.00 0.00 0.00 0.00 0.00 0.00 0.00 0.00 0.00
0.013 0.013 0.013 0.013 0.013 0.013 0.013 0.013 0.013 0.013 0.013 0.013 0.013 0.013 0.013 0.013 0.013 0.013 0.013 0.013 0.013
0.05 0.04 0.04 0.04 0.03 0.03 0.03 0.03 0.03 0.03 0.02 0.02 0.02 0.02 0.02 0.02 0.02 0.02 0.02 0.02 0.01
0.00 0.00 0.00 0.00 0.00 0.00 0.00 0.00 0.00 0.00 0.00 0.00 0.00 0.00 0.00 0.00 0.00 0.00 0.00 0.00 0.00
0.06 0.06 0.05 0.05 0.05 0.05 0.04 0.04 0.04 0.04 0.04 0.04 0.03 0.03 0.03 0.03 0.03 0.03 0.03 0.03 0.03
0.06 0.06 0.05 0.05 0.05 0.05 0.04 0.04 0.04 0.04 0.04 0.04 0.03 0.03 0.03 0.03 0.03 0.03 0.03 0.03 0.03
0.058 0.055 0.052 0.050 0.047 0.045 0.043 0.042 0.040 0.039 0.037 0.036 0.035 0.034 0.033 0.032 0.031 0.030 0.029 0.029 0.028
0.058 0.055 0.052 0.050 0.047 0.045 0.043 0.042 0.040 0.039 0.037 0.036 0.035 0.034 0.033 0.032 0.031 0.030 0.029 0.029 0.028
0.000 0.000 0.000 0.000 0.000 0.000 0.000 0.000 0.000 0.000 0.000 0.000 0.000 0.000 0.000 0.000 0.000 0.000 0.000 0.000 0.000
0.89 0.82 0.77 0.71 0.67 0.66 0.62 0.58 0.55 0.52 0.49 0.46 0.44 0.41 0.39 0.37 0.35 0.37 0.35 0.33 0.32
2.13 1.24 0.42 0.00 0.00 0.00 0.00 0.00 0.00 0.00 0.00 0.00 0.00 0.00 0.00 0.00 0.00 0.00 0.00 0.00 0.00
0.89 0.82 0.42 0.00 0.00 0.00 0.00 0.00 0.00 0.00 0.00 0.00 0.00 0.00 0.00 0.00 0.00 0.00 0.00 0.00 0.00
1.24 0.42 0.00 0.00 0.00 0.00 0.00 0.00 0.00 0.00 0.00 0.00 0.00 0.00 0.00 0.00 0.00 0.00 0.00 0.00 0.00
0.95 0.88 0.47 0.05 0.05 0.05 0.04 0.04 0.04 0.04 0.04 0.04 0.03 0.03 0.03 0.03 0.03 0.03 0.03 0.03 0.03
0.8877 0.8236 1.1138 1.4279 1.3338 1.3203 1.2381 1.1630 1.0943 1.0313 0.9734 0.9200 0.8706 0.8250 0.7827 0.7435 0.7070 0.7336 0.6991 0.6668 0.6366
0.4438 0.3294 0.4455 0.5712 0.5335 0.5281 0.4952 0.4652 0.4377 0.4125 0.3893 0.3680 0.3483 0.3300 0.3131 0.2974 0.2828 0.2934 0.2796 0.2667 0.2547
0.4438 0.4941 0.6683 0.8568 0.8003 0.7922 0.7429 0.6978 0.6566 0.6188 0.5840 0.5520 0.5224 0.4950 0.4696 0.4461 0.4242 0.4402 0.4195 0.4001 0.3820
0.0258 0.0225 0.0170 0.0115 0.0102 0.0101 0.0095 0.0089 0.0084 0.0079 0.0075 0.0071 0.0067 0.0064 0.0061 0.0058 0.0051 0.0052 0.0050 0.0048 0.0046
0.0194 0.0168 0.0128 0.0087 0.0077 0.0076 0.0071 0.0067 0.0063 0.0060 0.0056 0.0053 0.0051 0.0048 0.0046 0.0043 0.0038 0.0039 0.0038 0.0036 0.0034
1.00 0.86 0.65 0.43 0.40 0.40 0.37 0.35 0.33 0.31 0.29 0.28 0.26 0.25 0.23 0.22 0.21 0.22 0.21 0.20 0.19
0.85 0.73 0.54 0.35 0.33 0.32 0.30 0.28 0.26 0.24 0.23 0.21 0.20 0.19 0.18 0.17 0.16 0.16 0.15 0.15 0.14
0.80 1.67 2.32 2.75 3.15 3.54 3.91 4.26 4.59 4.90 5.19 5.47 5.73 5.98 6.21 6.43 6.65 6.87 7.08 7.28 7.47
0.06 0.06 0.05 0.05 0.05 0.05 0.04 0.04 0.04 0.04 0.04 0.04 0.03 0.03 0.03 0.03 0.03 0.03 0.03 0.03 0.03
6.41 6.47 6.52 6.57 6.62 6.66 6.71 6.75 6.79 6.83 6.86 6.90 6.93 6.97 7.00 7.03 7.06 7.09 7.12 7.15 7.18
1.39 1.21 0.92 0.62 0.58 0.57 0.54 0.51 0.48 0.45 0.43 0.40 0.38 0.36 0.35 0.33 0.31 0.32 0.31 0.30 0.28
7.55 8.76 9.67 10.29 10.88 11.45 11.99 12.49 12.97 13.42 13.85 14.25 14.64 15.00 15.35 15.68 15.99 16.31 16.62 16.92 17.20
0 1 1 1 1 1 1 1 1 1 1 1 1 1 1 1 1 1 1 1 1
Page 2 of 6 Sidetracks Only Case 5/15/201812:00 AM
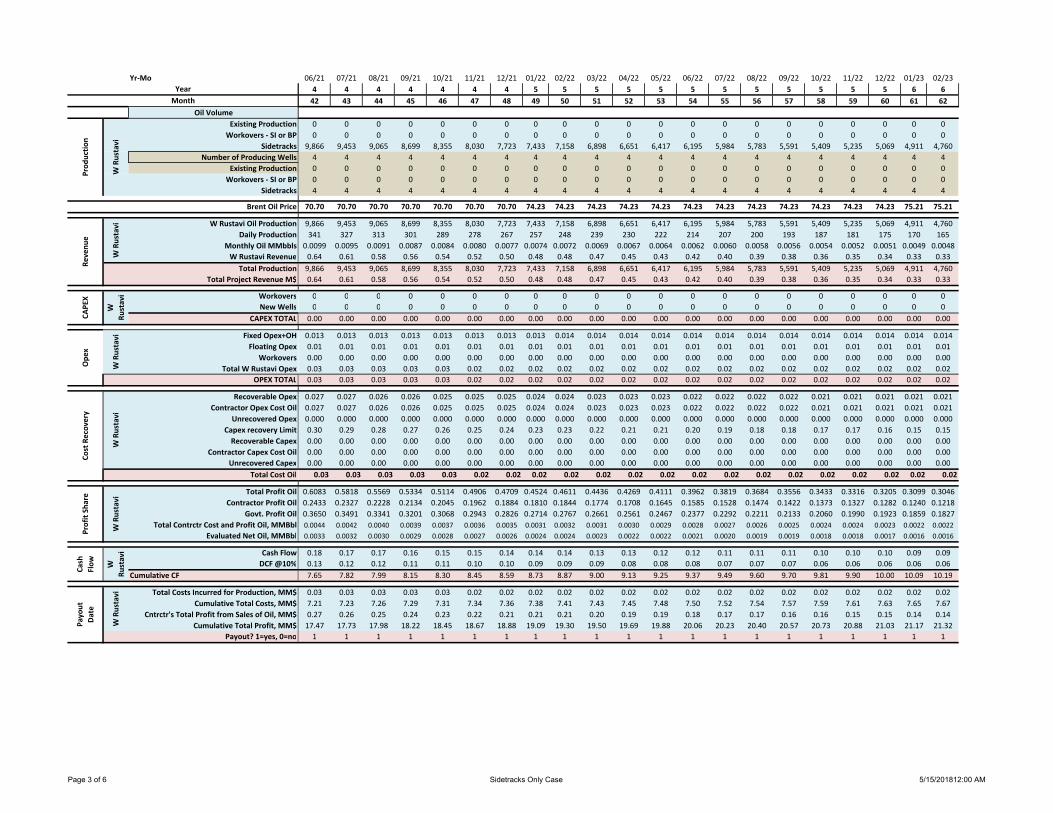
Yr‐Mo
Oil VolumeExisting ProductionWorkovers ‐ SI or BP
SidetracksNumber of Producing Wells
Existing ProductionWorkovers ‐ SI or BP
Sidetracks
W Rustavi Oil ProductionDaily Production
Monthly Oil MMbblsW Rustavi Revenue
Total ProductionTotal Project Revenue M$
WorkoversNew Wells
CAPEX TOTAL
Fixed Opex+OHFloating Opex
WorkoversTotal W Rustavi Opex
OPEX TOTAL
Recoverable OpexContractor Opex Cost Oil
Unrecovered OpexCapex recovery LimitRecoverable Capex
Contractor Capex Cost OilUnrecovered Capex
Total Cost Oil
Total Profit OilContractor Profit Oil
Govt. Profit OilTotal Contrctr Cost and Profit Oil, MMBbl
Evaluated Net Oil, MMBbl
Cash FlowDCF @10%
Cumulative CF
Total Costs Incurred for Production, MM$Cumulative Total Costs, MM$
Cntrctr's Total Profit from Sales of Oil, MM$Cumulative Total Profit, MM$
Payout? 1=yes, 0=no
Ope
x
W Rustavi
Cost Recov
ery
Profit Sh
are
YearMonth
Brent Oil Price
Reve
nue
W Rustavi
Prod
uctio
n
W Rustavi
CAPE
X
W
Rustavi
W Rustavi
Payo
utDate
W Rustavi
W Rustavi
WRu
stavi
Cash
Flow
06/21 07/21 08/21 09/21 10/21 11/21 12/21 01/22 02/22 03/22 04/22 05/22 06/22 07/22 08/22 09/22 10/22 11/22 12/22 01/23 02/23
4 4 4 4 4 4 4 5 5 5 5 5 5 5 5 5 5 5 5 6 642 43 44 45 46 47 48 49 50 51 52 53 54 55 56 57 58 59 60 61 62
0 0 0 0 0 0 0 0 0 0 0 0 0 0 0 0 0 0 0 0 0
0 0 0 0 0 0 0 0 0 0 0 0 0 0 0 0 0 0 0 0 0
9,866 9,453 9,065 8,699 8,355 8,030 7,723 7,433 7,158 6,898 6,651 6,417 6,195 5,984 5,783 5,591 5,409 5,235 5,069 4,911 4,760
4 4 4 4 4 4 4 4 4 4 4 4 4 4 4 4 4 4 4 4 4
0 0 0 0 0 0 0 0 0 0 0 0 0 0 0 0 0 0 0 0 0
0 0 0 0 0 0 0 0 0 0 0 0 0 0 0 0 0 0 0 0 0
4 4 4 4 4 4 4 4 4 4 4 4 4 4 4 4 4 4 4 4 4
70.70 70.70 70.70 70.70 70.70 70.70 70.70 74.23 74.23 74.23 74.23 74.23 74.23 74.23 74.23 74.23 74.23 74.23 74.23 75.21 75.21
9,866 9,453 9,065 8,699 8,355 8,030 7,723 7,433 7,158 6,898 6,651 6,417 6,195 5,984 5,783 5,591 5,409 5,235 5,069 4,911 4,760
341 327 313 301 289 278 267 257 248 239 230 222 214 207 200 193 187 181 175 170 165
0.0099 0.0095 0.0091 0.0087 0.0084 0.0080 0.0077 0.0074 0.0072 0.0069 0.0067 0.0064 0.0062 0.0060 0.0058 0.0056 0.0054 0.0052 0.0051 0.0049 0.0048
0.64 0.61 0.58 0.56 0.54 0.52 0.50 0.48 0.48 0.47 0.45 0.43 0.42 0.40 0.39 0.38 0.36 0.35 0.34 0.33 0.33
9,866 9,453 9,065 8,699 8,355 8,030 7,723 7,433 7,158 6,898 6,651 6,417 6,195 5,984 5,783 5,591 5,409 5,235 5,069 4,911 4,760
0.64 0.61 0.58 0.56 0.54 0.52 0.50 0.48 0.48 0.47 0.45 0.43 0.42 0.40 0.39 0.38 0.36 0.35 0.34 0.33 0.33
0 0 0 0 0 0 0 0 0 0 0 0 0 0 0 0 0 0 0 0 0
0 0 0 0 0 0 0 0 0 0 0 0 0 0 0 0 0 0 0 0 0
0.00 0.00 0.00 0.00 0.00 0.00 0.00 0.00 0.00 0.00 0.00 0.00 0.00 0.00 0.00 0.00 0.00 0.00 0.00 0.00 0.00
0.013 0.013 0.013 0.013 0.013 0.013 0.013 0.013 0.014 0.014 0.014 0.014 0.014 0.014 0.014 0.014 0.014 0.014 0.014 0.014 0.014
0.01 0.01 0.01 0.01 0.01 0.01 0.01 0.01 0.01 0.01 0.01 0.01 0.01 0.01 0.01 0.01 0.01 0.01 0.01 0.01 0.01
0.00 0.00 0.00 0.00 0.00 0.00 0.00 0.00 0.00 0.00 0.00 0.00 0.00 0.00 0.00 0.00 0.00 0.00 0.00 0.00 0.00
0.03 0.03 0.03 0.03 0.03 0.02 0.02 0.02 0.02 0.02 0.02 0.02 0.02 0.02 0.02 0.02 0.02 0.02 0.02 0.02 0.02
0.03 0.03 0.03 0.03 0.03 0.02 0.02 0.02 0.02 0.02 0.02 0.02 0.02 0.02 0.02 0.02 0.02 0.02 0.02 0.02 0.02
0.027 0.027 0.026 0.026 0.025 0.025 0.025 0.024 0.024 0.023 0.023 0.023 0.022 0.022 0.022 0.022 0.021 0.021 0.021 0.021 0.021
0.027 0.027 0.026 0.026 0.025 0.025 0.025 0.024 0.024 0.023 0.023 0.023 0.022 0.022 0.022 0.022 0.021 0.021 0.021 0.021 0.021
0.000 0.000 0.000 0.000 0.000 0.000 0.000 0.000 0.000 0.000 0.000 0.000 0.000 0.000 0.000 0.000 0.000 0.000 0.000 0.000 0.000
0.30 0.29 0.28 0.27 0.26 0.25 0.24 0.23 0.23 0.22 0.21 0.21 0.20 0.19 0.18 0.18 0.17 0.17 0.16 0.15 0.15
0.00 0.00 0.00 0.00 0.00 0.00 0.00 0.00 0.00 0.00 0.00 0.00 0.00 0.00 0.00 0.00 0.00 0.00 0.00 0.00 0.00
0.00 0.00 0.00 0.00 0.00 0.00 0.00 0.00 0.00 0.00 0.00 0.00 0.00 0.00 0.00 0.00 0.00 0.00 0.00 0.00 0.00
0.00 0.00 0.00 0.00 0.00 0.00 0.00 0.00 0.00 0.00 0.00 0.00 0.00 0.00 0.00 0.00 0.00 0.00 0.00 0.00 0.00
0.03 0.03 0.03 0.03 0.03 0.02 0.02 0.02 0.02 0.02 0.02 0.02 0.02 0.02 0.02 0.02 0.02 0.02 0.02 0.02 0.02
0.6083 0.5818 0.5569 0.5334 0.5114 0.4906 0.4709 0.4524 0.4611 0.4436 0.4269 0.4111 0.3962 0.3819 0.3684 0.3556 0.3433 0.3316 0.3205 0.3099 0.3046
0.2433 0.2327 0.2228 0.2134 0.2045 0.1962 0.1884 0.1810 0.1844 0.1774 0.1708 0.1645 0.1585 0.1528 0.1474 0.1422 0.1373 0.1327 0.1282 0.1240 0.1218
0.3650 0.3491 0.3341 0.3201 0.3068 0.2943 0.2826 0.2714 0.2767 0.2661 0.2561 0.2467 0.2377 0.2292 0.2211 0.2133 0.2060 0.1990 0.1923 0.1859 0.1827
0.0044 0.0042 0.0040 0.0039 0.0037 0.0036 0.0035 0.0031 0.0032 0.0031 0.0030 0.0029 0.0028 0.0027 0.0026 0.0025 0.0024 0.0024 0.0023 0.0022 0.0022
0.0033 0.0032 0.0030 0.0029 0.0028 0.0027 0.0026 0.0024 0.0024 0.0023 0.0022 0.0022 0.0021 0.0020 0.0019 0.0019 0.0018 0.0018 0.0017 0.0016 0.0016
0.18 0.17 0.17 0.16 0.15 0.15 0.14 0.14 0.14 0.13 0.13 0.12 0.12 0.11 0.11 0.11 0.10 0.10 0.10 0.09 0.09
0.13 0.12 0.12 0.11 0.11 0.10 0.10 0.09 0.09 0.09 0.08 0.08 0.08 0.07 0.07 0.07 0.06 0.06 0.06 0.06 0.06
7.65 7.82 7.99 8.15 8.30 8.45 8.59 8.73 8.87 9.00 9.13 9.25 9.37 9.49 9.60 9.70 9.81 9.90 10.00 10.09 10.19
0.03 0.03 0.03 0.03 0.03 0.02 0.02 0.02 0.02 0.02 0.02 0.02 0.02 0.02 0.02 0.02 0.02 0.02 0.02 0.02 0.02
7.21 7.23 7.26 7.29 7.31 7.34 7.36 7.38 7.41 7.43 7.45 7.48 7.50 7.52 7.54 7.57 7.59 7.61 7.63 7.65 7.67
0.27 0.26 0.25 0.24 0.23 0.22 0.21 0.21 0.21 0.20 0.19 0.19 0.18 0.17 0.17 0.16 0.16 0.15 0.15 0.14 0.14
17.47 17.73 17.98 18.22 18.45 18.67 18.88 19.09 19.30 19.50 19.69 19.88 20.06 20.23 20.40 20.57 20.73 20.88 21.03 21.17 21.32
1 1 1 1 1 1 1 1 1 1 1 1 1 1 1 1 1 1 1 1 1
Page 3 of 6 Sidetracks Only Case 5/15/201812:00 AM

Yr‐Mo
Oil VolumeExisting ProductionWorkovers ‐ SI or BP
SidetracksNumber of Producing Wells
Existing ProductionWorkovers ‐ SI or BP
Sidetracks
W Rustavi Oil ProductionDaily Production
Monthly Oil MMbblsW Rustavi Revenue
Total ProductionTotal Project Revenue M$
WorkoversNew Wells
CAPEX TOTAL
Fixed Opex+OHFloating Opex
WorkoversTotal W Rustavi Opex
OPEX TOTAL
Recoverable OpexContractor Opex Cost Oil
Unrecovered OpexCapex recovery LimitRecoverable Capex
Contractor Capex Cost OilUnrecovered Capex
Total Cost Oil
Total Profit OilContractor Profit Oil
Govt. Profit OilTotal Contrctr Cost and Profit Oil, MMBbl
Evaluated Net Oil, MMBbl
Cash FlowDCF @10%
Cumulative CF
Total Costs Incurred for Production, MM$Cumulative Total Costs, MM$
Cntrctr's Total Profit from Sales of Oil, MM$Cumulative Total Profit, MM$
Payout? 1=yes, 0=no
Ope
x
W Rustavi
Cost Recov
ery
Profit Sh
are
YearMonth
Brent Oil Price
Reve
nue
W Rustavi
Prod
uctio
n
W Rustavi
CAPE
X
W
Rustavi
W Rustavi
Payo
utDate
W Rustavi
W Rustavi
WRu
stavi
Cash
Flow
03/23 04/23 05/23 06/23 07/23 08/23 09/23 10/23 11/23 12/23 01/24 02/24 03/24 04/24 05/24 06/24 07/24 08/24 09/24 10/24 11/24
6 6 6 6 6 6 6 6 6 6 7 7 7 7 7 7 7 7 7 7 763 64 65 66 67 68 69 70 71 72 73 74 75 76 77 78 79 80 81 82 83
0 0 0 0 0 0 0 0 0 0 0 0 0 0 0 0 0 0 0 0 0
0 0 0 0 0 0 0 0 0 0 0 0 0 0 0 0 0 0 0 0 0
4,615 4,477 4,345 4,218 4,096 3,980 3,868 3,761 3,658 3,559 3,464 3,373 3,285 3,200 3,118 3,040 2,964 2,891 2,821 2,753 2,687
4 4 4 4 4 4 4 4 4 4 4 4 4 4 4 4 4 4 4 4 4
0 0 0 0 0 0 0 0 0 0 0 0 0 0 0 0 0 0 0 0 0
0 0 0 0 0 0 0 0 0 0 0 0 0 0 0 0 0 0 0 0 0
4 4 4 4 4 4 4 4 4 4 4 4 4 4 4 4 4 4 4 4 4
75.21 75.21 75.21 75.21 75.21 75.21 75.21 75.21 75.21 75.21 76.23 76.23 76.23 76.23 76.23 76.23 76.23 76.23 76.23 76.23 76.23
4,615 4,477 4,345 4,218 4,096 3,980 3,868 3,761 3,658 3,559 3,464 3,373 3,285 3,200 3,118 3,040 2,964 2,891 2,821 2,753 2,687
160 155 150 146 142 138 134 130 127 123 120 117 114 111 108 105 103 100 98 95 93
0.0046 0.0045 0.0043 0.0042 0.0041 0.0040 0.0039 0.0038 0.0037 0.0036 0.0035 0.0034 0.0033 0.0032 0.0031 0.0030 0.0030 0.0029 0.0028 0.0028 0.0027
0.32 0.31 0.30 0.29 0.28 0.27 0.26 0.26 0.25 0.24 0.24 0.23 0.23 0.22 0.22 0.21 0.20 0.20 0.19 0.19 0.19
4,615 4,477 4,345 4,218 4,096 3,980 3,868 3,761 3,658 3,559 3,464 3,373 3,285 3,200 3,118 3,040 2,964 2,891 2,821 2,753 2,687
0.32 0.31 0.30 0.29 0.28 0.27 0.26 0.26 0.25 0.24 0.24 0.23 0.23 0.22 0.22 0.21 0.20 0.20 0.19 0.19 0.19
0 0 0 0 0 0 0 0 0 0 0 0 0 0 0 0 0 0 0 0 0
0 0 0 0 0 0 0 0 0 0 0 0 0 0 0 0 0 0 0 0 0
0.00 0.00 0.00 0.00 0.00 0.00 0.00 0.00 0.00 0.00 0.00 0.00 0.00 0.00 0.00 0.00 0.00 0.00 0.00 0.00 0.00
0.014 0.014 0.014 0.014 0.014 0.014 0.014 0.014 0.014 0.014 0.014 0.014 0.014 0.014 0.014 0.014 0.014 0.014 0.014 0.014 0.014
0.01 0.01 0.01 0.01 0.01 0.01 0.01 0.01 0.01 0.01 0.00 0.00 0.00 0.00 0.00 0.00 0.00 0.00 0.00 0.00 0.00
0.00 0.00 0.00 0.00 0.00 0.00 0.00 0.00 0.00 0.00 0.00 0.00 0.00 0.00 0.00 0.00 0.00 0.00 0.00 0.00 0.00
0.02 0.02 0.02 0.02 0.02 0.02 0.02 0.02 0.02 0.02 0.02 0.02 0.02 0.02 0.02 0.02 0.02 0.02 0.02 0.02 0.02
0.02 0.02 0.02 0.02 0.02 0.02 0.02 0.02 0.02 0.02 0.02 0.02 0.02 0.02 0.02 0.02 0.02 0.02 0.02 0.02 0.02
0.020 0.020 0.020 0.020 0.020 0.020 0.019 0.019 0.019 0.019 0.019 0.019 0.019 0.019 0.019 0.019 0.018 0.018 0.018 0.018 0.018
0.020 0.020 0.020 0.020 0.020 0.020 0.019 0.019 0.019 0.019 0.019 0.019 0.019 0.019 0.019 0.019 0.018 0.018 0.018 0.018 0.018
0.000 0.000 0.000 0.000 0.000 0.000 0.000 0.000 0.000 0.000 0.000 0.000 0.000 0.000 0.000 0.000 0.000 0.000 0.000 0.000 0.000
0.15 0.14 0.14 0.13 0.13 0.13 0.12 0.12 0.11 0.11 0.11 0.11 0.10 0.10 0.10 0.10 0.09 0.09 0.09 0.09 0.08
0.00 0.00 0.00 0.00 0.00 0.00 0.00 0.00 0.00 0.00 0.00 0.00 0.00 0.00 0.00 0.00 0.00 0.00 0.00 0.00 0.00
0.00 0.00 0.00 0.00 0.00 0.00 0.00 0.00 0.00 0.00 0.00 0.00 0.00 0.00 0.00 0.00 0.00 0.00 0.00 0.00 0.00
0.00 0.00 0.00 0.00 0.00 0.00 0.00 0.00 0.00 0.00 0.00 0.00 0.00 0.00 0.00 0.00 0.00 0.00 0.00 0.00 0.00
0.02 0.02 0.02 0.02 0.02 0.02 0.02 0.02 0.02 0.02 0.02 0.02 0.02 0.02 0.02 0.02 0.02 0.02 0.02 0.02 0.02
0.2947 0.2853 0.2764 0.2678 0.2595 0.2516 0.2440 0.2368 0.2298 0.2231 0.2167 0.2140 0.2080 0.2021 0.1965 0.1911 0.1860 0.1809 0.1761 0.1714 0.1669
0.1179 0.1141 0.1105 0.1071 0.1038 0.1006 0.0976 0.0947 0.0919 0.0892 0.0867 0.0856 0.0832 0.0809 0.0786 0.0765 0.0744 0.0724 0.0704 0.0686 0.0668
0.1768 0.1712 0.1658 0.1607 0.1557 0.1510 0.1464 0.1421 0.1379 0.1339 0.1300 0.1284 0.1248 0.1213 0.1179 0.1147 0.1116 0.1086 0.1057 0.1029 0.1002
0.0021 0.0020 0.0020 0.0019 0.0019 0.0018 0.0018 0.0017 0.0017 0.0016 0.0016 0.0016 0.0015 0.0015 0.0014 0.0014 0.0014 0.0013 0.0013 0.0013 0.0013
0.0016 0.0015 0.0015 0.0014 0.0014 0.0014 0.0013 0.0013 0.0013 0.0012 0.0012 0.0012 0.0011 0.0011 0.0011 0.0011 0.0010 0.0010 0.0010 0.0010 0.0009
0.09 0.09 0.08 0.08 0.08 0.08 0.07 0.07 0.07 0.07 0.06 0.06 0.06 0.06 0.06 0.06 0.06 0.05 0.05 0.05 0.05
0.05 0.05 0.05 0.05 0.05 0.04 0.04 0.04 0.04 0.04 0.04 0.04 0.03 0.03 0.03 0.03 0.03 0.03 0.03 0.03 0.03
10.27 10.36 10.44 10.52 10.60 10.68 10.75 10.82 10.89 10.96 11.02 11.09 11.15 11.21 11.27 11.32 11.38 11.43 11.49 11.54 11.59
0.02 0.02 0.02 0.02 0.02 0.02 0.02 0.02 0.02 0.02 0.02 0.02 0.02 0.02 0.02 0.02 0.02 0.02 0.02 0.02 0.02
7.69 7.71 7.73 7.75 7.77 7.79 7.81 7.83 7.85 7.87 7.89 7.91 7.92 7.94 7.96 7.98 8.00 8.02 8.04 8.05 8.07
0.14 0.13 0.13 0.13 0.12 0.12 0.12 0.11 0.11 0.11 0.11 0.10 0.10 0.10 0.10 0.09 0.09 0.09 0.09 0.09 0.08
21.45 21.59 21.72 21.85 21.97 22.09 22.21 22.32 22.43 22.54 22.65 22.75 22.85 22.95 23.05 23.14 23.24 23.33 23.42 23.50 23.59
1 1 1 1 1 1 1 1 1 1 1 1 1 1 1 1 1 1 1 1 1
Page 4 of 6 Sidetracks Only Case 5/15/201812:00 AM

Yr‐Mo
Oil VolumeExisting ProductionWorkovers ‐ SI or BP
SidetracksNumber of Producing Wells
Existing ProductionWorkovers ‐ SI or BP
Sidetracks
W Rustavi Oil ProductionDaily Production
Monthly Oil MMbblsW Rustavi Revenue
Total ProductionTotal Project Revenue M$
WorkoversNew Wells
CAPEX TOTAL
Fixed Opex+OHFloating Opex
WorkoversTotal W Rustavi Opex
OPEX TOTAL
Recoverable OpexContractor Opex Cost Oil
Unrecovered OpexCapex recovery LimitRecoverable Capex
Contractor Capex Cost OilUnrecovered Capex
Total Cost Oil
Total Profit OilContractor Profit Oil
Govt. Profit OilTotal Contrctr Cost and Profit Oil, MMBbl
Evaluated Net Oil, MMBbl
Cash FlowDCF @10%
Cumulative CF
Total Costs Incurred for Production, MM$Cumulative Total Costs, MM$
Cntrctr's Total Profit from Sales of Oil, MM$Cumulative Total Profit, MM$
Payout? 1=yes, 0=no
Ope
x
W Rustavi
Cost Recov
ery
Profit Sh
are
YearMonth
Brent Oil Price
Reve
nue
W Rustavi
Prod
uctio
n
W Rustavi
CAPE
X
W
Rustavi
W Rustavi
Payo
utDate
W Rustavi
W Rustavi
WRu
stavi
Cash
Flow
12/24 01/25 02/25 03/25 04/25 05/25 06/25 07/25 08/25 09/25 10/25 11/25 12/25 01/26 02/26 03/26 04/26 05/26 06/26 07/26 08/26
7 8 8 8 8 8 8 8 8 8 8 8 8 9 9 9 9 9 9 9 984 85 86 87 88 89 90 91 92 93 94 95 96 97 98 99 100 101 102 103 104
0 0 0 0 0 0 0 0 0 0 0 0 0 0 0 0 0 0 0 0 0
0 0 0 0 0 0 0 0 0 0 0 0 0 0 0 0 0 0 0 0 0
2,624 2,562 2,503 2,446 2,390 2,337 2,285 2,235 2,186 2,139 2,094 2,049 2,006 1,965 1,925 1,885 1,847 1,810 1,775 1,740 1,706
4 4 4 4 4 4 4 4 4 4 4 4 4 4 4 4 4 4 4 4 4
0 0 0 0 0 0 0 0 0 0 0 0 0 0 0 0 0 0 0 0 0
0 0 0 0 0 0 0 0 0 0 0 0 0 0 0 0 0 0 0 0 0
4 4 4 4 4 4 4 4 4 4 4 4 4 4 4 4 4 4 4 4 4
76.23 77.26 77.26 77.26 77.26 77.26 77.26 77.26 77.26 77.26 77.26 77.26 77.26 78.37 78.37 78.37 78.37 78.37 78.37 78.37 78.37
2,624 2,562 2,503 2,446 2,390 2,337 2,285 2,235 2,186 2,139 2,094 2,049 2,006 1,965 1,925 1,885 1,847 1,810 1,775 1,740 1,706
91 89 87 85 83 81 79 77 76 74 72 71 69 68 67 65 64 63 61 60 59
0.0026 0.0026 0.0025 0.0024 0.0024 0.0023 0.0023 0.0022 0.0022 0.0021 0.0021 0.0020 0.0020 0.0020 0.0019 0.0019 0.0018 0.0018 0.0018 0.0017 0.0017
0.18 0.18 0.17 0.17 0.17 0.16 0.16 0.16 0.15 0.15 0.15 0.14 0.14 0.14 0.14 0.13 0.13 0.13 0.13 0.12 0.12
2,624 2,562 2,503 2,446 2,390 2,337 2,285 2,235 2,186 2,139 2,094 2,049 2,006 1,965 1,925 1,885 1,847 1,810 1,775 1,740 1,706
0.18 0.18 0.17 0.17 0.17 0.16 0.16 0.16 0.15 0.15 0.15 0.14 0.14 0.14 0.14 0.13 0.13 0.13 0.13 0.12 0.12
0 0 0 0 0 0 0 0 0 0 0 0 0 0 0 0 0 0 0 0 0
0 0 0 0 0 0 0 0 0 0 0 0 0 0 0 0 0 0 0 0 0
0.00 0.00 0.00 0.00 0.00 0.00 0.00 0.00 0.00 0.00 0.00 0.00 0.00 0.00 0.00 0.00 0.00 0.00 0.00 0.00 0.00
0.014 0.014 0.014 0.014 0.014 0.014 0.014 0.014 0.014 0.015 0.015 0.015 0.015 0.015 0.015 0.015 0.015 0.015 0.015 0.015 0.015
0.00 0.00 0.00 0.00 0.00 0.00 0.00 0.00 0.00 0.00 0.00 0.00 0.00 0.00 0.00 0.00 0.00 0.00 0.00 0.00 0.00
0.00 0.00 0.00 0.00 0.00 0.00 0.00 0.00 0.00 0.00 0.00 0.00 0.00 0.00 0.00 0.00 0.00 0.00 0.00 0.00 0.00
0.02 0.02 0.02 0.02 0.02 0.02 0.02 0.02 0.02 0.02 0.02 0.02 0.02 0.02 0.02 0.02 0.02 0.02 0.02 0.02 0.02
0.02 0.02 0.02 0.02 0.02 0.02 0.02 0.02 0.02 0.02 0.02 0.02 0.02 0.02 0.02 0.02 0.02 0.02 0.02 0.02 0.02
0.018 0.018 0.018 0.018 0.018 0.018 0.018 0.018 0.018 0.018 0.018 0.017 0.017 0.017 0.017 0.017 0.017 0.017 0.017 0.017 0.017
0.018 0.018 0.018 0.018 0.018 0.018 0.018 0.018 0.018 0.018 0.018 0.017 0.017 0.017 0.017 0.017 0.017 0.017 0.017 0.017 0.017
0.000 0.000 0.000 0.000 0.000 0.000 0.000 0.000 0.000 0.000 0.000 0.000 0.000 0.000 0.000 0.000 0.000 0.000 0.000 0.000 0.000
0.08 0.08 0.08 0.08 0.07 0.07 0.07 0.07 0.07 0.07 0.06 0.06 0.06 0.06 0.06 0.06 0.06 0.06 0.05 0.05 0.05
0.00 0.00 0.00 0.00 0.00 0.00 0.00 0.00 0.00 0.00 0.00 0.00 0.00 0.00 0.00 0.00 0.00 0.00 0.00 0.00 0.00
0.00 0.00 0.00 0.00 0.00 0.00 0.00 0.00 0.00 0.00 0.00 0.00 0.00 0.00 0.00 0.00 0.00 0.00 0.00 0.00 0.00
0.00 0.00 0.00 0.00 0.00 0.00 0.00 0.00 0.00 0.00 0.00 0.00 0.00 0.00 0.00 0.00 0.00 0.00 0.00 0.00 0.00
0.02 0.02 0.02 0.02 0.02 0.02 0.02 0.02 0.02 0.02 0.02 0.02 0.02 0.02 0.02 0.02 0.02 0.02 0.02 0.02 0.02
0.1626 0.1584 0.1570 0.1530 0.1491 0.1454 0.1418 0.1383 0.1349 0.1317 0.1285 0.1254 0.1224 0.1196 0.1189 0.1162 0.1135 0.1109 0.1083 0.1059 0.1035
0.0650 0.0634 0.0628 0.0612 0.0597 0.0582 0.0567 0.0553 0.0540 0.0527 0.0514 0.0502 0.0490 0.0478 0.0476 0.0465 0.0454 0.0443 0.0433 0.0423 0.0414
0.0976 0.0950 0.0942 0.0918 0.0895 0.0873 0.0851 0.0830 0.0810 0.0790 0.0771 0.0753 0.0735 0.0717 0.0714 0.0697 0.0681 0.0665 0.0650 0.0635 0.0621
0.0012 0.0012 0.0012 0.0012 0.0011 0.0011 0.0011 0.0011 0.0010 0.0010 0.0010 0.0010 0.0010 0.0009 0.0009 0.0009 0.0009 0.0009 0.0009 0.0009 0.0008
0.0009 0.0009 0.0009 0.0009 0.0009 0.0008 0.0008 0.0008 0.0008 0.0008 0.0008 0.0007 0.0007 0.0007 0.0007 0.0007 0.0007 0.0007 0.0007 0.0006 0.0006
0.05 0.05 0.05 0.05 0.04 0.04 0.04 0.04 0.04 0.04 0.04 0.04 0.04 0.04 0.04 0.03 0.03 0.03 0.03 0.03 0.03
0.03 0.02 0.02 0.02 0.02 0.02 0.02 0.02 0.02 0.02 0.02 0.02 0.02 0.02 0.02 0.02 0.02 0.01 0.01 0.01 0.01
11.64 11.69 11.73 11.78 11.82 11.87 11.91 11.95 11.99 12.03 12.07 12.11 12.14 12.18 12.22 12.25 12.28 12.32 12.35 12.38 12.41
0.02 0.02 0.02 0.02 0.02 0.02 0.02 0.02 0.02 0.02 0.02 0.02 0.02 0.02 0.02 0.02 0.02 0.02 0.02 0.02 0.02
8.09 8.11 8.13 8.14 8.16 8.18 8.20 8.21 8.23 8.25 8.27 8.28 8.30 8.32 8.34 8.35 8.37 8.39 8.41 8.42 8.44
0.08 0.08 0.08 0.08 0.08 0.08 0.07 0.07 0.07 0.07 0.07 0.07 0.07 0.07 0.06 0.06 0.06 0.06 0.06 0.06 0.06
23.67 23.75 23.83 23.91 23.99 24.07 24.14 24.21 24.28 24.35 24.42 24.49 24.56 24.62 24.69 24.75 24.81 24.88 24.94 25.00 25.06
1 1 1 1 1 1 1 1 1 1 1 1 1 1 1 1 1 1 1 1 1
Page 5 of 6 Sidetracks Only Case 5/15/201812:00 AM
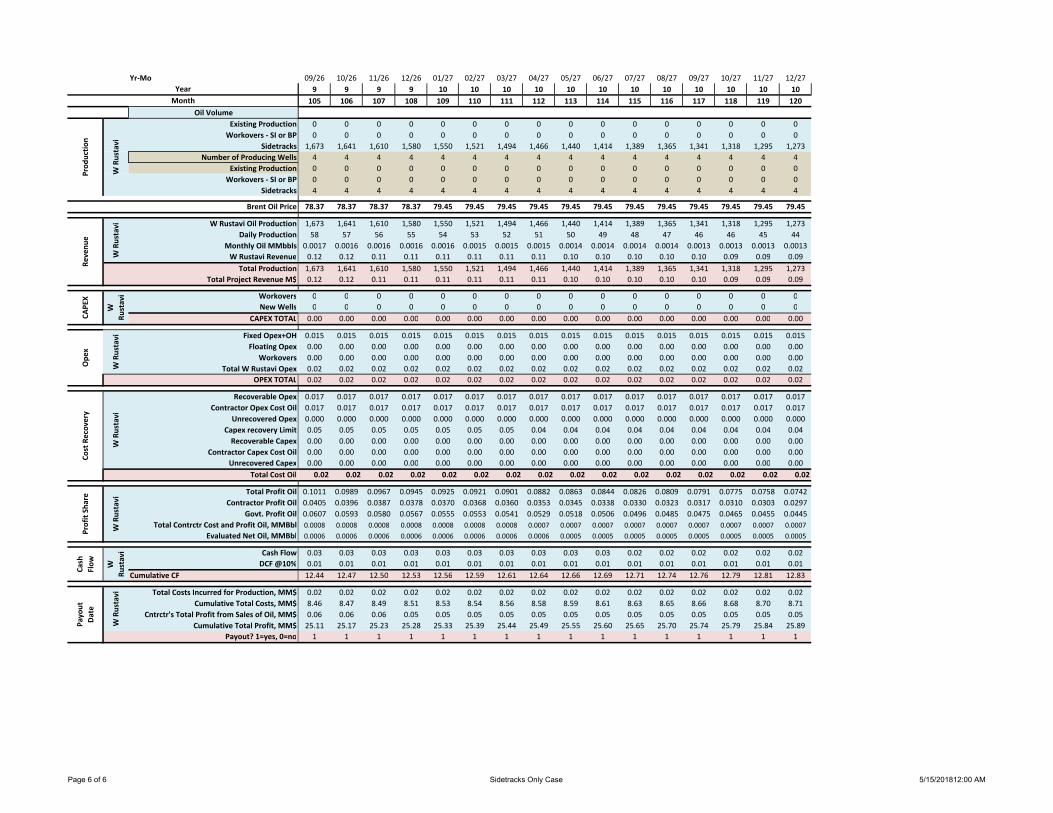
Yr‐Mo
Oil VolumeExisting ProductionWorkovers ‐ SI or BP
SidetracksNumber of Producing Wells
Existing ProductionWorkovers ‐ SI or BP
Sidetracks
W Rustavi Oil ProductionDaily Production
Monthly Oil MMbblsW Rustavi Revenue
Total ProductionTotal Project Revenue M$
WorkoversNew Wells
CAPEX TOTAL
Fixed Opex+OHFloating Opex
WorkoversTotal W Rustavi Opex
OPEX TOTAL
Recoverable OpexContractor Opex Cost Oil
Unrecovered OpexCapex recovery LimitRecoverable Capex
Contractor Capex Cost OilUnrecovered Capex
Total Cost Oil
Total Profit OilContractor Profit Oil
Govt. Profit OilTotal Contrctr Cost and Profit Oil, MMBbl
Evaluated Net Oil, MMBbl
Cash FlowDCF @10%
Cumulative CF
Total Costs Incurred for Production, MM$Cumulative Total Costs, MM$
Cntrctr's Total Profit from Sales of Oil, MM$Cumulative Total Profit, MM$
Payout? 1=yes, 0=no
Ope
x
W Rustavi
Cost Recov
ery
Profit Sh
are
YearMonth
Brent Oil Price
Reve
nue
W Rustavi
Prod
uctio
n
W Rustavi
CAPE
X
W
Rustavi
W Rustavi
Payo
utDate
W Rustavi
W Rustavi
WRu
stavi
Cash
Flow
09/26 10/26 11/26 12/26 01/27 02/27 03/27 04/27 05/27 06/27 07/27 08/27 09/27 10/27 11/27 12/27
9 9 9 9 10 10 10 10 10 10 10 10 10 10 10 10105 106 107 108 109 110 111 112 113 114 115 116 117 118 119 120
0 0 0 0 0 0 0 0 0 0 0 0 0 0 0 0
0 0 0 0 0 0 0 0 0 0 0 0 0 0 0 0
1,673 1,641 1,610 1,580 1,550 1,521 1,494 1,466 1,440 1,414 1,389 1,365 1,341 1,318 1,295 1,273
4 4 4 4 4 4 4 4 4 4 4 4 4 4 4 4
0 0 0 0 0 0 0 0 0 0 0 0 0 0 0 0
0 0 0 0 0 0 0 0 0 0 0 0 0 0 0 0
4 4 4 4 4 4 4 4 4 4 4 4 4 4 4 4
78.37 78.37 78.37 78.37 79.45 79.45 79.45 79.45 79.45 79.45 79.45 79.45 79.45 79.45 79.45 79.45
1,673 1,641 1,610 1,580 1,550 1,521 1,494 1,466 1,440 1,414 1,389 1,365 1,341 1,318 1,295 1,273
58 57 56 55 54 53 52 51 50 49 48 47 46 46 45 44
0.0017 0.0016 0.0016 0.0016 0.0016 0.0015 0.0015 0.0015 0.0014 0.0014 0.0014 0.0014 0.0013 0.0013 0.0013 0.0013
0.12 0.12 0.11 0.11 0.11 0.11 0.11 0.11 0.10 0.10 0.10 0.10 0.10 0.09 0.09 0.09
1,673 1,641 1,610 1,580 1,550 1,521 1,494 1,466 1,440 1,414 1,389 1,365 1,341 1,318 1,295 1,273
0.12 0.12 0.11 0.11 0.11 0.11 0.11 0.11 0.10 0.10 0.10 0.10 0.10 0.09 0.09 0.09
0 0 0 0 0 0 0 0 0 0 0 0 0 0 0 0
0 0 0 0 0 0 0 0 0 0 0 0 0 0 0 0
0.00 0.00 0.00 0.00 0.00 0.00 0.00 0.00 0.00 0.00 0.00 0.00 0.00 0.00 0.00 0.00
0.015 0.015 0.015 0.015 0.015 0.015 0.015 0.015 0.015 0.015 0.015 0.015 0.015 0.015 0.015 0.015
0.00 0.00 0.00 0.00 0.00 0.00 0.00 0.00 0.00 0.00 0.00 0.00 0.00 0.00 0.00 0.00
0.00 0.00 0.00 0.00 0.00 0.00 0.00 0.00 0.00 0.00 0.00 0.00 0.00 0.00 0.00 0.00
0.02 0.02 0.02 0.02 0.02 0.02 0.02 0.02 0.02 0.02 0.02 0.02 0.02 0.02 0.02 0.02
0.02 0.02 0.02 0.02 0.02 0.02 0.02 0.02 0.02 0.02 0.02 0.02 0.02 0.02 0.02 0.02
0.017 0.017 0.017 0.017 0.017 0.017 0.017 0.017 0.017 0.017 0.017 0.017 0.017 0.017 0.017 0.017
0.017 0.017 0.017 0.017 0.017 0.017 0.017 0.017 0.017 0.017 0.017 0.017 0.017 0.017 0.017 0.017
0.000 0.000 0.000 0.000 0.000 0.000 0.000 0.000 0.000 0.000 0.000 0.000 0.000 0.000 0.000 0.000
0.05 0.05 0.05 0.05 0.05 0.05 0.05 0.04 0.04 0.04 0.04 0.04 0.04 0.04 0.04 0.04
0.00 0.00 0.00 0.00 0.00 0.00 0.00 0.00 0.00 0.00 0.00 0.00 0.00 0.00 0.00 0.00
0.00 0.00 0.00 0.00 0.00 0.00 0.00 0.00 0.00 0.00 0.00 0.00 0.00 0.00 0.00 0.00
0.00 0.00 0.00 0.00 0.00 0.00 0.00 0.00 0.00 0.00 0.00 0.00 0.00 0.00 0.00 0.00
0.02 0.02 0.02 0.02 0.02 0.02 0.02 0.02 0.02 0.02 0.02 0.02 0.02 0.02 0.02 0.02
0.1011 0.0989 0.0967 0.0945 0.0925 0.0921 0.0901 0.0882 0.0863 0.0844 0.0826 0.0809 0.0791 0.0775 0.0758 0.0742
0.0405 0.0396 0.0387 0.0378 0.0370 0.0368 0.0360 0.0353 0.0345 0.0338 0.0330 0.0323 0.0317 0.0310 0.0303 0.0297
0.0607 0.0593 0.0580 0.0567 0.0555 0.0553 0.0541 0.0529 0.0518 0.0506 0.0496 0.0485 0.0475 0.0465 0.0455 0.0445
0.0008 0.0008 0.0008 0.0008 0.0008 0.0008 0.0008 0.0007 0.0007 0.0007 0.0007 0.0007 0.0007 0.0007 0.0007 0.0007
0.0006 0.0006 0.0006 0.0006 0.0006 0.0006 0.0006 0.0006 0.0005 0.0005 0.0005 0.0005 0.0005 0.0005 0.0005 0.0005
0.03 0.03 0.03 0.03 0.03 0.03 0.03 0.03 0.03 0.03 0.02 0.02 0.02 0.02 0.02 0.02
0.01 0.01 0.01 0.01 0.01 0.01 0.01 0.01 0.01 0.01 0.01 0.01 0.01 0.01 0.01 0.01
12.44 12.47 12.50 12.53 12.56 12.59 12.61 12.64 12.66 12.69 12.71 12.74 12.76 12.79 12.81 12.83
0.02 0.02 0.02 0.02 0.02 0.02 0.02 0.02 0.02 0.02 0.02 0.02 0.02 0.02 0.02 0.02
8.46 8.47 8.49 8.51 8.53 8.54 8.56 8.58 8.59 8.61 8.63 8.65 8.66 8.68 8.70 8.71
0.06 0.06 0.06 0.05 0.05 0.05 0.05 0.05 0.05 0.05 0.05 0.05 0.05 0.05 0.05 0.05
25.11 25.17 25.23 25.28 25.33 25.39 25.44 25.49 25.55 25.60 25.65 25.70 25.74 25.79 25.84 25.89
1 1 1 1 1 1 1 1 1 1 1 1 1 1 1 1
Page 6 of 6 Sidetracks Only Case 5/15/201812:00 AM


![RUSTAVI 2050 - pracowniamiejska.plpracowniamiejska.pl/wp-content/uploads/2019/05/Rustavi_finalreport-1.pdf · 2 Justyna Król, Pracownia Miejska [Urban Workshop] for United Nations](https://img.pdfslide.us/doc/110x75/5e11336f030fec7c1553aeef/rustavi-2050-2-justyna-krl-pracownia-miejska-urban-workshop-for-united-nations.jpg)


![Yamamoto, Norio. Peru and Bolivia. the Sounds of Evolving... (1997) [1992]](https://img.pdfslide.us/doc/110x75/5695d5171a28ab9b02a402a8/yamamoto-norio-peru-and-bolivia-the-sounds-of-evolving-1997-1992.jpg)