Embed Size (px)
Citation preview

14/08/2012
1
From “Sickman” to “New Tiger”
The Philippine Economy in an Asian Perspective
Norio Usui
Philippines Country Office
ASCEND Forum, 23 August, 2012
Presentation
Question 1
– How can we assess the Philippine economy?
– From “Sickman” to “Next Tiger” A real story?
Question 2
– How inclusive the past growth was?
– What can we do to make the growth more inclusive? What are missing here?
How can we assess the recent jump? Surprising 6.4% growth in Q1, 2012
2012
4.9 3.6 3.2 4.0
6.4
-15
-10
-5
0
5
10
15
20
25
Q1 Q2 Q3 Q4 Q1 Q2 Q3 Q4 Q1 Q2 Q3 Q4 Q1 Q2 Q3 Q4 Q1
Private Consumption Government Consumption Capital Formation
Exports Imports Statistical Discrepancy
GDP
2009 2010 2011 2008
%
Strong private consumption backed by remittances and lower inflation
2.9
-
1
2
3
4
5
6
Jan-1
1
Feb
Mar
Ap
r
May
Jun
e
July
Au
g
Sep
Oct
No
v
Dec
Jan-1
2
Feb
Mar
Ap
r
May
Food and Non-Alcoholic Beverages Fuel, light, water Transport Others Headline Inflation
%
0
5
10
15
20
25
2000 2002 2004 2006 2008 2010
Asia Americas
Middle East Europe
Others
$ billion Remittance inflows Inflation
Slowdown of investment? Significant 23.5% drop in Q1, 2012
Peso million (constant prices)
TYPE OF EXPENDITURE Q1 2011 Q1 2012 Growth (%)
Capital Formation 333,866 255,556 -23.5
Fixed Capital 319,949 328,887 2.8
Construction 108,012 108,290 0.3
Durable Equipment 179,019 185,428 3.6
Breeding Stock & Orchard Dev't 26,808 27,103 1.1
Intellectual Property Products 6,110 8,066 32.0
Changes in Inventories 13,917 -73,331
Construction Is private construction really weak?
0
20,000
40,000
60,000
80,000
100,000
120,000
Q1 2011 Q1 2012
Public Private
↓ 9.9%
↑62.2%
↑ 0.3%
Peso million (constant prices)
6.6
-9.9
-60
-40
-20
0
20
40
60
80
Mar-07
Au
g-07
Jan-08
Jun
-08
No
v-08
Ap
r-09
Sep-0
9
Feb-10
Jul-10
Dec-10
May-1
1
Oct-1
1
Mar-12
Building permit issued
Private construction (GVA)
Building permit and Private construction
%
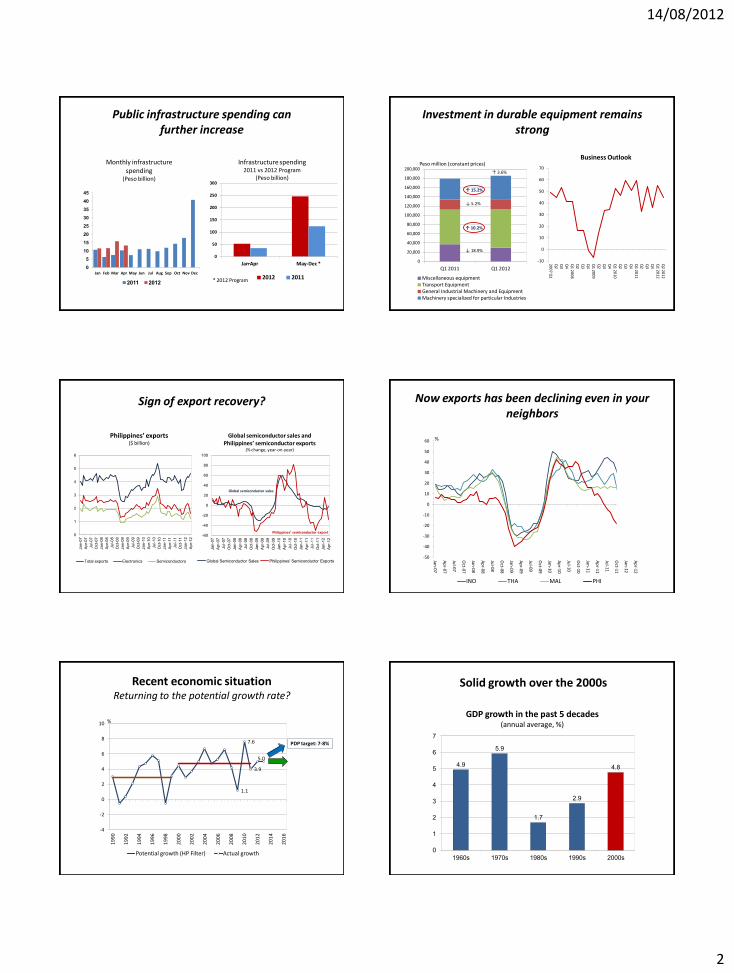
14/08/2012
2
Monthly infrastructure spending
(Peso billion)
Infrastructure spending 2011 vs 2012 Program
(Peso billion)
0
5
10
15
20
25
30
35
40
45
Jan Feb Mar Apr May Jun Jul Aug Sep Oct Nov Dec
2011 2012
0
50
100
150
200
250
300
Jan Apr May-Dec *
2012 2011 * 2012 Program
Public infrastructure spending can further increase
Investment in durable equipment remains strong
0
20,000
40,000
60,000
80,000
100,000
120,000
140,000
160,000
180,000
200,000
Q1 2011 Q1 2012
Miscellaneous equipment Transport Equipment General Industrial Machinery and Equipment Machinery specialized for particular Industries
↑ 3.6%
↑ 15.2%
↓ 18.9%
↓ 5.2%
Peso million (constant prices)
↑ 10.2%
-10
0
10
20
30
40
50
60
70
20
07
Q1
Q
2
Q3
Q
4
Q1
20
08
Q
2
Q3
Q
4
Q1
20
09
Q
2
Q3
Q
4
Q1
20
10
Q
2
Q3
Q
4
Q1
20
11
Q
2
Q3
Q
4
Q1
20
12
Q
2 2
01
2
Business Outlook
-60
-40
-20
0
20
40
60
80
100
Ja
n-0
7
Ap
r-0
7
Ju
l-0
7
Oct-
07
Ja
n-0
8
Ap
r-0
8
Ju
l-0
8
Oct-
08
Ja
n-0
9
Ap
r-0
9
Ju
l-0
9
Oct-
09
Ja
n-1
0
Ap
r-1
0
Ju
l-1
0
Oct-
10
Ja
n-1
1
Ap
r-1
1
Ju
l-1
1
Oct-
11
Ja
n-1
2
Ap
r-1
2
Global Semiconductor Sales Philippines' Semiconductor Exports
Sign of export recovery?
Global semiconductor sales
Philippines’ semiconductor export
Philippines’ exports ($ billion)
Global semiconductor sales and Philippines’ semiconductor exports
(% change, year-on-year)
0
1
2
3
4
5
6
Ja
n-0
7
Ap
r-0
7
Ju
l-0
7
Oct-
07
Ja
n-0
8
Ap
r-0
8
Ju
l-0
8
Oct-
08
Ja
n-0
9
Ap
r-0
9
Ju
l-0
9
Oct-
09
Ja
n-1
0
Ap
r-1
0
Ju
l-1
0
Oct-
10
Ja
n-1
1
Ap
r-1
1
Ju
l-1
1
Oct-
11
Ja
n-1
2
Ap
r-1
2
Total exports Electronics Semiconductors
Now exports has been declining even in your neighbors
-50
-40
-30
-20
-10
0
10
20
30
40
50
60
Jan-07
Ap
r-07
Jul-07
Oct-07
Jan-08
Ap
r-08
Jul-08
Oct-08
Jan-09
Ap
r-09
Jul-09
Oct-09
Jan-10
Ap
r-10
Jul-10
Oct-10
Jan-11
Ap
r-11
Jul-11
Oct-11
Jan-12
Ap
r-12
INO THA MAL PHI
%
Recent economic situation Returning to the potential growth rate?
PDP target: 7-8%
1.1
7.6
3.9
5.0
-4
-2
0
2
4
6
8
10
19
90
19
92
19
94
19
96
19
98
20
00
20
02
20
04
20
06
20
08
20
10
20
12
20
14
20
16
Potential growth (HP Filter) Actual growth
% GDP growth in the past 5 decades
(annual average, %)
4.9
5.9
1.7
2.9
4.8
0
1
2
3
4
5
6
7
1960s 1970s 1980s 1990s 2000s
Solid growth over the 2000s

14/08/2012
3
Let it be….
Let it be, let it be
Let it be, let it be
There will be an answer
Let it be
Let it be, let it be
Let it be, let it be
Whisper words of wisdom
Let it be
Policy Option I don’t think so. Why?
Structural weaknesses
– Weak link between growth and development
– Rising growth and declining investment
– Limited diversification of exports
Long-term development puzzle
Sector Contributions to GDP Growth (1980-2009, %)
Your growth has depended more on services
13.2 18.8
24.1 27.0
15.4 14.5 10.3
19.6
30.4
41.5 38.7
59.5
32.8
50.3
18.9
38.9
0
20
40
60
80
100
1980 2009 1980 2009 1980 2009 1980 2009
Indonesia Malaysia Philippines Thailand
Industry Services
Employment Shares (1980 and 2009, % of total employment)
50.1 49.4
26.3
48.3
38.5 43.5
66.6
43.2
11.4 7.2 7.1 8.6
0
20
40
60
80
100
INO MAL PHI THA
Industry Services Agriculture
0
2,500
5,000
7,500
10,000
12,500
0
1,500
3,000
4,500
6,000
7,500
1980 1985 1990 1995 2000 2005
Indonesia Philippines Thailand
Malaysia Viet Nam
Economy-wide labor productivity 1980-2009
Constant 2000 $
MAL (RHS)
THA
INO
PHI
VIE
71.3
105.6
-1.8
77.8
35.8
9.0
12.2
98.2
-50
0
50
100
150
200
Indonesia Malaysia Philippines Thailand
Sectoral productivity growth
Structural transfromation
Growth Decomposition
Sector productivity and labor shift
0
2,000
4,000
6,000
8,000
10,000
12,000
Agriculture Industry Services Manufacturing
0
2,000
4,000
6,000
8,000
10,000
12,000
Agriculture Industry Services Manufacturing
0
10
20
30
40
50
60
70
80
1980
1982
1984
1986
1988
1990
1992
1994
1996
1998
2000
2002
2004
2006
0
10
20
30
40
50
60
70
80
19
80
19
82
19
84
19
86
19
88
19
90
19
92
19
94
19
96
19
98
20
00
20
02
20
04
20
06
Employment by sector
Labor productivity by sector
Growing business process outsourcing
5,288
7,717
0
4
8
12
16
20
0
2,000
4,000
6,000
8,000
10,000
2004 2005 2006 2007 2008 2009
Contact Center
Transcription
Animation
Software Development
Other BPOs
% of total export of goods & services (RHS)
355,135
444,811
0.0
0.4
0.8
1.2
1.6
2.0
0
100,000
200,000
300,000
400,000
500,000
2004 2005 2006 2007 2008 2009
Contact Center
Transcription
Animation
Software Development
Other BPOs
% of total labor force (RHS)
Export (million $) Employment (persons)
14/08/2012
4
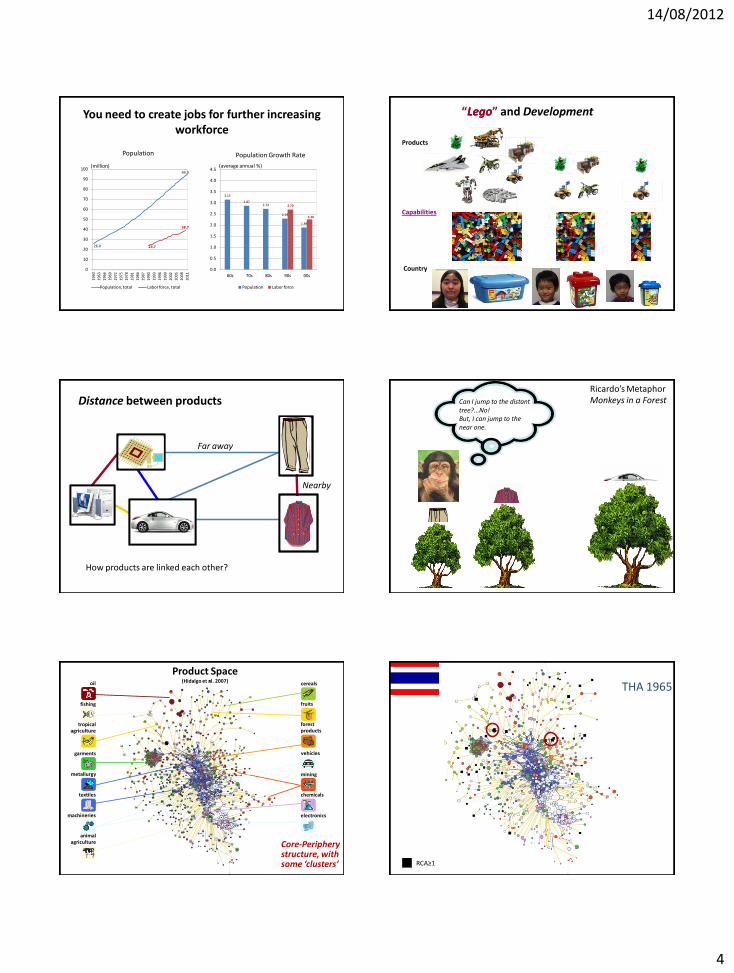
You need to create jobs for further increasing workforce
26.0
94.9
23.7
38.7
0
10
20
30
40
50
60
70
80
90
100
19
60
19
63
19
66
19
69
19
72
19
75
19
78
19
81
19
84
19
87
19
90
19
93
19
96
19
99
20
02
20
05
20
08
20
11
Population, total Labor force, total
3.15
2.87 2.73
2.29
1.89
2.70
2.26
0.0
0.5
1.0
1.5
2.0
2.5
3.0
3.5
4.0
4.5
60s 70s 80s 90s 00s
Population Labor force
(million) (average annual %)
Population Population Growth Rate
Country
Capabilities
Products
“LegoLego” and Development
Distance between products
Nearby
Far away
How products are linked each other?
Ricardo’s Metaphor Monkeys in a Forest Can I jump to the distant
tree?...No! But, I can jump to the near one.
oil
fishing
agriculture tropical
garments
metallurgy
textiles
agriculture animal
machineries
fruits
cereals
vehicles
electronics
chemicals
mining
products forest
Product Space (Hidalgo et al. 2007)
Core-Periphery structure, with some ‘clusters’
THA 1965
RCA≥1

14/08/2012
5
THA 1975 THA 1985
THA 1995 THA 2005
THA 2008 PHL 1965
RCA≥1

14/08/2012
6
PHL 1975 PHL 1985
PHL 1995 PHL 2005
PHL 2008 How many of your products have comparative
advantage?
35
0
74
4
134
21
132
34
91
29
110
40
0
25
50
75
100
125
150
175
200
core core core core core core
1965 1975 1985 1995 2005 2008
51
2
84
9
159
12
183
46
179
63
186
70
0
25
50
75
100
125
150
175
200
core core core core core core
1965 1975 1985 1995 2005 2008

14/08/2012
7
Assessment - Summing up -
• The past growth has been largely led by services
• Lagged growth is rooted in persistent productivity growth deficit due to stagnant industrialization, in particular lack of product diversification
• Limited job opportunities resulted in the slow poverty reduction
• The service-led growth did not require a relatively high investment
• Booming BPOs create jobs, but its impact is limited given the scale of utilized workforce, and its bias toward educated labor
• To join the growth club in the region and translate the growth into inclusive one, the country needs to “walk on two legs” both in industry and modern services
How can we help entrepreneurs jump to new products?
• Resolving long-standing issues:
– Infrastructure
– Business and investment climate
• Horizontal interventions: Is that all?
• Critical importance of focusing on product-specific constraints
High electricity price Is it a real headache for all?
Share of electricity cost in total production cost (including labor cost, depreciation, net tax)
1: Ave: 0.79
3: Ave: 4.63
2: Ave: 7.67
4: Ave: 0.27 5: Ave: 3.86 6: Ave: 0.57 7: Ave: 5.33 8: Ave: 2.42 9: Ave: 0.48 11: Ave: 0.99
10: Ave: 3.77
Manufacturing
Electronics…….have you fully exploited the opportunities?
RCA≥1
RCA<1
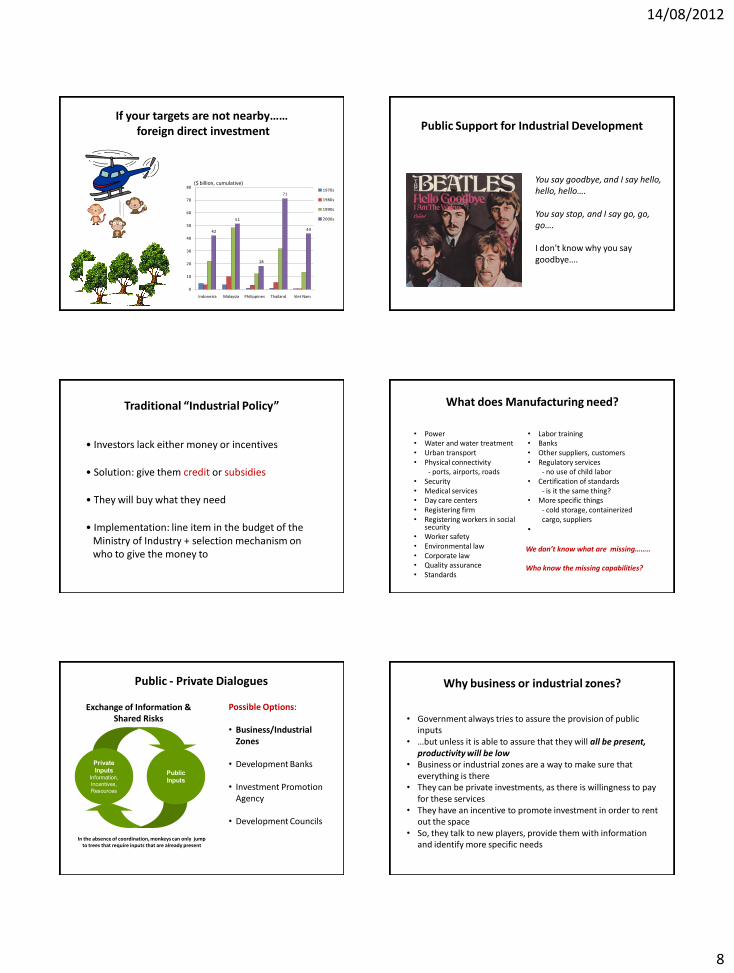
Targeted Public Sector Support - My Proposal -
Headache 1: Product identification (targeting)
Headache 2: Diagnostics of binding constraints for the targeted products
How can we “choose”?
Key dimensions of product identification
Easiness to jump: Nearby? Middle? Far Away?
– Above average sophistication (direct effect)
– Opportunities for further structural change (spillover effects)
– Capacity to absorb labor (job creation)
– Others such as global demand growth
14/08/2012
8
If your targets are not nearby…… foreign direct investment
42
51
18
71
43
0
10
20
30
40
50
60
70
80
Indonesia Malaysia Philippines Thailand Viet Nam
1970s
1980s
1990s
2000s
($ billion, cumulative) You say goodbye, and I say hello, hello, hello…. You say stop, and I say go, go, go…. I don't know why you say goodbye….
Public Support for Industrial Development
Traditional “Industrial Policy”
• Investors lack either money or incentives
• Solution: give them credit or subsidies
• They will buy what they need
• Implementation: line item in the budget of the Ministry of Industry + selection mechanism on who to give the money to
What does Manufacturing need?
• Power • Water and water treatment • Urban transport • Physical connectivity
- ports, airports, roads • Security • Medical services • Day care centers • Registering firm • Registering workers in social
security • Worker safety • Environmental law • Corporate law • Quality assurance • Standards
• Labor training • Banks • Other suppliers, customers • Regulatory services
- no use of child labor • Certification of standards
- is it the same thing? • More specific things
- cold storage, containerized cargo, suppliers
•
We don’t know what are missing…….. Who know the missing capabilities?
Public - Private Dialogues
Private
Inputs Information,
Incentives,
Resources
Public
Inputs
Exchange of Information & Shared Risks
In the absence of coordination, monkeys can only jump to trees that require inputs that are already present
Possible Options: • Business/Industrial
Zones
• Development Banks
• Investment Promotion Agency
• Development Councils
Why business or industrial zones?
• Government always tries to assure the provision of public inputs
• …but unless it is able to assure that they will all be present, productivity will be low
• Business or industrial zones are a way to make sure that everything is there
• They can be private investments, as there is willingness to pay for these services
• They have an incentive to promote investment in order to rent out the space
• So, they talk to new players, provide them with information and identify more specific needs
14/08/2012
9
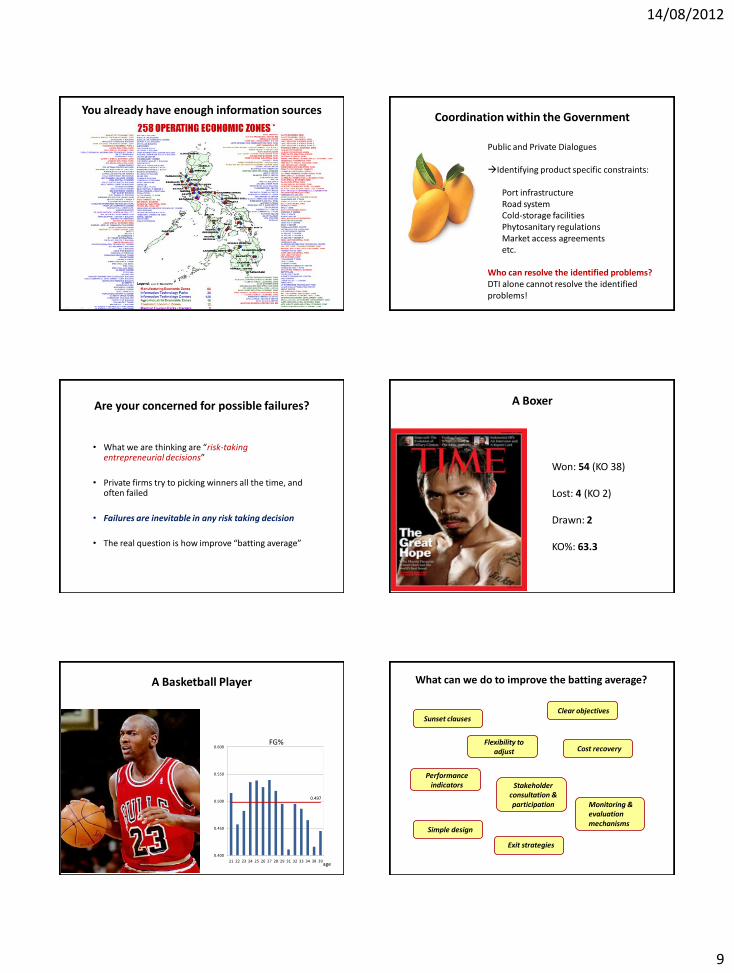
You already have enough information sources Coordination within the Government
Public and Private Dialogues Identifying product specific constraints:
Port infrastructure Road system Cold-storage facilities Phytosanitary regulations Market access agreements etc.
Who can resolve the identified problems? DTI alone cannot resolve the identified problems!
Are your concerned for possible failures?
• What we are thinking are “risk-taking entrepreneurial decisions”
• Private firms try to picking winners all the time, and often failed
• Failures are inevitable in any risk taking decision
• The real question is how improve “batting average”
Won: 54 (KO 38) Lost: 4 (KO 2) Drawn: 2 KO%: 63.3
A Boxer
A Basketball Player
0.497
0.400
0.450
0.500
0.550
0.600
21 22 23 24 25 26 27 28 29 31 32 33 34 38 39 age
FG%
What can we do to improve the batting average?
Sunset clauses
Exit strategies
Clear objectives
Cost recovery
Performance indicators
Simple design
Monitoring & evaluation mechanisms
Flexibility to adjust
Stakeholder consultation & participation
14/08/2012
10
Hey Jude, begin
You're waiting for someone to perform with
And don't you know that it's just you
Hey Jude, you'll do
The movement you need is on your shoulder
Hey Jude….
Thank you
The findings, interpretations, and views expressed are entirely those of the author, and do not necessarily represent the views of the Asian Development Bank, its executive directors, or the countries they represent.
For further information, please contact: Norio Usui ([email protected])
Philippine Country Office, Asian Development Bank
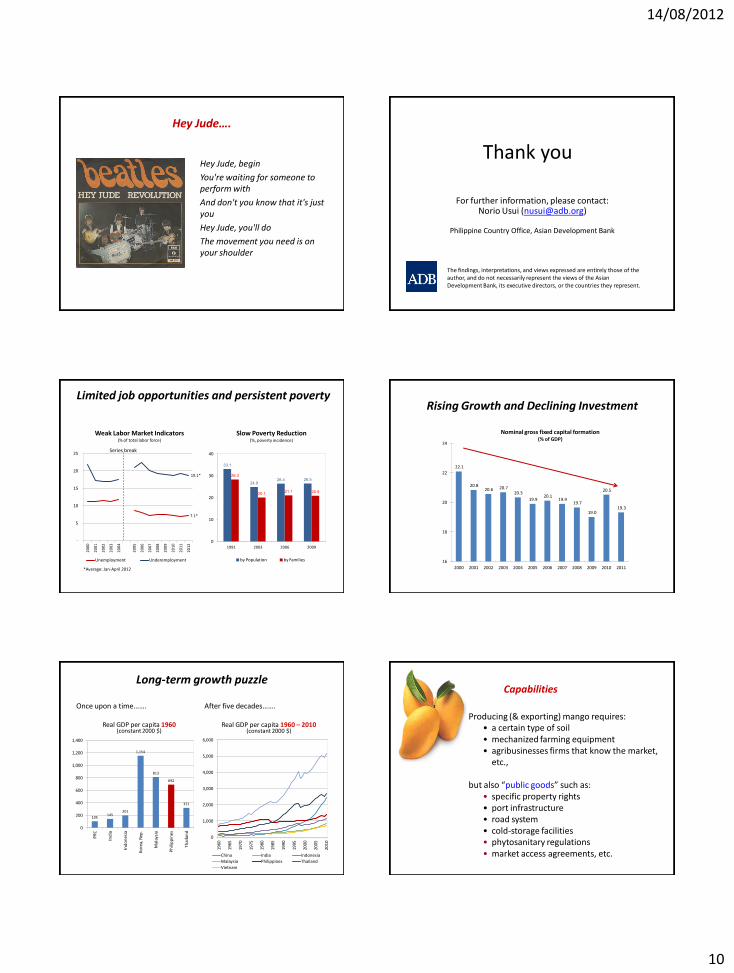
Limited job opportunities and persistent poverty
Series break
7.1*
19.1*
-
5
10
15
20
25
20
00
20
01
20
02
20
03
20
04
20
05
20
06
20
07
20
08
20
09
20
10
20
11
20
12
Unemployment Underemployment
Slow Poverty Reduction (%, poverty incidence)
33.1
24.9 26.4 26.5
28.3
20.1 21.1 20.9
0
10
20
30
40
1991 2003 2006 2009
by Population by Families
Weak Labor Market Indicators (% of total labor force)
*Average: Jan-April 2012
Rising Growth and Declining Investment
22.1
20.8 20.6 20.7
20.3
19.9 20.1
19.9 19.7
19.0
20.5
19.3
16
18
20
22
24
2000 2001 2002 2003 2004 2005 2006 2007 2008 2009 2010 2011
Nominal gross fixed capital formation (% of GDP)
Long-term growth puzzle
Real GDP per capita 1960 (constant 2000 $)
Real GDP per capita 1960 – 2010 (constant 2000 $)
Once upon a time……. After five decades…….
105 145
201
1,154
813
692
321
0
200
400
600
800
1,000
1,200
1,400
PR
C
Ind
ia
Ind
on
esi
a
Kore
a, R
ep.
Mal
aysi
a
Ph
ilip
pin
es
Th
aila
nd
0
1,000
2,000
3,000
4,000
5,000
6,000
196
0
196
5
197
0
197
5
198
0
198
5
199
0
199
5
200
0
200
5
201
0
China India Indonesia
Malaysia Philippines Thailand
Vietnam
Producing (& exporting) mango requires: • a certain type of soil • mechanized farming equipment • agribusinesses firms that know the market,
etc.,
but also “public goods” such as: • specific property rights • port infrastructure • road system • cold-storage facilities • phytosanitary regulations • market access agreements, etc.
Capabilities

14/08/2012
11
Your export basket Your capabilities What can you make with the
available capabilities?
Product Identification Where do you want to go?
Nearby Middle Far away
For example, if you want to choose “sophisticated products”
Export
value
(M US$)
7522 Complete digital data processing machines Machinery 28,109 3,403 1.347 0.327 164.24 0.74 24.76
8851 Watches, watch movements and case Machinery 25,310 6,014 2.982 0.656 89.72 0.201 8.07
8811 Photographic cameras, flashlight apparatus, parts, accessories, nes Machinery 17,702 5,488 2.042 0.912 16.37 0.034 -9.97
7643 Television, radio-broadcasting; transmitters, etc Machinery 16,537 8,103 1.193 0.644 447.26 1.116 12.12
8852 Clocks, clock movements and parts Machinery 15,040 7,273 2.982 0.624 15.13 0.037 2.23
6531 Fabrics, woven, of continuous synthetic textile materials Capital intensive 14,843 9,480 3.065 0.508 38.44 0.121 2.99
7641 Electrical line telephonic and telegraphic apparatus Machinery 14,713 8,346 1.193 0.16 20.84 0.238 -7.89
7622 Portable radio receivers Machinery 13,995 3,808 0.957 0.034 0.61 0.034 -1.67
0350 Fish, dried, salted or in brine; smoked fish Animal products 13,841 5,650 1.611 0.949 21.25 0.035 7.63
7642 Microphones; loud-speakers; audio-frequency electric amplifiers Machinery 13,583 7,997 0.957 0.635 49.25 0.121 7.19
7512 Calculating, accounting, cash registers, ticketing, etc, machines Machinery 13,485 8,199 0.383 0.031 0.72 0.036 2.96
0344 Fish fillets, frozen Animal products 13,286 5,413 1.611 0.762 44.87 0.09 12.67
0612 Refined sugar etc Tropical Agruculture 12,595 7,539 0.647 0.008 0.33 0.063 12.59
8973 Precious jewellery, goldsmiths' or silversmiths' wares Labor intensive 12,091 6,952 2.982 0.188 38.39 0.321 13.69
6664 Porcelain or china house ware Labor intensive 11,998 10,039 2.829 0.573 9.57 0.027 7.93
8981 Pianos, other string musical instruments Labor intensive 11,293 6,961 8.981 0.028 0.21 0.011 5.56
0814 Flours and meals, of meat, fish,etc, unfit for human; greaves Cereals 11,284 4,220 1.022 0.152 3.25 0.031 6.67
7243 Sewing machines, furniture, needles etc, and parts thereof, nes Machinery 11,250 9,035 1.392 0.228 4.16 0.035 3.01
7757 Domestic electro-mechanical appliances; and parts thereof, nes Machinery 10,866 8,559 0.505 0.092 8.02 0.142 11.13
8952 Pens, pencils and, fountain pens Labor intensive 10,829 9,795 3.547 0.028 0.85 0.049 6.45
RCA
Share to
world
export
(%)
Annual
average
growth rate
(%, 2000-
2007)
SITC
Code"Nearby" Commodities
Leamer
ClassificationPRODY
Strategic
Value
Labor
Intensity
Table 1.2: Ranked based on Strategic Value
Export
value
(M US$)
6664 Porcelain or china house ware Labor intensive 11,998 10,039 2.829 0.573 9.57 0.027 7.93
8952 Pens, pencils and, fountain pens Labor intensive 10,829 9,795 3.547 0.028 0.85 0.049 6.45
6531 Fabrics, woven, of continuous synthetic textile materials Capital intensive 14,843 9,480 3.065 0.508 38.44 0.121 2.99
7243 Sewing machines, furniture, needles etc, and parts thereof, nes Machinery 11,250 9,035 1.392 0.228 4.16 0.035 3.01
6674 Synthetic or reconstructed precious or semi-precious stones Labor intensive 10,643 8,688 16.177 0.070 0.20 0.004 3.05
7757 Domestic electro-mechanical appliances; and parts thereof, nes Machinery 10,866 8,559 0.505 0.092 8.02 0.142 11.13
7641 Electrical line telephonic and telegraphic apparatus Machinery 14,713 8,346 1.193 0.160 20.84 0.238 -7.89
8998 Small-wares and toilet articles, nes; sieves; tailors' dummies, etc Labor intensive 10,275 8,317 3.547 0.272 7.47 0.043 7.24
7512 Calculating, accounting, cash registers, ticketing, etc, machines Machinery 13,485 8,199 0.383 0.031 0.72 0.036 2.96
7643 Television, radio-broadcasting; transmitters, etc Machinery 16,537 8,103 1.193 0.644 447.26 1.116 12.12
7642 Microphones; loud-speakers; audio-frequency electric amplifiers Machinery 13,583 7,997 0.957 0.635 49.25 0.121 7.19
0612 Refined sugar etc Tropical Agruculture 12,595 7,539 0.647 0.008 0.33 0.063 12.59
8852 Clocks, clock movements and parts Machinery 15,040 7,273 2.982 0.624 15.13 0.037 2.23
6552 Knitted, not elastic nor rubberized, of fibres other than synthetic Capital intensive 10,446 7,267 4.594 0.142 11.15 0.125 14.25
8981 Pianos, other string musical instruments Labor intensive 11,293 6,961 8.981 0.028 0.21 0.011 5.56
8973 Precious jewellery, goldsmiths' or silversmiths' wares Labor intensive 12,091 6,952 2.982 0.188 38.39 0.321 13.69
1124 Distilled alcoholic beverages, nes Tropical Agruculture 10,808 6,214 0.473 0.170 18.91 0.172 10.77
8851 Watches, watch movements and case Machinery 25,310 6,014 2.982 0.656 89.72 0.201 8.07
0350 Fish, dried, salted or in brine; smoked fish Animal products 13,841 5,650 1.611 0.949 21.25 0.035 7.63
8811 Photographic cameras, flashlight apparatus, parts, accessories, nes Machinery 17,702 5,488 2.042 0.912 16.37 0.034 -9.97
RCA
Share to
world
export
(%)
Annual
average
growth rate
(%, 2000-
2007)
SITC
Code"Nearby" Commodities
Leamer
ClassificationPRODY
Strategic
Value
Labor
Intensity
High opportunities for further structural change
Table 1.3: Ranked based on Labor Intensity
Export
value
(M US$)
6674 Synthetic or reconstructed precious or semi-precious stones Labor intensive 10,643 8,688 16.177 0.070 0.20 0.004 3.05
8981 Pianos, other string musical instruments Labor intensive 11,293 6,961 8.981 0.028 0.21 0.011 5.56
6552 Knitted, not elastic nor rubberized, of fibres other than synthetic Capital intensive 10,446 7,267 4.594 0.142 11.15 0.125 14.25
8952 Pens, pencils and, fountain pens Labor intensive 10,829 9,795 3.547 0.028 0.85 0.049 6.45
8998 Small-wares and toilet articles, nes; sieves; tailors' dummies, etc Labor intensive 10,275 8,317 3.547 0.272 7.47 0.043 7.24
6531 Fabrics, woven, of continuous synthetic textile materials Capital intensive 14,843 9,480 3.065 0.508 38.44 0.121 2.99
8852 Clocks, clock movements and parts Machinery 15,040 7,273 2.982 0.624 15.13 0.037 2.23
8973 Precious jewellery, goldsmiths' or silversmiths' wares Labor intensive 12,091 6,952 2.982 0.188 38.39 0.321 13.69
8851 Watches, watch movements and case Machinery 25,310 6,014 2.982 0.656 89.72 0.201 8.07
6664 Porcelain or china house ware Labor intensive 11,998 10,039 2.829 0.573 9.57 0.027 7.93
8811 Photographic cameras, flashlight apparatus, parts, accessories, nes Machinery 17,702 5,488 2.042 0.912 16.37 0.034 -9.97
0350 Fish, dried, salted or in brine; smoked fish Animal products 13,841 5,650 1.611 0.949 21.25 0.035 7.63
0344 Fish fillets, frozen Animal products 13,286 5,413 1.611 0.762 44.87 0.090 12.67
7243 Sewing machines, furniture, needles etc, and parts thereof, nes Machinery 11,250 9,035 1.392 0.228 4.16 0.035 3.01
7522 Complete digital data processing machines Machinery 28,109 3,403 1.347 0.327 164.24 0.740 24.76
7641 Electrical line telephonic and telegraphic apparatus Machinery 14,713 8,346 1.193 0.160 20.84 0.238 -7.89
7643 Television, radio-broadcasting; transmitters, etc Machinery 16,537 8,103 1.193 0.644 447.26 1.116 12.12
0814 Flours and meals, of meat, fish,etc, unfit for human; greaves Cereals 11,284 4,220 1.022 0.152 3.25 0.031 6.67
7642 Microphones; loud-speakers; audio-frequency electric amplifiers Machinery 13,583 7,997 0.957 0.635 49.25 0.121 7.19
7622 Portable radio receivers Machinery 13,995 3,808 0.957 0.034 0.61 0.034 -1.67
RCA
Share to
world
export
(%)
Annual
average
growth rate
(%, 2000-
2007)
SITC
Code"Nearby" Commodities
Leamer
ClassificationPRODY
Strategic
Value
Labor
Intensity
High labor absorption