Embed Size (px)
Citation preview

The Pennsylvania State University
The Graduate School
College of the Liberal Arts
PERSONALITY TYPOLOGIES AS PREDICTORS OF EFFECTIVE PERFORMANCE
IN CUSTOMER SERVICE JOBS
A Dissertation in
Psychology
by
Patricia E. Grabarek
© 2011 Patricia E. Grabarek
Submitted in Partial Fulfillment
of the Requirements
for the Degree of
Doctor of Philosophy
December 2011
ii
The dissertation of Patricia E. Grabarek was reviewed and approved* by the following:
Alicia A. Grandey
Associate Professor of Psychology
Dissertation Advisor
Chair of Committee
Rick R. Jacobs
Professor of Psychology
Stephanie A. Shields
Professor of Psychology and Women’s Studies
Stephanie T. Lanza
Scientific Director at the Methodology Center
Research Associate Professor of Health and Human Development
Melvin M. Mark
Professor of Psychology
Department Head
*Signatures on file in The Graduate School
iii
Abstract
Customer service jobs are deserving of special research attention due to their prevalence
and importance in today’s economy (e.g. Frei & McDaniel, 1998). Employee performance in
service settings includes both task and interpersonal components. Since personality has been
shown to predict performance in all jobs (e.g., Barrick, Mount, & Judge, 2001), including
specific and unique predictions for jobs with high interpersonal interactions (Mount, Barrick, &
Stewart, 1998), service organizations would benefit from including personality in their selection
processes. However, prior research in using personality to predict job performance has been
limited by looking at traits individually. Combining personality traits will allow for a more
holistic look at individuals and predict performance more strongly than using individual
personality traits. The current study used latent class analysis – a novel person-focused statistical
approach in organizational research – to model personality typologies using multiple trait
variables. This study identified classes of individuals, using field data of retail convenience store
employees, with optimal trait combinations in predicting high task and interpersonal
performance in customer service jobs. Importantly, this study also provided strong evidence in
favor of the use of a person-focused approach in combining personality traits to predict
performance when compared to the variable-focused regression.

iv
Table of Contents
List of Tables .............................................................................................................................. v
Acknowledgements .................................................................................................................... vi
Chapter 1: Introduction ............................................................................................................... 1
Customer Service and Performance ......................................................................................... 3
Theories of Personality Selection ............................................................................................ 4
Personality Predicting Overall Customer Service Performance ................................................ 7
Personality Typologies and Predictions ................................................................................. 10
Chapter 2: Method .................................................................................................................... 17
Participants ........................................................................................................................... 17
Measures ............................................................................................................................... 19
Chapter 3: Analysis ................................................................................................................... 21
Preparing Personality Scales as Categorical Indicators .......................................................... 21
Latent Class Structure Identification ...................................................................................... 23
Including Performance Covariates ......................................................................................... 25
Multiple-Groups LCA ........................................................................................................... 26
Regression Comparison ......................................................................................................... 27
Chapter 4: Results ..................................................................................................................... 28
Individual-Level LCA ........................................................................................................... 28
Multi-Level LCA .................................................................................................................. 32
Performance Covariates......................................................................................................... 33
Multiple-Groups LCA ........................................................................................................... 35
Regression Comparison ......................................................................................................... 41
Chapter 5: Discussion ............................................................................................................... 43
Personality Typologies .......................................................................................................... 43
Service Orientation ................................................................................................................ 45
Predicting Performance ......................................................................................................... 46
Understanding the Effects of Gender ..................................................................................... 49
Regression Comparisons ....................................................................................................... 54
Revisiting the Personality Trait-Based Interactionist Model .................................................. 56
Limitations and Future Directions ......................................................................................... 56
Conclusions ........................................................................................................................... 59
References ................................................................................................................................ 60

v
List of Tables
1. Retail convenience store sample correlation matrix ............................................................... 29
2. Item-response probabilities for four-class model and class membership probabilities
by gender in the grocery store sample .............................................................................. 30
3. Item-response probabilities for four-class model and class membership probabilities
by gender in the retail convenience store sample .............................................................. 31
4. Parameter estimates and odds ratios for covariates ................................................................ 34
5. Parameter estimates and odds ratios for interpersonal performance in the groups
LCA with gender ............................................................................................................. 37
6. Parameter estimates and odds ratios for communication performance in the groups
LCA with gender ............................................................................................................. 39
7. Parameter estimates and odds ratios for task performance in the groups LCA with
gender ............................................................................................................................. 40

vi
Acknowledgements
Thank you to my family for all of their unwavering love and continued support
throughout my entire education and especially for their understanding and encouragement during
my graduate career. Thank you to Daniel Podesta for supporting me no matter where my career
goals took me and believing in those goals. A special thanks to Lily Cushenbery for spending
countless hours working by my side, for your willingness to listen to all of my ideas and
problems, for helping me balance work and life, for supporting and encouraging me throughout
graduate school, and for reminding me what a true friend is.
I also want to thank Autumn Krauss and Patricia Barger for providing me with the data
for this study.
Thank you to my knowledgeable and caring committee, Stephanie Lanza, Rick Jacobs,
and Stephanie Shields for all of your guidance and support. Your commitment to my success
made all of this possible. I have learned so much from each of you and am so appreciative for all
the experiences I had with you.
And most importantly, thank you to Alicia Grandey for being an amazing advisor –
always encouraging me, believing in me, supporting me, making time for me, and being willing
to give me the little “pushes” to help me reach my goals. I appreciate how much you really cared
about my success and all of the effort you have put in to make it happen. I am truly lucky to have
worked with such an accomplished and inspiring person. This dissertation and my entire
graduate career would not have been the same, or even possible, without you.

1
Personality Typologies as Predictors of Effective Performance in Customer Service Jobs
Chapter 1
Introduction
Customer service jobs are deserving of special research attention due to their prevalence
and importance in today’s economy (e.g. Frei & McDaniel, 1998). In customer service jobs, the
interactions with customers are an important factor in how employee performance is defined
(Bowen & Waldman, 1999; Liao & Chuang, 2004). Employee performance in these service
settings includes both task and interpersonal components. Personality has been shown to predict
performance in all jobs (e.g., Barrick, Mount, & Judge, 2001), including specific and unique
predictions for jobs with high interpersonal interactions (Mount, Barrick, & Stewart, 1998).
Personality refers to a combination of individual characteristics that combine to distinguish
individuals in their basic tendencies to think, feel, and behave (Ones et al., 2005). However, prior
research in using personality to predict job performance has been limited by looking at traits
individually. Combining personality traits will allow for a more holistic look at individuals and
predict performance more strongly than using individual traits (Barrick & Mount, 2005). These
combinations can possibly aid organizations in selecting the best individuals for the job.
Specifically, these combinations could particularly be important for customer service jobs given
the mixed findings on individual traits, such as extraversion, and the numerous components of
customer service performance.
The current study attempts to answer questions about predicting performance for
employees in customer service jobs and how using personality can aid in this process. Answers
to these questions can have implications for selecting employees for high costumer service jobs.
Little has been published on the selection of customer service employees (Schneider &

2
Schechter, 1991) Prior research has explored basic personality traits predicting performance in
jobs with frequent interaction (e.g. Witt et al., 2002) and other individual characteristics, such as
service orientation in predicting service performance (e.g. Frei & McDaniel, 1998). However,
the majority of the research has been mixed in its findings (e.g., Motowidlo, Brownlee, &
Schmit, 2008; Witt et al., 2002). This study hopes to further the customer service performance
and personality literatures, contributing theoretically and, hopefully, providing a starting point
for further research that can lead to the practical use of personality combinations in customer
service selection.
In addition to the incomplete research on customer service selection, prior research in
using personality to predict job performance has been limited by looking at traits individually.
Personality is a spectrum of traits and attributes that work together to consistently distinguish
individuals from each other and predict basic tendencies (Ones, Viswesvaran, & Dilchert, 2005).
Combining personality traits will allow for a more holistic look at individuals and predict
performance more strongly than using individual personality traits. Personality trait
combinations should be particularly relevant in interpersonal performance since personality
impacts how individuals interact with others. In other words, understanding the individual as a
whole, using a person-centered approach, through combining personality traits, is particularly
important for understanding individual differences in interpersonal interactions and performance.
A person-centered approach, rarely used in I/O psychology, focuses on identifying groups that
share similarities on a set of constructs, such as personality (Craig & Smith, 2000; Sinclair,
Tucker, Cullen, & Wright, 2005). Thus, the current study proposes using a novel person-focused
statistical approach in organizational research – latent class analysis – to model personality
typologies using multiple trait variables. The analysis will use multiple personality variables in
3
combination to find latent classes of people. The goal is to 1) describe the types of classes found
in a customer service population and, 2) identify a class of individuals with an optimal trait
combination in predicting high customer service performance.
Customer Service and Performance
Performance is defined as the utility of discrete behavior episodes that an individual
carries out over a standard period of time to the organization’s success (Motowidlo, 2003).
Performance is a property of behavior. Performance behaviors have varying positive and
negative consequences for the organization. Performance has often been broken down into
various types such as in Campbell’s Multifactor Model (1990), including task proficiency,
communication, and effort. Others have also differentiated between task and contextual
performance (e.g. Borman & Motowidlo, 1993). Task performance is the activities most
frequently recognized for performance, are often role-prescribed (Katz & Kahn, 1978), and
involve the technical core of the job (Borman & Motowidlo, 1993). Contextual performance is
the behaviors that support the environment, are less role-prescribed, and often include helping
and cooperating with others (Borman & Motowidlo, 1993).
In addition, customer service performance has generally been conceptualized in
performance literature as involving the types of behaviors in which an employee engages to
satisfy a customer’s expectations (Ryan & Ployhart, 2003). Service performance is uniquely
interpersonal in nature. Customer service requires treating customers with tact, courtesy,
consideration, perceiving customer needs, and providing accurate and pleasant communication
(Hogan et al., 1984). In addition, service quality has been defined to include five dimensions:
tangibles, which includes physical equipment, materials, and appearance of service providers;
reliability, which is the ability to perform the service accurately and dependably; responsiveness,

4
which includes the employee’s willingness to help customers and provide prompt service;
assurance, or the knowledge and courtesy of employees and their ability to inspire trust and
confidence; and empathy, which is the caring attention an employee provides the customers
(Parasuraman, Zeithaml, & Berry, 1998). Thus, underlying customer service performance are
interpersonal components (e.g. treating customers with courtesy, perceiving customer needs,
showing empathy) and task components (e.g. ability to perform the service accurately). Overall
performance in customer service jobs must include task performance since formal procedures
and rules still apply to customer service roles. Due to the high impact of overall employee
performance on organizational performance, the selection process is important for hiring
employees that will effectively interact interpersonally with customers, communicate with
others, and complete role-prescribed tasks.
This study defines overall customer service performance to include interpersonal and task
performance. These sub-dimensions of overall customer service are critical for superior
performance, even though task performance has often been parceled out of research on service
performance (e.g. Liao & Chuang, 2004). Customer service cannot be effective without the
employee effectively completing the basic tasks of the job.
Theories of Personality Selection
Selecting the best candidates for a job is critical for all organizations. In valid selection
systems, an applicant’s performance during the selection process will be predictive of good
performance on the job (Guion, 1998). Employers often use a combination of multiple tests on
cognitive ability, attitudes, personality, abilities, and knowledge to predict performance. For
example, test batteries frequently include cognitive ability tests along with personality scales
(Hough, 2003; Guion, 1998). Personality scales tend to be better at predicting “will-do”
5
performance criteria than cognitive ability (Hough, 2003; McHenry et al., 1990). Personality
predicts performance above and beyond cognitive ability and job experience (i.e. Barrick &
Mount, 2005). In addition, personality testing can help reduce adverse impact in hiring processes
since there are smaller group differences in personality among age, gender, and minority sub-
groups than there are for intelligence (Barrick & Mount, 2005; Sackett et al., 2001). Despite the
importance of selecting the best candidates, there are mixed results and limited research on using
personality in selection in the customer service literature. However, the previous attempts to
understand the personality effects on performance indicate an interest and a need to continue this
area of research.
Personality and performance – an interactionist model. Due to the important
relationship between performance and personality, researchers have developed theories and
models to explain the moderators of this relationship. One such model relevant to explaining
personality’s importance in customer service jobs is the Personality Trait-Based Interactionist
Model of Job Performance (Tett & Burnett, 2003).
The Trait-Based Interactionist Model lays the groundwork for identifying the conditions
under which particular personality traits will predict performance in particular jobs (Tett &
Burnett, 2003). In this model, personality is defined as intraindividual consistencies and
interindividual uniqueness in tendencies to behave in predictable and identifiable ways
dependent on situational demands. Personality traits are expressed as responses to trait-relevant
situational cues through a process fittingly called trait activation (Tett & Guterman, 2000). A
situation is considered to be relevant to a trait if it is thematically connected by cues that induce
responses (or lack of responses), which indicate an individual’s level of a trait. This model
proposes that traits are expressed in work behavior as responses to trait-relevant situational cues,
6
such as job demands. In addition, these trait-relevant cues can come from the task, social aspects
of situation (such as interactions with customers), and organizational norms and culture.
Furthermore, trait-expressive behavior is distinct from job performance since job performance is
the evaluation of a valued work behavior. This model also incorporates motivational cues to
express personality including, intrinsic needs to express personality, positive feedback from
others to the expression, and extrinsic organizational rewards. The Trait-Based Interactionist
Model claims the personality-job performance relationship is the result of trait activation and
evaluation. Thus, personality is related to job performance due to situational cues such as job
demands and the value placed on the expression of the trait in the organization.
This model creates a framework for research on personality and selection. People tend to
prefer jobs demanding the expression of their personality traits (DeFruyt & Mervielde, 1999),
which means it is important to identify what situational cues exist in the job and organization
prior to identifying personality traits to select for. For example, a job with tasks that have very
specific rules will be ideal for an individual high on conscientiousness by cuing the rule-
following tendencies of those with this trait (Tett & Burnett, 2003). In addition, identifying the
valued behaviors of the organization will also allow for better selection. For example, if the
organization values rule-following, performance will be evaluated in such a way that is in line
with conscientiousness, strengthening the relationship between personality and performance.
This can easily be applied to customer service jobs. For example, Tett and Burnett (2003)
identify friendliness as a work demand at the organizational level, captured in the culture and
climate, which activates trait expression for those high in agreeableness. Thus, in a situation
where friendliness is expected, such as in customer interactions, those high in agreeableness will
be cued to be friendly to customers and other individuals. In addition, an organization that values

7
the expression of friendliness will evaluate performance in line with the tendencies of those high
in agreeableness, strengthening the relationship between personality and performance.
Personality Predicting Overall Customer Service Performance
There are various ways in conceptualizing personality that have developed and change
over the history of the field. There are certain personality traits that have emerged from research
on specific types of jobs and performance, such as service orientation. Other conceptualizations
contain multiple factors and dimensions such as the Big 5. Because of this study’s interest in
overall customer service performance, including task, interpersonal, and communication
performance, service orientation is reviewed, but ultimately, the Big 5 is chosen as an
appropriate conceptualization due to the numerous studies linking these traits all types of
performance (e.g. Barrick & Mount, 1991).
Service orientation. Service orientation has been studied as a characteristic that can
predict service performance and thus be used in selection systems for customer service
employees. Service orientation has been defined as both a personality trait of those with the
tendency to help and serve others (Frei & McDaniel, 1998; Hogan, Hogan, & Busch, 1984) and
as behavioral dimensions associated with helping and serving others (Bettencourt & Brown,
1997). As personality traits, service orientation includes items about likeability, sociability and
adjustment (Hough et al., 1984). Service orientation behaviors include items about helping
customers, fulfilling or going above and beyond expectations in customer service, and keeping
customers satisfied (Bettencourt & Brown, 1997). The items are entirely focused on helping
behaviors while overall customer service performance includes more than that. Even though both
service orientation and overall customer service performance both have personality predictors,
the patterns are not identical. For example, extraversion has varied and mixed relationships with
8
service orientation (Frei & McDaniel, 1998), while extraversion is positively related to overall
job performance in jobs with frequent customer interactions (Conte & Gintoft, 2005; Mount,
Barrick, & Stewart, 1998). Thus, I argue that selecting the best employees for customer service
jobs is different than selecting employees simply for service orientation since customer service
jobs entail tasks in addition to helping and serving others. Different types of people may be
better at certain sub-dimensions of overall customer service performance, such as task
performance, and thus focusing on only one aspect of the job (service) may lead to poor
conclusions on who to hire.
The Big 5 and criticisms of personality research. The most common way to
conceptualize personality is by using the Big 5 (Goldberg, 1990; Costa & McCrae, 1992). The
Big 5 includes 5 dimensions – Extraversion, Conscientiousness, Agreeableness, Emotional
Stability (Neuroticism), and Openness to Experience – that are made up of 6 facets each. It is the
most widely used conceptualization of personality and is robust across different cultures and
languages (Hough & Furnham, 2003). Certain dimensions – Conscientiousness and Emotional
Stability – are strongly related to all performance criteria (Barrick & Mount, 2005; Barrick et al.,
2001). The Trait-Based Interactionist Model also includes information about the Big 5 and ties
each dimension to situational cues affecting the expression of each trait (Tett & Burnett, 2003).
Despite its common use and relatively predictability, there have been some criticisms
regarding the use of the Big 5 and personality measures, in general. Most importantly, there has
been a recent call to look at typologies or combinations of personality instead of individual
constructs separately, as is typically done with the Big 5 (Barrick & Mount, 2005). It has been
argued that “when we combine personality characteristics rather than considering them
individually, the relationship between personality and performance becomes even stronger”

9
(Barrick & Mount, 2005). Personality refers to a combination of individual characteristics that
combine to distinguish individuals in their basic tendencies to think, feel, and behave in certain
ways (Ones et al., 2005). Personality can be best understood as a profile and high and low levels
on dimensions and facets (Ones et al., 2005). People and not traits should be studied if we are
interested in how well personality predicts performance (Barrick & Mount, 2005; Borman et al.,
2003; Ones et al., 2005), thus personality typologies should be used.
Creating personality combinations or typologies has been discussed in the literature but
very rarely attempted in empirical research. Hogan and colleagues (1984) combined personality
scales to define service orientation. However, this combination was simply created by
developing an index with a composite score to determine overall service orientation and does not
address the complexity of personality combinations. A combination or typology can be best
understood as a profile that differentiates highs and lows on various facets. With a composite, an
individual that is high on the first facet and low on the second can get the same score as someone
who is low on the first facet and high on the second. Thus, to understand the complexity of
personality typologies, a different method needs to be used. One study used a more effective
clustering strategy to combine conscientiousness and extraversion into what was called
“ambition” (Hough & Ones, 2001). This combination of Big 5 variables was more predictive of
performance than conscientiousness and extraversion alone. Thus, utilizing personality
typologies is an important and unique strategy that needs to be explored further as a possibility
towards new selection systems and will be used in this study to predict interpersonal and task
performance for those in high customer service jobs.

10
Personality Typologies and Predictions
Since combining personality characteristics can make the relationship between
personality and job performance stronger, these combinations can aid organizations in selecting
the best individuals for the job. Different combinations can be expected to be most predictive of
different types of performance. This study used Latent Class Analysis (LCA) to create classes of
individuals based on personality. LCA is a statistical approach that uses observed discrete
variables to identify latent classes (Collins & Lanza, 2010). It is a person-oriented approach that
is analogous to factor analysis, a variable-oriented approach. This is important since personality
should be approached from a person perspective and not a variable perspective (Ones et al.,
2001). In latent class analysis, observed data is used to help identify an underlying structure, or
classes of people (Collins & Lanza, 2010; Agresti, 2007). In this study, latent class analysis was
used to create typologies of people using personality variables. In addition, the association
between typologies and performance was examined by including performance as covariates.
Because LCA is most commonly used as an exploratory tool, extracting patterns from
large amounts of information, it is difficult to define typologies in traditional hypotheses a priori.
Latent class analysis assumes that there are underlying subgroups, or latent classes, of
individuals who share similarities on certain characteristics, such as personality. True class
membership is unknown and can only be inferred through the measurement of the observed
characteristics. Without previous research using LCA in this area, there is little theory or
evidence to inform hypotheses on what will be found. Classes found using LCA are based solely
on the patterns of measured characteristics within the sample and are not contingent on
performance. One major contribution of this study is using this methodology to describe the

11
personality typologies of a customer service sample. Using this methodology will answer
questions about what typologies of people exist in customer service.
Even though this methodology does not allow for traditional hypotheses, the following
sections provide a general discussion of personality traits that may be important in overall
customer service performance and some basic predictions for interpersonal and task
performance.
Personality and interpersonal performance. Frequently, service performance has been
measured using items centering solely on the interpersonal interaction components of service
performance (e.g. Hurtz & Donovan, 2000). The findings discussed below are focused
specifically on research using interpersonal interaction types of items for service performance.
First, extraversion has many mixed findings on its prediction of interpersonal
performance. Frei and McDaniel (1998) found both no relationship between extraversion and
customer service and a small positive correlation between the two, depending on measurement of
the constructs. In addition, some research has found a positive relationship between extraversion
and helping behaviors (LePine & Van Dyne, 2001; Organ & Ryan, 1995), including helping
customers specifically (Conte & Gintoft, 2005). However, low extraversion was related to high
levels of performance in service jobs at an elite hotel (Stewart & Carson, 1995), while there was
no relationship found for sales representatives (Barrick & Mount, 1993; Barrick, Mount, &
Judge, 2001). In a few other studies, extraversion did not have a direct effect on service
performance (Chi, Grandey, Diamond, & Krimmel, in press; Motowidlo, Brownlee, & Schmit,
2008). Given these mixed findings, the role extraversion plays in predicting interpersonal
performance unclear. Extraversion can be helpful in interpersonal interactions since extraverted
individuals tend to be able to converse easily with others. However, their talkative manner may

12
also distract from the service the customer is seeking. In addition, their dominant style and
arousal-seeking tendencies may alienate customers that seek specific forms of help. Thus, no
predictions are made in regards to the level of extraversion necessary for interpersonal
performance.
Second, emotional stability is also considered to be a personality predictor that predicts
all types of performance (Barrick & Mount, 2005). However, a curvilinear relationship was also
found recently for emotional stability and performance (Le et al., 2011). This finding indicates
that emotional stability does not matter in predicting performance as long as an individual
possesses enough emotional stability to not be “critically unstable”. In addition, extreme highs
and lows of emotional stability are associated with lower performance in low complexity jobs
(Le et al., 2011), such as service jobs. Low job complexity occurs in jobs that contain routine
repetitive work instead of work involving high intellectual demands or frequent changes in task-
related requirements (Le et al., 2011; Oswald et al., 1999). Customer service jobs often require
similar (repetitive) interactions with subsequent customers, such as taking orders at a coffee
shop. Furthermore, moderate levels of emotional stability may actually be beneficial to
performance. Having some levels of anxiety (an aspect of neuroticism, the converse of emotional
stability) can facilitate performance due to the anticipation it creates in individuals (Le et al.,
2010; Nettle, 2006). Also, maintaining extreme calm, as in high emotional stability, when a
customer is distressed or emotional may hurt the relationship due to a potential lack of perceived
empathy. In sum, moderate levels of emotional stability may be important in predicting
interpersonal performance.
Conscientiousness is another personality trait that is likely to impact interpersonal
performance. Conscientiousness is a personality trait that strongly predicts all types performance

13
(Barrick & Mount, 2005; Barrick et al. 2001). In addition, conscientiousness has been found to
predict interpersonal performance, including cooperation and the quality of customer interactions
(Liao & Chuang, 2004; Brown et al., 2002; Hurtz & Donovan, 2000). Moreover, in a lab study,
conscientiousness was strongly related to cooperative behavior, necessary in interpersonal
interactions (LePine & Van Dyne, 2001). However, more recent and innovative work shows that
the relationship between conscientiousness is not as simple as originally implied. For example, in
a recent study, conscientiousness was found to have curvilinear effects on performance, similar
to that found with emotional stability, supporting the idea that individuals “excessively” high in
conscientiousness do not always perform better. In fact, high conscientiousness led to low levels
of performance in low complexity jobs (Le et al., 2011), such as service jobs. In addition, those
that are excessively conscientious may be seen as rigid, inflexible, and compulsive perfectionists
(Le et al., 2011), which could hurt interpersonal interactions. Thus, research suggests that a
moderate level of conscientiousness is preferable for successful interpersonal performance.
Agreeableness should also be important for interpersonal performance. The Trait-Based
Interactionist Model hypothesizes that jobs that involve showing friendliness, such as customer
service jobs, will cue the expression of agreeableness (Tett & Barnett, 2003). In addition,
agreeableness was found to predict interpersonal performance (including cooperation and the
quality of interactions) even more highly than conscientiousness (Hurtz & Donovan, 2000;
LePine & Van Dyne, 2001). In jobs that require getting along with others, agreeableness is an
important predictor of performance (Barrick, Parks, & Mount, 2005; Hogan & Holland, 2003).
In addition, agreeableness has been considered one of the best predictors of helping behavior
(Barrick et al., 1998), which is highly important in service contexts. Thus, the research indicates
that a high level of agreeableness is preferable for successful interpersonal performance.

14
Lastly, in a study that examined multiple traits simultaneously, Burke and Witt (2002)
found that the relationship between conscientiousness and job performance increased positively
when agreeableness was high. In another similar study, Witt and colleagues (2002) also found
that in jobs with frequent interactions with others, high conscientiousness was related to higher
performance scores only when paired with high agreeableness. Furthermore, conscientiousness
was positively related to helping behaviors when agreeableness was high and negatively related
to helping behaviors when agreeableness was low (King, George, & Hebl, 2005). Given the
varied results on the importance of high conscientiousness and the obvious importance of
agreeableness, I hypothesize that high interpersonal performers will be likely to belong to a class
that is high on agreeableness and moderate on conscientiousness.
Hypothesis 1: High interpersonal performers will be likely to belong to a class that is
high on agreeableness and moderate on conscientiousness and emotional stability.
Personality and task performance. In addition to predicting interpersonal performance,
latent class analyses will also be conducted using task performance as a covariate for
comparisons with the other overall customer service performance sub-dimensions. As stated
previously, task performance is the activities most frequently recognized for performance, are
often role-prescribed (Katz & Kahn, 1978), and involve the technical core of the job (Borman &
Motowidlo, 1993), such as following through with directions. It is expected that the classes that
are more successful at these types of performance will differ from the class found to be most
successful in interpersonal performance.
Extraversion is typically unrelated to task performance (Barrick & Mount, 2005; LePine
& Van Dyne, 2001). This is reasonable due to the fact that tasks vary widely and some often
have no need for extraversion, such as computer programming. However, some studies have
15
found that even in customer service jobs with high frequency of interactions, extraversion is
unrelated to performance (e.g. Motowidlo, Brownlee, & Schmit, 2008), while others have found
significant positive relationships with performance of tasks associated with customer service
(e.g. Conte & Gintoft, 2005). Given the mixed results, no predictions are made in regards to the
level of extraversion necessary for task performance.
Instead, I argue that conscientiousness is more important for task performance than
interpersonal performance. Abiding by rules and procedures is often important in task
performance since it is part of the role and often involves the technical core of the job (Borman
& Motowidlo, 2003). In addition, the rigidity of high conscientious individuals (Le et al., 2010)
should have less of a negative effect on task performance as it would on interpersonal
performance. Furthermore, emotional stability has also been highly related to all types of
performance, especially task performance (e.g. Barrick et al., 2001). Thus, I hypothesize that
high task performers will be likely to belong to a class that is high on conscientiousness and
emotional stability.
Hypothesis 2: High task performers will be likely to belong to a class that is high on
conscientiousness and emotional stability.
Gender differences. Latent class analysis can also be used to understand gender
differences in latent classes as well as in predicting performance. It is expected that the latent
class structure will not vary significantly by gender. However, the distribution of the classes (i.e.
which class is most prevalent) may differ by gender. In other words, there may be some classes
that are mostly female and vice versa.
This analysis will also be used to compare performance ratings by class by gender. LCA
will be able to detect any differences by gender. For example, LCA can detect if there is a class

16
that is rated highest on performance only for females. There is some limited evidence that gender
affects ratings on various types of performance. For example, some studies have shown that
women who achieved performance equivalent to that of men are still judged as having less
underlying ability (Biernat & Kobrynowicz, 1997; Yarkin et al., 1982). Furthermore, women in
tend to be rated lower than men in similar roles, both in leadership positions (Eagly, Makhijani &
Klonsky, 1992) and as service providers (Hekman et al., 2010). Despite the evidence on
performance ratings depending on gender, there is a lack of evidence on how traits affect the
relationship between performance and gender, thus these analyses will be exploratory.

17
Chapter 2
Method
Two samples of field data used in this study were collected by an external consulting
firm. Since the hypotheses concern personality typologies predicting performance, field data is
the optimal approach to answer the relevant questions. Such data allow for the gathering of true
performance ratings of employees in high customer service jobs. In addition, these particular
data were gathered for research purposes allowing for the possibility of more accurate and varied
performance ratings. Performance ratings are often influenced by raters’ goals (Cleveland &
Murphy, 1992). For example, managers are often rewarded for having consistently high
performing employees so they may inflate ratings used for administrative purposes. In addition,
the culture or the norms of the organization can affect rater behavior (Levy & Williams, 2004).
For instance, in organizations where ratings are consistently inflated, raters will most likely
conform to the norms to not punish their subordinates by using accurate ratings. Thus, it is
important that these performance ratings were gathered specifically for research and not provided
to the organization so that the supervisors could be more honest and accurate in the ratings.
Participants
Two samples were used in this study. The first smaller pilot sample included grocery
store employees and was used to initially identify the latent class structure. The larger second
sample included retail convenience store employees and was used to test the hypotheses.
However, both samples were used to describe and duplicate the personality typologies found. At
the time of the study, the stores did not use any personality assessments to hire these employees
so they were not screened based on these traits. Participants were identified for participation by
operations managers at their organization. Participation was voluntary and the data was collected
18
for research purposes only. The employees had positions that interacted directly with the public,
including titles such as cashier, customer service representative, and sales associate. The
participants completed online surveys on company computers during work hours with the
personality measures and their managers provided performance ratings for the employees
participating in the study in an online survey as well. Participants were thus nested within
supervisors. The survey data was provided directly back to the consulting firm and not seen by
the participants’ organizations. Identifying information was provided to match employees to their
supervisors. Once the matching was complete, the identifying information was removed. The
participating organizations only saw aggregate and summarized results.
For the pilot study, participants were 232 employees (62.7 percent female) from 2
different grocery store chains. The participants were 33 years old on average (range from 18 –
71). Approximately 80 percent of the employees have been working at their store for over a year.
Most participants identified themselves as White (54.7 percent). The second largest group
identified themselves as Black of African American (24.6 percent) followed by Hispanic or
Latino (16.4 percent), and less than one percent identified as Asian, American Indian or Alaska
Native, or Other.
For the main study, participants were 690 employees (70.9 percent female) from three
different retail convenience store chains. The average age of the participants was 31 (range from
18 – 74). Most participants also identified themselves as White (81.3 percent). The second
largest population identified as Black or African American (8.8 percent) followed by Hispanic or
Latino (2.9 percent), Asian (1.9 percent), two or more races (1.9 percent), and less than 1 percent
identified as American Indian, Alaskan Native, Native Hawaiian, or Pacific Islander.
Approximately 72 percent of the employees have been working at their store for over a year.
19
Measures
The measures used in both samples were identical. The consulting firm that provided the
data also developed all of the measures included in the study. Because they intend to use the
measures with clients, the items are proprietary and cannot be shared in full. The following
section describes the traits measured, the response scales, and gives a few examples.
Personality. Personality was measured using 28 forced choice items (56 adjectives) that
mapped directly to previously established Big 5 adjectives (e.g. John, 1989; Johnson &
Ostendorf, 1993; Hofstee, de Raad, & Goldberg, 1992). Forced choice items are frequently
preferred by organizations due to their ability to reduce faking on personality assessments
(Saville & Wilson, 1991; Jackson, Wroblewski, & Aston, 2000). Participants were asked to
choose which adjective (out of two options) described them best at work. Sample adjectives
include enthusiastic for extraversion, easy-going for agreeableness, organized for
conscientiousness, resilient for emotional stability, and innovative for openness to experience.
Each item was paired with an item from one of the other four Big 5 dimensions or with a
“distractor” adjective that did not fit with any of the Big 5. Adjectives that strongly factor into
one Big 5 dimension were chosen for use in this study. The items were prepared for use in latent
class analysis (see Analysis section).
Performance. Performance was measured using an online survey for supervisors to rate
their employees. Performance ratings were only used for the study, retail convenience store
sample to test the hypotheses. Each supervisor rated between 1 and 9 employees. Supervisors
received training prior to completing the ratings: a computer-based module to orient them to the
rating process and educate them about ways to avoid common rating errors. Supervisors rated
employees on a large set of performance items on a scale of 1 (fails to meet requirements) to 5

20
(consistently performs above and beyond), with this studying using items that were specifically
either interpersonal or task-based performance. An exploratory principal components factor
analysis with varimax rotation was used, given that these are not an existing scale. The results
supported three, rather than two, distinct performance factors: 8 task performance items ( =
0.934, M = 3.601, SD = 0.828,), 7 interpersonal performance with customers items ( = 0.940, M
= 3.851, SD = 0.809), and 6 communication items ( = 0.894, M = 3.728, SD = 0.763). The
communication items referred to communicating effectively with others in general, not just with
customers. After confirming good reliability, scale scores were created by summing the set of
items loading into each factor. Sample items include “Quickly start difficult tasks without
procrastination” (task performance), “Empathize with customers to better understand their
unique problems or needs” (interpersonal performance), and “Actively listen when
communicating with others” (communication performance). Scores were then standardized for
conducting latent class analyses.

21
Chapter 3
Analysis
The current study used latent class analysis as the primary method of testing the
hypotheses. Latent class analysis, as stated previously, is a person-oriented statistical approach
that is used to identify underlying latent classes of individuals who share similar characteristics
(Collins & Lanza, 2010). This study used the SAS procedure for LCA developed by the
Pennsylvania State University Methodology Center (PROC LCA, 2011; Lanza et al., 2011). For
more detailed information about LCA and its procedures, see Collins and Lanza (2010) and
Lanza and colleagues (2007).
Preparing Personality Scales as Categorical Indicators
As mentioned previously, forced choice items were used to measure personality. Forced
choice items have ipsative measurement properties, violating a number of assumptions such as
independence of error variance, making reliability, validity, and factor analyses inappropriate
statistics to use (Hicks, 1970, Johnson et al., 1988; Tenopyr, 1988; Meade, 2004; Vasilopoulos et
al., 2006). Even studies arguing for the benefits of forced choice items show lower reliabilities in
their results for ipsative data and higher dependence on the number of items for good reliability
(e.g. Saville & Wilson, 1991; Jackson, Wroblewski, & Aston, 2000). Instead, I explored the
option of using Item Response Theory (IRT); however, given the inconsistent pairings of the
items, such that adjectives were not consistently paired with the same Big 5 dimension or a
distractor, IRT was also an inappropriate approach (e.g. Brown & Maydeu-Olivares, 2011).
Given the above challenges to providing traditional psychometric and construct validity
evidence from the consulting firm’s measure of the Big 5, I pursued a content validity approach.
This approach included a comparison of my items with frequently used Big 5 items. Specifically,

22
in order to provide evidence that these forced choice items measured personality and aligned
with the Big 5, the pool of personality adjectives were compared to a number of Big 5 factor
validity studies (e.g. John, 1989; Johnson & Ostendorf, 1993; Hofstee, de Raad, & Goldberg,
1992). The personality responses were two adjectives for the participant to choose between.
Each item included one Big 5 adjective and either a different Big 5 dimension’s adjective or a
distractor adjective that did not fit within the Big 5. Specifically, each adjective used in the
personality items that was an identical match to an adjective found in all three studies was
chosen for use in this study. Three items (both sets of adjectives) were dropped from further
analysis based on the comparison. Then, each item was transformed into two items – one for
each adjective used in the original forced choice item. During this process, 15 additional
distractor adjectives that did not fit the Big 5 were dropped from further analyses leaving 35 total
personality adjectives for use in this study. There were 6 items for extraversion (M = 2.733, SD =
1.246), 7 for agreeableness (M = 3.754, SD = 1.420), 9 for conscientiousness (M = 5.284, SD =
1.672), 6 for emotional stability (M = 3.332, SD = 1.278), and 7 for openness to experience (M =
2.307, SD = 1.491).
Latent class models rely on categorical indicators of underlying subgroups (Lanza et al.,
2007). Thus, in order to prepare the measures for latent class analysis, the new items for each
personality dimension were summed and transformed into discrete variables. For each summed
personality dimension, the 25th
, 50th
and 75th
percentiles were calculated for the sample. Then,
for each trait, each individual was given either a score of 1 if she was in the 25th
percentile, 3 if
she was in the 75th
percentile, and 2 if she had a score of anything else, to form low, moderate,
and high levels of the trait.

23
Latent Class Structure Identification
The selection of a latent class model involves a procedure where models with different
numbers of latent classes are compared in terms of parameter estimates and fit statistics in order
to determine the optimal balance between fit and parsimony. Specifically, it is important to
identify a model with good absolute model fit (i.e., small G2 relative to the degrees of freedom),
an optimal balance between fit and parsimony (i.e., low Akaike information criterion, or AIC,
and Bayesian information criterion, or BIC), and an interpretable and meaningful solution. Two
parameters are estimated in LCA: class membership probabilities and item-response probabilities
conditional on class membership (Lanza et al., 2007; Collins & Lanza, 2010).
Individual-level LCA. Latent class analysis uses the EM (expectation-maximization)
algorithm to produce maximum likelihood estimates of all model parameters (Lanza et al., 2007).
To identify the appropriate latent class models, PROC LCA analyses were run in SAS using the
personality variables for the items and 100 random starting values for each model, starting with 1
class, then, adding additional classes. Model identification is assessed for each of the models
under consideration. When fitting a latent class model, multiple sets of starting values are
necessary to determine whether solutions with different parameter estimates are produced. It is
necessary to ascertain that random starting values consistently converge to the model solution
with the maximum likelihood value. Each of the models (starting with the one-class model) was
assessed using the fit statistics (G2, AIC, BIC) and interpretability of the resulting structures.
Model interpretability should consider whether each class is distinguishable from the others
based on the item-response probabilities, there is no class that is trivial in size, and it is possible
to assign meaningful labels to each class (Lanza et al., 2007). Typically, item-response
probabilities are considered high or meaningful if they are over 0.500. The model with the

24
optimal balance between fit and parsimony was identified in this step by comparing the fits
statistics and model interpretation across all of the models.
Comparison between samples. Individual-level LCAs were conducted on both the pilot
and the study samples. A comparison of the latent class structures identified was conducted to
validate the latent class structure found. To compare the two, the model structure was interpreted
for the study, retail convenience store sample and compared with the interpretation of the pilot,
grocery store sample. Similar results would indicate that the class structure is replicable in other
samples permitting for generalizability beyond the pilot sample. If the results were replicable,
further analyses were conducted on the larger, retail convenience store sample to test the
hypotheses. The larger sample was chosen for testing the hypotheses due to its increase in power,
important for latent class analyses.
Multi-level LCA. After completing the individual-level analyses, a multi-level LCA was
conducted on the retail convenience store sample. It was necessary given the nested nature of the
data. As stated previously, there were three different higher levels within the data – employees
within supervisors, supervisors within stores, and stores within retail convenience store chain.
Given that the multi-level LCA can only be conducted using one nesting (or clustering) variable,
the analysis was run using supervisors since they were the most proximal to the employees and
presumably the most influential in regards to performance scores. LCA with clustering
accommodates the fact that individuals within cluster may be more similar than individuals in
different clusters. The LCA using the four-class model was run using 100 random starting values
to ensure the structure would be repeated. The latent class structure was compared to the
structure of the individual-level LCA. Regardless of the comparison between the two structures,

25
the nested model was then used in subsequent analyses. The nested model has the correct
standard errors and is necessary for appropriate interpretability of results in further analyses.
Including Performance Covariates
Including covariates in a LCA extends the latent class models to include predictors of
class membership. Latent class membership is predicted by covariates through multinomial
logistic regression (Lanza et al., 2007; Collins & Lanza, 2010). After identifying and confirming
the multi-level latent class structure, each performance variable was included as a covariate in
the LCA individually to identify any differences between classes. A REFERENCE statement in
the SAS code specifies which latent class should be used as the reference class for the
multinomial logistic regression (Lanza et al., 2007). The results of this analysis include the log-
likelihood test for the overall effect of each covariate. For each type of performance, a significant
result indicates that performance is a significant predictor of latent class membership.
For significant covariates, the estimated logistic regression coefficients, or ß (Beta), and
odds ratios were interpreted. A significant odds ratio has a confidence interval that does not
include one. The odds ratio indicates the increase in odds of class membership, relative to the
reference class, corresponding to a one-unit increase in the covariate (Lanza et al., 2007).
However, if a covariate is found to be significant overall but none of the odds ratios are, given a
particular reference class, a change in reference class can help identify the pairwise differences
driving the significant covariate effect. In other words, if the overall effect is significant but the
reference class does not show where the effect is occurring, changing the reference class will
allow an examination of other pairwise comparisons. In this study, the reference class was
changed to the class with the highest odds ratios when this occurred. The results were interpreted
to understand the differences in performance between the latent classes.

26
Multiple-Groups LCA
For the exploratory gender analyses, a multiple-group LCA was conducted by including
gender as a grouping variable. In multiple-group LCA, the class membership and the item-
response probabilities can vary across groups (Lanza et al., 2007; Collins & Lanza, 2010). All
parameters can be estimated conditional on group membership. In addition, measurement
invariance across groups can be empirically tested using LCA. To test for measurement
invariance, a model with free estimation of the item-response probabilities was compared to a
model including restrictions that equated the probabilities across groups (the restricted model can
be specified by adding in a MEASUREMENT statement and identifying groups as the variable).
These two models are nested (Lanza et al., 2007) and thus can be compared by examining the
difference between the G2s from each model. A significant result indicates that measurement
invariance does not exist between the groups. However, it is also important to observe the AIC
and BIC statistics to identify which model is more appropriate in terms of balancing fit and
parsimony. In this study, the free estimation and restricted multi-level, multiple-group latent
class models were compared to identify whether measurement invariance existed. The optimal
model was used for interpretation of gender differences in class membership.
Gender and performance. The next step in understanding the differences between the
sexes is to include performance as a covariate in the multiple-group LCA. When a covariate and
a grouping variable are both included in LCA, they are automatically allowed to interact (Collins
& Lanza, 2010). Including performance as a covariate in multiple-group LCAs allowed for a
comparison of the effects of performance by gender. Similar to the original multi-level LCA
including the performance covariates, a significant result indicates that performance is a
predictor of latent class membership. In addition, the odds ratios were interpreted for significant

27
findings. In this analysis, the odds ratios are provided by gender. Thus, the odds ratio here
indicates the increase in odds of class membership for a particular gender, relative to the
reference class, corresponding to a one-unit increase in the covariate.
Regression Comparison
In addition to conducting the various LCAs described above, regression analyses were
also conducted to compare the implications that may be drawn based on the different analytic
approaches. Given that latent class analysis is a more complex analysis and is infrequently used
in the field, it is important to ensure it adds value above what a typical regression analysis
provides. Most frequently, regressions testing personality effects on performance have been
conducted as individual-level main effect analyses (e.g., Barrick & Mount, 2005). Each type of
performance was regressed on gender and the continuous personality scales. The r2 change,
regression coefficients, and significance tests were all interpreted to identify any effects of
personality on performance. These results were then compared to the LCA results to determine
the unique information that could be discerned from each analysis.

28
Chapter 4
Results
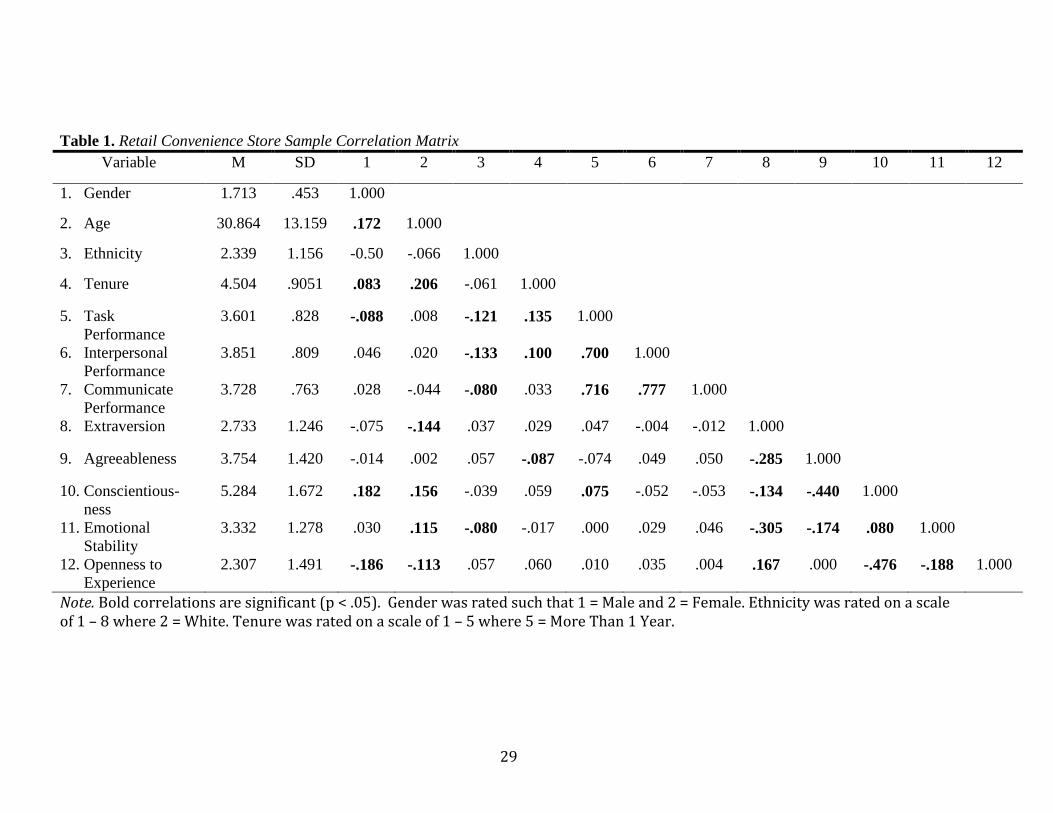
All of the relevant variables were correlated. The resulting correlations can be found in
Table 1. The analyses described in the above Analysis section were conducted and resulted in the
following outcomes.
Individual-Level LCA
The individual-level LCAs were conducted using the discrete personality variables and
100 random starts for each model, starting with 1 class and ending with 5 classes.
Pilot sample. For the pilot grocery store sample, a 4-class structure was found to be
optimal (G2
= 127.09; AIC = 213.09; BIC = 361.30; df = 199). The four latent classes identified
are labeled A, E, CEs, and O based on their unique, highest item-response probabilities (see
Table 2). The A Class (23 percent of the sample) had high item-response probabilities of being
low on extraversion (p = 0.564) and high on agreeableness (p = 0.991). In addition, this group
tends to be low on openness to experience (p = 0.501) and moderate on emotional stability (p =
0.516). The E Class (26 percent of the sample), on the other hand, are most likely to be low on
agreeableness (p = 0.678), conscientiousness (p = 0.607), and emotional stability (p = 0.674) and
high on extraversion (p = 0.954). The CEs Class (29 percent of the sample) tended to be low on
extraversion (p = 0.542), agreeableness (p = 0.985), and openness to experience (p = 0.588).
However, they also tended to be high on conscientiousness (p = 0.979) and emotional stability (p
= 0.784). Lastly, the O Class (22 percent of the sample) tended to be low on conscientiousness
(p = 0.727) and high on openness to experience (p = 0.890). They also tended to be high on
agreeableness (p = 0.648). Interestingly, the classes had fairly equivalent numbers of
participants.
29
Table 1. Retail Convenience Store Sample Correlation Matrix
Variable M SD 1 2 3 4 5 6 7 8 9 10 11 12
1. Gender 1.713 .453 1.000
2. Age 30.864 13.159 .172 1.000
3. Ethnicity 2.339 1.156 -0.50 -.066 1.000
4. Tenure 4.504 .9051 .083 .206 -.061 1.000
5. Task
Performance
3.601 .828 -.088 .008 -.121 .135 1.000
6. Interpersonal
Performance
3.851 .809 .046 .020 -.133 .100 .700 1.000
7. Communicate
Performance
3.728 .763 .028 -.044 -.080 .033 .716 .777 1.000
8. Extraversion 2.733 1.246 -.075 -.144 .037 .029 .047 -.004 -.012 1.000
9. Agreeableness 3.754 1.420 -.014 .002 .057 -.087 -.074 .049 .050 -.285 1.000
10. Conscientious-
ness
5.284 1.672 .182 .156 -.039 .059 .075 -.052 -.053 -.134 -.440 1.000
11. Emotional
Stability
3.332 1.278 .030 .115 -.080 -.017 .000 .029 .046 -.305 -.174 .080 1.000
12. Openness to
Experience
2.307 1.491 -.186 -.113 .057 .060 .010 .035 .004 .167 .000 -.476 -.188 1.000
Note. Bold correlations are significant (p < .05). Gender was rated such that 1 = Male and 2 = Female. Ethnicity was rated on a scale of 1 – 8 where 2 = White. Tenure was rated on a scale of 1 – 5 where 5 = More Than 1 Year.

30
Table 2. Item-response probabilities for four-class model and class membership proportions by
gender in the Grocery Store Sample.
Latent Classes
A Class E Class CEs Class O Class
Low
Extraversion 0.564 0.007 0.542 0.438
Agreeableness 0.009 0.678 0.985 0.352
Conscientiousness 0.279 0.607 0.003 0.727
Openness 0.501 0.158 0.588 0.007
Emotional Stability 0.233 0.674 0.064 0.280
Moderate
Extraversion 0.364 0.039 0.413 0.542
Agreeableness 0.000 0.000 0.000 0.000
Conscientiousness 0.294 0.162 0.175 0.263
Openness 0.461 0.268 0.269 0.103
Emotional Stability 0.516 0.131 0.152 0.266
High
Extraversion 0.072 0.954 0.045 0.020
Agreeableness 0.991 0.322 0.015 0.648
Conscientiousness 0.427 0.231 0.979 0.010
Openness 0.038 0.575 0.142 0.890
Emotional Stability 0.251 0.195 0.784 0.195
Class Membership Proportions
All Participants 23% 26% 29% 22%
Male 18% 21% 30% 31%
Female 34% 32% 27% 8%
Note. Boldfaced type indicates item-response probabilities over 0.500.
Study sample. For the retail convenience store sample, a four-class solution was also
selected as optimal, with relatively low fit statistics and good model interpretability (G2
=
295.62; AIC = 381.62; BIC = 576.70; df = 199). Overall, the latent class structure based on the
retail convenience store sample replicated the pilot sample extremely well (see Table 3). The
four latent classes identified were labeled similarly to the grocery store sample: A, E, CEs, and
O. The A Class (24 percent of the sample) had high item-response probabilities of being low on
extraversion (p = 0.779) and high on agreeableness (p = 0.771). In addition, this group tends to

31
Table 3. Item-response probabilities for four-class model and class membership proportions by
gender in the Retail Convenience Store Sample.
Latent Classes
A Class E Class CEs Class O Class
Low
Extraversion 0.779 0.097 0.736 0.218
Agreeableness 0.005 0.667 0.678 0.337
Conscientiousness 0.370 0.016 0.002 0.991
Openness 0.348 0.269 0.648 0.093
Emotional Stability 0.224 0.450 0.069 0.310
Moderate
Extraversion 0.220 0.384 0.241 0.320
Agreeableness 0.223 0.237 0.316 0.254
Conscientiousness 0.579 0.677 0.345 0.008
Openness 0.294 0.304 0.223 0.109
Emotional Stability 0.302 0.281 0.122 0.301
High
Extraversion 0.002 0.518 0.022 0.462
Agreeableness 0.771 0.096 0.006 0.409
Conscientiousness 0.051 0.306 0.653 0.001
Openness 0.358 0.428 0.130 0.798
Emotional Stability 0.474 0.269 0.809 0.389
Class Membership Proportions
All Participants 24% 30% 24% 22%
Male 16% 23% 14% 47%
Female 24% 29% 28% 19%
Note. Boldfaced type indicates item-response probabilities over 0.500.
be moderate on conscientiousness (p = 0.579). The E Class (30 percent of the sample), on the
other hand, are most likely to be low on agreeableness (p = 0.667) and high on extraversion (p =
0.518). However, they also tend to be moderate on conscientiousness (p = 0.677). The CEs
Class (24 percent of the sample) tended to be low on extraversion (p = 0.736), agreeableness (p
= 0.678), and openness to experience (p = 0.648). However, they also tended to be high on
conscientiousness (p = 0.653) and emotional stability (p = 0.809). Lastly, the O Class (22
percent of the sample) tended to be low on conscientiousness (p = 0.991) and high on openness

32
to experience (p = 0.798). As in the grocery store sample, the classes had fairly equivalent
numbers of participants.
The largest difference between the two samples appeared in the E Class. In the retail
convenience store sample, these individuals were most likely to be moderate on
conscientiousness, whereas in the grocery store sample, they tended to be low on
conscientiousness. In the grocery store sample, they also tended to be low on emotional stability.
In addition, the O Class in the grocery store sample was also high on agreeableness, while this
group was not characterized by agreeableness in the retail convenience store sample. Even
though there were a few differences, the general interpretability of the two latent class structures
were highly similar.
The comparisons between these two individual-level LCAs provided validation for the
four latent classes found in both sample. The results indicate ability to replicate similar
personality typologies in two different customer service settings. Given the validation of the
classes, further analyses were conducted on the larger sample (the retail convenience store
sample) to incorporate clustering and performance predictors in the latent class model.
Multi-Level LCA.
The multi-level LCA was conducted due to the nested nature of the data, using
supervisors as the clustering variable. The latent class structure selected was identical (i.e. item-
response probabilities did not differ by more than 0.001) to that of the individual-level LCA (G2
= 295.62; AIC = 381.62; BIC = 576.70; df = 199). This nested model was used in subsequent
analyses to examine the link between latent class membership and job performance. Even though
the structures were identical, as mentioned in the Analysis section, it is important to use the
nested model with the correct standard errors to appropriately interpret further findings.

33
Performance Covariates
After identifying and confirming the multi-level latent class structure, each performance
variable was included as a covariate in the LCA individually to identify the most effective task
and interpersonal performing classes. A reference statement was included when running the
analyses to indicate which reference class to use for the multinomial logistic regression. The CEs
Class was specified as the reference class initially because this was the one class that tended to
be high on conscientiousness and emotional stability, the two strongest predictors of
performance (Barrick & Mount, 2005). As discussed in the analysis section, the reference class
was changed to understand the effect of performance when the overall effect was significant but
the original reference class had no significant comparisons. Table 4 shows the ß parameter and
the odds ratio for each class for each type of performance. Since performance is a standardized
variable, the odds ratios are interpreted as the increase in odds of membership in a latent class
relative to the reference class corresponding to a one standard deviation increase in performance
(Lanza et al., 2007). When odds ratios are less than 1, inverse odds ratios (1/odds ratio) can be
used for easier interpretation. The inverse odds ratio is interpreted as an increase in odds of
membership in a latent class relative to the reference class corresponding to a one standard
deviation decrease in performance.
Interpersonal performance. Interpersonal performance was not a significant predictor
of latent class membership (p > 0.100). Thus, Hypothesis 1 that high interpersonal performers
would be high on agreeableness and moderate on conscientiousness and emotional stability was
not supported. However it is notable that there was a class of people who closely fit this profile
among the retail convenience store employees: 24 percent of the sample were in the A Class.
This group was high on agreeableness and moderate on conscientiousness, but was not

34
Table 4. Parameter estimates and odds ratios for covariates.
Interpersonal
Performance
Communication
Performance Task Performance
Class ß Odds
Ratio ß
Odds
Ratio ß
Odds
Ratio
A Class
Lower Bound
Upper Bound
0.051
1.052
0.841
1.315
-0.190
0.827
0.640
1.070
-0.334
0.716
0.572
0.897
E Class
Lower Bound
Upper Bound
-0.090
0.914
0.725
1.151
-0.311
0.733
0.571
0.940
-0.093
0.911
0.728
1.140
CEs Class
Lower Bound
Upper Bound
-
1.000
-0.094
0.910
0.728
1.137
-
1.000
O Class
Lower Bound
Upper Bound
0.109
1.115
0.883
1.407
-
1.000
-0.119
0.888
0.702
1.125
Note. Dashes indicate the reference class. Boldfaced type indicates odds ratios that were
significant. 95% Confidence Intervals of the odds ratios are provided in the Lower Bound/Upper
Bound rows.
A Class (high agreeableness, moderate conscientiousness, high extraversion)
E Class (high extraversion, moderate conscientiousness, low agreeableness)
CEs Class (high conscientiousness and emotional stability, low everything else)
O Class (high openness to experience, low conscientiousness)
characterized by emotional stability. However, they were no better at interpersonal performance
than any other class.
Communication performance. Since communication with others is also important for
overall interpersonal performance, the same hypotheses were tested for this predictor.
Communication performance was a significant predictor of latent class membership (p < 0.001).
However, none of the pairwise comparisons were significant when using the CEs Class as the
reference class. Thus to explore the communication performance effect further, the reference
class was changed to the class with the largest odds ratio, or the O Class. This reference class did
result in significant pairwise comparisons. For every one standard deviation decrease in
performance, employees were 36 percent (inverse odds ratio = 1.364) more likely to be in the E

35
Class than the O Class. Thus, employees who are better communicating with others were
significantly more likely to be in the O Class than the E Class. Since the E Class is characterized
by low agreeableness, this suggests lower levels of agreeableness make for worse
communication performance. Interestingly, higher levels of openness to experience, a trait that
uniquely characterized the O Class, was also key for high communication performance. Even
though Hypothesis 1 was not supported here since the best performers were low on
conscientiousness, the findings do indicate that high agreeableness is preferable to low
agreeableness.
Task performance. Task performance was a significant predictor of latent class
membership (p < 0.005). For task performance, since the odds ratio for the one significant
pairwise comparison was below 1 (odds ratio = 0.716), the inverse odds ratio was used. Thus for
every one standard deviation decrease in performance, employees were 40 percent (inverse odds
ratio = 1.397) more likely to be in the A Class than the CEs Class. Thus, better task performers
were significantly more likely to be in the CEs Class than the A Class. In Hypothesis 2, it was
hypothesized that high task performers would belong to a class that was high on
conscientiousness and emotional stability. The results support the predictions because the CEs
Class is uniquely characterized by high conscientiousness and emotional stability.
Multiple-Groups LCA
Gender was specified as a grouping variable in the retail convenience store sample in the
multi-level LCA to conduct the exploratory analyses on class prevalence within gender and the
effects of performance. To test for measurement invariance across gender, the latent class model
was conducted with all parameters freely estimated and again constraining item-response
probabilities to be equal across groups. The G2
difference was 73.920 (df = 40, p < 0.001). The

36
AIC for the freely estimated model was 636.000 and the BIC was 1025.660. For the constrained
model, the AIC was 629.920 and the BIC was 838.340. Thus, even though the likelihood-ratio
difference test was significant, the information criteria both point to the model with equal
measurement. Measurement invariance was imposed to ensure that the latent classes had the
same meaning across genders.
However, class membership probabilities varied greatly by gender (see Table 3),
especially for one class: 47 percent of men belonged to the O Class class compared to only 19
percent of women. In addition, women were more likely than men to be in the A Class (24% vs.
16%), the E Class (29% vs. 23%), and the CEs Class (28% vs. 14%). Interestingly, the latent
class prevalence varied in a similar direction in the grocery store sample (see Table 2). The
difference in latent class prevalence in the retail convenience store sample was tested for
significance by comparing the latent class model where latent class prevalence was estimated
freely and the model where the latent class prevalence was restricted to be equal across groups.
The G2
difference test was significant. (F = 17.993, df = 3, p < 0.01) indicating that the
differences in latent class prevalence by gender are meaningful. Women are less likely to belong
in the O Class than men, and men are less likely to be in any of the other classes than women.
Gender and interpersonal performance. Men averaged scores of 3.795 for
interpersonal performance, while women averaged 3.877. After including gender, interpersonal
performance became a significant predictor of latent class membership (p < 0.01) for males only.
Again, females seem to have been driving the majority of effects found in the single-group
LCAs. There were no effects for women in the sample (see Table 5). However, interestingly, for
every one standard deviation increase in interpersonal performance, male employees were 72
percent more likely to be in the O Class than the CEs Class. Thus, better male interpersonal

37
Table 5. Parameter estimates and odds ratios for Interpersonal Performance in the groups LCA
with Gender.
Interpersonal Performance
Reference:
CEs Class
Class ß Odds Ratio
MALES
A Class
Lower Bound
Upper Bound
0.134
1.143
0.717
1.824
E Class
Lower Bound
Upper Bound
0.338
1.402
0.924
2.128
CEs Class
Lower Bound
Upper Bound
-
1.000
O Class
Lower Bound
Upper Bound
0.545
1.724
1.179
2.521
FEMALES
A Class
Lower Bound
Upper Bound
0.089
1.093
0.849
1.407
E Class
Lower Bound
Upper Bound
-0.171
0.843
0.660
1.076
CEs Class
Lower Bound
Upper Bound
-
1.000
O Class
Lower Bound
Upper Bound
0.089
1.093
0.820
1.457
Note. Dashes indicate the reference class. Boldfaced type indicates odds ratios that were
significant. 95% Confidence Intervals of the odds ratios are provided in the Lower Bound/Upper
Bound rows.
A Class (high agreeableness, moderate conscientiousness, high extraversion)
E Class (high extraversion, moderate conscientiousness, low agreeableness)
CEs Class (high conscientiousness and emotional stability, low everything else)
O Class (high openness to experience, low conscientiousness)

38
Gender and communication performance. Men averaged scores of 3.698 for
communication performance, while women averaged 3.744. Communication performance was
not a significant overall predictor of latent class membership when gender was included as a
grouping variable (p > 0.1). However, for males, the confidence interval for the odds ratio for the
O Class did not include zero. Thus, it is worth mentioning that for every one standard deviation
increase in communication performance, male employees were 68 percent more likely to be in
the O Class than the CEs Class (see Table 6). This further suggests that the O Class is worth
further consideration given their importance in performance for men.
In addition, after changing the reference class to the O Class due to their highest odds
ratios, a significant odds ratio surfaced for females as well. For every standard deviation
decrease in communication performance, female employees were 35 percent (inverse odds ratio
= 1.353) more likely to be in the E Class than the O Class. Thus, better female communication
performers were more likely to be in the O Class than the E Class. Looking at the odds ratios
carefully indicates a trend towards the O Class being the best communication performers for both
genders.
Gender and task performance. Men averaged scores of 3.405 for task performance,
while women averaged 3.684. Again, task performance was a significant predictor of latent class
membership (p < 0.01). Table 7 shows, for each gender, the ß parameter and the odds ratio for
each class for task performance. For every one standard deviation decrease in performance,
female employees were 36 percent (inverse odds ratio = 1.360) more likely to be in the A Class
than the CEs Class. Thus, better female task performers were significantly more likely to be in
the CEs Class than the A Class. Although this effect was in the same direction for males, it was
not statistically significant.

39
Table 6. Parameter estimates and odds ratios for Communication Performance in the groups
LCA with Gender.
Communication Performance
Reference:
CEs Class
Reference:
O Class
Class ß Odds Ratio ß Odds Ratio
MALES
A Class
Lower Bound
Upper Bound
0.315
1.371
0.888
2.117
-0.205
0.815
0.555
1.196
E Class
Lower Bound
Upper Bound
0.225
1.252
0.754
2.078
-0.296
0.744
0.442
1.253
CEs Class
Lower Bound
Upper Bound
-
1.000
-0.520
0.594
0.400
0.884
O Class
Lower Bound
Upper Bound
0.520
1.683
1.132
2.501
-
1.000
FEMALES
A Class
Lower Bound
Upper Bound
-0.152
0.859
0.556
1.300
-0.170
0.844
0.615
1.158
E Class
Lower Bound
Upper Bound
-0.285
0.752
0.546
1.035
-0.303
0.739
0.556
0.981
CEs Class
Lower Bound
Upper Bound
-
1.000
-0.018
0.982
0.715
1.350
O Class
Lower Bound
Upper Bound
0.018
1.018
0.741
1.399
-
1.000
Note. Dashes indicate the reference class. Boldfaced type indicates odds ratios that were
significant. 95% Confidence Intervals of the odds ratios are provided in the Lower Bound/Upper
Bound rows.
A Class (high agreeableness, moderate conscientiousness, high extraversion)
E Class (high extraversion, moderate conscientiousness, low agreeableness)
CEs Class (high conscientiousness and emotional stability, low everything else)
O Class (high openness to experience, low conscientiousness)

40
Table 7. Parameter estimates and odds ratios for Task Performance in the groups LCA with
Gender.
Task Performance
Reference:
CEs Class
Reference:
A Class
Class ß Odds Ratio ß Odds Ratio
MALES
A Class
Lower Bound
Upper Bound
-0.218
0.805
0.510
1.268
-
1.000
E Class
Lower Bound
Upper Bound
0.037
1.038
0.635
1.695
0.226
1.290
0.817
2.038
CEs Class
Lower Bound
Upper Bound
-
1.000
0.218
1.243
0.789
1.959
O Class
Lower Bound
Upper Bound
0.217
1.243
0.845
1.827
-0.133
1.545
1.049
2.274
FEMALES
A Class
Lower Bound
Upper Bound
-0.309
0.735
0.576
0.937
-
1.000
E Class
Lower Bound
Upper Bound
-0.025
0.976
0.775
1.228
0.284
1.328
1.041
1.695
CEs Class
Lower Bound
Upper Bound
-
1.000
0.309
1.362
1.068
1.736
O Class
Lower Bound
Upper Bound
-0.073
0.930
0.715
1.209
0.236
1.266
0.905
1.771
Note. Dashes indicate the reference class. Boldfaced type indicates odds ratios that were
significant. 95% Confidence Intervals of the odds ratios are provided in the Lower Bound/Upper
Bound rows.
A Class (high agreeableness, moderate conscientiousness, high extraversion)
E Class (high extraversion, moderate conscientiousness, low agreeableness)
CEs Class (high conscientiousness and emotional stability, low everything else)
O Class (high openness to experience, low conscientiousness)

41
When interpreting the odds ratios, it was noticed that the O Class had the highest odds
ratio for men. Given the large difference between the odds ratios of the A Class and the O Class
for men, a change in reference class could possibly find a significant pairwise comparison. In
addition, for females, the A Class had much lower odds ratios than all of the other groups and,
since they had a significant difference from the CEs Class, it may make sense to compare them
to the other classes as well. Thus, to fully understand the significant effect of task performance,
the reference class was changed to the A Class. Interestingly, more significant pairwise
comparisons were identified. For every one standard deviation increase in task performance,
females were 33 percent more likely to be in the E Class than the A Class. In sum, the A Class
seem to be the lowest task performers for the female employees. In addition, male employees
were 55 percent more likely to be in the O Class than the A Class for every one standard
deviation increase in task performance. Overall, for both males and females, the A Class seemed
to be relatively low task performing employees.
Regression Comparison
Main effect regression analyses were conducted with gender and all five personality
predictors of performance as a comparison to the LCA results. None of the personality variables
significantly predicted task, interpersonal, or communication performance. Gender, also, did not
predict interpersonal or communication performance. The only significant finding was that
gender significantly predicted task performance (b = 0.152; r = 0.152; F(1, 684) = 16.180, p =
0.00), such that women are rated higher on task performance. In addition, given the complex
results of the LCAs that included both gender and performance, additional regressions were
conducted including interaction terms of gender with all of the personality predictors. However,

42
none of these interaction terms were found to be significant either. Thus, the regression results
suggest that the personality traits do not predict performance, in contrast to the LCA results.
43
Chapter 5
Discussion
The purpose of the current study was to describe the personality classes in a customer
service population and to identify a class of individuals with optimal trait combinations in
predicting high customer service performance by using a novel person-focused statistical
approach. Previous research on personality traits predicting performance in customer service jobs
have been mixed in its findings (e.g., Motowidlo, Brownlee, & Schmit, 2008; Witt et al., 2002).
Furthermore, prior personality research has been limited by looking at traits individually (Barrick
et al., 2001) even though personality is a set of traits and attributes that work together to create
an individual’s basic tendencies (Ones, Viswesvaran, & Dilchert, 2005). Using a person-centered
approach is important in understanding the individual holistically by identifying groups that
share similarities on a set of constructs, such as personality (Craig & Smith, 2000; Sinclair et al.,
2005). The current study used a person-focused statistical approach – latent class analysis – to
begin testing a potentially more informative and effective method of selecting employees for
customer service jobs.
Personality Typologies
Latent class analysis is a primarily descriptive analysis that extracts patterns from large
amounts of information (Collins & Lanza, 2010). LCA assumes there are underlying groups of
individuals within the sample who share similarities on certain characteristics. Using this method
allows researchers to describe samples and their personality types. This study was able to
describe four different personality typologies that exist in customer service jobs. The classes
found in this study are based solely on the patterns of measured personality within the grocery
store and retail convenience store samples. Four latent classes were found – A Class, E Class,

44
CEs Class, and O Class. The A Class is a class of individuals that are highly agreeable but also
introverted. The E Class is a group of customer service employees that are highly extraverted but
are low on agreeableness. The CEs Class is a personality type that describes highly conscientious
and emotionally stable individuals that tend to be low on all other personality traits. Lastly, the O
Class tends to be high on openness to experience while also not defining themselves as
conscientious.
Hypothesis 1 suggested that a class high on agreeableness and moderate on
conscientiousness and emotional stability would exist. Numerous studies mentioned the
importance of agreeableness in interpersonal performance (e.g. LePine & Van Dyne, 2001),
while a recent study on curvilinear relationships suggested that moderate levels of
conscientiousness and emotional stability are appropriate in various situations (Le et al., 2010).
A class similar to the one hypothesized did exist in the A Class. This group was characterized by
being high on agreeableness and moderate on conscientiousness. However, they were also
characterized by being low on extraversion and emotional stability did not characterize this
group at all. Given previous research on the importance of emotional stability for performance
(Barrick & Mount, 2005), this finding seems to make sense given that this class was no better at
interpersonal performance than the other classes.
Emotional stability actually only characterized one group, the CEs Class, which aligned
with Hypothesis 2. Hypothesis 2 predicted that a class would exist that was high on emotional
stability and high on conscientiousness given all of the extensive research on these traits
importance in job performance (e.g. Barrick et al, 2001). The CEs Class was characterized by
being high on both of these traits, as well as being low on all of the other Big 5 traits –
extraversion, agreeableness, and openness to experience. Interestingly, given the performance

45
findings (discussed below), this finding suggests that previous research on the importance of
these to variables is valid, at least for task performance. Even though these individuals were low
on all of the other Big 5 traits, the combination of conscientiousness and emotional stability
seems to compensate for this and link with positive performance. Importantly, however, the
relationships of these classes with performance were more complicated than initially
hypothesized.
The comparisons between the two samples validated the latent class structure found in
this study. Overall, the structures between the two samples were extremely similar. The general
interpretability of the two structures is highly similar and thus, the results indicate some ability to
replicate the latent personality structure of customer service employees. As stated previously, a
priori hypotheses are difficult using LCA when there is no research providing possible latent
classes. These classes can now inform future research and provide a foundation for future
hypotheses on personality combinations.
Nevertheless, the similarity between the two samples needs to be considered. Both
samples included low complexity jobs characterized by frequent encounter-based interactions
with customers. Different curvilinear relationships were found for emotional stability and
conscientiousness with performance based on the complexity of the job (Le et al., 2010). Thus,
the structures may have differed in other service settings.
Service Orientation
This study opted to use the Big 5 personality variables due to its frequent use in research
and practice. However, service orientation has also been used as a characteristic that can predict
service performance. Those that are high on service orientation are cooperative, self-controlled,
dependable, and well-adjusted (Hogan et al., 1984). Service orientation, thus, combines items

46
that potentially measure different personality variables. This group of individuals should thus be
high on agreeableness, conscientiousness, and emotional stability. Since this study identified
personality typologies in customer service employees, it can be used to compare classes with the
pattern of traits defined in service orientation measures to identify if a class of individuals that
fits service orientation exists. Unfortunately, none of the classes identified in these samples
actually fit the description of service orientation. The closest class is the CEs Class. However,
they tend to be low on agreeableness, which is counter to the definition of service orientation
presented. Thus, in low complexity, encounter-based customer service jobs, individuals that fit
the service orientation definition may not actually exist. Service orientation as a construct may
not be as useful and other personality trait combinations. Identifying existing personality
typologies is a more effective method in identifying high performers than defining a combination
of traits that may or may not exist in the population.
Predicting Performance
Performance in this study predicted the likelihood of class membership. Thus,
performance, included as a covariate in the LCA, could provide information surrounding which
class would be better at the different types of performance.
Interpersonal performance. Hypothesis 1 predicted that a class high on agreeableness
and moderate on conscientiousness and emotional stability would be effective interpersonal
performers. Unfortunately, this hypothesis was not supported. Even though the A Class was
similar to the predicted class, they did not perform any better than the other classes on
interpersonal performance with customers. This could indicate that personality does not
influence this form of interpersonal performance. However, interpersonal performance was
predicted by personality class but the effect depended on employee gender, as discussed below.

47
Furthermore, interpersonal performance in customer service includes both treating
customers with tact, consideration, and perceiving customer needs and providing effective and
pleasant communication (Hogan et al., 1984). This study found that performance factored into
both interpersonal performance with customers and communication with others. There was a
significant result found for the communication component of interpersonal performance. The E
Class was significantly worse communication performers than the O Class. Intuitively, it makes
sense that E Class would be poor at communication performance. They had the lowest odds ratio
out of all of the other classes, indicating a trend towards being the overall worst communication
performers. Extraverts’ dominant tendencies (Barrick et al., 2001) coupled with being
disagreeable, such as not being cooperative or willing to help others, explains why an E Class
member would be a poor communication performer. This suggests that when an organization is
looking to hire someone in a customer service job to be effective in communication, they should
avoid individuals with a combination of traits that include high extraversion and low
agreeableness. It is important to note that extraversion and disagreeableness alone does not have
this negative effect on performance indicating understanding personality combinations rather
than personality at the trait level is necessary.
Task performance. Hypothesis 2 predicted that a class characterized by high
conscientiousness and emotional stability would be effective task performers. This hypothesis
was supported; The CEs Class, the class that was characterized by high conscientiousness and
emotional stability as well as low extraversion, agreeableness, and openness to experience, were
significantly better task performers than the A Class, who are characterized by moderate
conscientiousness, high agreeableness and low extraversion. The CEs Class is more
conscientious and less agreeable than the A Class. In addition, the odds ratios trended such that

48
the CEs Class may be the highest task performers. Recent research showed a non-linear
relationship between conscientiousness and emotional stability on performance (Le et al., 2010)
but this study suggests that this relationship may highly depend on the type of performance. For
example, abiding by rules and procedures, a characteristic of high conscientiousness, is often
important in task performance since it is the technical core of the job (Borman & Motowidlo,
2003). In addition, the rigidity of a high conscientious individual should not affect the technical
task performance of a job. These results suggest that this is even true in customer service jobs
where interpersonal interactions are such an important aspect of the job.
Interestingly, however, the CEs Class was also low on extraversion, agreeableness, and
openness to experience. Generally, these three personality traits are less frequently found to
relate to performance (Barrick et al., 2001). Agreeableness and extraversion specifically are less
frequently found to be related to task performance than interpersonal performance (Barrick &
Mount, 2005; LePine & Van Dyne, 2001). It is possible that being high on these traits could
detract from task performance. For example, extraverts may tend to talk too much with their
coworkers or customers, taking time away from their tasks. In addition, high agreeableness may
influence task performance ratings. Those that spent more time on tasks have better career
outcomes than those that spend time on helping (Bergeron, 2007), an aspect of agreeableness.
Thus, being too agreeable and helping coworkers or spending too much time helping customers
can also lower the employee’s ability to perform tasks required by the job. Lastly, openness to
experience has traditionally been the personality trait least associated with performance (e.g.
Barrick et al., 2001). Openness may only be relevant in certain situations (Griffin & Hesketh,
2004) and thus may be irrelevant for performing basic tasks. Those that are high on openness
tend to seek out new and unconventional experiences and ideas (LePine, Colquitt, & Erez, 2000).

49
Instead of focusing on following procedures, high openness individuals may be seeking out new
ways to accomplish the tasks. Though this may be beneficial in the long-term for an organization
to discover new and more efficient ways to perform tasks, in the short-term and at the individual-
level, this may be harmful since time is detracted from the actual performance of tasks.
However, all of these supportive findings were looking at traits individually, unlike the
current study. Importantly, according to the current results, the combination of high
conscientiousness and high emotional stability with being low on the rest of the Big 5 is what led
to better task performance. The CEs Class could potentially be described as calm, subdued, and
rule-following individuals, which one could imagine would lead to effective task performance.
They are quiet, not easily excitable, and do not stray from tasks by helping others, while
following rules and procedures carefully to complete tasks on time and accurately.
In conclusion, the results suggest that, for task performance, high performing individuals
will have a personality combination of high conscientiousness and emotional stability and low
extraversion, agreeableness, and openness to experience. In addition, to employees with
ineffective interpersonal communication skills are characterized by the combination of high
extraversion and low agreeableness. However, these results get more complex when accounting
for gender.
Understanding the Effects of Gender
The relationships between personality and performance differed depending on gender.
Raters often have their own goals or biases that affect performance ratings (Cleveland &
Murphy, 1992) and may view the performance of the personality types differently depending on
the gender of the individual. In addition, men and women have different social norms that affect
the expressions of personality, even within the same personality class. Moreover, the distribution

50
of the personality types differed by gender in this study (see Table 2). For example, 47 percent of
men belonged to the O Class class compared to 19 percent of women. This class has the highest
percentage of men and the lowest percentage of women compared to the other classes.
Furthermore, since performance is an evaluation of effective behaviors (Motowidlo, 2003),
differences in performance findings by gender could indicate differences in the expression of
personality traits.
Interpersonal performance. After adding in gender as a grouping variable, the
relationship between interpersonal performance with customers and class membership became
significant for males. There were no significant pairwise comparisons for females, indicating all
groups performed similarly in interpersonal interactions. However, the male O Class was found
to be better interpersonal performers than the male CEs Class. Furthermore, the odds ratios
trended such that the O Class was the highest rated male interpersonal performers. This class of
individuals is characterized by being high on openness to experience and low on
conscientiousness. This combination supports the idea that some people are less likely to follow
rules while also being likely to explore new ideas and directions (Barrick et al., 2001; Griffin &
Hesketh, 2004). In addition, for communication performance, the male O Class was again found
to be significantly better performers than the male CEs Class. The trend towards the male O
Class being the highest rated male communication performers also existed in the odds ratios as it
did with interpersonal performance.
Thus, it seems that being high on openness to experience combined with being low on
conscientiousness is ideal for men on interpersonal performance (including communication
components) in customer service jobs. This is an interesting finding given that openness to
experience is the Big 5 variable that has been found to have the lowest relationships with
51
performance in numerous studies and meta-analyses (e.g. Barrick et al., 2001). However, as
stated previously, openness may be relevant in certain situations (Griffin & Hesketh, 2004), and
the customer service setting for men may be one of those situations. Jobs and occupations are
gendered and service jobs are often defined as needing stereotypically female characteristics in
the employees (Hall, 1993; Berheide, 1988). Service jobs are less congruent with male gender
roles (Hall, 1993). In order to perform well in a service job, men need to be willing to bend their
gender roles and not conform to societal norms. For example, in a restaurant setting, men as
waiters need to learn to be subservient to customers, which counters their societal norm of
dominance (Mars & Nicod, 1984). Those that are high in openness to experience seek out
unconventional experiences (LePine et al., 2000) and are less likely to conform to norms (Griffin
& Hesketh, 2004). The male O Class may be less likely to stick to their prescribed gender roles
and more likely to behave unconventionally, and thus more effectively, in customer service jobs.
Furthermore, after adding in gender as a grouping variable, the relationship between
communication performance and class membership became non-significant. However, a number
of pairwise comparisons had confidence intervals that did not include zero, indicating significant
differences. As discussed above, males belonging to the O Class were better communication
performers than men in the CEs Class class. In addition, females that belonged to the E Class
class were worse communication performers than females in the O Class class. Furthermore, the
female O Class, the CEs Class, and the A Class did not differ significantly in their
communication performance, indicating that the E Class were the worst female communicators.
The E Class would be dominant, talkative, and unfriendly. Not only is this incongruent to female
stereotypes (e.g. Hall, 1993), but one can imagine that this group would be difficult to
communicate with.

52
In conclusion, personality affects interpersonal performance differently depending on
gender. More specifically, it seems that – among currently employed service personnel –
personality is more predictive and important for differentiating higher and lower interpersonally
performing males compared with females. The results suggest that customer service
organizations would benefit from male employees that are a combination of high openness to
experience and low conscientiousness to be effective interpersonal performers and
communicators. However, for women, the E Class should be avoided.
Task performance. Task performance remained a significant predictor of class
membership even after including gender as a grouping variable. For women, the results
continued to somewhat support Hypothesis 2, where a class characterized by high
conscientiousness and high emotional stability would be effective task performers. The poorest
performers remained the A Class. However, the trend for the CEs Class being the highest
performers was not as strong when including gender. Not only were the CEs Class better task
performers than the A Class but so was the E Class. Their odds ratios were very similar (1.328
and 1.362 respectively; see Table 7). The results seem to indicate that the A Class is the class to
avoid for women rather than a different class being the one to choose. Intuitively this makes
sense in regards to task performance. As stated previously, those high on agreeableness tend to
help others, which can be detrimental to their task performance (Bergeron, 2007). The results
support this idea since those high on agreeableness were the lowest female task performers. In
addition, combining introversion with high agreeableness can be particularly detrimental to task
performance. Not only are these individuals willing to help others, they are also less dominant
due to their low extraversion and potentially more likely to have their kindness taken advantage

53
of. Thus, for effective task performers, customer service organizations should not hire women
with personality combinations of high agreeableness and low extraversion.
For men, the results for task performance somewhat mirrored what was found for both
types of interpersonal performance. The male O Class was significantly better task performers
than the male A Class. In addition, the male O Class trended towards being the highest task
performers, based on the odds ratios. Again, this finding is counterintuitive since openness to
experience has not been strongly linked to performance, especially task performance (Barrick et
al., 2001; LePine et al., 2000; Griffin & Hesketh, 2004). I argue, however, that since tasks
associated with customer service jobs (i.e. serving others, finding products for customers) are
also highly gendered, the same arguments can apply for task performance as for interpersonal
performance. Men high on openness to experience may be more likely to be unconventional and
open to untraditional work and experiences and less likely to conform to strict gender roles.
Furthermore, good performance also depends on the raters’ response to the employees’
behaviors. Thus raters may perceive the behaviors of these untraditional men differently than the
other classes, leading to the higher ratings of task performance.
In conclusion, according to the results of this study, identifying effective personality
types in a customer service organization depends on gender. Men should be high on openness to
experience and low on conscientiousness to be effective at all customer service performance –
task and interpersonal. However, for women, the results indicate that most personality types
should be effective at customer service performance, except for those with a combination of high
extraversion and low agreeableness or high agreeableness and low extraversion. This study
provided evidence that personality and gender affect customer service performance. However,
the gender results should not be used in a practical setting. This study is a basis for further

54
research on using this methodology in selection procedures but not enough is yet know for it to
be used simply based on this study.
Regression Comparisons
Since this study used a novel, person-focused statistical approach, it was important to
make some important comparisons to explore the effectiveness and benefits of this method.
Given that latent class analysis is a more complex analysis than regression and is infrequently
used in the field, regression analyses were conducted to compare results and ensure LCA adds
value.
The regression results indicated that personality traits did not predict performance. This is
counter to most previous research (e.g. Barrick et al., 2001), however, this study differed given
that personality was measured by asking individuals to choose adjectives that described them at
work rather than global personality as it is typically measured. Also, context-specific items are
less open for interpretation by participants in comparison to general, global personality measures.
Thus, the results between the different types of measures should differ. Some researchers
theorize that personality is conditional upon the situation (Bing et al., 2004; Wright & Mischel,
1987) and thus context-specific personality items should be more predictive of context-specific
outcomes. However, this study found that using traditional analyses, the context-specific
personality items are less predictive of performance.
More importantly though these regression results differed from the LCA results found in
this study. Combining personality variables in a person-oriented approach provided more
information in predicting performance than the typical regression. Researchers that have called
for combining personality traits predicted that these combinations would predict performance
more strongly than looking at traits individually (e.g. Barrick & Mount, 2005) as was found in

55
this study. Though rarely used in I/O psychology (Craig & Smith, 2000; Sinclair et al., 2005), a
person-focused approach is more appropriate than a variable-focused approach, since
organizations are made up of people and not variables. Organizations are not selecting traits, they
are selecting people that are characterized by numerous personality traits that work together to
determine behavior, thought, and feeling (Ones et al., 2005).
Comparisons between different groups of people were possible using LCA that are not
possible in regression, allowing for an understanding of more complex relationships between
personality types and performance. The comparison of classes on performance allowed the
results to suggest not only the best class of individuals with the optimal combination of
personality traits but also to identify what types of individuals were worse than others. In some
cases multiple classes were identified as not differing in their performance. For example, for
women, both a class of individuals high on conscientiousness (CEs Class) and a class low on
conscientiousness (O Class) did not vary significantly on interpersonal performance with
customers. This comparison highlights the importance of personality combinations and person-
focused analyses. When looking at traits individually, conscientiousness has been found to
highly predict overall performance. If using the most recent research, organizations would be
advised to select individuals moderate on conscientiousness due to the curvilinear relationship
with performance (Le et al., 2010). However, given this study’s findings, being low and high on
conscientiousness could be preferred depending on the other traits present in the individual. The
results gathered using LCA compared to regression is much more detailed and can capture
interesting findings that would not be possible in more traditional analyses.

56
Revisiting the Personality Trait-Based Interactionist Model
The Trait-Based Interactionist Model argues that personality traits are expressed as
responses to trait-relevant situational cues through trait activation (Tett & Guterman, 2000).
However, this does not account for personality in its true form, where traits are combined within
individuals. In addition, several trait-relevant situational cues can be occurring at once, such as in
customer service jobs where the job requires both interpersonal and task activities. Given the
findings of this study support the use of personality combinations, it is argued that this model is
too simplistic and breaks down when looking at individuals as a whole. Many questions remain
unanswered when looking at this model through the lens of personality combinations. For
example, what happens when multiple traits are cued in a situation that calls for both
agreeableness and conscientiousness? This model needs to be extended to understand how
multiple traits interplay and activate depending on the multiple situational cues that are
experienced in every job. In addition to other relevant future research needed (as described
below), the author calls for a re-visitation of this model when more is understood about
personality combinations.
Limitations and Future Research
This study provided evidence in using a person-focused approach to personality, resulting
in possible recommendations for selection for customer service jobs to maximize performance.
However, there are several limitations and opportunities for further research to continue
expanding our knowledge of new methods in selection, customer service performance, and
personality combined in a person-focused approach.
First, latent class analysis is a methodology that reduces data, similar to factor analysis.
Even though the data is reduced in a parsimonious way, it is unclear how much variance is lost in

57
this methodology creating some cause for concern that the methodology is limited in explaining
individual variance.
In addition, there were a number of issues surrounding the personality items used in this
study. The items were developed by an external consulting firm and have yet to be validated. In
addition, using forced choice items limits the ability to conduct reliability analyses (Hicks, 1970,
Johnson et al., 1988; Tenopyr, 1988; Meade, 2004; Vasilopoulos et al., 2006). Furthermore, the
inconsistent pairings of adjectives did not allow for IRT (Brown & Maydeu-Olivares, 2011),
which could have aided in the confidence in the reliability of the items. However, the items did
match identically to previously validated Big 5 items used in other research (e.g. John, 1989;
Johnson & Ostendorf, 1993; Hofstee, de Raad, & Goldberg, 1992). Moreover, the personality
items used were work-specific rather than global personality items. These should be more
predictive of context-specific performance (e.g. Bing et al., 2004) but were not predictive at all
in the regression analyses, counter to previous research. Given the limited certainty about the
personality items used in this study, future research should attempt to replicate the latent class
structure using different personality scales, preferably using one that is validated and frequently
used, such as the NEO Personality Inventory (Costa & McCrae, 1992).
In addition to replicating the latent class structure using different personality scales,
future research should also look to replicate the structure using different samples. This study was
limited in using participants that were already selected for the job and most were tenured at least
a year. These individuals may already be higher performers than the general population and
different from the pool of those that the organizations will be selecting from. However, there was
good variability in the performance ratings, including some ratings at the lowest level. In
addition, rater training was provided to the supervisors possibly allowing for more accuracy.

58
Regardless, these participants were most likely different than a population of job applicants, for
example, simply because they were selected. Thus, future research should look at the latent class
structures of different samples, such as applicant pools. This would identify any latent classes
that may exist in the broader population that should be selected for or against that was not
identified within this sample. Also, examining different occupational samples, including other
types of customer service jobs with higher complexity or relationship-based encounters, could
provide more information about personality combinations. It is possible that individuals within
other occupations would have different latent class structures. Previous research on personality
and performance indicate that traits differ in their prediction of performance depending on the
type of performance (Barrick et al., 2001). For example, extraversion and agreeableness tend to
be related to interpersonal performance more than task performance (Barrick & Mount, 2005;
LePine & Van Dyne, 2001). This study also showed that different personality combinations were
effective for the different types of performance. Thus, it is reasonable to assume that
performance in different types of jobs may require different personality combinations than
customer service jobs. Furthermore, researchers could also investigate the personality typologies
that exist within the general population, as challenging as that may be. If a limited number of
classes are found to exist within the general population, they can be used to inform selection
practices in general, not just focused on specific occupations.
Interestingly, there has also been limited research on the relationship between openness
to experience and gender roles. This study found that men who were high on openness to
experience and low on conscientiousness were high performers – both task and interpersonal – in
highly gendered customer service jobs. It is suggested that due to the unconventional and
untraditional qualities of an individual high on openness, the individual may be less likely to
59
abide by gender norms and roles. However, this suggestion needs further evidence to substantiate
its claims.
Conclusions
In conclusion, this study answered questions in regards to describing customer service
samples and predicting customer service performance, based on personality combinations. This
study is a first step in moving towards the development of a new and innovative selection
system. Importantly, this study also provided strong evidence in favor of the use of a person-
focused approach in combining personality traits to predict performance when compared to the
variable-focused regression. Latent class analysis provided insight that would have otherwise
been missed if simply using regression. This study provides some good preliminary evidence in
the use of latent class structures and person-focused analyses, however, there is still much to be
done, such as replicating and validating these results.
60
References
Agresti, A. (2007). An introduction to categorical data analysis. New York, NY: Wiley.
Barrick, M.R., & Mount, M.K. (2005). Yes, personality matters: moving on to more important
matters. Human Performance, 18(4), 359-372.
Barrick, M.R., Mount, M.K., & Judge, T.A. (2001). The FFM personality dimensions and job
performance: Meta-analysis of meta-analyses [Special issue]. International Journal of
Selection and Assessment, 9, 9-30.
Barrick, M.R., Parks, L., & Mount, M.K. (2005). Self-monitoring as a moderator of the
relationships between personality traits and performance. Personnel Psychology, 58, 745-
767.
Bergeron, D.M. (2007). The potential paradox of organizational citizenship behavior: Good
citizens at what cost? Academy of Management Review, 32(4), 1078-1095.
Berheide, C. (1988). Women in sales and service occupations. In A. Stromberg & S. Harkess
(Eds.), Women working: Theories and facts in perspective (pp. 241-257). Mountain
View, CA: Mayfield.
Bettencourt, L.A., & Brown S.W. (1997). Contact employees: Relationships among workplace
fairness, job satisfaction and prosocial service behaviors. Journal of Retailing, 73(1), 39-
61.
Biernat, M., & Kobrynowicz, D. (1997). Gender and race-based standards of competence: Lower
minimum standards but higher ability standards for devalued groups. Journal of
Personality and Social Psychology, 72, 544-557.
Bing, M.N., Whanger, J.C., Davison, H.K. & VanHook, J.B. (2004). Incremental validity of the

61
frame-of-reference effect in personality scale scores: A replication and extension. Journal
of Applied Psychology, 89(1), 150-157.
Borman, W.C., Ilgen, D.R., & Klimoski, R.J. (2003). Stability and change in industrial and
organizational psychology. In W.C. Borman, D.R. Ilgen, & R.J. Klimoski (Eds.),
Handbook of Psychology: Industrial and Organizational Psychology (Vol. 12, pp. 1-20).
Hoboken, NJ: John Wiley & Sons Inc.
Borman, W.C., & Motowidlo, S.J. (1993). Expanding the criterion domain to include elements of
contextual performance. In N. Schmitt & W.C. Borman (Eds.), Personnel selection in
organizations (pp. 71-98). San Francisco: Jossey-Bass.
Bowen, D.E., & Waldman, D.A. (1999). Customer-driven employee performance. In D.A. Ilgen
& E.D. Pulakos (Eds.), The changing nature of performance, (pp. 154-191). San
Francisco: Jossey-Bass.
Brown, A., & Maydeu-Olivares, A. (2011). Item response modeling of forced-choice
questionnaires. Educational and Psychological Measurement, 71(3), 460-502.
Brown, T.J., Mowen, J.C., Donavan, D.T., & Licata, J.W. (2002). The customer orientation of
service workers: Personality trait effects on self- and supervisor performance ratings.
Journal of Marketing Research, 39, 110-119.
Campbell, J.P. (1990). Modeling the performance prediction problem in industrial and
organizational psychology. In M.D. Dunnette & L.M. Hough (Eds.), Handbook of
Industrial and Organizational Psychology (Vol. 1, 2nd
ed., pp. 687-732). Palo Alto, CA:
Consulting Psychologists Press.
Chi, N.W., Grandey, A.A., Diamond, J.A., & Krimmel, K.R. (in press). Want a tip? Service

62
performance as a function of emotion regulation and extraversion. Journal of Applied
Psychology.
Cleveland, J.N. & Murphy, K.R. (1992). Analyzing performance appraisal as goal-directed
behavior. In G. Ferris & K. Rowland (Eds.), Research in personnel and human resources
management, (Vol. 10, pp. 121-185). Greenwich, CT: JAI Press.
Collins, L.M., & Lanza, S.T. (2010). Latent class and latent transition analysis for applications in
the social, behavioral, and health sciences. Hoboken, NJ: John Wiley & Sons, Inc.
Conte, J.M., & Gintoft, J.N. (2005). Polychronicity, big five personality dimensions, and sales
performance. Human Performance, 18(4), 427-444.
Costa, P.T., Jr., & McCrae, R.R. (1992). Four ways five factors are basic. Personality and
Individual Differences, 13, 653-665.
Craig, S.B., & Smith, J.A. (2000). Integrity and personality: A person-oriented
investigation. Paper presented at the 15th
Annual Conference for the Society for Industrial
and Organizational Psychology, New Orleans, LA.
DeFruyt, F., & Mervielde, I. (1999). RIASEC types and Big Five traits as predictors of
employment status and nature of employment. Personnel Psychology, 52, 701-727.
Eagly, A.H., Makhijani, M.G., & Klonsky, B.G. (1992). Gender and the evalution of leaders: A
meta-analysis. Psychological Bulletin, 111, 3-22.
Frei, R.L., & McDaniel, M.A. (1998). Validity of customer service measures in personnel
selection: A review of criterion and construct evidence. Human Performance, 11(1), 1-
27.
Goldberg, L.R. (1990). An alternative “description of personality”: The Big-Five factor structure.
Journal of Personality and Social Psychology, 59, 1216-1229.
63
Griffin, B. & Hesketh, B. (2004). Why openness to experience is not a good predictor of job
performance. International Journal of Selection and Assessment, 12(3), 243-251.
Guion, R.M. (1998). Assessment, measurement, and prediction for personnel decisions.
Mahwah, NJ: Lawrence Erlbaum Associates.
Hall, E.J. (1993). Smiling, deferring, and flirting: Doing gender by giving “good service”. Work
and Occupations, 20(4), 452-471.
Hekman, D.R., Aquino, K., Owens, B.P., Mitchell, T.R., Schilpzand, P., & Leavitt, K. (2010).
An examination of whether and how racial and gender biases influence customer
satisfaction. Academy of Management Journal, 53(2), 238-264.
Hicks, L.E. (1970). Some properties of ipsative, normative, and forced-choice normative
measures. Psychological Bulletin, 74, 167-184.
Hofstee, W.K., de Raad, B., & Goldberg, L.R. (1992). Integration of the big five and
circumplex approaches to trait structure. Journal of Personality and Social Psychology,
63(1), 146-163.
Hogan, J.C., Hogan, R., & Busch, C.M. (1984). How to measure service orientation. Journal of
Applied Psychology, 69, 167-173.
Hogan, J., & Holland, B. (2003). Using theory to evaluate personality and job-performance
relations: A socioanalytic perspective. Journal of Applied Psychology, 88, 100-112.
Hough, L.M. (2003). Emerging trends and needs in personality research and practice
beyond main effects. In M.B. Barrick & A.M. Ryan (Eds.), Personality and work:
Reconsidering the role of personality in organizations (pp. 289-325). San Francisco, CA:
Jossey-Bass.
Hough, L.M., & Furnham, A. (2003). Use of personality variables in work settings. In W.C.

64
Borman, D.R. Ilgen, & R.J. Klimoski (Eds.), Handbook of Psychology: Industrial and
Organizational Psychology (Vol. 12, pp. 377-397). Hoboken, NJ: John Wiley & Sons
Inc.
Hough, L.M., & Ones, D.S. (2001). The structure, measurement, validity, and use of
personality variables in industrial, work, and organizational psychology. In N. Anderson,
D.S. Ones, H.K. Sinangil, & C. Viswesvaran (Eds.), Handbook of industrial, work, and
organizational psychology (pp. 233-277). London: Sage.
Hurtz, G.M., & Donovan, J.J. (2000). Personality and job performance: The big five revisited.
Journal of Applied Psychology, 85(6), 869-879.
Jackson, D.N., Wroblewski, V.R., & Ashton, M.C. (2000). The impact of faking on employment
tests: Does forced choice offer a solution? Human Performance, 13(4), 371-388.
John, O.P. (1989). Towards a taxonomy of personality descriptors. In D.M. Buss & N.
Cantor (Eds.), Personality Psychology: Recent Trends and Emerging Directions (pp.
261-271). New York, NY: Springer-Verlag Publishing.
Johnson, C.E., Wood, R., & Blinkhorn, S.F. (1988). Spuriouser and spuriouser: The use of
ipsative personality tests. Journal of Occupational Psychology, 61, 153-62.
Johnson, J.A. & Ostendorf, F. (1993). Clarification of the five-factor model with the
abridged big five dimensional circumplex. Journal of Personality and Social Psychology,
65(3), 563-576.
Katz, D., & Kahn, R.L. (1978). The social psychology of organizations. New York: Wiley.
Landy, F.J. (2005). Some historical and scientific issues related to research on emotional
intelligence. Journal of Organizational Behavior, 26, 411-424.
Lanza, S.T., Collins, L.M., Lemmon, D.R., & Schafer, J.L. (2007). PROC LCA: A SAS

65
procedure for latent class analysis. Structural Equation Modeling, 14(4), 671-694.
Lanza, S. T., Dziak, J. J., Huang, L., Xu, S., & Collins, L. M. (2011). PROC LCA & PROC LTA
user’s guide (Version 1.2.7). University Park: The Methodology Center, Penn State.
Retrieved from http://methodology.psu.edu.
Le, H., Oh, I., Robbins, S.B., Illies, R., Holland, E., & Westrick, P. (2011). Too much of a good
thing: Curvilinear relationships between personality traits and job performance. Journal
of Applied Psychology, 96(1), 113-133.
LePine, J.A., Colquitt, J.A., & Erez, A. Adaptability to changing task contexts: Effects of general
cognitive ability, conscientiousness, and openness to experience. Personnel Psychology,
53, 563-593.
LePine, J.A., & Van Dyne, L. (2001). Voice and cooperative behavior as contrasting forms of
contextual performance: Evidence of differential relationships with Big Five personality
characteristics and cognitive ability. Journal of Applied Psychology, 86(2), 326-336.
Levy, P. & Williams, J.R. (2004). The social context of performance: A review and framework
for the future. Journal of Management, 30, 881-905.
Liao, H., & Chuang, A. (2004). A multilevel investigation of factors influencing employee
service performance and customer outcomes. Academy of Management Journal, 47(1),
41-58.
Mars, G. & Nicod, M. (1984). The world of waiters. Boston: George Allen Unwin.
McHenry, J.J., Hough, L.M., Toquam, J.L., Hanson, M.A., & Ashworth, S. (1990). Project A
validity results: The relationship between predictor and criterion domains. Personnel
Psychology, 43, 335-354.
Meade, A. (2004). Psychometric problems and issues involved with creating and using ipsative
66
measures for selection. Journal of Occupational and Organisational Psychology, 77,
531-552.
Motowidlo, S.J. (2003). Job Performance. In W.C. Borman, D.R. Ilgen, & R.J. Klimoski (Eds.),
Handbook of Psychology: Industrial and Organizational Psychology (Vol. 12, pp. 377-
397). Hoboken, NJ: John Wiley & Sons Inc.
Motowidlo, S.J., Brownlee, A.L., & Schmit, M.J. (2008). Effects of personality characteristics on
knowledge, skill, and performance in servicing retail customers. International Journal of
Selection and Assessment, 16(3), 272-281.
Mount, M.K., Barrick, M.R., & Stewart, G.L. (1998). Five-factor model of personality and
performance in jobs involving interpersonal interactions. Human Performance, 11(2/3),
145-165.
Nettle, D. (2006). The evolution of personality variation in humans and other animals. American
Psychologist, 61, 622-631.
O’Connor, M.C., & Puanonen, S.V. (2007). Big Five personality predictors of post-secondary
academic performance. Personality and Individual Differences, 43, 971-990.
Ones, D.S., Viswesvaran, C., & Dilchert, S. (2005). Personality at work: Raising awareness and
correcting misconceptions. Human Performance, 18(4), 389-404.
Organ, D.W., & Ryan, K. (1995). A meta-analytic review of attitudinal and dispositional
predictors of organizational citizenship behavior. Personnel Psychology, 48, 775-802.
Oswald, F., Campbell, J., McCloy, R., Rivkin, D., & Lewis, P. (1999). Stratifying occupational
units by specific vocational preparation. Raleigh, NC: National Center for O*NET
Development.
Parasuraman, A., Zeithaml, V.A., & Berry, L.L. (1998). SERVQUAL: A multiple-item scale for

67
measuring consumer perceptions of service quality. Journal of Retailing, 64(1), 12-40.
Puanonen, S.V., & Ashton, M.C. (2001). Big Five factors and facets and the prediction of
behavior. Journal of Personality and Social Psychology, 81, 524-539.
PROC LCA & PROC LTA (Version 1.2.7) [Software]. (2011). University Park: The
Methodology Center, Penn State. Retrieved from http://methodology.psu.edu
Robertson, I., & Callinan, M. (1998). Personality and work behavior. European Journal of Work
and Organizational Psychology, 7(3), 321-340.
Ryan, A.M., & Ployhart, R.E. (2003). Customer service behavior. In W.C. Borman, D.R. Ilgen,
& R.J. Klimoski (Eds.), Handbook of Psychology: Industrial and Organizational
Psychology (Vol. 12, pp. 377-397). Hoboken, NJ: John Wiley & Sons Inc.
Sackett, P.R., Schmitt, N., Ellingson, J.E., & Kabin, M.B. (2001). High-stakes testing in
employment, credentialing, and higher education: Prospects in a post-affirmative action
world. American Psychologist, 56, 302-318.
Saville, P. & Wilson, E. (1991). The reliability and validity of normative and ipsative approaches
in the measurement of personality. Journal of Occupational Psychology, 64, 219-238.
Schneider, B. & Schechter, D. (1991). Development of a personnel selection system for service
jobs. In S.W. Brown, S. Gummesson, B. Edvardsson, B. Gustavsson, (Eds), Service
Quality: Multidisciplinary and Multinational Perspectives, (pp. 217-236). New York,
NY: Lexington Books.
Sinclair, R.R., Tucker, J.S., Cullen, J.C., & Wright, C. (2005). Performance differences among
four organizational commitment profiles. Journal of Applied Psychology, 90(6), 1280-
1287.
Stewart, G.L., & Carson, K.P. (1995). Personality dimensions and domains of service

68
performance: A field investigation. Journal of Business and Psychology, 9, 365-378.
Tenopyr, M.L. (1988). Artifactual reliability of forced-choice technique. Psychological Bulletin,
48, 62-70.
Tett, R.P., & Burnett, D.D. (2003). Personality trait-based interactionist model of job
performance. Journal of Applied Psychology, 88(3), 500-517.
Tett, R.P., & Guterman, H.A. (2000). Situation trait relevance, trait expression, and cross-
situational consistency: Testing a principle of trait activation. Journal of Research in
Personality, 34, 397-423.
Vasilopoulos, N.L., Cucina, J.M., Dyomina, N.V., & Morewitz, C.L. (2006). Forced-choice
personality tests: A measure of personality and cognitive ability? Human Performance,
19(3), 175-199.
Witt, L.A., Burke, L.A., Barrick, M.R., & Mount, M.K. (2002). The interactive effects of
conscientiousness and agreeableness on job performance. Journal of Applied Psychology,
87(1), 164-169.
Wright, J.C., & Mischel, W. (1987). A conditional approach to dispositional constructs: The
local predictability of social behavior. Journal of Personality and Social Psychology, 53,
1159-1177.
Yarkin, K.L., Town, J.P., & Wallston, B.S. (1982). Blacks and women must try harder: Stimulus
person’s race and sex attributions of causality. Personality and Social Psychology
Bulletin, 8, 21-24.

Vita
Patricia Grabarek
Ph.D. Industrial/Organizational Psychology, 2011
The Pennsylvania State University
Dissertation: Personality Typologies as Predictors of Effective Performance in
Customer Service Jobs
M.S. Industrial/Organizational Psychology, 2009
The Pennsylvania State University
Thesis: Understanding Smile School: Emotional Labor Training Occurrence and
Consequences
B.A. Psychology, 2007
University of California, Los Angeles
APPLIED EXPERIENCE
Consultant, Federal Management Partners, December 2010 – Present.
Intern, Federal Management Partners, August 2010 – November 2010.
Director, Schreyer Honors College Leadership Assessment Center, May 2009 – August 2010.
SELECTED PUBLICATIONS AND PRESENTATIONS
Grandey, A.A., Grabarek, P.E., & Teague, S. (In press). Negative relational
exchanges of customers and employees: Performance and well-being implications. Eby,
L.T. & Allen, T.D. (Ed.) Relationships at Work: Frontiers in IO Psychology Series, San
Francisco, CA: Jossey-Bass.
Jacobs, R.R., Cushenbery, L., & Grabarek, P.E., (2011). Assessments for
selection and promotion of police officers. Kitaeff, J. (Ed.) Handbook of Police
Psychology.
Grabarek, P.E. & Grandey, A.A. (2010). Understanding smile school: Emotional labor
training occurrence and consequences. Symposium (co-chair), SIOP 2010.
Grabarek, P.E. (January 2010). Practicing science: The Penn State Assessment Center.
The Industrial-Organizational Psychologist 47(3).
http://www.siop.org/tip/jan10/17tiptopics.aspx
Grandey, A.A., Diefendorff, J.M., Grabarek, P.E., & Diamond, J.A. (2009). Emotional
display as job requirement: Differences across targets and performance. Symposium,
SIOP 2009.