Embed Size (px)
Citation preview
Personality Scale Validities Increase Throughout Medical School
Filip LievensGhent University
Deniz S. OnesUniversity of Minnesota
Stephan DilchertBaruch College, CUNY
Admissions and personnel decisions rely on stable predictor–criterion relationships. The authors studiedthe validity of Big Five personality factors and their facets for predicting academic performance inmedical school across multiple years, investigating whether criterion-related validities change over time.In this longitudinal investigation, an entire European country’s 1997 cohort of medical students wasstudied throughout their medical school career (Year 1, N � 627; Year 7, N � 306). Over time,extraversion, openness, and conscientiousness factor and facet scale scores showed increases in opera-tional validity for predicting grade point averages. Although there may not be any advantages to beingopen and extraverted for early academic performance, these traits gain importance for later academicperformance when applied practice increasingly plays a part in the curriculum. Conscientiousness,perhaps more than any other personality trait, appears to be an increasing asset for medical students:Operational validities of conscientiousness increased from .18 to .45. In assessing the utility of person-ality measures, relying on early criteria might underestimate the predictive value of personality variables.Implications for personality measures to predict work performance are discussed.
Keywords: personality validity, longitudinal validation, grades, medical school, professional education
Humphreys (1960) stated five decades ago that “in selectionresearch one should not be satisfied with validation of predictorsagainst the earliest possible criteria” (p. 318). Selection and ad-missions decisions in organizations rely on stable relationshipsbetween predictors and criteria. That is, it is assumed that perfor-mance differences between those high and low on various predic-tor constructs remain relatively stable across the years and thatpredictor–criterion relationships are of similar strength for indi-viduals of differing tenure. Potential changes in validity coeffi-cients have an impact on the expected utility of selection systems.In personnel selection as well as academic admissions, althoughwe aim to predict criteria of interest (typically performance) overa relatively long duration, the time spans over which criteria aregathered for validation studies most often reflect practical consid-erations (Sussmann & Robertson, 1986). In predictive studies, thetime periods selected for gathering criterion data rarely exceed
a year or two—in most cases they are merely a few months. Inconcurrent studies, criterion scores are often obtained from bothnewly selected individuals and individuals of varying tenurelevels.
Even though there exists a large literature on cognitive abilitytests that is directed at whether such tests retain their predictivevalue in the long run (Barrett, Phillips, & Alexander, 1981; Camp-bell & Knapp, 2001; Deadrick & Madigan, 1990; F. L. Schmidt,Hunter, Outerbridge, & Goff, 1988), few studies have focused onthe long-term predictive validity of noncognitive predictors suchas experience, interests, biographical data, assessment center di-mension ratings, or personality variables.
In the personality domain, two studies that have examined therelationships between personality and long-term success have fo-cused on income and occupational status (Dodd, Wollowick, &McNamara, 1970; Judge, Higgins, Thoresen, & Barrick, 1999).These studies are extremely valuable in demonstrating the useful-ness of personality for predicting long-term career success, but bydesign, their relevance for understanding the validity and utility ofpersonality for predicting performance within a given setting (or-ganizational or educational) is limited. To our knowledge, researchthat has examined the stability of criterion-related validities ofpersonality scales for predicting performance over longer timeframes is nonexistent. As will be detailed below, such long-termvalidation of the stability of personality validities is of key con-ceptual and practical importance because it would enable theory-driven tests of personality–performance relationships.
The primary objective of this research was to examine thevalidities of the Big Five personality dimensions (neuroticism,extraversion, openness, agreeableness, and conscientiousness) andtheir facets longitudinally. We studied the validity of Big Five
Filip Lievens, Department of Personnel Management and Work andOrganizational Psychology, Ghent University, Ghent, Belgium; Deniz S.Ones, Department of Psychology, University of Minnesota; StephanDilchert, Department of Management, Zicklin School of Business, BaruchCollege, City University of New York.
Order of authorship is arbitrary; all authors contributed equally to thisarticle.
Portions of this research were presented at the annual conference of theSociety for Industrial and Organizational Psychology, Los Angeles, CA,April 2005, and the International Symposium on Personality at Work,Luneburg, Germany, May 2005.
Correspondence concerning this article should be addressed to Deniz S.Ones, Department of Psychology, University of Minnesota, 75 East RiverRoad, Minneapolis, MN 55455. E-mail: [email protected]
Journal of Applied Psychology © 2009 American Psychological Association2009, Vol. 94, No. 6, 1514–1535 0021-9010/09/$12.00 DOI: 10.1037/a0016137
1514
personality factors and their facets for academic performance in allFlemish medical schools across multiple years, investigatingwhether criterion-related validities change across the entire span ofthe curriculum. We also explored personality differences betweenthose who leave medical school and those who stay to graduate.Specifically, we examined whether personality determinants ofattrition are different early compared with late in medical school.Predicting individuals’ success in medical school is of primeimportance for two reasons. First, medical education is expensive,and therefore, better selection and admission decisions can helpminimize educational costs by decreasing the proportion of drop-outs. Second, medical education is professional training to acquireknowledge and skills that will enable individuals to perform theirjob. These skills are potentially relied upon for careers spanningseveral decades. Which personality traits predict persistencethroughout the various stages of professional education is thusanother important question.
Theoretical Background
Research on Longitudinal Changes in Criteria
Although until now the issue of longitudinal validity remainedunexamined for personality measures, there is a large literaturedirected at examining whether cognitive variables retain theirpredictive value over time. This literature is closely linked to theliterature on dynamic criteria. The concept of dynamic criteria firstproposed by Ghiselli (1956) refers to “changes in the rank-ordering of individuals in their performance over time” (Barrett,Caldwell, & Alexander, 1985, p. 51) and has been examined inboth the educational and work psychology literatures. Humphreys(1960) noted that past behavior is less than perfectly correlatedwith future behavior and that the “further apart the measures are inthe series the lower will be the correlation between them” (p. 315).This observation builds on Guttman’s (1955) description of asimplex pattern of correlations.
For longitudinal changes in predictor validity, two primaryexplanations have been proposed: Either individuals change overtime (which would mean that their behavior would change toreflect this change), or the tasks and work being performed change(Alvares & Hulin, 1972). Of these explanations, the changingability/person explanation has now been largely rejected based onavailable data. Postdictive validities appear to follow the samepatterns of changes as predictive validities (Humphreys & Taber,1973; Lunneborg & Lunneborg, 1970). As Humphreys and Taber(1973) put it, “The hypothesis that reduced predictive validitiesand instability of grades is due to change in the broad abilities . . .must be rejected” (p. 181). Similar arguments of stability can bemade for personality traits that conceptually reflect stable individ-ual differences. Recent meta-analytic evidence (Fraley & Roberts,2005; Roberts & DelVecchio, 2000) suggests that rank-order sta-bility is remarkably high (Caspi, Roberts, & Shiner, 2005).
Changes in job or task requirements are likely at the root of“changing patterns of job demands” (Barrett et al., 1985, p. 42),with many authors explaining declines in relationships betweenincreasingly distal criteria with changing tasks and activities (e.g.,Alvares & Hulin, 1972; Dunham, 1974; Ghiselli & Haire, 1960;Woodrow, 1938). For academic performance, Humphreys (1960)concluded that “as a matter of fact the subjects would not need to
change at all if changes in course content were sufficiently sys-tematic. A gradual shift in emphasis from verbal to quantitativematerials, for example, would produce a matrix resembling asimplex” (p. 320). Several variants of the changing tasks modelhave also been incorporated into more recent theories of skillacquisition in the cognitive domain (e.g., Ackerman, 1987). Thisliterature suggests that the temporal stability of predictor–criterionrelationships for cognitive variables differs across types of abilities(general mental ability, psychomotor ability, perceptual ability),settings (educational, work), and types of work (consistent/inconsistent task performance, academic performance, job perfor-mance; Keil & Cortina, 2001).
Changes in tasks and work in general can mean that perfor-mance requirements may change (Jenkins, 1946) or that the rela-tive importance of performance predictors may vary over time(Deadrick & Madigan, 1990). No investigations on this matterexist for the domain of personality, even though there are concep-tual and empirical lines of reasoning that lead us to expect mostpersonality scale validities would increase over time.
There are two main conceptual arguments to support the hy-pothesis that in predicting performance, validities for personalityvariables would generally increase over time. First, during initialstages of tenure in a new environment, the “novelty and challengeof the task or job” (Helmreich, Sawin, & Carsrud, 1986, p. 185)tend to reduce naturally occurring motivational differences amongindividuals. Thus, during the honeymoon phase, personality traitssuch as achievement orientation, for example, are likely to playless of a role in predicting performance. However, in the long run,honeymoon effects might wear off and motivationally based per-sonality characteristics could therefore show greater predictivevalidities (Helmreich et al., 1986). This first conceptual argumentcan be complementarily framed in terms of trait activation theory(Lievens, Chasteen, Day, & Christiansen, 2006; Tett & Burnett,2003). From a trait activation point of view, the change in thecriterion with the increasing emphasis on different behavioralrequirements suggests changing performance demands for the ex-pression of various traits over time. That is, the changing demandsof the performance situation are likely to influence personality–performance linkages. In the honeymoon stage, the performancedemands might also be strong such that full expression of behav-iors are constrained, masking the driving force of underlyingpersonality traits. Conversely, when the honeymoon effects wearoff and performance demands become weaker or shift into differ-ent behavioral domains, only people high on specific personalitytraits might pick up the relevant situational cues, facilitating theobservation of variability in individual differences.
Second, as will be discussed below, in professional education(e.g., medical school), earlier courses (i.e., proximal criteria) typ-ically focus on the acquisition of declarative and proceduralknowledge, whereas later courses (i.e., distal criteria) place moreemphasis on applications and internship performance. The behav-ior that needs to be displayed for performance in such courses ismore complex, as it relies much more on interpersonal interac-tions. On the basis of the predictor–criterion matching logic(Campbell, McCloy, Oppler, & Sager, 1993; McHenry, Hough,Toquam, Hanson, & Ashworth, 1990), it might then be expectedthat different personality factors will be predictive for proximalcompared with distal criteria. Due to the changing content ofmedical courses over time (i.e., from acquisition of knowledge to
1515INCREASING VALIDITIES OF PERSONALITY SCALES

performance with mock patients or in the clinic), later grades inmedical school may be better predicted by personality traits thanearlier grades.
These two conceptual arguments suggest that personality vari-ables can be stronger determinants of increasingly applied perfor-mance that occurs later in professional education. From an empir-ical point of view, Barrett and Alexander (1989) cited severalexamples of increasing criterion-related validities for noncognitivepredictors (e.g., Dodd et al., 1970; Helmreich et al., 1986; Singh,1978). For noncognitive predictors studied thus far, such as as-sessment center ratings, criterion-related validities tend to be betterin the long run. For example, Hinrichs (1978) found that assess-ment center ratings predicted organizational level better 8 yearspostassessment than 1 year postassessment. Similar patterns ofresults have been reported by Bray and Howard (1983) and morerecently by Jansen and Stoop (2001). However, parallel investiga-tions for personality scales are lacking.
Academic Performance in Medical School: A TheoreticalDistinction Between Early and Late Performance
In this study, we examine personality determinants of successacross seven years, the entire duration of medical education inBelgium. Changing tasks characterize education in general andmedical education in particular, providing the possibility that per-sonality determinants of behavior could vary at different points intime.
Performance in educational settings in general can be describedbroadly as acquisition and applications of declarative and proce-dural knowledge. Performance in professional education in partic-ular (e.g., law, business administration, pharmacy, medical school)also includes elements of applied practice (e.g., internships). Med-ical education specifically includes both theoretical courseworkand large components of clinical practice (Curry & Makoul, 1998;Dusek & Bates, 2003; Laidlaw, MacLeod, Kaufman, Langille, &Sargeant, 2002; H. G. Schmidt et al., 1996). Conventional medicaltraining can be divided into preclinical and clinical years (Fergu-son, Sanders, O’Hehir, & James, 2000, p. 331; Lipton, 1988;Lipton, Huxham, & Hamilton, 1984). Early performance in med-ical school consists of performance in basic science courses (e.g.,gross anatomy, biochemistry, physiology, microbiology) and isassessed by scores on exams that aim to assess primarily declar-ative knowledge. Later years in medical school are referred to asclinical years, and academic performance during these years isheavily influenced by clerkships during which students are trainedwith hands-on approaches. Interactions with patients, oral exami-nations, and ward evaluations typically form the basis of grades(Turner, Helper, & Kriska, 1974). As performance during medicalschool changes, it can be anticipated that characteristics that arerelated to working well with others (patients, supervisors, peers)would gain in importance over the years spent in medical school.
Our study’s medical school performance criterion (and itschanging nature) fits very well with these descriptions. The cur-riculum of Belgian medical schools as it was operational at thestart of this study (in 1997) was a so-called conventional medicalcurriculum with the following format: In the first year, basicscience courses (physics, chemistry, biology, biochemistry) andstatistics (mathematics) were taught. In these theoretical courses,medical students were provided with the factual knowledge that
served as a foundation for subsequent years. If practical exerciseswere included, they typically took place in the laboratory (e.g.,practical chemistry labs). In terms of teaching format, courses inthe first year were lecture-based and given to large groups. Eval-uations consisted of written exams, testing whether students ac-quired the necessary knowledge.
From the second year on, medical courses were taught. In thesecond and third years, these medical courses focused on thehealthy human body (courses such as anatomy, physiology, andhistology). In the fourth and fifth years, the emphasis shifted topathologies and the mechanisms that cause disease (courses suchas internal medicine, infectious diseases, pediatrics, surgery, gy-necology, and ophthalmology). Another important change incourse content was that in the second and third years, clinicalexperiences were limited to patient contact in introductory courseson patient interviewing, whereas in the fourth and fifth years,multidisciplinary and communication skills courses were includedto prepare students for clinical and professional practice. In thesixth and seventh years, several hospital-based clinical clerkshipswere included. This clerkship program was divided into variousrotations (e.g., Children and Youth, Surgery, Primary Care), with2 to 4 months spent in each unit, and thus introduced appliedpractice and hands-on experience with patients into the curriculum.
This gradual change in focus from knowledge acquisition toapplied practice was also exemplified by the differences in teach-ing and examination format between the second and seventh years.Specifically, traditional lecture-based teaching methods graduallydecreased in importance in favor of small group interactive learn-ing. The latter is exemplified by case-based teaching, clinical casestudies, and experiential learning. The examination format re-flected this more applied focus in the clinical years with case-based examinations and even clinical practice examinations with“standardized” patients.
Thus, the changing nature of our criterion (grade point average[GPA] in medical schools) can be summarized as follows. In thefirst year, GPA was heavily determined by knowledge acquisitionwithin science courses given in large groups. In the next six years,there was a gradual shift from relatively minor clinical interactionwith patients to clinical practice being the primary component ofmedical education, something that was exemplified by the clerk-ship program at the end.
We believe that as individuals gain experience and expertise intheir fields, validities of occupationally relevant personality traitswill increase. Later grades in medical school may be better pre-dicted by personality traits than earlier grades, because personalityvariables are potentially stronger determinants of increasingly ap-plied performance that occurs later in professional education. Suchan increasing validities hypothesis also means that academic per-formance of groups scoring high and low on various personalitytraits should diverge throughout medical school. If our generalhypothesis of increasing validities is confirmed, the key implica-tion for validation studies is that validation of personality measuresagainst early criteria would underestimate true criterion-relatedvalidities and utility of personality scales in such settings.
Attrition and Persistence in Medical School
In addition to predicting early learning success and later inter-personal (practicum) performance among medical school students,
1516 LIEVENS, ONES, AND DILCHERT
the simple fact of whether students persist through their educationis an important criterion of interest. Attrition from medical schoolshas been the focus of research attention for 140 years. Paget (1869,cited in Gough & Hall, 1975) provided the first summary of baserates of attrition from a medical school in London, in an articletitled “What Becomes of Medical Students?” Paget followed 1,000medical students for a period of 10 years, reporting that only 720were still in medicine at the end of that time. Gough and Hall(1975) provided an excellent summary of the literature on persis-tence versus attrition in medical school; readers interested in baserates of medical school attrition and potential causes are directed tothat source. Very briefly, it appears that around the world over thepast 100 years, medical school attrition rates have ranged approx-imately between 1.5% and 25%; “an attrition rate of from 5 percentto 10 percent would appear to be ‘normal’” (Gough & Hall, 1975,p. 942). In addition, attrition appears to be most closely related toacademic performance and cognitive ability (Gough & Hall,1975). The few studies that have examined personality predictorsof medical school attrition have found that dropouts had higherscores on hysteria (Knehr & Kohl, 1959); lower scores on achieve-ment (D. G. Johnson & Hutchins, 1966); higher scores on nurtur-ance and succorance; and lower scores on responsibility, social-ization, and communality (Gough & Hall, 1975). However, thisresearch did not distinguish between early and late attrition instudents’ academic careers. In this study we examine personalityvariables and attrition across multiple years of medical school.
Theoretical and Empirical Relevance of Big FivePersonality Factors and Facets for Performance inMedical School
To date, the literature on the validity of personality scales forprediction of medical school success longitudinally has been ratherlimited. One relevant study on the topic included only three yearsof academic performance data and focused on dysfunctional, darkside personality traits (Knights & Kennedy, 2007). The resultsfrom that study suggest that ”moving away” traits (i.e., paranoid,avoidant, schizoid, borderline, and passive/aggressive) and “mov-ing against” traits (i.e., narcissistic, antisocial, histrionic, andschizotypal) increased in predictive validity across the three yearsexamined (see Knights & Kennedy’s, 2007, Table 2). In thecurrent study we investigate validities of normal-range personalitytraits over longer periods of academic performance. Although ourgeneral hypothesis was that personality validities would gain inimportance over time, we were open to the idea that this might notbe true for all Big Five traits and their facets (see, e.g., Stewart,1999).
We next present our theoretical considerations of specific link-ages between personality factors and facets and early as well aslate medical school performance. Where applicable, we note ourexpectations for medical school attrition as well.
Neuroticism. Neuroticism is the negative pole of emotionalstability and describes an individual’s tendency to become emo-tionally upset. Common attributes defining this dimension areanxiety, depression, anger, embarrassment, emotion, worry, fear-fulness, instability, and insecurity. Individuals who score high onneuroticism are self-conscious and low on self-esteem and gener-alized self-efficacy (Judge, Erez, Bono, & Thoresen, 2002). Inacademic settings, such individuals would be more likely to give
up easily and would have problems with approaching difficulttasks. Individuals who are high on neuroticism also are typicallyvulnerable and employ maladaptive coping strategies in dealingwith stressful situations. For example, they become easily disheart-ened and panicked. In educational settings, one would expectNeuroticism to be negatively related to academic performance andpositively related to attrition. Eysenck (1967) pointed out thatneurotic individuals tend to score lower on high-stakes tests. Thisis possibly due to their higher propensity to experience extremelevels of anxiety, including test anxiety, in evaluative settings (e.g.,Furnham & Mitchell, 1991; Zeidner, 1995; Zeidner & Matthews,2000). Previous research has found positive relations betweenemotional stability and performance in undergraduate classes (e.g.,Cattell & Kline, 1977; Goh & Moore, 1978; Lathey, 1991;Sanchez, Rejano, & Rodriguez, 2001; Savage, 1962) as well as inmedical school (Barratt & White, 1969).
Medicine is an emotionally demanding field (Marley & Carman,1999). Students being trained in a medical program need theemotional resources to cope with the general pressures of aca-demic performance and evaluation (i.e., exams) and specific pres-sures of medical education (e.g., dealing with sick people). Thefacets that are likely to be useful in the prediction of these perfor-mance criteria are anxiety, self-consciousness, and vulnerability.Previous research supports these hypotheses. In a study focusingon medical students, Grover and Smith (1981) found a correlationof –.48 between anxiety and overall GPA. Gough, Bradley, andMcDonald (1991) reported an observed correlation of .24 betweenwell-being and clinical performance of anesthesiology residents.
On the one hand, one could expect that for early academicsuccess, emotional stability would be a greater asset, as anxiety islikely to debilitate performance on traditional examinations and,thus, early medical school performance. On the other hand, addedstress of applied practice (e.g., patients’ lives depending on thetreatments prescribed) will also require a stable emotional consti-tution. Thus, we hypothesize neuroticism validities to remainstable across early and late medical school performance (Hypoth-esis 1).
Extraversion. Extraversion is defined as a person’s capacityfor joy and the tendency to seek interpersonal stimulation. Traitsrelating to sociability, dominance, energy, and positive affectconstitute the domain of extraversion. Adjectives such as ener-getic, active, vigorous, talkative, assertive, fun-loving, gregarious,persuasive, and positive describe individuals high on this trait.Extraverts tend to be socially dominant. They seek situationswhere they can interact with others. Rolfhus and Ackerman (1999)found that extraverts scored lower on knowledge tests than intro-verts. The theoretical interpretation offered for this finding is thatknowledge acquisition time differs between extraverts and intro-verts. In learning environments, extraverts “spend more time so-cializing” (Chamorro-Premuzic & Furnham, 2003, p. 321) ratherthan devoting their cognitive resources to knowledge acquisition.Extraverts tend to be more distractible, impulsive, and sociablethan introverts. Introverts tend to be able to focus better thanextraverts on cognitively demanding tasks, have better study skills(Entwistle & Entwistle, 1970), and therefore tend to receive bettergrades (see, for example, Broadbent, 1958; Sanchez et al., 2001;also see Furneaux, 1957, as cited in De Raad & Schouwenburg,1996). Perhaps Eysenck (1992) put it best when he concluded thatthe “extravert socializes, instead of concentrating on his work,
1517INCREASING VALIDITIES OF PERSONALITY SCALES
seeks nonacademic outlets (sports, sex) for his energies, and hasdifficulty in concentrating” (p. 137, cited in De Raad & Schou-wenburg, 1996). On the flipside, there is some evidence thatextraverts tend to receive higher evaluations in seminar classes(Furnham & Medhurst, 1995), suggesting that they do better insettings that require interpersonal interactions. Extraversion can beexpected to be “associated with success when interpersonal skillsare required” (Ferguson et al., 2000, p. 324).
On the basis of the foregoing theoretical arguments, we expectthat extraversion will be negatively related to early medical schoolperformance. Classes during the preclinical years require concen-trated study (e.g., memorization of facts) and individual prepara-tion. During this period, we anticipate extraversion, especially thesociability and excitement-seeking aspects of the trait, to be aliability among medical students. Clinical years of medical edu-cation, on the other hand, require greater interactions with bothpatients and colleagues. Extraverts thrive in social situations inwhich they can interact with others. Being socially ascendant,affectionate, and warm appears to be more important for latergrades that are based on practicums and clerkships. Thus, weexpect extraverts to demonstrate better academic performance laterin medical school, during clinical years.
In general, then, Hypothesis 2 is that the validities for extraver-sion would evidence changes from negative to positive throughoutmedical school. There is one aspect of extraversion that is likely tobe equally useful throughout medical school: stamina and energy.Medical school is rigorous and demanding; achieving high gradesand performance among other highly able students is likely torequire high levels of energy, including the ability to perform wellwith little sleep. Thus, achievements in medical school are alsolikely to be related to the energy aspect of extraversion both earlyand late.
Openness. Openness describes individual differences in imag-ination, curiosity, originality, broadmindedness, and intellectance.Openness is conceptualized as influencing the breadth and com-plexity of mental experiences of individuals. Open individualshave wide interests, are imaginative, curious, creative, insightful,and perceived as more intelligent by others. Due to its associationswith cognitive ability, particularly vocabulary (Goff & Ackerman,1992) and divergent thinking (McCrae, 1996), openness has beenempirically linked to academic performance (e.g., Blickle, 1996).Its facets of openness to aesthetics and ideas are more closelyrelated to lexical intellect than other facets of the dimension (J. A.Johnson, 1994; Saucier, 1994). Open individuals are also charac-terized by curiosity and intellectual engagement in cognitive tasks.Curiosity and engagement in intellectual pursuits are requisiteattributes in learning environments (Rocklin, 1994), and thusopenness is likely to be generally predictive of grades in medicaleducation.
Validities for the openness dimension of the Big Five haveusually been poor for predicting performance (Barrick, Mount, &Judge, 2001) and educational success (Hough, 1992). Inconsistentvalidities have been reported for this personality construct inpredicting training performance. A meta-analysis by Barrick andMount (1991) found a true score correlation of .25 (N � 2,700, k �14) with training success, whereas Hough (1992) reported a meanobserved validity of .02 (N � 8,744, k � 35). Recent studiesexamining facets of openness have reported more encouragingresults (Griffin & Hesketh, 2004).
There are reasons to expect openness validities to increasethroughout medical school education. Openness is a trait that isrelevant to adapting more adequately to novel and unforeseenchanges (LePine, Colquitt, & Erez, 2000). Students are much morelikely to encounter new situations during their clinical years.Nonetheless, different aspects of openness may be valuable forpredicting academic success in different stages of medical educa-tion, including early years. Openness to ideas might be predictiveof preclinical year grades, whereas openness to feelings might bemore predictive of later grades that are based on interactions withpatients. Thus, we hypothesized that the criterion-related validitiesassociated with openness to feelings would increase during med-ical school (Hypothesis 3).
Agreeableness. Agreeableness is the dimension of the BigFive describing the tendency to help others and behave in prosocialways. It is a trait that is important in characterizing how peoplebehave in interpersonal interactions. Agreeable individuals arecooperative, nurturing, affectionate, sensitive, caring, altruistic,kind, tender minded, and softhearted. Individuals scoring low onthis dimension are described as uncooperative, unfriendly, selfish,hostile, and egocentric. There have been at least two studies thathave demonstrated the usefulness of agreeableness-related person-ality traits in medical education, all focusing on clinical perfor-mance as the criterion (Gough et al., 1991; Shen & Comrey, 1997).These studies found that personality traits related to agreeablenessare correlated with clinical performance. Of particular importanceis the empathy facet of agreeableness. Empathy refers to the“ability to sense what others think and feel” (Gough et al., 1991,p. 993). Gough and colleagues found that empathy predictedclinical performance of anesthesiology residents, and they attrib-uted the personological meaning of this finding to individuals’ability to sense the needs of their patients and medical teams. Thus,we hypothesized validities for agreeableness to increase across theseven years of medical school, as the heaviest component of lateperformance in medical school is interpersonal in nature (Hypoth-esis 4).
Conscientiousness. Among the Big Five dimensions of per-sonality, conscientiousness has been most closely related toachievement and success in both educational environments(Blickle, 1996; Busato, Prins, Elshout, & Hamaker, 2000; Costa &McCrae, 1992; De Raad, 1996; De Raad & Schouwenburg, 1996;Goff & Ackerman, 1992; Kling, 2001) and work settings (e.g.,Barrick & Mount, 1991; Barrick et al., 2001; Burch & Anderson,2008; Dudley, Orvis, Lebiecki, & Cortina, 2006; Salgado, 1998).Conscientiousness refers to the cluster of traits relating to achieve-ment striving, prudence, dependability, persistence, order, andimpulse control. This dimension of personality is closely alignedwith educational achievement through effort and volition (hardwork, achievement orientation, and perseverance) as well as theenabling characteristics of being organized and efficient. Individ-uals high on this personality trait tend to work hard and choose topersist in goal-directed behavior. They also tend to follow rulesand norms, plan carefully, and display the ability to delay gratifi-cation. Adjectives such as competent, thorough, driven, and workoriented describe individuals high on this trait.
Conscientiousness is a motivational trait: Conscientious individ-uals not only strive to excel, but they also persist in the face ofadversity. Previous work utilizing conscientiousness-related traitshas documented its pervasive influence in predicting academic
1518 LIEVENS, ONES, AND DILCHERT

performance in college (e.g., Wolfe & Johnson, 1995) and grad-uate studies (e.g., Wiggins, Blackburn, & Hackman, 1969). In-deed, conscientiousness is the Big Five dimension with the mostimpressive record for predicting academic achievement.
Conscientiousness, and especially achievement-striving aspectsof the trait, are expected to predict learning criteria in medicalschool through motivational effects leading to hard work andpersistence. However, one would expect even stronger validities ofconscientiousness for grades in medical school where clinicalperformance is a core component. Interpersonal relationships arefacilitated by honesty and dependability. Attention to detail andvigilance are important in diagnosing and treating patients underthe supervision of professors. There is some support for these ideasin the medical education literature. Gough et al. (1991) found thatsocialization and achievement via conformance correlated in the.20s with performance among anesthesiology residents. Thus, wehypothesize validities associated with conscientiousness to be atuseful levels throughout medical school but to increase especiallyduring clinical years (Hypothesis 5).
We also expect conscientiousness to relate negatively to aca-demic attrition; conscientious individuals may be expected to havethe self-discipline to persist in medical school. Empirical evidencesupporting our hypothesis is reported by D. G. Johnson andHutchins (1966), who found that achievement orientation wasrelated to persistence in medical school. Also, Gough and Hall(1975) found that responsibility and socialization (which assessprimarily conscientiousness, but also agreeableness and emotionalstability; see Hough & Ones, 2001), were negatively related tomedical school attrition.
Method
Sample and Procedure
In 1997, 785 students entered medical studies across all sixFlemish universities in Belgium, having successfully passed acognitive ability-based admission exam, consisting of a generalmental ability and situational judgment test (see Lievens, Buyse, &Sackett, 2005, for details on tests and the selection procedure).Students were selected based on their standing on an overall scorecomposite, which was mostly determined by the general mentalability test (the observed correlation of the general mental abilitytest with the overall score was .78 in this sample). The generalmental ability test, the situational judgment test, and the overallscore composite correlated only negligibly with the focal(personality-based) predictors employed in this study (the stron-gest positive correlation was .09 with openness; the strongestnegative correlation was �.13 with agreeableness).
During classes at the beginning of the first academic year,students were asked to participate in this study by completing apersonality inventory and granting the researchers access to theiracademic records throughout their medical school career. Partici-pants were informed of the purpose of the study, were assured thatresults were to be used only for research purposes, and wereguaranteed confidentiality of the information provided. Feedbackon personality test scores was given to those individuals who wereinterested. For this purpose, student identification numbers, whichwere also used to match test scores to criterion data collected inlater stages of the study, were employed.
Of the 785 students initially enrolled across all six universities,627 agreed to participate, yielding a total response rate of 79.9%(ranging from 67.8% to 84.2% across universities). Of those stu-dents participating, 403 were female (64.3%) and 224 male(35.7%); the mean age of participants was 18 years 3 months(SD � 10 months) at the beginning of the study. A portion of thedata used in this research (from three preclinical years of theseven-year curriculum) was previously reported by Lievens, Co-etsier, De Fruyt, and De Maeseneer (2002). However, Lievens etal. did not study changes in criterion-related validity over time.The later GPA criterion available for the present article had notbeen collected at that point. Further, Lievens and colleagues fo-cused on differences between medical students and other studentsin terms of their personality characteristics; this issue is not a focusin the present article beyond its influence on predictor score rangerestriction and enhancement (see discussion below).
The mean personality scale scores of the 627 medical studentswho agreed to participate in this study did not differ notably fromthe population of Belgian college students (normative N � 1,560);the average absolute magnitude of group differences across BigFive factors and the 30 facet scales of the NEO PersonalityInventory-Revised (NEO PI-R; Costa & McCrae, 1992) was .07standard deviation units.1 With regard to variability in personalityscale scores, this sample was between 6% less variable and 9%more variable than the population of Belgian college students,depending on the personality scale under investigation. Thesefindings of relatively small differences are intuitively appealingwhen we consider that the personality inventory was administeredat the beginning of the first academic year for research purposesonly, and individuals’ scores were not used in any selection deci-sions. As such, we concluded that there was no bias in either meanlevels or variability of personality scores in this sample of medicalstudents when compared with the general student population.
One strength of this sample is that it consisted entirely ofmedical students (an entire country’s cohort). This afforded us agreater extent of curriculum standardization than is typically foundin studies involving students across several academic disciplines.By using this sample, we held constant a number of potentiallycontaminating influences that operate on reliabilities of grades andon observed validities in the prediction of academic success (e.g.,differences in course difficulty across fields; see discussion be-low).
Measures
Personality measure. Participants completed the authorizedFlemish translation (Hoekstra, Ormel, & De Fruyt, 1996) of theNEO PI-R (Costa & McCrae, 1992). The NEO PI-R is a 240-itempersonality inventory assessing the Big Five dimensions of neu-roticism, extraversion, openness, agreeableness, and conscien-tiousness, as well as 6 specific facets per factor (8 items per facet).The item response scale ranges from 1 (strongly agree) to 5(strongly disagree). In this sample, a principal components anal-ysis, followed by varimax-rotation, yielded five factors that ade-quately described the data, with eigenvalues ranging from 1.71 to5.75 (60.6% of variance explained). All but 1 of the 30 facets
1 We thank Filip De Fruyt for generously sharing the normative data ofthis large sample of Belgian college students.
1519INCREASING VALIDITIES OF PERSONALITY SCALES
measured by the NEO PI-R displayed their primary loadings on thefactor they were purported to measure. The only exception wasobserved in the impulsiveness facet of neuroticism, which wasfound to load primarily on the factor extraversion. This deviance infactor structure when compared with the original U.S. version ofthe test is one that is often observed in analyses of Dutch/Flemishdata sets (De Fruyt & Mervielde, 1998).
Criterion measures. Participants’ attrition status and GPAwere obtained from university records at the end of each academicyear for seven consecutive years (i.e., throughout the whole cur-riculum). We refer to the earlier section in our literature review fora year-by-year description of the criterion. GPA served as a mea-sure of academic performance in medical school. In Belgium, GPAis measured on a scale from 0 to 20, with higher scores indicatingbetter grades. In order to circumvent potential distortion effectscaused by differences in harsh or lenient grading policies amonguniversities, individuals’ GPAs were standardized within each ofthe six universities from which data were obtained.
These data were available for 608 students at the end of the firstyear, for 405 students at the end of the second year, for 353students at the end of the third year, for 339 students at the end ofthe fourth year, for 334 students at the end of the fifth year, for 307students at the end of the sixth year, and for 306 students at the endof the seventh and final year in medical school. The reduction inthe number of participants was due to attrition of students acrossyears primarily as a result of individuals failing final year examsand eventually dropping out of medical school.
These longitudinal data enabled us to compare the relativepredictive validity of personality traits over time, although, aspreviously discussed, attrition among students needed to be takeninto account as it could potentially lead to restriction of range inthe variables examined. Comparisons of validities for the GPAcriterion across seven years constitute our primary examination.However, we also summarize mean differences between persistersand dropouts in terms of personality characteristics.
Analyses
Correlations were computed between Big Five factor and facetscores, as assessed by the NEO PI-R, and students’ GPA, sepa-rately by year. Means and standard deviations were computed forstudents’ personality test scores as well as for GPA at the end ofeach academic year, to determine the extent of potential rangerestriction on the predictor and criterion variables that was due tostudent attrition (see below for more details on artifact correc-tions).
To examine differences between those who left medical schooland those who stayed in terms of Big Five personality factors andfacets, we computed standardized effect sizes (d values) compar-ing leavers and persisters. An effect size is computed byexpressing the differences in the means of the two personalityscale scores in pooled standard deviation units. In this study,positive d values indicate higher mean scores for persisters, andnegative d values indicate higher mean scores for dropouts. Al-though effect sizes can theoretically range between positive andnegative infinity, given a normal distribution, 95.44% of all effectsizes are found between 2.00 and –2.00. Effect sizes of about .20in magnitude are small, around .50 are medium, and above .80 arelarge (Cohen, 1977). In this research, effect sizes close to zero
would indicate the equivalence of the means of the two groupsbeing compared.
Our choice of standardized effect sizes (d values) to comparepersisters and leavers was based on two major considerations.First, different personality scales (e.g., Big Five factor scoresversus facet scale scores) do not have the same scoring. Wheneffect sizes are used to convert observed score differences tostandardized difference scores, the resulting value is independentof the original units of measurement. Second, and more importantfor this research, d values indicate the magnitudes of the differ-ences between two groups being compared, irrespective of samplesizes of individuals in each group. This was crucial for the inter-pretability of our findings as the degree of attrition was greatestbetween the first and the second year, with fewer and fewerstudents leaving medical school in subsequent years. In computing90% confidence intervals around the d values, unequal sizes of thegroups were taken into account in estimating sampling errors(Hedges & Olkin, 1985). Due to the smaller number of dropouts inlater years, we report these analyses only until Year 4, wheremeaningful comparisons can still be made.
Corrections for range restriction on the criterion. In longitu-dinal validation designs, attrition creates range restriction on thecriterion, typically performance. For instance, in work settings,poor performers are fired or laid off, and good performers arepromoted (Bass, 1962). Thus, performance measures assess onlythose individuals remaining at a particular point in time. As Stur-man and Trevor (2001) pointed out, “Research predicting individ-ual job performance over time that excludes leavers may sufferfrom nonrandom mortality, which threatens the internal validity ofsuch studies”; thus, “It is important that analyses not be biased byexcluding an often sizable, and conceptually important, portion ofthe workforce” (p. 695). In educational settings, poor performanceis the leading cause of academic dropouts (Humphreys, 1968). AsHumphreys put it, “A good deal of the change in Ns overall,however, is due to academic selection. Academic dropouts de-crease the range of talent and attenuate correlation coefficients” (p.375). Examinations of criteria over time must take attrition andturnover influences into account (Sturman & Trevor, 2001) be-cause they can work to produce spurious effects such as decliningvalidities due to range restriction (Lin & Humphreys, 1977).
Thus, in assessing the predictive value of a variable, it isdesirable to have an estimate of what the predictor–criterionrelationship would have been had there not been any range restric-tion (i.e., had no one dropped out). Conclusions about the validityand usefulness of selection and admissions instruments need toapply to the whole pool of applicants and not only to those whoremain in the organization or who stay to graduate. In this study,as the demands on students increase over the course of sevenacademic years, many individuals leave medical school becausethey fail to meet learning criteria (i.e., they fail end-of-year ex-ams). As academic attrition results in a reduced number of (pre-sumably high-performing) students over the course of seven years,the range of scores on the GPA criterion among each year’s sampleshould be notably reduced and thus attenuate observed correla-tions. We were interested in the predictability of academic perfor-mance for all students and not only for those who persisted tograduation. We therefore followed Humphreys’s (1968) recom-mendations and statistically corrected for range restriction in thecriterion.
1520 LIEVENS, ONES, AND DILCHERT

In longitudinal prediction studies such as this one, it is crucial todisentangle range restriction effects from other influences resultingin reductions in criterion variability. In addition to true changes inperformance (e.g., individuals become more homogeneous in theirperformance as a result of their training), one artifactual influencethat reduces criterion score variability is scale compression. Ifmedical students in later years mostly receive a limited set of highgrades, a ceiling effect on grades can produce reduced variabilityin GPAs that is substantively quite distinct from the effects ofdirect range restriction on the criterion. GPA scale compressioninfluences variability in criterion scores but is a separate phenom-enon from criterion range restriction caused by attrition. Althoughsuch scale compression artifactually depresses observed validity, itshould not be corrected for like range restriction, especially ininstances where it cannot be distinguished from true changes inperformance variability, as is the case in the present study.
In making artifact corrections, our goal was to be as accurate aspossible. Thus, we sought to not include the influence of non-attrition-related reductions in criteria (i.e., scale compression ortrue variability reductions) in our range restriction corrections butrather adjust range restriction correction factors (u values) toprovide more conservative (i.e., lower) estimates of operationalvalidities. Thus, we examined whether scale compression and/ortrue reductions in criterion variability affected GPA variabilityacross years. To this end, we computed means and standarddeviations on GPA separately for those groups of students whowere still enrolled each year across all preceding years separately,by university. For example, we selected all individuals still en-rolled in the seventh year and computed standard deviations onGPA for only this group for Years 1 to 7.
These analyses indicated that those groups of students whopersisted to go on to later years were much less variable in theirperformance even in early years, compared with the entire group ofindividuals entering medical school. In addition, there were tem-poral declines in the academic performance variability of persis-ters. For example, when we selected only those students whopersisted to the seventh year and computed GPA standard devia-tions for this select group of students separately for each year inmedical school, we found the respective standard deviations to be1.65 for Year 1, 1.83 for Year 2, 1.64 for Year 3, 1.65 for Year 4,1.33 for Year 5, 1.07 for Year 6, and 0.96 for Year 7. Because thisgroup consisted only of those students persisting to the seventhyear, attrition can be ruled out as a cause of declining standarddeviations.
The existence of scale compression effects and/or true reduc-tions in variability prevented the use of traditional range restrictioninformation in corrections for attenuation due to restriction causedby attrition. Normally, we would have obtained a range restrictioncorrection (u) value (cf. Hunter & Schmidt, 2004; Sackett & Yang,2000) by dividing the standard deviation of the restricted group(those students still enrolled in the year under investigation) by thestandard deviation of the unrestricted group (all students enrolledin the first year of studies).2
However, since there was evidence of non-attrition-related re-ductions in variability in our data, we had to devise and apply analternate strategy in order not to overestimate operational validitiesby applying range restriction corrections. Our aim was to isolateattrition-based range restriction effects from scale compressionand/or true variability reduction effects. We first computed a scale
compression/true variability reduction index for each year bydividing the standard deviation for that year’s GPA (using allstudents in that year) by the standard deviation of GPA for thesame students (a given year’s persisters) in Year 1. For example,the factor for Year 3 was computed by dividing the standarddeviation of GPA in Year 3 by the standard deviation of GPA forexactly the same students (Year 3 persisters) in Year 1.
To answer the question “For each year, what would be thestandard deviation of grades if academic attrition were not oper-ating?”, we multiplied the standard deviation of grades in Year 1(before any range restriction on the criterion occurred) by eachyear’s scale adjustment factor. This provided unrestricted groupGPA standard deviations for each year, unhampered by effects thatalso reduce variability but are not due to attrition (e.g., scalecompression and increased performance homogeneity). These newestimates of unrestricted group GPA variability were notablysmaller than those we would have obtained looking at observedYear 1 scores.
We then computed range restriction correction (u) values bydividing the GPA standard deviations of those who persisted toeach given year by the new unrestricted group GPA standarddeviation (as described earlier, after taking GPA scale reducedvariability effects into account). For example, for Year 3, the uvalue was obtained by dividing the Year 3 GPA standard deviationby the GPA standard deviation for all students in Year 1 multipliedby the scale variability reduction factor for Year 3. Such a proce-dure focuses only on the effects of attrition on the criterion anddoes not correct for reduced variability in criterion scores due toother influences (e.g., scale compression or true changes in per-formance). This procedure was repeated for all years to obtain aunique, attrition-based u value for each year. These more conser-vative u values were utilized in range restriction corrections. Nocorrections for range restriction were applied to Year 1 validities,as attrition based on academic performance was not evidenceduntil the end of that year.
Descriptive statistics for predictor and criterion variables arepresented in Appendix A. As indicated in Appendix A, the stan-dard deviation of GPA was 3.46 in Year 1, whereas it was 0.99 inYear 7 (based on GPA raw score units). As discussed earlier, thisreduction in variability was due to (a) academic attrition, (b) trueperformance changes, and (c) scale compression. The effects ofattrition-based range restriction on predictor and criterion variabil-ity are summarized in Appendix B. For the GPA criterion, the uvalues reported indicate that the greatest effect of attrition onvariability in grades occurs in Year 2 (the year when the greatestnumber of academic dropouts occurs—203 of 608 original stu-dents dropping out). The u value of .53 indicates that thosestudents who made it to Year 2 are 47% less variable on GPA thanwould be the case if all Year 1 students were allowed to advance
2 This procedure was followed by the only study we could locate thataddressed and dealt with the issue of range restriction in criterion scoresdue to student attrition over time (Humphreys, 1968). In reporting cor-rected correlations between ability and grades, Humphreys compared thestandard deviation of grades for each group for which validity was to beestimated with that of the most unrestricted group (students in the firstsemester). This correction was appropriate because there was no evidenceof scale compression in Humphreys’s study.
1521INCREASING VALIDITIES OF PERSONALITY SCALES

to Year 2 (recall that this takes into account only attrition-basedrange restriction). As such, the u values presented in Appendix Bdo not confound scale compression effects/true reductions in cri-terion variability with attrition-based range restriction effects. Ap-pendix C presents observed correlations between Big Five person-ality factors and facets and GPA, by year. The range restriction andrange enhancement u values reported in Appendix B were used inrange restriction corrections of observed correlations presented inAppendix C.
Corrections for range restriction on the predictor. Results ofthe personality assessment were not used in admission decisions orin selecting individuals to proceed to subsequent years throughouttheir medical school career. However, we were sensitive to the factthat student attrition across the seven years may result in lessvariability in students’ personality scores in later years, as can behypothesized by an attraction–selection–attrition model (B.Schneider, 1987). Thus, we also corrected observed correlationsfor range restriction on the predictor variable, as we were inter-ested in what the validity of the predictor (administered at time ofadmission) would be for the entire applicant pool. In the case ofpersonality test scores, this sometimes resulted in correction forrange enhancement in scores rather than corrections for rangerestriction. In applying range restriction/enhancement corrections,we relied on the improved approximation provided by Alexander,Carson, Alliger, and Carr (1987).
Corrections for unreliability. No corrections were applied forattenuation due to unreliability in predictor scores, as we wereinterested in the operational validity of personality scales in pre-dicting GPA. Also, unreliability in the criterion was not taken intoaccount. In this study, we did not want to rely on assumptions ormeta-analytic estimates of criterion reliability, despite the fact thatgood and stable estimates would be available in the literature onwhich we could base our corrections. Thus, our estimates ofoperational validities underestimate the real operational validity ofpersonality in predicting medical school GPA to the extent thatGPA is an unreliably measured criterion of academic performance.If one were to assume a level of unreliability in the GPA criterioncommensurate with that typically observed in educational settings(the meta-analysis by Kuncel, Hezlett, & Ones, 2001, reports amean reliability of .83 for graduate GPA), or if employing thevalue of .75 used for such corrections in previous studies (Lievenset al., 2005), all validities would be 9.7% (or 15.5%) larger thanthe values reported here, which are not corrected for attenuationdue to unreliability.
Multiple regression analyses. Multiple regression analyseswere conducted on the basis of correlation matrices obtained aftercorrecting all observed criterion-related validities for effects ofrange restriction and enhancement caused by academic attrition.For each year, GPA was regressed on all Big Five factors enteredinto the regression simultaneously, in order to obtain an estimate ofthe amount of variance in academic performance that is explainedby individual differences in personality, and also to investigate therelative value of each of the Big Five factors in the prediction.
Results
Operational Validity of Big Five Factor and Facet Scores
Table 1 presents operational validities of Big Five personalityfactors and facets for grade point average by year. The results
show that operational validities of personality for predicting gradestend to increase for most Big Five factor and facet scales over theseven years of medical school education.
For predicting GPA in Year 1, few personality factor and facetscales displayed operational validities that exceeded .10. Thesescales were extraversion (�.11), gregariousness facet of extraver-sion (�.13), and excitement-seeking facet of extraversion (�.16);ideas facet of openness (.12); conscientiousness (.18), as well ascompetence (.16), achievement striving (.14), self-discipline (.22),and deliberation (.14) facets of conscientiousness. By Year 7,operational validities for the Big Five factors of extraversion,openness to experience, agreeableness, and conscientiousnesswere substantially higher. Their validities for predicting academicperformance in the seventh year of medical school were .31, .30,.17, and .45, respectively. These values represent increases inoperational validity of .28 for openness, .16 for agreeableness, and.27 for conscientiousness. The validity of extraversion initially was–.11 and increased to .31 by Year 7. Only a very modest increasein validity was observed for the Big Five factor of neuroticism, asassessed by the NEO PI-R. Operational validity (not corrected forunreliability in the criterion) increased from a negligible value of� � .03 in the first year (higher scores on neuroticism indicatinghigher GPA) to a high of �.07 in the seventh year (lower scoresin neuroticism indicating higher GPA).
Early on, only 7 of 24 facet scales of extraversion, openness,agreeableness, and conscientiousness exceeded an operational va-lidity of .10. By Year 7, 19 of the 24 facet scales had substantialvalidities, ranging between .17 and .47. That is, with only a fewexceptions, virtually all facets of these four dimensions of the BigFive factors predicted medical school performance with goodefficiency. Average increases in operational validities were .18across extraversion facets, .15 across openness facets, .10 acrossagreeableness facets, and .21 across conscientiousness facets. Wenext discuss patterns of increasing operational validities for eachof the Big Five.
Operational Validities for Neuroticism
In general, validities for neuroticism remained relatively un-changed for predicting grades, supporting Hypothesis 1. Academicperformance differences between those high versus low on neu-roticism remained relatively constant across the years, but this BigFive dimension had virtually negligible predictive value to beginwith (r � .03 to �.07). Nontrivial validity increases, however,were found for two facets of neuroticism. Validities for self-consciousness increased by .10 validity points; validity for thevulnerability facet increased by .11 validity points. According toCosta and McCrae (1992), self-conscious individuals are “uncom-fortable around others, sensitive to ridicule, and prone to feelingsof inferiority,” and vulnerable individuals are “unable to cope withstress, becoming dependent, hopeless and panicked” (p. 16). Asmedical students move to dealing with patients in applied practiceduring their education, it appears that personality characteristicsrelating to being comfortable around others, as well as having theability to cope with stress, gain in validity for predicting medicalschool performance.
1522 LIEVENS, ONES, AND DILCHERT

Operational Validities for Extraversion
Of all the Big Five dimensions, operational validities showedthe greatest change for extraversion and its facets. The change invalidity between Year 1 and Year 7 was from �.11 to .31 for theoverall extraversion factor scale. The mean validity for extraver-sion facets was �.08 in Year 1 and .25 in Year 7. Largest gains invalidity were found for assertiveness and warmth facets. Beingsocially ascendant, affectionate, and warm appears to be importantfor later grades that are based on practicums and internships.
Note that extraversion scores were negatively associated withacademic performance early in medical school (e.g., operationalvalidity for Year 1 was –.11). Extraverted individuals tended toobtain lower GPAs. However, later on in medical school, extra-version scores were positively and more strongly related to thecriterion (validity in Year 7 was .31). Thus, Hypothesis 2 ofincreasing validities for extraversion received support. Extraver-sion and many of its facets predicted later grades in medical schoolbetter than earlier grades. As activities with significant interper-sonal interactions became part of the official curriculum, extra-verted individuals performed better.
Early in medical school, extraversion appears to be a liability.Particularly excitement-seeking and gregariousness facet scalespredict academic performance negatively (�s of �.16 and �.13,respectively). Furthermore, the excitement-seeking facet of extra-version was consistently negatively correlated with GPA through-out medical school. One explanation for the negative correlationbetween excitement-seeking and academic success might be thepotential negative influence that excitement-seeking behavior canhave on study habits of individuals; high scorers in this domain areconsiderably more prone to engage in social interactions andactivities that take time away from their studies. Personality ten-dencies such as craving excitement and stimulation, as well as apreference for the company of others, detract from concentratingon academic work.
Operational Validities for Openness
Open individuals are characterized by curiosity about differentlife domains and unconventionality. In our data, openness was notpredictive of academic performance in the first year of medicalschool (� � .02). However, the validity of openness increased to
Table 1Operational Validities (�) of Big Five Factors and Facets for Predicting Grade Point Average Across Years
VariableYear 1
(N � 608)Year 2
(N � 405)Year 3
(N � 353)Year 4
(N � 339)Year 5
(N � 334)Year 6
(N � 307)Year 7
(N � 306)
Neuroticism .03 �.01 �.01 .02 �.05 �.09 �.07Anxiety .06 .10 .02 .08 �.01 �.04 .02Angry Hostility .03 �.08 .08 .05 �.06 .01 �.01Depression .04 .01 .03 .01 �.04 .00 .00Self-Consciousness .04 .01 �.04 .03 �.08 �.19 �.14Impulsiveness �.05 �.09 �.06 �.05 .07 .00 �.07Vulnerability .01 �.02 �.08 �.02 �.12 �.17 �.12
Extraversion �.11 �.01 .03 .14 .25 .25 .31Warmth �.08 .07 .05 .18 .26 .26 .33Gregariousness �.13 �.09 �.06 .04 .20 .05 .18Assertiveness .01 .10 .24 .28 .29 .36 .44Activity �.01 .03 .07 .16 .14 .15 .29Excitement-Seeking �.16 �.18 �.16 �.13 �.07 �.02 �.11Positive Emotions �.07 .07 .00 .05 .23 .25 .17
Openness .02 .18 .25 .28 .42 .35 .30Fantasy �.01 .08 .01 .03 .24 .18 �.02Aesthetics .04 .17 .32 .34 .40 .40 .34Feelings .01 .13 .15 .34 .38 .30 .28Actions �.09 �.05 .00 �.01 .08 .14 .19Ideas .12 .22 .36 .30 .34 .29 .31Values �.06 .12 .06 .01 .26 .08 .08
Agreeableness �.01 .09 �.03 .01 .17 .06 .17Trust �.02 .11 .03 .03 .22 .06 .17Straightforwardness .06 .14 .08 .09 .23 .09 .23Altruism �.09 .04 �.01 .02 .11 .19 .27Compliance .05 .18 �.10 �.12 .02 �.06 .03Modesty �.06 �.12 �.14 �.05 �.04 �.06 �.08Tender-Mindedness �.02 .03 .01 .10 .20 .05 .13
Conscientiousness .18 .41 .33 .26 .38 .43 .45Competence .16 .25 .30 .19 .36 .42 .42Order .08 .22 .11 .02 .17 .24 .24Dutifulness .09 .26 .15 .22 .21 .21 .23Achievement Striving .14 .34 .31 .35 .41 .48 .44Self-Discipline .22 .46 .38 .34 .40 .43 .47Deliberation .14 .29 .22 �.01 .16 .16 .30
Note. N � sample size in a given year; � � operational validity, corrected for range restriction and range enhancement on predictor and criterion measures.See Appendix B for u values used in corrections.
1523INCREASING VALIDITIES OF PERSONALITY SCALES
the .30 to .40 range by the fifth to seventh year of medical school.Note that validities of openness to aesthetics, feelings, and ideasare higher than the validities of other openness facet scalesthroughout the seven years. According to Costa and McCrae(1992), individuals who score high on openness to aestheticsappreciate art and beauty; individuals who score high on opennessto feelings evaluate emotion as an important part of life; andindividuals who score high on openness to ideas are intellectuallycurious. Although it is relatively easy to understand why beingintellectually curious and open to feelings would result in betteracademic performance, particularly in those classes that involvepatients, it is not clear to us why appreciating art and beauty wouldtranslate into better grades in medical school. We can formulate noconvincing explanation for the pattern in validity of openness toaesthetics.
We noted that the largest gains in validity were observed for theopenness to aesthetics, feelings, actions, and ideas facet scales. Ingeneral, Hypothesis 3 of increasing validities for the domain ofopenness to experience received support. But it may be worthwhileto point out that the overall openness and the openness to aesthet-ics, feelings, and ideas operational validities suggest an asymptoteto a level of about .30. The relationship between year in medicalschool and the validity of openness scales can be characterized asa monotonically increasing, negatively accelerated curve.
Operational Validities for Agreeableness
The increase in operational validity was modest for the Big Fivefactor of agreeableness (total increase of .16 correlational pointsacross seven years). It could be argued that grades partially reflectlikeability in later academic years. Our Hypothesis 4 of increasingvalidities also received support for altruism, straightforwardness,trust, and tender-mindedness facet scales of agreeableness.Seventh-year validities for these facets ranged between .13 and.27. These facets of agreeableness are descriptive of individualswho are willing to help those in need, are sincere, are wellintentioned, and who show sympathy and concern for others. It isnot difficult to see how these qualities would be beneficial ininteracting with patients during practicums and internships andthus get reflected in later medical school GPA. The modesty facetof agreeableness, it is interesting to note, displayed a consistentsmall, negative validity over time.
Operational Validities for Conscientiousness
Conscientiousness is the Big Five dimension that has mostconsistently been found to predict training performance and learn-ing in educational settings (Barrick & Mount, 1991; Barrick et al.,2001; Hough, 1992; Salgado, 1997). Accordingly, validities forthis Big Five dimension were strong. The results for conscientious-ness also suggest that academic performance differences betweenhigh- and low-scoring groups on this trait diverge throughoutmedical school. That is, greater differences in academic perfor-mance are found between students high and low on conscientious-ness later in medical school. By Year 7, the validity for the overalldimension was .45 and validities across all six facets rangedbetween .23 and .47. The mean increase in facet validities was .21,lending support to Hypothesis 5.
In general, the more proactive conscientiousness traits (self-discipline, achievement striving, and competence) appeared tobetter predict medical school performance than inhibitory andregulatory conscientiousness traits (order, deliberation, and duti-fulness). Largest long-term validities were found for the overallconscientiousness factor and self-discipline, achievement striving,and competence facets (�s of .45, .47, .44, and .42, respectively,for Year 7 GPA). Individuals who start and finish tasks in a timelymanner “despite boredom and distractions,” who “work hard toachieve their goals” (Costa & McCrae, 1992, p. 18), and those whoare prudent do well early in medical school, but they do even betterlater, compared with individuals lower on these traits.
The validities for the Big Five personality domains reportedearlier are impressive for noncognitive predictors, especially in thelight of findings that typically suggest declining validities in lon-gitudinal investigations. We were encouraged by comments re-ceived during the peer review process of this article to conductadditional analyses to firmly illustrate that the effects reported hereare not simply due to the artifact corrections applied, but are trueeffects of rising validity. Recall that we did not correct for unre-liability in the predictor or the criterion, and we also did not correctfor reduced variability in criterion scores due to scale compressionor increasing performance homogeneity, and thus already providedvery conservative (downwardly biased) artifact corrections. Butbecause the (conservative) corrections we applied are relativelyuncommon, we wanted to further reinforce the fact that they arenot the source of the pattern of rising validities but only serve toestimate operational validities more accurately.
First, we checked on the potential impact that the adjustment wemade to range restriction (u) values (in order not to overcorrectgiven evidence of criterion scale compression and/or true reducedperformance variability in later years) had on conclusions drawnfrom range restriction corrected correlations. When the analysesreported in this article were repeated without the adjustment of uvalues for the effect of criterion variability reductions observed inlater years, the exact same pattern of results was replicated, yetoperational validity estimates were much higher. To illustrate this,we computed the correlations between the operational validityresults we reported earlier and those obtained without takingcriterion variability reductions in later years into account. For theBig Five traits, the correlations of these two respective sets ofvalidities across the seven years were .98, .98, .92, .96, and .89 forneuroticism, extraversion, openness, agreeableness, and conscien-tiousness, respectively.
Second, following the suggestion of one of the anonymousreviewers, we also analyzed the subsample of students who per-severed until Year 7 separately (n � 297 after listwise deletion onall variables). This sample is not influenced by range restriction onthe criterion, as there was no attrition for this group. However,results indicate that the variability in criterion scores was reducedacross years for this subsample as well, due to either scale com-pression (which we again did not correct for) or true reductions inperformance variability. The means and standard deviations ofGPA in all seven years for this subsample only are reported inAppendix D. In addition, we provide observed correlations be-tween all personality scales and the GPA criteria. These data showpatterns of increasing validities for the Big Five factors similar tothose observed among operational validities for the entire sample.In sum, regardless of the analytic approaches taken, validities for
1524 LIEVENS, ONES, AND DILCHERT

personality variables, particularly conscientiousness and extraver-sion, increased over the duration of medical school education.
Multiple Regression Results
We also conducted multiple regression analyses to determinethe overall predictive validity of the Big Five personality dimen-sions for academic performance in each year of medical school.The results of the regression analyses are reported in Table 2. Theregression results confirm some of the earlier results from zero-order correlations. Conscientiousness starts out as a moderatepredictor of medical school performance and strengthens in itspredictive value considerably for later phases of medical school.Openness initially contributes little to the prediction of medicalschool grades but over time contributes consistently, and nontrivi-ally, to prediction of this criterion. Extraversion starts out as anegative predictor of performance but eventually turns into apositive predictor. The regression analysis for Year 1 indicates thatconscientiousness (positively) and extraversion (negatively) moststrongly predict performance.
The adjusted multiple correlation (R) for all Big Five factorswas .22. Performance in Year 7 is most strongly predicted byconscientiousness, extraversion, and openness (all with positiveregression weights); adjusted R for Big Five factors was .56. Thecontribution of neuroticism to the prediction of grades is trivial ineach year. In some years, agreeableness appears to emerge as asuppressor variable. For example, in Years 3 and 4, the zero-ordercorrelations between agreeableness and GPA are virtually zero(.01 and �.03). However, the sizable standardized regressionweights for agreeableness suggest a suppressor role for this vari-able. Inspection of the R2 shows that effects are fairly homoge-neous within three stages of performance (i.e., Year 1, Years 2–4,and Years 5–7). This is consistent with our description of how thecriterion gradually changes through the years. At first, there is aheavy emphasis on the acquisition of declarative knowledge, withlimited patient contact. In the second stage, clinical courses andpatient management problems are also part of the curriculum.Finally, students actually deal with patients in various clerkships.
Two overarching conclusions are warranted based onthe results discussed above. First, the predictive validities of theBig Five personality factors increase over time. Second, thevalidity of an optimal linear combination of the Big Five
predicts long-term medical school success with an overall vali-dity of adjusted R � .56.
Attrition: Comparing Persisters and Leavers
Table 3 presents the standardized mean differences betweenpersisters and leavers in terms of Big Five dimension and facetscores as well as in terms of GPA. The table is organized to presentsample sizes of persisters (n1) and leavers (n2), d values, and 90%confidence intervals associated with each d value by academicyear in medical school. For example, Year 2 data contrast thosewho stayed to the second year with those who left prior to the startof the second year (i.e., those who left during or at the end of Year1). The numbers of leavers after the third year of medical schoolare too small to warrant discussion. The sample sizes of leavers forYears 1, 2, 3, 4, 5, and 6 are 203, 55, 22, 11, 19, and 1,respectively. Thus, we report, discuss, and interpret personalitydifferences only for Year 2 persisters versus Year 1 leavers, Year3 persisters versus Year 2 leavers, and Year 4 persisters versusYear 3 leavers.
The largest difference between leavers and persisters was interms of GPA for those who persevered to Year 2 compared withthose leaving during or at the end of Year 1 (d � .96). The GPAof the two groups differed by almost a standard deviation, con-firming that early on the primary reason for attrition is pooracademic performance. It is interesting that differences betweenpersisters and leavers on GPA were much more modest and in theopposite direction for years after the first year. That is, in subse-quent years the GPAs of leavers were slightly higher than those ofpersisters. As such, after the first year in medical school, poorgrades do not appear to be the primary cause for attrition.
Personality differences between persisters and leavers were neg-ligible to modest. Across the years, few effect sizes were greaterthan .15, with associated 90% confidence interval not excludingzero. Focusing on differences between medical students in Year 2and those who left prior to Year 2, there were small differences interms of conscientiousness (d � .18) and conscientiousness facetscales of achievement and self-discipline (ds � .20 and .22,respectively). Medical students persisting to Year 2 were some-what higher in terms of conscientiousness. They were also lessgregarious (d � –.19), and less open to actions and values (ds �–.24 for both). Personality differences between medical students in
Table 2Results of Regression Analyses for Big Five Factors
Variable
Year 1(N � 608)
Year 2(N � 405)
Year 3(N � 353)
Year 4(N � 339)
Year 5(N � 334)
Year 6(N � 307)
Year 7(N � 306)
Adj.R
Adj.R2 �
Adj.R
Adj.R2 �
Adj.R
Adj.R2 �
Adj.R
Adj.R2 �
Adj.R
Adj.R2 �
Adj.R
Adj.R2 �
Adj.R
Adj.R2 �
Model .22 .05 .46 .21 .44 .20 .40 .16 .56 .32 .57 .32 .56 .32Neuroticism .06 .11 .09 .12 .09 .07 .11Extraversion �.13 �.09 �.05 .08 .11 .14 .22Openness .08 .21 .31 .28 .38 .33 .21Agreeableness �.06 �.06 �.19 �.13 �.04 �.16 �.03Conscientiousness .22 .45 .39 .31 .39 .46 .46
Note. The range restriction corrected matrices served as input for the regression analyses. N � sample size in a given year; Adj. R � adjusted multiplecorrelation; Adj. R2 � adjusted squared multiple correlation; � � standardized regression coefficient.
1525INCREASING VALIDITIES OF PERSONALITY SCALES

Year 3 and those who left prior to Year 3 were about the samemagnitude. There were modest differences in conscientiousness(d � .23) and agreeableness (d � .27). Several conscientiousnessand agreeableness facet scales also distinguished between persis-ters and leavers, although the associated effect sizes were modest.These results suggest that even by Year 2, characteristics thatrelate to interpersonal interactions, such as agreeableness, relate toattrition. Contrary to our expectations, neuroticism was not relatedto attrition. While some modest group differences were foundbetween Year 4 persisters and dropouts, the group of dropouts atthat point was too small to conclude with certainty that the ob-served effect sizes would replicate in other settings.
In sum, the first year in medical school appears to act as anacademic-achievement-driven weed-out mechanism. Personalitycharacteristics associated with this effect are conscientiousnessand openness to experience. Later attrition in medical school
appears not to be primarily academic performance based. Person-ality characteristics associated with agreeableness, particularlytrust and tender-mindedness, differentiate persisters from leavers.Conceptually then, early attrition (Year 1 to 2) is explained by poorgrades, low conscientiousness, and high openness. Later attrition(Year 2 to 3) is associated with lower conscientiousness as well asagreeableness.
Discussion
The long-term predictive validity of personality traits is rarelystudied and reported. Previous research has examined the relation-ships between personality variables and extrinsic and intrinsiccareer success (Judge et al., 1999), but similar long-term investi-gations have not been carried out for academic performance. Assuch, our study fills a void in this area. We examined the longi-
Table 3Predicting Attrition: Comparison of Persisters and Leavers
Variable
Year 2 persisters � leavers Year 3 persisters � leavers Year 4 persisters � leavers
n1 n2 d 90% CISDper/SDleav n1 n2 d 90% CI
SDper/SDleav n1 n2 d 90% CI
SDper/SDleav
GPA 608 203 0.96 0.82, 1.10 1.14 405 55 �0.19 �0.42, 0.05 2.13 353 22 �0.37 �0.73, �0.01 1.86Neuroticism 608 203 0.13 �0.01, 0.26 0.89 405 55 0.05 �0.19, 0.28 1.29 353 22 �0.11 �0.47, 0.25 1.27
Anxiety 608 203 0.15 0.01, 0.28 0.97 405 55 0.19 �0.05, 0.43 1.21 353 22 �0.26 �0.62, 0.10 1.03Angry Hostility 608 203 0.15 0.02, 0.29 0.96 405 55 �0.15 �0.39, 0.08 1.02 353 22 0.17 �0.19, 0.53 1.08Depression 608 203 0.11 �0.03, 0.24 0.96 405 55 0.07 �0.17, 0.30 1.25 353 22 �0.16 �0.52, 0.20 1.08Self-Consciousness 608 203 0.10 �0.04, 0.23 0.96 405 55 0.13 �0.11, 0.36 1.24 353 22 0.17 �0.19, 0.53 0.95Impulsiveness 608 203 �0.02 �0.15, 0.11 1.02 405 55 �0.14 �0.38, 0.09 1.14 353 22 �0.16 �0.52, 0.20 1.00Vulnerability 608 203 0.06 �0.07, 0.19 0.89 405 55 0.08 �0.16, 0.31 1.34 353 22 �0.19 �0.55, 0.17 1.01
Extraversion 608 203 �0.14 �0.27, �0.01 1.01 405 55 �0.08 �0.31, 0.16 1.13 353 22 �0.06 �0.42, 0.30 0.78Warmth 608 203 �0.13 �0.27, 0.00 0.99 405 55 0.06 �0.18, 0.29 1.20 353 22 �0.17 �0.53, 0.19 0.78Gregariousness 608 203 �0.19 �0.32, �0.06 1.07 405 55 �0.04 �0.28, 0.19 1.17 353 22 0.09 �0.27, 0.45 0.79Assertiveness 608 203 �0.02 �0.15, 0.11 0.93 405 55 �0.25 �0.49, �0.01 1.06 353 22 �0.29 �0.65, 0.07 1.00Activity 608 203 0.00 �0.13, 0.14 1.06 405 55 �0.04 �0.27, 0.20 1.05 353 22 �0.16 �0.52, 0.20 0.76Excitement-Seeking 608 203 �0.15 �0.29, �0.02 1.20 405 55 �0.08 �0.32, 0.15 1.00 353 22 0.46 0.10, 0.82 0.77Positive Emotions 608 203 �0.08 �0.21, 0.05 1.01 405 55 0.06 �0.17, 0.30 1.15 353 22 �0.20 �0.56, 0.16 0.80
Openness 608 203 �0.09 �0.23, 0.04 1.00 405 55 0.15 �0.08, 0.39 1.16 353 22 �0.29 �0.65, 0.07 0.98Fantasy 608 203 �0.01 �0.14, 0.12 0.99 405 55 0.30 0.06, 0.53 1.08 353 22 �0.11 �0.47, 0.25 0.74Aesthetics 608 203 0.05 �0.09, 0.18 0.98 405 55 �0.14 �0.37, 0.10 1.14 353 22 �0.23 �0.59, 0.13 1.16Feelings 608 203 �0.05 �0.18, 0.09 0.90 405 55 0.13 �0.11, 0.36 1.00 353 22 �0.13 �0.49, 0.23 0.80Actions 608 203 �0.24 �0.38, �0.11 0.99 405 55 �0.06 �0.30, 0.17 1.13 353 22 �0.38 �0.74, �0.02 1.01Ideas 608 203 0.03 �0.11, 0.16 1.04 405 55 0.06 �0.17, 0.30 1.11 353 22 �0.18 �0.55, 0.18 1.08Values 608 203 �0.24 �0.37, �0.10 0.97 405 55 0.38 0.14, 0.61 1.11 353 22 �0.11 �0.47, 0.25 0.88
Agreeableness 608 203 �0.06 �0.19, 0.07 0.97 405 55 0.27 0.03, 0.50 0.94 353 22 �0.11 �0.47, 0.25 1.17Trust 608 203 �0.12 �0.25, 0.01 0.94 405 55 0.25 0.01, 0.49 1.00 353 22 0.04 �0.32, 0.40 1.18Straightforwardness 608 203 0.00 �0.13, 0.14 0.90 405 55 0.14 �0.09, 0.38 0.93 353 22 �0.25 �0.61, 0.11 1.06Altruism 608 203 �0.11 �0.24, 0.03 0.95 405 55 0.18 �0.05, 0.42 1.22 353 22 �0.22 �0.58, 0.14 0.76Compliance 608 203 �0.02 �0.15, 0.11 1.01 405 55 0.22 �0.02, 0.45 0.91 353 22 �0.01 �0.37, 0.35 0.90Modesty 608 203 0.00 �0.14, 0.13 1.06 405 55 0.01 �0.23, 0.25 0.95 353 22 0.00 �0.36, 0.36 1.10Tender-Mindedness 608 203 �0.03 �0.16, 0.10 1.06 405 55 0.37 0.13, 0.60 0.94 353 22 �0.02 �0.38, 0.35 0.98
Conscientiousness 608 203 0.18 0.05, 0.31 0.90 405 55 0.23 0.00, 0.47 1.05 353 22 0.05 �0.31, 0.41 0.96Competence 608 203 0.13 �0.01, 0.26 0.95 405 55 0.09 �0.15, 0.33 1.12 353 22 0.16 �0.20, 0.52 0.98Order 608 203 0.07 �0.06, 0.20 0.99 405 55 �0.04 �0.28, 0.19 1.03 353 22 �0.08 �0.44, 0.28 0.92Dutifulness 608 203 0.10 �0.03, 0.23 0.99 405 55 0.28 0.05, 0.52 1.05 353 22 �0.10 �0.46, 0.26 0.90Achievement Striving 608 203 0.20 0.07, 0.34 0.98 405 55 0.16 �0.08, 0.39 1.06 353 22 0.05 �0.31, 0.41 0.72Self-Discipline 608 203 0.22 0.09, 0.36 0.92 405 55 0.32 0.08, 0.56 1.01 353 22 �0.02 �0.38, 0.34 1.01Deliberation 608 203 0.08 �0.05, 0.22 0.92 405 55 0.21 �0.03, 0.44 0.92 353 22 0.21 �0.15, 0.57 0.99
Note. Year 6–Year 7 comparison was not computed, as only one individual left after Year 6. Results of analyses for Years 5 and 6 are available fromStephan Dilchert on request. n1 � sample size for persisters; n2 � sample size for leavers; d � Cohen’s d value, mean difference in standard deviationunits; CI � confidence interval; SDper � standard deviation of group that persisted to a given year; SDleav � standard deviation for group that left beforea given year.
1526 LIEVENS, ONES, AND DILCHERT

tudinal validities of the Big Five personality dimensions and theirfacets for predicting academic performance as well as attrition inmedical school.
Results across seven years indicated that validities for extraver-sion, openness, agreeableness, and conscientiousness factor andfacet scales increased in predictive potency. Largest gains invalidity were obtained for extraversion, openness, and conscien-tiousness. Virtually constant, negligible validities were found forneuroticism. Conscientiousness, perhaps more so than any otherpersonality trait, is an increasing asset for medical students duringtheir education. Further, the results of this study suggest thatalthough there may be no advantages to being open to experienceand extraverted in terms of predicting early academic performance,these traits increasingly gain in importance later in an individual’sacademic experience in medical school and in applied settings.More generally, it is noticeable that predictors related to “gettingahead” (cf. Hogan & Holland, 2003) are predictive in the earlyyears (conscientiousness), whereas both getting ahead and “gettingalong” predictors are important in later years. For example, con-sider the validities for the facets warmth, feelings, and altruism(conceptually matched to getting along criteria) and assertiveness,activity, competence, achievement striving, and self-discipline (re-lated to getting ahead criteria). The former start out as negligible(or even negative) performance predictors and obtain good valid-ities in later years, whereas the latter set of facets start out as goodpredictors and predict performance even better in later years.
The increasing validities observed for personality scales seem tobe related to changes in the GPA criterion. Early GPA in profes-sional schools reflects interpersonal behaviors only to a modestdegree. Later GPA reflects successful applications of knowledge inpractice where interpersonal behaviors play a key role (as ininternship performance, interacting with patients, and so forth).3
Framing the nature of this criterion change in socioanalytic theory(Hogan & Holland, 2003), the getting ahead dimension seems tobe more important than the getting along dimension in the firstyear. Between the second and sixth years, there occurs a gradualchange. Although the getting ahead dimension stays important(eligibility for specialty studies is primarily contingent upon thegrades obtained in later years), the importance of clinical andinterpersonal work with actual patients in the later years shows thatthe getting along dimension is becoming increasingly prevalent.
There are implications of such a criterion change for prediction.For example, previous research has demonstrated that personalitycharacteristics such as empathy are more useful in predictingclinical performance than cognitive ability (Gough & Hall, 1975;Shen & Comrey, 1997; Spiegel, Smolen, & Hopfensperger, 1986;Turner et al., 1974). In a related field, dentistry, Chamberlain,Catano, and Cunningham (2005) suggested that
certain academic related competencies, such as time management,task organization, reading comprehension, memorization, test taking,and concentration, may be more critical to success during the first yearof dental school. As students progress through dental school, thecurriculum begins to include clinical interactions with patients andbehavioural skills such as verbal communication and empathy becomemore valuable. (p. 3)
Smithers, Catano, and Cunningham (2004) also demonstrated thatdifferent predictors were associated with performance in academicand clinical courses.
In addition to changes in the nature of the criterion, increasingvalidities can also be interpreted in the light of trait-activationtheory (see earlier discussion). Both explanations are viable andeven complementary. We know for a fact that the nature of theGPA criterion changed over time, shifting emphasis from anassessment of declarative knowledge acquisition to performance inapplied courses and internships. The fact that our specific hypoth-eses were supported only further strengthens the former explana-tion. The latter, trait-activation-based explanation also seems via-ble. Within professional education, performance settings becomeless and less structured as students venture into more complex,real-life settings (e.g., simulation-based evaluations or even long-term internships). It is likely that these weaker situations leavemore room for individual differences in personality to determinestudent behavior and thus predict performance variability.
It is intriguing to compare our results for personality with theresults typically obtained in the ability domain. In predictingacademic performance (i.e., undergraduate, graduate, and profes-sional school grades), cognitive ability tests have shown decliningvalidities over time (Humphreys, 1968; Humphreys & Taber,1973; Lin & Humphreys, 1977). Highest validities are reported foracademic performance in early semesters and years, and graduallydeclining validities are observed thereafter. The patterns found inthe ability domain are in direct contrast to those reported forpersonality variables in this study. As F. L. Schmidt et al. (1988)noted, the different nature of GPA criteria in different years mayalso account for the declining validities of cognitive ability tests.
As noted earlier, students who participated in this study alsocompleted cognitive ability measures as part of the admissionsprocess. The validation results for these tests have been reportedelsewhere (Lievens, 2004; Lievens et al., 2005; Lievens & Sackett,2007) and will be summarized only briefly here. To make resultscomparable, we used normative information from our applicantpool to correct observed correlations between the general mentalability test and the GPA criterion for restriction of range instudents’ predictor scores. We also conducted the same analysesfor the score composite used to make admissions decisions (gen-eral mental ability and situational judgment test). The level ofrange restriction was very consistent across the seven years; uvalues ranged from .81 to .82 (for the general mental ability testalone) and from .66 to .67 for the overall score composite. Parallelto the analyses reported for personality, we also corrected forrestriction of range in GPA using the u values reported in Appen-dix B. Operational validities for the general mental ability test andthe score composite varied across years (no systematic increase ordecrease was observed) but were generally in the .30 range (� �.33 for the general mental ability test and .39 for the overall scorecomposite in Year 7). Thus, at the end of the curriculum, thepredictive power of personality (see results for conscientiousness
3 During the review process, the question of whether changes in validityover time were linear or curvilinear in nature was also raised. The presentdataset, despite its longitudinal design, does not lend itself to investigatingthis question (curve estimation would be based on only 7 data points).However, while the trends of effect sizes across the seven years in our datacan be described as linear, it is conceivable that curvilinear effects could beobserved in other investigations, depending on potential changes in crite-rion measures used to validate the predictors in question.
1527INCREASING VALIDITIES OF PERSONALITY SCALES

as well as the Big Five factors as a set) was at least on par with thatof the cognitive ability measures.
Implications for Practice
Our results of personality factors being predictive for more distal,interpersonal criteria have immediate implications for broadeningmedical school admissions criteria and for making admissions deci-sions to professional education in general. These findings provide animportant message for universities seeking to diversify their admis-sions procedures. Performance in professional education (e.g., law,business administration, pharmacy, medical school) over the yearsbecomes less reliant on the acquisition of declarative knowledge andincorporates more strongly interpersonal and motivational qualities.Admission to professional education cannot be based on only one typeof predictor or on maximizing one type of criterion. As our dataclearly show, early attrition is based mostly on academic performancein a structured classroom setting. Cognitive ability will always be thebest predictor of knowledge acquisition and must be an integral partin selecting students who will be able to master the required material.However, to better predict and ensure the long-term success of indi-viduals in professional education, noncognitive characteristics mustbe assessed such that those selected persevere and make the most oftheir education. Thus, our findings of personality validities increasingover time are particularly relevant to contexts wherein high-endcognitive ability-based preselection of candidates has already takenplace.
Implications for Validation Research
In assessing the utility of personality measures for academic per-formance, relying on early grades in validation is likely to underes-timate the predictive value of this noncognitive predictor domain. Ourresults suggest that the true value of personality traits may be higherthan estimated by the values typically observed in concurrent andmost predictive validation studies. A previous quantitative summaryhas reported negligible validities for most Big Five factors in educa-tional settings (Hough, 1992). There were two exceptions: Emotionalstability and the achievement facet of conscientiousness predictedgrades with mean observed validities of .20 and .29, respectively. Ourfindings of higher and more pervasive validities for all Big Fivefactors (except neuroticism) and many specific facets stand in con-trast. We suspect an underestimation of validities due to cross-sectional or short-term validation designs reported in previous quan-titative summaries of operational validities of personality scales inpredicting academic success. Our results highlight the importance ofexamining validity longitudinally in educational contexts. Similarly,criteria used in validating personality measures in occupational set-tings should capture contributions of workers not just during the initialmonths they spend on the job (i.e., the honeymoon period) but duringa longer time span or even their entire tenure with the organization. Itcan be expected that we will obtain a more accurate estimate of thepredictive value of personality for job performance when validationstudies are designed so that noncognitive predictors have room todistinguish among performance of individuals once they are wellbeyond the honeymoon phase of their organizational tenure.
There are also implications for meta-analytic research. Whereasmeta-analyses have traditionally emphasized validity generalizationacross various local settings and samples, our study shows that va-
lidity generalization across different time periods might be as impor-tant in order to obtain an accurate estimate of the predictive validity ofpersonality.
Directions for Future Research
Our research examined the stability of criterion-related validi-ties of personality measures for medical school performance.Changing criteria in medical school were likely at the root of theincreasing validities we observed. Similarly intriguing would bethe exploration of temporal changes in the relationships betweenpersonality measures and job performance. Clearly, our findingsneed to be replicated in other settings. Nonetheless, there areconceptual reasons as well as promising empirical support from asmall sample study to expect that similar conclusions might ensuein the work domain. Theoretically, when tasks are well learned andemployees are in a “maintenance” job stage (Murphy, 1989), onemight expect personality determinants of performance to gainpredictive value. We believe it is important to also investigatewhether validity coefficients of personality traits exhibit similar ordifferential increases for different performance dimensions (taskperformance versus contextual performance) over time. The onlystudy to investigate these matters (Thoresen, Bradley, Bliese, &Thoresen, 2004) has not focused on behavior and performance buton a criterion not entirely under the control of employees beingmeasured. Thoresen and colleagues examined the relationshipbetween a Big Five personality inventory and sales, and founddifferent personality traits to be predictive of sales for maintenanceand transitional job stages. For employees at a maintenance jobstage, conscientiousness predicted sales and extraversion and con-scientiousness predicted sales growth (N � 99). For employees ata transitional job stage, agreeableness and openness predicted bothsales and sales growth (N � 48).
Another intriguing possibility is potential nonlinearity in effectsof personality over time. Conceptually, longitudinal changes inmagnitudes of criterion-related validities of personality variablesmay be expected when changes in tasks and situational demands inwork settings are experienced. Such changes might create variousconfigurations of curvilinear relationships between time and per-sonality scale validities. Future research, if based on many moretemporal data points and conducted over longer periods of time,will have the opportunity to start exploring such effects.
So far, there is a scant and fragmented literature documentingincreases in validity of personality-based measures (assessmentcenter dimensions, competencies, etc.) using longitudinal designs.Hinrichs (1978) reported that aggressiveness measured duringassessment center exercises predicted organizational level betterafter 8 years on the job than earlier. Other studies (Dodd et al.,1970; Helmreich et al., 1986; Singh, 1978) all reported higherlong-term validities of specific personality scales for job perfor-mance. Perhaps most relevant to the results reported in this re-search, Jansen and Stoop (2001) found that the assessment centerdimension of interpersonal effectiveness showed validity onlyafter a number of years on the job. Similarly, in a study of 98executives, Russell (2001) reported that “people-oriented” compe-tencies were more predictive of later performance than “resourceproblem-solving oriented” competencies. Thus, there are indica-tions that personality-based measures are likely to show increasesin predictive validities over time in work settings as well.
1528 LIEVENS, ONES, AND DILCHERT
Conclusions
Despite the large amount of evidence supporting their appliedvalue in both work and educational settings (Barrick et al., 2001;Burch & Anderson, 2008; De Raad & Schouwenburg, 1996;Ferguson et al., 2000; Gough, 1964; Hough, 1992; Hough, Eaton,Dunnette, Kamp, & McCloy, 1990; Ones, Dilchert, Viswesvaran,& Judge, 2007; Salgado, 2003), personality variables are some-times criticized for having modest predictive validities. A varietyof reasons have been suggested. Among these are poor predictor–criterion matching in validation studies (Hough, 1992, 1998),various arguments around bandwidth-fidelity trade-off (Hogan &Holland, 2003; Ones & Viswesvaran, 1996; R. J. Schneider,Hough, & Dunnette, 1996), and predictive inefficiencies of non-Big Five scales (Hurtz & Donovan, 2000). Another key reason forseemingly modest validities of Big Five personality scales may bethat validation studies are often conducted with only limited timeframes. Few studies have focused on the long-term validity ofpersonality scales in predicting success in occupational and edu-cational settings. This study showed that in medical education,validation of personality measures against early criteria underes-timates their true validity and utility. We would like to suggest thepossibility that the true value of personality traits is amplified inthe long run in occupational settings as well. Large-scale investi-gations of Big Five traits and their facets in predicting long-termjob performance are called for.
References
Ackerman, P. L. (1987). Individual differences in skill learning: An inte-gration of psychometric and information processing perspectives. Psy-chological Bulletin, 102, 3–27.
Alexander, R. A., Carson, K. P., Alliger, G. M., & Carr, L. (1987).Correcting doubly truncated correlations: An improved approximationfor correcting the bivariate normal correlation when truncation hasoccurred on both variables. Educational and Psychological Measure-ment, 47, 309–315.
Alvares, K. M., & Hulin, C. L. (1972). Two explanations of temporalchanges in ability-skill relationships: A literature review and theoreticalanalysis. Human Factors, 14, 295–308.
Barratt, E. S., & White, R. (1969). Impulsiveness and anxiety related tomedical students’ performance and attitudes. Journal of Medical Edu-cation, 44, 604–607.
Barrett, G. V., & Alexander, R. A. (1989). Rejoinder to Austin, Hum-phreys, and Hulin: Critical reanalysis of Barrett, Caldwell, and Alex-ander. Personnel Psychology, 42, 597–612.
Barrett, G. V., Caldwell, M. S., & Alexander, R. A. (1985). The concept ofdynamic criteria: A critical reanalysis. Personnel Psychology, 38, 41–56.
Barrett, G. V., Phillips, J. S., & Alexander, R. A. (1981). Concurrent andpredictive validity designs: A critical reanalysis. Journal of AppliedPsychology, 66, 1–6.
Barrick, M. R., & Mount, M. K. (1991). The Big Five personality dimensionsand job performance: A meta-analysis. Personnel Psychology, 44, 1–26.
Barrick, M. R., Mount, M. K., & Judge, T. A. (2001). Personality andperformance at the beginning of the new millennium: What do we knowand where do we go next? International Journal of Selection andAssessment, 9, 9–30.
Bass, B. M. (1962). Mood changes during training laboratory. Journal ofApplied Psychology, 46, 361–364.
Blickle, G. (1996). Personality traits, learning strategies, and performance.European Journal of Personality, 10, 337–352.
Bray, D. W., & Howard, A. (1983). The AT&T longitudinal study of
managers. In K. W. Schaie (Ed.), Longitudinal studies of adult psycho-logical development (pp. 112–146). New York: Guilford Press.
Broadbent, D. E. (1958). Perception and communication. Elmsford, NY:Pergamon Press.
Burch, G. S. J., & Anderson, N. (2008). Personality as a predictor ofwork-related behavior and performance: Recent advances and directionsfor future research. In G. P. Hodgkinson & J. K. Ford (Eds.), Interna-tional review of industrial and organizational psychology (Vol. 23, pp.261–305). Hoboken, NJ: Wiley.
Busato, V. V., Prins, F. J., Elshout, J. J., & Hamaker, C. (2000). Intellectualability, learning style, personality, achievement motivation and aca-demic success of psychology students in higher education. Personalityand Individual Differences, 29, 1057–1068.
Campbell, J. P., & Knapp, D. J. (Eds.). (2001). Exploring the limits inpersonnel selection and classification. Mahwah, NJ: Erlbaum.
Campbell, J. P., McCloy, R. A., Oppler, S. H., & Sager, C. E. (1993). Atheory of performance. In N. Schmitt & W. C. Borman (Eds.), Personnelselection in organizations (pp. 35–70). San Francisco: Jossey-Bass.
Caspi, A., Roberts, B. W., & Shiner, R. L. (2005). Personality develop-ment: Stability and change. Annual Review of Psychology, 56, 453–484.
Cattell, R. B., & Kline, P. (1977). The scientific analysis of personality andmotivation. Oxford, England: Academic Press.
Chamberlain, T. C., Catano, V. M., & Cunningham, D. P. (2005). Personalityas a predictor of professional behavior in dental school: Comparisons withdental practitioners. Journal of Dental Education, 69, 1222–1237.
Chamorro-Premuzic, T., & Furnham, A. (2003). Personality predicts aca-demic performance: Evidence from two longitudinal university samples.Journal of Research in Personality, 37, 319–338.
Cohen, J. (1977). Statistical power analysis for the behavioral sciences.San Diego: Academic Press.
Costa, P. T., & McCrae, R. R. (1992). The revised NEO PersonalityInventory (NEO PI-R) and NEO Five-Factor Inventory (NEO-FFI)professional manual. Odessa, FL: Psychological Assessment Resources.
Curry, R. H., & Makoul, G. (1998). The evolution of courses in profes-sional skills and perspectives for medical students. Academic Medicine,73, 10–13.
Deadrick, D. L., & Madigan, R. M. (1990). Dynamic criteria revisited: Alongitudinal study of performance stability and predictive validity. Per-sonnel Psychology, 43, 717–744.
De Fruyt, F., & Mervielde, I. (1998). The assessment of the Big Five in theDutch language domain. Psychologica Belgica, 38, 1–22.
De Raad, B. (1996). Personality traits in learning and education. EuropeanJournal of Personality, 10, 185–200.
De Raad, B., & Schouwenburg, H. C. (1996). Personality in learning andeducation: A review. European Journal of Personality, 10, 303–336.
Dodd, W. E., Wollowick, H. B., & McNamara, W. J. (1970). Taskdifficulty as a moderator of long-range prediction. Journal of AppliedPsychology, 54, 265–270.
Dudley, N. M., Orvis, K. A., Lebiecki, J. E., & Cortina, J. M. (2006). Ameta-analytic investigation of conscientiousness in the prediction of jobperformance: Examining the intercorrelations and the incremental va-lidity of narrow traits. Journal of Applied Psychology, 91, 40–57.
Dunham, R. B. (1974). Ability-skill relationships: An empirical explana-tion of change over time. Organizational Behavior and Human Perfor-mance, 12, 372–382.
Dusek, T., & Bates, T. (2003). Analysis of European medical schools’teaching programs. Croatian Medical Journal, 44, 26–31.
Entwistle, N. J., & Entwistle, D. (1970). The relationships between per-sonality, study methods and academic performance. British Journal ofEducational Psychology, 40, 132–143.
Eysenck, H. J. (1967). Personality patterns in various groups of business-men. Occupational Psychology, 41, 249–250.
Eysenck, H. J. (1992). Personality and education: The influence of extra-
1529INCREASING VALIDITIES OF PERSONALITY SCALES

version, neuroticism and psychoticism. Zeitschrift fur PadagogischePsychologie, 6, 133–144.
Ferguson, E., Sanders, A., O’Hehir, F., & James, D. (2000). Predictivevalidity of personal statements and the role of the five-factor model ofpersonality in relation to medical training. Journal of Occupational andOrganizational Psychology, 73, 321–344.
Fraley, R., & Roberts, B. W. (2005). Patterns of continuity: A dynamic model forconceptualizing the stability of individual differences in psychological con-structs across the life course. Psychological Review, 112, 60–74.
Furnham, A., & Medhurst, S. (1995). Personality correlates of academicseminar behaviour: A study of four instruments. Personality and Indi-vidual Differences, 19, 197–208.
Furnham, A., & Mitchell, J. (1991). Personality, needs, social skills andacademic achievement: A longitudinal study. Personality and IndividualDifferences, 12, 1067–1073.
Ghiselli, E. E. (1956). Dimensional problems of criteria. Journal of AppliedPsychology, 40, 1–4.
Ghiselli, E. E., & Haire, M. (1960). The validation of selection tests in thelight of the dynamic character of criteria. Personnel Psychology, 13,225–231.
Goff, M., & Ackerman, P. L. (1992). Personality-intelligence relations:Assessment of typical intellectual engagement. Journal of EducationalPsychology, 84, 537–552.
Goh, D. S., & Moore, C. (1978). Personality and academic achievement inthree educational levels. Psychological Reports, 43, 71–79.
Gough, H. G. (1964). Academic achievement in high school as predictedfrom the California Psychological Inventory. Journal of EducationalPsychology, 55, 174–180.
Gough, H. G., Bradley, P., & McDonald, J. S. (1991). Performance ofresidents in anesthesiology as related to measures of personality andinterests. Psychological Reports, 68, 979–994.
Gough, H. G., & Hall, W. B. (1975). An attempt to predict graduation frommedical school. Journal of Medical Education, 50, 940–950.
Griffin, B., & Hesketh, B. (2004). Why openness to experience is not agood predictor of job performance. International Journal of Selectionand Assessment, 12, 243–251.
Grover, P. L., & Smith, D. U. (1981). Academic anxiety, locus of control,and achievement in medical school. Journal of Medical Education, 56,727–736.
Guttman, L. (1955). A generalized simplex for factor analysis. Psy-chometrika, 20, 173–192.
Hedges, L. V., & Olkin, I. (1985). Statistical methods for meta-analysis.San Diego: Academic Press.
Helmreich, R. L., Sawin, L. L., & Carsrud, A. L. (1986). The honeymooneffect in job performance: Temporal increases in the predictive power ofachievement motivation. Journal of Applied Psychology, 71, 185–188.
Hinrichs, J. R. (1978). An eight-year follow-up of a management assess-ment center. Journal of Applied Psychology, 63, 596–601.
Hoekstra, H. A., Ormel, J., & De Fruyt, F. (1996). NEO persoonlijkheids-vragenlijsten NEO PI-R en NEO-FFI. Lisse, The Netherlands: Swets &Zeitlinger.
Hogan, J., & Holland, B. (2003). Using theory to evaluate personality andjob-performance relations: A socioanalytic perspective. Journal of Ap-plied Psychology, 88, 100–112.
Hough, L. M. (1992). The “Big Five” personality variables—construct con-fusion: Description versus prediction. Human Performance, 5, 139–155.
Hough, L. M. (1998). The millennium for personality psychology: Newhorizons or good ole daze. Applied Psychology: An International Re-view, 47, 233–261.
Hough, L. M., Eaton, N. K., Dunnette, M. D., Kamp, J. D., & McCloy,R. A. (1990). Criterion-related validities of personality constructs andthe effect of response distortion on those validities. Journal of AppliedPsychology, 75, 581–595.
Hough, L. M., & Ones, D. S. (2001). The structure, measurement, validity,
and use of personality variables in industrial, work, and organizationalpsychology. In N. Anderson, D. S. Ones, H. K. Sinangil, & C. Viswes-varan (Eds.), Handbook of industrial, work, and organizational psychol-ogy: Vol. 1. Personnel psychology (pp. 233–277). London: Sage.
Humphreys, L. G. (1960). Investigations of the simplex. Psychometrika,25, 313–323.
Humphreys, L. G. (1968). The fleeting nature of the prediction of collegeacademic success. Journal of Educational Psychology, 59, 375–380.
Humphreys, L. G., & Taber, T. (1973). Postdiction study of the GraduateRecord Examination and eight semesters of college grades. Journal ofEducational Measurement, 10, 179–184.
Hunter, J. E., & Schmidt, F. L. (2004). Methods of meta-analysis. Thou-sand Oaks, CA: Sage.
Hurtz, G. M., & Donovan, J. J. (2000). Personality and job performance:The Big Five revisited. Journal of Applied Psychology, 85, 869–879.
Jansen, P. G. W., & Stoop, B. A. M. (2001). The dynamics of assessmentcenter validity: Results of a 7-year study. Journal of Applied Psychol-ogy, 86, 741–753.
Jenkins, J. G. (1946). Validity for what? Journal of Consulting Psychology,10, 93–98.
Johnson, D. G., & Hutchins, E. B. (1966). Doctor or dropout? A study ofmedical student attrition. Journal of Medical Education, 41, 1099–1269.
Johnson, J. A. (1994). Clarification of Factor Five with the help of theAB5C model. European Journal of Personality, 8, 311–334.
Judge, T. A., Erez, A., Bono, J. E., & Thoresen, C. J. (2002). Are measuresof self-esteem, neuroticism, locus of control, and generalized self-efficacy indicators of a common core construct? Journal of Personalityand Social Psychology, 83, 693–710.
Judge, T. A., Higgins, C. A., Thoresen, C. J., & Barrick, M. R. (1999). TheBig Five personality traits, general mental ability, and career successacross the life span. Personnel Psychology, 52, 621–652.
Keil, C. T., & Cortina, J. M. (2001). Degradation of validity over time: Atest and extension of Ackerman’s model. Psychological Bulletin, 127,673–697.
Kling, K. C. (2001, July). The role of personality, academic ability, andgender in predicting academic achievement. Paper presented at themeeting of the International Society for the Study of Individual Differ-ences, Edinburgh.
Knehr, C. A., & Kohl, R. N. (1959). MMPI screening of entering medical students.Journal of Psychology: Interdisciplinary and Applied, 47, 297–304.
Knights, J. A., & Kennedy, B. J. (2007). Medical school selection: Impactof dysfunctional tendencies on academic performance. Medical Educa-tion, 41, 362–368.
Kuncel, N. R., Hezlett, S. A., & Ones, D. S. (2001). A comprehensivemeta-analysis of the predictive validity of the Graduate Record Exam-inations: Implications for graduate student selection and performance.Psychological Bulletin, 127, 162–181.
Laidlaw, T. S., MacLeod, H., Kaufman, D. M., Langille, D. B., & Sargeant,J. (2002). Implementing a communication skills programme in medicalschool: Needs assessment and programme change. Medical Education,36, 115–124.
Lathey, J. W. (1991). Temperament style as a predictor of academic achievementin early adolescence. Journal of Psychological Type, 22, 52–58.
LePine, J. A., Colquitt, J. A., & Erez, A. (2000). Adaptability to changingtask contexts: Effects of general cognitive ability, conscientiousness, andopenness to experience. Personnel Psychology, 53, 563–593.
Lievens, F. (2004). Longitudinal study of the validity of different cognitiveability tests in a student admission context. Applied H. R. M. Research,9, 27–30.
Lievens, F., Buyse, T., & Sackett, P. R. (2005). The operational validity ofa video-based situational judgment test for medical college admissions:Illustrating the importance of matching predictor and criterion constructdomains. Journal of Applied Psychology, 90, 442–452.
Lievens, F., Chasteen, C. S., Day, E. A., & Christiansen, N. D. (2006).
1530 LIEVENS, ONES, AND DILCHERT

Large-scale investigation of the role of trait activation theory for under-standing assessment center convergent and discriminant validity. Jour-nal of Applied Psychology, 91, 247–258.
Lievens, F., Coetsier, P., De Fruyt, F., & De Maeseneer, J. (2002). Medicalstudents’ personality characteristics and academic performance: A five-factor model perspective. Medical Education, 36, 1050–1056.
Lievens, F., & Sackett, P. R. (2007). Situational judgment tests in high-stakes settings: Issues and strategies with generating alternate forms.Journal of Applied Psychology, 92, 1043–1055.
Lin, P.-C., & Humphreys, L. G. (1977). Predictions of academic perfor-mance in graduate and professional school. Applied Psychological Mea-surement, 1, 249–257.
Lipton, A. (1988). Predictors of success in a cohort of medical students.Medical Education, 18, 203–210.
Lipton, A., Huxham, G., & Hamilton, D. (1984). School results as predic-tors of medical school achievement. Medical Education, 22, 381–388.
Lunneborg, C. E., & Lunneborg, P. W. (1970). Relations between aptitudechanges and academic success during college. Journal of EducationalPsychology, 61, 169–173.
Marley, J., & Carman, I. (1999). Selecting medical students: A case reportof the need for change. Medical Education, 33, 455–459.
McCrae, R. R. (1996). Social consequences of experiential openness.Psychological Bulletin, 120, 323–337.
McHenry, J. J., Hough, L. M., Toquam, J. L., Hanson, M. A., & Ashworth,S. (1990). Project A validity results: The relationship between predictorand criterion domains. Personnel Psychology, 43, 335–354.
Murphy, K. R. (1989). Is the relationship between cognitive ability and jobperformance stable over time? Human Performance, 2, 183–200.
Ones, D. S., Dilchert, S., Viswesvaran, C., & Judge, T. A. (2007). Insupport of personality assessment in organizational settings. PersonnelPsychology, 60, 995–1027.
Ones, D. S., & Viswesvaran, C. (1996). Bandwidth-fidelity dilemma inpersonality measurement for personnel selection. Journal of Organiza-tional Behavior, 17, 609–626.
Paget, J. (1869). What becomes of medical students? St. Bartholomew’sHospital Report, 5, 238–242.
Roberts, B. W., & DelVecchio, W. F. (2000). The rank-order consistencyof personality traits from childhood to old age: A quantitative review oflongitudinal studies. Psychological Bulletin, 126, 3–25.
Rocklin, T. (1994). Relation between typical intellectual engagement andopenness: Comment on Goff and Ackerman (1992). Journal of Educa-tional Psychology, 86, 145–149.
Rolfhus, E. L., & Ackerman, P. L. (1999). Assessing individual differencesin knowledge: Knowledge, intelligence, and related traits. Journal ofEducational Psychology, 91, 511–526.
Russell, C. J. (2001). A longitudinal study of top-level executive perfor-mance. Journal of Applied Psychology, 86, 560–573.
Sackett, P. R., & Yang, H. (2000). Correction for range restriction: Anexpanded typology. Journal of Applied Psychology, 85, 112–118.
Salgado, J. F. (1997). The Five Factor Model of personality and jobperformance in the European Community. Journal of Applied Psychol-ogy, 82, 30–43.
Salgado, J. F. (1998). Big Five personality dimensions and job perfor-mance in Army and civil occupations: A European perspective. HumanPerformance, 11, 271–288.
Salgado, J. F. (2003). Predicting job performance using FFM and non-FFMpersonality measures. Journal of Occupational and Organizational Psy-chology, 76, 323–346.
Sanchez, M. M., Rejano, E. I., & Rodriguez, Y. T. (2001). Personality and
academic productivity in the university student. Social Behavior andPersonality, 29, 299–305.
Saucier, G. (1994). Mini-markers: A brief version of Goldberg’s unipolarBig-Five markers. Journal of Personality Assessment, 63, 506–516.
Savage, R. D. (1962). Personality factors and academic performance.British Journal of Educational Psychology, 32, 251–253.
Schmidt, F. L., Hunter, J. E., Outerbridge, A. N., & Goff, S. (1988). Jointrelation of experience and ability with job performance: Test of threehypotheses. Journal of Applied Psychology, 73, 46–57.
Schmidt, H. G., Machiels-Bongaerts, M., Hermans, H., ten Cate, T. J.,Venekamp, R., & Boshuizen, H. P. (1996). The development of diag-nostic competence: Comparison of a problem-based, an integrated, anda conventional medical curriculum. Academic Medicine, 71, 658–664.
Schneider, B. (1987). The people make the place. Personnel Psychology,40, 437–453.
Schneider, R. J., Hough, L. M., & Dunnette, M. D. (1996). Broadsided bybroad traits: How to sink science in five dimensions or less. Journal ofOrganizational Behavior, 17, 639–655.
Shen, H., & Comrey, A. L. (1997). Predicting medical students’ academicperformances by their cognitive abilities and personality characteristics.Academic Medicine, 72, 781–786.
Singh, S. (1978). Achievement motivation and entrepreneurial success: Afollow-up study. Journal of Research in Personality, 12, 500–503.
Smithers, S., Catano, V. M., & Cunningham, D. P. (2004). What predictsperformance in Canadian dental schools? Journal of Dental Education,68, 598–613.
Spiegel, D. A., Smolen, R. C., & Hopfensperger, K. A. (1986). Medicalstudent stress and clerkship performance. Journal of Medical Education,61, 929–931.
Stewart, G. L. (1999). Trait bandwidth and stages of job performance:Assessing differential effects for conscientiousness and its subtraits.Journal of Applied Psychology, 84, 959–968.
Sturman, M. C., & Trevor, C. O. (2001). The implications of linking thedynamic performance and turnover literatures. Journal of Applied Psy-chology, 86, 684–696.
Sussmann, M., & Robertson, D. U. (1986). The validity of validity: Ananalysis of validation study designs. Journal of Applied Psychology, 71,461–468.
Tett, R. P., & Burnett, D. D. (2003). A personality trait-based interactionistmodel of job performance. Journal of Applied Psychology, 88, 500–517.
Thoresen, C. J., Bradley, J. C., Bliese, P. D., & Thoresen, J. D. (2004). TheBig Five personality traits and individual job performance growth tra-jectories in maintenance and transitional job stages. Journal of AppliedPsychology, 89, 835–853.
Turner, E. V., Helper, M. M., & Kriska, S. D. (1974). Predictors of clinicalperformance. Journal of Medical Education, 49, 338–342.
Wiggins, N., Blackburn, M., & Hackman, J. R. (1969). Prediction offirst-year graduate success in psychology: Peer ratings. Journal of Ed-ucational Research, 63, 81–85.
Wolfe, R. N., & Johnson, S. D. (1995). Personality as a predictor of collegeperformance. Educational and Psychological Measurement, 55, 177–185.
Woodrow, H. (1938). The effect of practice on groups of different initialability. Journal of Educational Psychology, 29, 268–278.
Zeidner, M. (1995). Personality trait correlates of intelligence. In D. H.Saklofske & M. Zeidner (Eds.), International handbook of personalityand intelligence (pp. 299–319). New York: Plenum Press.
Zeidner, M., & Matthews, G. (2000). Intelligence and personality. In R. J.Sternberg (Ed.), Handbook of intelligence (pp. 581–610). New York:Cambridge University Press.
(Appendixes follow)
1531INCREASING VALIDITIES OF PERSONALITY SCALES

Appendix A
Descriptive Statistics for Predictor and Criterion Variables
Variable
Year 1(N � 608)
Year 2(N � 405)
Year 3(N � 353)
Year 4(N � 339)
Year 5(N � 334)
Year 6(N � 307)
Year 7(N � 306)
M SD M SD M SD M SD M SD M SD M SD
GPA 11.32 3.46 13.05 2.49 13.78 1.87 14.29 1.88 14.96 1.40 15.29 1.16 15.50 0.99Neuroticism 138.10 22.15 139.04 21.19 138.97 21.90 138.83 21.99 139.01 22.05 138.75 22.06 138.69 22.08
Anxiety 24.50 5.74 24.78 5.66 24.88 5.81 24.78 5.78 24.81 5.82 24.72 5.79 24.72 5.80Angry Hostility 20.94 4.68 21.18 4.61 21.04 4.63 21.12 4.64 21.17 4.63 21.09 4.60 21.06 4.58Depression 23.88 5.32 24.06 5.23 24.06 5.38 24.00 5.36 23.99 5.39 23.93 5.35 23.92 5.36Self-Consciousness 23.80 5.00 23.97 4.93 24.02 5.05 24.06 5.02 24.12 5.01 24.19 5.04 24.18 5.04Impulsiveness 25.42 4.69 25.39 4.72 25.28 4.78 25.24 4.76 25.22 4.80 25.22 4.88 25.21 4.88Vulnerability 19.57 4.89 19.67 4.68 19.68 4.84 19.63 4.80 19.70 4.89 19.60 4.93 19.61 4.93
Extraversion 166.08 19.91 165.15 19.97 164.96 20.29 164.99 19.83 164.79 20.49 164.63 20.63 164.55 20.61Warmth 29.63 4.29 29.43 4.27 29.49 4.36 29.44 4.24 29.36 4.35 29.43 4.44 29.43 4.45Gregariousness 28.50 5.16 28.17 5.26 28.14 5.36 28.19 5.25 28.11 5.37 28.14 5.38 28.13 5.39Assertiveness 23.65 5.37 23.62 5.24 23.43 5.28 23.37 5.28 23.52 5.25 23.41 5.28 23.37 5.25Activity 25.99 4.26 26.00 4.34 25.97 4.38 25.95 4.29 25.96 4.34 25.87 4.38 25.85 4.37Excitement-Seeking 27.46 4.83 27.21 5.08 27.15 5.08 27.29 4.95 27.21 4.98 27.19 4.99 27.19 5.00Positive Emotions 30.85 5.03 30.71 5.04 30.77 5.14 30.76 5.02 30.63 5.19 30.60 5.24 30.58 5.25
Openness 169.49 18.73 168.91 18.72 169.22 19.13 168.86 18.98 168.81 19.17 169.50 19.50 169.49 19.53Fantasy 27.97 5.43 27.96 5.42 28.16 5.45 28.10 5.30 28.07 5.33 28.21 5.40 28.21 5.41Aesthetics 28.99 5.72 29.07 5.69 28.91 5.82 28.84 5.86 28.85 5.90 28.95 5.96 28.96 5.97Feelings 30.06 4.54 29.99 4.38 30.06 4.41 30.04 4.31 30.02 4.37 30.02 4.41 30.01 4.41Actions 24.60 4.20 24.26 4.17 24.21 4.27 24.12 4.26 24.13 4.30 24.20 4.32 24.20 4.33Ideas 27.76 5.35 27.81 5.43 27.85 5.52 27.76 5.51 27.82 5.46 28.02 5.52 28.02 5.53Values 30.11 3.75 29.82 3.70 30.03 3.72 29.99 3.67 29.92 3.80 30.08 3.82 30.09 3.82
Agreeableness 170.04 19.47 169.64 19.27 170.41 19.07 170.13 19.34 169.51 19.41 169.91 19.42 170.00 19.38Trust 28.17 4.57 27.99 4.46 28.16 4.45 28.14 4.49 28.05 4.51 28.16 4.50 28.18 4.50Straightforwardness 27.81 5.48 27.82 5.29 27.92 5.24 27.82 5.25 27.69 5.20 27.79 5.19 27.81 5.19Altruism 30.25 3.84 30.11 3.77 30.22 3.85 30.14 3.75 30.02 3.83 29.99 3.82 29.98 3.83Compliance 24.07 4.62 24.04 4.64 24.19 4.58 24.15 4.57 24.03 4.51 24.05 4.51 24.08 4.48Modesty 29.02 4.78 29.01 4.87 29.05 4.84 29.03 4.87 28.99 4.87 29.06 4.91 29.08 4.91Tender-Mindedness 30.72 4.05 30.68 4.13 30.88 4.06 30.85 4.07 30.74 4.21 30.86 4.21 30.88 4.22
Conscientiousness 166.31 20.06 167.52 19.27 168.15 19.38 168.33 19.26 167.93 19.38 167.59 19.71 167.63 19.73Competence 28.19 3.55 28.34 3.49 28.39 3.54 28.44 3.51 28.40 3.55 28.38 3.56 28.39 3.56Order 25.56 4.97 25.68 4.95 25.65 5.00 25.67 4.99 25.64 4.95 25.36 4.91 25.36 4.92Dutifulness 30.29 4.34 30.43 4.33 30.61 4.34 30.58 4.28 30.49 4.31 30.51 4.38 30.51 4.39Achievement
Striving 29.20 4.52 29.51 4.48 29.59 4.52 29.60 4.41 29.53 4.50 29.51 4.54 29.49 4.54Self-Discipline 27.75 4.69 28.10 4.54 28.30 4.51 28.32 4.50 28.27 4.51 28.28 4.59 28.27 4.60Deliberation 25.32 4.91 25.46 4.77 25.62 4.72 25.72 4.69 25.61 4.70 25.56 4.73 25.60 4.67
1532 LIEVENS, ONES, AND DILCHERT
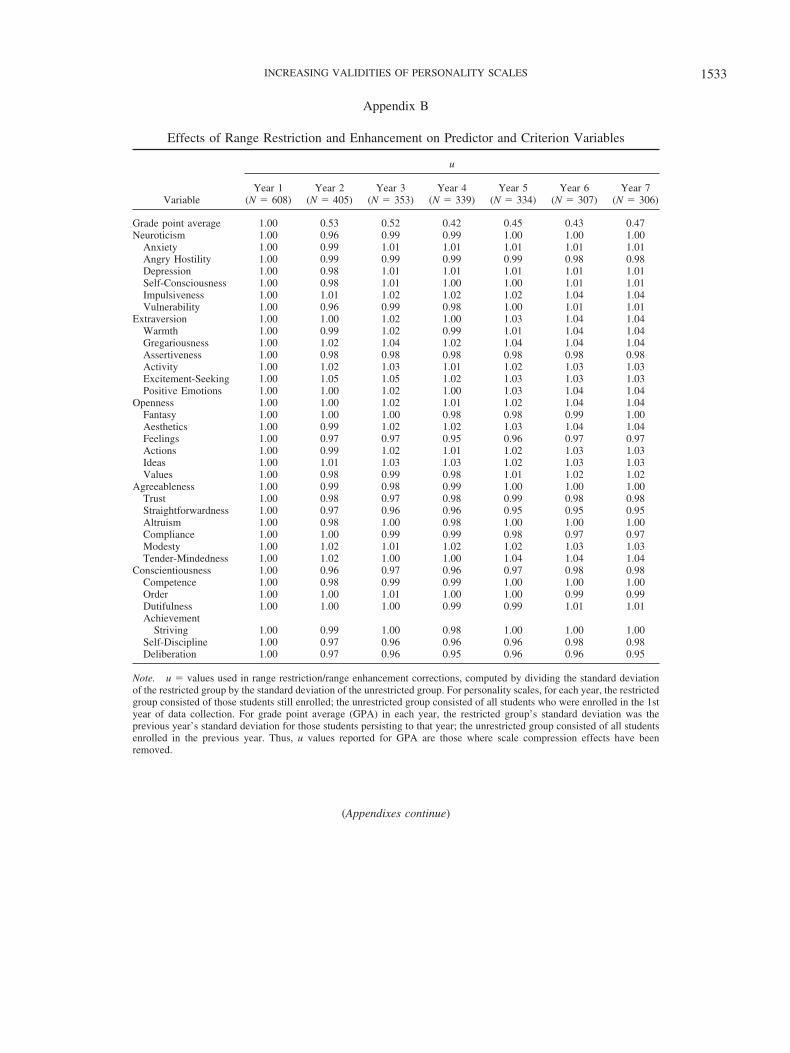
Appendix B
Effects of Range Restriction and Enhancement on Predictor and Criterion Variables
Variable
u
Year 1(N � 608)
Year 2(N � 405)
Year 3(N � 353)
Year 4(N � 339)
Year 5(N � 334)
Year 6(N � 307)
Year 7(N � 306)
Grade point average 1.00 0.53 0.52 0.42 0.45 0.43 0.47Neuroticism 1.00 0.96 0.99 0.99 1.00 1.00 1.00
Anxiety 1.00 0.99 1.01 1.01 1.01 1.01 1.01Angry Hostility 1.00 0.99 0.99 0.99 0.99 0.98 0.98Depression 1.00 0.98 1.01 1.01 1.01 1.01 1.01Self-Consciousness 1.00 0.98 1.01 1.00 1.00 1.01 1.01Impulsiveness 1.00 1.01 1.02 1.02 1.02 1.04 1.04Vulnerability 1.00 0.96 0.99 0.98 1.00 1.01 1.01
Extraversion 1.00 1.00 1.02 1.00 1.03 1.04 1.04Warmth 1.00 0.99 1.02 0.99 1.01 1.04 1.04Gregariousness 1.00 1.02 1.04 1.02 1.04 1.04 1.04Assertiveness 1.00 0.98 0.98 0.98 0.98 0.98 0.98Activity 1.00 1.02 1.03 1.01 1.02 1.03 1.03Excitement-Seeking 1.00 1.05 1.05 1.02 1.03 1.03 1.03Positive Emotions 1.00 1.00 1.02 1.00 1.03 1.04 1.04
Openness 1.00 1.00 1.02 1.01 1.02 1.04 1.04Fantasy 1.00 1.00 1.00 0.98 0.98 0.99 1.00Aesthetics 1.00 0.99 1.02 1.02 1.03 1.04 1.04Feelings 1.00 0.97 0.97 0.95 0.96 0.97 0.97Actions 1.00 0.99 1.02 1.01 1.02 1.03 1.03Ideas 1.00 1.01 1.03 1.03 1.02 1.03 1.03Values 1.00 0.98 0.99 0.98 1.01 1.02 1.02
Agreeableness 1.00 0.99 0.98 0.99 1.00 1.00 1.00Trust 1.00 0.98 0.97 0.98 0.99 0.98 0.98Straightforwardness 1.00 0.97 0.96 0.96 0.95 0.95 0.95Altruism 1.00 0.98 1.00 0.98 1.00 1.00 1.00Compliance 1.00 1.00 0.99 0.99 0.98 0.97 0.97Modesty 1.00 1.02 1.01 1.02 1.02 1.03 1.03Tender-Mindedness 1.00 1.02 1.00 1.00 1.04 1.04 1.04
Conscientiousness 1.00 0.96 0.97 0.96 0.97 0.98 0.98Competence 1.00 0.98 0.99 0.99 1.00 1.00 1.00Order 1.00 1.00 1.01 1.00 1.00 0.99 0.99Dutifulness 1.00 1.00 1.00 0.99 0.99 1.01 1.01Achievement
Striving 1.00 0.99 1.00 0.98 1.00 1.00 1.00Self-Discipline 1.00 0.97 0.96 0.96 0.96 0.98 0.98Deliberation 1.00 0.97 0.96 0.95 0.96 0.96 0.95
Note. u � values used in range restriction/range enhancement corrections, computed by dividing the standard deviationof the restricted group by the standard deviation of the unrestricted group. For personality scales, for each year, the restrictedgroup consisted of those students still enrolled; the unrestricted group consisted of all students who were enrolled in the 1styear of data collection. For grade point average (GPA) in each year, the restricted group’s standard deviation was theprevious year’s standard deviation for those students persisting to that year; the unrestricted group consisted of all studentsenrolled in the previous year. Thus, u values reported for GPA are those where scale compression effects have beenremoved.
(Appendixes continue)
1533INCREASING VALIDITIES OF PERSONALITY SCALES

Appendix C
Observed Correlations (robs) Between Big Five Factors and Facetsand Grade Point Average, by Year
Variable
robs
Year 1(N � 608)
Year 2(N � 405)
Year 3(N � 353)
Year 4(N � 339)
Year 5(N � 334)
Year 6(N � 307)
Year 7(N � 306)
Neuroticism .03 �.01 .00 .01 �.02 �.04 �.03Anxiety .06 .05 .01 .03 .00 �.02 .01Angry Hostility .03 �.04 .04 .02 �.03 .00 .00Depression .04 .00 .01 .00 �.02 .00 .00Self-Consciousness .04 .00 �.02 .01 �.04 �.08 �.07Impulsiveness �.05 �.05 �.03 �.02 .03 .00 �.03Vulnerability .01 �.01 �.04 �.01 �.05 �.08 �.06
Extraversion �.11 .00 .02 .06 .12 .12 .16Warmth �.08 .04 .03 .08 .13 .12 .17Gregariousness �.13 �.05 �.03 .02 .10 .02 .09Assertiveness .01 .05 .13 .13 .13 .17 .24Activity �.01 .02 .04 .07 .07 .07 .15Excitement-Seeking �.16 �.10 �.09 �.05 �.03 �.01 �.06Positive Emotions �.07 .04 .00 .02 .11 .12 .08
Openness .02 .10 .14 .13 .22 .17 .16Fantasy �.01 .04 .00 .01 .11 .08 �.01Aesthetics .04 .09 .18 .16 .21 .20 .18Feelings .01 .07 .07 .15 .19 .14 .14Actions �.09 �.03 .00 .00 .04 .06 .09Ideas .12 .13 .21 .14 .17 .14 .17Values �.06 .06 .03 .00 .12 .03 .04
Agreeableness �.01 .05 �.02 .01 .08 .02 .08Trust �.02 .06 .02 .01 .10 .03 .08Straightforwardness .06 .07 .04 .04 .10 .04 .11Altruism �.09 .02 �.01 .01 .05 .09 .14Compliance .05 .10 �.05 �.05 .01 �.03 .01Modesty �.06 �.07 �.07 �.02 �.02 �.03 �.04Tender-Mindedness �.02 .02 .01 .04 .09 .02 .07
Conscientiousness .18 .24 .18 .11 .18 .21 .25Competence .16 .14 .17 .08 .18 .21 .23Order .08 .12 .06 .01 .08 .11 .11Dutifulness .09 .14 .08 .09 .10 .10 .12Achievement
Striving .14 .20 .17 .16 .21 .25 .24Self-Discipline .22 .28 .21 .15 .20 .22 .26Deliberation .14 .16 .12 .00 .07 .07 .15
Note. N � sample size in a given year.
1534 LIEVENS, ONES, AND DILCHERT

Appendix D
Descriptive Statistics and Prediction of 7-Year Persisters’ Grade Point AverageAcross Years
Variable Year 1 Year 2 Year 3 Year 4 Year 5 Year 6 Year 7
MGPA 0.00 0.02 0.21 0.47 0.84 1.00 1.09SD 1.00 1.11 1.00 1.00 0.81 0.65 0.58Neuroticism �.04 �.04 �.03 �.03 �.02 �.03 �.04
Anxiety .02 .03 .02 .02 .01 �.02 .00Angry Hostility �.04 �.01 �.01 �.03 �.03 .04 �.01Depression �.02 .00 �.02 �.03 �.01 �.01 �.01Self-Consciousness �.07 �.09 �.06 �.04 �.06 �.06 �.07Impulsiveness �.04 �.04 �.05 �.03 .03 .01 �.04Vulnerability �.03 �.05 �.04 �.01 �.02 �.08 �.07
Extraversion �.05 .05 .02 .10 .16 .13 .17Warmth �.05 .04 .03 .09 .15 .11 .18Gregariousness �.09 �.03 �.03 .04 .09 .03 .09Assertiveness .13 .20 .14 .13 .21 .23 .24Activity �.02 .07 .02 .08 .08 .09 .15Excitement-Seeking �.11 �.09 �.10 �.03 �.01 �.03 �.06Positive Emotions �.09 .01 .03 .08 .14 .12 .09
Openness .13 .11 .14 .14 .20 .17 .16Fantasy �.02 .01 .02 .04 .10 .08 �.01Aesthetics .12 .15 .18 .18 .20 .19 .18Feelings .04 .06 .07 .16 .18 .16 .15Actions .04 .00 .00 .03 .05 .06 .09Ideas .26 .18 .22 .13 .16 .15 .17Values .05 �.01 .02 .00 .07 �.01 .03
Agreeableness �.01 .00 .00 .06 .07 �.02 .08Trust .03 .02 .04 .04 .11 �.01 .08Straightforwardness .07 .05 .05 .08 .08 .00 .11Altruism �.04 .01 .02 .05 .10 .08 .14Compliance .07 .07 �.02 .03 .01 �.07 .02Modesty �.10 �.10 �.09 �.01 �.05 �.04 �.04Tender-Mindedness �.10 �.06 .00 .06 .06 �.03 .06
Conscientiousness .16 .25 .21 .16 .21 .20 .26Competence .14 .18 .17 .12 .19 .20 .23Order .09 .14 .08 .05 .10 .11 .12Dutifulness .02 .10 .10 .12 .12 .09 .12Achievement
Striving .14 .24 .19 .17 .25 .28 .26Self-Discipline .23 .31 .24 .22 .22 .23 .27Deliberation .10 .15 .15 .03 .07 .01 .15
Note. MGPA � mean grade point average (GPA) for 7-year persisters (z score in terms of 1st-year GPA for that group);SD � standard deviation of GPA for the same group of persisters in standard score form. The remaining values arecorrelations between personality scales and GPA, corrected only for restriction and enhancement of range in personalityscores (for this sample of 7-year persisters, there was no attrition and thus no need to correct for range restriction in GPA).N � 297, based on complete listwise deletion on all variables.
Received June 16, 2008Revision received February 20, 2009
Accepted March 26, 2009 �
1535INCREASING VALIDITIES OF PERSONALITY SCALES