Embed Size (px)
Citation preview

Personalities and Public Sector Performance:Experimental Evidence from Pakistan
Michael Callen1 Saad Gulzar2
Ali Hasanain3 Yasir Khan4
Arman Rezaee5
1Harvard Kennedy School
2New York University
3Lahore University of Management Sciences
4International Growth Center
5University of California, San Diego
March 19, 2014

Partners and Collaborators
I Zubair Bhatti, World Bank
I Farasat Iqbal, Punjab Health Sector Reforms Program
I Asim Fayaz, World Bank/Technology for People Initiative
I International Growth Center (IGC)
1 / 35

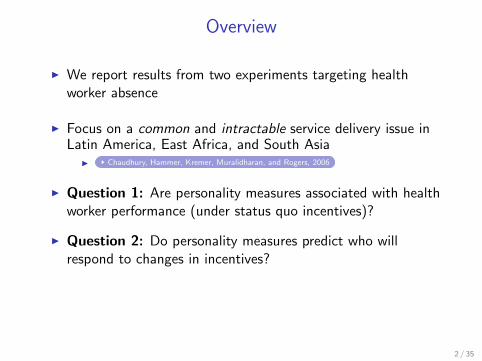
Overview
I We report results from two experiments targeting healthworker absence
I Focus on a common and intractable service delivery issue inLatin America, East Africa, and South Asia
I Chaudhury, Hammer, Kremer, Muralidharan, and Rogers, 2006
I Question 1: Are personality measures associated with healthworker performance (under status quo incentives)?
I Question 2: Do personality measures predict who willrespond to changes in incentives?
I Question 3: Do personality measures predict who will act oninformation?
2 / 35

Why intrinsic incentives?
I Governments (the primary source of services for the poor) arecomposed of people
I There is evidence that personalities measures predictperformance in the US, primarily in the private sector
I Personality measures rival or exceed IQ in terms of predictive power inseveral domains (Heckman, 2011)
I Several possible benefits:
1. Diagnostics and insights into bureaucratic decision-making
2. Profile of applicants responds to adjustable features of theposition (Dal Bo, Finan, Rossi, 2013)
3. Traits are malleable, providing an avenue for policy (Almund,Duckworth, Heckman, Kautz, 2011)
3 / 35

This Project
1. Experiment 1: implement a smartphone monitoring system
2. Experiment 2: make absence data salient to senior healthofficials
3. Measure Performance:
I doctor attendance
I health inspections
I collusion between inspectors and doctors
4. Measure Personality Traits:
I A large, representative sample of doctors in Punjab
I The universe of health inspectors in Punjab
I The universe of senior health officials in Punjab
4 / 35

Preview of Findings
1. Personality traits (Big 5 and Public Sector Motivation)positively predict doctor attendance and negatively predictwhether doctors collude with inspectors
2. Traits strongly predict responses to monitoring intervention
I one SD increase in Big 5 is associated with 27 percentage pointdifferential in attendance response
3. Personality traits strongly predict which senior officials act onreports of doctor absence
I one SD increase in Big 5 is associated with an additional 40 percentagepoint reduction in doctor absence
5 / 35

Outline
I. Introduction
II. Monitoring the Monitors
III. Research design
III. Traits and Public Sector Performance
V. Results
VI. Conclusion
6 / 35

Context: Punjab Department of Health
Health Secretary
Senior health officials (EDOs)(1 per district)
Health inspectors (DDOs)(1 per subdistrict)
Doctors (MOs)(1 per health clinic)
7 / 35

Rural Clinic Sample
8 / 35

Rural health clinics
9 / 35

Same data, new interface
Same data, new interface
10 / 35

Smartphones for health inspectors
11 / 35

Online dashboard—summary stats
12 / 35

Online dashboard—visit logs
13 / 35

Potential workers or shirkers
14 / 35

15 / 35

District-level randomization
16 / 35
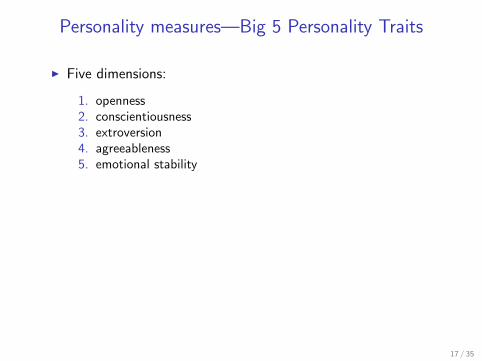
Personality measures—Big 5 Personality Traits
I Five dimensions:
1. openness2. conscientiousness3. extroversion4. agreeableness5. emotional stability
I Example statements:
I I like to be amongst lots of people.
I I don’t want to waste time day-dreaming.
I I try to be polite to everyone I meet.
I I keep all my things clean and tidy.
17 / 35
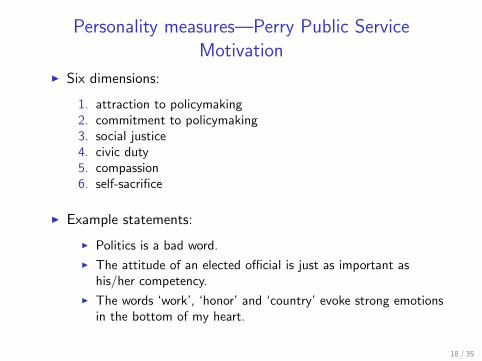
Personality measures—Perry Public ServiceMotivation
I Six dimensions:
1. attraction to policymaking2. commitment to policymaking3. social justice4. civic duty5. compassion6. self-sacrifice
I Example statements:
I Politics is a bad word.
I The attitude of an elected official is just as important ashis/her competency.
I The words ‘work’, ‘honor’ and ‘country’ evoke strong emotionsin the bottom of my heart.
18 / 35

I. Introduction
II. Monitoring the Monitors
III. Research design
III. Traits and Public Sector Performance
V. Results
VI. Conclusion
19 / 35

When will monitoring help?
θM1θM2
f (θ)
θ
Induced to work
or θM1θM2
f (θ)
θ
Induced to work
20 / 35

Doctor personality and doctor attendance
Social justiceSelf-sacrificeCompassionCommitment
Civic dutyAttraction
PSM index
OpennessEmotional stability
ExtroversionConscientiousness
AgreeablenessBig 5 index
Doct
or P
erso
nality
-.05 0 .05 .1 .15Standardized Regression Coefficient
Doctor Attendance (=1)
21 / 35

Doctor personality and doctor-inspector collusion
Social justiceSelf-sacrificeCompassionCommitment
Civic dutyAttraction
PSM index
OpennessEmotional stability
ExtroversionConscientiousness
AgreeablenessBig 5 index
Doct
or P
erso
nality
-.2 -.15 -.1 -.05 0Standardized Regression Coefficient
Doctor-Inspector Collusion (=1)
Tables
22 / 35

These measures have more predictive power than:
I Tenure in post
I Tenure in government
I Age
I Education
I other demographics
23 / 35

Results from Experiment 1
24 / 35

Context: Punjab Department of Health
Health Secretary
Senior health officials (EDOs)(1 per district)
Health inspectors (DDOs)(1 per subdistrict)
Doctors (MOs)(1 per health clinic)
25 / 35

Results
0.10
0.30
0.50
0.70
Perc
ent f
acilit
ies
visite
d by
DDO
Nov. 2011 June 2012 Oct. 2012Month
Control Treatment
26 / 35
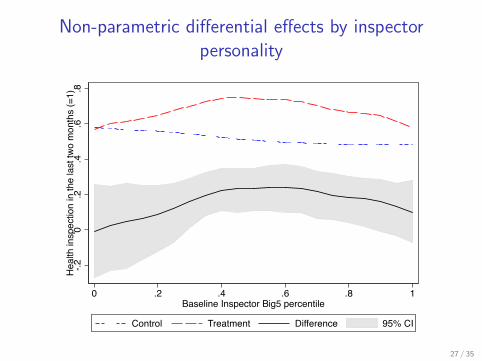
Non-parametric differential effects by inspectorpersonality
-.20
.2.4
.6.8
Hea
lth in
spec
tion
in th
e la
st tw
o m
onth
s (=
1)
0 .2 .4 .6 .8 1Baseline Inspector Big5 percentile
Control Treatment Difference 95% CI
27 / 35

Results from Experiment 2
28 / 35

Context: Punjab Department of Health
Health Secretary
Senior health officials (EDOs)(1 per district)
Health inspectors (DDOs)(1 per subdistrict)
Doctors (MOs)(1 per health clinic)
29 / 35
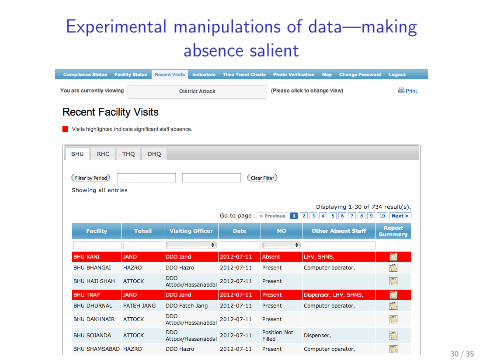
Experimental manipulations of data—makingabsence salient
30 / 35

0.2
.4.6
.81
Doc
tor a
bsen
ce s
ubse
quen
t vis
it
0 1 2 3 4 5 6Staff absent when inspected
Doctor absence after a dashboard flag
31 / 35

Differential clinic ‘flagging’ effects by senior healthofficer Big 5personality
Doctor absent (=1)(1) (2) (3) (4) (5) (6) (7)
Clinic flagged as underperforming on dashboard -0.146 -0.159 0.467 1.331 1.089 -1.012** 0.318(0.103) (0.113) (1.022) (0.843) (1.231) (0.490) (0.965)
Flagged x Big5 index -0.402**(0.200)
Flagged x Agreeableness -0.166(0.278)
Flagged x Conscientiousness -0.359*(0.202)
Flagged x Extroversion -0.322(0.318)
Flagged x Emotional stability -0.361*(0.205)
Flagged x Openness -0.157(0.326)
Mean of the dependent variable 0.480 0.480 0.480 0.480 0.480 0.480 0.480# Observations 123 123 123 123 123 123 123# Clinics 106 106 106 106 106 106 106R-Squared 0.204 0.231 0.206 0.227 0.211 0.219 0.205
Notes: *p < 0.1, **p < 0.05, ***p < 0.01. Standard errors clustered at the clinic level reported in parentheses. All regressions include districtand survey wave fixed effects. Clinics were flagged as underperforming if 3 or more of the 7 staff were absent in the last visit. All columns restrictthe sample to those clinics where only 2 or 3 staff were absent (up to 7 staff can be marked absent).
PSM table Full vs discontinuity samples
31 / 35

Senior health official time use by personalityShare senior official
time monitoring facilities(1) (2)
Number of clinics flagged as underperforming on dashboard 0.009 0.014***(0.006) (0.004)
# flagged x Big5 index 0.031*(0.016)
Mean of the dependent variable 0.097 0.097# Observations 17 17R-Squared 0.124 0.361
Notes: *p < 0.1, **p < 0.05, ***p < 0.01. Robust standard errors reported in parentheses. Sample limitedto senior health officials in treatment districts. Clinics were flagged as underperforming if 3 or more of the7 staff were absent. The number flagged is the total number of clinics flagged in each district priort to oursecond endline (when we also collected senior health official personality and time use). Each regression alsocontains a control for the personality measure uninteracted.
32 / 35

Summary
I Designed and implemented smartphone monitoring systemthat was highly effective (roughly doubled inspection rates)
I The effectiveness of this incentive reform depended on traits:
I Experiment 1: 1SD higher health inspector Big5 index →27% differential increase in inspections in treatment vs controldistricts.
I Experiment 2: 1SD higher senior health official Big5 index →40% reduction in doctor absence following underperformingfacility flag in treatment districts.
33 / 35

Policy Implications
1. Intrinsic factors/personalities matter in this domain
2. The same monitoring intervention can have different effects,depending on the profile of public servants
3. Simple manipulations to data can have big impacts
→ Gains from considering decision processes and heuristics
34 / 35

Thank you!
35 / 35

36 / 35
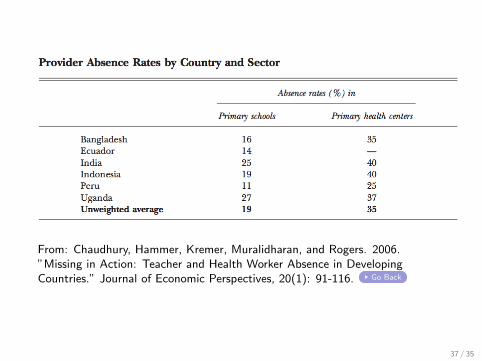
From: Chaudhury, Hammer, Kremer, Muralidharan, and Rogers. 2006.”Missing in Action: Teacher and Health Worker Absence in DevelopingCountries.” Journal of Economic Perspectives, 20(1): 91-116. Go Back
37 / 35

Doctor summary statistics
Mean SD P10 P50 P90 Obs
Big5 personality traits
Big 5 index (z-score) 0.05 0.79 -0.99 0.05 1.14 192Agreeableness 3.57 0.66 2.67 3.67 4.42 192Conscientiousness 4.02 0.55 3.33 4.00 4.75 192Extroversion 3.69 0.48 3.17 3.67 4.33 192Emotional stability -2.54 0.70 -3.50 -2.50 -1.67 192Openness 2.92 0.44 2.42 2.92 3.50 192
Public Sector MotivationPSM index (z-score) 0.02 0.67 -0.83 -0.01 0.92 192Attraction 3.46 0.60 2.60 3.40 4.20 192Civic duty 4.22 0.53 3.43 4.29 5.00 192Commitment 3.79 0.45 3.29 3.86 4.29 192Compassion 3.55 0.53 2.88 3.50 4.25 192Self Sacrifice 4.09 0.60 3.38 4.12 4.88 192Social justice 3.96 0.59 3.20 4.00 4.60 192
PerformancePresent (=1) 0.23 0.42 0.00 0.00 1.00 1197
Notes: Sample: doctors in control districts that completed the personalities sur-vey module, given in waves 2 and 3 and during a tracking round. Doctors wereonly asked to complete the module once. All personality traits and public sec-tor motivation variables measured on a one to five Likert scale unless otherwiseindicated.
38 / 35

Health inspector summary statistics
Mean SD P10 P50 P90 Obs
Big5 personality traits
Big 5 index (z-score) 0.02 0.75 -1.26 0.11 1.04 48Agreeableness 3.66 0.54 2.67 3.79 4.25 48Conscientiousness 4.12 0.54 3.33 4.21 4.75 48Extroversion 3.73 0.46 3.17 3.70 4.33 48Emotional stability -2.34 0.62 -3.25 -2.25 -1.58 48Openness 3.11 0.35 2.67 3.17 3.58 48
Public Sector MotivationPSM index (z-score) 0.07 0.61 -0.77 0.13 0.69 49Attraction 3.57 0.57 2.80 3.60 4.25 49Civic duty 4.44 0.42 3.86 4.57 5.00 49Commitment 3.97 0.37 3.43 3.86 4.50 49Compassion 3.66 0.49 3.00 3.62 4.25 49Self Sacrifice 4.40 0.45 3.86 4.50 5.00 49Social justice 4.20 0.43 3.60 4.20 5.00 49
PerformanceInspector inspected in the last two months (=1) 0.53 0.49 0.00 1.00 1.00 1263
Notes: Sample: health inspectors in control districts that completed the personalities survey module, given duringa single round after the final wave of clinic visits. All personality traits and public sector motivation variablesmeasured on a one to five Likert scale unless otherwise indicated.
39 / 35

Differential LATEs by inspector Big 5 personality
Inspector inspection in last 2 months (=1)(1) (2) (3) (4) (5) (6) (7)
Monitoring (=1) 0.111 0.101 -0.671 -1.107 -0.311 0.815** -1.022(0.115) (0.101) (0.646) (0.794) (0.633) (0.324) (0.692)[0.182]
Monitoring x Big5 index 0.271*(0.135)[0.095]
Monitoring x Agreeableness 0.215(0.167)[0.294]
Monitoring x Conscientiousness 0.295(0.185)[0.184]
Monitoring x Extroversion 0.114(0.162)[0.306]
Monitoring x Emotional stability 0.305**(0.128)[0.039]
Monitoring x Openness 0.370(0.228)[0.033]
Mean of dependent variable 0.575 0.575 0.575 0.575 0.575 0.575 0.575# Districts 35 35 35 35 35 35 35# Clinics 707 707 707 707 707 707 707# Observations 2115 2115 2115 2115 2115 2115 2115R-Squared 0.062 0.082 0.085 0.080 0.064 0.081 0.073
Notes: *p < 0.1, **p < 0.05, ***p < 0.01. Standard errors clustered at the district level reported in parentheses. P-valuesfrom Fishers Exact Test reported in brackets. All regressions include clinic and survey wave fixed effects and the interactionof a post treatment dummy with each trait.
PSM table40 / 35

Doctor Big 5 personality and doctor attendance
Doctor attendance (=1)(1) (2) (3) (4) (5) (6)
Big 5 index (z-score) 0.037(0.034)
Agreeableness 0.009(0.036)
Conscientiousness 0.098**(0.047)
Extroversion 0.093*(0.052)
Emotional stability 0.037(0.036)
Openness -0.043(0.059)
Mean of dependent variable 0.493 0.493 0.493 0.493 0.493 0.493# Clinics 190 190 190 190 190 190# Observations 479 479 479 479 479 479R-Squared 0.192 0.190 0.197 0.195 0.191 0.190
Notes: *p < 0.1, **p < 0.05, ***p < 0.01. Standard errors clustered at the clinic level reported inparentheses. All regressions include Tehsil (subdistrict) and survey wave fixed effects. Sample: controldistrict clinics for which doctor personality data is available.
PSM table
41 / 35
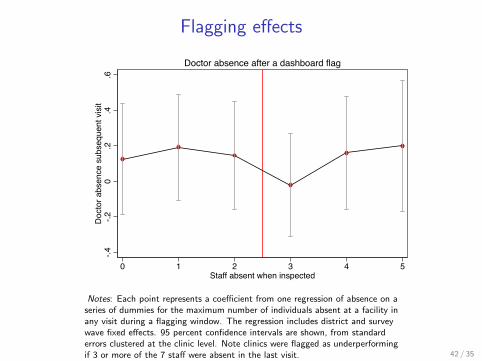
Flagging effects
-.4-.2
0.2
.4.6
Doc
tor a
bsen
ce s
ubse
quen
t vis
it
0 1 2 3 4 5Staff absent when inspected
Doctor absence after a dashboard flag
Notes: Each point represents a coefficient from one regression of absence on aseries of dummies for the maximum number of individuals absent at a facility inany visit during a flagging window. The regression includes district and surveywave fixed effects. 95 percent confidence intervals are shown, from standarderrors clustered at the clinic level. Note clinics were flagged as underperformingif 3 or more of the 7 staff were absent in the last visit. 42 / 35

Doctor PSM personality and doctor attendance
Doctor attendance (=1)(1) (2) (3) (4) (5) (6) (7)
PSM index (z-score) 0.074**(0.036)
Attraction 0.048(0.042)
Civic duty 0.115**(0.051)
Commitment 0.060(0.052)
Compassion 0.015(0.053)
Self Sacrifice 0.089**(0.042)
Social justice 0.047(0.038)
Mean of dependent variable 0.493 0.493 0.493 0.493 0.493 0.493 0.493# Clinics 190 190 190 190 190 190 190# Observations 479 479 479 479 479 479 479R-Squared 0.196 0.192 0.199 0.192 0.190 0.197 0.192
Notes: *p < 0.1, **p < 0.05, ***p < 0.01. Standard errors clustered at the clinic level reported in parentheses. Allregressions include Tehsil (subdistrict) and survey wave fixed effects. Sample: control district clinics for which doctorpersonality data is available.
Back
43 / 35

Inspector Big 5 personality and health inspections
Health inspector inspection in last two months (=1)(1) (2) (3) (4) (5) (6)
Big 5 index (z-score) -0.063(0.049)
Agreeableness -0.047(0.061)
Conscientiousness -0.100*(0.059)
Extroversion -0.093(0.073)
Emotional stability -0.102(0.061)
Openness 0.038(0.078)
Mean of dependent variable 0.511 0.511 0.511 0.511 0.511 0.511# Clinics 46 46 46 46 46 46# Observations 523 523 523 523 523 523R-Squared 0.181 0.179 0.182 0.182 0.183 0.178
Notes: *p < 0.1, **p < 0.05, ***p < 0.01. Standard errors clustered at the clinic level reported in parentheses. Allregressions include Tehsil (subdistrict) and survey wave fixed effects. Sample: control district clinics.
44 / 35

Inspector PSM personality and health inspections
Health inspector inspection in last two months (=1)(1) (2) (3) (4) (5) (6) (7)
PSM index (z-score) -0.021(0.058)
Attraction -0.027(0.065)
Civic duty 0.017(0.060)
Commitment -0.016(0.087)
Compassion -0.095(0.114)
Self Sacrifice -0.002(0.044)
Social justice -0.031(0.080)
Mean of dependent variable 0.495 0.495 0.495 0.495 0.495 0.495 0.495# Clinics 47 47 47 47 47 47 47# Observations 539 539 539 539 539 539 539R-Squared 0.199 0.200 0.199 0.199 0.202 0.199 0.199
Notes: *p < 0.1, **p < 0.05, ***p < 0.01. Standard errors clustered at the clinic level reported in parentheses. Allregressions include Tehsil (subdistrict) and survey wave fixed effects. Sample: control district clinics.
Back
45 / 35

Doctor Big 5 personality and doctor-inspectorcollusion
Doctor-inspector collusion (=1)(1) (2) (3) (4) (5) (6)
Big 5 index (z-score) -0.112***(0.031)
Agreeableness -0.128***(0.043)
Conscientiousness -0.120***(0.038)
Extroversion -0.141***(0.042)
Emotional stability -0.106***(0.031)
Openness -0.056(0.065)
Mean of dependent variable 0.092 0.092 0.092 0.092 0.092 0.092# Clinics 239 239 239 239 239 239# Observations 239 239 239 239 239 239R-Squared 0.438 0.434 0.418 0.420 0.422 0.383
Notes: *p < 0.1, **p < 0.05, ***p < 0.01. Standard errors clustered at the clinic level reported in parentheses. Allregressions include Tehsil (subdistrict) and survey wave fixed effects. Sample: clinics in treatment districts with doctorsthat completed the personalities survey module. Collusion is a dummy variable coded as 1 when a doctor is reported absentin both survey waves 2 and 3 but is reported as present by DDOs during every visit between the launch of the programand present (up to 73 visits).
46 / 35

Doctor PSM personality and doctor-inspectorcollusion
Doctor-inspector collusion (=1)(1) (2) (3) (4) (5) (6) (7)
PSM index (z-score) -0.150***(0.035)
Attraction -0.102***(0.036)
Civic duty -0.107***(0.037)
Commitment -0.149***(0.047)
Compassion -0.164***(0.046)
Self Sacrifice -0.140***(0.038)
Social justice -0.107***(0.036)
Mean of dependent variable 0.092 0.092 0.092 0.092 0.092 0.092 0.092# Clinics 239 239 239 239 239 239 239# Observations 239 239 239 239 239 239 239R-Squared 0.478 0.416 0.419 0.432 0.439 0.437 0.415
Notes: *p < 0.1, **p < 0.05, ***p < 0.01. Standard errors clustered at the clinic level reported in parentheses. All regressions includeTehsil (subdistrict) and survey wave fixed effects. Sample: clinics in treatment districts with doctors that completed the personalities surveymodule. Collusion is a dummy variable coded as 1 when a doctor is reported absent in both survey waves 2 and 3 but is reported as presentby DDOs during every visit between the launch of the program and present (up to 73 visits).
Back
47 / 35

Inspector Big 5 personality and doctor-inspectorcollusion
Doctor-inspector collusion (=1)(1) (2) (3) (4) (5) (6)
Big 5 index (z-score) 0.041(0.045)
Agreeableness 0.015(0.064)
Conscientiousness 0.009(0.037)
Extroversion 0.109*(0.055)
Emotional stability 0.011(0.024)
Openness -0.021(0.046)
Mean of dependent variable 0.088 0.088 0.088 0.088 0.088 0.088# Inspectors 47 47 47 47 47 47# Observations 251 251 251 251 251 251R-Squared 0.142 0.140 0.140 0.154 0.140 0.140
Notes: *p < 0.1, **p < 0.05, ***p < 0.01. Standard errors clustered at the clinic level reported inparentheses. All regressions include Tehsil (subdistrict) and survey wave fixed effects. Sample: clinics intreatment districts. Collusion is a dummy variable coded as 1 when a doctor is reported absent in bothsurvey waves 2 and 3 but is reported as present by DDOs during every visit between the launch of theprogram and present (up to 73 visits).
48 / 35

Inspector PSM personality and doctor-inspectorcollusion
Doctor-inspector collusion (=1)(1) (2) (3) (4) (5) (6) (7)
PSM index (z-score) -0.075**(0.032)
Attraction -0.117*(0.068)
Civic duty 0.039(0.049)
Commitment -0.132***(0.042)
Compassion -0.052(0.047)
Self Sacrifice -0.055(0.034)
Social justice -0.073*(0.041)
Mean of dependent variable 0.091 0.091 0.091 0.091 0.091 0.091 0.091# Inspectors 48 48 48 48 48 48 48# Observations 253 253 253 253 253 253 253R-Squared 0.152 0.149 0.140 0.163 0.143 0.143 0.147
Notes: *p < 0.1, **p < 0.05, ***p < 0.01. Standard errors clustered at the clinic level reported in parentheses. Allregressions include Tehsil (subdistrict) and survey wave fixed effects. Sample: clinics in treatment districts. Collusion is adummy variable coded as 1 when a doctor is reported absent in both survey waves 2 and 3 but is reported as present byDDOs during every visit between the launch of the program and present (up to 73 visits).
Back
49 / 35

Differential LATEs by inspector PSM personality
Inspector inspection in last 2 months (=1)(1) (2) (3) (4) (5) (6) (7) (8)
Monitoring (=1) 0.121 0.110 -1.022** 0.648 -0.282 -0.530 -0.122 -0.752(0.112) (0.105) (0.473) (0.682) (0.688) (0.784) (0.884) (0.713)
[]Monitoring x PSM index 0.160
(0.140)[0.211]
Monitoring x Attraction 0.316**(0.123)[0.02]
Monitoring x Civic duty -0.124(0.154)[ 0.723]
Monitoring x Commitment 0.098(0.165)[0.297]
Monitoring x Compassion 0.175(0.199)[0.198]
Monitoring x Self sacrifice 0.056(0.189)[0.363]
Monitoring x Social justice 0.206(0.163)[0.179]
Mean of dependent variable 0.567 0.567 0.567 0.567 0.567 0.567 0.567 0.567# Districts 35 35 35 35 35 35 35 35# Clinics 721 721 721 721 721 721 721 721# Observations 2157 2157 2157 2157 2157 2157 2157 2157R-Squared 0.063 0.072 0.079 0.065 0.077 0.066 0.063 0.073
Notes: *p < 0.1, **p < 0.05, ***p < 0.01. Standard errors clustered at the district level reported in parentheses. P-values fromFishers Exact Test reported in brackets. All regressions include clinic and survey wave fixed effects and the interaction of a posttreatment dummy with each trait.
Back
50 / 35

Differential LATEs by doctor personality
Social justiceSelf-sacrificeCompassionCommitment
Civic dutyAttraction
PSM index
OpennessEmotional stability
ExtroversionConscientiousness
AgreeablenessBig 5 index
Doct
or P
erso
nality
-.2 -.1 0 .1 .2 .3Standardized Interaction Coefficient
Doctor Attendance (=1)
Notes: Each row represents the interaction coefficient from a regression ofdoctor attendance on the shown personality trait interacted with a treatmentdummy. Regressions include a post*treatment dummy and survey wave andclinic fixed effects and SEs are clustered at the district level.
51 / 35

Differential LATEs by doctor Big 5 personality
Doctor attendance (=1)(1) (2) (3) (4) (5) (6) (7)
Monitoring (=1) 0.019 0.022 0.144 -0.232 -0.073 -0.061 -0.006(0.076) (0.077) (0.417) (0.495) (0.374) (0.252) (0.530)[0.336]
Monitoring x Big5 index 0.005(0.086)[0.545]
Monitoring x Agreeableness -0.033(0.116)[0.627]
Monitoring x Conscientiousness 0.063(0.123)[0.489]
Monitoring x Extroversion 0.026(0.097)[0.443]
Monitoring x Emotional stability -0.031(0.090)[0.619]
Monitoring x Openness 0.009(0.177)[0.450]
Mean of dependent variable 0.540 0.540 0.540 0.540 0.540 0.540 0.540# Districts 34 34 34 34 34 34 34# Clinics 474 474 474 474 474 474 474# Observations 1216 1216 1216 1216 1216 1216 1216R-Squared 0.013 0.013 0.016 0.013 0.013 0.013 0.013
Notes: *p < 0.1, **p < 0.05, ***p < 0.01. Standard errors clustered at the district level reported in parentheses. P-valuesfrom Fishers Exact Test reported in brackets. All regressions include clinic and survey wave fixed effects.
52 / 35

Differential LATEs by doctor PSM personality
Doctor attendance (=1)(1) (2) (3) (4) (5) (6) (7) (8)
Monitoring (=1) 0.019 0.020 -0.123 -0.067 0.231 0.296 -0.114 -1.058***(0.076) (0.076) (0.313) (0.547) (0.409) (0.369) (0.535) (0.327)
[]Monitoring x PSM index 0.057
(0.086)[0.279]
Monitoring x Attraction 0.040(0.085)[0.355]
Monitoring x Civic duty 0.021(0.125)[0.543]
Monitoring x Commitment -0.056(0.111)[0.619]
Monitoring x Compassion -0.077(0.106)[0.771]
Monitoring x Self sacrifice 0.033(0.135)[0.496]
Monitoring x Social justice 0.273***(0.090)[0.028]
Mean of dependent variable 0.540 0.540 0.540 0.540 0.540 0.540 0.540 0.540# Districts 34 34 34 34 34 34 34 34# Clinics 474 474 474 474 474 474 474 474# Observations 1216 1216 1216 1216 1216 1216 1216 1216R-Squared 0.013 0.018 0.016 0.013 0.019 0.016 0.013 0.027
Notes: *p < 0.1, **p < 0.05, ***p < 0.01. Standard errors clustered at the district level reported in parentheses. P-values fromFishers Exact Test reported in brackets. All regressions include clinic and survey wave fixed effects.
Back
53 / 35

Differential clinic ‘flagging’ effects by senior healthofficer PSM personality
Doctor absent (=1)(1) (2) (3) (4) (5) (6) (7) (8)
Clinic flagged as underperforming on dashboard -0.165 0.326 0.137 2.449 -0.418 -0.433 1.187(0.105) (0.661) (0.946) (1.673) (1.134) (0.903) (0.938)
Flagged x PSM index -0.124(0.169)
Flagged x Attraction -0.128(0.180)
Flagged x Civic duty -0.065(0.214)
Flagged x Commitment -0.700(0.450)
Flagged x Compassion 0.071(0.292)
Flagged x Self sacrifice 0.066(0.205)
Flagged x Social justice -0.343(0.240)
Mean of dependant variable 0.480 0.480 0.480 0.480 0.480 0.480 0.480# Observations 123 123 123 123 123 123 123# Clinics 106 106 106 106 106 106 106R-Squared 0.208 0.207 0.204 0.217 0.204 0.204 0.219
Notes: *p < 0.1, **p < 0.05, ***p < 0.01. Standard errors clustered at the clinic level reported in parentheses. All regressions include district andsurvey wave fixed effects. Clinics were flagged as underperforming if 3 or more of the 7 staff were absent in the last visit. All columns restrict thesample to those clinics where only 2 or 3 staff were absent (up to 7 staff can be marked absent).
Back
54 / 35

Differential clinic ‘flagging’ effects by senior healthofficer personality
Doctor absent (=1)(1) (2) (3) (4) (5) (6)
Clinic flagged as underperforming on dashboard -0.100 -0.146 -0.094 -0.159 -0.098 -0.165(0.067) (0.103) (0.067) (0.098) (0.070) (0.105)
Flagged x Big5 index -0.118 -0.402**(0.131) (0.200)
Flagged x PSM index 0.016 -0.124(0.108) (0.169)
Mean of the dependent variable 0.521 0.480 0.521 0.480 0.521 0.480# Observations 326 123 326 123 326 123# Clinics 228 106 228 106 228 106R-Squared 0.114 0.204 0.117 0.231 0.114 0.208Sample Full Discontinuity Full Discontinuity Full Discontinuity
Notes: *p < 0.1, **p < 0.05, ***p < 0.01. Standard errors clustered at the clinic level reported in parentheses. All regressions include district andsurvey wave fixed effects. Clinics were flagged as underperforming if 3 or more of the 7 staff were absent in the last visit. Columns 2 and 4 restrict thesample to those clinics where only 2 or 3 staff were absent (up to 7 staff can be marked absent). We call this sample the “discontinuity” sample.
Back
55 / 35