Embed Size (px)
Citation preview
456
PERSONAL INCOME TAXES
CHAPTER OBJECTIVES
After you have taxed your patience and
gotten to the end of this chapter you will
understand the rudiments of how taxes work. You
should understand the concepts of horizontal and
vertical equity and how they apply to the issue of
taxation. You will understand the tradeoff that
exists between simplicity and horizontal equity
when people are making tax policy. You will
understand that taxes can alter the incentives of people to work and save and that taxes have been used
to motivate other socially desirable outcomes as well. Finally, you will be able to understand in a greater
context the debates over taxes that took place during the 1990's and continue to today.
INTRODUCTION
In 2000 income taxes accounted for $952 billion of the $1956 billion that made up federal
revenue. The rest came from payroll, corporate, and excise taxes. Personal income taxes make up
almost a majority of the revenue government takes in. These taxes also provoke many of the
disagreements between Republicans and Democrats. Each party fights for policies it believes are best for
the nation and ones that help its constituencies.
Usually the political fights surrounding the personal income code boil down to whether the rich
pay their “fair share.” To look at these controversies with any insight we will need to understand the way
CHAPTER OUTLINECHAPTER OBJECTIVESINTRODUCTIONHOW INCOME TAXES WORKISSUES IN INCOME TAXATION
Horizontal And Vertical EquitySimplicity vs Equity
INCENTIVES AND THE TAX CODEDo Taxes Alter Work DecisionsDo Taxes Alter Saving DecisionsTaxes For Social Engineering
THE TAX DEBATE OF THE 1990's ANDBEYONDCHAPTER SUMMARY
457
Withholding : a guess as to how much tax youare going to owe during a year
taxes work and who pays them before we get into which party has the better claim on taxes.
In this chapter we will lead off with a discussion of how income taxes work in the United States.
Following that we will discuss whether and how income taxes alter the willingness of people to work and
save and how capital gains fit into this picture. We will introduce surprising news about who actually
pays taxes. At the end we will lay out some of the interesting tax debates of the 1990's and beyond.
HOW INCOME TAXES WORK
Federal income taxes in the United States
are accomplished with a series of guesses that are
corrected on April 15 of the year after the tax
year. When you get a new job you have to fill out a W-4 form on which you specify how many
exemptions you are taking. Usually, your exemptions are yourself and the others in your household, but
you can adjust the number by as many as necessary to make the guess on the taxes you will owe as
close as possible. The number you provide is used by your employer to figure out how much tax should
be withheld from each of your pay checks. Withholding is the manner in which you and the
government guess how much tax you are going to owe during a year so you can pay it a little at a time
rather than all at once. On April 15th you take what you have actually made (reported to you on a W-2
form or a Form 1099) in order to compute what you actually owe. People who have had too much
withheld get a tax refund. If they have too little withheld, they have to make it up by April 15th.
As you can see from Figure 1, the amount of tax you owe looks complicated. In reality tax
computations are quite simple for most people. That is because, thanks to a 1986 law, most people can
skip the single most complicated step, the deductions, and fill out as few as 10 lines on their tax forms.

458
Figure 1 2000 Federal Income Taxes
Still, for many others, tax forms, rules, and procedures are complicated and jargon filled. In order to
understand how taxes affect people we must first take a crack understanding those forms, rules,
procedures and jargon.
The tax you owe is, of course, influenced
Adjusted Gross Income : total net incomefrom all sources
Capital Gains : any profit you have from assetsales
459
Exemptions : an amount by which AGI isreduced that is determined by the size of thefamily
Deductions : amounts by which AGI is reduced;the greater of either the standard deduction oritemized deductions
Standard Deduction : the minimum level ofdeduction
Itemized Deductions : deductions for particularexpenses on which the government does notwant taxes paid
by how much you make. The adjusted gross income (AGI) is the total net income from all sources.
To get that number, add together all of the income you get from the traditional sources (of wages,
salaries, tips, interest, and dividends.) Then, add in any net profit from businesses, and rental apartments,
any profit you have from asset sales (called capital gains ) and, finally, adjust that for net alimony
received. (If you paid alimony, this is a negative).
To figure out how much of that Adjusted
Gross Income is taxable you first have to adjust
that number by two other numbers. The first,
exemptions , is an amount by which AGI is reduced that is determined by the size of the family. These
exemptions are similar to, but not the same as the exemptions you compute for form W-4. For that form
you can essentially create fictitious people in order to make your withholding correct. Here, the
exemptions have to be real. Each person in the household counts as one. Each person over 65 counts as
one more, as does each blind person. For the 2000 tax year, each exemption reduced AGI by $2,800.
For example, a married couple, both of whose members are old and blind, would have had six
exemptions whereas a husband and wife with two
small children would have had four. In the first
case the total exemption is 6*$2,800, or
$16,800. In the second example it is 4*$2,800,
or $11,200.
Deductions are also amounts by which
AGI is reduced. These are complicated by the
460
fact that they are the greater of either a minimum level or the sum of particular expenditures, the value of
which is money that will not be taxed. The minimum level of deduction is called the standard deduction,
and this is the amount that most people take. Itemized deductions are for particular expenses on which
government does not want taxes paid. The reason that, for most people, taxes are relatively simple is
that they skip this complicated step. Rather than itemizing deductions, they accept the value of the
standard deduction.
When people itemize (that is, “list”) they
add up those things that are deductible
(approved types of expenses) and instead of reducing their taxable income by a fixed amount, they
reduce it by the sum of those expenses. For instance, when people buy homes they typically have
mortgage payments. In the early years of paying on a mortgage, the payment is almost entirely interest.
That interest is deductible. Other deductible items that are itemized include state and local income and
property taxes, charitable donations, certain employment expenses, and certain (usually very high)
medical expenses.
Most people do not itemize their deductions because, if they did, they would not add up to the
standard deduction. This is especially true for renters because renters cannot deduct the mortgage
interest and the property taxes on their residences. Only those who own the properties are entitled to
take these deductions.
The standard deduction simplifies taxes for most people, and it reduces the amount of tax that
they owe. Those people who itemize have at least one, if not many more, forms than the people who
take the standard deduction. In addition, since the standard deduction gives the people who take it a
Deductible: approved types of expenses
461
larger reduction off income than they would
otherwise get, it reduces their tax burden.
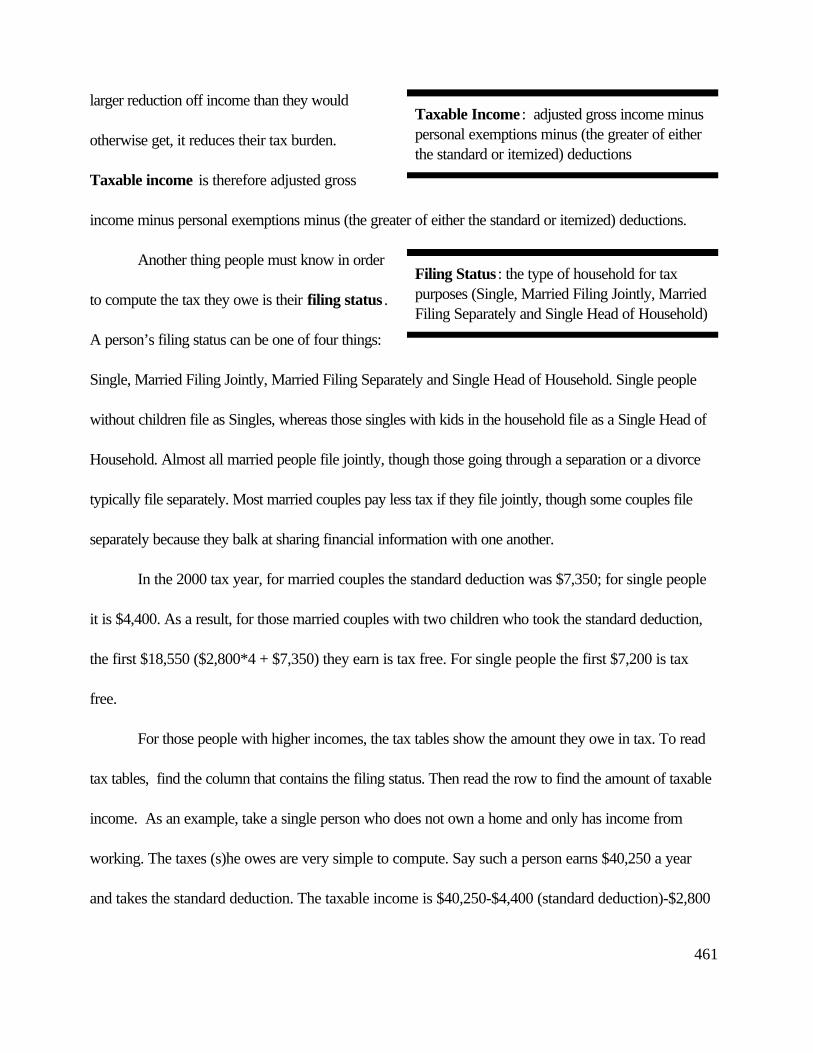
Taxable income is therefore adjusted gross
income minus personal exemptions minus (the greater of either the standard or itemized) deductions.
Another thing people must know in order
to compute the tax they owe is their filing status .
A person’s filing status can be one of four things:
Single, Married Filing Jointly, Married Filing Separately and Single Head of Household. Single people
without children file as Singles, whereas those singles with kids in the household file as a Single Head of
Household. Almost all married people file jointly, though those going through a separation or a divorce
typically file separately. Most married couples pay less tax if they file jointly, though some couples file
separately because they balk at sharing financial information with one another.
In the 2000 tax year, for married couples the standard deduction was $7,350; for single people
it is $4,400. As a result, for those married couples with two children who took the standard deduction,
the first $18,550 ($2,800*4 + $7,350) they earn is tax free. For single people the first $7,200 is tax
free.
For those people with higher incomes, the tax tables show the amount they owe in tax. To read
tax tables, find the column that contains the filing status. Then read the row to find the amount of taxable
income. As an example, take a single person who does not own a home and only has income from
working. The taxes (s)he owes are very simple to compute. Say such a person earns $40,250 a year
and takes the standard deduction. The taxable income is $40,250-$4,400 (standard deduction)-$2,800
Taxable Income : adjusted gross income minuspersonal exemptions minus (the greater of eitherthe standard or itemized) deductions
Filing Status : the type of household for taxpurposes (Single, Married Filing Jointly, MarriedFiling Separately and Single Head of Household)
462
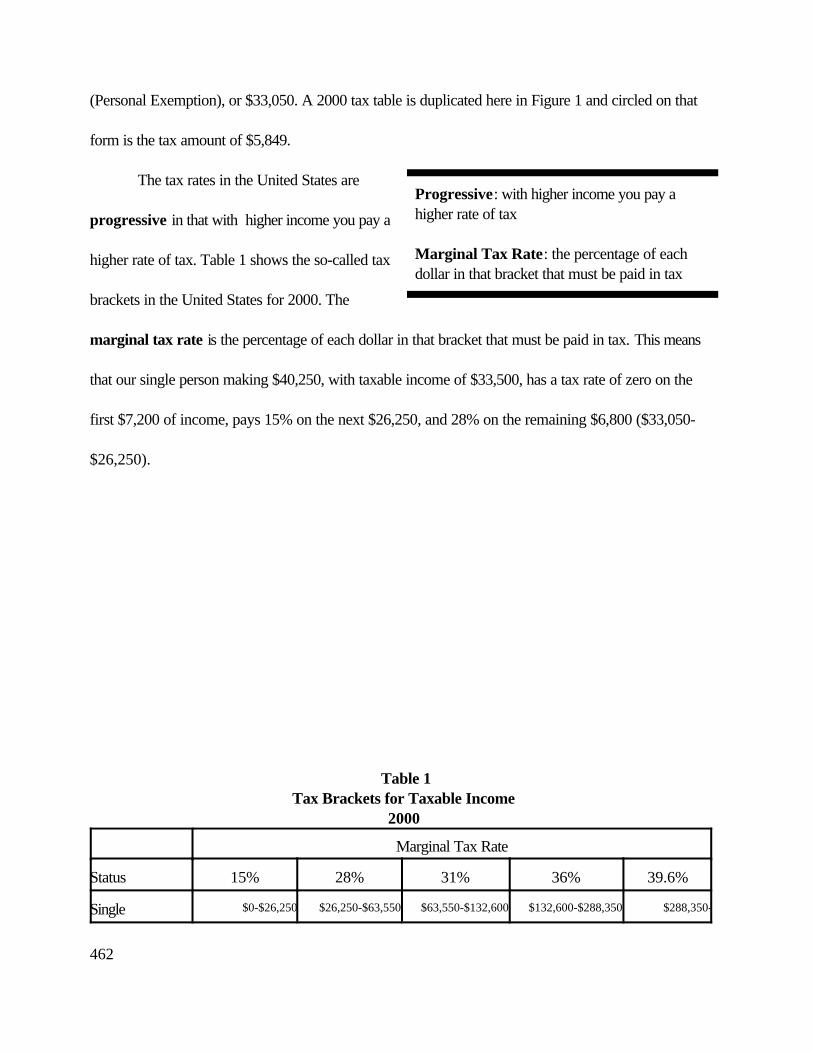
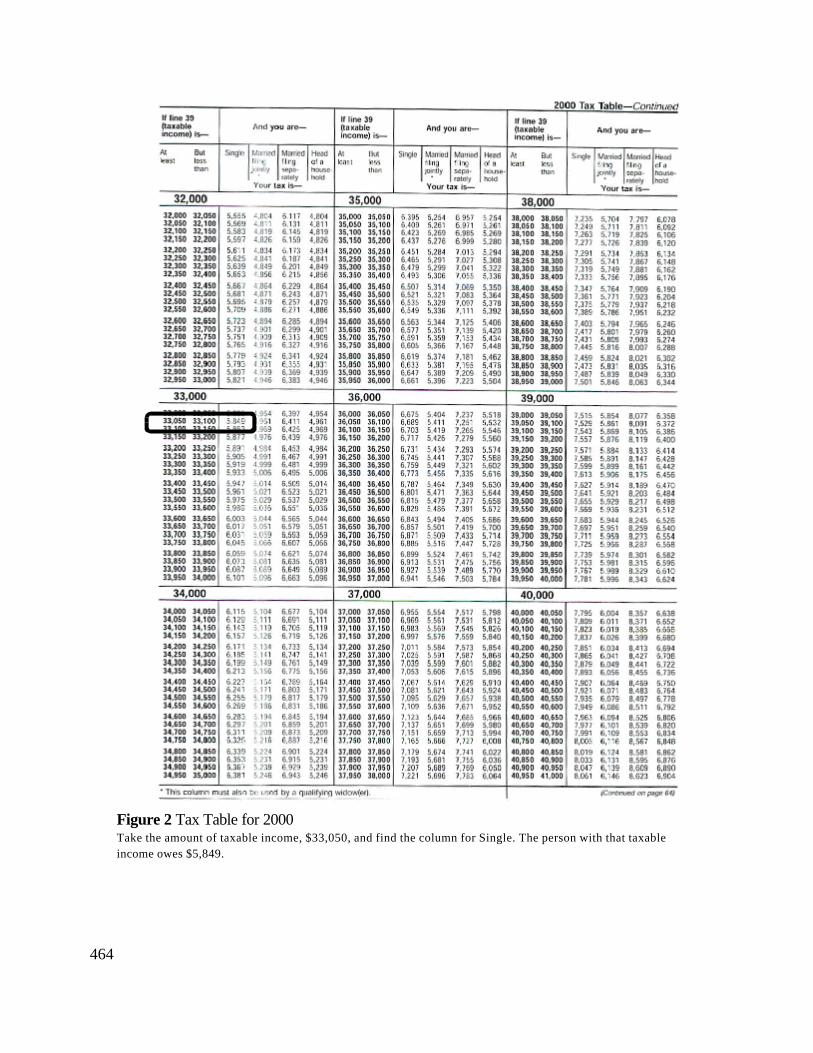
(Personal Exemption), or $33,050. A 2000 tax table is duplicated here in Figure 1 and circled on that
form is the tax amount of $5,849.
The tax rates in the United States are
progressive in that with higher income you pay a
higher rate of tax. Table 1 shows the so-called tax
brackets in the United States for 2000. The
marginal tax rate is the percentage of each dollar in that bracket that must be paid in tax. This means
that our single person making $40,250, with taxable income of $33,500, has a tax rate of zero on the
first $7,200 of income, pays 15% on the next $26,250, and 28% on the remaining $6,800 ($33,050-
$26,250).
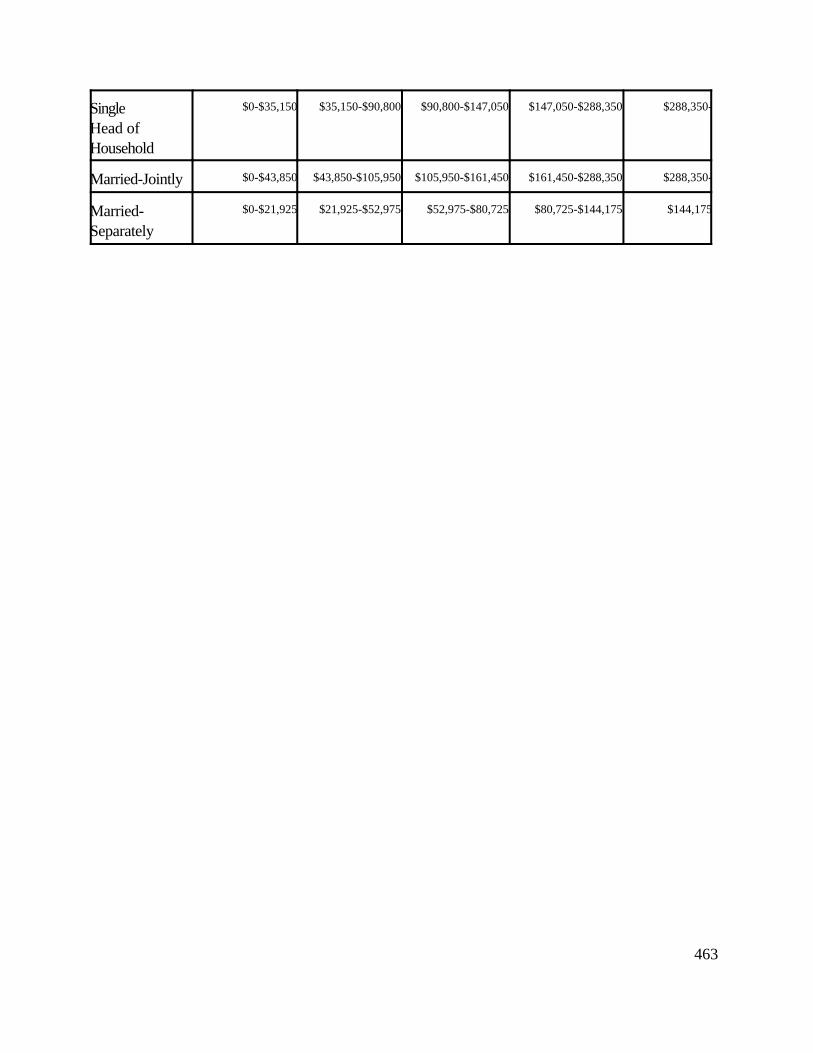
Table 1Tax Brackets for Taxable Income
2000
Marginal Tax Rate
Status 15% 28% 31% 36% 39.6%
Single $0-$26,250 $26,250-$63,550 $63,550-$132,600 $132,600-$288,350 $288,350-
Progressive: with higher income you pay ahigher rate of tax
Marginal Tax Rate: the percentage of eachdollar in that bracket that must be paid in tax
463
SingleHead ofHousehold
$0-$35,150 $35,150-$90,800 $90,800-$147,050 $147,050-$288,350 $288,350-
Married-Jointly $0-$43,850 $43,850-$105,950 $105,950-$161,450 $161,450-$288,350 $288,350-
Married-Separately
$0-$21,925 $21,925-$52,975 $52,975-$80,725 $80,725-$144,175 $144,175
464
Figure 2 Tax Table for 2000Take the amount of taxable income, $33,050, and find the column for Single. The person with that taxableincome owes $5,849.
465
Even after you have figured your tax, this is not what you actually owe. There are four important
tax credits that now go into the computation. The first, the earned income tax credit, is designed for the
working poor. This can be a substantial increase in your take-home pay if you have children and do not
make a lot of money. For those with at least two children, the credit amounts to as much as $3,888. The
second important credit is the child credit. For those married couples that make less than $110,000, this
credit amounts to $500 per child. The third major credit is the child- (and elder-) care tax credit. For the
majority of families with child-care expenses, this credit allows for between twenty and thirty percent
(again, depending on AGI) of those expenses to come off the tax bill. The last of these major credits is a
tuition tax credit. This allows for up to $1500 of college-related expenses to come off the tax bill.
There is an important distinction between tax credits and deductions. A tax deduction comes off
taxable income, so the savings to the taxpayer are whatever their marginal tax rate is times the amount of
the deduction. So, if a person is in the 15% tax bracket a $1,000 deduction is worth $150. A $1,000
credit on the other hand is $1,000 off the tax bill. Tax credits are, therefore, better than deductions if the
two are in equal amounts.
There is another aspect of the distinction between credits and deductions that is important.
During tax debates there is often a discussion of whether there should be a tax deduction for something
or a tax credit for it. Since credits are more costly to the government than deductions, we can imagine
that the choice facing policy makers for the tax cut would be a $2,500 deduction or a $500 credit. For
someone in the 15% tax bracket a $2,500 tax deduction is worth between nothing (because they still
end up with insufficient deductions to get over the standard deduction) and 15% of $2,500 or $375. For
someone in the 28% bracket a $2,500 deduction is worth up to $700. The net result of this is that
466
Vertical Equity: people across the income scaleare treated fairly with regard to ability to pay
credits are better than deductions when they are in equal amounts and that for tax reductions of equal
cost to the government, credits are better than deductions for the poor. For the rich the opposite is true,
tax deductions are preferred over tax credits.
For people with a variety of income sources and many deductions the rules are very
complicated. The vast majority of people are not in this predicament. You have to either own a farm or
business, have a significant and actively changing investment portfolio, have significant medical expenses
that you have to pay yourself, work in an environment where you get high pay but have to pay for lots of
work expenses (like a truck driver) or have some other strange source of income in order to have overly
complicated income taxes.
ISSUES IN INCOME TAXATION
Horizontal and Vertical Equity
One of the questions that always arises
with regard to income taxes is are they “fair?” The
very definition of “fair” requires some thought. In
order to be fair it seems rather clear that equal people should be treated equally. This concept, called
horizontal equity, is not much disputed. People who make the same income, from the same sources,
with the same family structure and are the same in every other dimension should pay the same taxes.
Where the controversy lies with most
people is the issue of vertical equity. That is, are
people across the income scale treated fairly with
regard to their ability to pay. As you saw with the Table 1, people at the upper end of the income scale
Horizontal Equity: equal people should betreated equally
467
Neutral: a characteristic of a tax code thatimplies that it does not favor particular forms ofincome or expenditure
pay much more in tax and much higher percentages of tax than people at the lower end.
Equity vs Simplicity
There is a distinct trade-off between
horizontal equity and simplicity. This is because it
is difficult to nail down the question of “sameness”
that is at the heart of the definition of horizontal equity. Most economists who study the issue of taxation
want the tax code to be neutral. For instance, in order to be neutral you have to treat income made
from work the same as you treat income made from investments. The problem is that in order to actually
do that you need to make the tax code very complicated. Use capital gains income as an example.
When assets are bought and then later sold at a profit there is capital gain. Under the principles
of neutrality that capital gain should be taxed, the question is how much? This is because there are
problems with capital gains that do not affect earnings from work. First, much of the increase in the value
of an asset is simply the compensation for inflation. We tax all gains rather than just the inflation adjusted
gains because it is easier. A second problem is that it is hard to evaluate some assets, so capital gains are
taxed only on realization (when you actually have the profit in hand) rather than accrual (when the asset
price increase happened.) This under-taxes capital gains by letting the holder of them defer the tax.
Taxing on realization rather than accrual is simple, but it creates a different problem whose
solution only creates another problem. Because there is no tax until an asset is sold, when a person dies
before they sell an asset, there are capital gains. Perhaps there is no paperwork to find out when it was
bought, so there is no way of finding out exactly how big the capital gain is. To solve this, all capital gains
and, therefore, all taxes owed on those gains are forgiven at death. This creates yet another problem.
468
There is an incentive for the elderly to hold assets with large capital gains rather than sell them because
doing avoids the capital gains tax.
Thus the problem is that there is a trade-off between simplicity and equity. In order to be simple
we will violate equity and in order to be fair, it will cost us simplicity.
INCENTIVES AND THE TAX CODE
There is an active debate among politicians and among economists about the effects of income
taxes on the behavior of people. Two of the most interesting of these issues are how such taxes affect
people’s willingness to work and save. Republican politicians and conservative economists are
convinced that income taxes cause people to work and save less. Democratic politicians and liberal
economists are convinced that people do not work and save any less and may, in fact, work and save
more.
This is because there is a fundamental
disagreement between economists concerning the
relative importance of what economists call the
substitution effect and the income effect. Any
time you change the price of something, in this
case either the take-home wage rate or the after-
tax interest rate, you create these two effects. The
substitution effect moves people toward the good that is now cheaper or away from the good that is now
more expensive. As an example, if there are only two goods, apples and oranges, and the price of
apples increases, you would move toward oranges. This is not the end of the story, though. There is also
Substitution Effect: moves people toward thegood that is now cheaper or away from the goodthat is now more expensive
Income Effect: can go either direction, anincrease in price lowers spending power; if thegood is normal this further lowers consumption, ifit is inferior it can increase consumption backtoward where it was (or even further.)
469
an income effect. This can go either direction and depends on the Chapter 2 concepts of normal and
inferior. If a good is inferior, the increase in price lowers your real spending power and you would move
back toward that good.
Do Taxes Alter Work Decisions?
One of the most well-researched questions in economics is the effect of take-home pay on the
number of hours worked. Though, to the untrained observer this may not seem like a very difficult
question, it actually is. The substitution effect is the more obviously seen effect. Since taxes reduce the
take-home pay for every hour worked, the incentive to work rather than stay home and relax, is
lessened. Thus you reduce your work effort. The other side of the story, though, is the reduction in
income. If you do the work that is necessary to generate a certain standard of living, then you will have
to work more hours to have the income to sustain that standard of living. The empirical research suggests
that if taxes do alter the work decision it is only very slightly. Most estimates suggest that the substitution
effect is exactly countered by the income effect. That is an increase in taxes has no effect on work effort
though some have found the effect to be that it takes an 8% reduction in after-tax wage rates to generate
a 1% reduction in work hours. Either way, taxes do not substantially alter the incentive to work.
Do Taxes Alter Savings Decisions?
A similar result has been found on after-tax interest rates. Though there is disagreement in
methodology that generates a disagreement in the conclusion, many economists also believe that an
increase in tax rates has little or no effect on saving behavior. This also suggests that the substitution
effect and income effect completely counter each other. There are, though, estimates that suggest that the
net is not zero. In particular, Michael Boskin estimated that a 2.5% decrease in the after-tax interest
26Another effect of this subsidy is that is gives colleges and universities an increased ability toraise tuition.
470
rates results in a 1% decrease in savings.
Taxes for Social Engineering
If taxes do not substantially alter the incentive of people to work or save, then you might think
that policy makers would have given up on using taxes to get people to do other desirable things. If you
thought that you would be wrong. President Clinton proposed and got through a plan to use tax credits
to provide an incentive to go to college. Tax deductions and credits for a variety of desirable outcomes
have been tried at a variety of different times. Typically the breaks do not end up causing more of the
desired outcome, but simply subsidize the people who were already engaging in it. If the research on
college tax credits that is published in the next few years duplicates the results of the research on work
and savings, the tax deductions and credits will probably not increase the number of people going to
college but will merely be a special tax break to those that would have gone to college anyway.26
WHO PAYS INCOME TAXES?
A vastly misunderstood concept of income taxation is the question, “who pays?” For years
Republicans and Democrats alike have perpetuated the myth that middle Americans pay this tax and the
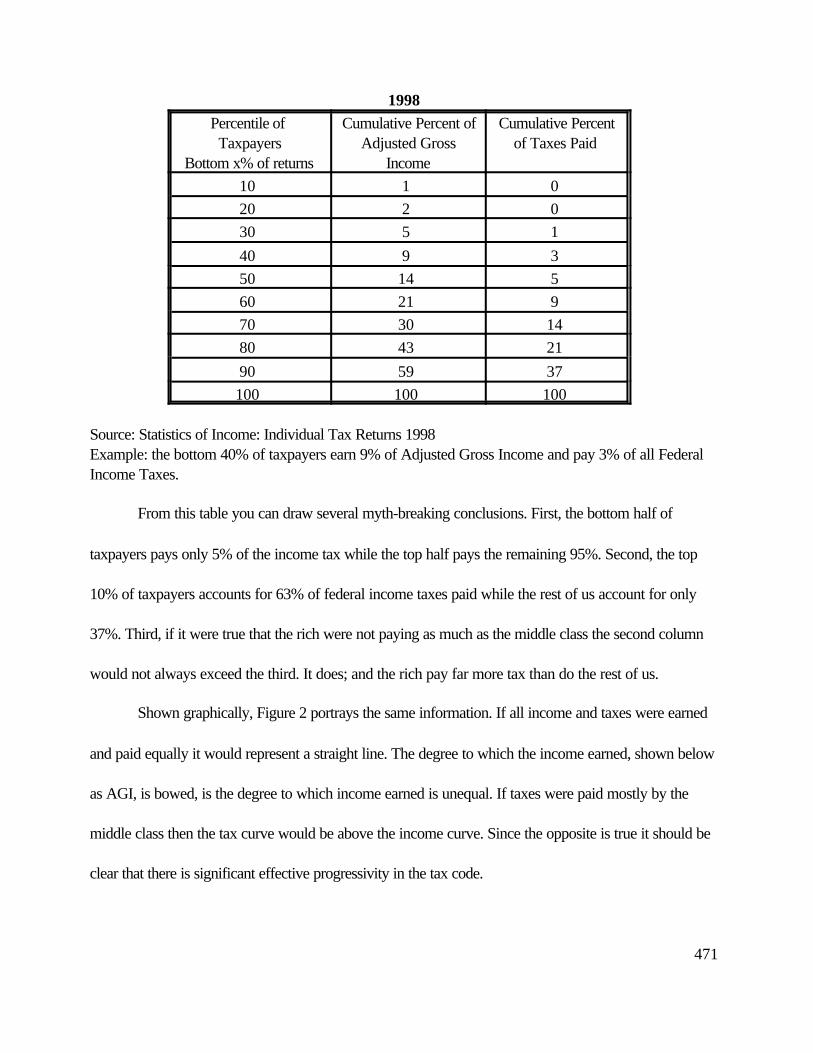
rich do not pay their fair share. A look at Table 2 below should begin to dispel that myth. The first
column indicates the percentile of tax returns while the second and third column indicate the percent of
income earned and taxes paid by everyone at or below that percentile. For instance, the bottom 40% of
earners account for 9% of income and 3% of taxes paid.
Table 2Distribution of Taxes
471
1998Percentile of Taxpayers
Bottom x% of returns
Cumulative Percent ofAdjusted Gross
Income
Cumulative Percentof Taxes Paid
10 1 0 20 2 0 30 5 1
40 9 3 50 14 5 60 21 9 70 30 14 80 43 21
90 59 37 100 100 100
Source: Statistics of Income: Individual Tax Returns 1998Example: the bottom 40% of taxpayers earn 9% of Adjusted Gross Income and pay 3% of all FederalIncome Taxes.
From this table you can draw several myth-breaking conclusions. First, the bottom half of
taxpayers pays only 5% of the income tax while the top half pays the remaining 95%. Second, the top
10% of taxpayers accounts for 63% of federal income taxes paid while the rest of us account for only
37%. Third, if it were true that the rich were not paying as much as the middle class the second column
would not always exceed the third. It does; and the rich pay far more tax than do the rest of us.
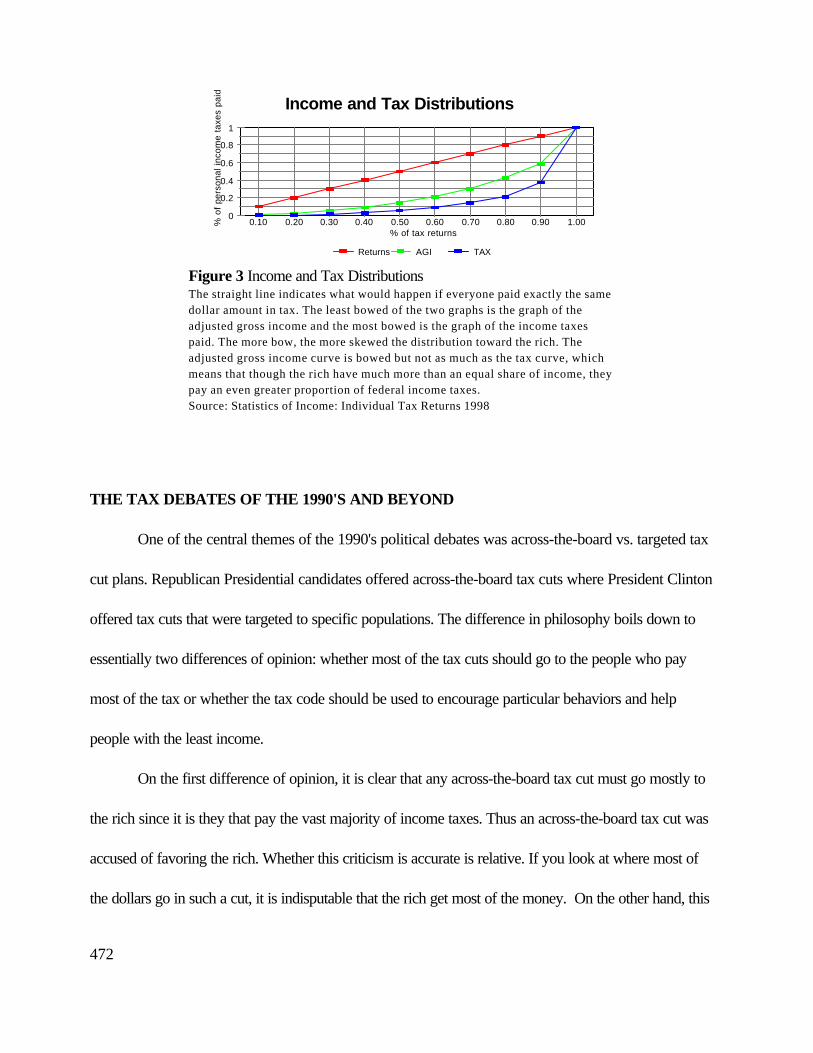
Shown graphically, Figure 2 portrays the same information. If all income and taxes were earned
and paid equally it would represent a straight line. The degree to which the income earned, shown below
as AGI, is bowed, is the degree to which income earned is unequal. If taxes were paid mostly by the
middle class then the tax curve would be above the income curve. Since the opposite is true it should be
clear that there is significant effective progressivity in the tax code.
472
0
0.2
0.4
0.6
0.8
1
% o
f per
sona
l inc
ome
taxe
s pa
id0.10 0.20 0.30 0.40 0.50 0.60 0.70 0.80 0.90 1.00
% of tax returns
Returns AGI TAX
Income and Tax Distributions
Figure 3 Income and Tax DistributionsThe straight line indicates what would happen if everyone paid exactly the samedollar amount in tax. The least bowed of the two graphs is the graph of theadjusted gross income and the most bowed is the graph of the income taxespaid. The more bow, the more skewed the distribution toward the rich. Theadjusted gross income curve is bowed but not as much as the tax curve, whichmeans that though the rich have much more than an equal share of income, theypay an even greater proportion of federal income taxes.Source: Statistics of Income: Individual Tax Returns 1998
THE TAX DEBATES OF THE 1990'S AND BEYOND
One of the central themes of the 1990's political debates was across-the-board vs. targeted tax
cut plans. Republican Presidential candidates offered across-the-board tax cuts where President Clinton
offered tax cuts that were targeted to specific populations. The difference in philosophy boils down to
essentially two differences of opinion: whether most of the tax cuts should go to the people who pay
most of the tax or whether the tax code should be used to encourage particular behaviors and help
people with the least income.
On the first difference of opinion, it is clear that any across-the-board tax cut must go mostly to
the rich since it is they that pay the vast majority of income taxes. Thus an across-the-board tax cut was
accused of favoring the rich. Whether this criticism is accurate is relative. If you look at where most of
the dollars go in such a cut, it is indisputable that the rich get most of the money. On the other hand, this
473
is because they pay the most. Giving a tax cut to the poor gives a tax cut to people who do not pay any
federal income taxes to begin with.
Because of the progressivity of the tax code, simply reducing the tax rate by a fixed percentage
not only gives more of a tax break to upper income Americans, it also changes the income distribution in
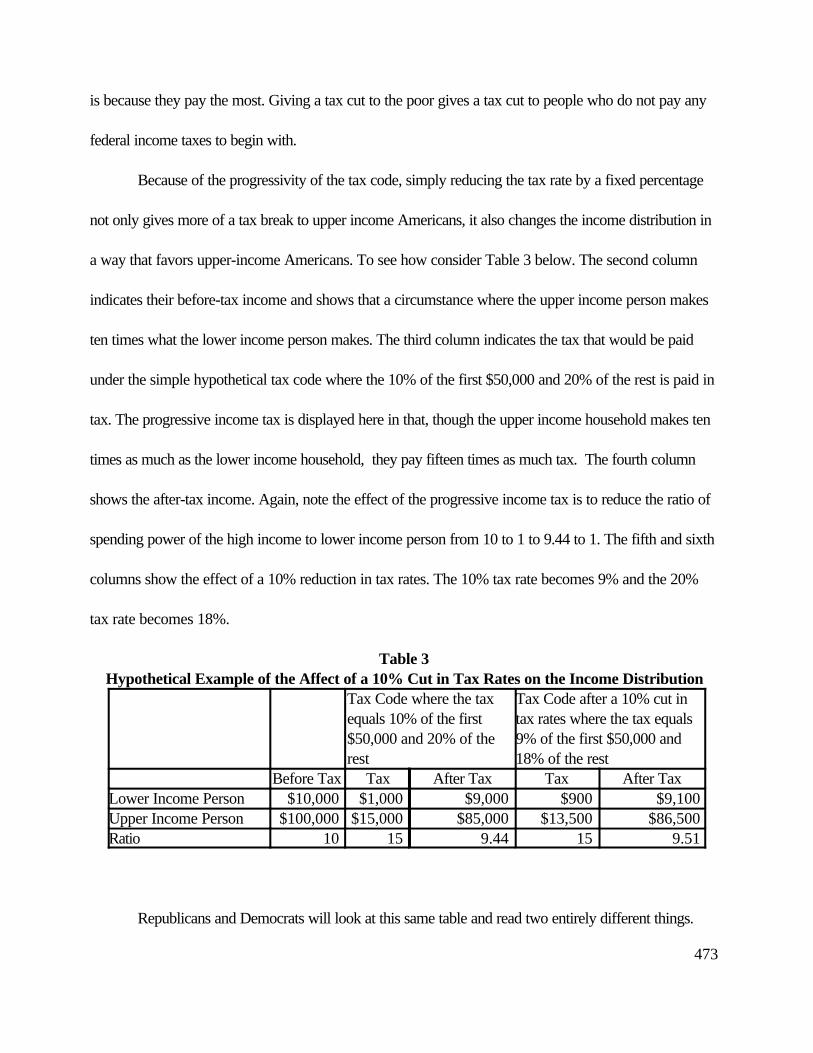
a way that favors upper-income Americans. To see how consider Table 3 below. The second column
indicates their before-tax income and shows that a circumstance where the upper income person makes
ten times what the lower income person makes. The third column indicates the tax that would be paid
under the simple hypothetical tax code where the 10% of the first $50,000 and 20% of the rest is paid in
tax. The progressive income tax is displayed here in that, though the upper income household makes ten
times as much as the lower income household, they pay fifteen times as much tax. The fourth column
shows the after-tax income. Again, note the effect of the progressive income tax is to reduce the ratio of
spending power of the high income to lower income person from 10 to 1 to 9.44 to 1. The fifth and sixth
columns show the effect of a 10% reduction in tax rates. The 10% tax rate becomes 9% and the 20%
tax rate becomes 18%.
Table 3Hypothetical Example of the Affect of a 10% Cut in Tax Rates on the Income Distribution
Tax Code where the taxequals 10% of the first$50,000 and 20% of therest
Tax Code after a 10% cut intax rates where the tax equals9% of the first $50,000 and18% of the rest
Before Tax Tax After Tax Tax After TaxLower Income Person $10,000 $1,000 $9,000 $900 $9,100 Upper Income Person $100,000 $15,000 $85,000 $13,500 $86,500 Ratio 10 15 9.44 15 9.51
Republicans and Democrats will look at this same table and read two entirely different things.
474
The Republicans will say that under both tax codes the upper income people are paying fifteen times the
taxes that the lower income people are paying. Moreover, they will claim that any tax cut that helps the
poor will change the distribution of taxes to be even further slanted to upper income people. Democrats
will focus on the distribution of after-tax income figure and note that an across-the-board tax cut
increases the ratio of an upper income person’s after-tax income to a lower income person’s after- tax
income from 9.44 to 9.51. As a result, though an across-the-board tax cut keeps the percentage of
government funded by each group the same, it changes the after-tax income distribution in favor of the
rich.
The other great debate of the 1990's centered on unraveling the 1986 tax reform law that
eliminated most social engineering from the tax code. Prior to that year there were thousands of
provisions that were included to induce people to do a variety of things. The law passed in 1986
eliminated almost all of them. Slowly, but steadily, the Clinton administration sought provisions to again
urge people in particular directions. For instance, they sought and got partial tax deductions and credits
for higher education. Vice President Gore, while campaigning for President in 2000 argued to make
those deductions and credits complete.
Regardless of the politics of the time, taxes are always going to be the focal point for debate.
Because the federal government accounts for more than a fifth of the economy, who pays for that fifth
and who gets the benefit of that fifth will always be the subject of debate.
CHAPTER SUMMARY
You now understand how taxes work and are able to apply that knowledge and the concepts of
horizontal and vertical equity to the US tax code. You understand the tradeoff that exists between
475
simplicity and horizontal equity and understand that in theory taxes can alter the incentives of people to
work and save but that little effect has actually been shown. You know that this has not stopped policy
makers from using taxes to motivate other socially desirable outcomes. Lastly, you should be able to
understand in a greater context the debates over taxes that have taken place during the 1990's and
continue today.
KEY TERMSWithholdingAdjusted Gross IncomeCapital GainsExemptionsDeductionsStandard DeductionItemized Deductions
DeductibleTaxable IncomeFiling StatusProgressiveMarginal Tax RateHorizontal EquityVertical Equity
476
Quiz Yourself
Which of following reduces taxes directlya) the standard deductionb) itemized deductionsc) the earned income tax creditd) the personal exemption
Which of the following reduces taxable incomea) the standard deductionb) itemized deductionsc) the personal exemptiond) all of the above
If a person were given the choice of a $500 credit or a $500 deduction a) he would take the deduction every time.b) he would take the credit every time.c) he would take the deduction if he were rich and the credit if he were poor.d) he would take the deduction if he were poor and credit if he were rich.
If a person were given the choice of a $500 credit or a $2500 deduction a) he would take the deduction every time.b) he would take the credit every time. c) he would take the deduction if he were rich (in the 28% tax bracket) and the credit if he were poor
(in the 15% tax bracket).d) he would take the deduction if he were poor (in the 15% tax bracket) and credit if he were rich (in
the 28% tax bracket).
The thought that a tax cut would increase savings a) is not logical.b) is obvious and indisputable.c) depends on the substitution effect overwhelming the income effect.d) depends on the income effect overwhelming the substitution effect.
The bottom half of the income scale paysa) more than half of personal income taxes.b) slightly less than half of personal income taxes.c) about a quarter of personal income taxes.d) about 5% of personal income taxes.
477
An across-the-board tax cut woulda) keep the proportion of tax paid by those at the upper end of the income scale constant.b) increase the proportion of after-tax income accruing to upper income people.c) have a large proportion of the tax cut go to upper income people.d) all of the above
Referring to Table 1, compute the amount of taxes owed if a single person makes $50,000.
Referring to Table 1, compute the amount of taxes owed if a married person makes $75,000.
Explain the difference between a $500 credit and a $500 deduction. Show that for a low-middle incomeperson a $500 credit is better than a $2500 deduction while the opposite is true for a rich person.
Think About ThisShould the next tax cut be “targeted” or across-the-board.
If we decide that taxes need to be raised after we have already passed a targeted cut, should the cut beeliminated, or should the targeted tax cut be kept and higher taxes placed on the rich.
Talk About ThisShould incomes taxes simply raise revenue or should provision in the code be used for social engineeringprojects like encouraging people to further their education or buy electric cars.
For More Insight SeeCitizens for Tax Justice The Hidden Entitlements Washington D.C.
Slemrod, Joel; “Do We Know How Progressive the Income Tax Should Be?” National Tax Journal Vol36 NO 3
Slemrod Joel Do Taxes Matter? The Impact of the Tax Reform Act of 1986 Cambridge MA MITPress 1991
Hyman, David Public Finance : A Contemporary Application of Theory to Policy 6th ed DrydenPress Chapters 13 and 14 in particular
All forms can be found at http://www.irs.gov
![Chapter 718: MUNICIPAL INCOME TAXES [Operative Until 1/1 ... · Chapter 718: MUNICIPAL INCOME TAXES 718.01 [Operative Until 1/1/2016] Municipal income tax rates. (A) As used in this](https://img.pdfslide.us/doc/110x75/5ff0113c39f7093c03255bc3/chapter-718-municipal-income-taxes-operative-until-11-chapter-718-municipal.jpg)