Embed Size (px)
Citation preview
University of Missouri, St. LouisIRL @ UMSL
Dissertations UMSL Graduate Works
7-15-2011
Person-Organization Fit as a Barrier to EmployeeCreativityAngela M. FarabeeUniversity of Missouri-St. Louis, [email protected]
Follow this and additional works at: https://irl.umsl.edu/dissertation
Part of the Psychology Commons
This Dissertation is brought to you for free and open access by the UMSL Graduate Works at IRL @ UMSL. It has been accepted for inclusion inDissertations by an authorized administrator of IRL @ UMSL. For more information, please contact [email protected].
Recommended CitationFarabee, Angela M., "Person-Organization Fit as a Barrier to Employee Creativity" (2011). Dissertations. 427.https://irl.umsl.edu/dissertation/427
Farabee, Angela, 2011, UMSL, p. 1
PERSON-ORGANIZATION FIT AS A BARRIER TO EMPLOYEE CREATIVITY
by
Angela M. Farabee
M. A., Psychology, University of Missouri – Saint Louis, 2009
B. S., Psychology, Truman State University, 2006
A DISSERTATION
Submitted to the Graduate School of the
UNIVERSITY OF MISSOURI – ST. LOUIS
In Partial Fulfillment of the Requirements for the Degree
DOCTOR OF PHILOSOPHY IN PSYCHOLOGY
with an emphasis in Industrial and Organizational
August 2011
Advisory Committee
James Breaugh, Ph.D.
Chairperson
Deborah Balser, Ph.D.
John Meriac, Ph.D.
Stephanie Merritt, Ph.D.
Farabee, Angela, 2011, UMSL, p. 2
Acknowledgements
I would like to acknowledge all of those involved with helping me reach the goal I
have had since I was 16 years old. In particular, I have a vast amount of gratitude and
respect for my advisor, Dr. James Breaugh. His keen insight, thought provoking questions,
and dedicated quick draft turnaround helped me constantly move forward in this process;
for both the thesis and the dissertation. A sincere thank you goes to you, Jim. I would like
to thank my dissertation committee, Dr. Stephanie Merritt, Dr. John Meriac, and Dr.
Deborah Balser, for providing both their suggestions and time which helped make for a
stronger dissertation. I appreciate all of the professors I have had in graduate school who
have helped me acquire the knowledge and skills needed to create this dissertation and to
be successful in future, especially Drs. Macan and Tubbs. I believe UMSL has a very
strong I/O psychology program and I am so happy to have been accepted in the first place
and now to have finished what I started. I also want to thank the numerous professors who
let me take class time to collect data in just one month, without which, I would still be
collecting data. A big thank you goes to my cohort and fellow I/O program students for
providing laughs and mutual understanding. Graham Wohler was immensely helpful when
I needed advice or a careful editor and cannot thank him enough.
On a personal level, this dissertation and graduate school process was made much
easier with the overwhelming support of my wonderful parents and sister, Marilyn, Bill
and Erin, patient and caring boyfriend, Chris Schneider, and thoughtful friends. I will
always be grateful for their constant love and look forward to spending more time with
them. Lastly, I would like to acknowledge my Grandpa Farabee and Uncle Jack Farabee;
they know why.
Farabee, Angela, 2011, UMSL, p. 3
Abstract
The relationship between person-organization fit (PO fit) and creativity was investigated in
this study. Based on the attraction-selection-attrition framework (Schneider, 1987), over
time organizational members become more homogeneous (e.g., on cultural values) which
may be less conducive for individual employee creativity. Person-organization fit, defined
as congruence on the non-creativity values from the competing values model (Quinn,
1988), was hypothesized to negatively relate to creativity. This had partial support for
internal processes value fit when considering individuals in a low creative culture,
otherwise it was unsupported. It was also hypothesized and moderately supported that fit
on creativity/innovation value would be positively related to creativity. Individual
conformity preference and willingness to take risks were included as moderators. Risk-
taking was the only significant moderator and was only significant for the relationship
between creativity/innovation value fit and creativity. Based on an exploratory analysis,
anticipated reward for creativity was the largest positive predictor of creativity compared
to fit and other predictors of creativity. A sample of currently working or previously
employed undergraduate and graduate students served as participants and the outcome
variable (i.e., creativity) was collected from supervisors and coworkers. Differences in the
results between self and other ratings are discussed.
Keywords: Person-organization fit, creativity, competing values model
Farabee, Angela, 2011, UMSL, p. 4
Person-Organization Fit as a Barrier to Employee Creativity
Organizational leaders are beginning to recognize the value of promoting the
creativity and innovation of their employees. In a recent survey of company executives,
83% mentioned innovation as part of their organization’s economic recovery strategy
(Andrew, 2010). In order to be innovative, employees must initially be creative. The
implication for organizations seeking to be innovative is that they must first focus on
cultivating creativity within the organization. While creativity and innovation are related,
they are distinct. Creativity is the production of ideas around products, processes, or
procedures that are novel or original and potentially useful to the employing organization
(Amabile, 1983) and innovation is the implementation of those creative ideas (West &
Atlink, 1996). In this economy, organizations and their members need to be able to create
and innovate to remain competitive in their market (Andrew, 2010). While researchers
have identified many barriers and promoters of the first stage of innovation, creativity
(e.g., Shalley, Zhou, & Oldham, 2004), minimal attention has been given to a potential
barrier of creativity, person-organization fit.
Person-organization fit (PO fit) can be defined as the congruence between
individuals and organizations for which they work on a host of different dimensions (e.g.,
values, goals, personality; Kristof, 1996). Typically, PO fit is related to important work
outcomes for both the employee and the organization, regardless of which dimension is
used (Arthur, Bell, Villado, & Doverspike, 2006; Hoffman & Woehr, 2006; Kristof-
Brown, Zimmerman, & Johnson, 2005; Verquer, Beehr, & Wagner, 2003). The better the
fit, the more committed employees are to their organizations, the more satisfied they are
with their organization and job, and the less likely they are to leave their organizations.
Farabee, Angela, 2011, UMSL, p. 5
The previous examples are representative of the PO fit literature in that the outcomes
typically investigated are positive (Harrison, 2007). That is, the more a person fits with the
organization, the more positive the outcomes. However, based on theoretical models (i.e.,
attraction-selection-attrition framework, Schneider, 1987; strength of weak ties,
Granovetter, 1973) and related research, individuals with a strong fit with an organization
may be less likely to be creative. Although the proposed negative link between PO fit and
creativity has not yet been investigated in the literature, a parallel example can be drawn
from research on teams. Some research suggests that the more similar team members are,
particularly on demographic variables, the less creativity they exhibit (Milliken, Bartel, &
Kurtzberg, 2003; West, 2001). Likewise, the more diverse a team, the more creative ideas
result (cf., Shin & Zhou, 2007; Zhou & Shalley, 2011). Potentially, based on this example,
employees with a high PO fit may not be as creative as those who have less of a fit with
the organization. Given the importance of fostering employee creativity, the purpose of this
study was to fill the gap in the literature concerning the relationship between PO fit and
individual employee creativity. In addition to PO fit, a selection of already established
predictors of creativity was included in this study in order to expand the nomological
network surrounding these constructs. Lastly, individuals’ preference for conformity and
willingness to take risks were investigated as potential moderators between the relationship
of PO fit and individual employee creativity (see Figure 1).
Theoretical Foundation
Attraction-Selection-Attrition. Schneider’s (1987) attraction-selection-attrition
(ASA) framework for organizations provides the foundation for the hypothesis that
individuals’ creativity at work may be negatively impacted by a high fit between the
Farabee, Angela, 2011, UMSL, p. 6
employee and the organization. The main premise of ASA is that individuals are attracted
to and selected by organizations that are similar to them. Moreover, individuals who do not
believe they fit with the organization tend to turnover. As the ASA cycle continues, the
resulting workforce is suggested to become more homogeneous in terms of its values,
attitudes, and personality (Schneider, Goldstein, & Smith, 1995). Jordan, Herriot, and
Chalmers (1991) and Schneider, Smith, Taylor, and Fleenor (1998) found similar results
confirming that homogeneity in organizations exists. In their studies, they established that
organizations could be differentiated based on personality measures of their top
management. Specifically, top management within an organization displayed similar
personality profiles to one another, whereas top management between organizations
displayed different personality profiles. This homogeneity may result in less creativity and
innovation (e.g., due to shared mental models; Schneider et al., 1995).
Additional demonstrations that organizations become homogeneous over time have
been studied indirectly using PO fit. For example, the higher the anticipated PO fit, the
more attracted applicants are to the organization and the more likely they are to pursue a
job with the company (Chapman, Uggerslev, Carroll, Piasentin, & Jones, 2005). Once
selected by an organization, those with high PO fit tend to stay and those who do not fit
will likely leave (Chatman, 1989; Kristof-Brown et al., 2005). Overall, the ASA model has
continued to receive support and suggests that, over time, organizations will become more
homogeneous (Giberson, Resick, & Dickson, 2005; Schneider, 2008).
Individuals interacting with similar others in an organization can create an
environment of shared values and norms, that is, a strong homogeneous organizational
culture. Organizational culture can be defined as ―the pattern of shared beliefs and values
Farabee, Angela, 2011, UMSL, p. 7
that gives members of an institution meaning, and provides them with the rules for
behavior in their organization‖ (Davis, 1984, p. 1). In a strong organizational culture, most
employees will abide by the same rules. Any behavior that is outside of that routine will
likely not be engaged in. In addition, individuals are more likely to have similar mental
models, that is, similar ways of thinking (Schneider et al., 1995). Those with similar
mental models are less likely to think divergently (e.g., identifying multiple solutions to a
problem) and creativity has been found to improve with divergent thinking (e.g., Basadur,
Wakabayashi, & Graen, 1990; Mumford & Gustafson, 1988).
Strength of weak ties. Beyond the ASA framework, little theory and research
exists to support why there should be a negative link between PO fit and creativity.
However, although not directly tested in the current study, additional support can be
garnered from Granovetter’s (1973) strength of weak ties theory. Specifically, the strength
of weak ties theory helps explain why individuals maintain the status quo by following the
norms and culture of their organization as opposed to being creative.
The premise of weak ties is that there are social networks of individuals consisting
of those who are close to us (strong ties) and others who are not as close and are more like
acquaintances (weak ties). Granovetter (1973) suggested that individuals have both weak
and strong ties to others (e.g., perceived closeness, frequency of interaction, emotional
intensity). Employees who belong to a dense collection of strong ties (i.e., a group of
mutually connecting strong ties) often share similar information and perspectives (Burt,
2004; Zhou, Shin, Brass, Choi, & Zhang, 2009). This similarity stems from the concept of
homophily (Byrne, 1971). That is, individuals naturally prefer to interact with others who
are similar to them; not unlike how the ASA framework suggests that employees will
Farabee, Angela, 2011, UMSL, p. 8
turnover when they are not similar to others in the organization (e.g., lack of PO fit). In
turn, by interacting with similar others, the perceptions and attitudes of every individual
tend to be reinforced. The potential result is the creation of social pressures to conform to
the current norms of the organization or group. Beyond conformity, individuals may have
perceptual blinders to other opportunities due to their shared mental models (Das & Teng,
1999). That is to say an individual might not have enough differing information to offer
any new and useful ideas.
On the other hand, connections with weak ties are thought to provide accessibility
to diverse perspectives and experience, to spread ideas, and to challenge existing
assumptions (Brass, 1995; Granovetter, 1973; cf., Burt, 1992) which are valuable for
creativity (e.g., Amabile 1983; Perry-Smith, 2006). Both Perry-Smith (2006) and Zhou et
al. (2009) found support for the positive relationship between the number of weak ties
individuals had and creativity; supporting the idea that there is strength in weak ties (e.g.,
more creativity). In addition, Zhou et al. (2009) found that the number of weak ties
promotes creativity up to a point and then their usefulness is diminished (i.e., a curvilinear
relationship). The explanation behind this finding was that an abundance of weak ties may
actually be detrimental to creativity because it would be more challenging to (a) have
meaningful discussions with many weak ties and (b) to synthesize all the diverse
information. Mechanisms suggested by the strength of weak ties theory for why PO fit
should be related to creativity (e.g., differing information and perspectives) were not
considered currently as social network methodology was beyond the purposes of this
study.
Farabee, Angela, 2011, UMSL, p. 9
Before leaving the strength of weak ties theory, a few more insights can be
garnered from the two studies previously cited (i.e., Perry-Smith, 2006 and Zhou et al.,
2009). In both Perry-Smith (2006) and Zhou et al. (2009), the number of strong ties an
individual had was not related to creativity. Zhou et al. (2009) hypothesized that this
relationship would be negative for the reasons that strong ties may make individuals
conform or expose them only to the similar information. Zhou et al. suggested the
explanation for the non-significant relationship found between the two could be that the
number of strong ties has both a positive and negative effect on creativity; therefore,
cancelling out the relationship. There is a potential positive effect as strong ties provide
support to the employee, and support from both supervisors and coworkers have been
found to positively influence creativity (e.g., Amabile, Conti, Coon, Lazenby, & Herron,
1996). The possible negative effect is as the strength of weak ties theory would suggest;
the lack of differing perspectives may impede creativity. Although I hypothesized that
there will be a negative relationship between PO fit and creativity, as opposed to a non-
significant relationship, other correlates of creativity (e.g., supervisor support) were
included, not only to expand the nomological network, but also to help explain some of the
findings.
Interactionist perspective on behavior. An overarching connector between PO fit
and creativity is that they both stem from the interactionist perspective (Lewin, 1936;
Pervin, 1989). The crux of the interactionist perspective is that behavior is not solely a
function of individual characteristics (Allport, 1937) or solely a function of situational
characteristics (Mischel, 1968); instead, it is the joint effects of the individual and the
environmental characteristics that determine behavior. Person-organization fit influences
Farabee, Angela, 2011, UMSL, p. 10
behavior because of the interacting effect of the characteristics of the individual and the
environment (Edwards, 2008) and creativity (i.e., behavior) is thought to be influenced by
both individual and environmental characteristics (Amabile, 1983; Woodman &
Schoenfeldt, 1990; Woodman, Sawyer, & Griffin, 1993). In order to provide context for
the present study, an examination of the conceptualizations of both PO fit and creativity
will be presented.
Conceptualization of PO Fit
As previously mentioned, PO fit has often been defined as the congruence between
an individual’s characteristics and the organization’s characteristics (Kristof, 1996). The
two words in the definition of PO fit that need further explanation are ―congruence‖ and
―characteristics.‖ Congruence has been conceptualized in two main ways, supplementary
fit and complementary fit (Muchinsky & Monahan, 1987). Supplementary fit focuses on
the similarity between the person and the organization (e.g., they share similar values) and
complementary fit is a mutually fulfilling relationship between the person and the
organization, where one provides what the other requires. Complementary fit is further
delineated into needs-supplies and demands-abilities fit. Needs-supplies fit is strong when
the organization provides something an individual needs or values (e.g., job security). The
second type of complementary fit is demands-abilities fit in which the person has the
abilities to cope with organizational demands (e.g., ability to be cooperative because
teamwork demands cooperation).
Given that the ASA framework purports that organizational members tend to be
similar to each other, this study assessed supplementary fit as it measures employees’
similarity between themselves and the organization. Also, needs-supplies fit was included
Farabee, Angela, 2011, UMSL, p. 11
in the present study to understand how the congruence between what employees want in an
organization and what they actually receive affects creativity. Organizations have some
control over what they offer to employees so it is important to understand its influence for
the practical purpose of fostering creativity. Demands-abilities fit has been studied in the
small extant literature of PO fit and creativity together (e.g., Choi, 2004); however, it is the
other two types of fit that are necessary to test for a negative relationship between PO fit
and creativity. This is based on how ―characteristics‖ has been defined, which is described
next.
The second word in the definition of PO fit that needs to be further addressed is
what is meant by ―characteristics‖ of the organization and of the individual. Although other
operational definitions exist (e.g., needs, goals, personality), most often fit is defined as
being between a person’s values and the organization’s values (Chatman, 1989; Kristof-
Brown, et al., 2005). Values can be defined as beliefs that transcend situations and that
guide behavior (Schwartz, 1992). Organizational cultural values and individuals’ preferred
organizational cultural values were the characteristics used in the current study (i.e., needs-
supplies values fit). Demands-abilities fit is not applicable when ―characteristics‖ are
defined as values. Values define the culture of the organization, which in turn, partially
determines employees’ behavior (Schein, 1992). Based on certain values employees may
act (or not act) in certain ways. For instance, if an organization is very rule-oriented,
employees may not offer creative suggestions that would challenge any established rules.
Organizational values can be condensed into a few components as demonstrated with the
competing values model (Quinn, 1988).
Farabee, Angela, 2011, UMSL, p. 12
The values chosen for this study were derived from Quinn and Rohrbaugh’s (1981,
1983) competing values model, a model recommended for use in PO fit research by
Ostroff, Shin, and Kinicki (2005) and Meyer, Hecht, Gill, and Toplonytsky (2010). The
competing values model consists of two dimensions that make up four quadrants (see
Figure 2). However, these quadrants are not mutually exclusive but rather organizations
can have differing degrees of each quadrant (Cameron & Quinn, 1999). The first
dimension reflects organizational structure and ranges from control (e.g., valuing stability,
planning, and continuity) to flexibility (e.g., valuing decentralization, differentiation, and
experimentation). The second dimension ranges from internal, where the focus is on the
interests and growth of individuals in the organization to external, where the focus is on
the interests and growth of the organization itself (Quinn & Rohrbaugh, 1981). These two
dimensions create four quadrants that are representative of organizational culture (e.g.,
Howard, 1998). The four quadrants on which organizations can vary are human relations
(flexibility, internal), rational goal (control, external), internal processes (control, internal),
and particularly relevant to creativity, open systems (flexibility, external; Quinn 1988).
Again, following Meyer et al. (2010) and Cameron and Quinn (1999), instead of
categorizing organizations into one quadrant, organizations instead should be characterized
as having differing degrees of each quadrant. That is, each of the four values becomes a
component of an organization’s culture (Meyer et al., 2010).
Organizations that value human relations have an internal focus on employee
development with flexibility in how employees will interact. A focus on teamwork,
employee morale, and cohesion are characteristic of the human relations value. Rational
goal value describes organizations with a competitive, achievement-oriented culture where
Farabee, Angela, 2011, UMSL, p. 13
organizational productivity is the goal. The internal processes value is characterized by
organizations that support rules for employees, timeliness, and efficiency. A bureaucratic
organization would be described as having a strong internal processes value. The last
value, hereafter referred to as creativity/innovation value, characterizes organizations as
supportive of innovation, growth, and adaptability.
Before leaving the discussion on the conceptualization of PO fit, another aspect that
needs attention is how to measure these conceptualizations. There are three main ways:
perceived, subjective, and objective (Kristof-Brown & Guay, 2011). Both
conceptualizations (i.e., supplementary and complementary fit) can be measured any of
these ways. Perceived measures ask individuals to assess the degree of fit with an
organization they feel they have (e.g., I feel my values are similar to the organizations—for
supplementary fit; I believe the organization provides the values I need in an
organization—complementary fit). Perceived measures do not assess fit as the person and
the organization separately as the interactionist perspective would support; however,
subjective and objective measures do.
A subjective PO fit measure consists of individuals assessing their characteristics
and then separately assessing their organization’s characteristics. Objective PO fit is
similar to subjective PO fit with the exception that organizational members separate from
the main individual make an assessment of the characteristics of the organization. There
has been confusion over these labels in the literature (Kristof-Brown & Guay, 2011). For
example, the labels of perceived and subjective measures have been switched in the past
(e.g., Hoffman & Woehr, 1996; Kristof, 1996; Verquer et al., 2003). Kristof-Brown and
Guay (2011) have suggested that researchers use definitions that have been described
Farabee, Angela, 2011, UMSL, p. 14
currently in keeping with the early foundations of PO fit research (i.e., French, Rogers, &
Cobb, 1974). The supplementary conceptualization in this study was assessed with a
perceived measure which asks individuals to determine how similar they believe they are
to the organization’s values. The needs-supplies fit conceptualization was assessed with a
subjective measure which asks individuals to determine the values they want in an
organization and then separately determine the values that describe their organization.
Conceptualization of Creativity
Creativity is the production of novel and potentially useful ideas about products,
processes, and procedures (Zhou & Shalley, 2011). A further conceptualization is that
creativity can be either incremental or radical (Amabile, 1988). For example, not all
creativity must introduce a radical new product, even introducing a helpful procedure like
how to track vacation hours can be considered creative. Likewise, creativity is not
exclusive to research and development or marketing jobs. Creativity can be expressed from
all levels and job areas in an organization (Amabile, 1988).
PO Fit and Creativity
Relatively few studies have specifically focused on PO fit and creativity (except
Choi, 2004; Choi & Price, 2005; Lipkin, 1999; Livingstone, Nelson, & Barr, 1997).
Livingstone et al. (1997) looked at PO fit conceptualized as creativity congruence and how
that fit affects outcomes such as strain, job satisfaction, organizational commitment, and
overall job performance. The more specific conceptualizations of PO fit used were
creativity needs-supplies fit and creativity demands-abilities fit assessed via a subjective
measure. For needs-supplies fit, when both the individual and the organization value
creativity there is creativity congruence. For demands-abilities fit, when the organizational
Farabee, Angela, 2011, UMSL, p. 15
demands require creativity and the employee has the ability to meet those demands, there
is also creativity congruence. Although many outcomes were included in this study, actual
individual creative behavior was not addressed. Results showed that creativity demands-
abilities fit did positively relate to strain and job performance. Also, the environment (both
organizational demand for creativity and organizational supply of creativity value) had a
stronger influence on the outcomes than did the individual creativity value or ability.
Choi (2004) extended Livingstone et al.’s (1997) research by also looking at both
creativity needs-supplies fit and creativity demands-abilities fit except on actual creative
behavior (using subjective fit measures). In a classroom setting, students’ creativity value
and ability predicted professors’ creativity ratings at the end of the semester. The
environment did not predict professors’ ratings nor did the fit between the person and
environment. The author suggested that there was little variance in the classes as they were
all structured similarly; thereby, the variance of the environment was limited (i.e., range
restriction) which is a potential reason neither the environment nor the person-environment
fit were significant predictors.
Choi and Price (2005) also researched creativity needs-supplies fit and creativity
demands-abilities fit as did Choi (2004) but investigated the outcomes of implementation
intention (affect) and implementation behavior regarding a company’s switch to a
paperless cyber culture. Their findings demonstrated that having an organization that
supported creativity (i.e., environmental supply of creativity) influenced implementation
intentions and both individuals’ value level for creativity and creative ability predicted
actual implementation behavior. The results from Choi and Price (2005), Livingstone et al.
(1997) and Choi (2004) suggest that while creativity congruence is an important predictor
Farabee, Angela, 2011, UMSL, p. 16
of work outcomes, individual characteristics and the creative work culture may also
contribute to work outcomes beyond the congruence between the individual and the
environment (e.g., organizational culture).
Another common thread in these studies is that they used fit, be it needs-supplies fit
or demands abilities-fit, defined as creativity congruence and found it to be positively
related to creativity and other outcomes. Moreover, these studies all only tested one
dimension of values congruence, creativity. It is intuitive that the more creativity value
congruence on needs-supplies fit, the more creative behaviors result. However, there are
cultural values beyond creativity (Schwartz, 1992). Given that individuals and
organizations have multiple values which partially guide behavior, investigating a larger
set of values (e.g., competing values model) is pertinent to theory development. It is
pertinent because including additional values on which organizations and individuals may
fit will expand our understanding of how PO fit relates to creativity. Further understanding
may also guide organizations in establishing a culture that supports creativity and
innovation.
Lipkin (1999) also studied the relationship between PO fit and a variation of
creativity. The variation of creativity included was creative ideation (i.e., self-rated ability
to think creatively). The Organization Culture Profile (OCP; O’Reilly, Chatman, &
Caldwell, 1991) was used to rate PO fit using a sample of 49 employees at an insurance
company. The OCP required participants to rank 54 values by what they want in an
organization and then rank the same values in the order that described the organization.
The profiles were then compared via difference scores. Contrary to the current
investigation, Lipkin hypothesized a positive relationship between fit and creative ideation.
Farabee, Angela, 2011, UMSL, p. 17
The rationale was that the OCP contains some items that may support creative ideation
(e.g., risk-taking) and that the fit literature suggests that fit has a positive influence on
outcomes. No significant relationship was found between PO fit and creative ideation;
however, Lipkin mentioned her main limitation was low statistical power hindering the
ability to find a significant relationship. An additional concern not addressed within her
study was that difference scores were used to compare individuals’ values to the
organization’s values. Many issues are associated with the use of difference scores
(Edwards, 2002; 1993). Edwards (1993) explains that using difference scores to calculate
the similarity between profiles obscures the sources of differences. Also, the profile is
ambiguous because it combines conceptually distinct measures into one entity (e.g.,
heterogeneous values). The fact that this was the method employed could have influenced
the results. For example, while some values may have promoted creative ideation, other
values may not have and this distinction was lost by using difference scores.
The Current Study
In summary, the ASA model suggests that as time passes, organizations become
more homogeneous. The implication is that employees are similar in terms of their values
(Schneider, 1987). In turn, the more similar employees are to one another, the less creative
they will likely be due to shared mental models and maintenance of the status quo (e.g.,
Granovetter, 1973). Since creativity is defined, in part, by suggesting new ways of
proceeding, employee creativity does challenge the status quo of an organization,
something from which an individual with a strong PO fit may refrain. The goals of this
study were to investigate the relationship between PO fit and creativity compared to the
Farabee, Angela, 2011, UMSL, p. 18
already established predictors of creativity as well as to investigate two potential boundary
conditions around PO fit and creativity (see Figure 1).
Person-organization fit should not be solely defined in terms of creativity value
congruence (e.g., Livingstone et al., 1997). Given that individuals and organizations have
multiple values (Schwartz, 1992), taking into account a wider set of values should allow
for a more comprehensive understanding of the relationship between PO fit and creativity.
For example, according to the competing values model, the internal processes value is
characterized by rigidness and predictability (Meyer et al., 2010). Congruence on this
value is less likely to promote creativity. The four value components (i.e., human relations,
internal processes, rational goal, creativity/innovation) from the competing values model
are representative of organizations (Ostroff et al., 2005) and are recommended for use in
congruence research (e.g., PO fit). Using this model, employees determined what specific
values they want in an organization and what values they believe are characteristic of their
organization (i.e., subjective needs-supplies PO fit). In addition to the four specific value
components, a general supplementary PO values fit measure was also be incorporated. The
general PO values fit measure asked employees to judge how well they fit with the
organization (i.e., a perceived fit measure). The defining feature of a general PO values fit
measure is that it taps the individual’s overall similarity to the organization’s values
(Kristof, 1996). Considering there are moderate to strong relationships between outcomes
and supplementary PO fit measures (e.g., Hoffman & Woehr, 2006; Verquer et al., 2003),
coupled with the idea that the ASA model is based on organizational homogeneity (i.e.,
member similarity), inclusion of this measure is warranted.
Farabee, Angela, 2011, UMSL, p. 19
The two conceptualizations of PO fit that were included are meant to complement
each other in that both are hypothesized to relate negatively to creativity. The advantage of
using the subjective needs-supplies PO fit conceptualization over the perceived general
measure is that the interactive effects of the person and the environment can be examined
with the subjective measure as the interactionist perspective would support. It is
hypothesized that individuals who have a strong PO fit, defined here in terms of non-
creativity values congruence (i.e., human relations value, internal processes value, rational
goal value, general PO values fit), will be less likely to be creative on the job. Formally
stated,
Hypothesis 1: Person-organization fit, defined as non-creativity values congruence
(i.e., human relations, internal processes, rational goal, general PO values fit), will be
negatively related to individual employee creativity.
A caveat to the first hypothesis should be offered. Those who have a strong fit with
the organization are still likely to be creative if the culture is one that values, or supports,
creativity (Amabile et al., 1996). Specifically, if one of the organization’s core values is
creativity and the individual also values creativity, then in this case, it is more likely that
PO fit will be positively related to creativity. Personal creativity value was found to
positively relate to students’ class creativity (Choi, 2004). However, further research is
needed to determine if congruence on the value of creativity relates to actual employee
creativity. For example, Choi (2004) did not find that the congruence between the person
and the environment predicted creativity because there was little variance in the
environment. The current study included a heterogeneous sample of organizations to
Farabee, Angela, 2011, UMSL, p. 20
increase the likelihood of capturing more environmental variance. Thus, it was
hypothesized that,
Hypothesis 2: Person-organization fit, defined as creativity/innovation value
congruence, will be positively related to individual employee creativity.
Moderators. The relationship between PO fit and creativity may not be adequately
explained without the inclusion of potential moderators. Although there is limited research
on PO fit and creativity, the rationale for including moderators and an idea of what those
moderators might be can be drawn from relationships in the literature that are similar to PO
fit and creativity. Zhou et al. (2009) applied the strength of weak ties theory to their
hypothesis that the number of strong ties an individual had would negatively relate to
creativity. Strong ties can be characterized as perceived closeness and frequent interaction
with similar others (e.g., Granovetter, 1973; Zhou et al., 2009) much like how those with a
strong PO fit are likely similar to others who fit. Zhou et al. found no significant
relationship between the number of strong ties and creativity. They included individuals’
preference for conformity as a moderator between the number of weak ties and creativity
and found that individuals’ conformity preference moderated the link between weak ties
and creativity such that the relationship between weak ties and creativity was stronger
when individuals’ conformity preference was low. However, they did not test this
moderator for the relationship between the number of strong ties and creativity. Although
they did not, it may be that individual conformity preference may interact with strong ties
in predicting creativity just as it did with weak ties. Likewise, the parallel can be drawn to
the relationship between PO fit and creativity. Two moderators will be examined in the
current study, individuals’ conformity preference and individuals’ willingness to take risks;
Farabee, Angela, 2011, UMSL, p. 21
both of which relate to whether or not employees will challenge norms. These variables are
hypothesized to moderate the relationship between all definitions of PO fit (i.e., non-
creativity values, creativity/innovation value, and general PO values fit) and creativity.
Individual conformity preference. An outcome of interacting with similar others
governed by the same norms is that individuals are less likely to behave in ways that are
contrary to those norms. Those who prefer conformity tend to follow group trends and
social expectations and often rely on others’ suggestions (Mehrabian & Stefl, 1995;
Schwartz, 1992). Furthermore, those who have a strong conformity preference are less
likely to suggest new ways of proceeding as conformity has been found to be negatively
related to creativity (Rice, 2006). On the other hand, those who have a low conformity
preference may offer their creative ideas regardless of if it violates prior assumptions or
norms. Employees can still have high PO fit on non-creativity values, but have a low
preference to conform. Those who have PO fit on creativity/innovation value are more
likely to be creative; however, if they fit on creativity/innovation value and have a low
preference to conform; their creativity might be enhanced over those with a high
conformity preference. It was hypothesized that,
Hypothesis 3a: Individual preference for conformity will moderate the negative
relationship between PO fit (defined as non-creativity values) and individual employee
creativity such that the negative relationship between PO fit and creativity will be stronger
for those with high conformity preference.
Hypothesis 3b: Individual preference for conformity will moderate the positive
relationship between PO fit (defined as creativity/innovation value) and individual
Farabee, Angela, 2011, UMSL, p. 22
employee creativity such that the positive relationship between PO fit and creativity will be
stronger for those with a low conformity preference.
Individuals’ willingness to take risks. A second relevant moderator would be
individuals’ willingness to take risks (Dewett, 2006). Willingness to take risks is defined as
individuals’ propensity to take risks on their job. That is, employees are willing to behave
in ways where the outcome of the behavior is unknown and could potentially be positive or
negative. Engaging in creativity carries with it a degree of uncertainty regarding what the
outcome of that behavior might be (Sethia, 1989). Creativity is characterized by voicing
ideas and offering suggestions that are new and, therefore, outside the scope of regular
organizational routine. Given creativity may not be looked upon favorably, those who
prefer not to take risks on the job are less likely to be creative. The link between individual
risk-taking and creativity has been demonstrated (Dewett, 2006; Kirton, 1976) and
research shows that when organizations encourage employees to take risks, employees are
more likely to be creative (Edmondson, 1999). Even if the organization does not encourage
risk-taking, those who are risk-takers themselves have a higher likelihood of being creative
than those with a lower willingness to take risks. A risk-taker can have a strong fit with an
organization, but may still take risks that do not align with the organization. In addition,
similar to conformity preference, individuals who have PO fit on creativity/innovation
value are likely to be creative but those with a high willingness to take risks may be more
creative than those with a low willingness to take risks. Thus, formally stated,
Hypothesis 4a: Individuals’ willingness to take risks on the job will moderate the
negative relationship between PO fit (defined as non-creativity values) and individual
Farabee, Angela, 2011, UMSL, p. 23
employee creativity such that the negative relationship between PO fit and creativity will
be stronger when individuals have a low willingness to take risks.
Hypothesis 4b: Individuals’ willingness to take risks on the job will moderate the
positive relationship between PO fit (defined as creativity/innovation value) and individual
employee creativity such that the positive relationship between PO fit and creativity will be
stronger when individuals have a high willingness to take risks.
Correlates of creativity. It is informative to expand the nomological network
surrounding fit and creativity by also including variables already suggested to be in that
network. The variables included in the current study are a representative, although not
exhaustive, sample of predictors of creativity, many of which organizations have some
degree of control over. For the purposes of this study, these predictors of creativity will be
grouped into two categories: the componential model-related predictors (Amabile, 1983)
and employee perceptions about the job itself predictors (see Figure 1).
Componential model-related predictors. Amabile’s (1983, 1988) componential
model of creativity has been an oft-cited model for creativity research. The model consists
of three parts: domain-relevant skills, creativity-relevant skills, and task motivation. Not all
components were directly tested in this study, although many of the correlates included
were based off of the componential model. Domain-relevant skills, which were included,
are influential because without mastery in the domain one is working in, it is difficult to be
creative (Woodman et al., 1993). Instead of using energy toward being creative, energy is
dispensed toward learning or adequately performing the job. Domain-relevant skills
include both knowledge, such as facts, procedures, and principles, and the technical skills
related to performing the job (Amabile, 1983). Although the componential model and
Farabee, Angela, 2011, UMSL, p. 24
others (e.g., Woodman et al., 1993; Zhou & Shalley, 2011) mention that domain-relevant
skills are a precursor to creativity, minimal research exists empirically testing this link as
the relationship is typically implied. Therefore, domain-relevant skills were measured in
the current study. Based on Amabile’s (1983) componential model, it was hypothesized
that:
Hypothesis 5: Domain-relevant skills will be positively related to individual
employee creativity.
The second component in the model, creativity-relevant skills, includes types of
cognitive style (e.g., divergent thinking, postponing decision-making, combining diverse
information). Instead of testing creativity-relevant skills directly as is typically done via lab
studies (Zhou & Shalley, 2011) or well-researched cognitive style surveys (e.g., Kirton,
1976), the perception of the presence of creative role models was included as only two
studies have investigated its relationship with creativity. The presence of creative role
models may help individuals strengthen their creativity-relevant skills (Amabile, 1988) and
has also been shown to positively relate to creativity (Zhou, 2003).
Based on Bandura’s (1986) social learning theory, when individuals observe others
acting in a certain way, they are sometimes able to model others’ behavior (e.g. others’
creativity-relevant skills). Creative role models can be coworkers or leaders in an
organization who demonstrate creativity. Shalley and Perry-Smith (2001) found that when
provided with an example of a creative solution to a business problem, participants were
more likely to be creative over those who were provided with an example of a non-creative
solution. It was hypothesized that,
Farabee, Angela, 2011, UMSL, p. 25
Hypothesis 6: The presence of creative role models will be positively related to
individual employee creativity.
The last factor in the componential model is task motivation. Task motivation
includes intrinsic motivation to be creative, which is supported by social aspects of one’s
environment (Conti, Coon, & Amabile, 1996). Task motivation has been the component in
Amabile’s (1983) model that has received the most research attention (Zhou & Shalley,
2011), especially on the social environment surrounding creative behavior. Since there was
no particular task incorporated into this study, task motivation was not directly tested, but
instead, a social aspect supporting intrinsic motivation was included.
A social aspect related to intrinsic motivation is supervisor support. Supportive
supervisors demonstrate concern for their direct reports’ feelings, encourage open
communication, and provide feedback that is non-threatening (Deci, Connell, & Ryan,
1989). Supervisor support can influence intrinsic motivation based on cognitive evaluation
theory (Deci & Ryan, 1985). Cognitive evaluation theory suggests that external factors to
individuals have both informational and controlling aspects. In terms of the informational
aspect, when supervisors are supportive, individuals receive helpful informational
feedback about their work; thereby, increasing intrinsic motivation and creativity
(Amabile, 1983). Frese, Teng, and Wijnen (1999) found that supervisor support positively
related to the number of suggestions submitted to an employee suggestion program which
was how creativity was operationalized in the study. Since supervisors can have
substantial influence over employees’ perceptions and behaviors (e.g., Shin & Zhou,
2007), when supervisors are supportive they can increase employees’ intrinsic motivation
Farabee, Angela, 2011, UMSL, p. 26
to perform (Deci & Ryan, 1985). The more support supervisors provide to employees, the
more likely employees are to be creative. Therefore,
Hypothesis 7: Supervisor support will be positively related to individual employee
creativity.
Perceptions about the job itself predictors. While supervisor support provides an
informational aspect to employees (Deci & Ryan, 1985), the way the job is structured can
provide a controlling aspect. According to cognitive evaluation theory, when the
environment is controlling, intrinsic motivation decreases (Deci & Ryan). Job autonomy is
where employees have the freedom to decide the way in which their work is carried out
(Hackman & Oldham, 1980). Specifically, employees have job autonomy when they have
control over the method(s) to use when performing their job (Breaugh, 1999).Without this
freedom, employees have little opportunity to be creative (i.e., the environment is
controlling). In past research (Amabile & Gitomer, 1984; Shalley et al., 2004), job
autonomy has been shown to be a significant positive predictor of creativity. Thus, it was
hypothesized,
Hypothesis 8: Job autonomy, in terms of method autonomy, will be positively
related to individual employee creativity.
One of the barriers to creativity that can be described as being part of job itself is
excessive time pressure (Amabile et al., 1996). Excessive time pressure results when
individuals perceive that there is not enough time to complete their workload or meet their
deadlines. When there is an excessive amount of work to complete in a constricted time
limit, creativity is less likely to occur (Amabile et al., 1996). When employees work under
excessive time pressure, they are more likely to remain performing comfortable procedures
Farabee, Angela, 2011, UMSL, p. 27
than they are to explore other, more creative, options. For example, ideas that were
produced under a ten minute interval were less creative than those produced under a twenty
minute interval (Kelly & McGrath, 1985). Other researchers have also found a negative
relationship between time pressure and creativity (Andrews & Smith, 1996) and creativity
time pressure (i.e., time pressure specifically hindering creativity) and creativity (Baer &
Oldham, 2006).
Despite this support, the research has still been mixed (Shalley et al., 2004). The
key that makes time pressure a barrier to creativity is that the workload is unmanageable as
opposed challenging (i.e., motivating). When time pressure to perform a task is
challenging to an individual, but not excessive, intrinsic motivation and creativity are
likely to increase (Amabile et al., 1996). Time pressure, at moderate levels, has been
shown to positively relate to creativity (Andrews & Farris, 1972; Noefer, Stegmaier,
Molter, & Sonntag, 2009). Furthermore, other researchers have suggested the relationship
between time pressure and creativity is inverted U-shaped (e.g., Baer & Oldham, 2006,
Ohly, Sonnentag, & Pluntke, 2006). Ohly et al. (2006) found support for an inverted U-
shaped relationship. Baer and Oldham found an inverted U-shape, but only at high levels
of supervisor support; otherwise the relationship was negative.
In sum, the relationship between time pressure and creativity is mixed. Research
has found that time pressure can have a positive, negative or curvilinear relationship with
creativity. Minimal time pressure is likely negatively related to creativity, as is excessive
time pressure. Intermediate levels of time pressure are likely positively related to
creativity. The studies cited all used different scales of time pressure which may also
contribute to the conflicting results. For example, participants can interpret items such as ―I
Farabee, Angela, 2011, UMSL, p. 28
often experience time pressure at work‖ (Noefer et al., 2009; p. 388) to mean the pressure
is challenging or excessive. Since time pressure was not a central focus of this study, the
measure of time pressure used only focused on excessive time pressure on the job in line
with Amabile et al., (1996). As such, it was hypothesized that,
Hypothesis 9: Excessive time pressure will be negatively related to individual
employee creativity.
The last two correlates of creativity relevant to this study are creative job
requirement and anticipated reward for being creative. Although all jobs afford the
opportunity to be creative based on the conceptualization of creativity (Amabile, 1988), a
promoter of creativity is employees’ perceptions of whether or not their job requires them
to be creative (Yuan & Woodman, 2010). Yuan and Woodman tested this proposition on
the basis that (a) employees will be more motivated to be creative since doing so is likely
tied to performance ratings and (b) employees may think that others will more readily
accept their ideas since their job requires creativity (e.g., a research and development
scientist). When employees feel their ideas will be accepted they will feel more
psychologically safe to risk breaking the norms of the organization (Edmondson, 1999).
Regardless of if employees feel their job requires them to be creative, they may still
believe that if they are creative they can expect positive performance outcomes such as
rewards (Yuan & Woodman, 2010).
Anticipated reward for being creative is the extent to which employees feel that if
they are creative, their performance will be recognized and rewarded. According to
Vroom’s (1964) expectancy theory, individuals are motivated to behave in ways that will
result in certain desired outcomes (e.g., a positive reward). If employees believe that being
Farabee, Angela, 2011, UMSL, p. 29
creative will help with their job performance, in terms of being rewarded for good
performance, they are more likely to be creative. As hypothesized, anticipated positive
performance outcomes (i.e., rewards) significantly and positively correlated with
innovative behavior (i.e., creativity and innovation combined; Yuan & Woodman, 2010).
A second reason for including these two variables is to replicate the findings in Yuan and
Woodman’s (2010) recent study as these variables answer the ―why‖ employees are
creative (e.g., task motivation; Amabile, 1983; 1988). Formally stated,
Hypothesis 10: Creative job requirement will be positively related to individual
employee creativity.
Hypothesis 11: Anticipated reward for being creative will be positively related to
individual employee creativity.
Expanding the nomological networks. Failing to include correlates of creativity
in PO fit-creativity research may impede further establishment of the nomological network
surrounding these variables; therefore, a representative sample of correlates was chosen for
this study although other correlates exist. For example, research on the impact of moods on
creativity also appears in the literature (see Zhou & Shalley, 2011 for a review). As moods
are temporary, generalized, affective states (Brief & Weiss, 2002), capturing their
influence on creativity was beyond the central question of the current study. Person-
organization fit, defined as values, is more stable than moods.
An additional creativity correlate example is that the more open to experience
individuals are, the more broad-minded, inquisitive, and unconventional they tend to be
(Costa & McCrae, 1992) which enhances their creativity-relevant skills (Amabile, 1983;
Barron & Harrington, 1981). Research has found that creative individuals (e.g., scientists
Farabee, Angela, 2011, UMSL, p. 30
and artists) are more open to experience than those not in typically creative positions (e.g.,
non-scientists and non-artists; Feist, 1998). Likewise, research has shown that using a
sample that excluded artists and scientists resulted in no significant relationship between
openness to experience and creativity (George & Zhou, 2001). Since research on the
relationship between openness to experience and creativity is inconsistent and a non-artist
and non-scientist sample was used in the current study (i.e., business students), the
inclusion of the correlate openness to experience was beyond the purpose of the present
investigation.
As almost all of the correlates of creativity included in this study have previously
been shown to have significant relationships with creativity, there is the possibility that
some may also moderate the relationship between PO fit and creativity. For example, job
autonomy may moderate the relationship between PO fit and creativity. However,
following the logic of ASA, those with high levels of job autonomy may still not conduct
their work in ways that are contrary to the norms of the organization if they have a high fit
with the organization. Both moderators included in this study, conformity preference and
willingness to take risks, do directly address if individuals have the propensity to behave
contrary to the norms. Inclusion of additional moderators beyond the two discussed were
beyond the scope of the current study.
Additional analyses. Creativity, as it has been presented currently, is described as
a desirable outcome, although as Shalley et al. (2004) pointed out, little research has
examined this assertion. Three individual outcome variables of creativity were investigated
in order to help understand the positive impact of creativity—innovation, job performance,
and turnover intention. As creativity is the precursor to innovation (i.e., the implementation
Farabee, Angela, 2011, UMSL, p. 31
of creativity); a measure was included in order to capture employee innovation. An
employee might voice a creative suggestion, but unless they actually carry out that
creativity, innovation may not occur (Amabile, 1996). A question in the current study was
if employees are creative, do they actually implement that creativity (i.e., are they
innovative)?
Job performance is arguably one of the most important outcomes researched in
industrial-organizational psychology; therefore, job performance was measured in this
study. Some evidence exists to suggest that the more creative employees are, the better
their job performance as rated by supervisors (Oldham & Cummings, 1996; Zhang &
Bartol, 2010). There are however, examples that may suggest that creativity is not always
positively related to job performance. For instance, a supervisor may not approve of the
creative ideas from a direct report and as such, this may reflect poorly on the employee’s
performance review. Therefore an additional analysis investigated how creativity relates to
job performance.
Presumably, organizations want most employees to have low turnover intention.
The relationship between creativity and turnover intention was explored in the present
study, although the causal relationship between the two was not implied. Almost no
research exists to answer the question, are employees who are creative less likely to have
turnover intention (i.e., turnover intent as an outcome)? Or on the other hand, if employees
are planning to turnover, are they less creative (i.e., turnover intent as a predictor)?
Lastly, there is no literature suggesting how PO fit relates to creativity vis-à-vis the
inclusion of other predictors. For example, does PO fit account for more or less variance
than the rest of the predictors? PO fit was compared to the other predictors of creativity in

Farabee, Angela, 2011, UMSL, p. 32
this study. The research question that was posed is as follows: How does PO fit relate to
creativity compared to other predictors of creativity?
Method
Procedure and Participants
There were two data collection waves in which individuals participated. All study
variables were filled out by participants at Time 1 which was typically during class time.
For Time 2, an online survey with creativity and innovation measured again was
administered for test-retest purposes and as a way to reduce common method variance
(Podsakoff, MacKenzie, Lee, & Podsakoff, 2003). In addition, employee creativity,
employee innovation, and the cultural values of the organization were assessed by
supervisors and coworkers of participants in order to provide more than one perspective on
the hypothesized relationships.
A total of 401 participants from a mid-sized Midwestern university completed the
measures at Time 1; however, two were eliminated due to missing needs-supplies fit
scales. Another five were eliminated because they did not complete the creativity measure,
nor did a supervisor or a coworker. This left 394 participants. Of these participants, 84%
were undergraduate business students and 16% were graduate MBA students. The average
age of participants was 25.02 (SD = 5.99), with a similar rate of males (54.3%; n = 214)
and females. Seventy-three percent of the participants in the sample were Caucasian, 11%
were Black or African-American, 9.4% were Asian, 3.3% were more than one race, and
1.5% were Hispanic. Out of the participants, 70% were describing a job in which they were
paid hourly and 80% were currently working. The average time participants were in their
current job or previous job was 2.61 years (SD = 3.02). For those who were not currently
Farabee, Angela, 2011, UMSL, p. 33
working, the average time since they held the job they responded over was 1.13 years (SD
= 1.10).
Participants were offered a chance to win 1 of 5 $100 prizes for completing the
Time 2 measures. An average of 23.74 days (SD = 13.52, n = 193) lapsed between Time 1
data and Time 2 data with a 53% response rate. The response rate was based only on those
who provided their email addresses. Participants were emailed two reminders to take the
Time 2 measures and participants’ professors also reminded them in class in order to
increase the response rate. The Time 2 data had similar demographics as Time 1 with the
following exceptions: females and graduate students were more likely to respond to the
Time 2 measure (χ2 (1) = 9.31; 12.94, respectively; ps < .01).
Participants were also asked to supply email addresses of a direct supervisor and a
coworker so that a short survey could be sent to them on the participant’s creativity and
innovation and the organization’s culture. Out of the emails received, 65% of the direct
supervisors replied (n = 80) and 64% of the coworkers replied (n = 67). No demographic
information was collected from them. On average, supervisors worked with their direct
reports for 2.12 years (SD = 2.64) and coworkers worked with participants an average of
1.93 years (SD = 2.31).
Measures
All measures are available in Appendix A in the order in which they were given to
participants. In addition, all measures were rated on a seven-point Likert-type scale ranging
from 1 (strongly disagree) to 7 (strongly agree) unless otherwise indicated.
Participant measures. The measures that follow were filled out by the participants
in the study.

Farabee, Angela, 2011, UMSL, p. 34
General PO values fit. The first measure of PO fit was a general perceived measure
which asked participants how they believed they fit with their organization’s values. This
three-item measure combined items from both Saks and Ashforth’s (2002) scale and items
suggested by Kristof-Brown and Guay (2011) in their description of general PO fit
measures. The three items represent fit in terms of general values congruence. An example
item includes, ―The values of my company are similar to the values I want in a company.‖
Alpha equals .93.
Needs-supplies PO fit (competing values model measures). The needs-supplies PO
fit measures were based on the competing values model (Quinn, 1988). Three items
adapted from Meyer et al.’s (2010) competing values model scales were used for each
dimension (i.e., human relations, internal processes, rational goal, and
creativity/innovation). Participants rated their agreement with each item twice as this was a
subjective fit measure. First, they assessed if the statement described the organization for
which they were currently working (or the last organization for which they worked).
Second, they assessed if the statement described what they want in an organization. An
example item from each scale is as follows: human relations (My organization is
employee-focused; supply α = .78; need α = .81 ), internal processes (My organization is
stable and rule-oriented; supply α = .75; need α = .85), rational goal (My organization
promotes a competitive and achievement-oriented image; supply α = .83; need α = .87),
and creativity/innovation (My organization promotes an image of innovation, adaptability,
and entrepreneurship; supply α = .89; need α = .94).
Conformity preference. Individuals assessed their preference for conformity with
three items from Mehrabian and Stefl’s (1995) scale. An example item from this scale is
Farabee, Angela, 2011, UMSL, p. 35
―Generally, I’d rather give in and go along for the sake of peace than struggle to have my
way.‖ Alpha was .83.
Willingness to take risks. Participants’ willingness to take risks on the job was
assessed with three items adapted from Dewett’s (2006) eight-item scale. Many items were
redundant therefore five items were deleted. This measure captures individuals’
willingness to take risks which encompasses their knowledge of the potential negative
outcome of taking risks. An example item is ―I will take a risk and try something new if I
have an idea that might improve my work, regardless of how I might be evaluated.‖ Alpha
was .83.
Presence of creative role models. As research evidence on the presence of creative
role models is limited (see Zhou and Shalley, 2011), a three-item scale was created for the
purpose of this study. Zhou (2003) used a scale that focused on coworkers; however, the
current scale was defined more broadly than that (i.e., any employee in the organization
can be a creative role model). An example item is, ―There are employees in my
organization who I consider to be creative role models.‖ Alpha was .86.
Supervisor support. Four items were adapted from Oldham and Cumming’s (1996)
supervisor support scale. The items assessed the degree to which direct reports believe
their supervisor encourages and helps them. ―My supervisor encourages me to develop
new skills,‖ is an example item (α = .85).
Job autonomy. The methods scale from Breaugh (1999) was used to measure job
autonomy. Individuals have autonomy in the method of their work when they are able to
determine how they go about completing their job. ―I am free to choose the method(s) to
Farabee, Angela, 2011, UMSL, p. 36
use in carrying out my work‖ is an example item. The scale had three items and an alpha of
.94.
Creative job requirement. The perception of whether or not individuals’ jobs
require them to be creative was assessed by three items from Yuan and Woodman’s (2010)
five-item scale. An example item is ―I don’t have to be creative to fulfill my job
requirement (reverse-coded).‖ Alpha for this study was .81.
Anticipated reward for being creative. Three items adapted from Yuan and
Woodman (2010; adapted from House and Dessler, 1974) were used to assess the degree to
which employees believe if they are creative, they will be rewarded. An example item
includes, ―I will be rewarded if I am creative on my job.‖ Alpha equaled .86.
Excessive time pressure. The time pressure scale assessed if individuals felt they
have too much work to complete in too little time. An adapted version of Durham, Locke,
Poon, and McLeod’s (2000) three-item scale was used in the current study. A sample item
includes, ―I feel I work under excessive time pressure‖ (previous α = .83). The key to this
scale is that the items are meant to tap time pressure that is excessive; not challenging or
minimal. Alpha for this study was .86.
Turnover intention. Intent to turnover is the extent to which an employee plans to
leave the organization within the next year. Turnover intention was measured with two-
items from Colarelli’s (1984) three-item measure. An example item is ―I am planning on
searching for a new job during the next 12 months.‖ Previous alpha levels have been .75
(e.g., Colarelli, 1984; Oldham & Cummings, 1996). Alpha was .92 in this study. This scale
was only relevant for those who were currently working.
Farabee, Angela, 2011, UMSL, p. 37
Measures for participant, participant’s direct supervisor, and participant’s
coworker. Individual employee creativity, innovation, and domain-relevant skills were
measured by all three sources.
Individual creativity. The most useful judges to assess the creativity of others are
those considered subject matter experts in their profession. For example, supervisors and
coworkers have a visceral understanding of jobs in the organization and are able to
determine if an idea is new and practical. Other research has also focused on self ratings of
creativity because individuals are aware of their behaviors that are directed toward being
creative (e.g., Shalley, Gilson, & Blum, 2009). Even though self report measures may be
susceptible to personal biases (e.g., leniency), Axtell, Holman, Unsworth, Wall, Waterson,
and Harrington (2000) found that self and supervisor ratings of creativity correlated .62. In
the current study, creativity was operationalized as ratings from supervisors, coworkers,
and self in order to get multiple perspectives on individual employee creativity.
A combination of six items from two oft-cited creativity scales was used in this
study (George & Zhou, 2001; Tierney, Farmer, & Graen, 1999; self Time 1 α = .92; self
Time 2 α = .91; supervisor α = .95; coworker α = .94). The items were chosen to represent
the items closest to the definition of creativity used in the current study. That is, creativity
is the production of ideas around procedures, products, or processes that are both useful
and novel. An example item is, ―I have suggested new uses for existing methods or
equipment.‖ Words were changed for supervisors and coworkers (e.g., My coworker has
suggested new uses for existing methods or equipment).
Innovation. Part of the additional analyses was whether or not individuals’
creativity (generation of ideas) transfers to actual innovation (implementation of ideas).
Farabee, Angela, 2011, UMSL, p. 38
Three items were created for the current study that addressed if individuals implement their
creativity; however, the item that was reversed coded was not internally consistent with the
other two items and was removed. For consistency, the reverse coded item was removed
from all other innovation scales (self Time 1 α = .72; self Time 2 α = .58; supervisor α =
.83; coworker α = .81). An example item includes, ―I implement my creative ideas on the
job.‖ Words were changed for supervisor and coworker (e.g., My direct report implements
his/her creative ideas on the job).
Domain-relevant skills. Three items were created to assess individuals’ perceptions
of their domain-relevant skills. To my knowledge, no domain-relevant skills measure
exists as typically, the relationship between domain-relevant skills and creativity has been
inferred only, not empirically linked. An example item is, ―I have the skills necessary to
perform my job.‖ Alpha was .85.
The scale that participants completed was assessed by the direct supervisors and
coworkers with the wording slightly changed. The three items were, ―My direct
report/coworker has the skills necessary to perform his/her job‖, ―My direct
report/coworker is very experienced when it comes to his/her job‖ and ―Performing his/her
job comes easily to my direct report/coworker.‖ Alpha for the supervisor scale was .76 and
alpha for the coworker scale was .75.
Organizational values supply (competing values model measures). In order to
demonstrate that participants’ perceptions of their organizations’ cultural values were
accurate, direct supervisors and coworkers completed the same measures about the
organization’s values as the participant did. That is, they rated the extent to which the
organization’s values can be characterized as human relations, internal processes, rational
Farabee, Angela, 2011, UMSL, p. 39
goal, and creativity/innovation (supervisor alphas were .81, .76, .83, .88, respectively;
coworker alphas were .78, .82, .84, .90, respectively).
Additional measure for participant’s direct supervisor. One additional measure
was completed by the supervisor.
Job performance. Supervisors rated their direct report’s overall job performance
using three items from Hackman and Oldham’s (1976) scale. These three items asked
supervisors to rate the level of performance of their direct report on work quality, work
quantity, and effort on the job. The rating scale for this measure ranged from 1 (very
unsatisfactory) to 7 (very satisfactory). This job performance rating scale has been used in
other creativity research (e.g., Oldham & Cummings, 1996) and a previous alpha was
found to be .85 in Oldham and Cummings. Alpha for this study was also .85.
Job complexity rating based on the Dictionary of Occupational Titles. In order
to complement the many measures to which participants, supervisors, and coworkers
responded, I coded job complexity based on individuals’ job titles and brief descriptions of
their job. The characteristics of complex jobs are that they afford individuals a high level
of autonomy, meaningfulness, skill variety, task identity and feedback from the job itself
(Hackman & Oldham, 1980). Job complexity has been positively related to creativity in the
past (Amabile & Gryskiewicz, 1989; Oldham & Cummings, 1996; Shalley et al., 2009). A
similar methodology to Shalley et al. (2009) was followed in order to code job complexity
based on job titles and brief job descriptions. Shalley et al. coded complexity by using
Roos and Treiman’s (1980) substantive complexity score. This complexity score was
based on a factor analysis of 44 occupational characteristics documented in the Dictionary
of Occupational Titles. This factor included characteristics such as training needed to

Farabee, Angela, 2011, UMSL, p. 40
perform the job, the level of interaction with data, people, and things, and cognitive ability.
While these characteristics do not mirror Hackman and Oldham’s (1980) job complexity
definition, they do allow for a level of objectivity in measuring how the type of work
relates to creativity. Roos and Treiman coded 591 occupations for their substantive
complexity. Job titles in this study were compared to these ratings.
Job complexity was coded for 378 participants out of 394. Those missing the
complexity coding were missing due to lack of information provided. The substantive
complexity score ranged from 0 (not complex) to 10 (most complex). The majority of the
job titles in this study were identical to those in Roos and Treiman. That is, a few
participants were bartenders and there was a code explicitly for bartenders. A few
examples of coding include bartender equaling 1.9, food server equaling 2.1, sales
associate equaling 3.9 and engineer equaling 8.2. An independent coder determined the
complexity ratings for those job titles that did not have a similar match (n = 33). The
independent coder and I were able to agree on all but two of the job titles. For these two, a
third coder determined which rating should be given.
Results
Descriptive statistics and intercorrelations for study variables can be found in Table
1. As can be seen in the table, most measures have adequate internal consistency (i.e.,
greater than .70; Nunnally, 1978) with the exception of Time 2 innovation (α = .58). All
variables were checked for univariate outliers and very few existed (i.e., less than 2% for
each variable). Those that did exist were negative outliers (e.g., on domain-relevant skills).
No cases were excluded from the data set given all responses were plausible such as not
wanting to work for an organization high on human relations value (e.g., characterized by
Farabee, Angela, 2011, UMSL, p. 41
substantial teamwork). The spread of the data were adequate for most variables. Seven
variables had standard deviations that were less than 1.00 (i.e., domain-relevant skills rated
by self, supervisor, and coworker, human relations value need-self rated, creativity and
innovation rated by coworkers, and supervisor rated job performance). Relationships with
these variables may have been truncated due to restriction in range.
Reliability, Test-Retest Stability, and Agreement among Rating Sources
Creativity and innovation were rated twice by participants, at Time 1 and Time 2,
and were rated once by supervisors and coworkers. Domain-relevant skills were measured
by participants at Time 1 and by supervisors and coworkers. Supervisors and coworkers
also rated their perceptions of the organization’s culture via the competing values model
measures. Table 2 displays the paired samples t-test between each pair of ratings and the
mean differences associated with these analyses. Table 1 displays the correlations among
these variables along with their means and standard deviations.
The overall pattern for creativity ratings was that the mean at Time 1 was
moderately lower than Time 2, which was moderately lower than supervisor ratings, which
was moderately lower than coworker ratings. Time 1 and Time 2 ratings of creativity
correlated significantly at .65 (p < .01). Creativity ratings between supervisor and self
were also significantly correlated (r = .24 for Time 1; r = .25 for Time 2; ps < .05). Self
ratings did not significantly correlate with coworker ratings of creativity (Time 1 r = .08, p
= .55; Time 2 r = .14, p = .29). Lastly, supervisor and coworker ratings of creativity were
not significantly correlated (r = .07, p = .67). Since coworkers rated participants high on
creativity (M = 6.38, SD = .72), the correlations with these ratings were likely truncated
due to restriction of range. Based on this information, all of the analyses were run
Farabee, Angela, 2011, UMSL, p. 42
separately on these outcomes (i.e., creativity rated at Time 1 and Time 2 and by supervisor
and coworker). The same pattern as above emerged for innovation ratings (see Tables 1
and 2).
For domain-relevant skills, self and supervisor ratings were significantly correlated
(r = .25, p < .05) and the means were not significantly different (see Table 2). Coworker
and self ratings were not significantly related (r =.12, p =.33) and coworkers rated
individuals significantly higher on domain-relevant skills than individuals rated
themselves. Lastly, coworker and supervisor ratings of domain-relevant skills were not
statistically different in terms of means, but they were not significantly correlated at the .05
level (i.e., r = .26, p < .10).
Agreement and reliability were also analyzed for the competing values model
measures to determine if participants’ perception of the organizations’ culture could be
verified by others working for that company. For human relations value, self ratings
correlated significantly with supervisor and coworker ratings (r = .26, p < .05; r = .32, p <
.01, respectively), although the means were significantly higher for both supervisors and
coworkers (see Table 2). For internal processes value, supervisor and self ratings did not
correlated significantly (r = .16, p = .16); however, the means were not significantly
different. Coworker and self ratings of internal process values did correlate (r = .38, p <
.01) but the mean was significantly higher for coworkers. For rational goal value,
supervisor and self ratings were not significantly correlated (r = .10, p = .38) and
supervisors’ perception that rational goal value was present in the organization was
significantly higher. Self and coworker ratings were not correlated at the .05 significance
level (r = .23, p = .07) and the coworker mean was significantly higher. Lastly, for

Farabee, Angela, 2011, UMSL, p. 43
creativity/innovation value, self and supervisor ratings did not correlate (r = .09, p = .42)
but self and coworker ratings did (r = .28, p < .05). Means for creativity/innovation value
were significantly higher for supervisor and coworker ratings versus self ratings. Lastly,
while supervisor and coworker mean ratings of the organization’s values were not
significantly different from each other (see Table 2), supervisor ratings of values were not
significantly correlated to coworker ratings of values (see Table 1).
In summary, supervisors and coworkers rated the majority of variables significantly
more favorably than did participants in this study. In a little less than half of the interrater
reliability comparisons, supervisors’ and participants’ and coworkers’ and participants’
ratings correlated, although not to a large degree (i.e., small effect sizes according to r2
values). Even though the perceived supply of culture varied among self and other ratings,
self perceptions of reality are important predictors of behavior versus what others believe
to be reality (Caplan, 1987). All analyses were run using self ratings of the organization’s
cultural supply.
Potential Extraneous Variables
Table 3 lists the significant differences on main study variables (i.e., creativity and
general PO values fit) based on the additional variables collected. Graduate students rated
themselves as more creative than undergraduates, but only at Time 1. Those working 40
hours a week rated themselves higher on creativity at Time 1 and Time 2 than did those not
working (those working part-time did not rate creativity significantly differently from
either). Those working 40 hours a week were also statistically more likely to be graduate
students (χ2(2) = 34.92, p < .01), and as seen above, graduate students rated themselves as
more creative which may help to explain this finding. Those currently working had higher
Farabee, Angela, 2011, UMSL, p. 44
ratings of general PO values fit than did those not currently working (see Table 3), but
there was no difference on creativity. These concerns will be addressed later under the
section ―Exploratory Research Questions.‖
Data Analysis
Polynomial regression (Edwards, 1993; 2002) was used to calculate how PO fit
related to creativity for the competing values model dimensions of human relations,
rational goal, internal processes, and creativity/innovation. That is, a polynomial regression
equation was computed to regress creativity rated by participants at Time 1, participants at
Time 2, supervisors, and coworkers on each of the competing values model ratings.
Polynomial regression is a method used to examine the joint effects of the person and the
environment on an outcome. This method allows for both the investigation of how
congruence between the person and environment affects an outcome as well as more
complex questions concerning misfit (e.g., how the direction of the misfit affects an
outcome).
The equation used was Z = b0 + b1X + b2Y +b3X2 + b4XY + b5Y
2 + e, where Z was
creativity, X was what the employee values in an organization and Y was what the
employee perceived the organization’s values to be. There were three steps followed to
test the relationships using polynomial regression. For step one, the value components
were centered on the scale mid-point (i.e., 4) to reduce multicollinearity as recommended
by Edwards (2002). In the second step, the scale centered X and Y predictors were entered
into the equation along with the scale centered X2, XY, and Y
2 predictors. When R
2 was
significant, then step three was to use the unstandardized regression weights to produce a
three-dimensional response surface graph depicting the relationship (Edwards & Rothbard,
Farabee, Angela, 2011, UMSL, p. 45
1999; Edwards, 2002). Explicitly stated, the emphasis is not on the significance or
direction of the regression weights themselves, but is on the shape of the response surface
graph. Moreover, the interpretation of results was then based on a statistical analysis of the
shape of the response surface graph (e.g., how creativity was rated when X = Y).
Four characteristics of the response surface graph were analyzed using t-tests.
These characteristics are the slope of the line of fit when X = Y (a1), the shape of the line
of fit (concave or convex, represented by a2), the slope of the line of misfit when X = -Y
(a3), and the shape of the line of misfit (concave or convex, represented by a4). The
formulas for these tests and a quick reference to the meaning of these characteristics are
listed in Table 4 (Edwards, 2002; Shanock, Baran, Gentry, Pattison, & Heggestad, 2010).
A1 is particularly important to answering Hypotheses 1 and 2 as it represents what happens
to creativity when an individual fits with an organization. A thorough explanation of
interpreting a response surface accompanies the first graph discussed for Hypothesis 1.
The data were checked for outliers for each polynomial regression as different
outliers appeared for different regressions. The decision to remove these outliers was based
on the impact outliers have on the analysis when they are included in the squared and
interaction terms (Edwards & Rothbard, 1999). No more than 1% of the cases were ever
eliminated due to being outliers. The number of individuals represented in each regression
is available under each relevant table. Outliers were removed when they had excessive
leverage (i.e., h < .24), studentized residuals (i.e., +/- 3), and/or were clearly dispersed
from most scores during a visual inspection of the standardized residuals plotted against
the standardized predicted values.
Farabee, Angela, 2011, UMSL, p. 46
Hypothesis 1 stated that fit on non-creativity values would be negatively related to
creativity and Hypothesis 2 stated that fit on creativity/innovation value would be
positively related to creativity. There were three approaches taken to answering these
questions. First, all cases (minus outliers) were included in the polynomial regression
analyses (or correlational analysis for general PO values fit). Second, the analyses were run
again using only those individuals whose organizations had a low creative culture. That is,
the relationship between non-creativity values congruence and creativity should also be
tested when there is minimal supply of creativity/innovation value in the environment;
otherwise, the negative relationship may be indiscernible as those with an organization
with a creative culture may be influencing the results in a positive direction.
In order to facilitate the second approach, individuals’ ratings of their
organization’s culture on creativity/innovation value were used. This variable was
normally distributed with a median of 4.00 and a mean of 4.02 (SD = 1.61). All individuals
who rated their organization’s supply of culture four or below were considered to have a
low creative culture and the analyses were conducted again only on this subset (Time 1 n =
199, Time 2 n = 99, supervisor n = 43, coworker n = 25). Although the sample sizes did
decrease, there was still a decently full range of scores on creativity as the standard
deviations were larger with this sample (with the exception of Time 2 creativity; i.e., Time
1 M = 4.42, SD = 1.40; Time 2 M = 5.06, SD = 1.11; Supervisor M = 5.90, SD = .92;
Coworker M = 6.31, SD = .90) than in the full sample available in Table 1.
The third approach used to analyze the data was to compare only those who
participated in both Time 1 and Time 2. Since almost half of the sample did not respond at
Time 2 and the test-retest results for creativity were significantly different (i.e., the mean at
Farabee, Angela, 2011, UMSL, p. 47
Time 2 was higher), there may have been a level of unaccounted for response bias. By
analyzing the paired Time 1-Time 2 data, the results are more comparable. Univariate
outliers on the Time 1-Time 2 change scores (i.e., +/- 2 standard deviations) were removed
because some respondents on the second survey likely filled it out quickly by responding
with all sevens on the scale when they had responded lower at Time 1. Nine cases were
removed leaving a total of 179 individuals for the paired Time 1-Time 2 data. The
correlation between self rated creativity at paired Time 1 and paired Time 2 was .75 (p <
.01); however, there was still a significant difference between paired Time 1 and paired
Time 2 creativity ratings even after excluding outliers (paired Time 1 M = 5.02, SD =
1.21; paired Time 2 M = 5.32, SD =1.01; t(178) = -4.79, p < .01, Cohen’s d = -.37). All
three approaches (i.e., all data minus outliers, low creative culture only, and paired Time 1-
Time 2 data) are presented for relevant analyses.
Hypothesis 1
Human relations value. Human relations value describes an organization that
supports team work and cohesion. Table 5 displays the polynomial regression results for
self ratings of creativity at Time 1, self ratings of creativity at Time 2, paired Times 1 and
2 creativity ratings, and supervisor ratings for all available data. The coworker regressions
for human relations value as well as the other competing values model regressions revealed
negative adjusted R2s suggesting that there were not enough observations to regressors
(Tabachnick & Fidell, 2007). Table 6 displays the results of the coworker regressions
although they were not significant.
The linear (i.e., human relations supply, human relations need) and nonlinear
effects (i.e., human relations supply squared, need times supply, need squared) as a set
Farabee, Angela, 2011, UMSL, p. 48
were statistically significant predictors of creativity at Time 1 and paired ratings of
creativity at Times 1 and 2. The variance in creativity explained by these effects was 7% in
each case. Instead of interpreting the regression weights (or their associated significance
level) as in ordinary least squares regression, the regression weights were used to depict
the relationship using response surface methodology (Edwards, 2002). As a reminder,
interpretations were made and surface graphs were plotted only for those regressions which
were both significant overall (e.g., R2) and which had at least one significant surface
characteristic (e.g., the slope of the line of fit). When considering all data, the only
regression that had both of these characteristics was creativity rated at Time 1. Figure 3a
(p. 142) displays the response surface graph for human relations value fit and self rated
Time 1 creativity. Figure 3a will be used as an introduction to interpreting the graphs.
The bottom left side of the graph ranges from +3 to -3 and represents the level of
need an individual has for a certain cultural value. This range is based on the fact that the
competing values model scales were centered on the mid-point such that the highest score
of +3 translates to the highest point on the scale, 7 (or 7 minus mid-point 4). The bottom
right side of the graph ranges from -3 to +3 and it represents the level, or supply, of the
value that is present in the organization. The vertical axis represents creativity and ranges
from 1 to 7, seven being the highest. The point on the graph where +3 for need and +3 for
supply intersect is located at the back corner of the graph and represents perfect fit at a
high level of the human relations value. Negative three for need and -3 for supply also
represent perfect fit but at the lowest level of the value.
The line that runs between +3, +3 and -3, -3 is the line of fit. Perpendicular to the
line of fit is the line of misfit which runs from the point where +3 need meets -3 supply and
Farabee, Angela, 2011, UMSL, p. 49
-3 need meets +3 supply. The different colors on the graph are used to aid in interpreting
how much the slope increases or decreases; however, the colors do not represent statistical
significance. Figure 3a suggests that fit on human relations value was positively related to
creativity as the graph slopes upward toward the point +3, +3. More important than a
visual inspection of the graph, there are the four surface tests of significance (see Table 4
for reference). Specifically, these are a1, a2, a3, and a4. A1 represents the slope of the line of
fit. As can be seen in Table 5 for human relations Time 1, the value for a1 was .32 (p < .05)
indicating that when need equals supply, creativity increases (as the value is positive). A2
represents the curvature of the line of fit. This value was .02 (p < .05), while although
small, indicates the shape of the slope was convex, or sloping upward (Shanock et al.,
2010). A3 represents the slope of the line of misfit (-.04, n.s.). Although not significant, if
negative, a3 means that creativity is higher when need exceeds supply (this is opposite for
positive values). Lastly, a4 represents the curvature of the line of misfit. The a4 value for
human relations at Time 1 was -.02 (n.s.). A negative value for a4 indicates that the shape
of the line of misfit is concave or, downward sloping. A summary for the surface tests of
human relations value Time 1 is as follows: the fit between human relations value need and
supply was positively related to creativity with a slight upward sloping curve indicated by
the three different colors (purple being the highest, followed by teal, followed by yellow at
the lowest).
Table 7 contains the results for the significant relationships between human
relations value fit and creativity in a low creative culture. The linear and nonlinear effects
of human relations value were significant predictors as a set of Time 2 creativity ratings,
with 11% of the variance in creativity explained and of supervisor ratings with 24% of the

Farabee, Angela, 2011, UMSL, p. 50
variance explained. Figure 3b (p. 142) displays the relationship between human relations
value fit and supervisor rated creativity as this was the one out of the two significant
polynomial regression equations which also showed significant surface tests. Based on a
positive a1 (2.62, p < .05) the relationship between human relations value fit and creativity
was positive. There was a slight downward, concave shape to the line of fit (-.73, p < .05
for supervisor) toward the point where +3 and +3 intersect, suggesting that toward higher
values of fit, creativity may decrease. Lastly, creativity was higher when need exceeded
supply (a3 = -2.70, p < .01 for supervisor) and this line of misfit was slightly concave, or
downward curving (a4 = -.70, p < .05).
Taken together, the relationship between human relations value fit and creativity
did not support Hypothesis 1. Instead, there was slight support that human relations value
fit was positively related to creativity. There is only slight support as this was not a
significant trend with all ratings. There was a small downward curve close to fit at a high
level (+3, +3) for supervisor ratings in a low creative culture; however, the sample size at
this point was low (n = 3) indicating that this part of the graph may not have been
adequately predicted.
Internal processes value. An organization that values internal processes is very
efficient and bureaucratic. When all cases were considered, Time 1 and Time 2 creativity
ratings were significantly predicted by the linear and nonlinear effects of internal processes
value fit as a set (see Table 5, Figure 4a-b, p. 143) with 3% and 7% of the variance in
creativity explained, respectively. Both also had at least one significant surface test result.
For those cases with a low creative culture, Time 2, paired Time 1 and Time 2, and
supervisor creativity ratings were all significantly predicted by the internal processes value
Farabee, Angela, 2011, UMSL, p. 51
linear and nonlinear effects as a set (see Table 7, Figure 4c-f, p. 143) with variance
explained ranging from 7% to 23%. All four also had at least one significant surface test
result.
For all cases, the only significant surface test was for a2 at both Time 1 (.07, p <
.05) and Time 2 (.10, p < .05) indicating that the line of fit had a convex, upward sloping
curve (see Table 5). This means that for Time 1 and Time 2, creativity was higher moving
away from where 0 need met 0 supply toward -3, -3 and +3, +3. Given the remaining
surface tests were non-significant and that paired ratings for Times 1 and 2 returned
negative adjusted R2s, internal processes value fit only had a minimal, if any, relationship
with creativity when those with creative cultures were included in the analysis.
A different pattern emerged when only considering those in a low creative culture
(see Table 7). For the self ratings of creativity, a2s were significant and negative for Time 2
and paired Time 2 (-.23, p < .05, -.26, p < .01, respectively). This means that the line of fit
was curved such that when moving toward extreme levels of fit (both high and low)
creativity decreased. Paired Times 1 and 2 both had significant positive a3s (.35, p < .10,
albeit at the .10 level; .37, p < .05, respectively) and significant negative a4s (-.30, p < .05;
-.36, p < .01, respectively). This indicates that the line of misfit was curved downward
such that creativity was lower toward extreme ends of misfit; however, creativity was
slightly higher when the supply for internal processes value exceeded the need. For
example, in Figure 4c (p. 143) there is a blue color at +3 need and -3 supply which denotes
lower levels of creativity. Close to -3 need and +3 supply, the level of creativity is slightly
higher (i.e., there is no blue).
Farabee, Angela, 2011, UMSL, p. 52
Supervisor ratings of creativity in a low creative culture had an a1 of -.44 (p < .05)
which means that fit on internal processes value was negatively related to supervisor
ratings of creativity (see Table 7). Overall, internal processes value fit had minimal or no
significant impact on creativity when the sample included those with a creative culture.
When the sample only included those in a low creative culture, fit on internal processes
value was related to lower self rated creativity moving toward the extreme levels of fit.
Based on supervisor ratings, fit on internal processes values was negatively related to
creativity. The findings on the relationship between internal processes value fit and
creativity in a low creative culture provide some support to Hypothesis 1.
Rational goal value. Rational goal value describes an organization that fosters
high performance, achievements, and competition. For all cases, the linear and nonlinear
effects of rational goal value as a set were significant predictors of creativity rated at Time
1, Time 2, paired Times 1 and 2, and rated by supervisors (see Table 5) with a range of
10% to 13% of the variance in creativity ratings explained. For those with a low creative
culture, the linear and nonlinear effects of rational goal value as a set were significant
predictors of creativity rated at Time 1, paired Time 1, and by supervisors (see Table 7)
with variance explained for self ratings at 11% each and for supervisor ratings at 35%.
When all cases were included, the only significant regression that also had a
significant surface test result was creativity rated at Time 1 (see Figure 5a, p. 144).
Specifically, a significant positive a1 indicated that fit on rational goal value was positively
related to Time 1 creativity (a1 = .48, p < .01; see Table 5). When only considering those
with a low creative culture, again only Time 1 creativity ratings also had a significant
surface test result (see Figure 5b, p. 144). The fit on rational goal value in a low creative
Farabee, Angela, 2011, UMSL, p. 53
culture was also positively related to creativity at Time 1 (a1 = .52, p < .01), all other tests
were non-significant (see Table 7).
Taken together, the relationship between rational goal value fit and creativity did
not support Hypothesis 1. Instead, there was slight support that rational goal value fit was
positively related to creativity. There is only slight support as this was not a significant
trend with all ratings. The finding with rational goal value fit was similar to the finding for
human relations value fit.
General PO values fit. General PO values fit was also hypothesized to relate
negatively to creativity. This hypothesis was tested by analyzing the correlations. When all
cases were considered, fit was positively and significantly related to creativity at Time 1 (r
= .33, p <. 01, n = 387) and Time 2 (r = .22; p < .01; n = 193), but was unrelated to
supervisor or coworker ratings of creativity (r = -.06, p = .58, n = 80; r = -.06, p = .63, n =
67, respectively). Paired Time 1 and Time 2 for all data showed a similar pattern as with
all data included. That is, general PO values fit correlated .30 (p < .01, n = 179) with
paired Time 1 and .18 (p < .05, n = 179) with paired Time 2.
A slightly different pattern emerged when considering only those in a low creative
culture. Fit positively related to Time 1 creativity (r = .18, p < .05; n = 199), but not to
Time 2 (r = .10, p = .33, n = 99). To compare, paired Time 1 was not significantly
correlated to creativity (r = .15, p = .16, n = 91) nor was paired Time 2 (r = .07, p = .53, n
= 91). Although not significant at the .05 significance level, the direction of the
relationship between fit and supervisor rated creativity was in line with Hypothesis 1 (r = -
.27, p = .08; n = 43) in a low creative culture. Lastly, general PO values fit was not
Farabee, Angela, 2011, UMSL, p. 54
significantly related to coworker rated creativity in a low creative culture (r = -.25, p =.22;
n =25).
In summary, the relationship between non-creativity values fit and creativity was
more complicated than suggested in Hypothesis 1. There was slight support that creativity
was more likely to be positively related to fit on human relations value and rational goal
value rather than negatively related. However, the relationships for these two values were
not consistent among rating sources which suggests that they may only have a small
relationship with creativity, if any. There was some support to the hypothesis when looking
at internal processes value fit in a low creative culture. That is, for Time 2 and paired Time
2, creativity tended to decrease toward extreme levels of fit. In addition, internal processes
value fit was negatively related to supervisor rated creativity when only low creative
culture data were included in the analysis. Lastly, regardless of including all data or data
from a low creative culture, the relationship between general PO values fit and creativity
failed to support Hypothesis 1. One finding to note was that the direction of general PO
values fit and supervisor rated creativity in a low creative culture was in line with
Hypothesis 1 at the .10 significance level. Overall, Hypothesis 1 received mixed support.
Hypothesis 2
Creativity/innovation value. Hypothesis 2 stated that fit on creativity/innovation
value would be positively related to creativity. Significant polynomial regressions resulted
when including all data, with a range of 18% to 24% of the variance in self ratings of
creativity explained (see Table 8). Supervisor and coworker ratings were not significantly
predicted by creativity/innovation value fit. The non-significant polynomial regressions are
presented for low creative culture in Table 9 for reference.
Farabee, Angela, 2011, UMSL, p. 55
Out of the significant polynomial regressions, Time 1, Time 2 and paired Time 2
also had significant surface test results (see Table 8 and Figure 6a-c). Figure 6a (p. 145)
and the surface tests for Time 1 ratings of creativity support Hypothesis 2, as the slope of
the line of fit (a1) was .65 (p < .01) meaning fit on creativity/innovation value was
positively related to creativity. The result for Time 2 and paired Time 2 did not have
significant a1 values, but they did have significant a2 values (.14, p < .05; .13, p < .05,
respectively). This suggests that toward extreme levels of fit on creativity/innovation
value, creativity increased (i.e., the shape of the line of fit was convex; see Figure 6b-c, p.
145).
Overall, Hypothesis 2 had some support. This is despite the visual differences in
the shape of the response surface graphs at Time 1 compared to Time 2 and paired Time 2.
At Time 1, creativity was lowest moving toward the point where -3 need met -3 supply,
whereas at Time 2 and paired Time 2, creativity was high at any level of the
creativity/innovation value the organization supplied. This finding may have been the
result of almost half of the sample not responding at Time 2. For example, when paired
Time 1 was plotted, despite the surface tests being non-significant, the shape of the graph
resembled Time 2 and paired Time 2 such that creativity appeared higher along any value
of the cultural supply. Simply stated, the individuals who responded which helped form the
shape of the Time 1 surface plot, did not respond at Time 2.
Hypotheses 3 and 4
Hypotheses 3 and 4 suggested that all of the PO fit-creativity relationships
proposed would be moderated by both individuals’ conformity preference and their
willingness to take risks at work. The relationships for the competing values model
Farabee, Angela, 2011, UMSL, p. 56
variables were again tested using polynomial regression. The equation for moderation was
Z = b0 + b1X + b2X +b3X2 + b4XY + b5Y
2 + b6V +b7XV + b8YV + b9X
2V + b10XYV +
b11Y2V + e, where V was the moderator. The terms that include the moderator were entered
into a separate regression step after the linear effects, nonlinear effects, and the mean
centered moderator were included in the first step. A significant change in R2
indicated that
there was evidence for moderation (Edwards, 1994). After determining there was a
moderating effect, the polynomial regressions were run again at high and low levels of the
moderator to interpret the impact of the moderator on the fit-creativity relationship (see
Anseel & Lievens, 2006; Edwards & Rothbard, 1999). For these analyses, those who were
below a 4.00 on the moderators were considered low on the moderator whereas those
above a 4.00 were considered high on the moderator. That is, the moderators were
dichotomized so polynomial regressions could be conducted for both high and low levels
of the moderators (Edwards & Rothbard, 1999). Both moderators were normally
distributed with minimal skewness. Those individuals who rated conformity or willingness
to take risks around the mid-point were not removed as this would have caused the sample
size to drop substantially in some instances (e.g., when only considering low creative
culture) and these regressions were needed for comparison purposes.
Hypotheses 3a and 4a stated that the negative relationship between non-creativity
values and creativity would be stronger for those high on conformity preference (or low on
willingness to take risks) compared to those low in conformity preference (or high on
willingness to take risks). Support for these hypotheses would have been demonstrated
through a significant negative a1 for high conformity preference (or low willingness to take
risks) and an a1 for those with a low conformity preference (or high willingness to take
Farabee, Angela, 2011, UMSL, p. 57
risks) that had a less negative value in comparison (even if still significant), a non-
significant value, or a significant value in the positive direction. Hypotheses 3b and 4b
stated that the positive relationship between creativity/innovation value fit and creativity
would be stronger for those low on conformity preference (or high on willingness to take
risks) over those high on conformity preference (or low on willingness to take risks).
Support for these hypotheses would have been demonstrated through a significant positive
a1 for those low on conformity preference (or high willingness to take risks) and an a1 for
those with a high conformity preference (or low willingness to take risks) with a less
positive value in comparison (even if still significant), a non-significant value, or a
significant value in the negative direction. Lastly, the only interpretations made and graphs
plotted were for those relationships with at least one statistically significant surface test
result.
The general PO values fit was tested using traditional moderated regression where
the interaction term was added in a separate step from the individual predictors (after being
mean-centered) and if the regression weight for the interaction and change in R2 were
significant, then there was evidence for moderation.
Conformity preference. Results of the moderation analyses for the competing
values model are presented via change in R2
in Tables 5, 7, and 8. Conformity preference
did not moderate the relationship between creativity/innovation value fit and creativity for
any of the ratings (see Table 8); therefore, Hypothesis 3b was not supported. Conformity
preference also did not moderate the relationship between general PO values fit and
creativity when either all data were included or when only low creative culture data were
included (see Tables 10 and 11, respectively). Out of the non-creativity values-creativity
Farabee, Angela, 2011, UMSL, p. 58
relationships, conformity preference significantly moderated four out of the 19 possible
relationships. The 19 possible relationships were the polynomial regressions that reached
statistical significance in Tables 5 and 7. The significant moderation results were for Time
1 for internal processes value with all data included where including the moderator
explained 5% more of the variance in creativity, paired Times 1 and 2 for rational goal
value including all data where the addition of the moderator explained 7% more variance
in creativity each, and Time 1 for rational goal value in a low creative culture, where
including the moderator explained 7% more variance in the creativity ratings. The surface
tests can be found in Table 12.
As can be seen with the surface test results, the a1 values were not in the
appropriate direction (i.e., a significantly negative a1 for high conformity preference)
indicating that Hypothesis 3a was not supported. Figure 7a-f (p. 146) displays the surface
graphs for high and low levels of conformity preference for which there was at least one
significant surface test result. The surface tests for rational goal value paired Time 2
ratings with all data were not significant for low conformity preference; hence it was not
graphed. Likewise, none of the high conformity preference surface tests for Time 1 rational
goal value with data from a low creative culture were significant (see Table 12).
Individuals’ willingness to take risks. Individual’s willingness to take risks at
work did not moderate any of the relationships for the non-creativity competing values fit
and creativity (see Tables 5 and 7), nor did it moderate the relationship for general PO
values fit and creativity (see Tables 13 and 14). Therefore, Hypothesis 4a was not
supported. Risk-taking was only a significant moderator for the creativity/innovation value
fit-creativity relationship at Time 1, Time 2, and paired Times 1 and 2 when including all
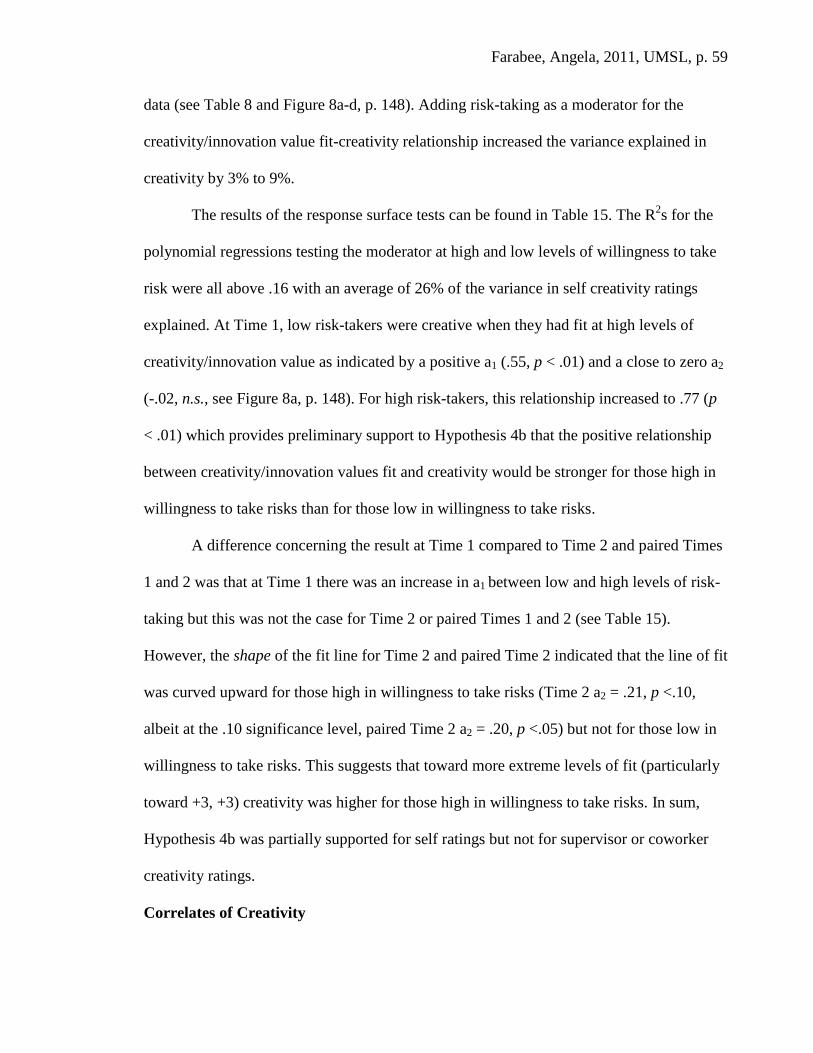
Farabee, Angela, 2011, UMSL, p. 59
data (see Table 8 and Figure 8a-d, p. 148). Adding risk-taking as a moderator for the
creativity/innovation value fit-creativity relationship increased the variance explained in
creativity by 3% to 9%.
The results of the response surface tests can be found in Table 15. The R2s for the
polynomial regressions testing the moderator at high and low levels of willingness to take
risk were all above .16 with an average of 26% of the variance in self creativity ratings
explained. At Time 1, low risk-takers were creative when they had fit at high levels of
creativity/innovation value as indicated by a positive a1 (.55, p < .01) and a close to zero a2
(-.02, n.s., see Figure 8a, p. 148). For high risk-takers, this relationship increased to .77 (p
< .01) which provides preliminary support to Hypothesis 4b that the positive relationship
between creativity/innovation values fit and creativity would be stronger for those high in
willingness to take risks than for those low in willingness to take risks.
A difference concerning the result at Time 1 compared to Time 2 and paired Times
1 and 2 was that at Time 1 there was an increase in a1 between low and high levels of risk-
taking but this was not the case for Time 2 or paired Times 1 and 2 (see Table 15).
However, the shape of the fit line for Time 2 and paired Time 2 indicated that the line of fit
was curved upward for those high in willingness to take risks (Time 2 a2 = .21, p <.10,
albeit at the .10 significance level, paired Time 2 a2 = .20, p <.05) but not for those low in
willingness to take risks. This suggests that toward more extreme levels of fit (particularly
toward +3, +3) creativity was higher for those high in willingness to take risks. In sum,
Hypothesis 4b was partially supported for self ratings but not for supervisor or coworker
creativity ratings.
Correlates of Creativity
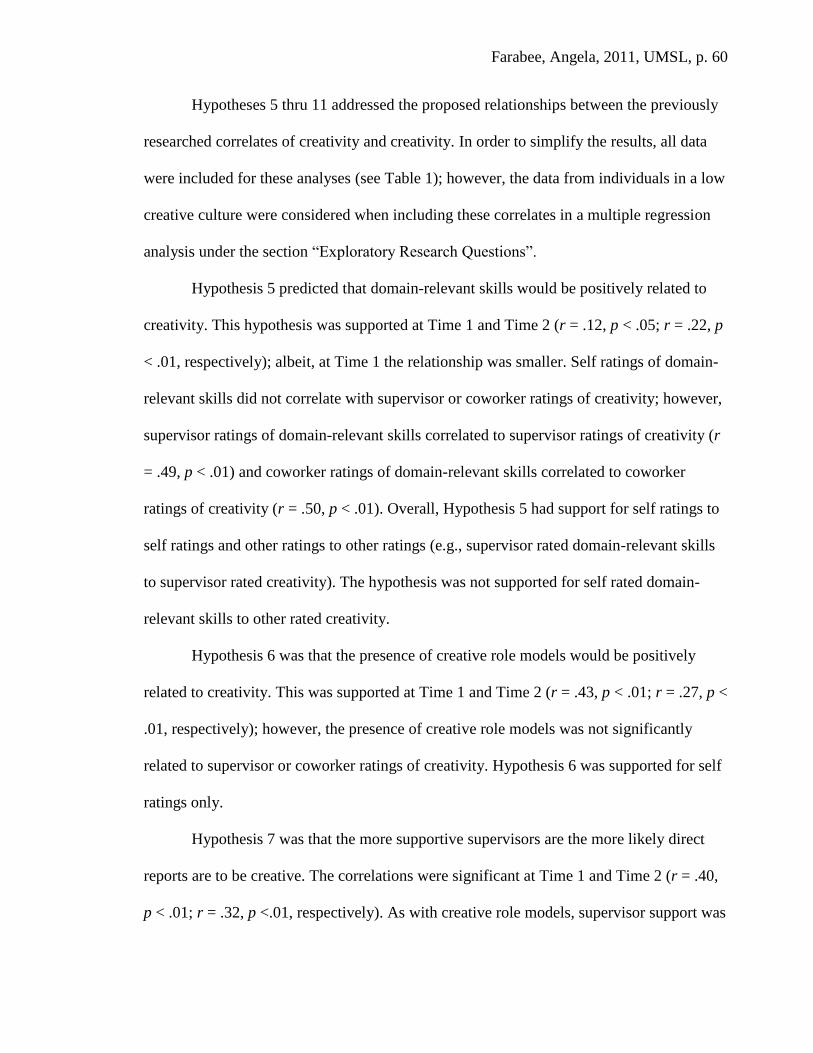
Farabee, Angela, 2011, UMSL, p. 60
Hypotheses 5 thru 11 addressed the proposed relationships between the previously
researched correlates of creativity and creativity. In order to simplify the results, all data
were included for these analyses (see Table 1); however, the data from individuals in a low
creative culture were considered when including these correlates in a multiple regression
analysis under the section ―Exploratory Research Questions‖.
Hypothesis 5 predicted that domain-relevant skills would be positively related to
creativity. This hypothesis was supported at Time 1 and Time 2 (r = .12, p < .05; r = .22, p
< .01, respectively); albeit, at Time 1 the relationship was smaller. Self ratings of domain-
relevant skills did not correlate with supervisor or coworker ratings of creativity; however,
supervisor ratings of domain-relevant skills correlated to supervisor ratings of creativity (r
= .49, p < .01) and coworker ratings of domain-relevant skills correlated to coworker
ratings of creativity (r = .50, p < .01). Overall, Hypothesis 5 had support for self ratings to
self ratings and other ratings to other ratings (e.g., supervisor rated domain-relevant skills
to supervisor rated creativity). The hypothesis was not supported for self rated domain-
relevant skills to other rated creativity.
Hypothesis 6 was that the presence of creative role models would be positively
related to creativity. This was supported at Time 1 and Time 2 (r = .43, p < .01; r = .27, p <
.01, respectively); however, the presence of creative role models was not significantly
related to supervisor or coworker ratings of creativity. Hypothesis 6 was supported for self
ratings only.
Hypothesis 7 was that the more supportive supervisors are the more likely direct
reports are to be creative. The correlations were significant at Time 1 and Time 2 (r = .40,
p < .01; r = .32, p <.01, respectively). As with creative role models, supervisor support was
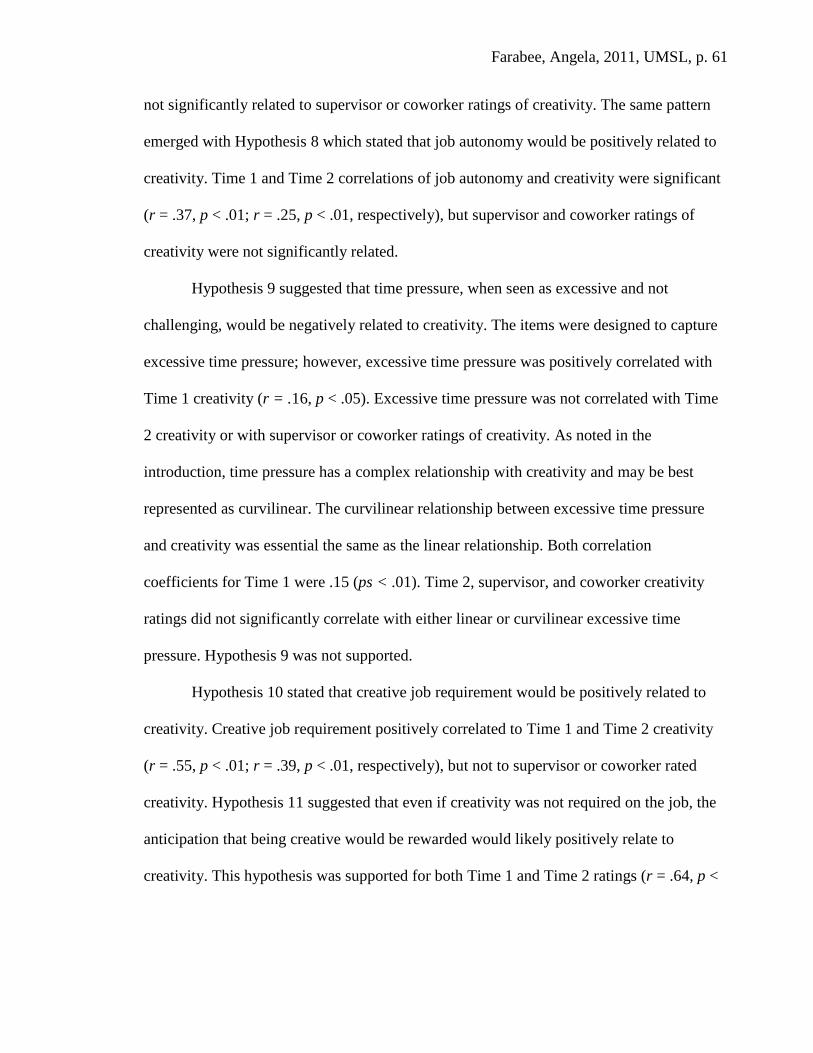
Farabee, Angela, 2011, UMSL, p. 61
not significantly related to supervisor or coworker ratings of creativity. The same pattern
emerged with Hypothesis 8 which stated that job autonomy would be positively related to
creativity. Time 1 and Time 2 correlations of job autonomy and creativity were significant
(r = .37, p < .01; r = .25, p < .01, respectively), but supervisor and coworker ratings of
creativity were not significantly related.
Hypothesis 9 suggested that time pressure, when seen as excessive and not
challenging, would be negatively related to creativity. The items were designed to capture
excessive time pressure; however, excessive time pressure was positively correlated with
Time 1 creativity (r = .16, p < .05). Excessive time pressure was not correlated with Time
2 creativity or with supervisor or coworker ratings of creativity. As noted in the
introduction, time pressure has a complex relationship with creativity and may be best
represented as curvilinear. The curvilinear relationship between excessive time pressure
and creativity was essential the same as the linear relationship. Both correlation
coefficients for Time 1 were .15 (ps < .01). Time 2, supervisor, and coworker creativity
ratings did not significantly correlate with either linear or curvilinear excessive time
pressure. Hypothesis 9 was not supported.
Hypothesis 10 stated that creative job requirement would be positively related to
creativity. Creative job requirement positively correlated to Time 1 and Time 2 creativity
(r = .55, p < .01; r = .39, p < .01, respectively), but not to supervisor or coworker rated
creativity. Hypothesis 11 suggested that even if creativity was not required on the job, the
anticipation that being creative would be rewarded would likely positively relate to
creativity. This hypothesis was supported for both Time 1 and Time 2 ratings (r = .64, p <
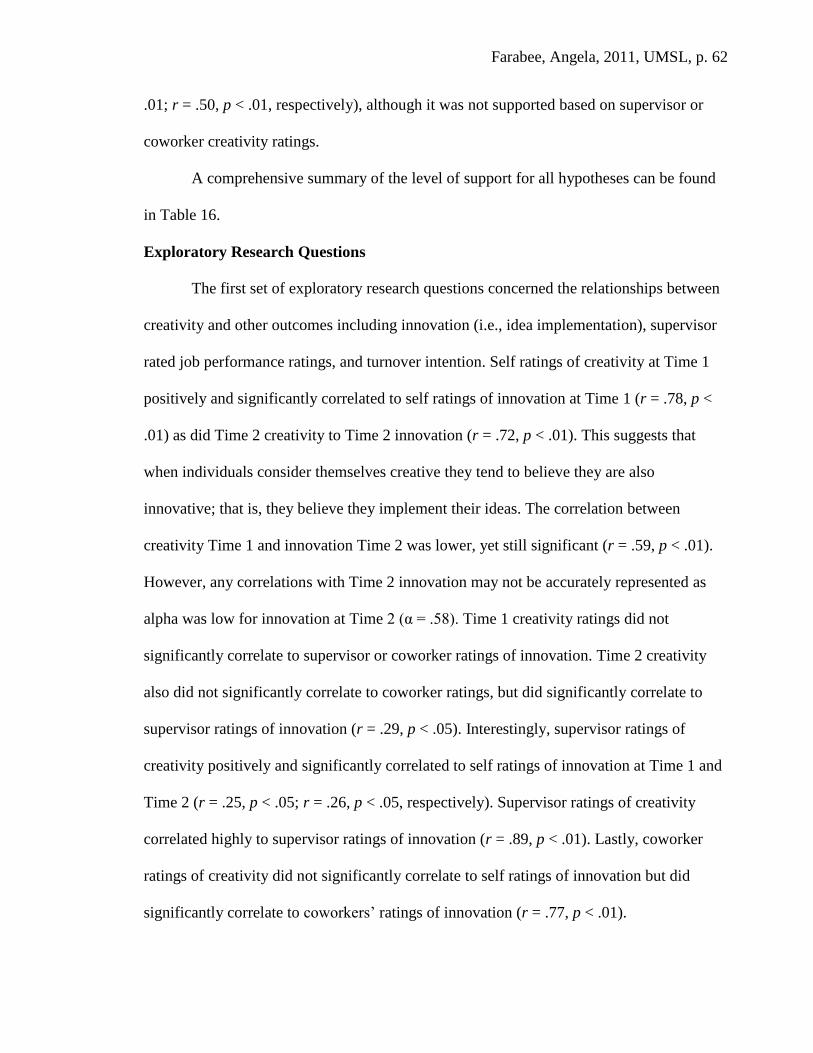
Farabee, Angela, 2011, UMSL, p. 62
.01; r = .50, p < .01, respectively), although it was not supported based on supervisor or
coworker creativity ratings.
A comprehensive summary of the level of support for all hypotheses can be found
in Table 16.
Exploratory Research Questions
The first set of exploratory research questions concerned the relationships between
creativity and other outcomes including innovation (i.e., idea implementation), supervisor
rated job performance ratings, and turnover intention. Self ratings of creativity at Time 1
positively and significantly correlated to self ratings of innovation at Time 1 (r = .78, p <
.01) as did Time 2 creativity to Time 2 innovation (r = .72, p < .01). This suggests that
when individuals consider themselves creative they tend to believe they are also
innovative; that is, they believe they implement their ideas. The correlation between
creativity Time 1 and innovation Time 2 was lower, yet still significant (r = .59, p < .01).
However, any correlations with Time 2 innovation may not be accurately represented as
alpha was low for innovation at Time 2 (α = .58). Time 1 creativity ratings did not
significantly correlate to supervisor or coworker ratings of innovation. Time 2 creativity
also did not significantly correlate to coworker ratings, but did significantly correlate to
supervisor ratings of innovation (r = .29, p < .05). Interestingly, supervisor ratings of
creativity positively and significantly correlated to self ratings of innovation at Time 1 and
Time 2 (r = .25, p < .05; r = .26, p < .05, respectively). Supervisor ratings of creativity
correlated highly to supervisor ratings of innovation (r = .89, p < .01). Lastly, coworker
ratings of creativity did not significantly correlate to self ratings of innovation but did
significantly correlate to coworkers’ ratings of innovation (r = .77, p < .01).
Farabee, Angela, 2011, UMSL, p. 63
Supervisors were asked to rate their direct reports’ performance on the job.
Supervisor ratings of creativity were significantly and positively related to supervisors’
ratings of individuals’ performance (r = .56, p < .01) suggesting that to some extent,
supervisors’ perception of employees’ creativity on the job had an impact on performance
ratings. Self ratings of creativity did not significantly relate to supervisor performance
ratings suggesting that individuals may believe they are creative but this does not
necessarily translate to supervisor rated job performance. Lastly, coworker ratings also did
not significantly correlate to supervisor rated job performance.
Self ratings of creativity at Time 1 were negatively correlated to turnover intention
of those currently working (r = -.15, p < .01), although not to a large degree. Creativity
ratings at Time 2 were not significantly related to turnover intention. Supervisor and
coworker creativity ratings did not significantly correlate to individuals’ turnover intention
as well. This suggests that the relationship between creativity and turnover intention may
only be minimal.
The other exploratory research question concerned how PO fit relates to creativity
compared to the already established predictors of creativity. In order to answer this
question, general PO values fit was entered into the first step of a hierarchical regression
equation predicting creativity. This was followed by entering the correlates of creativity as
well as individuals’ conformity preference and willingness to take risks. Results for all
data can be seen in Table 17, results for those in a low creative culture can be seen in Table
18, results of those currently working (refer to Table 3 as there was a difference on general
PO values fit) can be seen in Table 19 for all data, and in Table 20 for low creative culture.
In addition, Tables 21 and 22 display the multiple hierarchical regression results
Farabee, Angela, 2011, UMSL, p. 64
considering all data for graduate and undergraduate students, respectively (refer to Table 3
as there was a difference on creativity between these two groups). The comparison
between graduate and undergraduates in a low creative culture was not included as the
sample size for graduate students was extremely low (n = 26 for self ratings and n = 9 for
coworker ratings of creativity). Since graduate students’ responses influenced the different
results on creativity between full-time workers and those not currently working (see Table
3), the results were only analyzed by graduate versus undergraduate students.
For all data, general PO values fit was a significant positive predictor for Time 1,
Time 2, and paired Times 1 and 2 self ratings of creativity, but not for supervisor or
coworker rated creativity. Change in R2
was significant at the .01 level when the other
predictors were added for all self ratings and significant at the .10 level for supervisor
ratings (see Table 17). With the inclusion of all predictors, adjusted R2s ranged from .29 to
.53 for self ratings and was .09 for supervisor ratings. The results were fairly consistent
(i.e., similar for all self ratings) such that fit was not a significant predictor when the other
variables were entered. Self rated domain-relevant skills and anticipated reward for being
creative were significant predictors for all ratings except supervisors. The only significant
predictors for supervisor rated creativity were excessive time pressure (b = -.14, p < .05)
and conformity preference (b = -.19, p < .05).
In a low creative culture, domain-relevant skills and anticipated reward for being
creative were again significant positive predictors for all self rated creativity while fit was
not (see Table 18). The changes in R2 for self ratings when adding in the other predictors
were all significant at the .01 level and the adjusted R2s ranged from .23 to .53. As for
supervisor ratings, fit was a negative predictor for creativity (b = -.23, p <.05) as was
Farabee, Angela, 2011, UMSL, p. 65
conformity preference (b = -.27, p <.05); however, the regression model itself was not
significant and adjusted R2
equaled .06.
For those currently working, the most consistent significant positive predictor of
self rated creativity was anticipated reward for being creative when both all data were
included and when low creative culture data were included (see Tables 19 and 20). General
PO values fit was not a significant predictor in either case. The adjusted R2s for self ratings
for all data of those currently working ranged from .22 to .54, and all changes in R2 were
significant at the .01 level. The adjusted R2s for self ratings of those in a low creative
culture ranged from .29 to .54 and all changes in R2 were significant at the .01 level. For
supervisor ratings, with both all data and low creative culture data, the regression weights
for conformity preference were significant and negative. The overall regression equation
was only significant at the .10 level with all data and not significant with low creative
culture data included.
All changes in R2s were significant at the .01 level for self ratings for both graduate
students and undergraduate students when entering all correlates of creativity. Anticipated
reward for being creative was a consistent significant positive predictor for both graduate
students and for undergraduate students while fit was not (see Tables 21 and 22). Domain-
relevant skills was also a consistent predictor of creativity for undergraduates but not for
graduate students. The adjusted R2s for graduate student self ratings ranged from .48 to .62
and they ranged from .22 to .53 for undergraduate self ratings. Neither supervisor ratings
nor coworker ratings for graduate students or undergraduate students had significant
regression equations.
Farabee, Angela, 2011, UMSL, p. 66
Overall, general PO values fit was not a significant predictor of creativity when
other variables were also considered. Anticipated reward for being creative was the biggest
consistent positive predictor of participants’ self rated creativity followed by domain-
relevant skills. Conformity preference was the most consistent negative predictor of
supervisor ratings. The competing values model of fit was not compared to the other
predictors of creativity as the beta weights are not interpreted the same as they would be in
ordinal least squares regression (e.g., instead of interpreting the beta weights, they are
plotted using response surface methodology).
The last exploratory analysis was over job complexity. Job complexity was coded
on a scale of 0 to 10 with 10 being most complex. The mean complexity score for this
sample was 4.08 (SD = 1.75) ranging from .20 to 8.30. Job complexity was normally
distributed and Table 1 displays all study variables correlation with job complexity. Job
complexity was significantly correlated with creativity at Time 1 (r = .29, p < .01) and
Time 2 (r = .30, p < .01), and innovation at Time 1 (r = .21, p < .01) and Time 2 (r = .29, p
< .01). Job complexity was not significantly correlated with creativity or innovation ratings
of supervisors (r = .15, p = .18; r = .15, p = .19, respectively) or coworkers (r = .18, p =
.15; r = .23, p =.06, respectively). Given complex jobs can be described by the amount of
autonomy individuals have, the relationship between job complexity and job autonomy
was examined. The correlation was .10 (p < .05) indicating that, to a small but significant
extent, job complexity ratings covaried with job autonomy.
Discussion
As mentioned in the recent review by Kristof-Brown and Guay (2011), there has
been a call to conduct more research on the relationship between PO fit and creativity. One
Farabee, Angela, 2011, UMSL, p. 67
of the overarching goals of this study was to begin to answer the question of whether or not
there is a dark side to PO fit. Schneider’s (1987) attraction-selection-attrition framework
was the impetus for the idea that PO fit may be negatively related to creativity. If
individuals do not feel they fit with an organization they are likely to turnover. Over time
this cycle leaves an organization with employees who are more homogeneous on certain
characteristics, such as their values. Schneider posits that this homogeneity may reduce
organizations’ flexibility and ability to be creative and innovative. From a practical
standpoint, more and more companies are focusing their efforts on developing innovative
capabilities at their organizations (Andrew, 2010) and in order to be innovative (idea
implementation) employees must first be creative (idea generation). Therefore beyond
theory development, there are practical implications from this study as well as limitations
that may be addressed with future PO fit-creativity research.
The first hypothesis that PO fit would be negatively related to creativity was tested
using general PO values fit and the three non-creativity values of the competing values
model (Quinn, 1988; Quinn & Rohrbaugh, 1983). The second hypothesis that PO fit would
be positively related to creativity was tested using the creativity/innovation value of the
competing values model. The competing values model was chosen because (a) the four
values have been shown to comprehensively represent organizations’ culture (Howard,
1998), (b) it has been recommended for use in congruence research (Ostroff et al., 2005),
(c) using the competing values model expands other PO fit-creativity research which only
looked at fit on a creativity value (e.g., Choi, 2004), and (d) organizations have some
control over whether or not they have these four values. The measures for the competing
values model were operationalized as subjective needs-supplies fit which allowed the joint
Farabee, Angela, 2011, UMSL, p. 68
effects of the person and the environment on creativity to be tested. This operational
definition of fit supported the interactionist perspective (e.g., Lewin, 1936) as well as
allowed for the use of polynomial regression (i.e., the recommended statistical technique
for congruence research; Edwards, 2002; Meyer et al., 2010). In addition to the competing
values model, a general PO values fit measure was used to capitalize on the fact that it was
a supplementary perceived measure. That is, the measure had individuals assess if they
thought they were similar to their organization as the ASA model would support.
A revisit to Figure 2 is necessary in order to interpret the results for Hypotheses 1
and 2. The four competing values are characterized by two dimensions; control (valuing
stability and planning) versus flexibility (valuing differentiation and experimentation) and
external (a focus outside the organization) versus internal (a focus inside the organization).
The creativity/innovation value is defined as being external and flexible. Opposite of this is
the internal processes value which is defined as being internal and controlled. Human
relations and rational goal values each share a characteristic in common with the
creativity/innovation value. Human relations value shares the flexible characteristic and
rational goal value shares the external characteristic. Understanding these similarities helps
to explain the results. For a few of the relationships (i.e., for self ratings at Time 1 with
either all data or low creative culture data considered), fit on human relations value and
rational goal value was positively related to creativity, failing to support Hypothesis 1.
Likewise, fit on creativity/innovation value positively related to creativity (rated by self) in
support of Hypothesis 2. These findings can be explained by the fact that human relations
value and rational goal value share characteristics in common with creativity/innovation
value. However, under certain conditions (i.e., in a low creative culture), individuals’ fit on
Farabee, Angela, 2011, UMSL, p. 69
the internal processes value, which is opposite of creativity/innovation value, was more in
line with Hypothesis 1.
When all data were considered, the relationship between internal processes value fit
and self rated creativity was sometimes positive (i.e., based on a2) and other times there
was no relationship. As mentioned previously, the analyses were run by using all data and
by using data of those in a low creative culture in order to understand how fit on non-
creativity values related to creativity when the organization does not value creativity.
When considering those individuals whose organizations were low on creative culture, fit
on internal processes value was generally significantly related to lower levels of creativity
for both self and supervisor ratings. This was not the case for those in a low creative
culture for human relations and rational goal values fit, but as discussed above, they share
characteristics in common with the creativity/innovation value.
The relationship between general PO values fit and creativity was positively related
to self ratings when all data were considered, but it was unrelated to supervisor or
coworker ratings of creativity. When only taking into account those in a low creative
culture, fit was positively or not significantly related to self ratings of creativity and
negatively related to supervisor ratings at the .10 level. Overall, Hypothesis 1 received
some support in a low creative culture for internal processes value fit on self and
supervisor creativity ratings. Moreover, general PO values fit was negatively related to
supervisor ratings in a low creative culture which also demonstrated some support.
However, Hypothesis 1 was unsupported (i.e., fit was somewhat positively related to
creativity) when considering human relations and rational goal values fit when all data
were included and when only data at low levels of creative culture supply were included.
Farabee, Angela, 2011, UMSL, p. 70
The fact that Hypothesis 1 was unsupported for human relations and rational goal value
may be explained by these values sharing characteristics in common with
creativity/innovation value which fit, for the most part, on this value positively related to
creativity in support of Hypothesis 2.
In this study, Hypotheses 3a and 3b were not supported for either the competing
values model or general PO values fit as individuals’ conformity preference was not a
significant moderator of the relationship between fit and creativity in the hypothesized
direction. Hypothesis 4a was not supported as willingness to take risks did not moderate
the relationship between the non-creativity values (i.e., human relations, internal processes,
rational goal, and general PO values fit) and creativity. With creativity/innovation values
fit; however, willingness to take risks did moderate the relationship between this fit and
creativity in the hypothesized direction for most self ratings, but did not for supervisor or
coworker ratings. That is, the relationship between fit and self rated creativity was stronger
(either due to a positive line of fit or a positive convex shape) for those with a high
willingness to take risks over those with a low willingness to take risks. Overall, there was
partial support for Hypothesis 4b.
Instead of individuals’ conformity preference and willingness to take risks serving
as moderators for the fit-creativity relationship as suggested in Hypotheses 3 and 4, they
may only be predictors of creativity. This was demonstrated by the significant negative
relationships between conformity preference and self ratings at Times 1 and 2 and
conformity and supervisor ratings. The more likely individuals were to conform to the
group, the less likely they were to be creative, despite their PO fit. Also, willingness to
take risks had significant positive relationships with self ratings as was to be expected
Farabee, Angela, 2011, UMSL, p. 71
based on prior research on risk-taking (e.g., Dewett, 2006). Another possible reason that
conformity preference and willingness to take risks were not significant moderators for
most of the relationships is related to the fact that when added to the fit-creativity
relationship, they did not explain much additional variance in creativity ratings. This may
have made it hard to even find a relationship, if one does exist, without a large enough
sample of individuals.
There were two overarching findings about the zero-order correlations between the
correlates of creativity and creativity. First, the hypotheses, 5 to 11, were supported for self
ratings of creativity with the exception of the relationship between excessive time pressure
and creativity (i.e., Hypothesis 9 was not supported). Second, the predictors tended to
correlate with self ratings of creativity but not to other ratings of creativity. These two
general findings and the more specific findings are discussed next.
The relationship between domain-relevant skills and creativity was based on the
componential model of creativity (Amabile, 1983; 1988) and had, to my knowledge, not
been empirically tested previously. The measure created in this study was assessed by all
raters and there were similarities between the way supervisors and participants rated (both
in agreement and reliability). However, as noted previously, self ratings of domain-relevant
skills positively related to self ratings of creativity and other ratings of domain-relevant
skills positively related to other ratings of creativity. Future researchers may want to refine
and use this measure in creativity studies because, based on the exploratory analyses, it
was the second most consistent positive predictor of self rated creativity.
The presence of creative role models, supervisor support, and job autonomy all
correlated with self rated creativity in the expected positive direction. These three
Farabee, Angela, 2011, UMSL, p. 72
correlates tended to be non-significant predictors of self rated creativity when considering
other predictors (e.g., domain-relevant skills) in a multiple regression analysis. Also, they
did not significantly correlate with supervisor or coworker ratings. In terms of the
supervisor support measure, it may have had a stronger relationship with creativity had the
focus of the scale been different. The supervisor support measure asked about participants’
perception that their supervisor was supportive in general. Potentially, if the measure had
asked if their supervisor supported employee creativity in the organization, the relationship
between it and creativity might have been stronger due to their similar focus (Madjar,
Oldham, & Pratt, 2002).
As mentioned previously, Hypothesis 9, which stated that excessive time pressure
would be negatively related to creativity, was not supported. Time pressure and creativity
have a complex relationship such that at minimal and excessive levels of time pressure,
creativity is more likely to be lower than when it is at moderate levels (Baer & Oldham,
2006). The measure of time pressure in this study was meant to represent excessive time
pressure, but it is possible that the participants did not interpret the items in this way as
excessive time pressure was positively related to self ratings of creativity. Future
researchers may look into crafting a measure that only represents excessive time pressure;
otherwise, the relationships may be best represented as curvilinear. In the present study, the
curvilinear relationship between time pressure and creativity was tested and found to be
essentially the same as the linear relationship (e.g., correlation coefficients were both .15).
This is not surprising given that Baer and Oldham (2006) only found an inverted U-shaped
relationship for those high in the level of a moderator (e.g., openness to experience).
Lastly, like the general focus of the supervisor support measure, if excessive time pressure
Farabee, Angela, 2011, UMSL, p. 73
was not just general, but about excessive time pressure specifically hindering creativity, the
relationship between this and creativity may have been significant and negative (Baer &
Oldham, 2006).
The last two hypothesized correlates were creative job requirement and anticipated
reward for being creative. These variables were included to replicate Yuan and
Woodman’s (2010) study which linked these variables to supervisor ratings of innovative
behavior (defined as creativity and innovation combined). Both variables were positively
related to self rated creativity but were unrelated to supervisor or coworker ratings. This is
not surprising given that many of the correlates did not relate to other ratings. Additionally,
a main finding that resulted from the exploratory analysis was that anticipated reward for
being creative was the most consistent and largest predictor of self rated creativity
compared to the other correlates of creativity, including general PO values fit.
One of the most consistent findings throughout this entire study was that the results
of relationships to self and other ratings of creativity were mostly dissimilar. This
happened for the relationships concerning the competing values model, general PO values
fit, and the correlates of creativity. There are a few possible explanations for this finding.
First, interrater reliability for creativity was low. Recall that self ratings of creativity were
significantly correlated to supervisor ratings but the effect size was not large (i.e., r2 = .06).
Also, coworker ratings of creativity were not significantly correlated to self ratings, and,
had a small standard deviation. This lack of interrater reliability overall and potential range
restriction for coworker ratings may have contributed to the inconsistent relationships with
creativity and other study variables.
Farabee, Angela, 2011, UMSL, p. 74
In order to reduce the common method bias that may have resulted from having
individuals assess the predictor variables and creativity at the same time with the same
method (i.e., responding to a survey), creativity was measured at Time 2 as well. Although
there was a time lapse, common method bias could have been a second contributor to the
inconsistent findings. For example, the strongest relationships between the predictors and
creativity were observed with Time 1 ratings. Some of the relationships at Time 1 could
have been inflated due to common method bias. Common method bias could be another
reason why self and other ratings differed beyond lack of interrater reliability. That is, even
at Time 2 the self rated predictors were still being correlated with self rated creativity.
A third explanation for the self-other rating inconsistencies is that supervisor and
coworker creativity ratings might have been less accurate than self ratings. For example,
independent from both self and other ratings, job complexity was coded as past research
demonstrates that job complexity has been positively related to creativity (e.g., Amabile &
Gryskiewicz, 1989; Shalley et al., 2009). This variable also showed the pattern of
significantly correlating to self ratings but not to other ratings. Since this measure was
independent from all raters in this study, it is possible that supervisor and coworker ratings
were less accurate. Rater errors such as leniency may help explain this inaccuracy.
However, another plausible alternative explanation to supervisors and coworkers rating
inaccurately is that there may have been some accuracy as these raters could have just
observed different behaviors than individuals perceived of themselves. Lastly, researchers
have argued that creativity can be considered an internal process where supervisors and
coworkers are better judges of innovation, which is more visible, over creativity (Drazin,
Glynn, & Kazanjian, 1999). Given that for the current study the innovation ratings also
Farabee, Angela, 2011, UMSL, p. 75
mirrored the creativity ratings in that there were inconsistencies in relationships and low
interrater reliability, this may not be the case currently.
A fourth explanation for the inconsistent results is non-response bias. Participants
decided if they would provide the emails of their supervisors and coworkers for the study
as well as whom those individuals would be. Given that the means were significantly
higher for supervisor and coworker ratings, the individuals whose coworkers and
supervisor were not included may have given lower ratings than those who were; hence
participants may have been reluctant to provide contact information on them. Moreover,
inconsistencies in the Time 1 and Time 2 relationships could have been due to non-
response bias (e.g., the relationship between creativity/innovation value fit on creativity at
Time 1 to Time 2 was inconsistent, see Figure 6). It is likely that all three explanations
(i.e., lack of interrater reliability, inaccuracy in ratings, and non-response bias) had some
effect on the inconsistencies between relationships with self and other creativity ratings
and study variables. Overall, reviews on creativity (e.g., Shalley et al., 2004; Zhou &
Shalley, 2011) have suggested that field studies should begin to incorporate multiple raters
(e.g., self, supervisor, and coworker) to fully understand the creative relationship.
Consequently, in the creativity literature, these relationships are not yet clear.
Some insight regarding self and other ratings that may be useful for future
creativity research can be drawn from the literature on 360 degree feedback and
assessment centers. In the 360 degree feedback literature, some researchers are using the
lack of raters’ consistency to build theories (Atwater & Yammarino, 1992). That is, the
lack of consistency may be related to outcomes as different raters may see different aspects
of behavior; all of which may be valid. Atwater, Ostroff, Yammarino, and Fleenor (1998)
Farabee, Angela, 2011, UMSL, p. 76
found that self and other ratings were not in perfect agreement (or reliability), yet both
were significant predictors of managerial effectiveness. Moreover, the interaction of self
and other ratings mattered (e.g., effectiveness was highest when others rated higher than
managers did or if there was perfect agreement). Future creativity researchers may want to
consider how the degree of mismatch (i.e., agreement and reliability) between self and
other ratings relate to other study variables such as general PO values fit (e.g., via
polynomial regression).
Even if the mismatch between self and other ratings matters, it may also be possible
to increase reliability and agreement of self-other creativity ratings as has been
demonstrated with assessment center research. During assessment centers, raters make
evaluations of participants’ behavior. Likewise for this study, self and other raters were
asked to rate their perceptions of employee (or self) behavior. The raters may have had a
different conceptualization of creativity when answering the questions. In assessment
center research, ratings tend to be more consistent when the raters have had frame of
reference training (e.g., Goodstone & Lopez, 2001). Frame of reference training gives
raters a common definition of the concept and defines specific behavioral indicators of the
concept. Both of these are then reinforced though making practice ratings and receiving
feedback on the accuracy of the ratings. Applied here, if raters were trained briefly on what
constitutes creativity, they may have had more consistent ratings. The research on
assessment centers shows that after frame of reference training, raters were more consistent
in their assessments (e.g., better reliability), and this consistency increased the observed
statistical relationships between variables (Schleicher, Day, Mayes, & Riggio, 2002).
Overall, the relationships to self and other rated creativity may be greater and more
Farabee, Angela, 2011, UMSL, p. 77
consistent if raters are given frame of reference training, or at the least, if the rating scale is
behaviorally anchored.
Before discussing the practical implications of this study, there are a few
exploratory findings worth mentioning. For example, supervisors’ perception of their
direct reports’ creativity was positively related to job performance ratings, indicating for
this sample, creativity was seen as a positive behavior. Only a few studies have
investigated the relationship between creativity and performance (e.g., Zhang & Bartol,
2010) as creativity is usually the outcome in this type of research. Creativity did not have a
strong relationship with turnover intention for self ratings, indicating that higher creativity
may not relate to lower turnover intention. This relationship may be further explained if
future studies include continuance commitment (i.e., staying at an organization because
there are no other options) as a moderator. For example, Zhou and George (2001) found
that employees were creative (i.e., voiced concerns about change) when they were both
dissatisfied and had a high level of continuance commitment. Potentially, creativity and
turnover intention may be more strongly related in situations where there is also
continuance commitment.
Practical Implications
Organizations can use the information from this research to take steps toward
increasing employee creativity in their organizations. The first recommendation is that
organizations should move toward understanding how employees perceive the
organization’s cultural values as there could be potential differences between espoused
(values the organization says they have) and enacted values (values they actually have). By
understanding how employees perceive the environment, organizations can learn if they
Farabee, Angela, 2011, UMSL, p. 78
are high on the values that, coupled with employee fit on that value, may positively (or
negatively) relate to creativity. Of particular importance would be to determine if there are
high levels of creativity/innovation value or internal processes value. That is, if there are
high levels of creativity/innovation value, employees are more likely to be creative,
especially if they fit with this value. An organization could even ask employees if
creativity/innovation is something they value in this first step in order to form a more
holistic understanding of if individuals fit with the culture (instead of assuming they do
since they have not left the organization). Likewise, if organizations are high on internal
processes value and employees fit on this value, the organization may find that creativity is
not happening at high levels, especially if the organization is also low on
creativity/innovation value. Given that creativity/innovation value and internal processes
value do not share the same characteristics (i.e., external and flexible versus internal and
controlled), this may be the case that an organization high on internal processes value is
also low on creativity/innovation value. More research needs to be conducted to fully
understand the impact of human relations and rational goal values fit on creativity, but it
seems possible, based on this research, that fit on these values may at least somewhat
predict higher levels of creativity.
If organizations find they are not high on creativity/innovation value, they can
initiate a culture change to work toward instating this value. At the same time, they may
need to reduce the focus on internal processes value. As culture change is a slow process
(Zell, 1997), an organization would need to build in systems to support creativity (e.g.,
gaining supervisor understanding so they can be supportive, identifying creative role
models to set the example, implementing rewards for creativity, and tolerating risk-taking).
Farabee, Angela, 2011, UMSL, p. 79
Given that behavioral norms govern, to some degree, how employees behave in an
organization, organizations might be able to identify the specific norms in the organization
that might hinder creativity (e.g., conforming to the group to ensure cohesion). These
norms could be identified through focus groups or an employee survey. The norms that
employees find most intense are likely to be the ones that direct behavior (O’Reilly, 1989)
and it would be useful to create salient norms that support creativity (e.g., risk-taking).
Based on this research, the largest consistent significant predictor of creativity was
anticipated reward for being creative. If creativity is tied to rewards, employees are more
likely to see themselves as creative and in turn, are more likely to implement that
creativity. Therefore, if rewards are used to spur creativity, it would behoove organizations
to ensure their employees value rewards for being creative as well as to form an
understanding of what rewards are important to them (e.g., monetary vs. public
recognition; Vroom, 1964).
Organizations may also benefit from attracting those who prefer creativity in
organizations by means of employee recruiting. For example, organizations could send the
message on company web sites or through other recruitment material that they are seeking
applicants who value creativity. By implementing structures that support creativity and
attracting individuals who are creative, employees are more likely to be creative and
innovative.
The last recommendation for organizations based on the inconsistent self and other
ratings in this study is that they should develop a common definition of what creativity and
innovation mean. In terms of creating a common definition, Unsworth (2001) suggests that
there are four types of creativity and organizations might find one more important than the
Farabee, Angela, 2011, UMSL, p. 80
other. For example, one of the creativity types is responsive creativity which is creativity
in response to an organizational problem, whereas proactive creativity is where there is no
current problem; instead this type of creativity is unprompted. Concept definition and
frame of reference training may be a beneficial addition to any culture change toward
creativity/innovation value.
Limitations and Future Research
There are a few limitations of this study that should be mentioned. First, although
creativity was measured by two sources independent from the participant and at Times 1
and 2, the data were correlational; therefore, the assumption cannot be made that PO fit
causes less or more creativity. Laboratory studies where group value composition is
manipulated, or quasi-experiments where those high in the same value are asked to work
together on a creative project, may be used in order to allow for more causal statements. In
addition, this study was cross-sectional where self and other ratings were made at
essentially the same time. Longitudinal data would add more evidence to support the PO
fit-creativity link (Zhou & Shalley, 2011).
Another potential limitation was how PO fit was measured. A subjective needs-
supplies PO fit measure was used to capture the competing values model dimensions. This
measure had participants rate both the values they wanted in an organization and what they
believed the organization’s values are (Kristof, 1996). While individuals’ fit perceptions
relate to important attitudinal outcomes (e.g., turnover intention; Hoffman & Woehr, 2006;
Kristof-Brown, et al., 2005), objective measures tend to have higher relationships with
actual behaviors (Hoffman & Woehr). An objective PO fit measure still requires
individuals to rate what they value in an organization, but then a separate group of
Farabee, Angela, 2011, UMSL, p. 81
employees rate the organization’s values. Although there were two other sources used for
measuring the organization’s culture, there were some issues with reliability and agreement
among them. In order to use objective fit measures, multiple raters need to agree on the
culture of the organization. In addition, this would also likely mean that one organization
would have to be studied versus including a random sample of employees from a variety of
industries. Future researchers may be able to use a research method that lends itself to
studying PO fit with an objective measure (e.g., by surveying members of a single
organization).
The sample in this study may have influenced the results. A wide variety of
individuals with different backgrounds were included to represent differences in the
environmental levels of the different values. This is a strength as fit has been shown to be
unrelated to creativity when the environment to which individuals were assessing their fit
was similar (i.e., low variance truncates relationships; Choi 2004). However, there were
some differences between graduate students and undergraduates and those currently
working versus those not working. These differences were assessed by looking at the
groups separately in some instances (e.g., in the multiple regression analyses), but future
research would benefit from using different kinds of samples, including more
homogeneous samples. For instance, an ideal way to test the hypotheses in this study
would be to have the sample consist of multiple organizations instead of individuals
(Schneider, 2008). That is, these relationships could be tested at the organizational level;
although obtaining enough power would be difficult. Overall, the results of this study need
to be replicated so that the generalizability of these findings can be assessed. While the
sample size was acceptable for self ratings, supervisors and coworkers had lower
Farabee, Angela, 2011, UMSL, p. 82
participation. There were still significant results with some supervisor and coworker
ratings; however, additional researchers can include more non-self ratings than in the
present study.
There are many avenues in which to take the PO fit and creativity literature. Given
that fit only accounted for some of the variance in creativity in the current study, it is
possible that fit is a distal predictor to more proximal predictors of creativity. For example,
if individuals fit with an organization, then they are likely similar to other members and
share common mental models and information. In other words, fit may be related to
creativity because of these other factors. Future researchers could incorporate these other
factors by using social network theories such as the strength of weak ties theory
(Granovetter, 1973) with PO fit when predicting creativity. Social network characteristics
(e.g., density of strong ties) might be the proximal mechanism through which PO fit relates
to creativity. In addition, there has been a call to extend the research on creativity to
include social networks (e.g., Zhou & Shalley, 2011). One step further would be to
incorporate both PO fit and social networks.
There are more types of fit than just PO fit, and considering these other types of fit
would be an informative direction in which to take fit- creativity research. For example,
person- group fit may be especially relevant for creativity research as many times,
organizations have a culture that requires teamwork. Moreover, this may mean that teams
have to be creative together, not just at the individual level. Multilevel research on fit and
creativity may help organizations understand how person-group fit relates to team or
individual creativity. This may also help address the inconsistent research on the impact
Farabee, Angela, 2011, UMSL, p. 83
that team composition has on team creativity (e.g., understanding the role that diversity
plays; Milliken et al., 2003; Shin & Zhou, 2007).
In the introduction I mentioned that there were other correlates of creativity that
were not included in the present study that could be included in future fit-creativity
research. These include more individual factors such as moods, creativity-relevant skills,
and openness to experience. A recent review by Zhou and Shalley (2011) describes many
variables that could be relevant in creativity (and PO fit) research. For example, creativity
researchers have recently included the variable creative self-efficacy (Tierney & Farmer,
2004) which is individuals’ belief in their ability to be creative. Another variable,
psychological safety (Edmondson, 1999), allows individuals to feel safe with taking risks
or speaking against norms which may relate to higher levels of creativity. These variables
may be potential moderators of the relationship between PO fit and creativity or person-
group fit and creativity. Mentioned in Shalley et al.’s (2004) review is that there is some
research on the impact that the physical space one is working in has on creativity. A few
examples of physical space that may be investigated include how an open floor plan versus
a closed plan (tall cubicle walls and many offices) effect creativity or even, understanding
which furniture, colors, and decorations are most conducive for creativity. This is
something that could lend itself to laboratory studies. Fit may interact with the physical
space in predicting creativity.
Although there are many different avenues in which to take fit-creativity research,
two final areas addressed currently concern understanding self-other creativity rating
differences and the implication of time in fit-creativity studies. First, as there was a lack of
consistency between self and other ratings, future researchers should look at the degree of
Farabee, Angela, 2011, UMSL, p. 84
correlation between supervisor ratings of employee creativity and employee ratings of how
they believe their supervisor would rate them on creativity. Likewise, self ratings of
creativity should be correlated to supervisor ratings of how supervisors think their direct
reports would rate their own creativity. For example, employees may think that they are
creative, but know that their supervisor has not seen this behavior; therefore, while the
employee would rate themselves high on creativity, they may respond that the supervisor
would rate their creativity low. It is more likely that supervisor creativity ratings and what
employees believe would be their supervisors’ ratings would show a stronger relationship
than would self rated creativity with supervisor rated creativity. Assessing creativity in this
way could help researchers understand why self and other ratings may differ.
Lastly, as the ASA framework suggests that organizations become more
homogeneous over time, future fit-creativity research could place more emphasis on time.
For example, in this study the length of time employees worked with their supervisor and
coworker and the time they were on their job and in the organization were captured
(although since time on the job and in the organization were highly correlated, only time
on the job was presented for simplicity). While the current results with these time
variables did not relate to creativity, they may still have an impact in other scenarios. For
instance, if researchers collect data at just one organization, there may be a difference in
creativity based on tenure with the organization or tenure with the supervisor. As ASA
would suggest, the longer employees are with an organization, the more likely they are
similar to other members of the organization. Potentially, a long tenure could be associated
with less creativity. Time under the same supervisor may also be related to creativity. With
shorter tenure with a supervisor, employees may feel less psychologically safe to be
Farabee, Angela, 2011, UMSL, p. 85
creative. Finally, to understand how fit and time spent working with the supervisor relates
to creativity, researchers may also include leader-member exchange theory (Graen & Uhl-
Bien, 1995). That is, fit and time with the supervisor may matter, but also the quality of the
relationship between the leader and the member could impact employee creativity. The
preceding scenarios are just a few examples of how time may be an informative variable in
future fit-creativity studies.
To conclude, while the findings of this research did not produce a definitive answer
to the question of whether or not PO fit is negatively related to creativity, my hope is that
this study will generate additional discussion and research attention to the subject of
whether or not there is a ―dark side‖ to PO fit. Creativity and innovation are important
outcomes for many organizations and will likely continue to be part of their organizational
strategies. With additional research over the relationship between PO fit and creativity,
organizations can begin to create the most conducive environment to foster creativity and
innovation. Research in this area may also be a useful way to bring researchers and
practitioners together in order to help bridge the perceived scientist-practitioner gap in the
field of Industrial-Organizational Psychology.
Farabee, Angela, 2011, UMSL, p. 86
References
Allport, G. (1937). Personality: A psychological interpretation. New York: Holt.
Amabile, T. M. (1983). The social psychology of creativity. New York: Springer-Verlag.
Amabile, T. M. (1988). A model of creativity and innovation in organizations. In B. M.
Staw & L. L. Cummings (Eds.), Research in organizational behavior, vol. 10: 123-
167. Greenwich, CT: JAJ Press.
Amabile, T. M. (1996). Creativity in context. Boulder, CO: Westview.
Amabile, T. M., Conti, R., Coon, H., Lazenby, J., & Herron, M. (1996). Assessing the
work environment for creativity. Academy of Management Journal, 39, 1154-1184.
Amabile, T. M., & Gitomer, J. (1984). Children’s artistic creativity: Effects of choice in
task materials. Personality and Social Psychology Bulletin, 10, 209-215.
Andrew, J. P. (2010). What executives make of innovation. Retrieved on May 7, 2010
from
http://www.businessweek.com/magazine/content/10_17/b4175043789498.htm?cha
n=magazine+channel_special+report.
Andrews, F. M., & Farris, G. F., (1972). Time pressure and performance of scientists and
engineers: A five year panel study. Organizational Behavior and Human
Performance, 8, 185-200.
Andrews, J., & Smith, D. C., (1996). In search of the marketing imagination: Factors
affectiving the creativity of marketing programs for mature products. Journal of
Marketing Research, 33, 174-187.
Farabee, Angela, 2011, UMSL, p. 87
Anseel, F., & Lievens, F. (2006). Certainty as a moderator of feedback reactions? A test of
the strength of the self-verification motive. Journal of Occupational and
Organizational Psychology, 79, 533-551.
Arthur, W., Bell, S. T., Villado, A. J., & Doverspike, D. (2006). The use of person-
organization fit in employment decision making: An assessment of its criterion-
related validity. Journal of Applied Psychology, 4, 786-801.
Atwater, L. E., & Yammarino, F. J. (1992). Self-other rating agreement: A review and
model. Research in Personnel and Human Resources Management, 15, 121-174.
Atwater, L. E., Ostroff, C., Yammarino, F. J., & Fleenor, J. W. (1998). Self-other
agreement: Does it really matter? Personnel Psychology, 51, 577-598.
Axtell, C. M., Holman, D. J., Unsworth, K. L., Wall, T. D., Waterson, P. E., & Harrison, E.
(2000). Shopfloor innovation: Facilitating the suggestion and implementation of
ideas. Journal of Occupational and Organizational Psychology, 73, 265-285.
Baer, M., & Oldham, G. R. (2006). The curvilinear relation between experienced creative
time pressure and creativity: Moderating effects of openness to experience and
support for creativity. Journal of Applied Psychology, 91, 963-970.
Bandura, A. (1986). Social foundations of thought and action: A social cognitive
theory. Englewood Cliffs, NJ: Prentice Hall.
Barron. F. B., & Harrington. D. M. (1981). Creativity, intelligence, and personality.
Annual Review of Psychology, 32, 439-476.
Basadur, M., Wakabayashi, M., &, Graen, G. B. (1990). Individual problem-solving styles
and attitudes toward divergent thinking before and after training. Creativity
Research Journal, 3, 22-32.
Farabee, Angela, 2011, UMSL, p. 88
Brass, D. J. (1995). Creativity: It’s all in your social network. In C. M.Ford & D. A. Gioia
(Eds.), Creative action in organizations (pp. 94–99).Thousand Oaks, CA: Sage.
Breaugh, J. A. (1999). Further investigation of the work autonomy scales: Two studies.
Journal of Business and Psychology, 13, 357-373.
Brief, A. P., & Weiss, H. M. (2002). Organizational behavior: Affect in the workplace.
Annual Review of Psychology, 53, 279-307.
Burt, R. S. (1992). Structural holes: The social structure of competition. Cambridge, MA:
Harvard University Press.
Burt, R. S. (2004). Structural holes and good ideas. American Journal of Sociology, 110,
349-399.
Byrne, D. (1971). The attraction paradigm. New York: Academic Press.
Cameron, K. S., & Quinn, R. E. (1999). Diagnosing and changing organizational culture.
Reading, MA: Addison-Wesley.
Caplan, R. D. (1987). Person-environment fit theory and organizations: Commensurate
dimensions, time perspectives, and mechanisms. Journal of Vocational Behavior,
31, 248-267.
Chapman, D. S., Uggerslev, K. L., Carroll, S. A., Piasentin, K. A., & Jones, D. A. (2005).
Application attraction to organizations and job choice: A meta-analytic review of
the correlates of recruiting outcomes. Journal of Applied Psychology, 90, 928-944.
Chatman, J. A. (1989). Improving interactional organizational research: A model of
person-organization fit. Academy of management Review, 3, 333-349.
Farabee, Angela, 2011, UMSL, p. 89
Choi, J. N. (2004). Person-environment fit and creative behavior: Differential impacts of
supplies-values and demands-abilities versions of fit. Human Relations, 57, 531-
552.
Choi, J. N., & Price, R. H. (2005). The effects of person-innovation fit on individual
responses to innovation. Journal of Occupational and Organizational Psychology,
78, 83-96.
Cohen, J., Cohen, P, West, S. G., & Aiken, L. S. (2003). Applied Multiple
Regression/Correlational Analysis for the Behavioral Sciences. (3rd
ed.). Mahwah,
N.J., Lawrence Erlbaum.
Colarelli, S. M. (1984). Methods of communication and mediating processes in realistic
job previews. Journal of Applied Psychology, 69, 633-642.
Conti, R., Coon, H., & Amabile, T. M. (1996). Evidence to support the Componential
Model of Creativity: Secondary analyses of three studies. Creativity Research
Journal, 9, 385-389.
Costa, P. T., & McCrae, R. R. (1992). Revised NEO Personality Inventory (NEO
PI-R)
and NEO Five-Factor Inventory (NEO-FFI) professional manual. Odessa,
FL: Psychological Assessment Resources.
Das, T. K., & Teng, B. S. (1999). Cognitive biases and strategic decision processes: An
integrative perspective, Journal of Management Studies, 36, 757-778.
Davis, S. (1984). Managing corporate culture. Cambridge, MA: Ballinger.
Deci, E. L., Connell, J. P., & Ryan, R. M. 1989. Self-determination in a work organization.
Journal of Applied Psychology, 74, 580–590.
Farabee, Angela, 2011, UMSL, p. 90
Deci, E. L., & Ryan, R. M. (1985). The general causality orientation scale: Self-
determination in personality. Journal of Research in Personality, 19, 109-137.
Dewett, T. (2006). Exploring the role of risk in employee creativity. Journal of Creative
Behavior, 40, 27-45.
Drazin, R., Glynn, M., & Kazanjian, R. (1999). Multilevel theorizing about
creativity in
organizations: A sensemaking perspective. Academy of Management
Review, 24, 286-307.
Durham, C. C., Locke, E. A., Poon, J. L., & McLeod, P. L. (2000). Effects of group goals
and time pressure on group efficacy, information-seeking strategy, and
performance. Human Resources, 13, 115-138.
Edmondson, A. C. (1999). Psychological safety and learning behavior in work teams.
Administrative Science Quarterly, 44, 350-383.
Edwards, J. R. (1993). Problems with the use of profile similarity indices in the study of
congruence in organizational research. Personnel Psychology, 46, 641-665.
Edwards, J. R. (1994). The study of congruence in organizational behavior research:
Critique and a proposed alternative. Organizational Behavior and Human Decision
Processes, 58, 51-100.
Edwards, J. R. (2002). Alternatives to difference scores: Polynomial regression analysis
and response surface methodology. In F. Drasgow & N. W. Schmitt (Eds.),
Advances in measurement and data analysis (pp. 350-400). San Francisco: Jossey-
Bass.
Farabee, Angela, 2011, UMSL, p. 91
Edwards, J. R. (2008). Person-environment fit in organizations: An assessment of
theoretical progress. The Academy of Management Annuals, 2, 167-230.
Edwards, J. R. & Rothbard, N. P. (1999). Work and family stress and well-being: An
examination of person-environment fit in the work and family domains.
Organizational Behavior and Human Decision Processes, 77, 85-102.
Feist, G. J. (1998). A meta-analysis of personality in scientific and artistic
creativity.
Personality and Social Psychology Review, 4, 290-309.
French, J. R. P., Jr., Rogers, W., & Cobb, S. (1974). Adjustment as person-
environment fit. In D. A. H. G. V. Coelho, & J. E. Adams (Ed.), Coping
and adaption. New York: Basic Books.
Frese, M., Teng, E., & Wijnen, C. J. (1999). Helping to improve suggestion systems:
Predictors of making suggestions in companies. Journal of Organizational
Behavior, 20, 1139–1155.
George, J. M., & Zhou, J. 2001. When openness to experience and conscientiousness are
related to creative behavior: An interactional approach. Journal of Applied
Psychology, 86, 513–524.
Giberson, T. R., Resick, C. J., & Dickson, M. W. (2005). Embedding leader
characteristics: An examination of homogeneity of personality and values in
organizations. Journal of Applied Psychology, 90, 1002-1010.
Goodstone, M. S. & Lopez, F. E. (2001). The frame of reference approach as a solution to
an assessment center dilemma. Consulting Psychology Journal, 53, 96-107.
Farabee, Angela, 2011, UMSL, p. 92
Graen,G. B. & Uhl-Bien, M.(1995). The relationship-based approach to leadership:
Development of LMX theory of leadership over 25 years: Applying a multi-level,
multi-domain perspective. Leadership Quarterly, 6,219-247.
Granovetter, M. S. (1973). The strength of weak ties. American Journal of Sociology, 78,
1360-1380.
Hackman, J. R., & Oldham, G. R. (1976). Motivation through the design of work: Test of a
theory. Organizational Behavior and Human Performance, 16, 250-279.
Hackman, J. R., & Oldham, G. R. (1980). Work redesign. Reading, MA: Addison-Wesley.
Harrison, D. A. (2007). Pitching fits in applied psychological research: Making fit methods
fit theory. In C. Ostroff & T. A. Judge (Ed.), Perspectives on organizational fit.
(pp. 389-416). New York: Lawrence Erlbaum Associates.
Hoffman, B. J., & Woehr, D. J. (2006). A quantitative review of the relationship between
person-organization fit and behavioral outcomes. Journal of Vocational Behavior,
68, 389-399.
House, R. J., & Dessler, G. 1974. The path goal theory of leadership: Some post hoc and a
priori tests. In J. Hunt & L. Larson (Eds.), Contingency Approaches to Leadership:
29–55. Carbondale, IL: Southern Illinois University Press.
Howard, L. W. (1998). Validating the competing values model as a representation of
organizational cultures. The International Journal of Organizational Analysis, 6,
231-250.
Jordan, M., Herriot, E., & Chalmers, C. (1991). Testing Schneider's ASA theory. Applied
Psychology: An International Review, 40, 47-54.
Farabee, Angela, 2011, UMSL, p. 93
Kelly, J. R., & McGrath, J. E. (1985). Effects of time limits and task types on task
performance and interaction of four-person groups. Journal of Personality and
Social Psychology, 49, 395-497.
Kirton, M. J. (1976). Adaptors and innovators: A description and measure. Journal
of Applied Psychology, 61, 622-629.
Kristof, A. L. (1996). Person-organization fit: An integrative review of its
conceptualizations, measurement, and implications. Personnel Psychology, 49, 1-
49.
Kristof-Brown, A. L., & Guay, R. P. (2011). Person-environment fit. In S. Zedeck (Ed.),
Handbook of Industrial and Organizational Psychology. Washington D. C.:
American Psychological Association.
Kristof-Brown, A. L., Zimmerman, R. D., & Johnson, E. C. (2005). Consequences of
individuals’ fit at work: A meta-analysis of person-job, person-organization,
person-group, and person-supervisor fit. Personnel Psychology, 58, 281-342.
Lewin, K. (1936). Principles of Topological Psychology. New York: McGraw-Hill.
Lipkin, J. N. (1999). Person-organization fit and creative thinking: A study of the
relationship between person-organization value fit and creative thinking.
Unpublished doctoral dissertation. California School of Professional Psychology.
Livingstone, L. P., Nelson, D. L., & Barr, S. H. (1997). Person-environment fit and
creativity: An examination of supply-value and demand-ability versions of fit.
Journal of Management, 23, 119-146.
Farabee, Angela, 2011, UMSL, p. 94
Madjar, N., Oldham, G. R., & Pratt, M. G. (2002). There’s no place like home? The
contributions of work and nonwork creativity support to employees’ creative
performance. Academy of Management Journal, 45, 757-767.
Mehrabian, A., & Stefl, C. A. (1995). Basic temperament components of loneliness,
shyness, and conformity. Social Behavior and Personality, 23, 253-264.
Meyer, J. P., Hecht, T. D., Gill, H., & Toplonytsky, L. (2010). Person-organization
(culture) fit and employee commitment under conditions of organizational change:
A longitudinal study. Journal of Vocational Behavior, 76, 458-473.
Milliken, F. J., Bartel, C. A., & Kurtzberg, T. (2003). Diversity and creativity in work
groups: A dynamic perspective on the affective and cognitive processes that link
diversity and performance. In P. Paulus & B. Nijstad (Eds.), Group creativity: 32–
62. New York: Oxford University Press.
Mischel, W. (1968). Personality and assessment. New York: Wiley.
Muchinsky, P. M., & Monahan, C. J. (1987). What is person-environment congruence?
Supplementary versus complementary models of fit. Journal of Vocational
Behavior, 31, 268–277.
Mumford, M. D., & Gustafson, S. B. (1988). Creativity syndrome: integration, application,
and innovation. Psychological Bulletin, 103, 27-43.
Noefer, K., Stegmaier , R., Molter, B., & Sonntag, K. (2009). A great many things to do
and not a minute to spare: Can feedback from supervisors moderate the relationship
between skill variety, time pressure, and employees’ innovative behavior.
Creativity Research Journal, 21, 384-393.
Nunnally, J. C. (1978). Psychometric theory. New York: McGraw-Hill.
Farabee, Angela, 2011, UMSL, p. 95
Ohly, S., Sonnentag, S., & Pluntke, F. (2006). Routinization, work characteristics and their
relationship with creative and proactive behaviors. Journal of Organizational
Behavior, 27, 257-279.
Oldham, G. R., & Cummings, A. (1996). Employee creativity: Personal and contextual
factors at work. Academy of Management Journal, 39, 607-634.
O’Reilly, C. A. (1989). Corporations, culture, and commitment: Motivation and social
control in organizations. California Management Review, 31, 9-25.
O’Reilly, C. A., III, Chatman, J., & Caldwell, D. F. (1991). People and organizational
culture: A profile comparison approach to assessing person-organization fit.
Academy of Management Journal, 34, 487-516.
Ostroff, C., Shin, Y., & Kinicki, A. J. (2005). Multiple perspectives of congruence:
Relationships between values congruence and employee attitudes. Journal of
Organizational Behavior, 26, 591-623.
Perry-Smith, J. E. (2006). Social yet creative: The role of social relationships in facilitating
individual creativity. Academy of Management Journal, 49, 85-101.
Pervin, L. A. (1989). Persons, Situations, Interactions: The history of a controversy and a
discussion of theoretical models. Academy of Management Review, 14, 350-360.
Podsakoff, P. M., MacKenzie, S. B., Lee, J., & Podsakoff, N. P. (2003). Common method
biases in behavioral research: A critical review of the literature and recommended
remedies. Journal of Applied Psychology, 88, 879-903.
Quinn, R. E. (1988). Beyond rational management: Mastering the paradoxes and
competing demands of high performance. San Francisco: Jossey-Bass.
Farabee, Angela, 2011, UMSL, p. 96
Quinn, R. E., & Rohrbaugh, J. (1981). A competing values approach to organizational
effectiveness. Public Productivity Review, 5, 122–140.
Quinn, R. E., & Rohrbaugh, J. (1983). A spatial model of effectiveness criteria: Toward a
competing values approach to organizational analysis. Management Science, 29,
363-377.
Rice, G. (2006). Individual values, organizational context, and self-perceptions of
employee creativity: Evidence from Egyptian organizations. Journal of Business
Research, 59, 233-241.
Roos, P. A., & Treiman, D. J. (1980). DOT scales for the 1970 census classification. In A.
R. Miller, D. J. Treinman, P. S. Cain, & P. A. Roos (Ed.), Work, Jobs, and
Occupations. A Critical Review of the Dictionary of Occupational Titles.
Washington DC: National Academy Press.
Saks, A. M., & Ashforth, B. E. (2002). Is job search related to employment quality? It all
depends on the fit. Journal of Applied Psychology, 87, 646-654.
Schein E. (1992). Organizational culture and leadership. San Francisco: Jossey-Bass.
Schleicher, D. J., Day, D. V., Mayes, B. T., & Riggio, R. E. (2002). A new frame for
frame-of-reference training: Enhancing the construct validity of assessment centers.
Journal of Applied Psychology, 87, 735-746.
Schneider, B. (1987). The people make the place. Personnel Psychology, 40, 437-453.
Schneider, B. (2008). The people still make the place. In B. D. Smith (Ed.), The people
make the place: Dynamic linkages between individuals and organizations. New
York, NY: Taylor and Frances Group/Lawrence Erlbaum Associates.
Farabee, Angela, 2011, UMSL, p. 97
Schneider, B., Goldstein, H. W., & Smith, D. B. (1995). The ASA framework: An update.
Personnel Psychology, 48, 747-771.
Schneider, B., Smith, D. B., Taylor, S., & Fleenor, J. (1998). Personality and
organizations: A test of homogeneity of personality hypothesis. Journal of Applied
Psychology, 83, 462-470.
Schwartz, S. H. (1992). Universals in the content and structure of values: Theoretical
advances and empirical tests in 20 countries. In M. Zanna (Ed.), Advances in
experimental social psychology. San Diego, CA: Academic Press; US.
Sethia, N. K. (1989). The shaping of creativity in organizations. Academy of Management
Best Papers Proceedings. 49th
annual meeting. Washington DC, August 13-16.
Shalley, C. E., Gilson, L.L., & Blum, T.C. (2009). Interactive effects of growth
need
strength, work context, and job complexity on self-reported creative
performance. Academy of Management Journal, 52, 489-505.
Shalley, C. E., & Perry-Smith, J. E. (2001). Effects of social-psychological factors
on
creative performance: The role of informational and controlling expected
evaluation and modeling experience. Organizational Behavior and Human
Decision Processes, 84, 1-22.
Shalley, C. E., Zhou, J., & Oldham, G. R. (2004). The effects of personal and contextual
characteristics on creativity: Where should we go from here? Journal of
Management, 30, 933-958.
Farabee, Angela, 2011, UMSL, p. 98
Shanock, L. R., Baran, B. E., Gentry, W. A., Pattison, S. C., & Heggestad, E. D. (2010).
Polynomial regression with response surface analysis: A powerful approach for
examining moderation and overcoming limitations of difference scores. Journal of
Business Psychology, 25, 543-554.
Shin, S. J., & Zhou, J. (2007). When is educational specialization heterogeneity related to
creativity in research and development teams? Transformational leadership as a
moderator. Journal of Applied Psychology, 92, 1709-1721.
Tabachnick, B. G., & Fidell, L. S. (2007). Using multivariate statistics. Boston, MA:
Pearson Education, Inc.
Tierney, P., Farmer, S. M., & Graen, G. B. (1999). An examination of leadership and
employee creativity: The relevance of traits and relationships. Personnel
Psychology, 52, 591-620.
Tierney, P. & Farmer, S.M. (2004). The Pygmalion process and employee
creativity.
Journal of Management, 30, 413-432.
Unsworth, K. (2001). Unpacking creativity. Academy of Management Review, 26, 289-
297.
Verquer, M. L., Beehr, T. A., & Wagner, S. H. (2003). A meta-analysis of relations
between person-organization fit and work attitudes. Journal of Vocational
Behavior, 63, 473-489.
Vroom, V. H. (1964). Work and motivation. New York: Wiley.
Farabee, Angela, 2011, UMSL, p. 99
West, M.A. (2001). The human team. In N. Anderson, D.S. Ones, H. Sinangil, & C.
Viswesvaran (Ed.), Handbook of industrial, work & organizational psychology,
Volume 2, Organizational psychology (pp. 270-288). London: Sage.
West, M. A., & Atlink, W. M. M. (1996). Innovation at work: Individual, group, and
organizational and sociohistorical perspectives. European Journal of Work and
Organizational Psychology, 2, 3-11.
Woodman, R. W., & Schoenfeldt. L. F. (1990). An interactionist model of creative
behavior. Journal of Creative Behavior, 24 279-290.
Woodman, R. W., Sawyer, J. E., & Griffin, R. W. (1993). Toward a theory of
organizational creativity. Academy of Management Review, 18, 293-321.
Yuan, F., & Woodman, R. W. (2010). Innovative behavior in the workplace: The role of
performance and image outcome expectations. Academy of Management Journal,
53, 323-342.
Zell, D. (1997). Changing by Design. Ithaca, NY: Cornell University Press.
Zhang, X., & Bartol, K. M. (2010). The influence of creative process engagement on
employee creative performance and overall job performance. Journal of Applied
Psychology,95, 862-873.
Zhou, J. (2003). When the presence of creative coworkers is related to creativity:
Role of
supervisor close monitoring, developmental feedback, and creative
personality. Journal of Applied Psychology, 88, 413-422.
Zhou, J., & George, J. M. (2001). When dissatisfaction leads to creativity:
Encouraging the expression of voice. Academy of Management Journal, 44,
Farabee, Angela, 2011, UMSL, p. 100
682-696.
Zhou, J., & Shalley, C. E. (2011). Deepening our understanding of creativity in the
workplace: A review of different approaches to creativity research. In S. Zedeck
(Ed.), Handbook of Industrial and Organizational Psychology. Washington D. C.:
American Psychological Association.
Zhou, J., Shin, S. J., Brass, D. J., Choi, J., & Zhang, Z. (2009). Social networks, personal
values, and creativity: Evidence for curvilinear and interaction effects. Journal of
Applied Psychology, 94, 1544-1552.
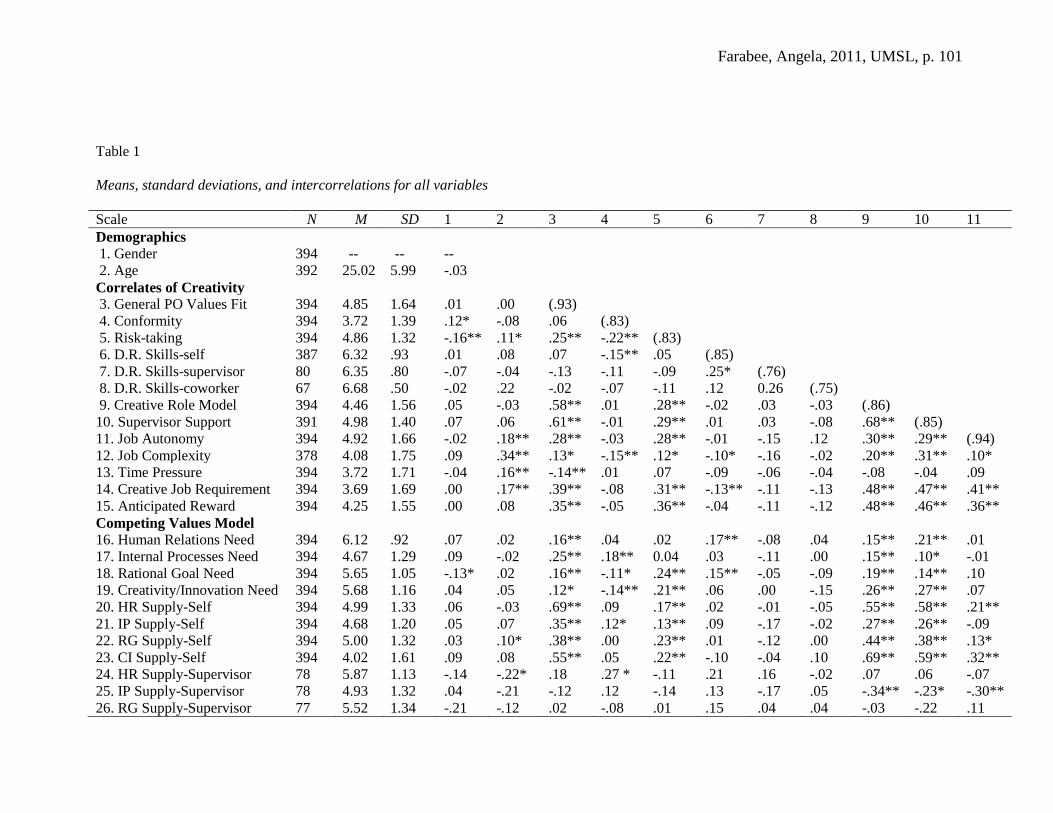
Farabee, Angela, 2011, UMSL, p. 101
Table 1
Means, standard deviations, and intercorrelations for all variables
Scale N M SD 1 2 3 4 5 6 7 8 9 10 11
Demographics
1. Gender 394 -- -- --
2. Age 392 25.02 5.99 -.03
Correlates of Creativity
3. General PO Values Fit 394 4.85 1.64 .01 .00 (.93)
4. Conformity 394 3.72 1.39 .12* -.08 .06 (.83)
5. Risk-taking 394 4.86 1.32 -.16** .11* .25** -.22** (.83)
6. D.R. Skills-self 387 6.32 .93 .01 .08 .07 -.15** .05 (.85)
7. D.R. Skills-supervisor 80 6.35 .80 -.07 -.04 -.13 -.11 -.09 .25* (.76)
8. D.R. Skills-coworker 67 6.68 .50 -.02 .22 -.02 -.07 -.11 .12 0.26 (.75)
9. Creative Role Model 394 4.46 1.56 .05 -.03 .58** .01 .28** -.02 .03 -.03 (.86)
10. Supervisor Support 391 4.98 1.40 .07 .06 .61** -.01 .29** .01 .03 -.08 .68** (.85)
11. Job Autonomy 394 4.92 1.66 -.02 .18** .28** -.03 .28** -.01 -.15 .12 .30** .29** (.94)
12. Job Complexity 378 4.08 1.75 .09 .34** .13* -.15** .12* -.10* -.16 -.02 .20** .31** .10*
13. Time Pressure 394 3.72 1.71 -.04 .16** -.14** .01 .07 -.09 -.06 -.04 -.08 -.04 .09
14. Creative Job Requirement 394 3.69 1.69 .00 .17** .39** -.08 .31** -.13** -.11 -.13 .48** .47** .41**
15. Anticipated Reward 394 4.25 1.55 .00 .08 .35** -.05 .36** -.04 -.11 -.12 .48** .46** .36**
Competing Values Model
16. Human Relations Need 394 6.12 .92 .07 .02 .16** .04 .02 .17** -.08 .04 .15** .21** .01
17. Internal Processes Need 394 4.67 1.29 .09 -.02 .25** .18** 0.04 .03 -.11 .00 .15** .10* -.01
18. Rational Goal Need 394 5.65 1.05 -.13* .02 .16** -.11* .24** .15** -.05 -.09 .19** .14** .10
19. Creativity/Innovation Need 394 5.68 1.16 .04 .05 .12* -.14** .21** .06 .00 -.15 .26** .27** .07
20. HR Supply-Self 394 4.99 1.33 .06 -.03 .69** .09 .17** .02 -.01 -.05 .55** .58** .21**
21. IP Supply-Self 394 4.68 1.20 .05 .07 .35** .12* .13** .09 -.17 -.02 .27** .26** -.09
22. RG Supply-Self 394 5.00 1.32 .03 .10* .38** .00 .23** .01 -.12 .00 .44** .38** .13*
23. CI Supply-Self 394 4.02 1.61 .09 .08 .55** .05 .22** -.10 -.04 .10 .69** .59** .32**
24. HR Supply-Supervisor 78 5.87 1.13 -.14 -.22* .18 .27 * -.11 .21 .16 -.02 .07 .06 -.07
25. IP Supply-Supervisor 78 4.93 1.32 .04 -.21 -.12 .12 -.14 .13 -.17 .05 -.34** -.23* -.30**
26. RG Supply-Supervisor 77 5.52 1.34 -.21 -.12 .02 -.08 .01 .15 .04 .04 -.03 -.22 .11
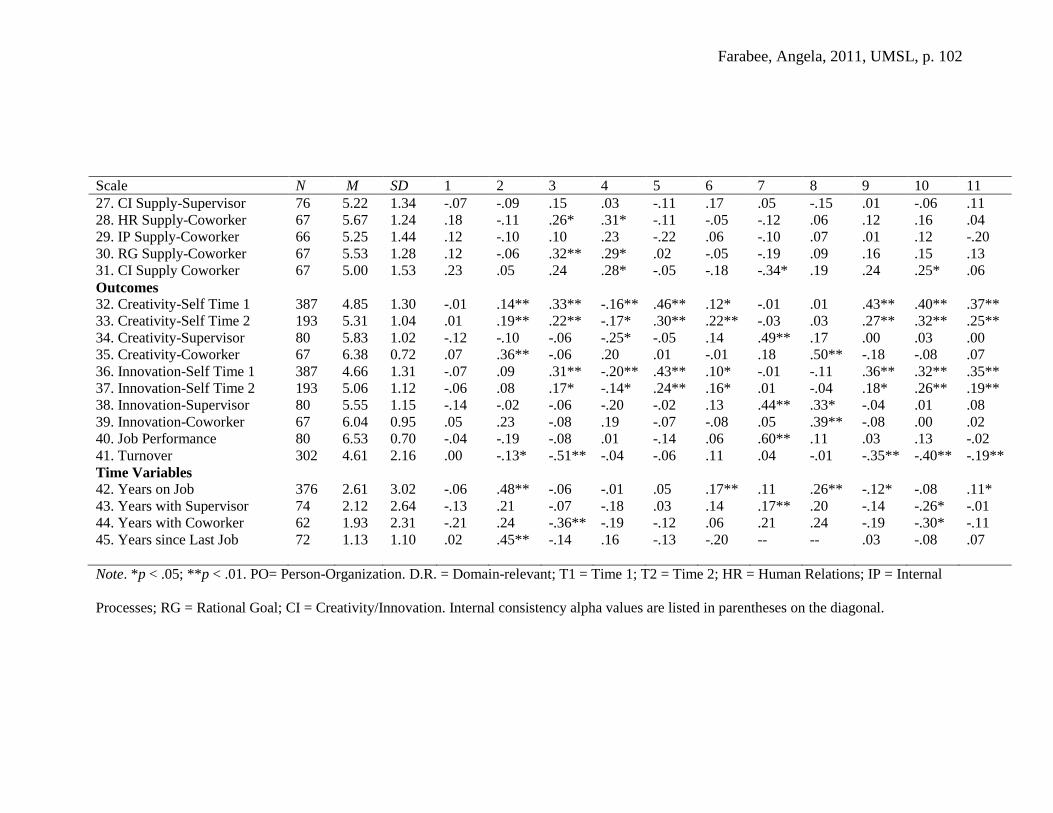
Farabee, Angela, 2011, UMSL, p. 102
Scale N M SD 1 2 3 4 5 6 7 8 9 10 11
27. CI Supply-Supervisor 76 5.22 1.34 -.07 -.09 .15 .03 -.11 .17 .05 -.15 .01 -.06 .11
28. HR Supply-Coworker 67 5.67 1.24 .18 -.11 .26* .31* -.11 -.05 -.12 .06 .12 .16 .04
29. IP Supply-Coworker 66 5.25 1.44 .12 -.10 .10 .23 -.22 .06 -.10 .07 .01 .12 -.20
30. RG Supply-Coworker 67 5.53 1.28 .12 -.06 .32** .29* .02 -.05 -.19 .09 .16 .15 .13
31. CI Supply Coworker 67 5.00 1.53 .23 .05 .24 .28* -.05 -.18 -.34* .19 .24 .25* .06
Outcomes
32. Creativity-Self Time 1 387 4.85 1.30 -.01 .14** .33** -.16** .46** .12* -.01 .01 .43** .40** .37**
33. Creativity-Self Time 2 193 5.31 1.04 .01 .19** .22** -.17* .30** .22** -.03 .03 .27** .32** .25**
34. Creativity-Supervisor 80 5.83 1.02 -.12 -.10 -.06 -.25* -.05 .14 .49** .17 .00 .03 .00
35. Creativity-Coworker 67 6.38 0.72 .07 .36** -.06 .20 .01 -.01 .18 .50** -.18 -.08 .07
36. Innovation-Self Time 1 387 4.66 1.31 -.07 .09 .31** -.20** .43** .10* -.01 -.11 .36** .32** .35**
37. Innovation-Self Time 2 193 5.06 1.12 -.06 .08 .17* -.14* .24** .16* .01 -.04 .18* .26** .19**
38. Innovation-Supervisor 80 5.55 1.15 -.14 -.02 -.06 -.20 -.02 .13 .44** .33* -.04 .01 .08
39. Innovation-Coworker 67 6.04 0.95 .05 .23 -.08 .19 -.07 -.08 .05 .39** -.08 .00 .02
40. Job Performance 80 6.53 0.70 -.04 -.19 -.08 .01 -.14 .06 .60** .11 .03 .13 -.02
41. Turnover 302 4.61 2.16 .00 -.13* -.51** -.04 -.06 .11 .04 -.01 -.35** -.40** -.19**
Time Variables
42. Years on Job 376 2.61 3.02 -.06 .48** -.06 -.01 .05 .17** .11 .26** -.12* -.08 .11*
43. Years with Supervisor 74 2.12 2.64 -.13 .21 -.07 -.18 .03 .14 .17** .20 -.14 -.26* -.01
44. Years with Coworker 62 1.93 2.31 -.21 .24 -.36** -.19 -.12 .06 .21 .24 -.19 -.30* -.11
45. Years since Last Job 72 1.13 1.10 .02 .45** -.14 .16 -.13 -.20 -- -- .03 -.08 .07
Note. *p < .05; **p < .01. PO= Person-Organization. D.R. = Domain-relevant; T1 = Time 1; T2 = Time 2; HR = Human Relations; IP = Internal
Processes; RG = Rational Goal; CI = Creativity/Innovation. Internal consistency alpha values are listed in parentheses on the diagonal.
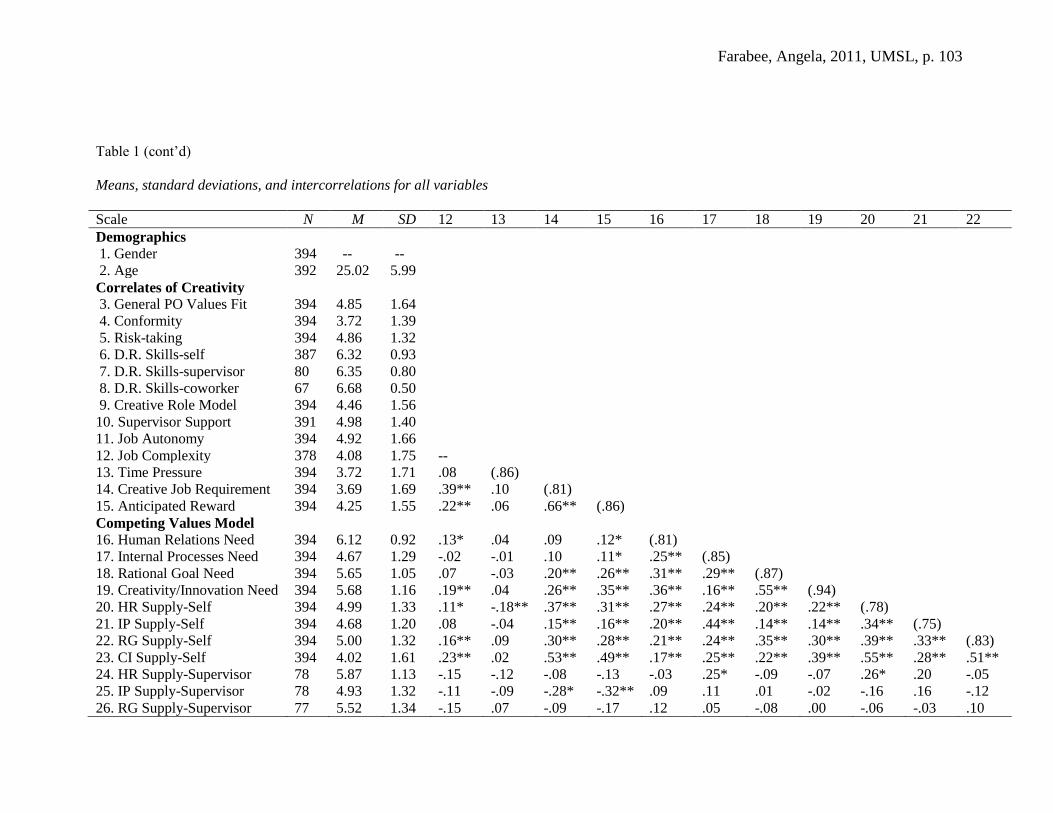
Farabee, Angela, 2011, UMSL, p. 103
Table 1 (cont’d)
Means, standard deviations, and intercorrelations for all variables
Scale N M SD 12 13 14 15 16 17 18 19 20 21 22
Demographics
1. Gender 394 -- --
2. Age 392 25.02 5.99
Correlates of Creativity
3. General PO Values Fit 394 4.85 1.64
4. Conformity 394 3.72 1.39
5. Risk-taking 394 4.86 1.32
6. D.R. Skills-self 387 6.32 0.93
7. D.R. Skills-supervisor 80 6.35 0.80
8. D.R. Skills-coworker 67 6.68 0.50
9. Creative Role Model 394 4.46 1.56
10. Supervisor Support 391 4.98 1.40
11. Job Autonomy 394 4.92 1.66
12. Job Complexity 378 4.08 1.75 --
13. Time Pressure 394 3.72 1.71 .08 (.86)
14. Creative Job Requirement 394 3.69 1.69 .39** .10 (.81)
15. Anticipated Reward 394 4.25 1.55 .22** .06 .66** (.86)
Competing Values Model
16. Human Relations Need 394 6.12 0.92 .13* .04 .09 .12* (.81)
17. Internal Processes Need 394 4.67 1.29 -.02 -.01 .10 .11* .25** (.85)
18. Rational Goal Need 394 5.65 1.05 .07 -.03 .20** .26** .31** .29** (.87)
19. Creativity/Innovation Need 394 5.68 1.16 .19** .04 .26** .35** .36** .16** .55** (.94)
20. HR Supply-Self 394 4.99 1.33 .11* -.18** .37** .31** .27** .24** .20** .22** (.78)
21. IP Supply-Self 394 4.68 1.20 .08 -.04 .15** .16** .20** .44** .14** .14** .34** (.75)
22. RG Supply-Self 394 5.00 1.32 .16** .09 .30** .28** .21** .24** .35** .30** .39** .33** (.83)
23. CI Supply-Self 394 4.02 1.61 .23** .02 .53** .49** .17** .25** .22** .39** .55** .28** .51**
24. HR Supply-Supervisor 78 5.87 1.13 -.15 -.12 -.08 -.13 -.03 .25* -.09 -.07 .26* .20 -.05
25. IP Supply-Supervisor 78 4.93 1.32 -.11 -.09 -.28* -.32** .09 .11 .01 -.02 -.16 .16 -.12
26. RG Supply-Supervisor 77 5.52 1.34 -.15 .07 -.09 -.17 .12 .05 -.08 .00 -.06 -.03 .10
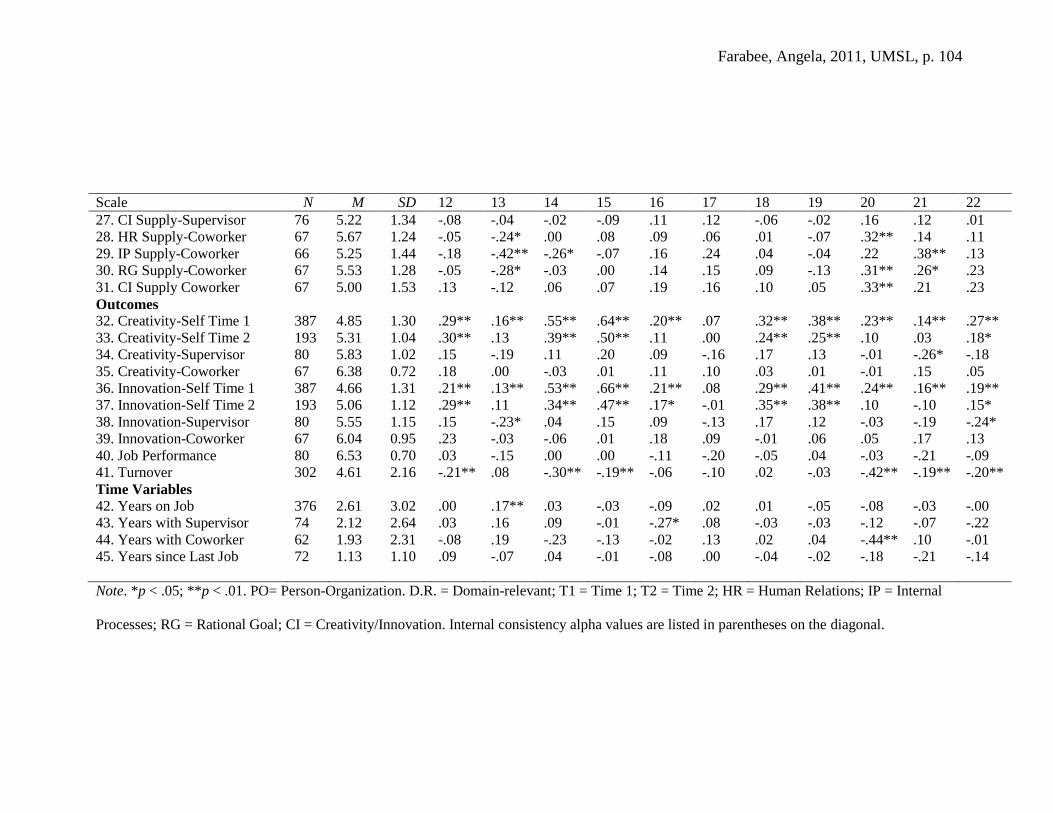
Farabee, Angela, 2011, UMSL, p. 104
Scale N M SD 12 13 14 15 16 17 18 19 20 21 22
27. CI Supply-Supervisor 76 5.22 1.34 -.08 -.04 -.02 -.09 .11 .12 -.06 -.02 .16 .12 .01
28. HR Supply-Coworker 67 5.67 1.24 -.05 -.24* .00 .08 .09 .06 .01 -.07 .32** .14 .11
29. IP Supply-Coworker 66 5.25 1.44 -.18 -.42** -.26* -.07 .16 .24 .04 -.04 .22 .38** .13
30. RG Supply-Coworker 67 5.53 1.28 -.05 -.28* -.03 .00 .14 .15 .09 -.13 .31** .26* .23
31. CI Supply Coworker 67 5.00 1.53 .13 -.12 .06 .07 .19 .16 .10 .05 .33** .21 .23
Outcomes
32. Creativity-Self Time 1 387 4.85 1.30 .29** .16** .55** .64** .20** .07 .32** .38** .23** .14** .27**
33. Creativity-Self Time 2 193 5.31 1.04 .30** .13 .39** .50** .11 .00 .24** .25** .10 .03 .18*
34. Creativity-Supervisor 80 5.83 1.02 .15 -.19 .11 .20 .09 -.16 .17 .13 -.01 -.26* -.18
35. Creativity-Coworker 67 6.38 0.72 .18 .00 -.03 .01 .11 .10 .03 .01 -.01 .15 .05
36. Innovation-Self Time 1 387 4.66 1.31 .21** .13** .53** .66** .21** .08 .29** .41** .24** .16** .19**
37. Innovation-Self Time 2 193 5.06 1.12 .29** .11 .34** .47** .17* -.01 .35** .38** .10 -.10 .15*
38. Innovation-Supervisor 80 5.55 1.15 .15 -.23* .04 .15 .09 -.13 .17 .12 -.03 -.19 -.24*
39. Innovation-Coworker 67 6.04 0.95 .23 -.03 -.06 .01 .18 .09 -.01 .06 .05 .17 .13
40. Job Performance 80 6.53 0.70 .03 -.15 .00 .00 -.11 -.20 -.05 .04 -.03 -.21 -.09
41. Turnover 302 4.61 2.16 -.21** .08 -.30** -.19** -.06 -.10 .02 -.03 -.42** -.19** -.20**
Time Variables
42. Years on Job 376 2.61 3.02 .00 .17** .03 -.03 -.09 .02 .01 -.05 -.08 -.03 -.00
43. Years with Supervisor 74 2.12 2.64 .03 .16 .09 -.01 -.27* .08 -.03 -.03 -.12 -.07 -.22
44. Years with Coworker 62 1.93 2.31 -.08 .19 -.23 -.13 -.02 .13 .02 .04 -.44** .10 -.01
45. Years since Last Job 72 1.13 1.10 .09 -.07 .04 -.01 -.08 .00 -.04 -.02 -.18 -.21 -.14
Note. *p < .05; **p < .01. PO= Person-Organization. D.R. = Domain-relevant; T1 = Time 1; T2 = Time 2; HR = Human Relations; IP = Internal
Processes; RG = Rational Goal; CI = Creativity/Innovation. Internal consistency alpha values are listed in parentheses on the diagonal.
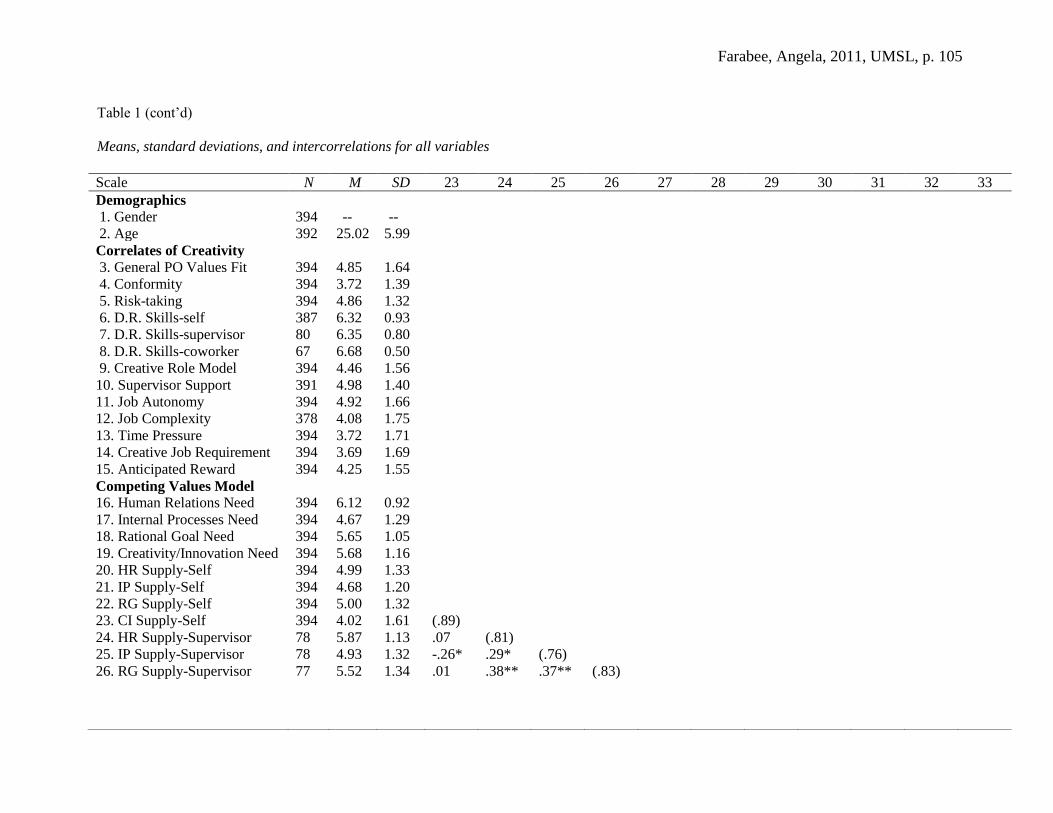
Farabee, Angela, 2011, UMSL, p. 105
Scale N M SD 23 24 25 26 27 28 29 30 31 32 33
Demographics
1. Gender 394 -- --
2. Age 392 25.02 5.99
Correlates of Creativity
3. General PO Values Fit 394 4.85 1.64
4. Conformity 394 3.72 1.39
5. Risk-taking 394 4.86 1.32
6. D.R. Skills-self 387 6.32 0.93
7. D.R. Skills-supervisor 80 6.35 0.80
8. D.R. Skills-coworker 67 6.68 0.50
9. Creative Role Model 394 4.46 1.56
10. Supervisor Support 391 4.98 1.40
11. Job Autonomy 394 4.92 1.66
12. Job Complexity 378 4.08 1.75
13. Time Pressure 394 3.72 1.71
14. Creative Job Requirement 394 3.69 1.69
15. Anticipated Reward 394 4.25 1.55
Competing Values Model
16. Human Relations Need 394 6.12 0.92
17. Internal Processes Need 394 4.67 1.29
18. Rational Goal Need 394 5.65 1.05
19. Creativity/Innovation Need 394 5.68 1.16
20. HR Supply-Self 394 4.99 1.33
21. IP Supply-Self 394 4.68 1.20
22. RG Supply-Self 394 5.00 1.32
23. CI Supply-Self 394 4.02 1.61 (.89)
24. HR Supply-Supervisor 78 5.87 1.13 .07 (.81)
25. IP Supply-Supervisor 78 4.93 1.32 -.26* .29* (.76)
26. RG Supply-Supervisor
77 5.52 1.34 .01 .38** .37** (.83)
Table 1 (cont’d)
Means, standard deviations, and intercorrelations for all variables

Farabee, Angela, 2011, UMSL, p. 106
Note. *p < .05; **p < .01. PO= Person-Organization. D.R. = Domain-relevant; T1 = Time 1; T2 = Time 2; HR = Human Relations; IP = Internal
Processes; RG = Rational Goal; CI = Creativity/Innovation. Internal consistency alpha values are listed in parentheses on the diagonal.
Scale N M SD 23 24 25 26 27 28 29 30 31 32 33
27. CI Supply-Supervisor 76 5.22 1.34 .09 .64** .27* .66** (.88)
28. HR Supply-Coworker 67 5.67 1.24 .14 -.07 .00 .02 -.14 (.78)
29. IP Supply-Coworker 66 5.25 1.44 .09 .10 .01 -.06 -.05 .63** (.82)
30. RG Supply-Coworker 67 5.53 1.28 .11 .11 .07 .22 .00 .67** .56** (.84)
31. CI Supply Coworker 67 5.00 1.53 .28* -.10 -.03 .11 -.05 .71** .43** .62** (.90)
Outcomes
32. Creativity-Self Time 1 387 4.85 1.30 .40** -.13 -.17 -.05 -.13 .02 -.08 -.05 .11 (.92)
33. Creativity-Self Time 2 193 5.31 1.04 .30** -.14 -.12 -.04 -.13 -.02 -.17 -.03 .15 .65** (.91)
34. Creativity-Supervisor 80 5.83 1.02 -.02 .09 -.03 -.01 .05 -.09 -.16 -.08 -.32* .24* .25*
35. Creativity-Coworker 67 6.38 0.72 .03 -.01 -.09 .00 -.07 .23 .09 .17 .41** .08 .14
36. Innovation-Self Time 1 387 4.66 1.31 .38** -.10 -.25* .06 -.01 .15 -.08 .03 .11 .78** .55**
37. Innovation-Self Time 2 193 5.06 1.12 .24** -.15 -.19 .00 -.06 .07 -.14 .02 .21 .59** .72**
38. Innovation-Supervisor 80 5.55 1.15 -.05 .08 .09 -.03 .06 -.06 -.10 -.07 -.32* .20 .29*
39. Innovation-Coworker 67 6.04 0.95 .06 .14 .11 .09 .10 .28* .21 .19 .46** .04 .16
40. Job Performance 80 6.53 0.70 .04 .14 -.02 -.07 .05 .07 -.03 -.04 -.20 .03 -.03
41. Turnover 302 4.61 2.16 -.28** -.01 .19 .09 -.06 -.33* -.06 -.22 -.23 -.15** .02
Time Variables
42. Years on Job 376 2.61 3.02 -.05 .10 -.05 .05 .04 -.04 .05 -.07 -.13 .10 -.05
43. Years with Supervisor 74 2.12 2.64 -.03 .16 -.03 .10 .16 -.21 -.07 -.38* -.36* .14 .06
44. Years with Coworker 62 1.93 2.31 -.09 -.05 -.04 .08 .05 -.20 .07 -.27* -.16 -.16 -.20
45. Years since Last Job 72 1.13 1.10 .05 -- -- -- -- -- -- -- -- -.11 -.42*
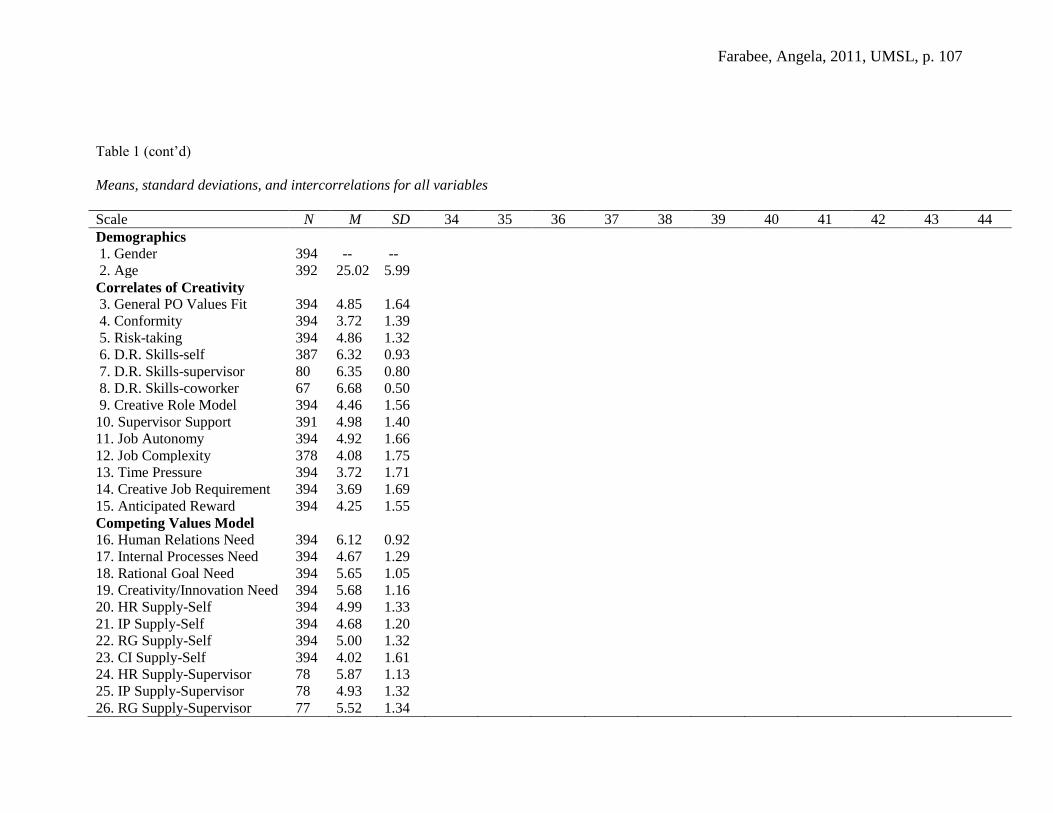
Farabee, Angela, 2011, UMSL, p. 107
Table 1 (cont’d)
Means, standard deviations, and intercorrelations for all variables
Scale N M SD 34 35 36 37 38 39 40 41 42 43 44
Demographics
1. Gender 394 -- --
2. Age 392 25.02 5.99
Correlates of Creativity
3. General PO Values Fit 394 4.85 1.64
4. Conformity 394 3.72 1.39
5. Risk-taking 394 4.86 1.32
6. D.R. Skills-self 387 6.32 0.93
7. D.R. Skills-supervisor 80 6.35 0.80
8. D.R. Skills-coworker 67 6.68 0.50
9. Creative Role Model 394 4.46 1.56
10. Supervisor Support 391 4.98 1.40
11. Job Autonomy 394 4.92 1.66
12. Job Complexity 378 4.08 1.75
13. Time Pressure 394 3.72 1.71
14. Creative Job Requirement 394 3.69 1.69
15. Anticipated Reward 394 4.25 1.55
Competing Values Model
16. Human Relations Need 394 6.12 0.92
17. Internal Processes Need 394 4.67 1.29
18. Rational Goal Need 394 5.65 1.05
19. Creativity/Innovation Need 394 5.68 1.16
20. HR Supply-Self 394 4.99 1.33
21. IP Supply-Self 394 4.68 1.20
22. RG Supply-Self 394 5.00 1.32
23. CI Supply-Self 394 4.02 1.61
24. HR Supply-Supervisor 78 5.87 1.13
25. IP Supply-Supervisor 78 4.93 1.32
26. RG Supply-Supervisor 77 5.52 1.34
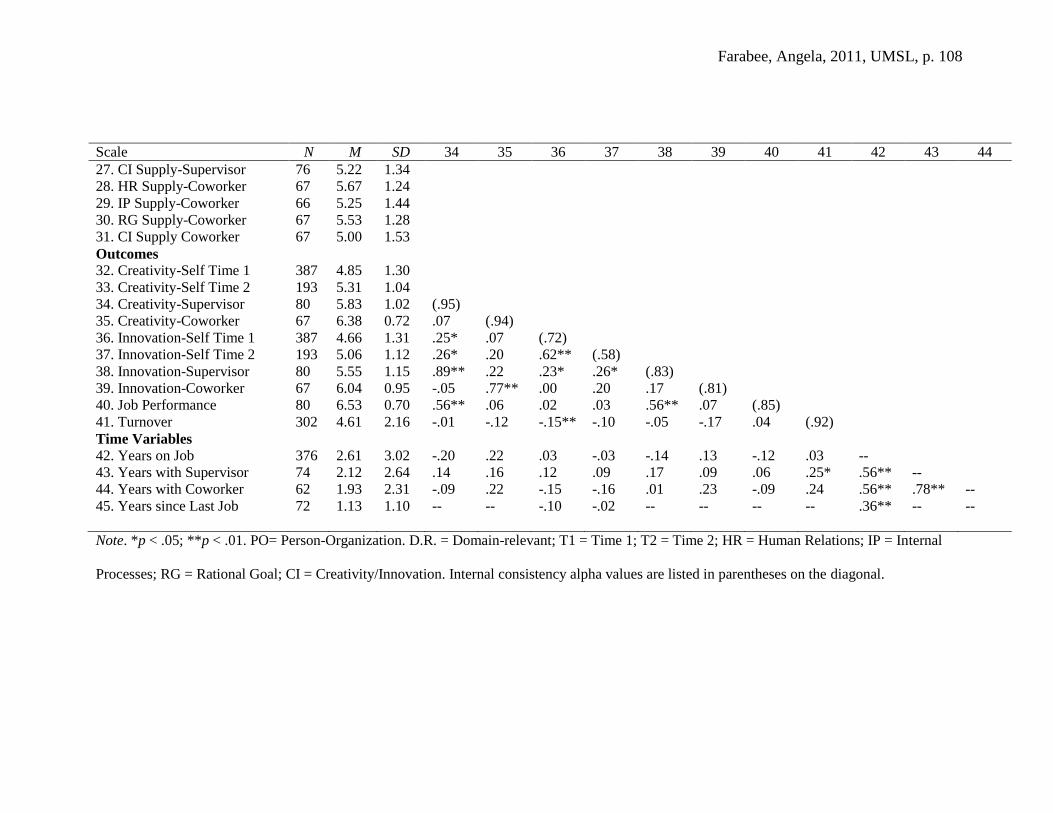
Farabee, Angela, 2011, UMSL, p. 108
Scale N M SD 34 35 36 37 38 39 40 41 42 43 44
27. CI Supply-Supervisor 76 5.22 1.34
28. HR Supply-Coworker 67 5.67 1.24
29. IP Supply-Coworker 66 5.25 1.44
30. RG Supply-Coworker 67 5.53 1.28
31. CI Supply Coworker 67 5.00 1.53
Outcomes
32. Creativity-Self Time 1 387 4.85 1.30
33. Creativity-Self Time 2 193 5.31 1.04
34. Creativity-Supervisor 80 5.83 1.02 (.95)
35. Creativity-Coworker 67 6.38 0.72 .07 (.94)
36. Innovation-Self Time 1 387 4.66 1.31 .25* .07 (.72)
37. Innovation-Self Time 2 193 5.06 1.12 .26* .20 .62** (.58)
38. Innovation-Supervisor 80 5.55 1.15 .89** .22 .23* .26* (.83)
39. Innovation-Coworker 67 6.04 0.95 -.05 .77** .00 .20 .17 (.81)
40. Job Performance 80 6.53 0.70 .56** .06 .02 .03 .56** .07 (.85)
41. Turnover 302 4.61 2.16 -.01 -.12 -.15** -.10 -.05 -.17 .04 (.92)
Time Variables
42. Years on Job 376 2.61 3.02 -.20 .22 .03 -.03 -.14 .13 -.12 .03 --
43. Years with Supervisor 74 2.12 2.64 .14 .16 .12 .09 .17 .09 .06 .25* .56** --
44. Years with Coworker 62 1.93 2.31 -.09 .22 -.15 -.16 .01 .23 -.09 .24 .56** .78** --
45. Years since Last Job 72 1.13 1.10 -- -- -.10 -.02 -- -- -- -- .36** -- --
Note. *p < .05; **p < .01. PO= Person-Organization. D.R. = Domain-relevant; T1 = Time 1; T2 = Time 2; HR = Human Relations; IP = Internal
Processes; RG = Rational Goal; CI = Creativity/Innovation. Internal consistency alpha values are listed in parentheses on the diagonal.
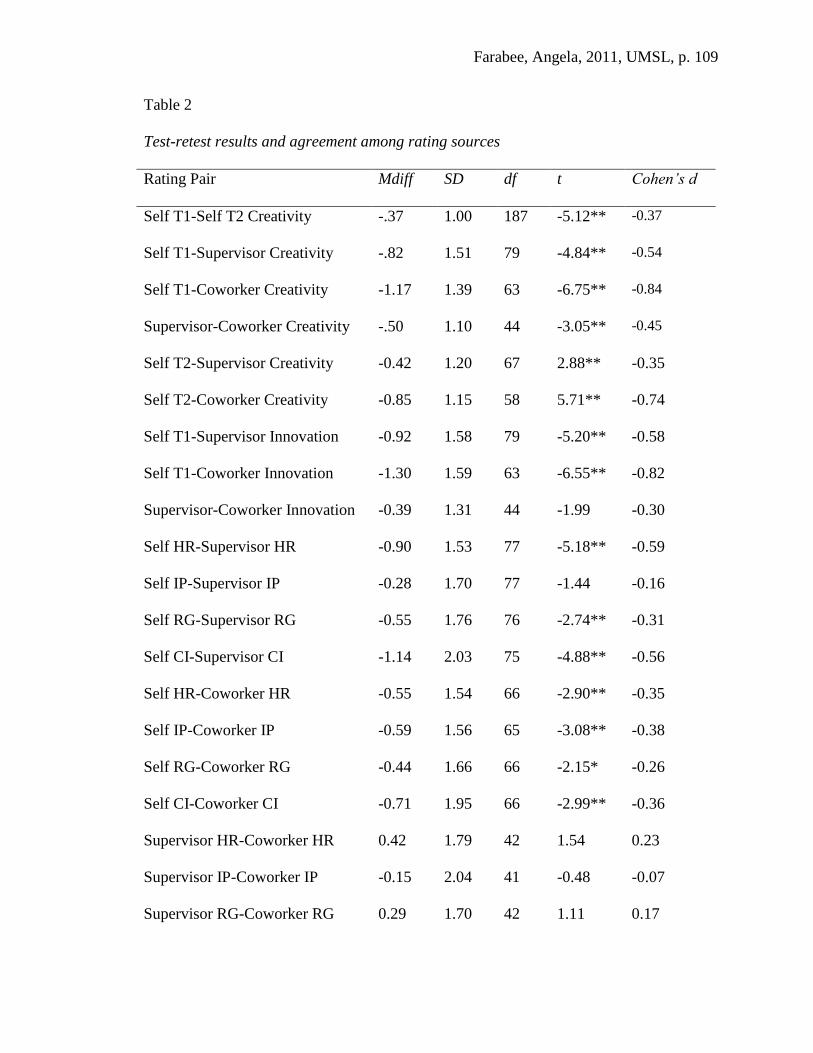
Farabee, Angela, 2011, UMSL, p. 109
Table 2
Test-retest results and agreement among rating sources
Rating Pair Mdiff SD df t Cohen’s d
Self T1-Self T2 Creativity -.37 1.00 187 -5.12** -0.37
Self T1-Supervisor Creativity -.82 1.51 79 -4.84** -0.54
Self T1-Coworker Creativity -1.17 1.39 63 -6.75** -0.84
Supervisor-Coworker Creativity -.50 1.10 44 -3.05** -0.45
Self T2-Supervisor Creativity -0.42 1.20 67 2.88** -0.35
Self T2-Coworker Creativity -0.85 1.15 58 5.71** -0.74
Self T1-Supervisor Innovation -0.92 1.58 79 -5.20** -0.58
Self T1-Coworker Innovation -1.30 1.59 63 -6.55** -0.82
Supervisor-Coworker Innovation -0.39 1.31 44 -1.99 -0.30
Self HR-Supervisor HR -0.90 1.53 77 -5.18** -0.59
Self IP-Supervisor IP -0.28 1.70 77 -1.44 -0.16
Self RG-Supervisor RG -0.55 1.76 76 -2.74** -0.31
Self CI-Supervisor CI -1.14 2.03 75 -4.88** -0.56
Self HR-Coworker HR -0.55 1.54 66 -2.90** -0.35
Self IP-Coworker IP -0.59 1.56 65 -3.08** -0.38
Self RG-Coworker RG -0.44 1.66 66 -2.15* -0.26
Self CI-Coworker CI -0.71 1.95 66 -2.99** -0.36
Supervisor HR-Coworker HR 0.42 1.79 42 1.54 0.23
Supervisor IP-Coworker IP -0.15 2.04 41 -0.48 -0.07
Supervisor RG-Coworker RG 0.29 1.70 42 1.11 0.17

Farabee, Angela, 2011, UMSL, p. 110
Supervisor CI-Coworker CI 0.56 2.08 41 1.73 0.27
Self-Supervisor D.R. Skills -0.05 1.04 79 -0.47 -0.05
Self-Coworker D.R. Skills -0.39 1.04 63 -3.00** -0.38
Supervisor-Coworker D.R. Skills -0.13 0.69 44 -1.22 -0.18
Note. * p <.05; ** p <.01. Mdiff = Mean difference, D.R. = Domain-relevant; T1= Time
1; T2 = Time 2; HR = Human Relations; IP = Internal Processes; RG = Rational Goal; CI
= Creativity/Innovation.
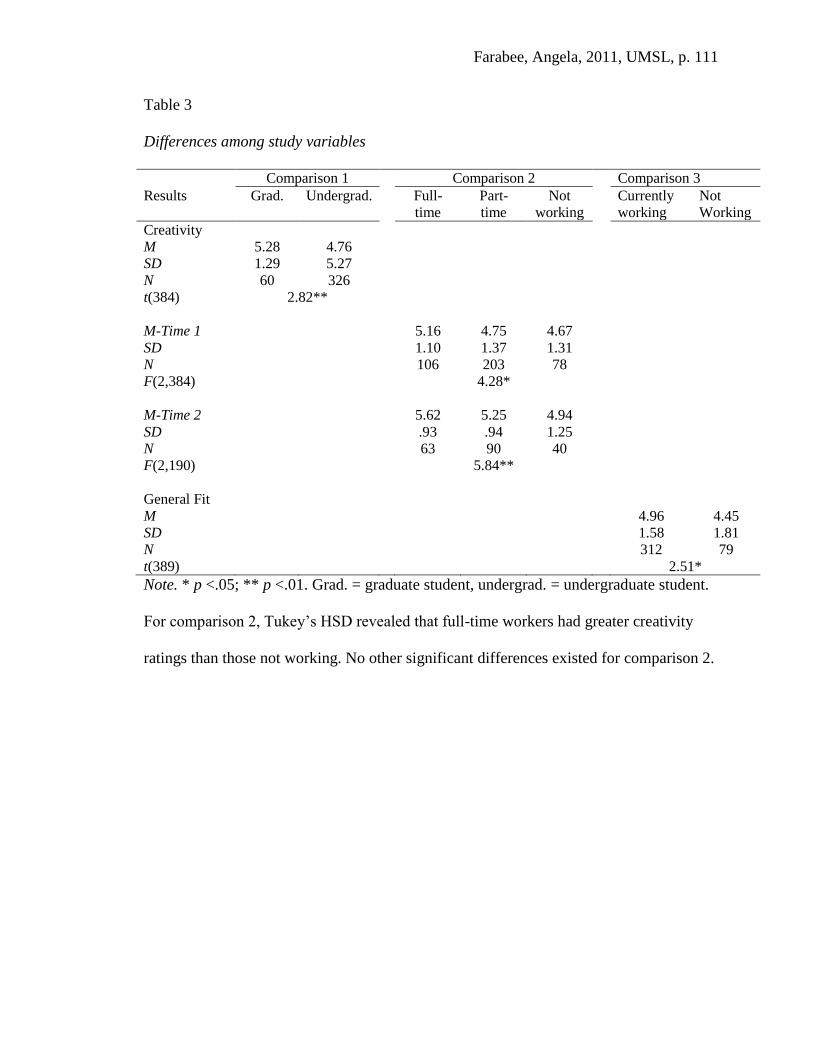
Farabee, Angela, 2011, UMSL, p. 111
Table 3
Differences among study variables
Comparison 1 Comparison 2 Comparison 3
Results Grad. Undergrad. Full-
time
Part-
time
Not
working
Currently
working
Not
Working
Creativity
M 5.28 4.76
SD 1.29 5.27
N 60 326
t(384) 2.82**
M-Time 1 5.16 4.75 4.67
SD 1.10 1.37 1.31
N 106 203 78
F(2,384) 4.28*
M-Time 2 5.62 5.25 4.94
SD .93 .94 1.25
N 63 90 40
F(2,190) 5.84**
General Fit
M 4.96 4.45
SD 1.58 1.81
N 312 79
t(389) 2.51*
Note. * p <.05; ** p <.01. Grad. = graduate student, undergrad. = undergraduate student.
For comparison 2, Tukey’s HSD revealed that full-time workers had greater creativity
ratings than those not working. No other significant differences existed for comparison 2.
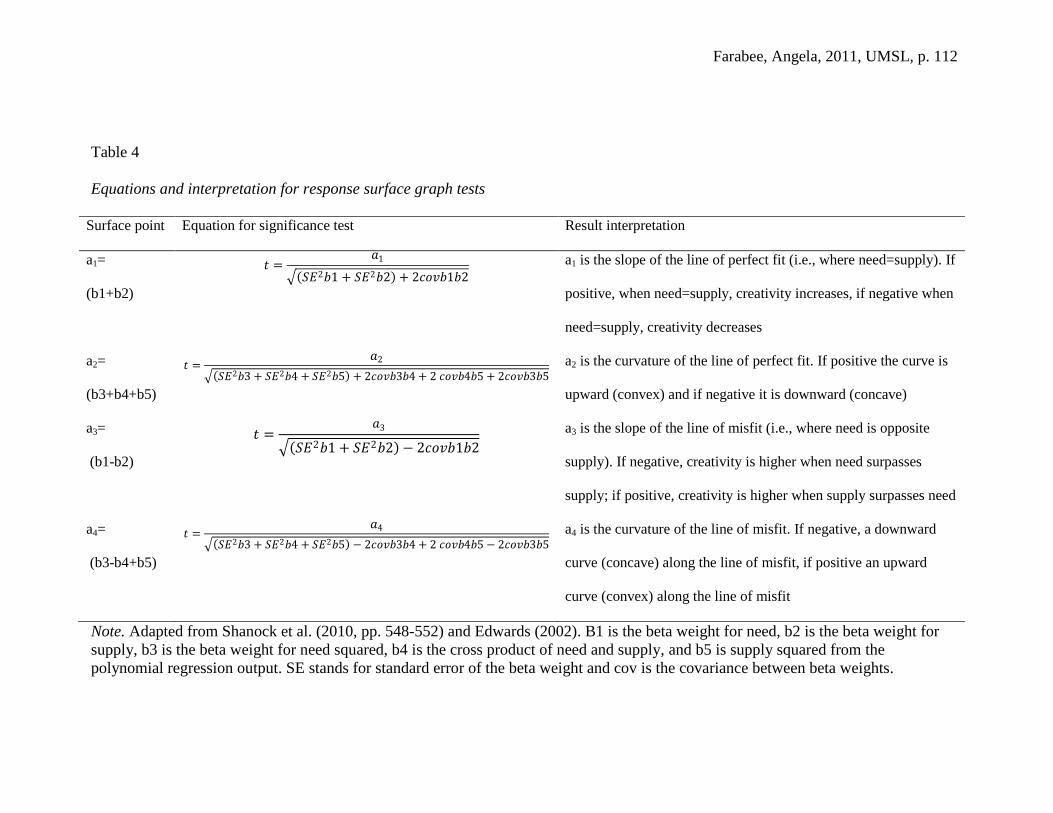
Farabee, Angela, 2011, UMSL, p. 112
Table 4
Equations and interpretation for response surface graph tests
Surface point Equation for significance test Result interpretation
a1=
(b1+b2)
𝑡 =𝑎1
𝑆𝐸2𝑏1 + 𝑆𝐸2𝑏2 + 2𝑐𝑜𝑣𝑏1𝑏2
a1 is the slope of the line of perfect fit (i.e., where need=supply). If
positive, when need=supply, creativity increases, if negative when
need=supply, creativity decreases
a2=
(b3+b4+b5)
𝑡 =𝑎2
𝑆𝐸2𝑏3 + 𝑆𝐸2𝑏4 + 𝑆𝐸2𝑏5 + 2𝑐𝑜𝑣𝑏3𝑏4 + 2 𝑐𝑜𝑣𝑏4𝑏5 + 2𝑐𝑜𝑣𝑏3𝑏5 a2 is the curvature of the line of perfect fit. If positive the curve is
upward (convex) and if negative it is downward (concave)
a3=
(b1-b2)
𝑡 =𝑎3
𝑆𝐸2𝑏1 + 𝑆𝐸2𝑏2 − 2𝑐𝑜𝑣𝑏1𝑏2
a3 is the slope of the line of misfit (i.e., where need is opposite
supply). If negative, creativity is higher when need surpasses
supply; if positive, creativity is higher when supply surpasses need
a4=
(b3-b4+b5)
𝑡 =𝑎4
𝑆𝐸2𝑏3 + 𝑆𝐸2𝑏4 + 𝑆𝐸2𝑏5 − 2𝑐𝑜𝑣𝑏3𝑏4 + 2 𝑐𝑜𝑣𝑏4𝑏5 − 2𝑐𝑜𝑣𝑏3𝑏5 a4 is the curvature of the line of misfit. If negative, a downward
curve (concave) along the line of misfit, if positive an upward
curve (convex) along the line of misfit
Note. Adapted from Shanock et al. (2010, pp. 548-552) and Edwards (2002). B1 is the beta weight for need, b2 is the beta weight for
supply, b3 is the beta weight for need squared, b4 is the cross product of need and supply, and b5 is supply squared from the
polynomial regression output. SE stands for standard error of the beta weight and cov is the covariance between beta weights.
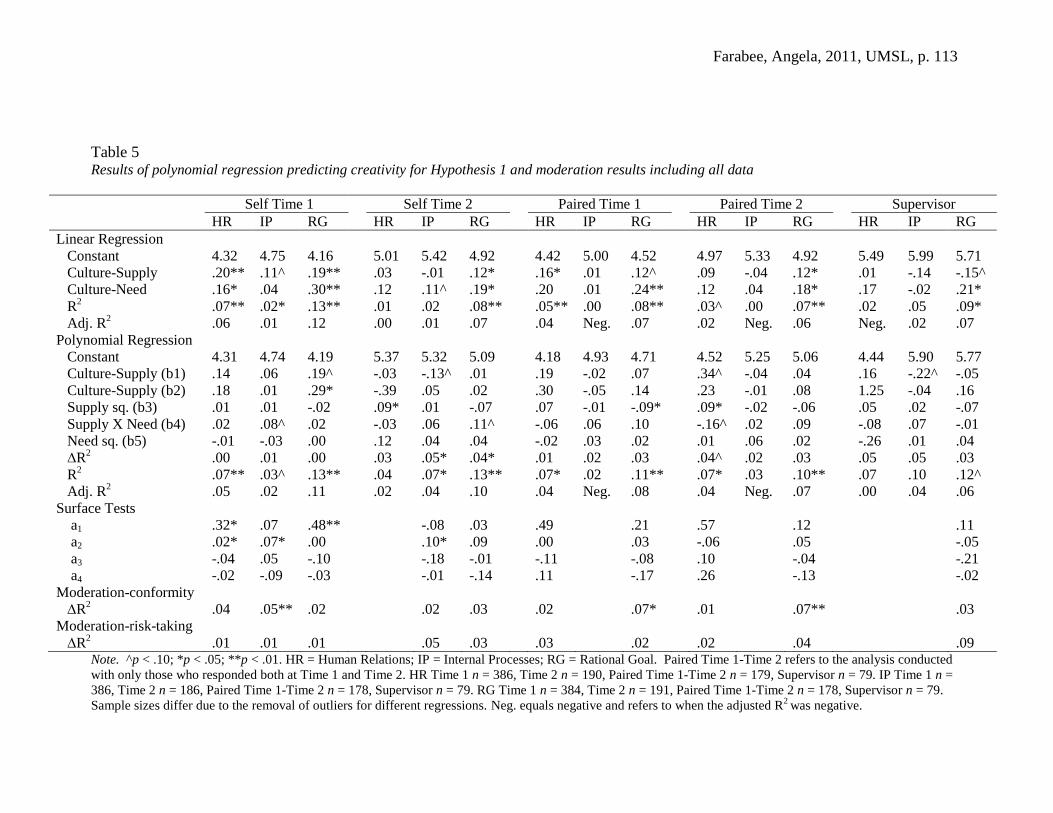
Farabee, Angela, 2011, UMSL, p. 113
Table 5 Results of polynomial regression predicting creativity for Hypothesis 1 and moderation results including all data
Self Time 1 Self Time 2 Paired Time 1 Paired Time 2 Supervisor
HR IP RG HR IP RG HR IP RG HR IP RG HR IP RG
Linear Regression
Constant 4.32 4.75 4.16 5.01 5.42 4.92 4.42 5.00 4.52 4.97 5.33 4.92 5.49 5.99 5.71
Culture-Supply .20** .11^ .19** .03 -.01 .12* .16* .01 .12^ .09 -.04 .12* .01 -.14 -.15^
Culture-Need .16* .04 .30** .12 .11^ .19* .20 .01 .24** .12 .04 .18* .17 -.02 .21*
R2 .07** .02* .13** .01 .02 .08** .05** .00 .08** .03^ .00 .07** .02 .05 .09*
Adj. R2 .06 .01 .12 .00 .01 .07 .04 Neg. .07 .02 Neg. .06 Neg. .02 .07
Polynomial Regression
Constant 4.31 4.74 4.19 5.37 5.32 5.09 4.18 4.93 4.71 4.52 5.25 5.06 4.44 5.90 5.77
Culture-Supply (b1) .14 .06 .19^ -.03 -.13^ .01 .19 -.02 .07 .34^ -.04 .04 .16 -.22^ -.05
Culture-Supply (b2) .18 .01 .29* -.39 .05 .02 .30 -.05 .14 .23 -.01 .08 1.25 -.04 .16
Supply sq. (b3) .01 .01 -.02 .09* .01 -.07 .07 -.01 -.09* .09* -.02 -.06 .05 .02 -.07
Supply X Need (b4) .02 .08^ .02 -.03 .06 .11^ -.06 .06 .10 -.16^ .02 .09 -.08 .07 -.01
Need sq. (b5) -.01 -.03 .00 .12 .04 .04 -.02 .03 .02 .01 .06 .02 -.26 .01 .04
∆R2 .00 .01 .00 .03 .05* .04* .01 .02 .03 .04^ .02 .03 .05 .05 .03
R2 .07** .03^ .13** .04 .07* .13** .07* .02 .11** .07* .03 .10** .07 .10 .12^
Adj. R2 .05 .02 .11 .02 .04 .10 .04 Neg. .08 .04 Neg. .07 .00 .04 .06
Surface Tests
a1 .32* .07 .48** -.08 .03 .49 .21 .57 .12 .11
a2 .02* .07* .00 .10* .09 .00 .03 -.06 .05 -.05
a3 -.04 .05 -.10 -.18 -.01 -.11 -.08 .10 -.04 -.21
a4 -.02 -.09 -.03 -.01 -.14 .11 -.17 .26 -.13 -.02
Moderation-conformity
∆R2 .04 .05** .02 .02 .03 .02 .07* .01 .07** .03
Moderation-risk-taking
∆R2 .01 .01 .01 .05 .03 .03 .02 .02 .04 .09 Note. ^p < .10; *p < .05; **p < .01. HR = Human Relations; IP = Internal Processes; RG = Rational Goal. Paired Time 1-Time 2 refers to the analysis conducted
with only those who responded both at Time 1 and Time 2. HR Time 1 n = 386, Time 2 n = 190, Paired Time 1-Time 2 n = 179, Supervisor n = 79. IP Time 1 n =
386, Time 2 n = 186, Paired Time 1-Time 2 n = 178, Supervisor n = 79. RG Time 1 n = 384, Time 2 n = 191, Paired Time 1-Time 2 n = 178, Supervisor n = 79.
Sample sizes differ due to the removal of outliers for different regressions. Neg. equals negative and refers to when the adjusted R2
was negative.
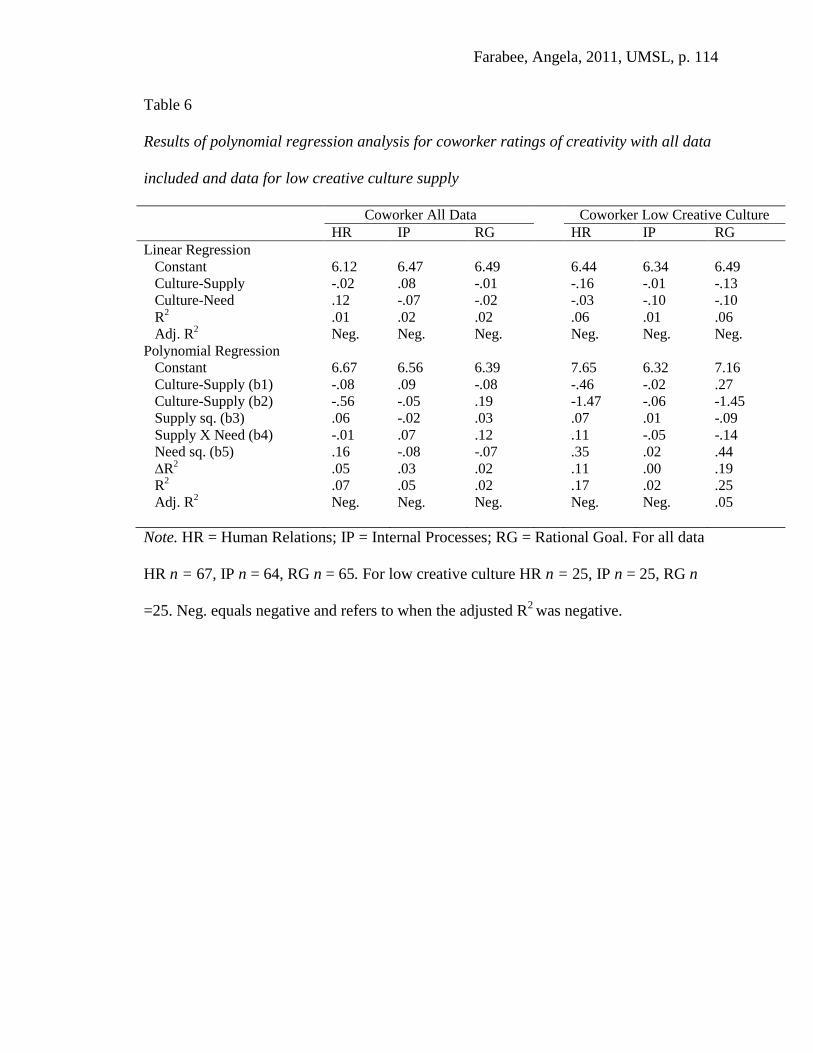
Farabee, Angela, 2011, UMSL, p. 114
Table 6
Results of polynomial regression analysis for coworker ratings of creativity with all data
included and data for low creative culture supply
Coworker All Data Coworker Low Creative Culture
HR IP RG HR IP RG
Linear Regression
Constant 6.12 6.47 6.49 6.44 6.34 6.49
Culture-Supply -.02 .08 -.01 -.16 -.01 -.13
Culture-Need .12 -.07 -.02 -.03 -.10 -.10
R2 .01 .02 .02 .06 .01 .06
Adj. R2 Neg. Neg. Neg. Neg. Neg. Neg.
Polynomial Regression
Constant 6.67 6.56 6.39 7.65 6.32 7.16
Culture-Supply (b1) -.08 .09 -.08 -.46 -.02 .27
Culture-Supply (b2) -.56 -.05 .19 -1.47 -.06 -1.45
Supply sq. (b3) .06 -.02 .03 .07 .01 -.09
Supply X Need (b4) -.01 .07 .12 .11 -.05 -.14
Need sq. (b5) .16 -.08 -.07 .35 .02 .44
∆R2 .05 .03 .02 .11 .00 .19
R2 .07 .05 .02 .17 .02 .25
Adj. R2 Neg. Neg. Neg. Neg. Neg. .05
Note. HR = Human Relations; IP = Internal Processes; RG = Rational Goal. For all data
HR n = 67, IP n = 64, RG n = 65. For low creative culture HR n = 25, IP n = 25, RG n
=25. Neg. equals negative and refers to when the adjusted R2
was negative.
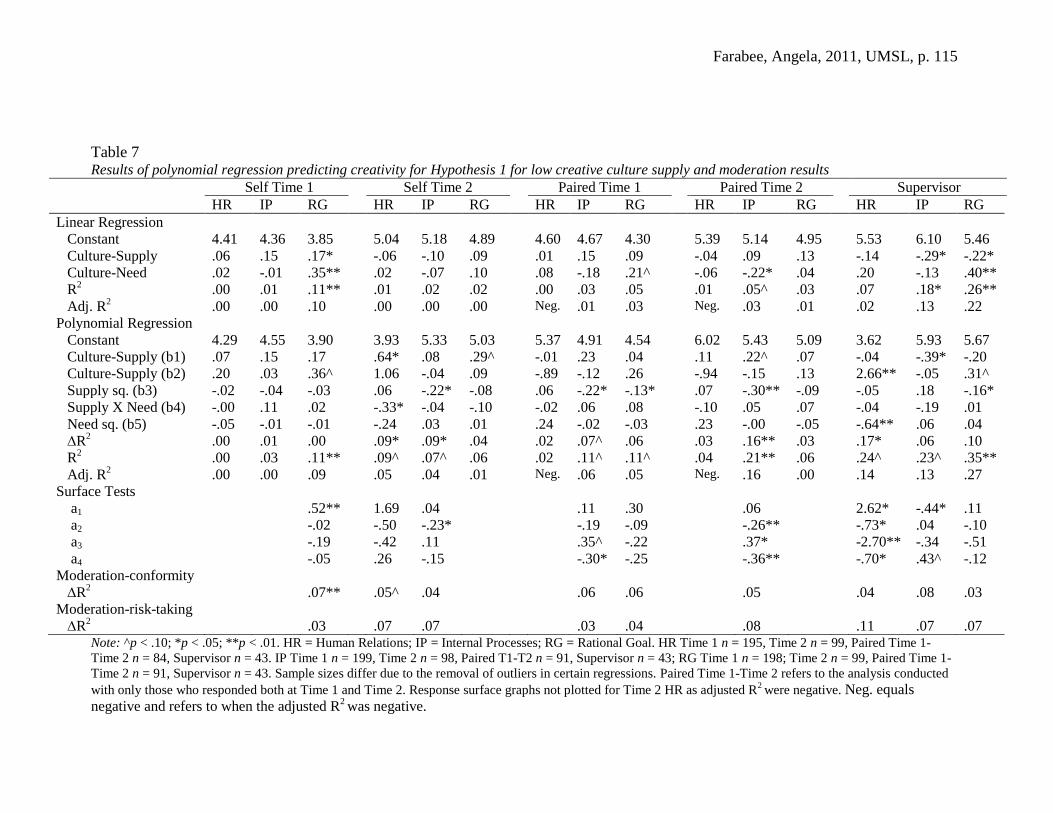
Farabee, Angela, 2011, UMSL, p. 115
Table 7 Results of polynomial regression predicting creativity for Hypothesis 1 for low creative culture supply and moderation results
Self Time 1 Self Time 2 Paired Time 1 Paired Time 2 Supervisor
HR IP RG HR IP RG HR IP RG HR IP RG HR IP RG
Linear Regression
Constant 4.41 4.36 3.85 5.04 5.18 4.89 4.60 4.67 4.30 5.39 5.14 4.95 5.53 6.10 5.46
Culture-Supply .06 .15 .17* -.06 -.10 .09 .01 .15 .09 -.04 .09 .13 -.14 -.29* -.22*
Culture-Need .02 -.01 .35** .02 -.07 .10 .08 -.18 .21^ -.06 -.22* .04 .20 -.13 .40**
R2 .00 .01 .11** .01 .02 .02 .00 .03 .05 .01 .05^ .03 .07 .18* .26**
Adj. R2 .00 .00 .10 .00 .00 .00 Neg. .01 .03 Neg. .03 .01 .02 .13 .22
Polynomial Regression
Constant 4.29 4.55 3.90 3.93 5.33 5.03 5.37 4.91 4.54 6.02 5.43 5.09 3.62 5.93 5.67
Culture-Supply (b1) .07 .15 .17 .64* .08 .29^ -.01 .23 .04 .11 .22^ .07 -.04 -.39* -.20
Culture-Supply (b2) .20 .03 .36^ 1.06 -.04 .09 -.89 -.12 .26 -.94 -.15 .13 2.66** -.05 .31^
Supply sq. (b3) -.02 -.04 -.03 .06 -.22* -.08 .06 -.22* -.13* .07 -.30** -.09 -.05 .18 -.16*
Supply X Need (b4) -.00 .11 .02 -.33* -.04 -.10 -.02 .06 .08 -.10 .05 .07 -.04 -.19 .01
Need sq. (b5) -.05 -.01 -.01 -.24 .03 .01 .24 -.02 -.03 .23 -.00 -.05 -.64** .06 .04
∆R2 .00 .01 .00 .09* .09* .04 .02 .07^ .06 .03 .16** .03 .17* .06 .10
R2 .00 .03 .11** .09^ .07^ .06 .02 .11^ .11^ .04 .21** .06 .24^ .23^ .35**
Adj. R2 .00 .00 .09 .05 .04 .01 Neg. .06 .05 Neg. .16 .00 .14 .13 .27
Surface Tests
a1 .52** 1.69 .04 .11 .30 .06 2.62* -.44* .11
a2 -.02 -.50 -.23* -.19 -.09 -.26** -.73* .04 -.10
a3 -.19 -.42 .11 .35^ -.22 .37* -2.70** -.34 -.51
a4 -.05 .26 -.15 -.30* -.25 -.36** -.70* .43^ -.12
Moderation-conformity
∆R2 .07** .05^ .04 .06 .06 .05 .04 .08 .03
Moderation-risk-taking
∆R2 .03 .07 .07 .03 .04 .08 .11 .07 .07 Note: ^p < .10; *p < .05; **p < .01. HR = Human Relations; IP = Internal Processes; RG = Rational Goal. HR Time 1 n = 195, Time 2 n = 99, Paired Time 1-
Time 2 n = 84, Supervisor n = 43. IP Time 1 n = 199, Time 2 n = 98, Paired T1-T2 n = 91, Supervisor n = 43; RG Time 1 n = 198; Time 2 n = 99, Paired Time 1-
Time 2 n = 91, Supervisor n = 43. Sample sizes differ due to the removal of outliers in certain regressions. Paired Time 1-Time 2 refers to the analysis conducted
with only those who responded both at Time 1 and Time 2. Response surface graphs not plotted for Time 2 HR as adjusted R2
were negative. Neg. equals
negative and refers to when the adjusted R2 was negative.
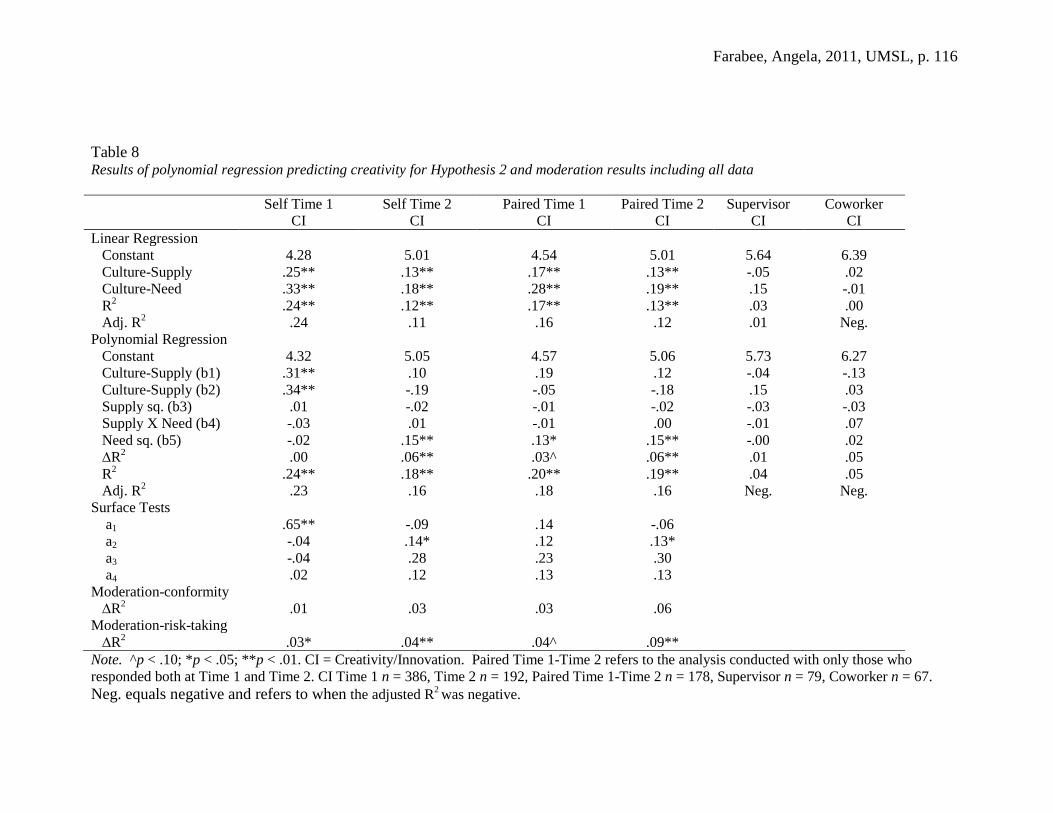
Farabee, Angela, 2011, UMSL, p. 116
Table 8 Results of polynomial regression predicting creativity for Hypothesis 2 and moderation results including all data
Self Time 1 Self Time 2 Paired Time 1 Paired Time 2 Supervisor Coworker
CI CI CI CI CI CI
Linear Regression
Constant 4.28 5.01 4.54 5.01 5.64 6.39
Culture-Supply .25** .13** .17** .13** -.05 .02
Culture-Need .33** .18** .28** .19** .15 -.01
R2 .24** .12** .17** .13** .03 .00
Adj. R2 .24 .11 .16 .12 .01 Neg.
Polynomial Regression
Constant 4.32 5.05 4.57 5.06 5.73 6.27
Culture-Supply (b1) .31** .10 .19 .12 -.04 -.13
Culture-Supply (b2) .34** -.19 -.05 -.18 .15 .03
Supply sq. (b3) .01 -.02 -.01 -.02 -.03 -.03
Supply X Need (b4) -.03 .01 -.01 .00 -.01 .07
Need sq. (b5) -.02 .15** .13* .15** -.00 .02
∆R2 .00 .06** .03^ .06** .01 .05
R2 .24** .18** .20** .19** .04 .05
Adj. R2 .23 .16 .18 .16 Neg. Neg.
Surface Tests
a1 .65** -.09 .14 -.06
a2 -.04 .14* .12 .13*
a3 -.04 .28 .23 .30
a4 .02 .12 .13 .13
Moderation-conformity
∆R2 .01 .03 .03 .06
Moderation-risk-taking
∆R2 .03* .04** .04^ .09**
Note. ^p < .10; *p < .05; **p < .01. CI = Creativity/Innovation. Paired Time 1-Time 2 refers to the analysis conducted with only those who
responded both at Time 1 and Time 2. CI Time 1 n = 386, Time 2 n = 192, Paired Time 1-Time 2 n = 178, Supervisor n = 79, Coworker n = 67.
Neg. equals negative and refers to when the adjusted R2 was negative.

Farabee, Angela, 2011, UMSL, p. 117
Table 9
Results of polynomial regression predicting creativity for Hypothesis 2 for low creative culture supply
Self Time 1 Self Time 2 Paired Time 1 Paired Time 2 Supervisor Coworker
CI CI CI CI CI CI
Linear Regression
Constant 4.30 5.08 4.46 5.06 5.68 6.25
Culture-Supply .26** .08 .01 .05 .01 -.09
Culture-Need .32** .08 .20* .11 .19^ -.08
R2 .12** .02 .06^ .02 .09 .05
Adj. R2 .11 Neg. .03 .00 .04 Neg.
Polynomial Regression Constant 4.52 5.04 4.60 5.17 5.34 5.66 Culture-Supply (b1) .34 .13 .19 .38 -.77 -.92 Culture-Supply (b2) .21 -.20 -.14 -.19 .23 -.07 Supply sq. (b3) -.02 -.00 .01 .08 -.25 -.26 Supply X Need (b4) -.10 .02 -.06 -.02 .05 .06 Need sq. (b5) -.03 .16 .13^ .14* .02 .06 ∆R
2 .01 .07 .04 .08 .06 .09
R2 .13** .09 .10 .10 .14 .14
Adj. R2 .11 .04 .04 .04 .03 Neg.
Note: ^p < .10; *p < .05; **p < .01. CI = Creativity/Innovation. CI Time 1 n = 198, Time 2 n = 98, Time 1-2 n = 89, Supervisor n = 43,
Coworker n = 25. Sample sizes differ due to the removal of outliers in certain regressions. Paired Time 1-Time 2 refers to the analysis
conducted with only those who responded both at Time 1 and Time 2. Neg. equals negative and refers to when the adjusted R2
was
negative.

Farabee, Angela, 2011, UMSL, p. 118
Table 10
The relationship between general PO values fit and creativity moderated by conformity
preference with all data included
Self T1 Self T2 P. T1 P. T2 Supervisor Coworker
Constant 4.85 5.34 5.03 5.33 5.84 6.40
General PO Fit .27** .12** .25** .13** -.03 -.01
Conformity Preference -.17** -.12* -.22** -.12* -.18* .11
R2 .14** .06** .18** .06** .06^ .05
Adj. R2 .14 .05 .17 .05 .04 .01
Constant 4.85 5.35 5.03 5.33 5.84 6.40
General PO Fit .27** .12* .25** .13** -.03 -.01
Conformity Preference -.17 ** -.12* -.22** -.12* -.18* .11
Fit X Conformity .02 -.02 .00 -.01 .001 .01
∆R2 .00 .00 .00 .00 .00 .00
R2 .14** .07** .16** .06* .06 .05
Adj. R2 .13 .05 .14 .05 .03 Neg.
Note. ^p < .10; *p < .05; **p < .01. PO = Person Organization, P. T1 = Paired Time 1, P. T2 =
Paired Time 2. Time 1 n = 387, Time 2 n = 192, Paired Time 1-Time 2 n = 179, Supervisor n =
43. Paired Time 1-Time 2 refers to the analysis conducted with only those who responded both at
Time 1 and Time 2. Neg. equals negative and refers to when the adjusted R2 was negative.
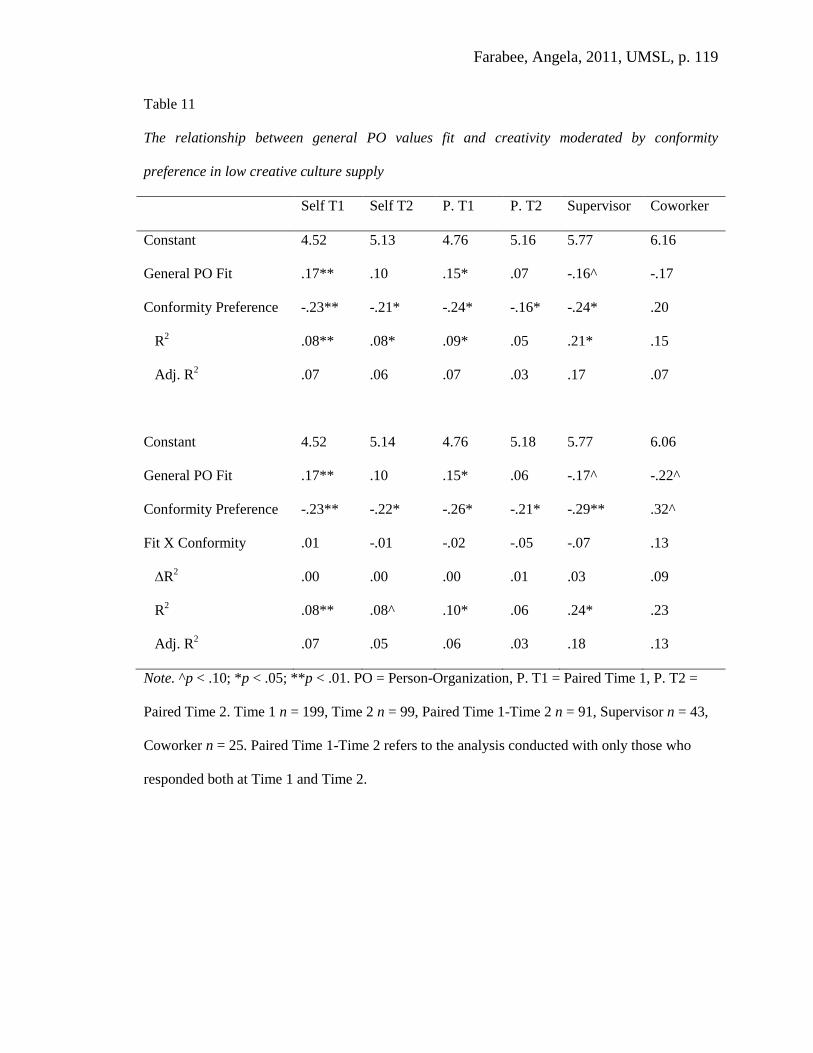
Farabee, Angela, 2011, UMSL, p. 119
Table 11
The relationship between general PO values fit and creativity moderated by conformity
preference in low creative culture supply
Self T1 Self T2 P. T1 P. T2 Supervisor Coworker
Constant 4.52 5.13 4.76 5.16 5.77 6.16
General PO Fit .17** .10 .15* .07 -.16^ -.17
Conformity Preference -.23** -.21* -.24* -.16* -.24* .20
R2 .08** .08* .09* .05 .21* .15
Adj. R2 .07 .06 .07 .03 .17 .07
Constant 4.52 5.14 4.76 5.18 5.77 6.06
General PO Fit .17** .10 .15* .06 -.17^ -.22^
Conformity Preference -.23** -.22* -.26* -.21* -.29** .32^
Fit X Conformity .01 -.01 -.02 -.05 -.07 .13
∆R2 .00 .00 .00 .01 .03 .09
R2 .08** .08^ .10* .06 .24* .23
Adj. R2 .07 .05 .06 .03 .18 .13
Note. ^p < .10; *p < .05; **p < .01. PO = Person-Organization, P. T1 = Paired Time 1, P. T2 =
Paired Time 2. Time 1 n = 199, Time 2 n = 99, Paired Time 1-Time 2 n = 91, Supervisor n = 43,
Coworker n = 25. Paired Time 1-Time 2 refers to the analysis conducted with only those who
responded both at Time 1 and Time 2.
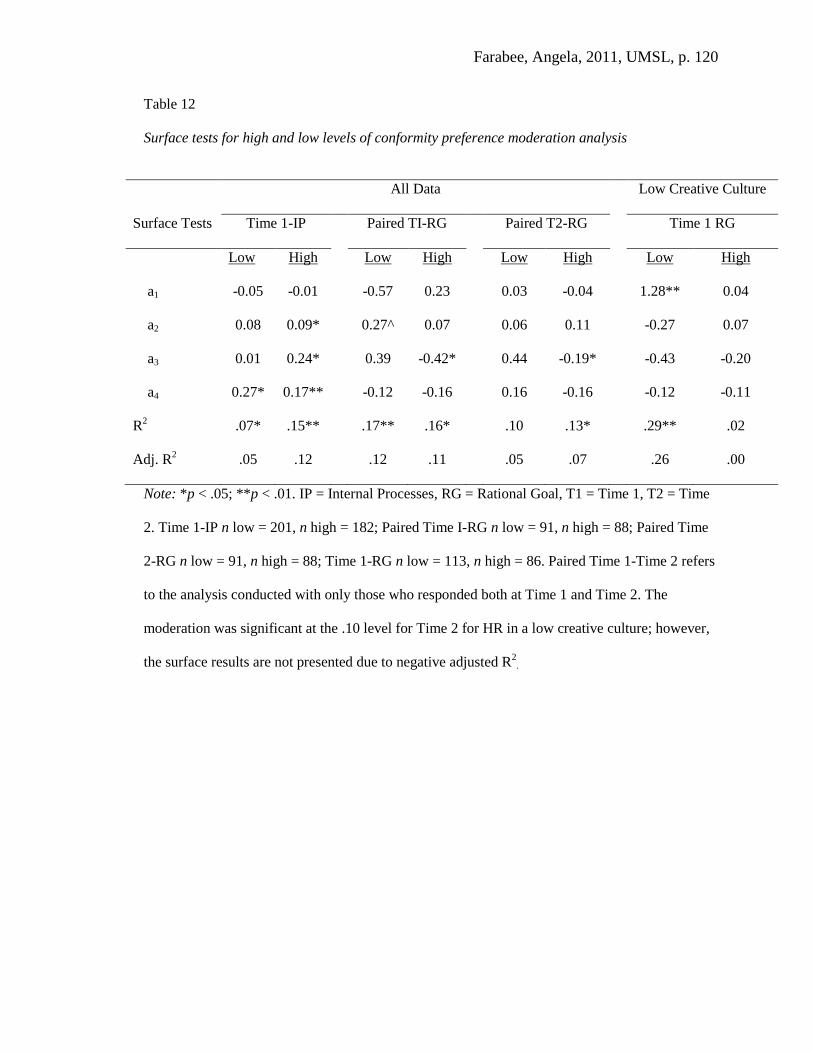
Farabee, Angela, 2011, UMSL, p. 120
Table 12
Surface tests for high and low levels of conformity preference moderation analysis
All Data Low Creative Culture
Surface Tests Time 1-IP Paired TI-RG Paired T2-RG Time 1 RG
Low High Low High Low High Low High
a1 -0.05 -0.01 -0.57 0.23 0.03 -0.04 1.28** 0.04
a2 0.08 0.09* 0.27^ 0.07 0.06 0.11 -0.27 0.07
a3 0.01 0.24* 0.39 -0.42* 0.44 -0.19* -0.43 -0.20
a4 0.27* 0.17** -0.12 -0.16 0.16 -0.16 -0.12 -0.11
R2 .07* .15** .17** .16* .10 .13* .29** .02
Adj. R2 .05 .12 .12 .11 .05 .07 .26 .00
Note: *p < .05; **p < .01. IP = Internal Processes, RG = Rational Goal, T1 = Time 1, T2 = Time
2. Time 1-IP n low = 201, n high = 182; Paired Time I-RG n low = 91, n high = 88; Paired Time
2-RG n low = 91, n high = 88; Time 1-RG n low = 113, n high = 86. Paired Time 1-Time 2 refers
to the analysis conducted with only those who responded both at Time 1 and Time 2. The
moderation was significant at the .10 level for Time 2 for HR in a low creative culture; however,
the surface results are not presented due to negative adjusted R2.
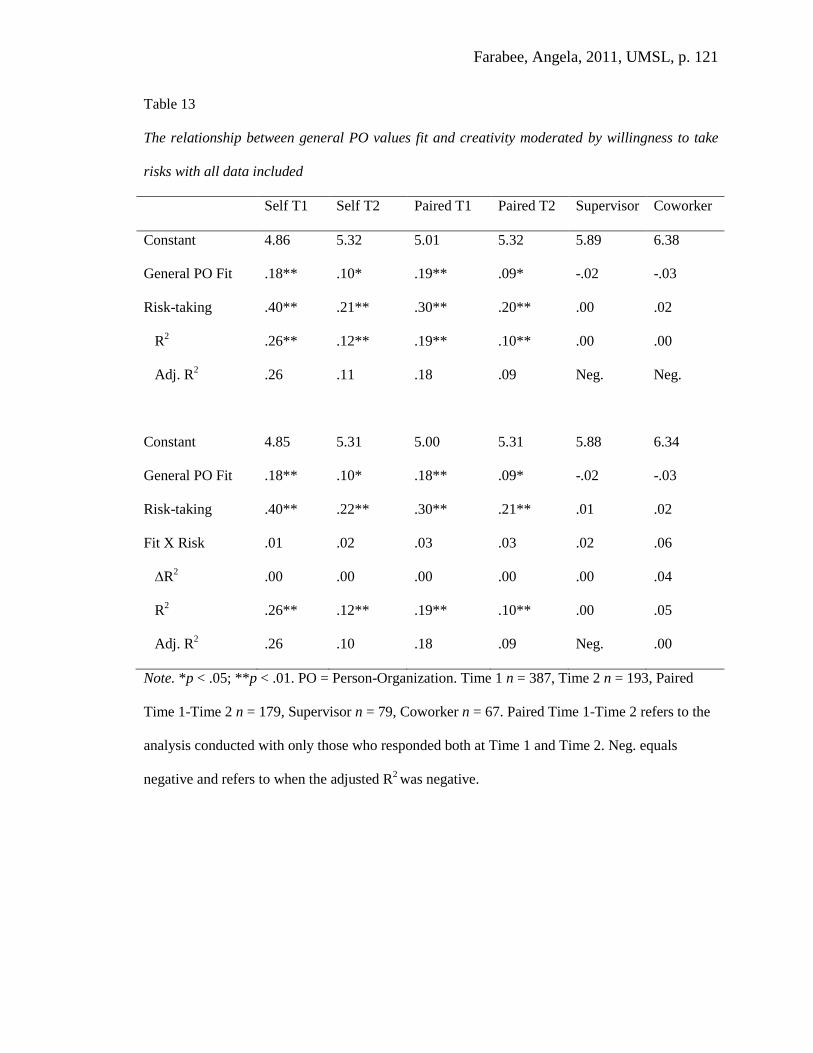
Farabee, Angela, 2011, UMSL, p. 121
Table 13
The relationship between general PO values fit and creativity moderated by willingness to take
risks with all data included
Self T1 Self T2 Paired T1 Paired T2 Supervisor Coworker
Constant 4.86 5.32 5.01 5.32 5.89 6.38
General PO Fit .18** .10* .19** .09* -.02 -.03
Risk-taking .40** .21** .30** .20** .00 .02
R2 .26** .12** .19** .10** .00 .00
Adj. R2 .26 .11 .18 .09 Neg. Neg.
Constant 4.85 5.31 5.00 5.31 5.88 6.34
General PO Fit .18** .10* .18** .09* -.02 -.03
Risk-taking .40** .22** .30** .21** .01 .02
Fit X Risk .01 .02 .03 .03 .02 .06
∆R2 .00 .00 .00 .00 .00 .04
R2 .26** .12** .19** .10** .00 .05
Adj. R2 .26 .10 .18 .09 Neg. .00
Note. *p < .05; **p < .01. PO = Person-Organization. Time 1 n = 387, Time 2 n = 193, Paired
Time 1-Time 2 n = 179, Supervisor n = 79, Coworker n = 67. Paired Time 1-Time 2 refers to the
analysis conducted with only those who responded both at Time 1 and Time 2. Neg. equals
negative and refers to when the adjusted R2 was negative.
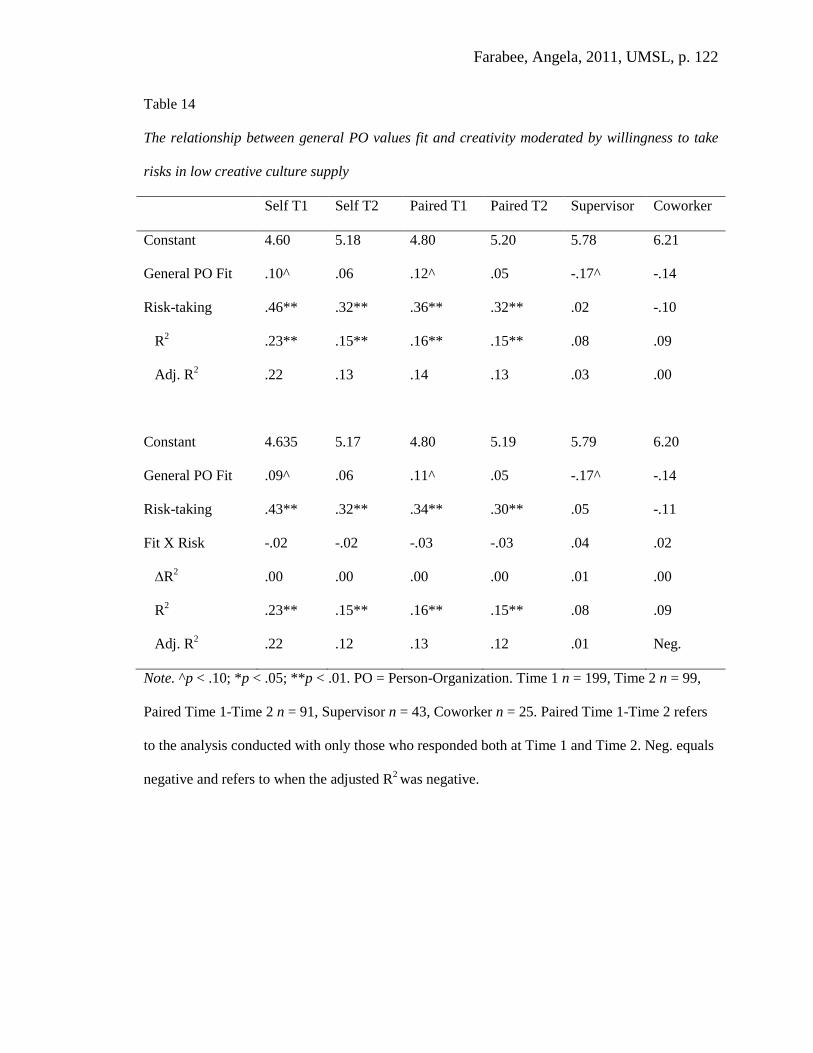
Farabee, Angela, 2011, UMSL, p. 122
Table 14
The relationship between general PO values fit and creativity moderated by willingness to take
risks in low creative culture supply
Self T1 Self T2 Paired T1 Paired T2 Supervisor Coworker
Constant 4.60 5.18 4.80 5.20 5.78 6.21
General PO Fit .10^ .06 .12^ .05 -.17^ -.14
Risk-taking .46** .32** .36** .32** .02 -.10
R2 .23** .15** .16** .15** .08 .09
Adj. R2 .22 .13 .14 .13 .03 .00
Constant 4.635 5.17 4.80 5.19 5.79 6.20
General PO Fit .09^ .06 .11^ .05 -.17^ -.14
Risk-taking .43** .32** .34** .30** .05 -.11
Fit X Risk -.02 -.02 -.03 -.03 .04 .02
∆R2 .00 .00 .00 .00 .01 .00
R2 .23** .15** .16** .15** .08 .09
Adj. R2 .22 .12 .13 .12 .01 Neg.
Note. ^p < .10; *p < .05; **p < .01. PO = Person-Organization. Time 1 n = 199, Time 2 n = 99,
Paired Time 1-Time 2 n = 91, Supervisor n = 43, Coworker n = 25. Paired Time 1-Time 2 refers
to the analysis conducted with only those who responded both at Time 1 and Time 2. Neg. equals
negative and refers to when the adjusted R2 was negative.
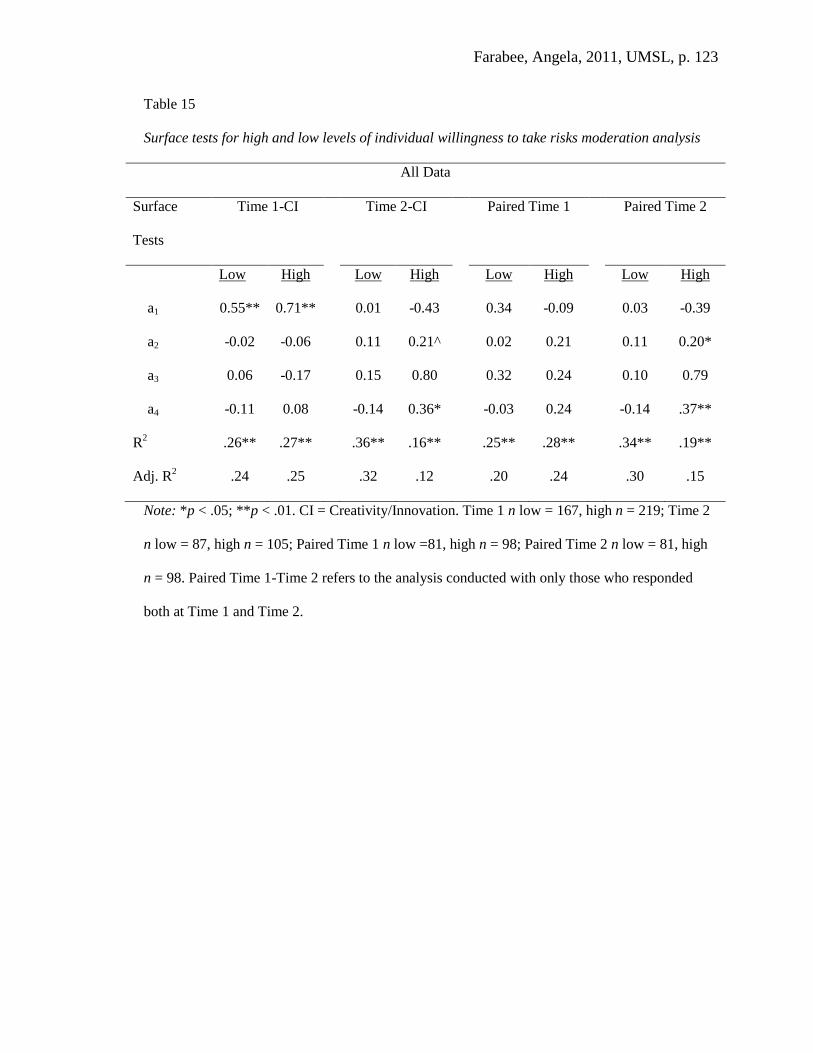
Farabee, Angela, 2011, UMSL, p. 123
Table 15
Surface tests for high and low levels of individual willingness to take risks moderation analysis
All Data
Surface
Tests
Time 1-CI Time 2-CI Paired Time 1 Paired Time 2
Low High Low High Low High Low High
a1 0.55** 0.71** 0.01 -0.43 0.34 -0.09 0.03 -0.39
a2 -0.02 -0.06 0.11 0.21^ 0.02 0.21 0.11 0.20*
a3 0.06 -0.17 0.15 0.80 0.32 0.24 0.10 0.79
a4 -0.11 0.08 -0.14 0.36* -0.03 0.24 -0.14 .37**
R2 .26** .27** .36** .16** .25** .28** .34** .19**
Adj. R2 .24 .25 .32 .12 .20 .24 .30 .15
Note: *p < .05; **p < .01. CI = Creativity/Innovation. Time 1 n low = 167, high n = 219; Time 2
n low = 87, high n = 105; Paired Time 1 n low =81, high n = 98; Paired Time 2 n low = 81, high
n = 98. Paired Time 1-Time 2 refers to the analysis conducted with only those who responded
both at Time 1 and Time 2.

Farabee, Angela, 2011, UMSL, p. 124
Table 16
Summary of results for hypotheses
Hypothesis
Self Rating Supervisor Rating Coworker Rating
1. PO fit on non-creativity values
will negatively relate to creativity
Human Relations Value
Not Supported Not Supported Not Supported
Internal Processes Value
Mixed Support Mixed Support Not Supported
Rational Goal Value
Not Supported Not Supported Not Supported
General PO Values Fit Not Supported
Some Support Not Supported
2. PO fit on creativity/innovation value
will positively relate to creativity
Mixed Support
Not Supported Not Supported
3a. Conformity preference will
moderate the relationship between non-
creativity values fit and creativity
Not Supported
Not Supported Not Supported
3b. Conformity preference will
moderate the relationship between
creativity/innovation value fit and
creativity
Not Supported
Not Supported Not Supported
4a. Willingness to take risks will
moderate the relationship between non-
creativity values fit and creativity
Not Supported Not Supported Not Supported
4b. Willingness to take risks will
moderate the relationship between
creativity/innovation value fit and
creativity
Some Support
Not Supported Not Supported
5. Domain-relevant skills will
positively relate to creativity
Supported
Mixed Support Mixed Support
6. Presence of creative role models will
positively relate to creativity
Supported
Not Supported Not Supported
7. Supervisor support will positively
relate to creativity
Supported
Not Supported Not Supported
8. Job autonomy will positively relate
to creativity
Supported
Not Supported Not Supported
9. Excessive time pressure will Not Supported Not Supported Not Supported
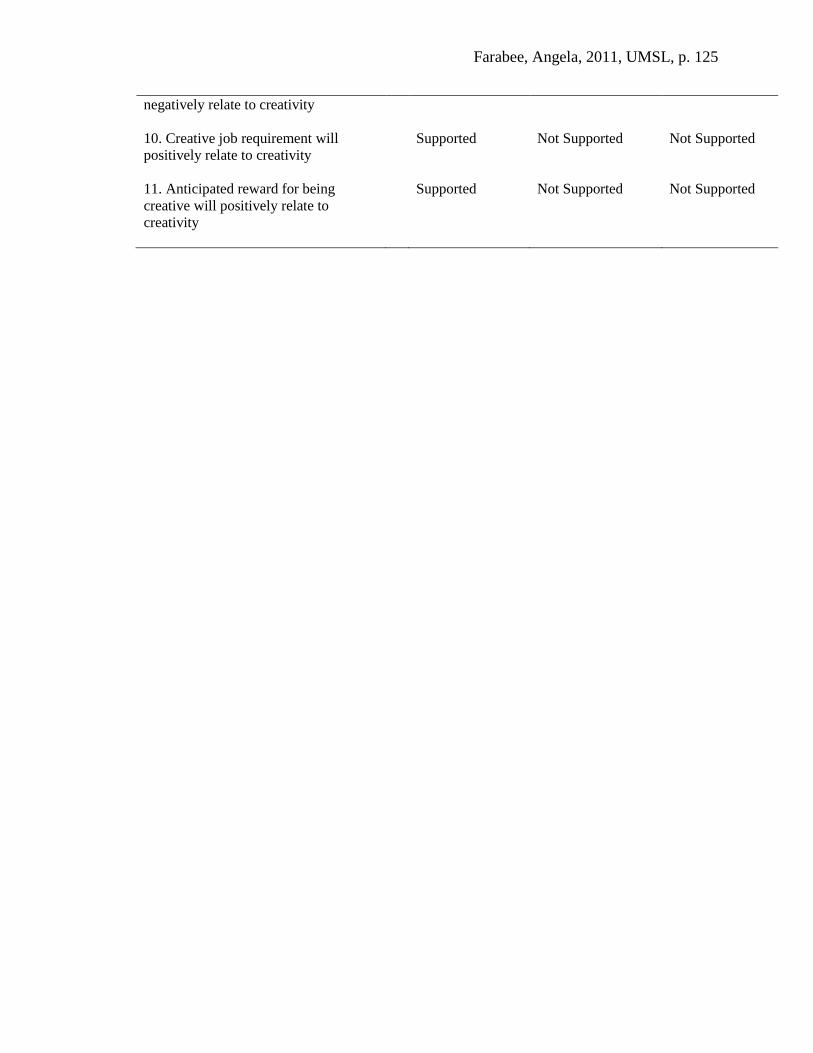
Farabee, Angela, 2011, UMSL, p. 125
negatively relate to creativity
10. Creative job requirement will
positively relate to creativity
Supported
Not Supported Not Supported
11. Anticipated reward for being
creative will positively relate to
creativity
Supported
Not Supported Not Supported
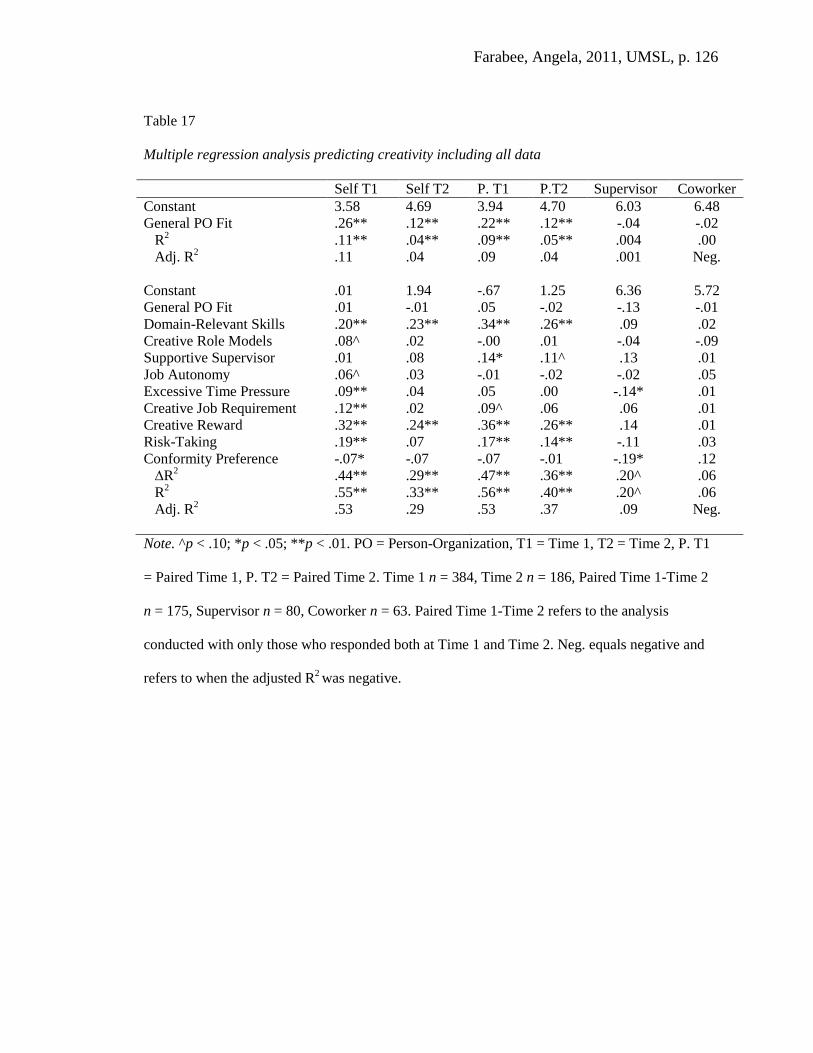
Farabee, Angela, 2011, UMSL, p. 126
Table 17
Multiple regression analysis predicting creativity including all data
Self T1 Self T2 P. T1 P.T2 Supervisor Coworker
Constant 3.58 4.69 3.94 4.70 6.03 6.48
General PO Fit .26** .12** .22** .12** -.04 -.02
R2 .11** .04** .09** .05** .004 .00
Adj. R2 .11 .04 .09 .04 .001 Neg.
Constant .01 1.94 -.67 1.25 6.36 5.72
General PO Fit .01 -.01 .05 -.02 -.13 -.01
Domain-Relevant Skills .20** .23** .34** .26** .09 .02
Creative Role Models .08^ .02 -.00 .01 -.04 -.09
Supportive Supervisor .01 .08 .14* .11^ .13 .01
Job Autonomy .06^ .03 -.01 -.02 -.02 .05
Excessive Time Pressure .09** .04 .05 .00 -.14* .01
Creative Job Requirement .12** .02 .09^ .06 .06 .01
Creative Reward .32** .24** .36** .26** .14 .01
Risk-Taking .19** .07 .17** .14** -.11 .03
Conformity Preference -.07* -.07 -.07 -.01 -.19* .12
∆R2 .44** .29** .47** .36** .20^ .06
R2 .55** .33** .56** .40** .20^ .06
Adj. R2 .53 .29 .53 .37 .09
Neg.
Note. ^p < .10; *p < .05; **p < .01. PO = Person-Organization, T1 = Time 1, T2 = Time 2, P. T1
= Paired Time 1, P. T2 = Paired Time 2. Time 1 n = 384, Time 2 n = 186, Paired Time 1-Time 2
n = 175, Supervisor n = 80, Coworker n = 63. Paired Time 1-Time 2 refers to the analysis
conducted with only those who responded both at Time 1 and Time 2. Neg. equals negative and
refers to when the adjusted R2 was negative.
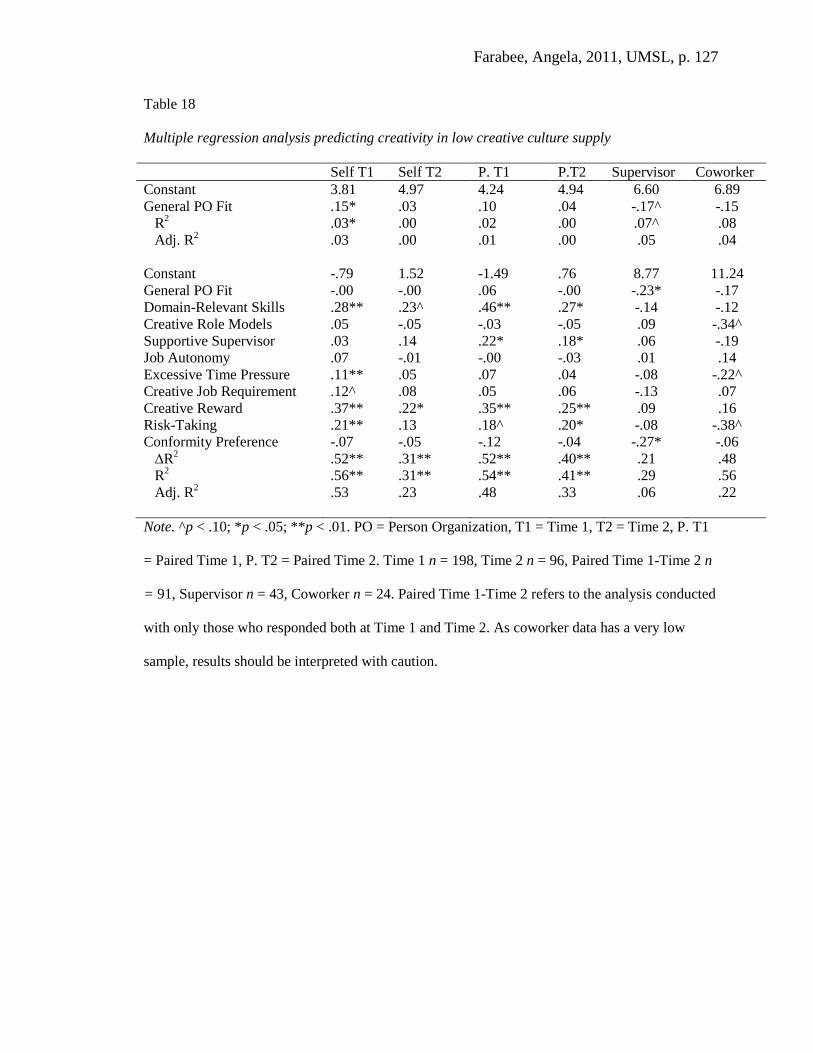
Farabee, Angela, 2011, UMSL, p. 127
Table 18
Multiple regression analysis predicting creativity in low creative culture supply
Self T1 Self T2 P. T1 P.T2 Supervisor Coworker
Constant 3.81 4.97 4.24 4.94 6.60 6.89
General PO Fit .15* .03 .10 .04 -.17^ -.15
R2 .03* .00 .02 .00 .07^ .08
Adj. R2 .03 .00 .01 .00 .05 .04
Constant -.79 1.52 -1.49 .76 8.77 11.24
General PO Fit -.00 -.00 .06 -.00 -.23* -.17
Domain-Relevant Skills .28** .23^ .46** .27* -.14 -.12
Creative Role Models .05 -.05 -.03 -.05 .09 -.34^
Supportive Supervisor .03 .14 .22* .18* .06 -.19
Job Autonomy .07 -.01 -.00 -.03 .01 .14
Excessive Time Pressure .11** .05 .07 .04 -.08 -.22^
Creative Job Requirement .12^ .08 .05 .06 -.13 .07
Creative Reward .37** .22* .35** .25** .09 .16
Risk-Taking .21** .13 .18^ .20* -.08 -.38^
Conformity Preference -.07 -.05 -.12 -.04 -.27* -.06
∆R2 .52** .31** .52** .40** .21 .48
R2 .56** .31** .54** .41** .29 .56
Adj. R2 .53 .23 .48 .33 .06 .22
Note. ^p < .10; *p < .05; **p < .01. PO = Person Organization, T1 = Time 1, T2 = Time 2, P. T1
= Paired Time 1, P. T2 = Paired Time 2. Time 1 n = 198, Time 2 n = 96, Paired Time 1-Time 2 n
= 91, Supervisor n = 43, Coworker n = 24. Paired Time 1-Time 2 refers to the analysis conducted
with only those who responded both at Time 1 and Time 2. As coworker data has a very low
sample, results should be interpreted with caution.
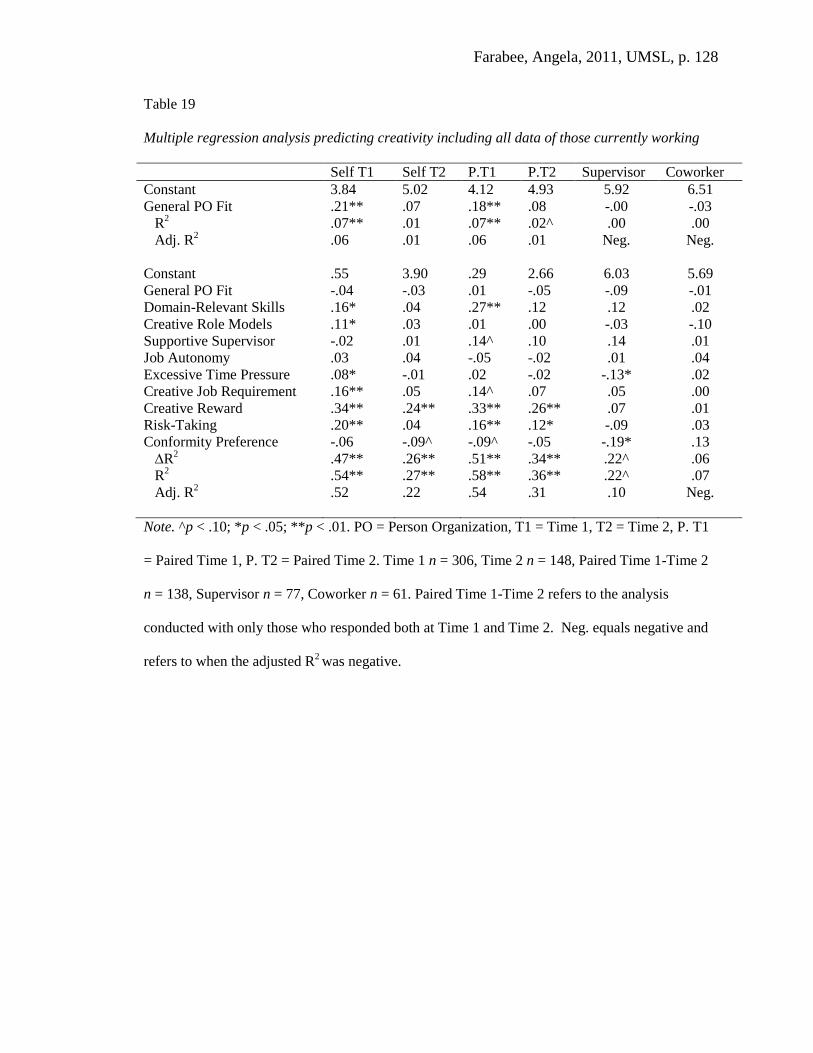
Farabee, Angela, 2011, UMSL, p. 128
Table 19
Multiple regression analysis predicting creativity including all data of those currently working
Self T1 Self T2 P.T1 P.T2 Supervisor Coworker
Constant 3.84 5.02 4.12 4.93 5.92 6.51
General PO Fit .21** .07 .18** .08 -.00 -.03
R2 .07** .01 .07** .02^ .00 .00
Adj. R2 .06 .01 .06 .01 Neg. Neg.
Constant .55 3.90 .29 2.66 6.03 5.69
General PO Fit -.04 -.03 .01 -.05 -.09 -.01
Domain-Relevant Skills .16* .04 .27** .12 .12 .02
Creative Role Models .11* .03 .01 .00 -.03 -.10
Supportive Supervisor -.02 .01 .14^ .10 .14 .01
Job Autonomy .03 .04 -.05 -.02 .01 .04
Excessive Time Pressure .08* -.01 .02 -.02 -.13* .02
Creative Job Requirement .16** .05 .14^ .07 .05 .00
Creative Reward .34** .24** .33** .26** .07 .01
Risk-Taking .20** .04 .16** .12* -.09 .03
Conformity Preference -.06 -.09^ -.09^ -.05 -.19* .13
∆R2 .47** .26** .51** .34** .22^ .06
R2 .54** .27** .58** .36** .22^ .07
Adj. R2 .52 .22 .54 .31
.10 Neg.
Note. ^p < .10; *p < .05; **p < .01. PO = Person Organization, T1 = Time 1, T2 = Time 2, P. T1
= Paired Time 1, P. T2 = Paired Time 2. Time 1 n = 306, Time 2 n = 148, Paired Time 1-Time 2
n = 138, Supervisor n = 77, Coworker n = 61. Paired Time 1-Time 2 refers to the analysis
conducted with only those who responded both at Time 1 and Time 2. Neg. equals negative and
refers to when the adjusted R2 was negative.
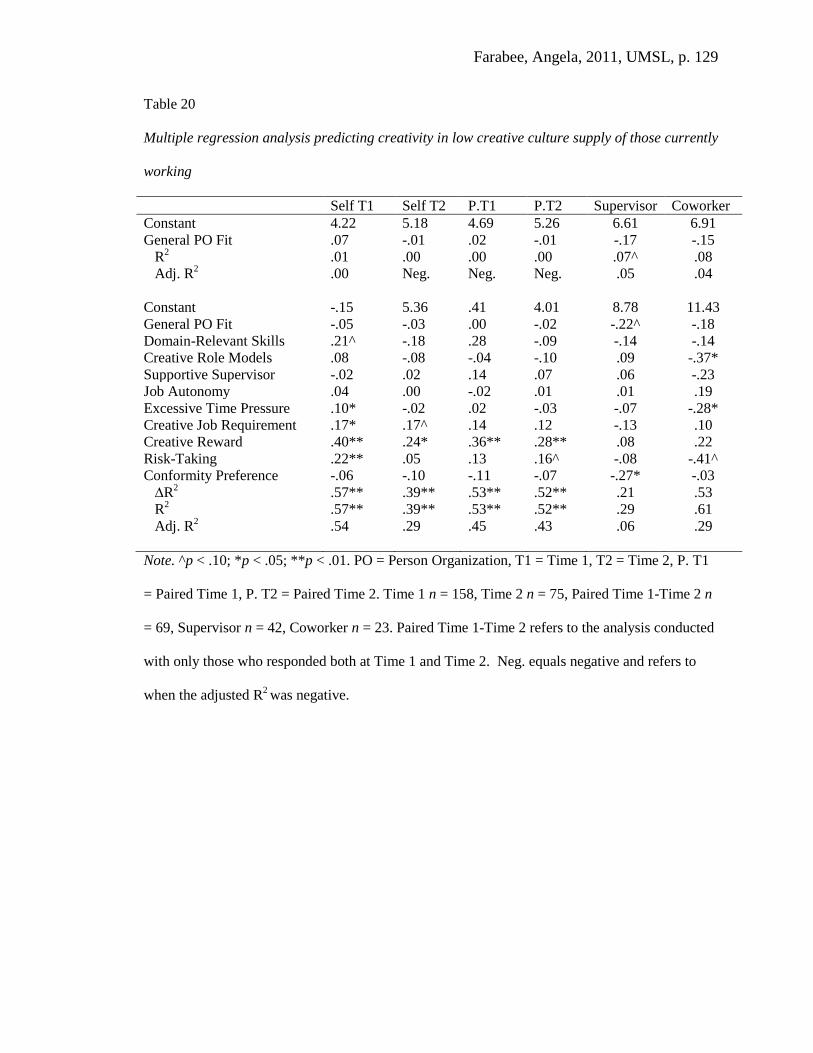
Farabee, Angela, 2011, UMSL, p. 129
Table 20
Multiple regression analysis predicting creativity in low creative culture supply of those currently
working
Self T1 Self T2 P.T1 P.T2 Supervisor Coworker
Constant 4.22 5.18 4.69 5.26 6.61 6.91
General PO Fit .07 -.01 .02 -.01 -.17 -.15
R2 .01 .00 .00 .00 .07^ .08
Adj. R2 .00 Neg. Neg. Neg. .05 .04
Constant -.15 5.36 .41 4.01 8.78 11.43
General PO Fit -.05 -.03 .00 -.02 -.22^ -.18
Domain-Relevant Skills .21^ -.18 .28 -.09 -.14 -.14
Creative Role Models .08 -.08 -.04 -.10 .09 -.37*
Supportive Supervisor -.02 .02 .14 .07 .06 -.23
Job Autonomy .04 .00 -.02 .01 .01 .19
Excessive Time Pressure .10* -.02 .02 -.03 -.07 -.28*
Creative Job Requirement .17* .17^ .14 .12 -.13 .10
Creative Reward .40** .24* .36** .28** .08 .22
Risk-Taking .22** .05 .13 .16^ -.08 -.41^
Conformity Preference -.06 -.10 -.11 -.07 -.27* -.03
∆R2 .57** .39** .53** .52** .21 .53
R2 .57** .39** .53** .52** .29 .61
Adj. R2 .54 .29 .45 .43
.06 .29
Note. ^p < .10; *p < .05; **p < .01. PO = Person Organization, T1 = Time 1, T2 = Time 2, P. T1
= Paired Time 1, P. T2 = Paired Time 2. Time 1 n = 158, Time 2 n = 75, Paired Time 1-Time 2 n
= 69, Supervisor n = 42, Coworker n = 23. Paired Time 1-Time 2 refers to the analysis conducted
with only those who responded both at Time 1 and Time 2. Neg. equals negative and refers to
when the adjusted R2 was negative.
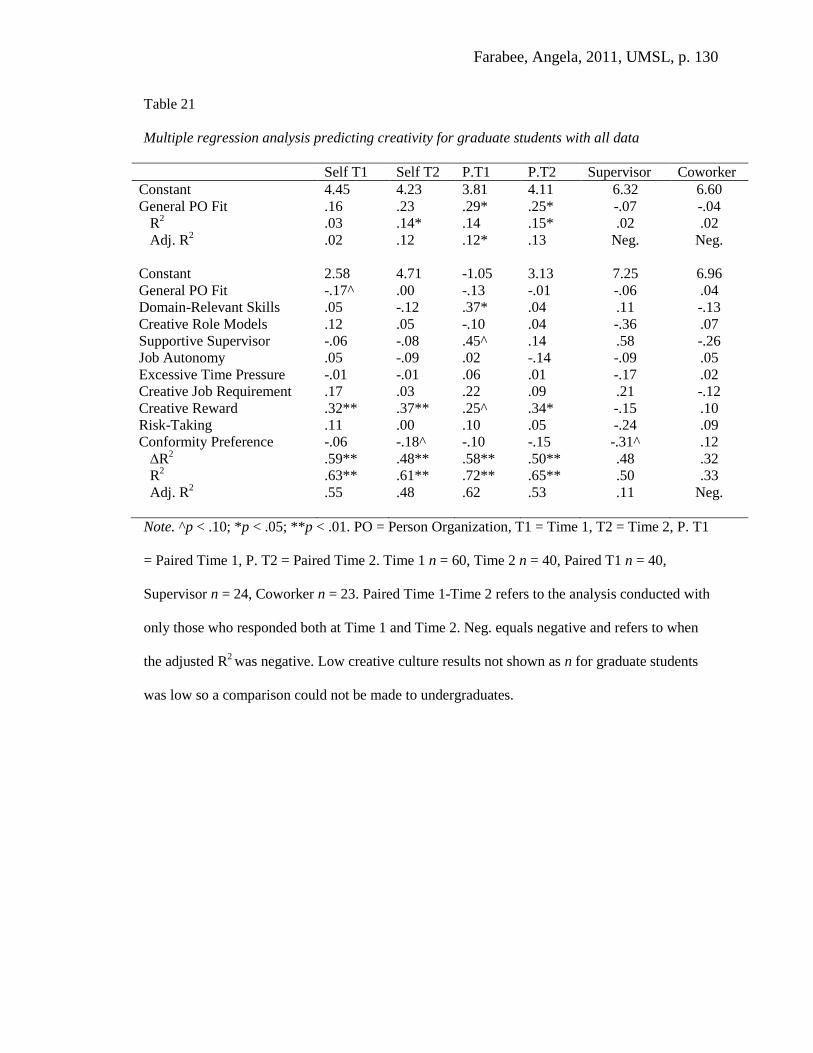
Farabee, Angela, 2011, UMSL, p. 130
Table 21
Multiple regression analysis predicting creativity for graduate students with all data
Self T1 Self T2 P.T1 P.T2 Supervisor Coworker
Constant 4.45 4.23 3.81 4.11 6.32 6.60
General PO Fit .16 .23 .29* .25* -.07 -.04
R2 .03 .14* .14 .15* .02 .02
Adj. R2 .02 .12 .12* .13 Neg. Neg.
Constant 2.58 4.71 -1.05 3.13 7.25 6.96
General PO Fit -.17^ .00 -.13 -.01 -.06 .04
Domain-Relevant Skills .05 -.12 .37* .04 .11 -.13
Creative Role Models .12 .05 -.10 .04 -.36 .07
Supportive Supervisor -.06 -.08 .45^ .14 .58 -.26
Job Autonomy .05 -.09 .02 -.14 -.09 .05
Excessive Time Pressure -.01 -.01 .06 .01 -.17 .02
Creative Job Requirement .17 .03 .22 .09 .21 -.12
Creative Reward .32** .37** .25^ .34* -.15 .10
Risk-Taking .11 .00 .10 .05 -.24 .09
Conformity Preference -.06 -.18^ -.10 -.15 -.31^ .12
∆R2 .59** .48** .58** .50** .48 .32
R2 .63** .61** .72** .65** .50 .33
Adj. R2 .55 .48 .62
.53 .11 Neg.
Note. ^p < .10; *p < .05; **p < .01. PO = Person Organization, T1 = Time 1, T2 = Time 2, P. T1
= Paired Time 1, P. T2 = Paired Time 2. Time 1 n = 60, Time 2 n = 40, Paired T1 n = 40,
Supervisor n = 24, Coworker n = 23. Paired Time 1-Time 2 refers to the analysis conducted with
only those who responded both at Time 1 and Time 2. Neg. equals negative and refers to when
the adjusted R2 was negative. Low creative culture results not shown as n for graduate students
was low so a comparison could not be made to undergraduates.

Farabee, Angela, 2011, UMSL, p. 131
Table 22
Multiple regression analysis predicting creativity for undergraduate students with all data
Self T1 Self T2 P.T1 P.T2 Supervisor Coworker
Constant 3.46 4.79 3.99 4.94 5.80 6.39
General PO Fit .27** .10* .20 .07 .01 -.01
R2 .12** .03* .09** .01 .00 .00
Adj. R2 .12 .02 .08 .01 Neg. Neg.
Constant -.37 1.12 -.30 1.26 5.59 4.34
General PO Fit .06 -.01 .12 -.02 -.04 -.04
Domain-Relevant Skills .25** .37** .34** .33** .09 .20
Creative Role Models .09^ .01 .04 .00 .08 -.05
Supportive Supervisor -.04 .05 .04 .08 .00 .01
Job Autonomy .05 .05 .02 .05 .04 .02
Excessive Time Pressure .11** .03 .10* .03 -.10 .01
Creative Job Requirement .11* .03 .04 .03 .02 .02
Creative Reward .31** .20** .33** .20** .17 .03
Risk-Taking .20** .09 .13 .10 -.05 .03
Conformity Preference -.08* -.04 -.12* -.03 -.22* .14
∆R2 .42** .30** .40** .27** .26 .08
R2 .54** .33** .49** .29** .26 .08
Adj. R2 .53 .22 .44 .23
.10 Neg.
Note. ^p < .10; *p < .05; **p < .01. PO = Person Organization, T1 = Time 1, T2 = Time 2, P. T1
= Paired Time 1, P. T2 = Paired Time 2. Time 1 n = 323, Time 2 n = 145, Paired Time 1-Time 2
n = 136, Supervisor n = 55, Coworker n = 40. Paired Time 1-Time 2 refers to the analysis
conducted with only those who responded both at Time 1 and Time 2. Neg. equals negative and
refers to when the adjusted R2 was negative. Low creative culture results not shown as n for
graduate students was low so a comparison could not be made to undergraduates.
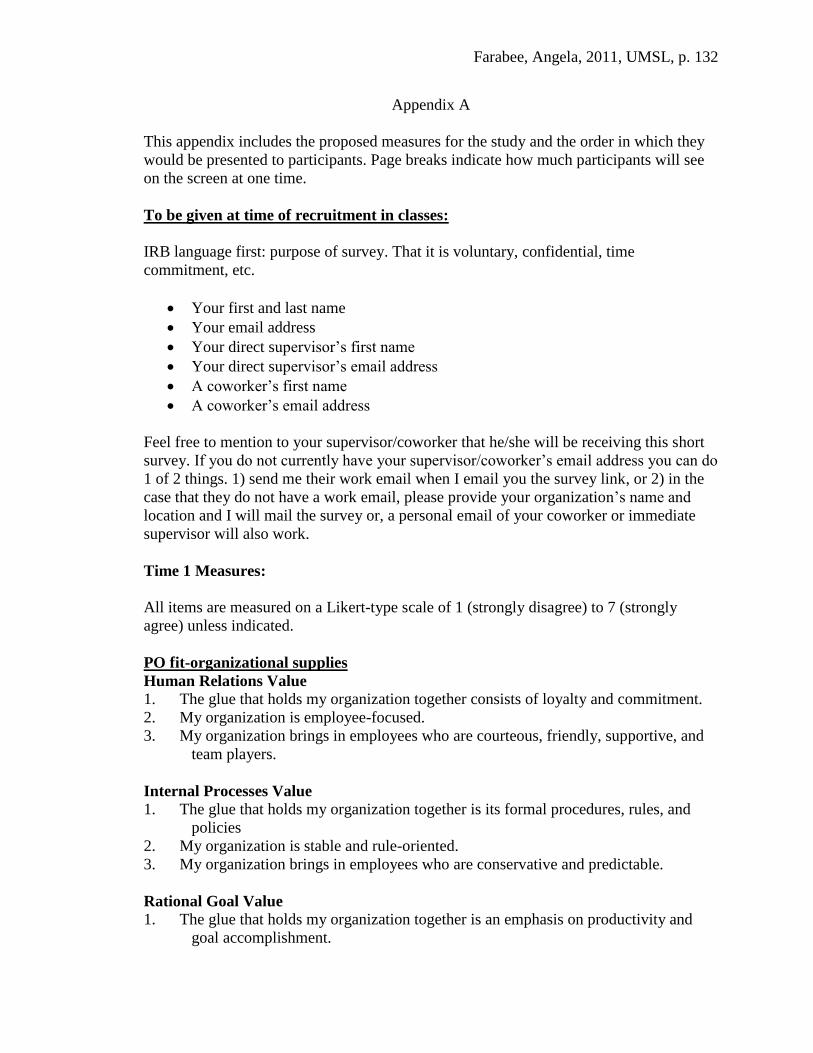
Farabee, Angela, 2011, UMSL, p. 132
Appendix A
This appendix includes the proposed measures for the study and the order in which they
would be presented to participants. Page breaks indicate how much participants will see
on the screen at one time.
To be given at time of recruitment in classes:
IRB language first: purpose of survey. That it is voluntary, confidential, time
commitment, etc.
Your first and last name
Your email address
Your direct supervisor’s first name
Your direct supervisor’s email address
A coworker’s first name
A coworker’s email address
Feel free to mention to your supervisor/coworker that he/she will be receiving this short
survey. If you do not currently have your supervisor/coworker’s email address you can do
1 of 2 things. 1) send me their work email when I email you the survey link, or 2) in the
case that they do not have a work email, please provide your organization’s name and
location and I will mail the survey or, a personal email of your coworker or immediate
supervisor will also work.
Time 1 Measures:
All items are measured on a Likert-type scale of 1 (strongly disagree) to 7 (strongly
agree) unless indicated.
PO fit-organizational supplies
Human Relations Value
1. The glue that holds my organization together consists of loyalty and commitment.
2. My organization is employee-focused.
3. My organization brings in employees who are courteous, friendly, supportive, and
team players.
Internal Processes Value
1. The glue that holds my organization together is its formal procedures, rules, and
policies
2. My organization is stable and rule-oriented.
3. My organization brings in employees who are conservative and predictable.
Rational Goal Value
1. The glue that holds my organization together is an emphasis on productivity and
goal accomplishment.

Farabee, Angela, 2011, UMSL, p. 133
2. My organization promotes a competitive and achievement-oriented image.
3. My organization brings in employees who are competitive and achievement-
oriented.
Creativity/Innovation Value
1. The glue that holds my organization together is a focus on innovation.
2. My organization promotes an image of innovation, adaptability, and
entrepreneurship.
3. My organization brings in employees who are creative and innovative.
Supervisor Support
1. My supervisor encourages me to develop new skills.
2. My supervisor encourages employees to participate in important decisions.
3. My supervisor encourages employees to speak up when they disagree with a
decision.
4. My supervisor praises good work.
General PO Values Fit
1. The values of my company are similar to the values I want in a company.
2. I believe I fit well with my organization’s values.
3. I am well matched to my organization’s culture.
Presence of Creative Role Models
1. In my organization, I often see employees display creative behaviors at work.
2. In my organization, I have a role model who offers new and useful ideas.
3. There are employees in my organization who I consider to be creative role models.
Willingness to Take Risks at Work
1. When I think of a good way to improve the way I accomplish my work, I will risk
potential failure to try it out.
2. I will take a risk and try something new if I have an idea that might improve my
work, regardless of how I might be evaluated.
3. I am willing to go out on a limb at work and risk failure when I have a good idea
that could help me become more successful.
Conformity Preference
1. I tend to go along with what the group wants.
2. Generally, I’d rather give in and go along for the sake of peace than struggle to have
my way.
3. I give into others easily.
Needs-Supplies Fit-Needs
Human Relations Value
1. I want the glue that holds my organization together to consist of loyalty and
commitment.
2. I want my organization to be employee-focused.
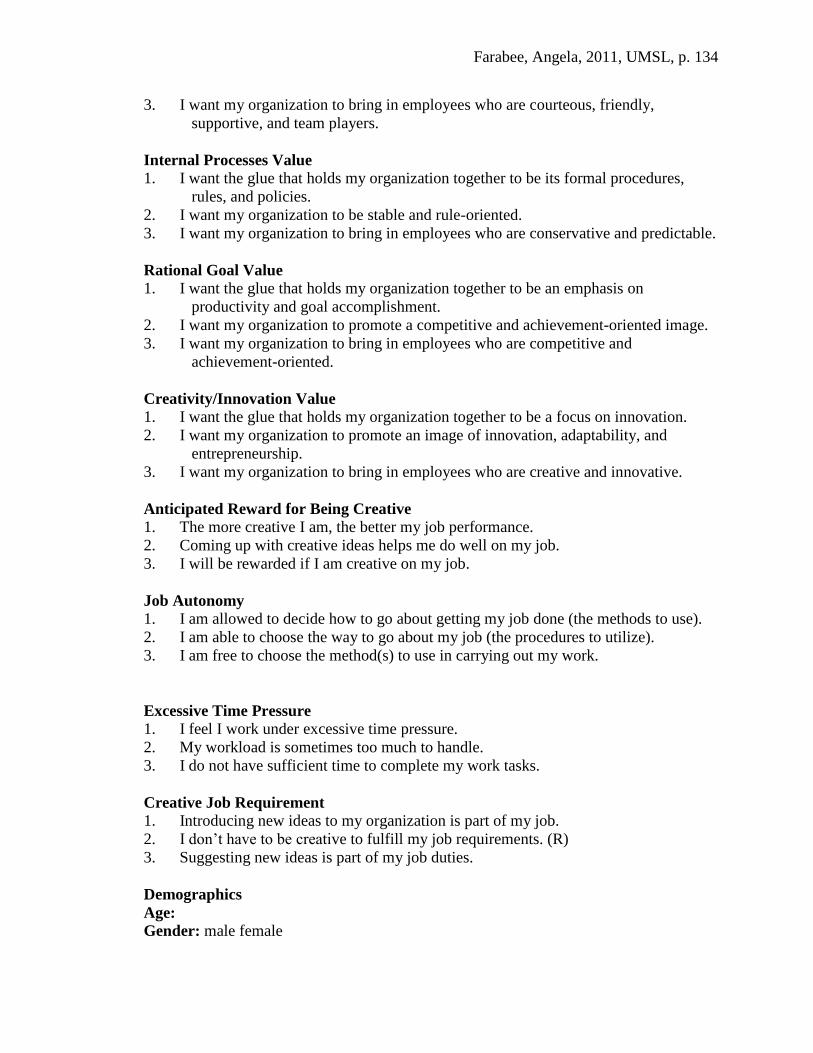
Farabee, Angela, 2011, UMSL, p. 134
3. I want my organization to bring in employees who are courteous, friendly,
supportive, and team players.
Internal Processes Value
1. I want the glue that holds my organization together to be its formal procedures,
rules, and policies.
2. I want my organization to be stable and rule-oriented.
3. I want my organization to bring in employees who are conservative and predictable.
Rational Goal Value
1. I want the glue that holds my organization together to be an emphasis on
productivity and goal accomplishment.
2. I want my organization to promote a competitive and achievement-oriented image.
3. I want my organization to bring in employees who are competitive and
achievement-oriented.
Creativity/Innovation Value
1. I want the glue that holds my organization together to be a focus on innovation.
2. I want my organization to promote an image of innovation, adaptability, and
entrepreneurship.
3. I want my organization to bring in employees who are creative and innovative.
Anticipated Reward for Being Creative 1. The more creative I am, the better my job performance.
2. Coming up with creative ideas helps me do well on my job.
3. I will be rewarded if I am creative on my job.
Job Autonomy
1. I am allowed to decide how to go about getting my job done (the methods to use).
2. I am able to choose the way to go about my job (the procedures to utilize).
3. I am free to choose the method(s) to use in carrying out my work.
Excessive Time Pressure 1. I feel I work under excessive time pressure.
2. My workload is sometimes too much to handle.
3. I do not have sufficient time to complete my work tasks.
Creative Job Requirement
1. Introducing new ideas to my organization is part of my job.
2. I don’t have to be creative to fulfill my job requirements. (R)
3. Suggesting new ideas is part of my job duties.
Demographics
Age:
Gender: male female
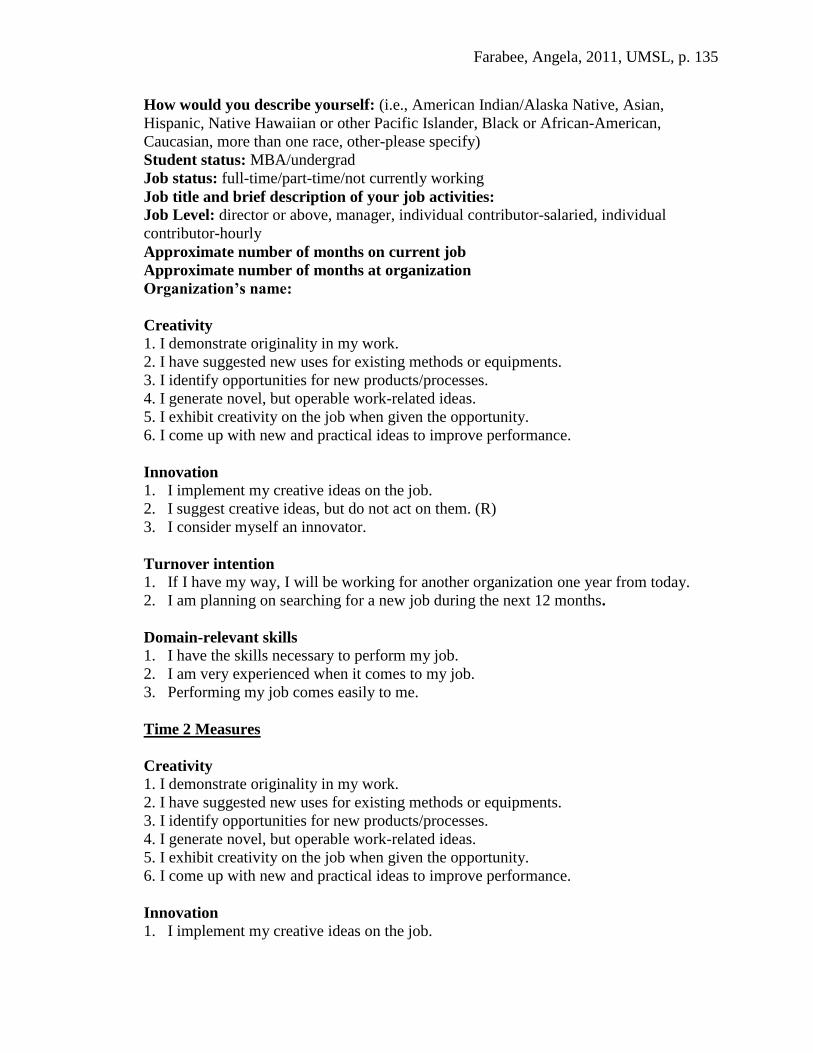
Farabee, Angela, 2011, UMSL, p. 135
How would you describe yourself: (i.e., American Indian/Alaska Native, Asian,
Hispanic, Native Hawaiian or other Pacific Islander, Black or African-American,
Caucasian, more than one race, other-please specify)
Student status: MBA/undergrad
Job status: full-time/part-time/not currently working
Job title and brief description of your job activities:
Job Level: director or above, manager, individual contributor-salaried, individual
contributor-hourly
Approximate number of months on current job
Approximate number of months at organization
Organization’s name:
Creativity
1. I demonstrate originality in my work.
2. I have suggested new uses for existing methods or equipments.
3. I identify opportunities for new products/processes.
4. I generate novel, but operable work-related ideas.
5. I exhibit creativity on the job when given the opportunity.
6. I come up with new and practical ideas to improve performance.
Innovation
1. I implement my creative ideas on the job.
2. I suggest creative ideas, but do not act on them. (R)
3. I consider myself an innovator.
Turnover intention
1. If I have my way, I will be working for another organization one year from today.
2. I am planning on searching for a new job during the next 12 months.
Domain-relevant skills
1. I have the skills necessary to perform my job.
2. I am very experienced when it comes to my job.
3. Performing my job comes easily to me.
Time 2 Measures
Creativity
1. I demonstrate originality in my work.
2. I have suggested new uses for existing methods or equipments.
3. I identify opportunities for new products/processes.
4. I generate novel, but operable work-related ideas.
5. I exhibit creativity on the job when given the opportunity.
6. I come up with new and practical ideas to improve performance.
Innovation
1. I implement my creative ideas on the job.
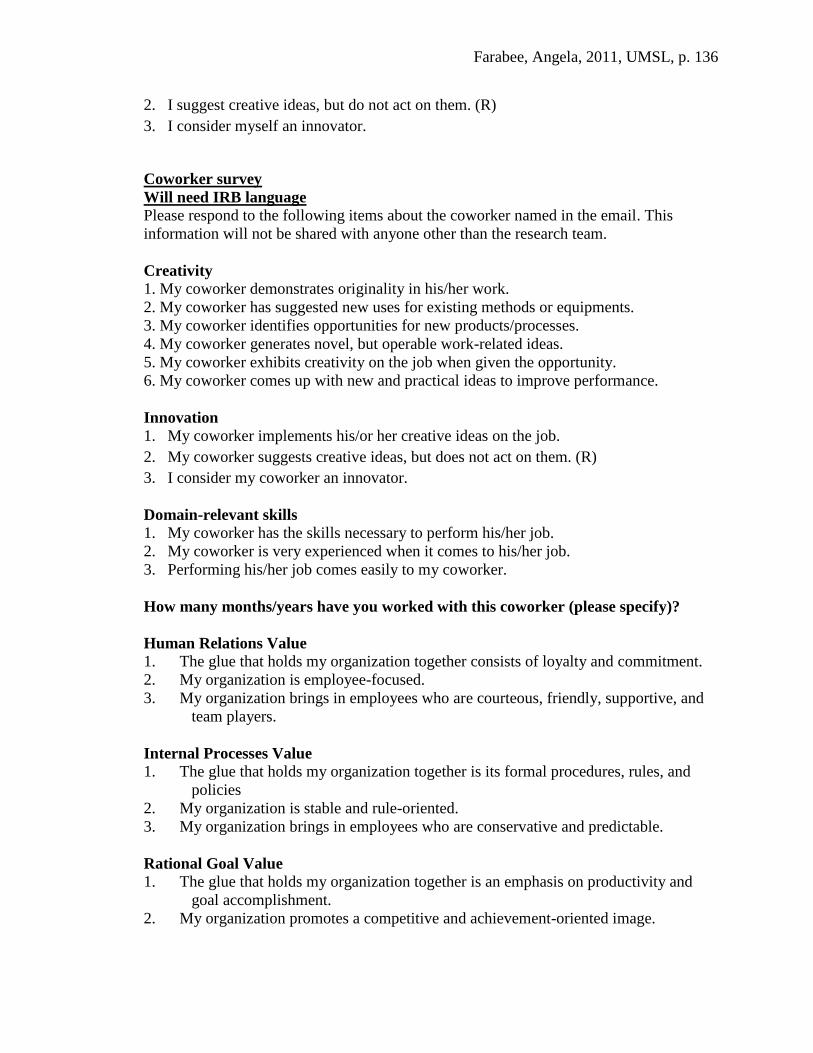
Farabee, Angela, 2011, UMSL, p. 136
2. I suggest creative ideas, but do not act on them. (R)
3. I consider myself an innovator.
Coworker survey
Will need IRB language
Please respond to the following items about the coworker named in the email. This
information will not be shared with anyone other than the research team.
Creativity
1. My coworker demonstrates originality in his/her work.
2. My coworker has suggested new uses for existing methods or equipments.
3. My coworker identifies opportunities for new products/processes.
4. My coworker generates novel, but operable work-related ideas.
5. My coworker exhibits creativity on the job when given the opportunity.
6. My coworker comes up with new and practical ideas to improve performance.
Innovation
1. My coworker implements his/or her creative ideas on the job.
2. My coworker suggests creative ideas, but does not act on them. (R)
3. I consider my coworker an innovator.
Domain-relevant skills
1. My coworker has the skills necessary to perform his/her job.
2. My coworker is very experienced when it comes to his/her job.
3. Performing his/her job comes easily to my coworker.
How many months/years have you worked with this coworker (please specify)?
Human Relations Value
1. The glue that holds my organization together consists of loyalty and commitment.
2. My organization is employee-focused.
3. My organization brings in employees who are courteous, friendly, supportive, and
team players.
Internal Processes Value
1. The glue that holds my organization together is its formal procedures, rules, and
policies
2. My organization is stable and rule-oriented.
3. My organization brings in employees who are conservative and predictable.
Rational Goal Value
1. The glue that holds my organization together is an emphasis on productivity and
goal accomplishment.
2. My organization promotes a competitive and achievement-oriented image.
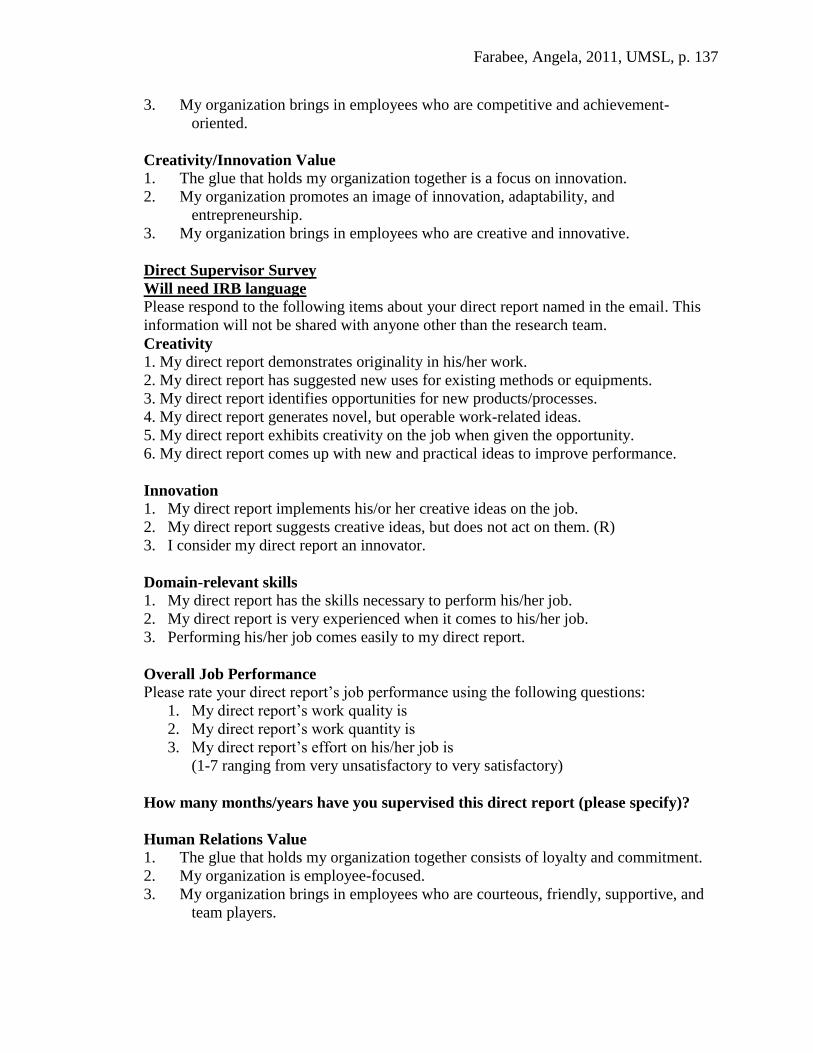
Farabee, Angela, 2011, UMSL, p. 137
3. My organization brings in employees who are competitive and achievement-
oriented.
Creativity/Innovation Value
1. The glue that holds my organization together is a focus on innovation.
2. My organization promotes an image of innovation, adaptability, and
entrepreneurship.
3. My organization brings in employees who are creative and innovative.
Direct Supervisor Survey
Will need IRB language
Please respond to the following items about your direct report named in the email. This
information will not be shared with anyone other than the research team.
Creativity
1. My direct report demonstrates originality in his/her work.
2. My direct report has suggested new uses for existing methods or equipments.
3. My direct report identifies opportunities for new products/processes.
4. My direct report generates novel, but operable work-related ideas.
5. My direct report exhibits creativity on the job when given the opportunity.
6. My direct report comes up with new and practical ideas to improve performance.
Innovation
1. My direct report implements his/or her creative ideas on the job.
2. My direct report suggests creative ideas, but does not act on them. (R)
3. I consider my direct report an innovator.
Domain-relevant skills
1. My direct report has the skills necessary to perform his/her job.
2. My direct report is very experienced when it comes to his/her job.
3. Performing his/her job comes easily to my direct report.
Overall Job Performance
Please rate your direct report’s job performance using the following questions:
1. My direct report’s work quality is
2. My direct report’s work quantity is
3. My direct report’s effort on his/her job is
(1-7 ranging from very unsatisfactory to very satisfactory)
How many months/years have you supervised this direct report (please specify)?
Human Relations Value
1. The glue that holds my organization together consists of loyalty and commitment.
2. My organization is employee-focused.
3. My organization brings in employees who are courteous, friendly, supportive, and
team players.
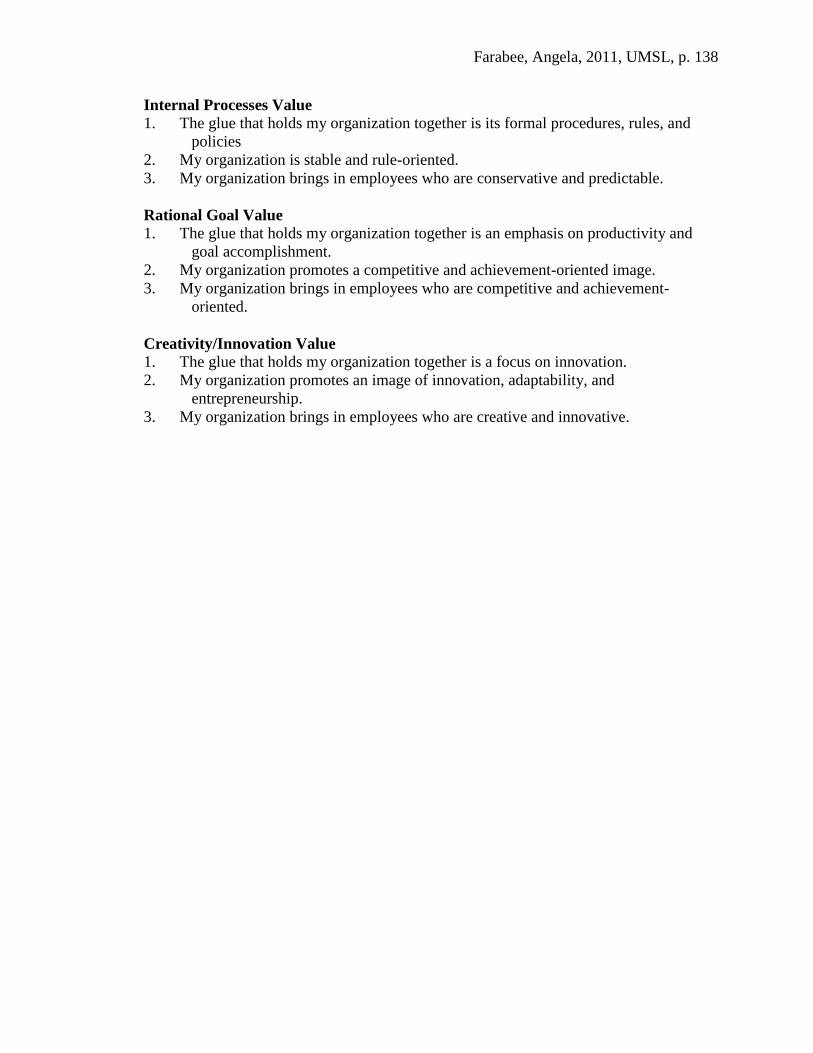
Farabee, Angela, 2011, UMSL, p. 138
Internal Processes Value
1. The glue that holds my organization together is its formal procedures, rules, and
policies
2. My organization is stable and rule-oriented.
3. My organization brings in employees who are conservative and predictable.
Rational Goal Value
1. The glue that holds my organization together is an emphasis on productivity and
goal accomplishment.
2. My organization promotes a competitive and achievement-oriented image.
3. My organization brings in employees who are competitive and achievement-
oriented.
Creativity/Innovation Value
1. The glue that holds my organization together is a focus on innovation.
2. My organization promotes an image of innovation, adaptability, and
entrepreneurship.
3. My organization brings in employees who are creative and innovative.
Farabee, Angela, 2011, UMSL, p. 139
Figure Caption
Figure 1. Proposed model for study
Figure 2. Competing values model categories (Quinn, 1988)
Figure 3. Surface graphs for human relations value
Figure 4. Surface graphs for internal processes value
Figure 5. Surface graphs for rational goal value
Figure 6. Surface graphs for creativity/innovation value
Figure 7. Surface graphs for conformity preference as a moderator
Figure 8. Surface graphs for individual willingness to take risks at work as a moderator
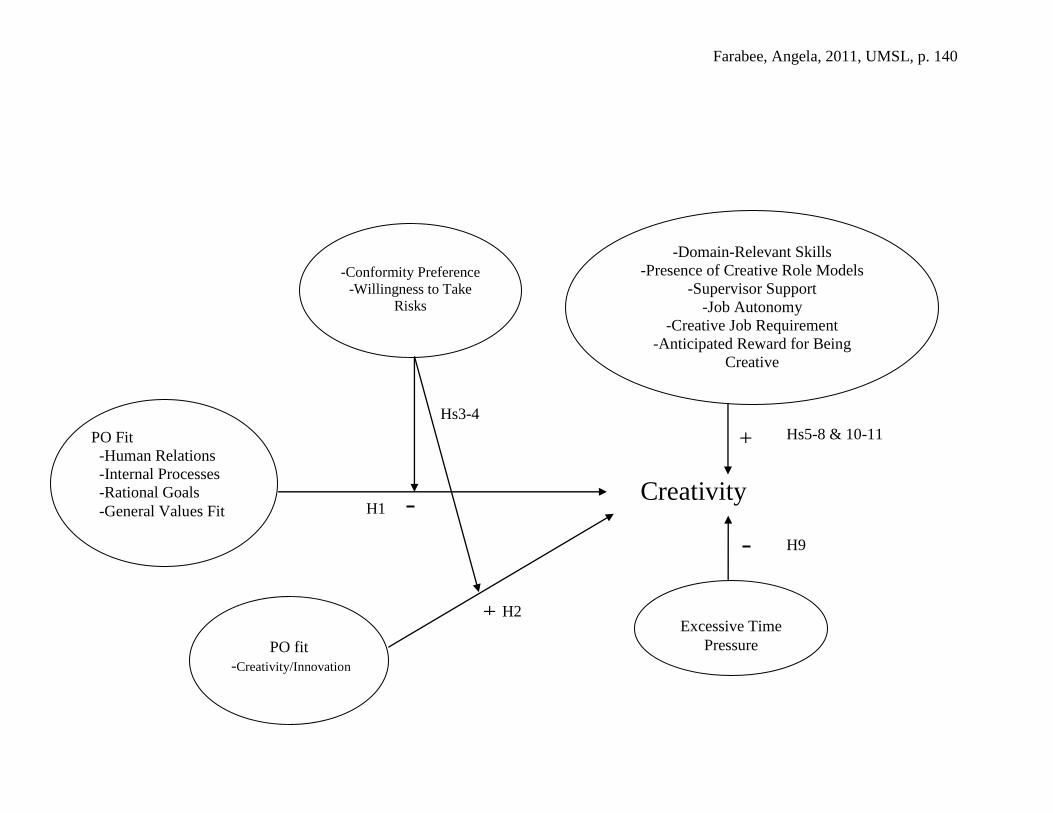
Farabee, Angela, 2011, UMSL, p. 140
-Conformity Preference
-Willingness to Take
Risks
PO Fit
-Human Relations
-Internal Processes
-Rational Goals
-General Values Fit
PO fit
-Creativity/Innovation
Creativity
+
H1
H2
Hs3-4
+
-Domain-Relevant Skills
-Presence of Creative Role Models
-Supervisor Support
-Job Autonomy
-Creative Job Requirement
-Anticipated Reward for Being
Creative
Excessive Time
Pressure
Hs5-8 & 10-11
H9
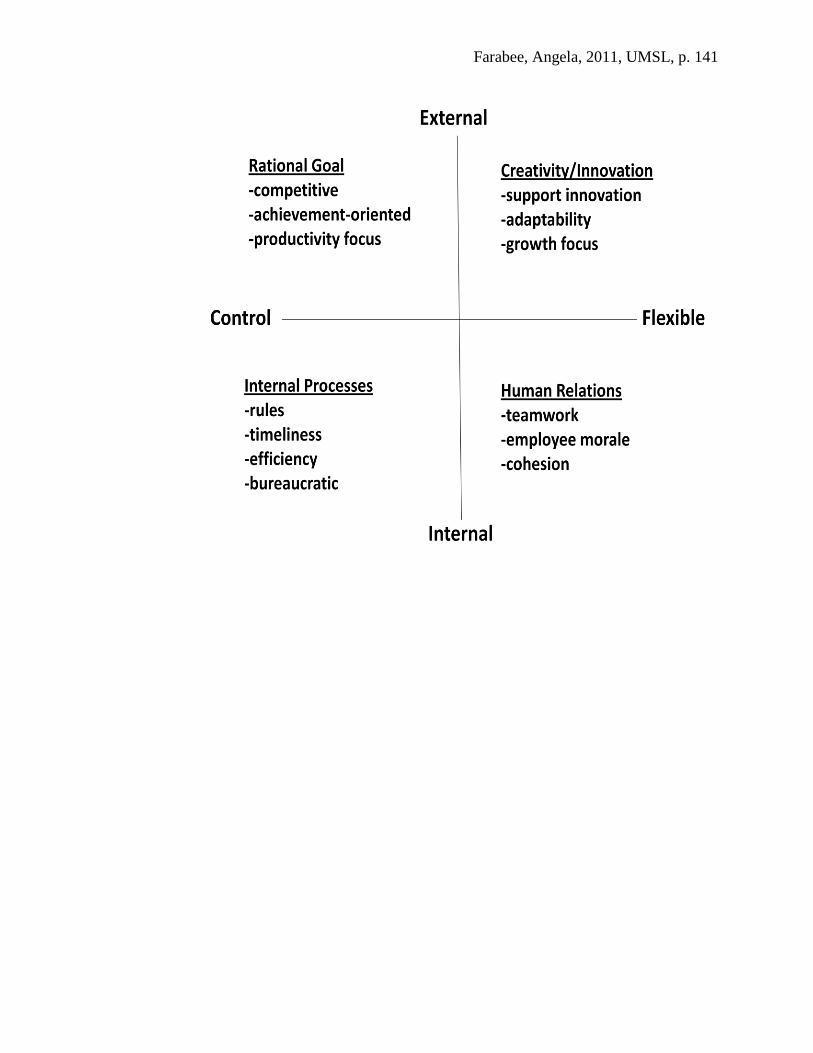
Farabee, Angela, 2011, UMSL, p. 141
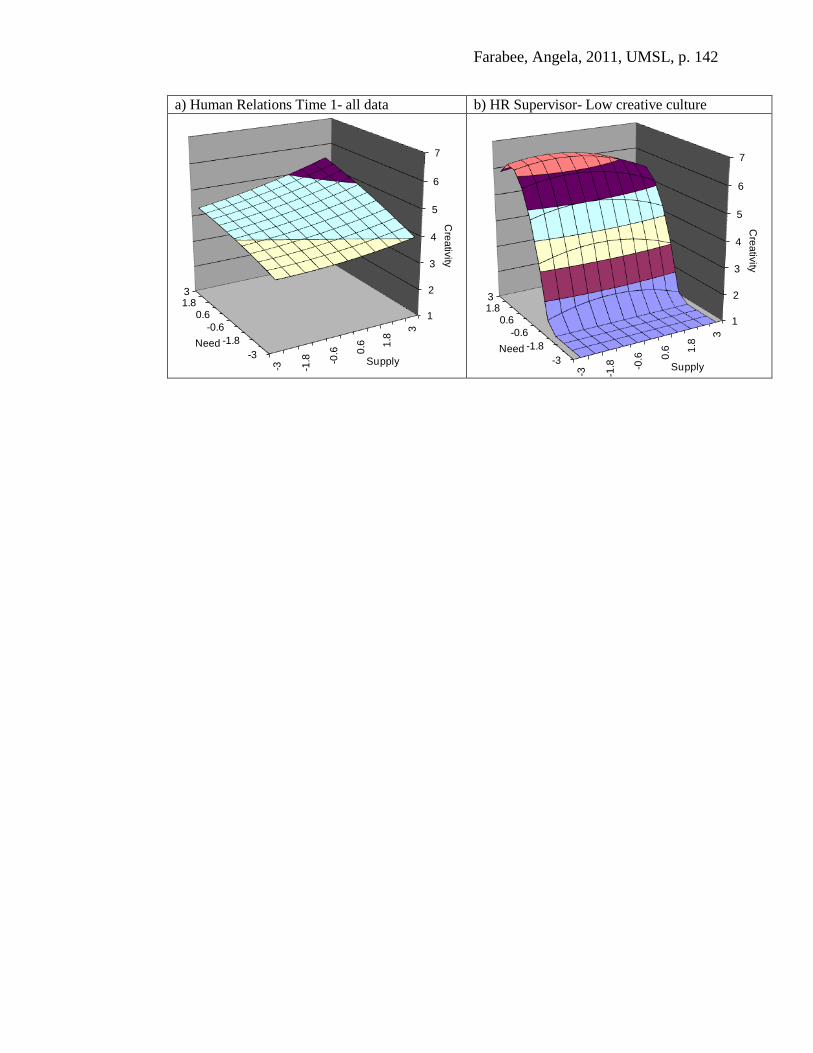
Farabee, Angela, 2011, UMSL, p. 142
a) Human Relations Time 1- all data b) HR Supervisor- Low creative culture
-3
-1.8
-0.6
0.61.83
1
2
3
4
5
6
7
-3 -1.8 -0
.6 0.6 1
.8
3
Need
Cre
ativ
itySupply -3
-1.8
-0.6
0.61.83
1
2
3
4
5
6
7
-3 -1.8 -0
.6 0.6 1
.8
3
Need
Cre
ativ
ity
Supply
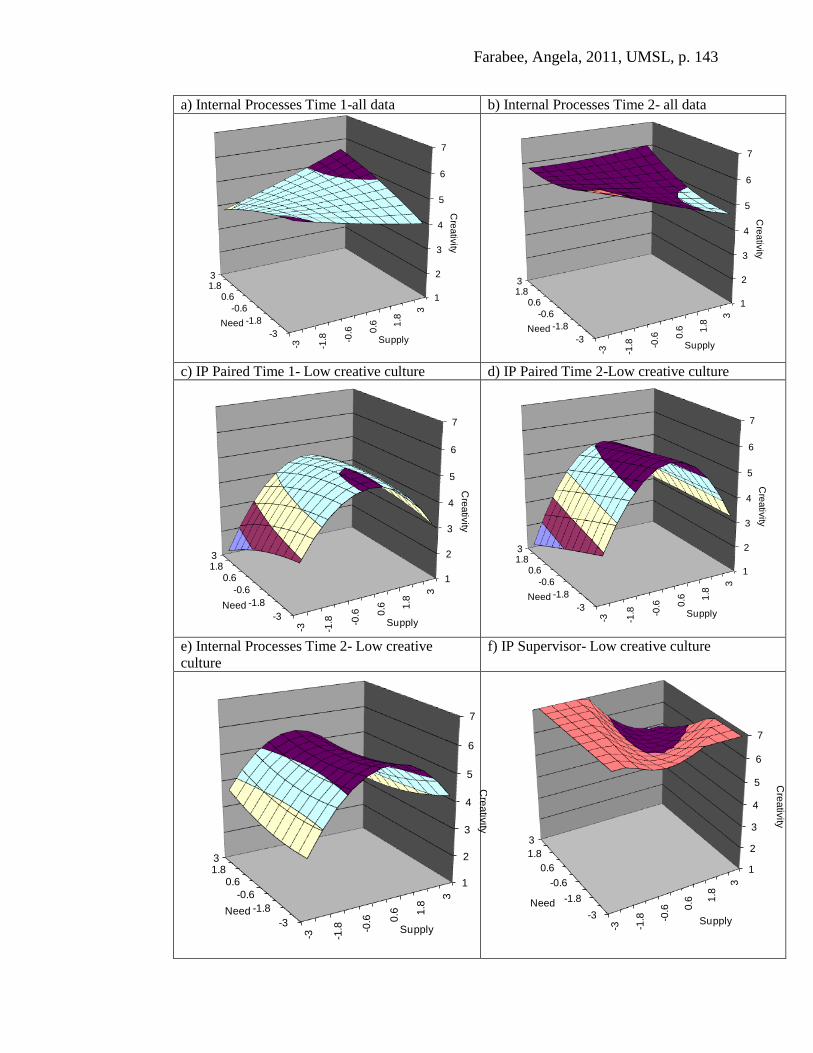
Farabee, Angela, 2011, UMSL, p. 143
a) Internal Processes Time 1-all data b) Internal Processes Time 2- all data
c) IP Paired Time 1- Low creative culture d) IP Paired Time 2-Low creative culture
e) Internal Processes Time 2- Low creative
culture
f) IP Supervisor- Low creative culture
-3
-1.8
-0.6
0.61.83
1
2
3
4
5
6
7
-3 -1.8 -0
.6 0.6 1
.8
3
Need
Cre
ativ
ity
Supply -3
-1.8
-0.6
0.61.83
1
2
3
4
5
6
7
-3 -1.8 -0
.6 0.6 1
.8
3
Need
Cre
ativ
ity
Supply
-3
-1.8
-0.6
0.61.83
1
2
3
4
5
6
7
-3 -1.8 -0
.6 0.6 1
.8
3
Need
Cre
ativ
ity
Supply
-3
-1.8
-0.6
0.61.83
1
2
3
4
5
6
7
-3 -1.8 -0
.6 0.6 1
.8
3
Need
Cre
ativ
ity
Supply
-3
-1.8
-0.6
0.61.83
1
2
3
4
5
6
7
-3 -1.8 -0
.6 0.6 1
.8
3
Need
Cre
ativ
ity
Supply
-3
-1.8
-0.6
0.6
1.8
3
1
2
3
4
5
6
7
-3 -1.8 -0
.6 0.6 1
.8
3
Need
Cre
ativ
ity
Supply
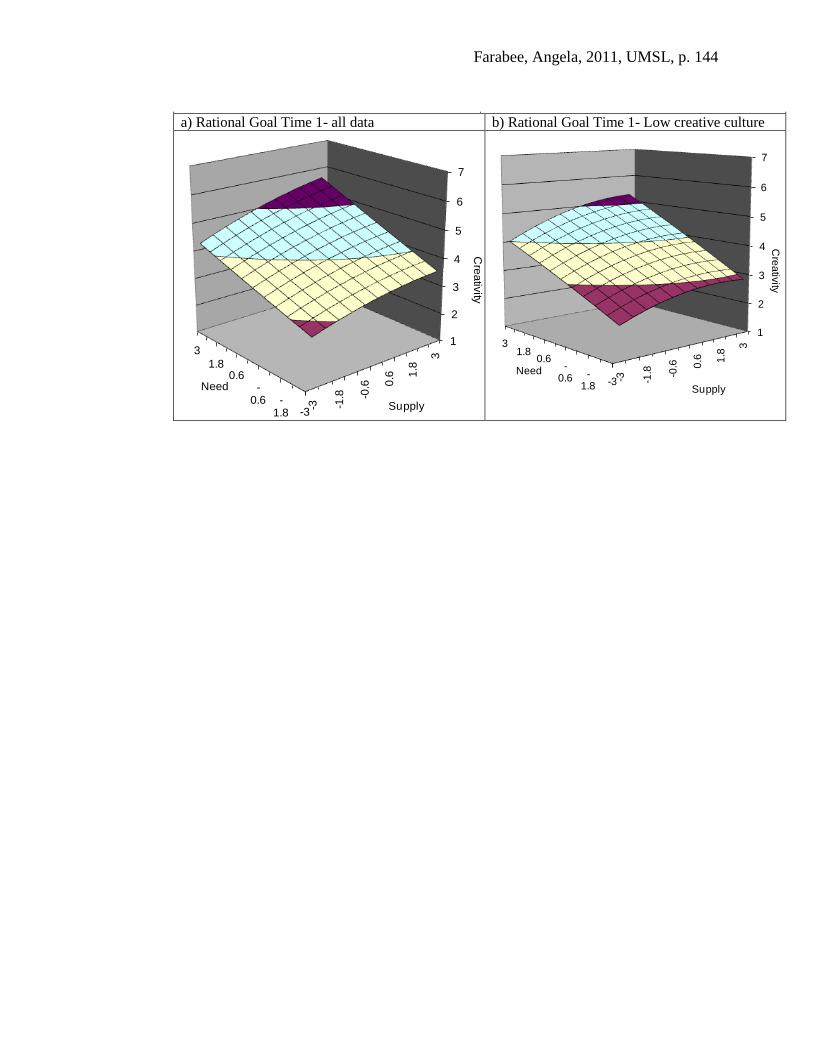
Farabee, Angela, 2011, UMSL, p. 144
a) Rational Goal Time 1- all data b) Rational Goal Time 1- Low creative culture
-3-
1.8
-0.6
0.61.8
31
2
3
4
5
6
7
-3 -1.8 -0
.6 0.6 1
.8
3
Need
Cre
ativ
ity
Supply
-3-
1.8
-0.6
0.61.8
31
2
3
4
5
6
7
-3 -1.8 -0
.6 0.6 1.8
3
Need
Cre
ativ
ity
Supply
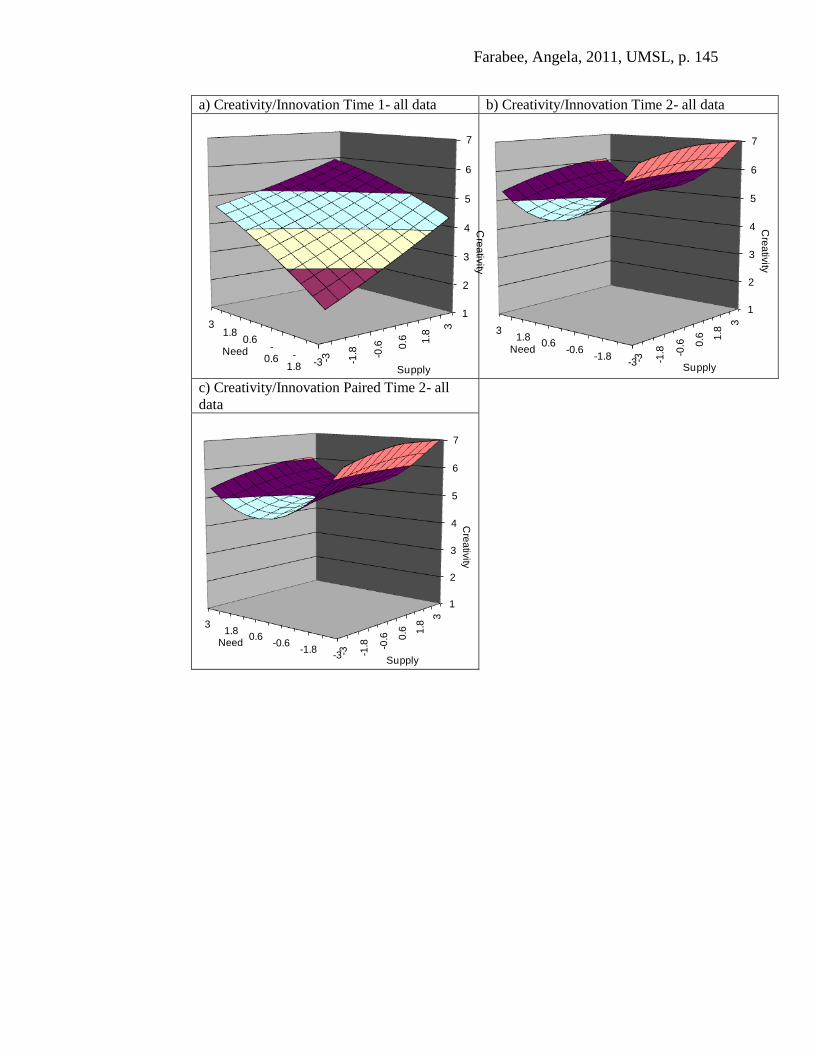
Farabee, Angela, 2011, UMSL, p. 145
a) Creativity/Innovation Time 1- all data b) Creativity/Innovation Time 2- all data
c) Creativity/Innovation Paired Time 2- all
data
-3-
1.8
-0.6
0.61.8
31
2
3
4
5
6
7
-3 -1.8 -0
.6 0.6 1.8
3
Need
Cre
ativ
ity
Supply-3
-1.8-0.6
0.61.8
3
1
2
3
4
5
6
7
-3 -1.8 -0
.6 0.6 1
.8
3
Need
Cre
ativ
ity
Supply
-3-1.8
-0.60.6
1.83
1
2
3
4
5
6
7
-3 -1.8 -0
.6 0.6 1
.8
3
Need
Cre
ativ
ity
Supply
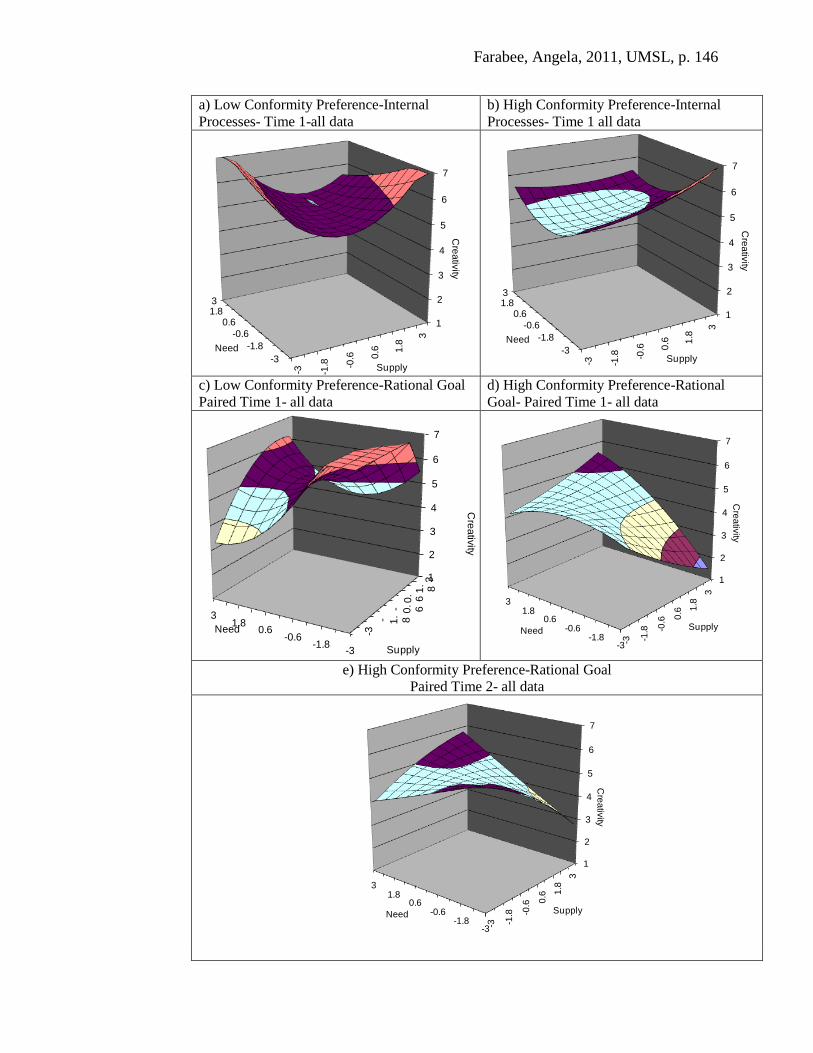
Farabee, Angela, 2011, UMSL, p. 146
a) Low Conformity Preference-Internal
Processes- Time 1-all data
b) High Conformity Preference-Internal
Processes- Time 1 all data
c) Low Conformity Preference-Rational Goal
Paired Time 1- all data
d) High Conformity Preference-Rational
Goal- Paired Time 1- all data
e) High Conformity Preference-Rational Goal
Paired Time 2- all data
-3
-1.8
-0.6
0.61.83
1
2
3
4
5
6
7
-3 -1.8 -0
.6 0.6 1
.8
3
NeedC
rea
tivity
Supply
-3
-1.8
-0.6
0.61.83
1
2
3
4
5
6
7
-3 -1.8 -0
.6 0.6 1
.8
3
Need
Cre
ativ
ity
Supply
-3-1.8
-0.60.6
1.83
1
2
3
4
5
6
7
-3
- 1. 8
- 0. 60
. 61
. 83
Need
Cre
ativ
ity
Supply-3
-1.8-0.6
0.61.8
3
1
2
3
4
5
6
7
-3 -1.8 -0
.6 0.6 1
.8
3
Need
Cre
ativ
ity
Supply
-3-1.8
-0.60.6
1.83
1
2
3
4
5
6
7
-3 -1.8 -0
.6 0.6 1
.8
3
Need
Cre
ativ
ity
Supply
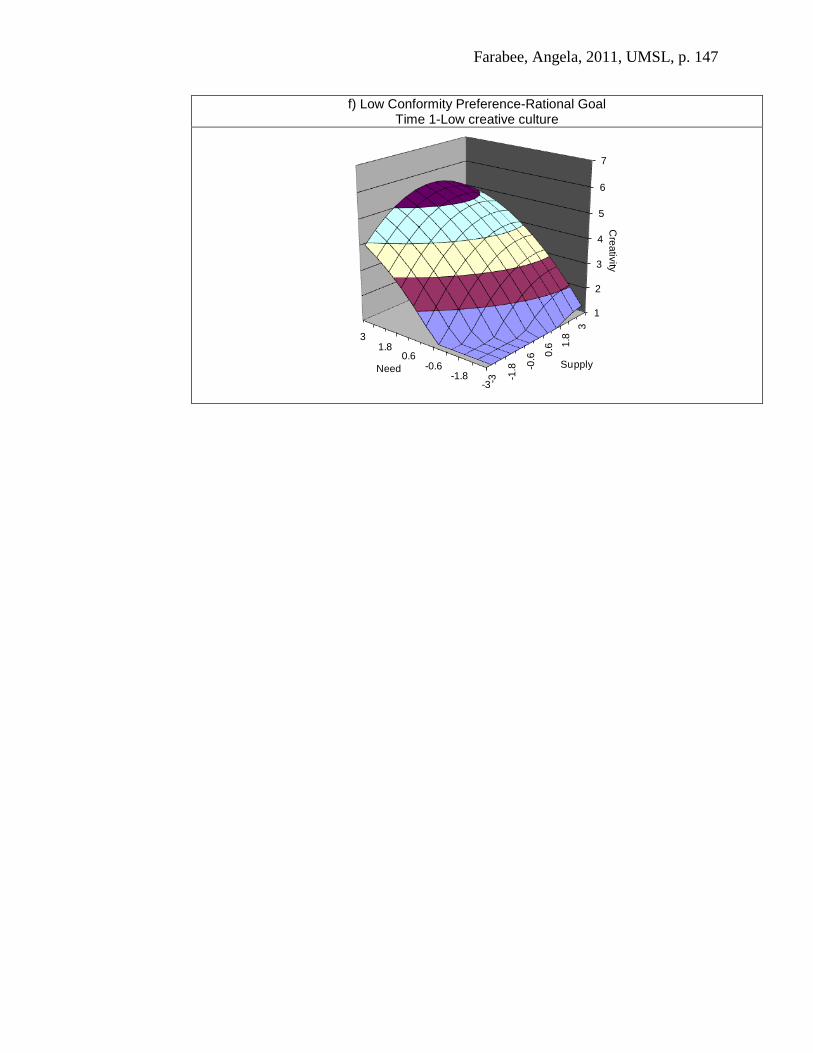
Farabee, Angela, 2011, UMSL, p. 147
f) Low Conformity Preference-Rational Goal Time 1-Low creative culture
-3-1.8
-0.60.6
1.83
1
2
3
4
5
6
7
-3 -1.8 -0
.6 0.6 1
.8
3
Need
Cre
ativ
ity
Supply
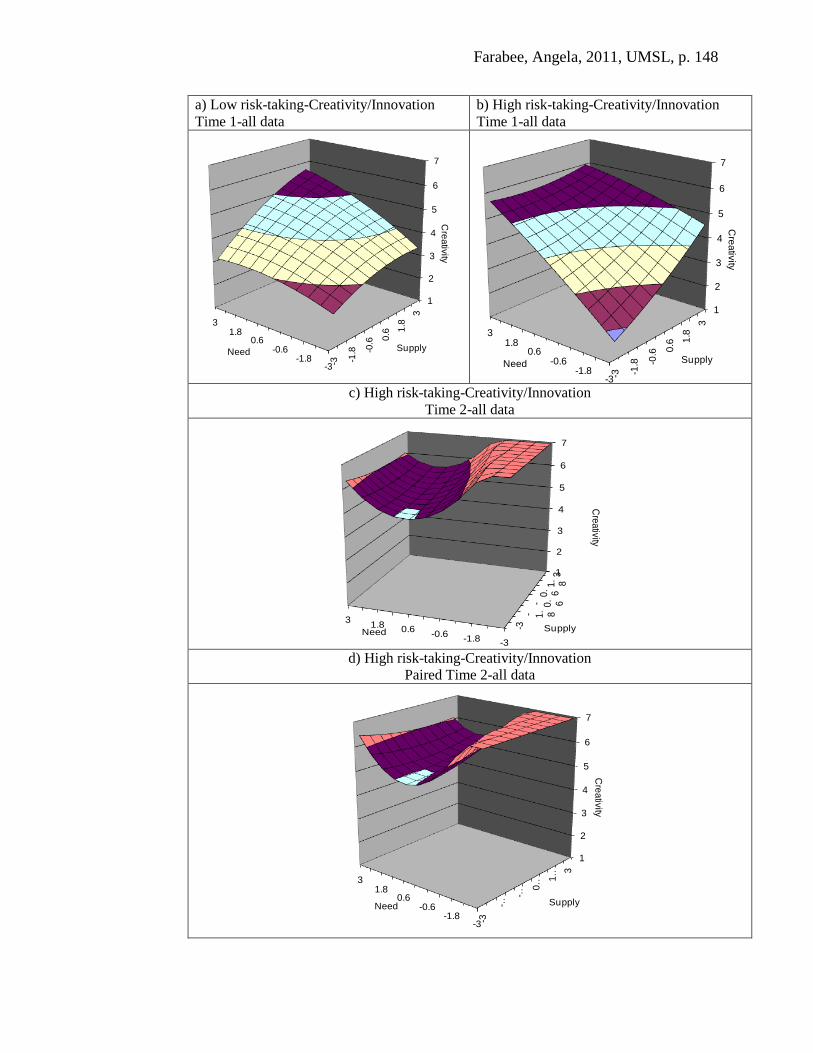
Farabee, Angela, 2011, UMSL, p. 148
a) Low risk-taking-Creativity/Innovation
Time 1-all data
b) High risk-taking-Creativity/Innovation
Time 1-all data
c) High risk-taking-Creativity/Innovation
Time 2-all data
d) High risk-taking-Creativity/Innovation
Paired Time 2-all data
-3-1.8
-0.60.6
1.83
1
2
3
4
5
6
7
-3 -1.8 -0
.6 0.6 1
.8
3
Need
Cre
ativ
ity
Supply
-3-1.8
-0.60.6
1.83
1
2
3
4
5
6
7
-3 -1.8 -0
.6 0.6 1
.8
3
Need
Cre
ativ
ity
Supply
-3-1.8-0.6
0.61.8
3
1
2
3
4
5
6
7
-3- 1. 8
- 0. 6
0. 61
. 83
Need
Cre
ativity
Supply
-3-1.8
-0.60.6
1.83
1
2
3
4
5
6
7
-3
-…
-…
0… 1
… 3
Need
Cre
ativ
ity
Supply


![NETWORKS & CREATIVITY Session Two: Conceptualizing Creativity creativity. from itskay [kala]itskay [kala]](https://img.pdfslide.us/doc/110x75/5513bb755503464b298b4703/networks-creativity-session-two-conceptualizing-creativity-creativity-from-itskay-kalaitskay-kala.jpg)