Embed Size (px)
Citation preview
PAPER www.rsc.org/softmatter | Soft Matter
Permeability of drugs and hormones through a lipid bilayer: insights fromdual-resolution molecular dynamics†
Mario Orsi and Jonathan W. Essex*
Received 20th March 2010, Accepted 21st May 2010
DOI: 10.1039/c0sm00136h
The unassisted permeation process of b-blocker drugs (alprenolol, atenolol, pindolol) and steroid
hormones (progesterone, testosterone) through a lipid membrane is simulated by a novel dual-
resolution molecular dynamics approach. The lipid and water molecules are described by simple and
efficient coarse-grain models, whereas the drug and hormone permeants are represented by traditional
atomistic models. Our hybrid method is about two orders of magnitude faster than standard atomic-
level counterparts. For each permeant, we calculate the transfer free energy as a function of depth inside
the bilayer; these data indicate the location across the membrane where the solutes preferentially
partition. Using the free energy profiles, we develop a simple expression that proves remarkably
accurate in predicting experimental permeability rankings; the proposed permeation model highlights
and addresses potentially problematic aspects of the standard solubility-diffusion theory. We also
calculate the diffusion coefficients of the permeants, and track their lateral motion to study their
diffusive patterns. Furthermore, we show the drugs’ perturbing effect on the bilayer structure and
quantify the steroids’ preferred orientations. The results obtained compare favourably with
experimental measurements and traditional atomic-level simulation data reported in the literature.
Promising potential applications of our methodology to areas such as drug design and membrane-
protein modelling are discussed.
Introduction
Passive permeation is a fundamental mechanism for the trans-
port of molecules across biological membranes. Biosystems
absorb, distribute and eliminate the majority of chemicals by
unassisted, spontaneous diffusion through phospholipid
bilayers.1 The biological importance of studying and under-
standing passive permeation is therefore evident. Moreover, such
knowledge is extremely beneficial for industrial applications in
medicinal chemistry, nanotechnology, environmental toxicology
and many other fields. Unfortunately, the mechanism of solute
permeation through membranes is difficult to study experi-
mentally, because of the small scale and complexity of lipid
bilayer systems.
Particle-based computer models represent particularly attr-
active tools to study permeation; simulations have the potential
to unveil the molecular basis of the permeability mechanism and
provide estimates of the permeability coefficient. In principle,
simulations can directly reproduce the spontaneous permeability
phenomenon. For example, using a simplified model, we have
recently been able to calculate the transmembrane permeability
coefficient of water from the direct observation of membrane
School of Chemistry, University of Southampton, Highfield, Southampton,SO17 1BJ, United Kingdom. E-mail: [email protected]; Fax:+ 44 (0)23 8059 3781; Tel: + 44 (0)23 8059 2794
† Electronic supplementary information (ESI) available: Inertial featuresof permeant molecules, examples of time evolution of constraint forces,numerical results of permeability predictor, comparison betweenpermeant free energy profiles and lateral pressure profile. See DOI:10.1039/c0sm00136h
This journal is ª The Royal Society of Chemistry 2010
crossing events over microsecond-long simulations.2,3 However,
standard atomic-level (AL) membrane simulations cannot
currently reach such a timescale, and indeed passive water
transport has never been quantified with these traditional
models. For example, in a recent state-of-the-art molecular
dynamics study,4 four phosphatidylcholine bilayers, each
comprising 128 lipids, have been simulated for 50 ns. In the four
simulations, only 2, 4, 6 and 7 crossing events of water molecules
were respectively observed; from such limited statistics, an
estimation of the permeability coefficient would not be reliable.
Moreover, for many other important solute molecules, such as
large hydrophilic drugs, the timescales required to directly
observe a statistically significant number of translocation events
are expected to be in the range of (at least) milliseconds, beyond
the capabilities of any particle-based simulation model.
Fortunately, permeation processes can still be simulated through
indirect techniques, typically involving the imposition of
constraints on the permeant; with such methods, AL molecular
dynamics simulations have indeed been successfully employed to
predict permeability coefficients and to investigate the general
permeation mechanism for several solutes.5–7 However, there is
a huge computational cost inevitably associated with the simu-
lation of traditional AL membrane models, and this negatively
affects permeability simulation studies. For example, obtaining
well-converged data is difficult. Computational issues also limit
the size of the bilayer; this can induce artefacts, especially when
large drugs are inserted into the membrane. Also, the number of
different permeants that can be investigated in a reasonable
amount of time is limited to a handful of molecules; this prevents
applications in a drug design context, where the concurrent study
Soft Matter, 2010, 6, 3797–3808 | 3797
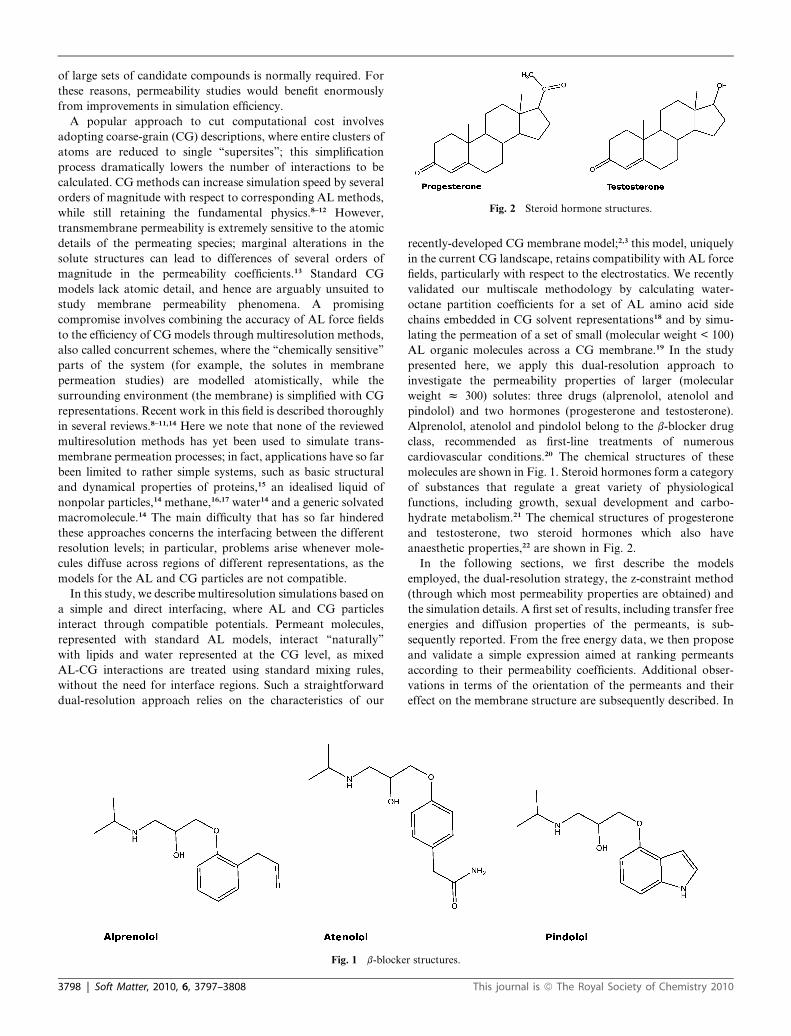
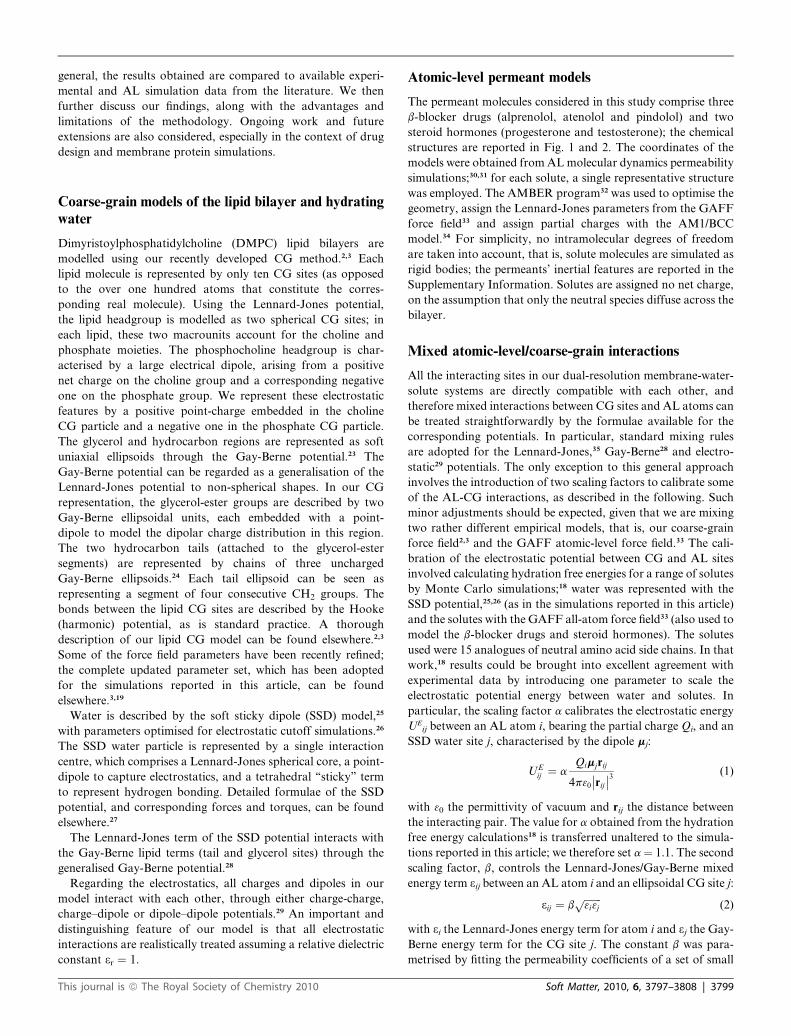
Fig. 2 Steroid hormone structures.
of large sets of candidate compounds is normally required. For
these reasons, permeability studies would benefit enormously
from improvements in simulation efficiency.
A popular approach to cut computational cost involves
adopting coarse-grain (CG) descriptions, where entire clusters of
atoms are reduced to single ‘‘supersites’’; this simplification
process dramatically lowers the number of interactions to be
calculated. CG methods can increase simulation speed by several
orders of magnitude with respect to corresponding AL methods,
while still retaining the fundamental physics.8–12 However,
transmembrane permeability is extremely sensitive to the atomic
details of the permeating species; marginal alterations in the
solute structures can lead to differences of several orders of
magnitude in the permeability coefficients.13 Standard CG
models lack atomic detail, and hence are arguably unsuited to
study membrane permeability phenomena. A promising
compromise involves combining the accuracy of AL force fields
to the efficiency of CG models through multiresolution methods,
also called concurrent schemes, where the ‘‘chemically sensitive’’
parts of the system (for example, the solutes in membrane
permeation studies) are modelled atomistically, while the
surrounding environment (the membrane) is simplified with CG
representations. Recent work in this field is described thoroughly
in several reviews.8–11,14 Here we note that none of the reviewed
multiresolution methods has yet been used to simulate trans-
membrane permeation processes; in fact, applications have so far
been limited to rather simple systems, such as basic structural
and dynamical properties of proteins,15 an idealised liquid of
nonpolar particles,14 methane,16,17 water14 and a generic solvated
macromolecule.14 The main difficulty that has so far hindered
these approaches concerns the interfacing between the different
resolution levels; in particular, problems arise whenever mole-
cules diffuse across regions of different representations, as the
models for the AL and CG particles are not compatible.
In this study, we describe multiresolution simulations based on
a simple and direct interfacing, where AL and CG particles
interact through compatible potentials. Permeant molecules,
represented with standard AL models, interact ‘‘naturally’’
with lipids and water represented at the CG level, as mixed
AL-CG interactions are treated using standard mixing rules,
without the need for interface regions. Such a straightforward
dual-resolution approach relies on the characteristics of our
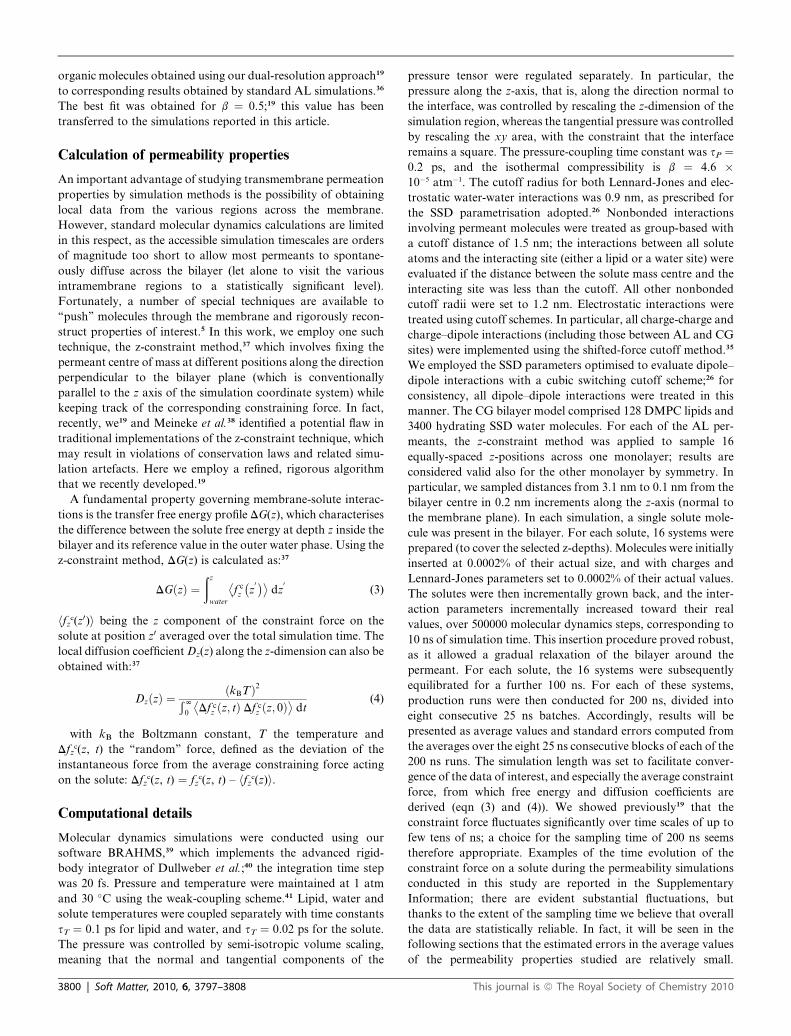
Fig. 1 b-blocke
3798 | Soft Matter, 2010, 6, 3797–3808
recently-developed CG membrane model;2,3 this model, uniquely
in the current CG landscape, retains compatibility with AL force
fields, particularly with respect to the electrostatics. We recently
validated our multiscale methodology by calculating water-
octane partition coefficients for a set of AL amino acid side
chains embedded in CG solvent representations18 and by simu-
lating the permeation of a set of small (molecular weight < 100)
AL organic molecules across a CG membrane.19 In the study
presented here, we apply this dual-resolution approach to
investigate the permeability properties of larger (molecular
weight z 300) solutes: three drugs (alprenolol, atenolol and
pindolol) and two hormones (progesterone and testosterone).
Alprenolol, atenolol and pindolol belong to the b-blocker drug
class, recommended as first-line treatments of numerous
cardiovascular conditions.20 The chemical structures of these
molecules are shown in Fig. 1. Steroid hormones form a category
of substances that regulate a great variety of physiological
functions, including growth, sexual development and carbo-
hydrate metabolism.21 The chemical structures of progesterone
and testosterone, two steroid hormones which also have
anaesthetic properties,22 are shown in Fig. 2.
In the following sections, we first describe the models
employed, the dual-resolution strategy, the z-constraint method
(through which most permeability properties are obtained) and
the simulation details. A first set of results, including transfer free
energies and diffusion properties of the permeants, is sub-
sequently reported. From the free energy data, we then propose
and validate a simple expression aimed at ranking permeants
according to their permeability coefficients. Additional obser-
vations in terms of the orientation of the permeants and their
effect on the membrane structure are subsequently described. In
r structures.
This journal is ª The Royal Society of Chemistry 2010
general, the results obtained are compared to available experi-
mental and AL simulation data from the literature. We then
further discuss our findings, along with the advantages and
limitations of the methodology. Ongoing work and future
extensions are also considered, especially in the context of drug
design and membrane protein simulations.
Coarse-grain models of the lipid bilayer and hydratingwater
Dimyristoylphosphatidylcholine (DMPC) lipid bilayers are
modelled using our recently developed CG method.2,3 Each
lipid molecule is represented by only ten CG sites (as opposed
to the over one hundred atoms that constitute the corres-
ponding real molecule). Using the Lennard-Jones potential,
the lipid headgroup is modelled as two spherical CG sites; in
each lipid, these two macrounits account for the choline and
phosphate moieties. The phosphocholine headgroup is char-
acterised by a large electrical dipole, arising from a positive
net charge on the choline group and a corresponding negative
one on the phosphate group. We represent these electrostatic
features by a positive point-charge embedded in the choline
CG particle and a negative one in the phosphate CG particle.
The glycerol and hydrocarbon regions are represented as soft
uniaxial ellipsoids through the Gay-Berne potential.23 The
Gay-Berne potential can be regarded as a generalisation of the
Lennard-Jones potential to non-spherical shapes. In our CG
representation, the glycerol-ester groups are described by two
Gay-Berne ellipsoidal units, each embedded with a point-
dipole to model the dipolar charge distribution in this region.
The two hydrocarbon tails (attached to the glycerol-ester
segments) are represented by chains of three uncharged
Gay-Berne ellipsoids.24 Each tail ellipsoid can be seen as
representing a segment of four consecutive CH2 groups. The
bonds between the lipid CG sites are described by the Hooke
(harmonic) potential, as is standard practice. A thorough
description of our lipid CG model can be found elsewhere.2,3
Some of the force field parameters have been recently refined;
the complete updated parameter set, which has been adopted
for the simulations reported in this article, can be found
elsewhere.3,19
Water is described by the soft sticky dipole (SSD) model,25
with parameters optimised for electrostatic cutoff simulations.26
The SSD water particle is represented by a single interaction
centre, which comprises a Lennard-Jones spherical core, a point-
dipole to capture electrostatics, and a tetrahedral ‘‘sticky’’ term
to represent hydrogen bonding. Detailed formulae of the SSD
potential, and corresponding forces and torques, can be found
elsewhere.27
The Lennard-Jones term of the SSD potential interacts with
the Gay-Berne lipid terms (tail and glycerol sites) through the
generalised Gay-Berne potential.28
Regarding the electrostatics, all charges and dipoles in our
model interact with each other, through either charge-charge,
charge–dipole or dipole–dipole potentials.29 An important and
distinguishing feature of our model is that all electrostatic
interactions are realistically treated assuming a relative dielectric
constant 3r ¼ 1.
This journal is ª The Royal Society of Chemistry 2010
Atomic-level permeant models
The permeant molecules considered in this study comprise three
b-blocker drugs (alprenolol, atenolol and pindolol) and two
steroid hormones (progesterone and testosterone); the chemical
structures are reported in Fig. 1 and 2. The coordinates of the
models were obtained from AL molecular dynamics permeability
simulations;30,31 for each solute, a single representative structure
was employed. The AMBER program32 was used to optimise the
geometry, assign the Lennard-Jones parameters from the GAFF
force field33 and assign partial charges with the AM1/BCC
model.34 For simplicity, no intramolecular degrees of freedom
are taken into account, that is, solute molecules are simulated as
rigid bodies; the permeants’ inertial features are reported in the
Supplementary Information. Solutes are assigned no net charge,
on the assumption that only the neutral species diffuse across the
bilayer.
Mixed atomic-level/coarse-grain interactions
All the interacting sites in our dual-resolution membrane-water-
solute systems are directly compatible with each other, and
therefore mixed interactions between CG sites and AL atoms can
be treated straightforwardly by the formulae available for the
corresponding potentials. In particular, standard mixing rules
are adopted for the Lennard-Jones,35 Gay-Berne28 and electro-
static29 potentials. The only exception to this general approach
involves the introduction of two scaling factors to calibrate some
of the AL-CG interactions, as described in the following. Such
minor adjustments should be expected, given that we are mixing
two rather different empirical models, that is, our coarse-grain
force field2,3 and the GAFF atomic-level force field.33 The cali-
bration of the electrostatic potential between CG and AL sites
involved calculating hydration free energies for a range of solutes
by Monte Carlo simulations;18 water was represented with the
SSD potential,25,26 (as in the simulations reported in this article)
and the solutes with the GAFF all-atom force field33 (also used to
model the b-blocker drugs and steroid hormones). The solutes
used were 15 analogues of neutral amino acid side chains. In that
work,18 results could be brought into excellent agreement with
experimental data by introducing one parameter to scale the
electrostatic potential energy between water and solutes. In
particular, the scaling factor a calibrates the electrostatic energy
UEij between an AL atom i, bearing the partial charge Qi, and an
SSD water site j, characterised by the dipole mj:
UEij ¼ a
Qimjrij
4p30
��rij
��3 (1)
with 30 the permittivity of vacuum and rij the distance between
the interacting pair. The value for a obtained from the hydration
free energy calculations18 is transferred unaltered to the simula-
tions reported in this article; we therefore set a¼ 1.1. The second
scaling factor, b, controls the Lennard-Jones/Gay-Berne mixed
energy term 3ij between an AL atom i and an ellipsoidal CG site j:
3ij ¼ bffiffiffiffiffiffiffi3i3j
p(2)
with 3i the Lennard-Jones energy term for atom i and 3j the Gay-
Berne energy term for the CG site j. The constant b was para-
metrised by fitting the permeability coefficients of a set of small
Soft Matter, 2010, 6, 3797–3808 | 3799
organic molecules obtained using our dual-resolution approach19
to corresponding results obtained by standard AL simulations.36
The best fit was obtained for b ¼ 0.5;19 this value has been
transferred to the simulations reported in this article.
Calculation of permeability properties
An important advantage of studying transmembrane permeation
properties by simulation methods is the possibility of obtaining
local data from the various regions across the membrane.
However, standard molecular dynamics calculations are limited
in this respect, as the accessible simulation timescales are orders
of magnitude too short to allow most permeants to spontane-
ously diffuse across the bilayer (let alone to visit the various
intramembrane regions to a statistically significant level).
Fortunately, a number of special techniques are available to
‘‘push’’ molecules through the membrane and rigorously recon-
struct properties of interest.5 In this work, we employ one such
technique, the z-constraint method,37 which involves fixing the
permeant centre of mass at different positions along the direction
perpendicular to the bilayer plane (which is conventionally
parallel to the z axis of the simulation coordinate system) while
keeping track of the corresponding constraining force. In fact,
recently, we19 and Meineke et al.38 identified a potential flaw in
traditional implementations of the z-constraint technique, which
may result in violations of conservation laws and related simu-
lation artefacts. Here we employ a refined, rigorous algorithm
that we recently developed.19
A fundamental property governing membrane-solute interac-
tions is the transfer free energy profile DG(z), which characterises
the difference between the solute free energy at depth z inside the
bilayer and its reference value in the outer water phase. Using the
z-constraint method, DG(z) is calculated as:37
DGðzÞ ¼ðz
water
�f c
z
�z0��
dz0
(3)
hfzc(z0)i being the z component of the constraint force on the
solute at position z0 averaged over the total simulation time. The
local diffusion coefficient Dz(z) along the z-dimension can also be
obtained with:37
DzðzÞ ¼ðkBTÞ2ÐN
0
�Df c
z ðz; tÞ Df cz ðz; 0Þ
�dt
(4)
with kB the Boltzmann constant, T the temperature and
Dfzc(z, t) the ‘‘random’’ force, defined as the deviation of the
instantaneous force from the average constraining force acting
on the solute: Dfzc(z, t) ¼ fz
c(z, t) – hfzc(z)i.
Computational details
Molecular dynamics simulations were conducted using our
software BRAHMS,39 which implements the advanced rigid-
body integrator of Dullweber et al.;40 the integration time step
was 20 fs. Pressure and temperature were maintained at 1 atm
and 30 �C using the weak-coupling scheme.41 Lipid, water and
solute temperatures were coupled separately with time constants
sT ¼ 0.1 ps for lipid and water, and sT ¼ 0.02 ps for the solute.
The pressure was controlled by semi-isotropic volume scaling,
meaning that the normal and tangential components of the
3800 | Soft Matter, 2010, 6, 3797–3808
pressure tensor were regulated separately. In particular, the
pressure along the z-axis, that is, along the direction normal to
the interface, was controlled by rescaling the z-dimension of the
simulation region, whereas the tangential pressure was controlled
by rescaling the xy area, with the constraint that the interface
remains a square. The pressure-coupling time constant was sP ¼0.2 ps, and the isothermal compressibility is b ¼ 4.6 �10�5 atm�1. The cutoff radius for both Lennard-Jones and elec-
trostatic water-water interactions was 0.9 nm, as prescribed for
the SSD parametrisation adopted.26 Nonbonded interactions
involving permeant molecules were treated as group-based with
a cutoff distance of 1.5 nm; the interactions between all solute
atoms and the interacting site (either a lipid or a water site) were
evaluated if the distance between the solute mass centre and the
interacting site was less than the cutoff. All other nonbonded
cutoff radii were set to 1.2 nm. Electrostatic interactions were
treated using cutoff schemes. In particular, all charge-charge and
charge–dipole interactions (including those between AL and CG
sites) were implemented using the shifted-force cutoff method.35
We employed the SSD parameters optimised to evaluate dipole–
dipole interactions with a cubic switching cutoff scheme;26 for
consistency, all dipole–dipole interactions were treated in this
manner. The CG bilayer model comprised 128 DMPC lipids and
3400 hydrating SSD water molecules. For each of the AL per-
meants, the z-constraint method was applied to sample 16
equally-spaced z-positions across one monolayer; results are
considered valid also for the other monolayer by symmetry. In
particular, we sampled distances from 3.1 nm to 0.1 nm from the
bilayer centre in 0.2 nm increments along the z-axis (normal to
the membrane plane). In each simulation, a single solute mole-
cule was present in the bilayer. For each solute, 16 systems were
prepared (to cover the selected z-depths). Molecules were initially
inserted at 0.0002% of their actual size, and with charges and
Lennard-Jones parameters set to 0.0002% of their actual values.
The solutes were then incrementally grown back, and the inter-
action parameters incrementally increased toward their real
values, over 500000 molecular dynamics steps, corresponding to
10 ns of simulation time. This insertion procedure proved robust,
as it allowed a gradual relaxation of the bilayer around the
permeant. For each solute, the 16 systems were subsequently
equilibrated for a further 100 ns. For each of these systems,
production runs were then conducted for 200 ns, divided into
eight consecutive 25 ns batches. Accordingly, results will be
presented as average values and standard errors computed from
the averages over the eight 25 ns consecutive blocks of each of the
200 ns runs. The simulation length was set to facilitate conver-
gence of the data of interest, and especially the average constraint
force, from which free energy and diffusion coefficients are
derived (eqn (3) and (4)). We showed previously19 that the
constraint force fluctuates significantly over time scales of up to
few tens of ns; a choice for the sampling time of 200 ns seems
therefore appropriate. Examples of the time evolution of the
constraint force on a solute during the permeability simulations
conducted in this study are reported in the Supplementary
Information; there are evident substantial fluctuations, but
thanks to the extent of the sampling time we believe that overall
the data are statistically reliable. In fact, it will be seen in the
following sections that the estimated errors in the average values
of the permeability properties studied are relatively small.
This journal is ª The Royal Society of Chemistry 2010
Incidentally, the sampling time attainable by standard atomistic
permeability simulations5,30,36,42 is typically 1–2 orders of magni-
tude shorter than that achieved here by our dual-resolution
technique. All simulations could be run almost concurrently on
a supercomputer43 in a coarsely parallel fashion, meaning that
each (independent) constraint simulation ran on a different
processor. The entire set of calculations, totalling z 25 ms of
simulation time, could be completed in about one month.
Transfer free energies
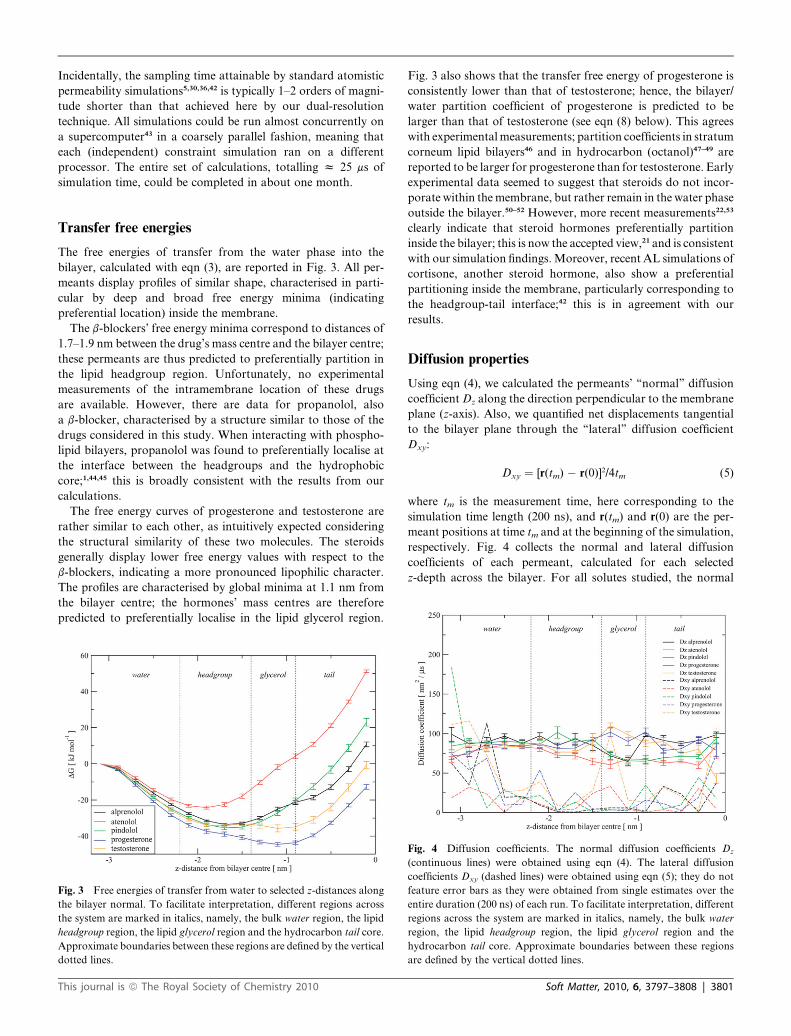
The free energies of transfer from the water phase into the
bilayer, calculated with eqn (3), are reported in Fig. 3. All per-
meants display profiles of similar shape, characterised in parti-
cular by deep and broad free energy minima (indicating
preferential location) inside the membrane.
The b-blockers’ free energy minima correspond to distances of
1.7–1.9 nm between the drug’s mass centre and the bilayer centre;
these permeants are thus predicted to preferentially partition in
the lipid headgroup region. Unfortunately, no experimental
measurements of the intramembrane location of these drugs
are available. However, there are data for propanolol, also
a b-blocker, characterised by a structure similar to those of the
drugs considered in this study. When interacting with phospho-
lipid bilayers, propanolol was found to preferentially localise at
the interface between the headgroups and the hydrophobic
core;1,44,45 this is broadly consistent with the results from our
calculations.
The free energy curves of progesterone and testosterone are
rather similar to each other, as intuitively expected considering
the structural similarity of these two molecules. The steroids
generally display lower free energy values with respect to the
b-blockers, indicating a more pronounced lipophilic character.
The profiles are characterised by global minima at 1.1 nm from
the bilayer centre; the hormones’ mass centres are therefore
predicted to preferentially localise in the lipid glycerol region.
Fig. 3 Free energies of transfer from water to selected z-distances along
the bilayer normal. To facilitate interpretation, different regions across
the system are marked in italics, namely, the bulk water region, the lipid
headgroup region, the lipid glycerol region and the hydrocarbon tail core.
Approximate boundaries between these regions are defined by the vertical
dotted lines.
This journal is ª The Royal Society of Chemistry 2010
Fig. 3 also shows that the transfer free energy of progesterone is
consistently lower than that of testosterone; hence, the bilayer/
water partition coefficient of progesterone is predicted to be
larger than that of testosterone (see eqn (8) below). This agrees
with experimental measurements; partition coefficients in stratum
corneum lipid bilayers46 and in hydrocarbon (octanol)47–49 are
reported to be larger for progesterone than for testosterone. Early
experimental data seemed to suggest that steroids do not incor-
porate within the membrane, but rather remain in the water phase
outside the bilayer.50–52 However, more recent measurements22,53
clearly indicate that steroid hormones preferentially partition
inside the bilayer; this is now the accepted view,21 and is consistent
with our simulation findings. Moreover, recent AL simulations of
cortisone, another steroid hormone, also show a preferential
partitioning inside the membrane, particularly corresponding to
the headgroup-tail interface;42 this is in agreement with our
results.
Diffusion properties
Using eqn (4), we calculated the permeants’ ‘‘normal’’ diffusion
coefficient Dz along the direction perpendicular to the membrane
plane (z-axis). Also, we quantified net displacements tangential
to the bilayer plane through the ‘‘lateral’’ diffusion coefficient
Dxy:
Dxy ¼ [r(tm) � r(0)]2/4tm (5)
where tm is the measurement time, here corresponding to the
simulation time length (200 ns), and r(tm) and r(0) are the per-
meant positions at time tm and at the beginning of the simulation,
respectively. Fig. 4 collects the normal and lateral diffusion
coefficients of each permeant, calculated for each selected
z-depth across the bilayer. For all solutes studied, the normal
Fig. 4 Diffusion coefficients. The normal diffusion coefficients Dz
(continuous lines) were obtained using eqn (4). The lateral diffusion
coefficients Dxy (dashed lines) were obtained using eqn (5); they do not
feature error bars as they were obtained from single estimates over the
entire duration (200 ns) of each run. To facilitate interpretation, different
regions across the system are marked in italics, namely, the bulk water
region, the lipid headgroup region, the lipid glycerol region and the
hydrocarbon tail core. Approximate boundaries between these regions
are defined by the vertical dotted lines.
Soft Matter, 2010, 6, 3797–3808 | 3801
diffusion coefficients display relatively constant values across the
bilayer; in particular, Dz coefficients are z 50–100 nm2/ms,
irrespective of the location across the bilayer. The diffusion
coefficients obtained in this study are generally lower than those
calculated in previous simulations of small (molecular weight <
100) molecules.19,36,37,54,55 This is expected, considering the larger
size (molecular weight z 300) of the permeants simulated in this
study. Also, small molecules can display enhanced diffusion in
the bilayer centre;19,37,54,55 this effect is typically ascribed to their
increased ability to jump between enlarged free volume pockets
present in the middle of the bilayer (the lowest-density region of
the system). Such a phenomenon is not observed for the (larger)
permeants studied here; it can be argued that these molecules are
not small enough to experience enhanced diffusion in the lipid
core. A similar conclusion was reached by Alper and Stouch56 on
the basis of their simulation data for benzene (a small molecule)
and a large nifedipine drug analogue (molecular weight z 300);
benzene displayed enhanced diffusion in the bilayer centre,
a phenomenon ascribed to a ‘‘hole-jumping’’ mechanism,
whereas the nifedipine drug was characterised by position-
independent diffusion rates.56
Regarding the lateral diffusion coefficients Dxy, it can be seen
that they tend to be lower than the normal diffusion coefficients
Dz, especially when permeants are constrained inside the
membrane. This effect can be rationalised considering that lipid
molecules, despite their high degree of conformational disorder,
are on average oriented and stretched along the normal axis.
Pockets of free-volume through which permeants diffuse are then
also likely to be elongated and preferentially oriented along the z
normal axis, thus favouring faster rates of diffusion along z.
Moreover, we should stress that the calculated Dxy do not
correspond to the lateral component of ‘‘free’’ diffusing particles,
but instead to that of molecules forced to remain in a particular
plane. ‘‘Real’’ lateral diffusion coefficients might well be higher
(hence more consistent with the normal coefficients), because
lateral displacements of free particles should be facilitated
compared to particles constrained to a particular depth. The
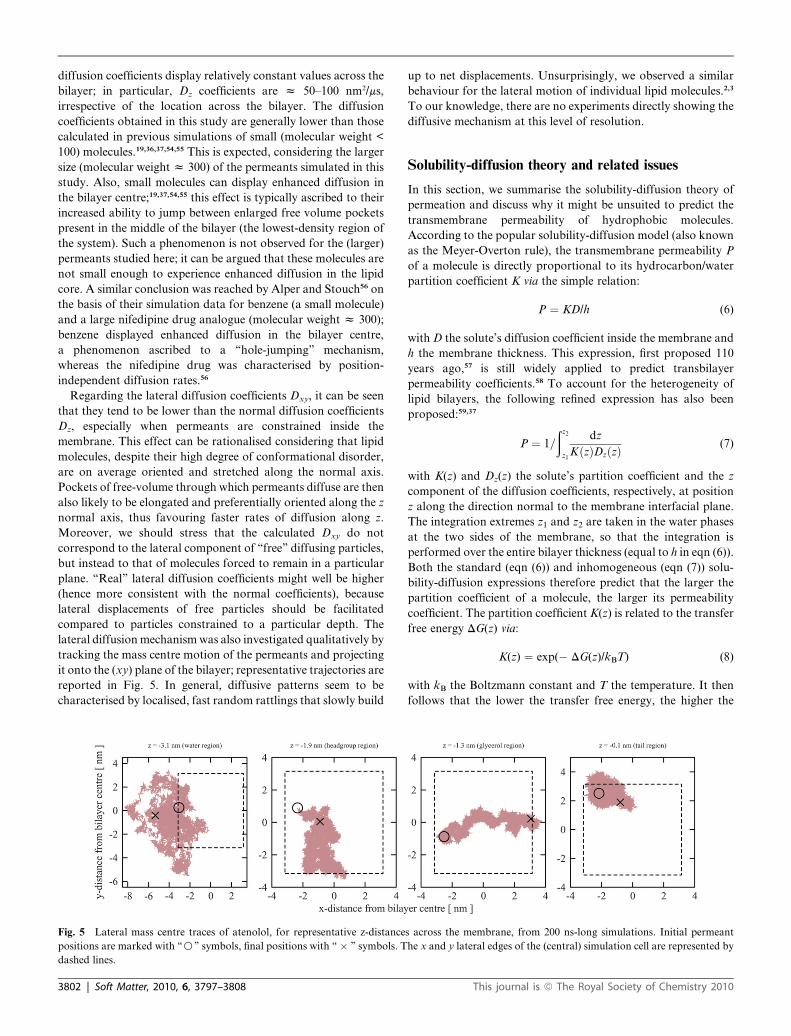
lateral diffusion mechanism was also investigated qualitatively by
tracking the mass centre motion of the permeants and projecting
it onto the (xy) plane of the bilayer; representative trajectories are
reported in Fig. 5. In general, diffusive patterns seem to be
characterised by localised, fast random rattlings that slowly build
Fig. 5 Lateral mass centre traces of atenolol, for representative z-distance
positions are marked with ‘‘B’’ symbols, final positions with ‘‘ � ’’ symbols. T
dashed lines.
3802 | Soft Matter, 2010, 6, 3797–3808
up to net displacements. Unsurprisingly, we observed a similar
behaviour for the lateral motion of individual lipid molecules.2,3
To our knowledge, there are no experiments directly showing the
diffusive mechanism at this level of resolution.
Solubility-diffusion theory and related issues
In this section, we summarise the solubility-diffusion theory of
permeation and discuss why it might be unsuited to predict the
transmembrane permeability of hydrophobic molecules.
According to the popular solubility-diffusion model (also known
as the Meyer-Overton rule), the transmembrane permeability P
of a molecule is directly proportional to its hydrocarbon/water
partition coefficient K via the simple relation:
P ¼ KD/h (6)
with D the solute’s diffusion coefficient inside the membrane and
h the membrane thickness. This expression, first proposed 110
years ago,57 is still widely applied to predict transbilayer
permeability coefficients.58 To account for the heterogeneity of
lipid bilayers, the following refined expression has also been
proposed:59,37
P ¼ 1=
ðz2
z1
dz
KðzÞDzðzÞ(7)
with K(z) and Dz(z) the solute’s partition coefficient and the z
component of the diffusion coefficients, respectively, at position
z along the direction normal to the membrane interfacial plane.
The integration extremes z1 and z2 are taken in the water phases
at the two sides of the membrane, so that the integration is
performed over the entire bilayer thickness (equal to h in eqn (6)).
Both the standard (eqn (6)) and inhomogeneous (eqn (7)) solu-
bility-diffusion expressions therefore predict that the larger the
partition coefficient of a molecule, the larger its permeability
coefficient. The partition coefficient K(z) is related to the transfer
free energy DG(z) via:
K(z) ¼ exp(� DG(z)/kBT) (8)
with kB the Boltzmann constant and T the temperature. It then
follows that the lower the transfer free energy, the higher the
s across the membrane, from 200 ns-long simulations. Initial permeant
he x and y lateral edges of the (central) simulation cell are represented by
This journal is ª The Royal Society of Chemistry 2010
permeability coefficient will be (and vice versa). This is evidently
correct for permeants whose transfer free energy profiles are
characterised by ‘‘barrier’’ regions (normally, the hydrocarbon
core) of large positive values; for example, this is a typical case
for hydrophilic compounds. However, the transfer free energy
profiles of hydrophobic solutes can be mostly negative, and
particularly it can be characterised by deep negative minima
inside the bilayer (as exemplified in Fig. 3 for the permeants
studied here). For such solutes, the solubility-diffusion theory
would then predict large permeability values. However, it is
physically intuitive that deep negative free energy minima (like
those observed in this study) act as ‘‘traps’’ where permeants are
likely to accumulate; in such cases, the overall transmembrane
permeability rate is expected to decrease substantially. Therefore,
for hydrophobic molecules the solubility-diffusion model is
arguably unsuited to predict transmembrane permeability
coefficients. Interestingly, the general validity of the solubility-
diffusion model has recently been questioned also by Grime
et al.,60 who found experimentally that the permeability coeffi-
cient of a series of aliphatic (hydrophobic) weak acids decreased
with increasing hydrocarbon/water partition coefficient, in
striking contradiction with the Meyer-Overton rule (eqn (6)). It is
possible that these molecules fit into the scenario we depicted
above for hydrophobic permeants; the larger the partition
coefficient, the deeper the free energy ‘‘traps’’ inside the bilayer,
and ultimately the smaller the permeability.
These issues stimulated us to develop a new expression,
presented in the next section, aimed at estimating permeability
rankings within series of compounds. As will be seen, this new
simple model builds on the solubility-diffusion theory in that
positive free energy maxima retain their permeability barrier
effect; however, the model addresses the controversy involving
hydrophobic permeants by treating transfer free energy minima
as obstacles to permeation.
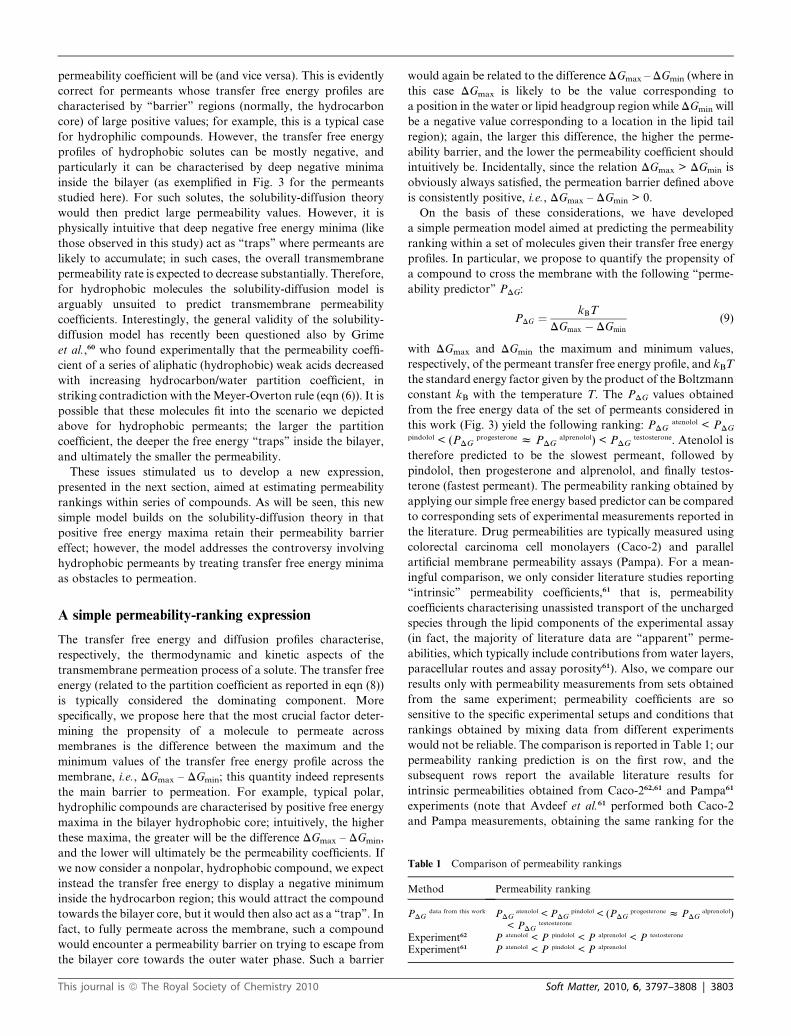
Table 1 Comparison of permeability rankings
Method Permeability ranking
PDGdata from this work PDG
atenolol < PDGpindolol < (PDG
progesterone z PDGalprenolol)
< PDGtestosterone
Experiment62 P atenolol < P pindolol < P alprenolol < P testosterone
Experiment61 P atenolol < P pindolol < P alprenolol
A simple permeability-ranking expression
The transfer free energy and diffusion profiles characterise,
respectively, the thermodynamic and kinetic aspects of the
transmembrane permeation process of a solute. The transfer free
energy (related to the partition coefficient as reported in eqn (8))
is typically considered the dominating component. More
specifically, we propose here that the most crucial factor deter-
mining the propensity of a molecule to permeate across
membranes is the difference between the maximum and the
minimum values of the transfer free energy profile across the
membrane, i.e., DGmax – DGmin; this quantity indeed represents
the main barrier to permeation. For example, typical polar,
hydrophilic compounds are characterised by positive free energy
maxima in the bilayer hydrophobic core; intuitively, the higher
these maxima, the greater will be the difference DGmax – DGmin,
and the lower will ultimately be the permeability coefficients. If
we now consider a nonpolar, hydrophobic compound, we expect
instead the transfer free energy to display a negative minimum
inside the hydrocarbon region; this would attract the compound
towards the bilayer core, but it would then also act as a ‘‘trap’’. In
fact, to fully permeate across the membrane, such a compound
would encounter a permeability barrier on trying to escape from
the bilayer core towards the outer water phase. Such a barrier
This journal is ª The Royal Society of Chemistry 2010
would again be related to the difference DGmax – DGmin (where in
this case DGmax is likely to be the value corresponding to
a position in the water or lipid headgroup region while DGmin will
be a negative value corresponding to a location in the lipid tail
region); again, the larger this difference, the higher the perme-
ability barrier, and the lower the permeability coefficient should
intuitively be. Incidentally, since the relation DGmax > DGmin is
obviously always satisfied, the permeation barrier defined above
is consistently positive, i.e., DGmax – DGmin > 0.
On the basis of these considerations, we have developed
a simple permeation model aimed at predicting the permeability
ranking within a set of molecules given their transfer free energy
profiles. In particular, we propose to quantify the propensity of
a compound to cross the membrane with the following ‘‘perme-
ability predictor’’ PDG:
PDG ¼kBT
DGmax � DGmin
(9)
with DGmax and DGmin the maximum and minimum values,
respectively, of the permeant transfer free energy profile, and kBT
the standard energy factor given by the product of the Boltzmann
constant kB with the temperature T. The PDG values obtained
from the free energy data of the set of permeants considered in
this work (Fig. 3) yield the following ranking: PDGatenolol < PDG
pindolol < (PDGprogesterone z PDG
alprenolol) < PDGtestosterone. Atenolol is
therefore predicted to be the slowest permeant, followed by
pindolol, then progesterone and alprenolol, and finally testos-
terone (fastest permeant). The permeability ranking obtained by
applying our simple free energy based predictor can be compared
to corresponding sets of experimental measurements reported in
the literature. Drug permeabilities are typically measured using
colorectal carcinoma cell monolayers (Caco-2) and parallel
artificial membrane permeability assays (Pampa). For a mean-
ingful comparison, we only consider literature studies reporting
‘‘intrinsic’’ permeability coefficients,61 that is, permeability
coefficients characterising unassisted transport of the uncharged
species through the lipid components of the experimental assay
(in fact, the majority of literature data are ‘‘apparent’’ perme-
abilities, which typically include contributions from water layers,
paracellular routes and assay porosity61). Also, we compare our
results only with permeability measurements from sets obtained
from the same experiment; permeability coefficients are so
sensitive to the specific experimental setups and conditions that
rankings obtained by mixing data from different experiments
would not be reliable. The comparison is reported in Table 1; our
permeability ranking prediction is on the first row, and the
subsequent rows report the available literature results for
intrinsic permeabilities obtained from Caco-262,61 and Pampa61
experiments (note that Avdeef et al.61 performed both Caco-2
and Pampa measurements, obtaining the same ranking for the
Soft Matter, 2010, 6, 3797–3808 | 3803
three drugs considered in our study). It can be seen that our
simple permeability predictor perfectly reproduces the available
experimental rankings.
The proposed expression (eqn (9)) has also been further tested
on free energy profiles, for different sets of solutes, available in
the literature. Again, for these tests to be reliable, we only
considered sets of data obtained from the same series of simu-
lations and experiments; as already mentioned, this is necessary
for meaningful comparisons, given the sensitivity of permeability
properties to the particular simulation/experimental methods
and conditions. First, we tested our simple expression on two
collections of free energy data36,19 obtained in our research group
for the same set of small molecules simulated respectively in an
atomistic dipalmitoylphosphatidylcholine (DPPC)36 bilayer and
in a coarse-grain DMPC19 bilayer. The results obtained are
presented in Table 2, along with a corresponding set of experi-
mental data63 obtained with real phosphatidylcholine bilayers. It
can be seen that the two rankings predicted by our simple
permeability model are in remarkable agreement with the
experimental data. The only discrepancy involves the relative
ranking of water and acetamide obtained when using one of the
two sets of free energy data (first row of Table 2). We then tested
our expression on literature data reported by other simulation
groups. First, we applied our permeability predictor on a set of
free energy data64 comprising urea, glycerol and water, simulated
in a palmitoyloleoylphosphatidylcholine (POPC) bilayer; the
ranking obtained is reported in Table 3, together with a corres-
ponding experimental ranking from measurements on phos-
phatidylcholine bilayers.65 Our PDG prediction is in good
agreement with the experimental data. We then tested the model
on simulation free energy data66 for sugars in a POPC bilayer.
The ranking obtained is reported in Table 4, along with the
corresponding data from experimental measurements on POPC
membranes.67 The agreement is again satisfactory; in particular,
it can be seen that our permeability model correctly reproduces
Table 2 Comparison of permeability rankings
Method Permeability ranking
PDGdata from ref.19 PDG
water < (PDGacetamide z PDG
aceticacid) < PDGmethylamine
PDGdata from ref.36 (PDG
acetamide z PDGwater) < PDG
aceticacid < PDGmethylamine
Experiment63 P acetamide < P water < P aceticacid < P methylamine
Table 3 Comparison of permeability rankings
Method Permeability ranking
PDGdata from ref.64 PDG
urea < (PDGglycerol z PDG
water)Experiment 65 P urea < P glycerol < P water
Table 4 Comparison of permeability rankings
Method Permeability ranking
PDGdata from ref.66 (PDG
arabinose z PDGxylose) < PDG
ribose
Experiment67 (P arabinose z P xylose) < P ribose
3804 | Soft Matter, 2010, 6, 3797–3808
the (important67) experimental finding that ribose is the fastest
permeant in the set.
The actual numerical results obtained by applying eqn (9),
which underlie the rankings of Tables 1, 2, 3 and 4, are reported
in the Supplementary Information.
Additional observations - membrane perturbation,water intrusion and permeant orientation
By visually inspecting the simulation trajectories, we can obtain
qualitative insights into the permeation mechanism. When con-
strained in the water region outside the membrane, all permeants
show random orientations and do not perturb the bilayer
structure; this behaviour, intuitively expected, is consistent with
AL simulations of the same b-blockers30 and dual-resolution
simulations of small molecules.19 However, when constrained
inside the membrane, the solutes display a tendency for tilted
orientations with respect to the direction normal to the
membrane plane.
Inside the bilayer region, the b-blockers tend to point their
central oxygens towards the outside; such behaviour is probably
determined by the favourable electrostatic interactions between
the most polar atoms of the permeant and the (outer) polar
moieties of the membrane system (lipid headgroups and
glycerols, and hydrating water). Previous AL simulations30 of the
same drugs could not identify any conclusive equilibrium
distribution of orientations inside the membrane due to the short
simulation times achieved (3 ns). However, it was noticed that the
b-blocker orientations were mainly tilted with respect to the
bilayer normal;30 this is broadly consistent with our observations
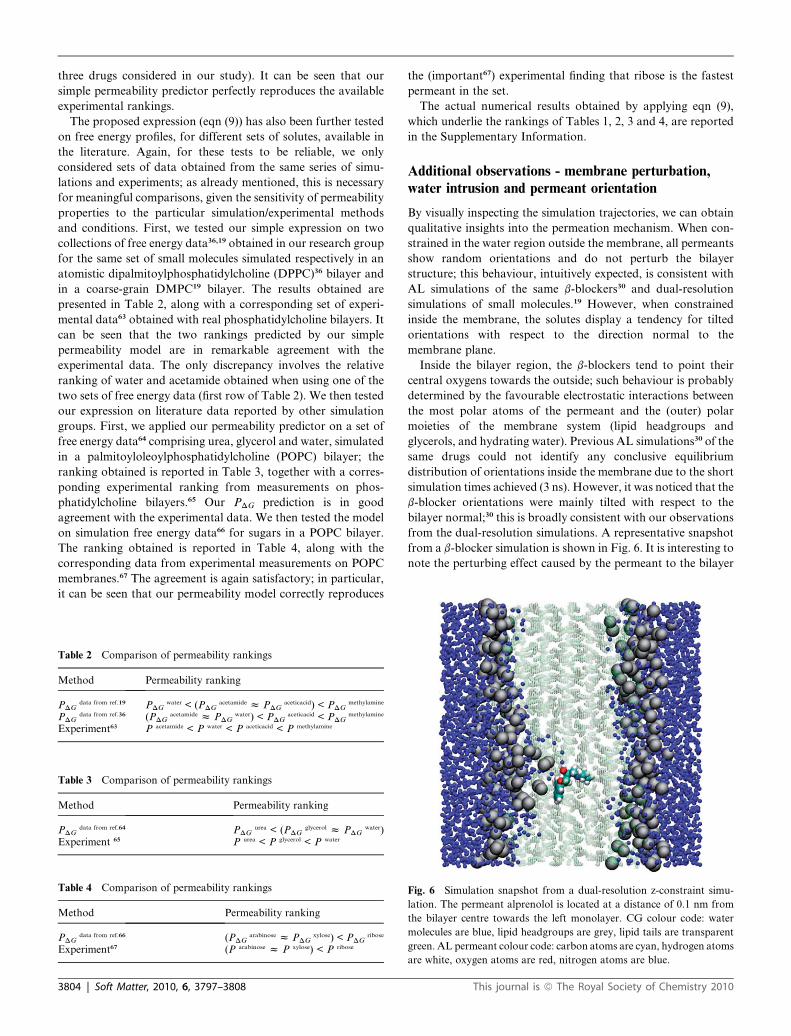
from the dual-resolution simulations. A representative snapshot
from a b-blocker simulation is shown in Fig. 6. It is interesting to
note the perturbing effect caused by the permeant to the bilayer
Fig. 6 Simulation snapshot from a dual-resolution z-constraint simu-
lation. The permeant alprenolol is located at a distance of 0.1 nm from
the bilayer centre towards the left monolayer. CG colour code: water
molecules are blue, lipid headgroups are grey, lipid tails are transparent
green. AL permeant colour code: carbon atoms are cyan, hydrogen atoms
are white, oxygen atoms are red, nitrogen atoms are blue.
This journal is ª The Royal Society of Chemistry 2010
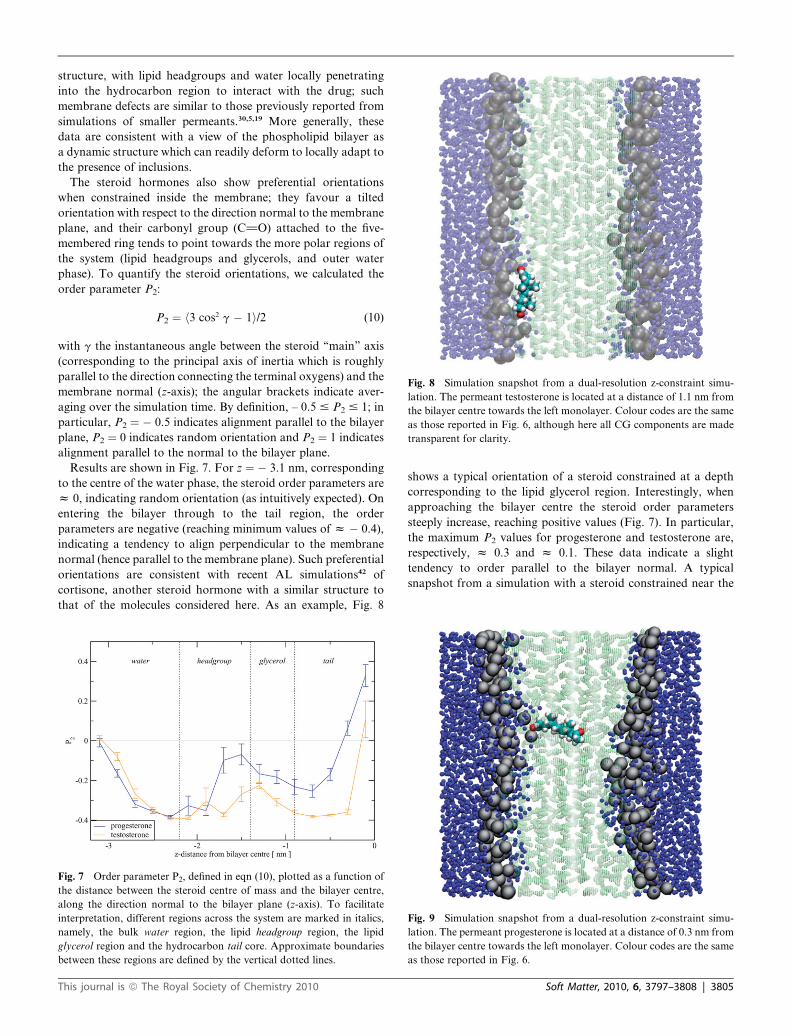
Fig. 8 Simulation snapshot from a dual-resolution z-constraint simu-
lation. The permeant testosterone is located at a distance of 1.1 nm from
the bilayer centre towards the left monolayer. Colour codes are the same
as those reported in Fig. 6, although here all CG components are made
transparent for clarity.
structure, with lipid headgroups and water locally penetrating
into the hydrocarbon region to interact with the drug; such
membrane defects are similar to those previously reported from
simulations of smaller permeants.30,5,19 More generally, these
data are consistent with a view of the phospholipid bilayer as
a dynamic structure which can readily deform to locally adapt to
the presence of inclusions.
The steroid hormones also show preferential orientations
when constrained inside the membrane; they favour a tilted
orientation with respect to the direction normal to the membrane
plane, and their carbonyl group (C]O) attached to the five-
membered ring tends to point towards the more polar regions of
the system (lipid headgroups and glycerols, and outer water
phase). To quantify the steroid orientations, we calculated the
order parameter P2:
P2 ¼ h3 cos2 g � 1i/2 (10)
with g the instantaneous angle between the steroid ‘‘main’’ axis
(corresponding to the principal axis of inertia which is roughly
parallel to the direction connecting the terminal oxygens) and the
membrane normal (z-axis); the angular brackets indicate aver-
aging over the simulation time. By definition, – 0.5 # P2 # 1; in
particular, P2 ¼ � 0.5 indicates alignment parallel to the bilayer
plane, P2 ¼ 0 indicates random orientation and P2 ¼ 1 indicates
alignment parallel to the normal to the bilayer plane.
Results are shown in Fig. 7. For z ¼ � 3.1 nm, corresponding
to the centre of the water phase, the steroid order parameters are
z 0, indicating random orientation (as intuitively expected). On
entering the bilayer through to the tail region, the order
parameters are negative (reaching minimum values of z � 0.4),
indicating a tendency to align perpendicular to the membrane
normal (hence parallel to the membrane plane). Such preferential
orientations are consistent with recent AL simulations42 of
cortisone, another steroid hormone with a similar structure to
that of the molecules considered here. As an example, Fig. 8
Fig. 7 Order parameter P2, defined in eqn (10), plotted as a function of
the distance between the steroid centre of mass and the bilayer centre,
along the direction normal to the bilayer plane (z-axis). To facilitate
interpretation, different regions across the system are marked in italics,
namely, the bulk water region, the lipid headgroup region, the lipid
glycerol region and the hydrocarbon tail core. Approximate boundaries
between these regions are defined by the vertical dotted lines.
This journal is ª The Royal Society of Chemistry 2010
shows a typical orientation of a steroid constrained at a depth
corresponding to the lipid glycerol region. Interestingly, when
approaching the bilayer centre the steroid order parameters
steeply increase, reaching positive values (Fig. 7). In particular,
the maximum P2 values for progesterone and testosterone are,
respectively, z 0.3 and z 0.1. These data indicate a slight
tendency to order parallel to the bilayer normal. A typical
snapshot from a simulation with a steroid constrained near the
Fig. 9 Simulation snapshot from a dual-resolution z-constraint simu-
lation. The permeant progesterone is located at a distance of 0.3 nm from
the bilayer centre towards the left monolayer. Colour codes are the same
as those reported in Fig. 6.
Soft Matter, 2010, 6, 3797–3808 | 3805
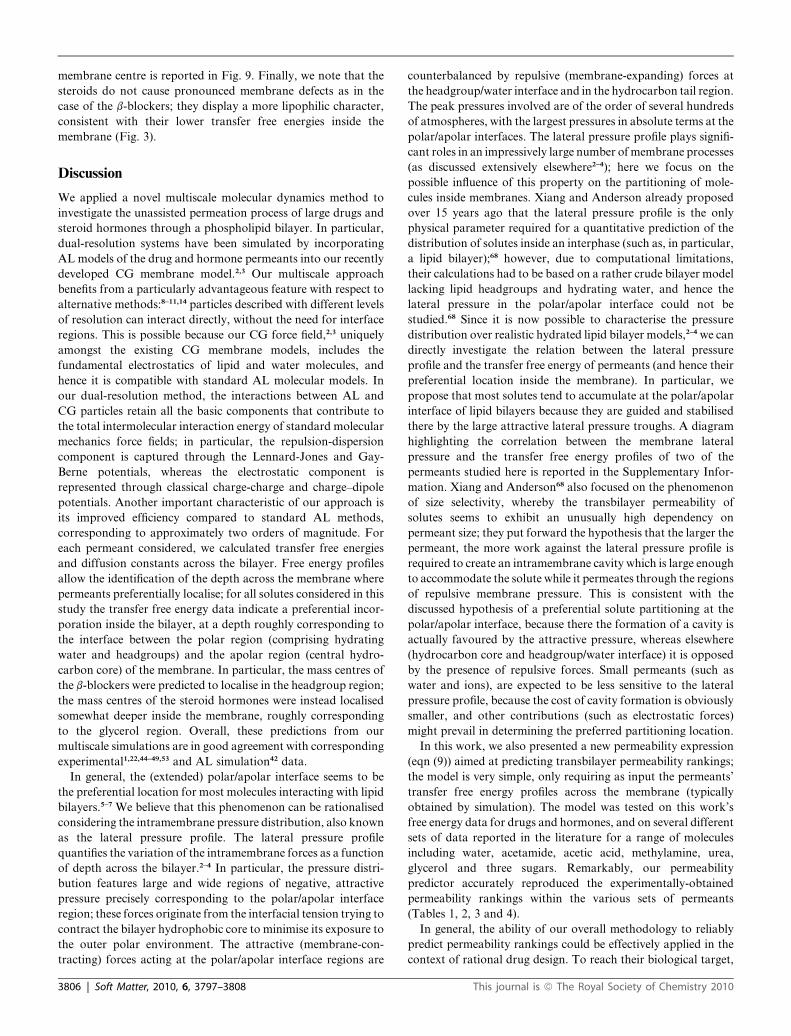
membrane centre is reported in Fig. 9. Finally, we note that the
steroids do not cause pronounced membrane defects as in the
case of the b-blockers; they display a more lipophilic character,
consistent with their lower transfer free energies inside the
membrane (Fig. 3).
Discussion
We applied a novel multiscale molecular dynamics method to
investigate the unassisted permeation process of large drugs and
steroid hormones through a phospholipid bilayer. In particular,
dual-resolution systems have been simulated by incorporating
AL models of the drug and hormone permeants into our recently
developed CG membrane model.2,3 Our multiscale approach
benefits from a particularly advantageous feature with respect to
alternative methods:8–11,14 particles described with different levels
of resolution can interact directly, without the need for interface
regions. This is possible because our CG force field,2,3 uniquely
amongst the existing CG membrane models, includes the
fundamental electrostatics of lipid and water molecules, and
hence it is compatible with standard AL molecular models. In
our dual-resolution method, the interactions between AL and
CG particles retain all the basic components that contribute to
the total intermolecular interaction energy of standard molecular
mechanics force fields; in particular, the repulsion-dispersion
component is captured through the Lennard-Jones and Gay-
Berne potentials, whereas the electrostatic component is
represented through classical charge-charge and charge–dipole
potentials. Another important characteristic of our approach is
its improved efficiency compared to standard AL methods,
corresponding to approximately two orders of magnitude. For
each permeant considered, we calculated transfer free energies
and diffusion constants across the bilayer. Free energy profiles
allow the identification of the depth across the membrane where
permeants preferentially localise; for all solutes considered in this
study the transfer free energy data indicate a preferential incor-
poration inside the bilayer, at a depth roughly corresponding to
the interface between the polar region (comprising hydrating
water and headgroups) and the apolar region (central hydro-
carbon core) of the membrane. In particular, the mass centres of
the b-blockers were predicted to localise in the headgroup region;
the mass centres of the steroid hormones were instead localised
somewhat deeper inside the membrane, roughly corresponding
to the glycerol region. Overall, these predictions from our
multiscale simulations are in good agreement with corresponding
experimental1,22,44–49,53 and AL simulation42 data.
In general, the (extended) polar/apolar interface seems to be
the preferential location for most molecules interacting with lipid
bilayers.5–7 We believe that this phenomenon can be rationalised
considering the intramembrane pressure distribution, also known
as the lateral pressure profile. The lateral pressure profile
quantifies the variation of the intramembrane forces as a function
of depth across the bilayer.2–4 In particular, the pressure distri-
bution features large and wide regions of negative, attractive
pressure precisely corresponding to the polar/apolar interface
region; these forces originate from the interfacial tension trying to
contract the bilayer hydrophobic core to minimise its exposure to
the outer polar environment. The attractive (membrane-con-
tracting) forces acting at the polar/apolar interface regions are
3806 | Soft Matter, 2010, 6, 3797–3808
counterbalanced by repulsive (membrane-expanding) forces at
the headgroup/water interface and in the hydrocarbon tail region.
The peak pressures involved are of the order of several hundreds
of atmospheres, with the largest pressures in absolute terms at the
polar/apolar interfaces. The lateral pressure profile plays signifi-
cant roles in an impressively large number of membrane processes
(as discussed extensively elsewhere2–4); here we focus on the
possible influence of this property on the partitioning of mole-
cules inside membranes. Xiang and Anderson already proposed
over 15 years ago that the lateral pressure profile is the only
physical parameter required for a quantitative prediction of the
distribution of solutes inside an interphase (such as, in particular,
a lipid bilayer);68 however, due to computational limitations,
their calculations had to be based on a rather crude bilayer model
lacking lipid headgroups and hydrating water, and hence the
lateral pressure in the polar/apolar interface could not be
studied.68 Since it is now possible to characterise the pressure
distribution over realistic hydrated lipid bilayer models,2–4 we can
directly investigate the relation between the lateral pressure
profile and the transfer free energy of permeants (and hence their
preferential location inside the membrane). In particular, we
propose that most solutes tend to accumulate at the polar/apolar
interface of lipid bilayers because they are guided and stabilised
there by the large attractive lateral pressure troughs. A diagram
highlighting the correlation between the membrane lateral
pressure and the transfer free energy profiles of two of the
permeants studied here is reported in the Supplementary Infor-
mation. Xiang and Anderson68 also focused on the phenomenon
of size selectivity, whereby the transbilayer permeability of
solutes seems to exhibit an unusually high dependency on
permeant size; they put forward the hypothesis that the larger the
permeant, the more work against the lateral pressure profile is
required to create an intramembrane cavity which is large enough
to accommodate the solute while it permeates through the regions
of repulsive membrane pressure. This is consistent with the
discussed hypothesis of a preferential solute partitioning at the
polar/apolar interface, because there the formation of a cavity is
actually favoured by the attractive pressure, whereas elsewhere
(hydrocarbon core and headgroup/water interface) it is opposed
by the presence of repulsive forces. Small permeants (such as
water and ions), are expected to be less sensitive to the lateral
pressure profile, because the cost of cavity formation is obviously
smaller, and other contributions (such as electrostatic forces)
might prevail in determining the preferred partitioning location.
In this work, we also presented a new permeability expression
(eqn (9)) aimed at predicting transbilayer permeability rankings;
the model is very simple, only requiring as input the permeants’
transfer free energy profiles across the membrane (typically
obtained by simulation). The model was tested on this work’s
free energy data for drugs and hormones, and on several different
sets of data reported in the literature for a range of molecules
including water, acetamide, acetic acid, methylamine, urea,
glycerol and three sugars. Remarkably, our permeability
predictor accurately reproduced the experimentally-obtained
permeability rankings within the various sets of permeants
(Tables 1, 2, 3 and 4).
In general, the ability of our overall methodology to reliably
predict permeability rankings could be effectively applied in the
context of rational drug design. To reach their biological target,
This journal is ª The Royal Society of Chemistry 2010
drugs must typically cross cell membranes by unassisted perme-
ation, and hence valid tools for predicting permeability coeffi-
cients before synthesis are highly desirable to minimise the
investment in pharmaceutical design and development.5 Stand-
ard permeability assays, such as Caco-269 and Pampa70 systems,
are not without drawbacks, as they can be expensive and time-
consuming. Also, given their complexity and variability, data
reproducibility and interpretation can be problematic.71 Our
computational method represents a promising alternative; given
the current (growing) availability of supercomputers, it would be
possible to apply our methodology to conduct screening studies
on large sets of compounds. This would allow the cheap and fast
estimation of the permeability ranking within a set of drug
candidates, thus offering a simple way to identify possible lead
compounds. Moreover, since results would be obtained using
a consistent protocol, interpretation and comparison amongst
different sets of data would be straightforward.
In terms of limitations and drawbacks, we should point out
that it is difficult to assess a priori the general validity of our
simple dual-resolution method. While the results presented here
and elsewhere19 encouragingly agree with experimental
measurements and atomistic simulation data, more work is
needed to establish the extent to which the inevitable loss of
accuracy (compared with full atomistic models) due to the
simplified membrane representation still allows the relevant
lipid-solute interactions to be correctly modelled. A related
specific issue is the lack of an explicit hydrogen bonding
representation, due to the absence of hydrogens in the coarse-
grain description of lipids and water.2,3 Although our explicit
treatment of electrostatics probably allows the fundamental
features of hydrogen bonding to be captured, the exact effect of
this approximation remains to be established. The hydrogen
bonding ability of drug molecules is recognised as an important
factor for drug permeation and absorption,72 and indeed
previous AL data indicated a correlation between the number of
drug-water hydrogen bonds and the ranking of the permeability
coefficients, with the permeability coefficient decreasing with the
formation of an increasing number of hydrogen bonds.30
Although the absence of explicit hydrogen bonds does not seem
to have compromised our results for the drug and hormone
permeants studied here, and for the small molecule solutes
investigated elsewhere,19 more tests are desirable to clarify the
issue. Another limitation of the method presented lies in the
assumption of intramolecular rigidity. While such a simplifying
treatment is arguably acceptable for intrinsically rigid molecules
such as the steroid hormones (given their stiff four-ringed
structure), it is more problematic to justify its use for the
b-blocker models. In fact, atomistic simulations of the same
b-blockers highlighted depth-dependent conformational
changes.30 Even though the rigid-body assumption does not seem
to compromise the reliability of the method in predicting the
relative permeability coefficients for the permeants investigated
here, we are working on the implementation of intramolecular
flexibility for atomistic solutes. This extension will require the
implementation of additional force-field terms to account for the
atomistic bonded interactions (such as bond stretching and angle
bending); while the technical aspect is straightforward, there will
be related efficiency issues. In particular, the integration of
the fastest atomistic intramolecular motions would require
This journal is ª The Royal Society of Chemistry 2010
a reduction of the timestep, thus potentially compromising the
overall efficiency of our methodology. However, this problem
could be tackled by implementing a multiple-timestep method,
allowing different degrees of freedom to be integrated at different
frequencies; the faster atomistic components of the system will be
integrated with a small timestep, whereas the coarse-grain sites
will be treated with the usual larger timestep. The implement-
ation of atomistic flexibility, besides allowing a more realistic
representation of large drug permeants, could also be exploited
to model membrane proteins; it will be possible to run dual-
resolution simulations where AL protein models are embedded
in a CG description of lipids and water. Further attractive and
relatively straightforward extensions to such systems might
involve the modelling of protein active sites by quantum
mechanics/molecular mechanics methods,10,9 thus constructing
truly multiresolution simulation models.
Conclusion
A novel dual-resolution molecular dynamics method was applied
to investigate the permeation process of atomistically-modelled
drugs and hormones through a coarse-grain membrane. Our
simulation approach is simple, since all particles interact with
each other directly through compatible potentials, that is,
without the need to implement interface regions. The proposed
methodology is also general, as any permeant can be quickly set
up using a standard force field. Computationally, our hybrid
simulations are two orders of magnitude faster than standard
atomic-level methods. We calculated several important perme-
ability properties, such as preferential partitioning locations,
diffusion coefficients and orientations of the permeants inside the
membrane; our results proved consistent with available literature
data from experiments and standard atomistic simulations.
Notably, we also proposed and successfully tested a simple
expression to predict the permeability rankings from transfer free
energy data.
Acknowledgements
This work has been funded by the UK Biotechnology and Bio-
logical Sciences Research Council (BBSRC). We thank Jochen
Hub, Bert de Groot, Chenyu Wei and Andrew Pohorille for
sharing their free energy data.
References
1 S. Balaz, Chem. Rev., 2009, 109, 1793–1899.2 M. Orsi, D. Y. Haubertin, W. E. Sanderson and J. W. Essex, J. Phys.
Chem. B, 2008, 112, 802–815.3 M. Orsi, J. Michel and J. W. Essex, J. Phys.: Condens. Matter, 2010,
22, 155106.4 S. Ollila, M. T. Hyv€onen and I. Vattulainen, J. Phys. Chem. B, 2007,
111, 3139–3150.5 T.-X. Xiang and B. D. Anderson, Adv. Drug Delivery Rev., 2006, 58,
1357–1378.6 J. L. MacCallum and D. P. Tieleman, in Computational modeling of
membrane bilayers, ed. S. E. Feller, Elsevier, 2008, pp. 227–256.7 M. Orsi and J. W. Essex, in Molecular simulations and biomembranes:
from biophysics to function, ed. P. C. Biggin and M. S. P. Sansom,Royal Society of Chemistry, 2010, pp. 77–91.
8 G. S. Ayton, W. G. Noid and G. A. Voth, Curr. Opin. Struct. Biol.,2007, 17, 192–198.
Soft Matter, 2010, 6, 3797–3808 | 3807
9 P. Sherwood, B. R. Brooks and M. S. P. Sansom, Curr. Opin. Struct.Biol., 2008, 18, 630–640.
10 C. J. Woods and A. J. Mulholland, in RSC Special periodical reports:chemical modelling and theory, ed. A. Hinchliffe, Royal Society ofChemistry, 2008, vol. 5, pp. 13–50.
11 S. A. Pandit and H. L. Scott, Biochim. Biophys. Acta, Biomembr.,2009, 1788, 136–148.
12 M. Orsi, W. Sanderson and J. W. Essex, in Molecular interactions -bringing chemistry to life, ed. M. G. Hicks and C. Kettner, Beilstein-Institut, Frankfurt, 2007, pp. 185–205.
13 T.-X. Xiang and B. D. Anderson, J. Membr. Biol., 1994, 140, 111–122.14 M. Praprotnik, L. Delle Site and K. Kremer, Annu. Rev. Phys. Chem.,
2008, 59, 545–571.15 M. Neri, C. Anselmi, V. Carnevale, A. V. Vargiu and P. Carloni,
J. Phys.: Condens. Matter, 2006, 18, S347–S355.16 C. F. Abrams, J. Chem. Phys., 2005, 123, 234101.17 B. Ensing, S. O. Nielsen, P. B. Moore, M. L. Klein and M. Parrinello,
J. Chem. Theory Comput., 2007, 3, 1100–1105.18 J. Michel, M. Orsi and J. W. Essex, J. Phys. Chem. B, 2008, 112, 657–660.19 M. Orsi, W. E. Sanderson and J. W. Essex, J. Phys. Chem. B, 2009,
113, 12019–12029.20 J. Shin and J. A. Johnson, Pharmacotherapy, 2007, 27, 874–887.21 D. Voet and J. G. Voet, Biochemistry, Wiley, New York, 3rd edn,
2004.22 T. J. O’Leary, P. D. Ross and I. W. Levin, Biochemistry, 1984, 23,
4636–4641.23 J. G. Gay and B. J. Berne, J. Chem. Phys., 1981, 74, 3316–3319.24 L. Whitehead, C. M. Edge and J. W. Essex, J. Comput. Chem., 2001,
22, 1622–1633.25 Y. Liu and T. Ichiye, J. Phys. Chem., 1996, 100, 2723–2730.26 C. J. Fennell and J. D. Gezelter, J. Chem. Phys., 2004, 120, 9175–9184.27 A. Chandra and T. Ichiye, J. Chem. Phys., 1999, 111, 2701–2709.28 D. J. Cleaver, C. M. Care, M. P. Allen and M. P. Neal, Phys. Rev. E:
Stat. Phys., Plasmas, Fluids, Relat. Interdiscip. Top., 1996, 54,559–567.
29 S. L. Price, A. J. Stone and M. Alderton, Mol. Phys., 1984, 52,987–1001.
30 D. Bemporad, C. Luttmann and J. W. Essex, Biochim. Biophys. Acta,Biomembr., 2005, 1718, 1–21.
31 B. Cheney and J. W. Essex, unpublished work.32 D. A. Case, Amber 8.0 User Manual, University of California, San
Francisco.33 J. M. Wang, R. M. Wolf, J. W. Caldwell, P. A. Kollman and
D. A. Case, J. Comput. Chem., 2004, 25, 1157–1174.34 A. Jakalian, B. L. Bush and D. B. Jack, J. Comput. Chem., 2000, 21,
132–146.35 D. C. Rapaport, The art of molecular dynamics simulation, Cambridge
University Press, 2nd edn, 2004.36 D. Bemporad, J. W. Essex and C. Luttmann, J. Phys. Chem. B, 2004,
108, 4875–4884.37 S.-J. Marrink and H. J. C. Berendsen, J. Phys. Chem., 1994, 98,
4155–4168.38 M. A. Meineke, C. F. Vardeman II, T. Lin, C. J. Fennell and
J. D. Gezelter, J. Comput. Chem., 2005, 26, 252–271.
3808 | Soft Matter, 2010, 6, 3797–3808
39 http://www.personal.soton.ac.uk/orsi/brahms/.40 A. Dullweber, B. Leimkuhler and R. McLachlan, J. Chem. Phys.,
1997, 107, 5840–5851.41 H. J. C. Berendsen, J. P. M. Postma, W. F. van Gunsteren, A. Di Nola
and J. R. Haak, J. Chem. Phys., 1984, 81, 3684–3690.42 R. Vijayan and P. C. Biggin, Biophys. J., 2008, 95, L45–L47.43 http://www.southampton.ac.uk/isolutions/computing/hpc/iridis/.44 R. S. Phadke, N. V. Kumar, R. V. Hosur, A. Saran and G. Govil, Int.
J. Quantum Chem., 1981, 20, 85–92.45 L. Herbette, A. Katz and J. Sturtevant, Mol. Pharmacol., 1983, 24,
259–269.46 S. Mitragotri, Pharm. Res., 2000, 17, 1026–1029.47 C. Hansch and A. Leo, in Exploring QSAR. Fundamentals and
applications in chemistry and biology, American Chemical Society,Washington, 1995, pp. 1–557.
48 C. Hansch and A. Leo, in Subsituent constants for correlation analysisin chemistry and biology, Wiley, New York, 1979.
49 M. Yazdanian, S. L. Glynn, J. L. Wright and A. Hawi, Pharm. Res.,1998, 15, 1490–1494.
50 G. W. Cleary and J. L. Zatz, J. Pharm. Sci., 1977, 66, 975–80.51 A. Kha€ıat, P. Ketevi, L. Ter-Minassian-Saraga, N. Cittanova and
M. Jayle, Biochim. Biophys. Acta, Biomembr., 1975, 401, 1–5.52 A. Munck, Biochim. Biophys. Acta, 1957, 24, 507–514.53 G. A. Golden, R. T. Rubin and R. P. Mason, Biochim. Biophys. Acta,
Biomembr., 1998, 1368, 161–166.54 W. Shinoda, M. Mikami, T. Baba and M. Hato, J. Phys. Chem. B,
2004, 108, 9346–9356.55 D. Bassolino-Klimas, H. E. Alper and T. R. Stouch, Biochemistry,
1993, 32, 12624–12637.56 H. E. Alper and T. R. Stouch, J. Phys. Chem., 1995, 99, 5724–5731.57 E. Overton, Studien €uber die Narkose, Fischer, Jena, 1901.58 A. Missner and P. Pohl, ChemPhysChem, 2009, 10, 1405–1414.59 J. M. Diamond and Y. Katz, J. Membr. Biol., 1974, 17, 121–154.60 J. M. A. Grime, M. A. Edwards, N. C. Rudd and P. R. Unwin, Proc.
Natl. Acad. Sci. U. S. A., 2008, 105, 14277–14282.61 A. Avdeef, P. Artursson, S. Neuhoff, L. Lazorova, J. Grasjo and
S. Tavelin, Eur. J. Pharm. Sci., 2005, 24, 333–349.62 A. Adson, P. S. Burton, T. J. Raub, C. L. Barsuhn, K. L. Audus and
N. F. H. Ho, J. Pharm. Sci., 1995, 84, 1197–1204.63 A. Walter and J. Gutknecht, J. Membr. Biol., 1986, 90, 207–217.64 J. S. Hub and B. L. de Groot, Proc. Natl. Acad. Sci. U. S. A., 2008,
105, 1198–1203.65 S. Paula, A. G. Volkov, A. N. Vanhoek, T. H. Haines and
D. W. Deamer, Biophys. J., 1996, 70, 339–348.66 C. Wei and A. Pohorille, J. Am. Chem. Soc., 2009, 131, 10237–10245.67 M. G. Sacerdote and J. W. Szostak, Proc. Natl. Acad. Sci. U. S. A.,
2005, 102, 6004–6008.68 T.-X. Xiang and B. D. Anderson, Biophys. J., 1994, 66, 561–572.69 H. Sun, E. C. Y. Chow, S. Liu, Y. Du and K. S. Pang, Expert Opin.
Drug Metab. Toxicol., 2008, 4, 395–411.70 A. Avdeef, Expert Opin. Drug Metab. Toxicol., 2005, 1, 325–342.71 J. Ruell, Mod. Drug Discov., 2003, Jan, 28–30.72 C. A. Lipinski, F. Lombardo, B. W. Dominy and P. J. Feeney, Adv.
Drug Delivery Rev., 1997, 23, 3–25.
This journal is ª The Royal Society of Chemistry 2010