Embed Size (px)
Citation preview

Permafrost Hydrology in Muskeg Lands Permafrost Hydrology in Muskeg Lands
Masaki HayashiMasaki Hayashi11, Bill Quinton, Bill Quinton22, Alastair McClymont, Alastair McClymont11, , Brendan ChristensenBrendan Christensen11, Larry Bentley, Larry Bentley11, Agnès Rivière, Agnès Rivière11
11Geoscience, University of CalgaryGeoscience, University of Calgary22Geography & Geography & EnvEnv. Studies, . Studies, WilfridWilfrid Laurier UniversityLaurier University
Continuous (> 90%)
Discontinuous (50-90%)
Distribution of Permafrost in Canada
continuous( )
Discontinuous (10-50%)
Isolated patches (< 10%)
No permafrost
Natural Resources Canada(http://atlas nrcan gc ca/)
Ft. SimpsonFt. Simpson
(http://atlas.nrcan.gc.ca/)
discontinuous
Permafrost: Ground is frozen for > 2 yr

Distribution of Permafrost in Canada
Wetlands (%)< 55 25
50-75< 75
Ft. SimpsonFt. SimpsonFt. SimpsonFt. Simpson
5-2525-50
< 75
Tarnocai et al. (2002, GSC Open File Rept. 4002)
-4
-2
0
tem
p ( C
)
Ft. Simpson Mean Annual Air Temperature
-8
-6
1900 1920 1940 1960 1980 2000
air t
Questions:• How will the permafrost distribution change?How will the permafrost distribution change?• How fast will the change occur?• How will the water cycle be affected?→ Scientific basis for adaptation to climate change

Discontinuous Permafrost near Ft. SimpsonDiscontinuous Permafrost near Ft. Simpson
flat bogflat bog
channel fenchannel fen
peat plateaupeat plateau
channel fenchannel fen
bogbog
peat plateaupeat plateau

Peat Plateaus Have Permafrost Cores
channel fenchannel fen
40 m40 m
Water flows over the permafrost.
bogbog
40 m40 m
permafrostpermafrost
1
m) 2006 GS
Frost Table in Late AugustGS: ground surface FT: frost table
-1
-0.5
0
0.5
tive
elev
atio
n (m 2006 GS
2006 FT
0.5 m0.9 m
-1.5
-1
0 10 20 30 40
rela
distance from fen (m)

1m
) 2006 GS
GS: ground surface FT: frost tableFrost Table in Late August
-1
-0.5
0
0.5
tive
elev
atio
n (m 2006 GS
2006 FT
2009 GS
-1.5
-1
0 10 20 30 40
rela
distance from fen (m)
2009 FT
zf
T = Ts
ground srf.
Qm
0.4
0.5
m-1
K-1
)
Differential Thawing by Conduction
T = 0frost table
Conduction dominates heat flux.All of heat flux is used to melt ice.
0.1
0.2
0.3
0.4 0.5 0.6 0.7 0.8
Measuredde Vries Eqn.
λ b(W
m
ater contentQm = λb (Ts – 0) / zf
λb : bulk thermal conductivity
Hayashi et al. (2007, Hydrol. Proces. 21: 2610-2622)
water content

0.5
1n
(m) ground surf.
Soil “Pits” InstrumentationW pit
C pit
-1
-0.5
0
rela
tive
elev
atio
n
frost table
-1.50 10 20 30 40
r
distance from fen (m)
Frost Table Lowering in 2004
dzf Qm
dt ρice Lf fice=
ρice: density of iceLf: latent heat of fusionfice: volumetric ice fraction
0
0.2
0.4z f (m
) Site USite L
5/1 5/16 5/31 6/15 6/30 7/15 7/30 8/14
C pitW pit
Hayashi et al. (2007, Hydrol. Proces. 21: 2610-2622)

Frost Table Lowering in 2004
dzf Qm
dt ρice Lf fice=
ρice: density of iceLf: latent heat of fusionfice: volumetric ice fraction
0
0.2
0.4z f (m
) Site USite L
5/1 5/16 5/31 6/15 6/30 7/15 7/30 8/14
C pitW pit
fice = 0.59
Hayashi et al. (2007, Hydrol. Proces. 21: 2610-2622)0
0.4
0.8
liqui
d w
ater
con
t.
Measured at 0.2 m depth
2D Survey of Frost Table (FT)June 12, 2006
ground surf.
FT
• FT measured using FT probe on 0.25 m grids.• Data interpolated using SURFER on 0.1 m grids.
Wright et al. (2009, Water Resour. Res., 45: W05414)

• Whole model domain initially drained completely.• Addition of 15 mm of infiltration
Groundwater Flow Simulation
Water accumulates inWater accumulates in frost-table depressions.Wet condition in depression enhances thawing.→ Positive Feedback
Saturated thickness (m)
→ Positive Feedback
Wright et al. (2009, Water Resour. Res., 45: W05414)
Electrical Resistivity Imaging (ERI)
fenfen
bogbog
0 m 20 40 80fen plateau bog0 m
5
60
FTunfrozen peatunfrozen peat
permafrostpermafrost
15
510
20resistivity (Ω m) 102 103 104
FT clayclaypermafrostpermafrost
McClymont et al. (2013. J. Geophys. Res., 118: 1826-1837)
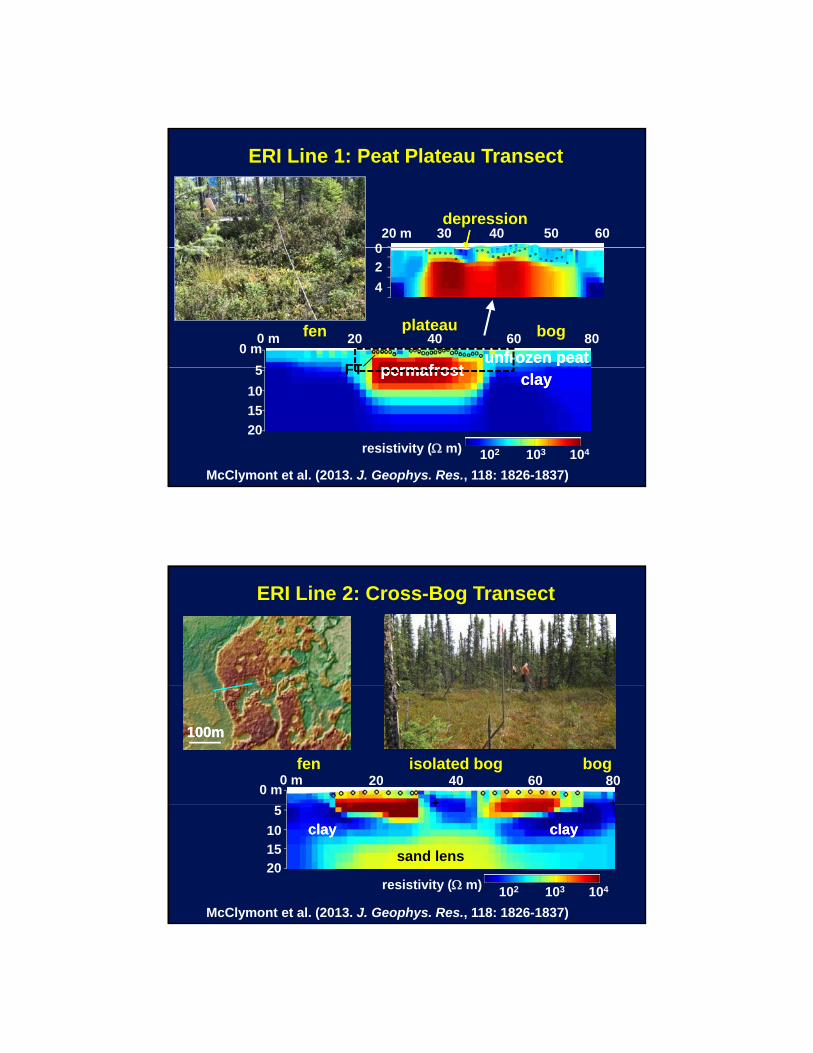
ERI Line 1: Peat Plateau Transect
020 m 30 40 50 60
depression
0 m 20 40 80fen plateau bog0 m
5
60
FT
024
unfrozen peatunfrozen peatpermafrostpermafrost
15
510
20resistivity (Ω m) 102 103 104
FT clayclaypermafrostpermafrost
McClymont et al. (2013. J. Geophys. Res., 118: 1826-1837)
ERI Line 2: Cross-Bog Transect
100m100m
0 m 20 40 80fen isolated bog bog
0 m 60
15
510
20resistivity (Ω m) 102 103 104
clayclayclayclay
sand lens
McClymont et al. (2013. J. Geophys. Res., 118: 1826-1837)

19771977Delineation of Peat Plateau on Aerial Images
200 m
Quinton et al. (2011, Hydrol. Proces., 25:152)
20002000Delineation of Peat Plateau on Aerial Images
200 m
Quinton et al. (2011, Hydrol. Proces., 25:152)

20082008Delineation of Peat Plateau on Aerial Images
Peat Plateau Area1977: 53%2000: 49%2008: 43%
200 m
Quinton et al. (2011, Hydrol. Proces., 25:152)
Aug. 2002Aug. 2002
Changes Evident on the Ground
July 2013
DataloggerDatalogger DataloggerDatalogger
• Wetlands become larger and larger.• They generate more drainage pathways.Consequences??

300
400 BirchJean-MarieBlackstone
off (
mm
) Runoff = Total flow / Drainage area
Annual Total Basin Runoff near Ft. SimpsonFour Rivers (150-1,900 km2), Similar Landcovers
600 Ft. Simpson precip.(mm
)
0
100
200
1970 1980 1990 2000 2010
Scotty
annu
al ru
no
0
200
400
1970 1980 1990 2000 2010prec
ipita
tion
(
Global Water and Energy Experiment (GEWEX)
MacKenzie GEWEX Study (MAGS): 1995-2005
Ft. Simpson
Hydrology of circum-polar region using the Mackenzie Basin as an experimental watershed.
Scotty Creek study was initiated as a MAGS “node”initiated as a MAGS node .
Personnel: Bill and MasakiBudget: $15,000/yr

Humble Beginning, 1999-2001
Camp Scotty Set Up, 2003-2004

Relocation to Camp Scotty 2, 2006
Camp Scotty 3 Construction, 2012
2013 Scotty Crew

Photo: Michael Braverman
Photo: Michael Braverman
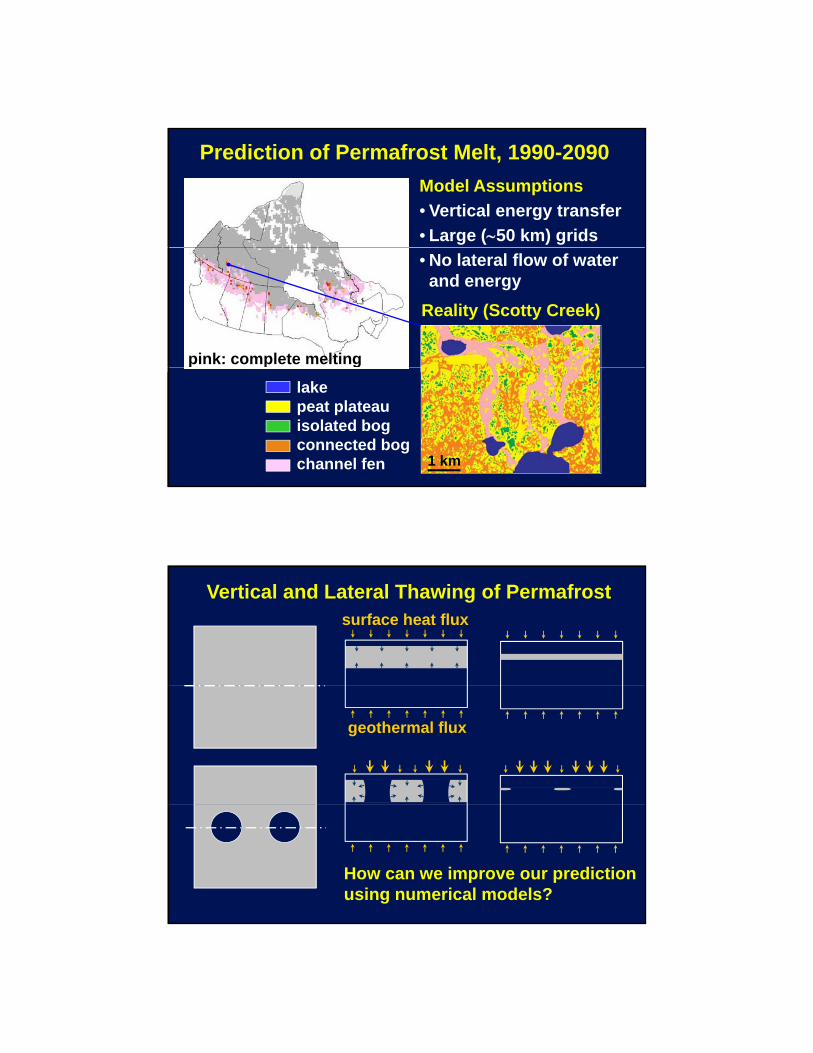
Prediction of Permafrost Melt, 1990-2090Model Assumptions• Vertical energy transfer• Large (∼50 km) grids
pink: complete melting
• No lateral flow of water and energy
Reality (Scotty Creek)
gZhang et al. (2008. Geophys. Res. Lett., 35: L02502)
1 km
lakepeat plateauisolated bogconnected bogchannel fen
Vertical and Lateral Thawing of Permafrostsurface heat flux
geothermal flux
How can we improve our prediction using numerical models?

Electrical Resistivity Imaging (ERI)
fenfen
bogbog
0 m 20 40 80fen plateau bog0 m
60unfrozen peatunfrozen peat
15
510
20resistivity (Ω m) 102 103 104
FT clayclaypp
permafrostpermafrost
Numerical Modelling ApproachNorthern Ecosystem Soil Temperature (NEST) model
2D finite-element heat transfer model, Temp/W
NEST plateau NEST bog
Zhang et al. (2003, JGR, 108, D22)

Permafrost Thaw Simulation, 2004-2010Extent of permafrost body (only half is shown)
3.5 m
1.4 m2010
2004
McClymont et al. (2013. J. Geophys. Res., 118: 1826-1837)
Permafrost Thaw Simulation, 2012-2032Extent of permafrost body (only half is shown)
2012
2032

Drainage Paths in Scotty Creek Watershed
Seismic exploration in 1960s.
5 km
20082008Delineation of Peat Plateau on Aerial Images
200 m
Quinton et al. (2011, Hydrol. Proces., 25:152)

ERI Line 3: Winter Road (∼ 40 yrs old)
clearingforest forest0 m 20 40 80
0 m60
resistivity (Ω m) 102 103 104
15
510
20
permafrostpermafrost permafrostpermafrost
partial thawing
Simulation after road construction, 1969-2010NEST bog NEST plateau
2.1 m
dept
h (m
)
2.1 m
dept
h (m
)
distance (m)distance (m)

2050
2010
Winter Road Simulation, 2010-2100
dept
h (m
)2030
2050
2010
distance (m)
Permafrost Thaw – Positive Feedbackpeat plateau1. Thinning of canopy.
→ Increase in radiationenergy input.
1
2preferential thaw
2. Local thawing.→ Water-energy feedback
causes further thawing.3. Wet condition prevents
trees from growing back.→ New bog forms
saturated, frozen peatsaturated, thawed peatunsaturated, thawed peat
new bog
3
p→ New bog forms.
Quinton et al. (2009, Can. Water Resour. J. 34: 311 )

Take Home Points• Open canopy and wet condition enhance thawing.• Thawing causes a dramatic shift in water cycle.• Resource exploration activity can have a strong
People: Nicole Wright, Laura Chasmer, Mike Toews, Alan Bonnetrouge, Chris Hopkinson, and many others
C S
Acknowledgements
• Resource exploration activity can have a strong influence.
Funding: International Polar Year, Canadian Space AgencyCanadian Foundation of Climate and Atmospheric SciencesNatural Sciences and Engineering Research Council
Logistical Support : Liidlii Kue First NationsNorthwest Territories Government, Environment Canada