Embed Size (px)
Citation preview

This journal is©The Royal Society of Chemistry 2016 Integr. Biol.
Cite this:DOI: 10.1039/c5ib00286a
Performing selections under dynamic conditionsfor synthetic biology applications
Jessica M. Lindle and Mary J. Dunlop*
As the design of synthetic circuits and metabolic networks becomes more complex it is often difficult to
know a priori which parameters and design choices will result in a desired phenotype. To counter this,
rational design can be complemented by library-based approaches where diversity is introduced and then
coupled with screening or selection methods. Here, we used a model of competitive growth to show that
selection can rapidly identify library variants with near-optimal phenotypes. Many synthetic biology
applications require phenotypes that balance multiple objectives, such as responding to more than one
chemical signal. In addition, desired traits may be time-dependent, for example changing with the growth
phase. By applying dynamic inputs to the selection, we show that it is possible to select for traits that satisfy
multiple goals. Furthermore, we demonstrate that the underlying diversity in a library is heavily influenced
by the initial circuit design. Overall, our findings argue that rational synthetic circuit design, coupled with
diversity generation and dynamic selection are powerful tools for many synthetic biology applications.
Insight, innovation, integrationIn synthetic biology applications, researchers often rationally design gene circuits to perform a desired function. However, as their complexity increases, it is canbe difficult to predict exactly how a synthetic circuit will behave. To counter this, researchers can develop libraries and then apply evolution-guided selection toidentify the best alternatives. However, synthetic biology applications often require that multiple different goals be met. Here, we use a mathematical model toshow that applying dynamic inputs during selection is an efficient way of identifying optimal synthetic circuit designs. Furthermore, we show that the way diversityis introduced into a library can have a dramatic impact on how straightforward or challenging it is to select synthetic circuits with desired properties.
Introduction
Synthetic circuit design and metabolic engineering have benefitedgreatly from the integration of rational design with approachesthat introduce diversity and variability. Tools from syntheticbiology have enabled the construction of large libraries thatcontain many variations on a particular design. For example, indirected evolution error prone PCR or other mutagenesis methodscan introduce mutations within specified regions and librarymembers can be subsequently screened or selected for desirablephenotypes.1 These methods have been enabled by advances insynthetic biology, including efficient cloning protocols and thedecreasing cost of DNA synthesis.2–4 In addition, multiplexedgenome engineering methods can rapidly introduce variabilityat a genome-wide scale.5–8 With recent advances in syntheticbiology tools that have enabled the design and construction oflibraries of genetic variants, our ability to screen or select fordesired traits is critical to success.1
In principle, given sufficient time, selection will identify thebest candidate from a large library; however under practicalengineering circumstances it is often preferable to rapidlyidentify a solution that is very close to the optimal while usingless effort (time and resources). For example, the number ofrounds of selection required may be dramatically different toisolate a library variant in the top 1% as opposed to one in thetop 10%. Because lengthy selections increase the possibility ofmutation or adaptation effects that can confound analysis, itmay be preferable for synthetic biology applications to find asolution that is ‘‘close enough’’ to optimal.
We highlight the use of biosensors here as a particularlyrelevant example where well-designed screening or selectionprocedures can have a large impact. Biosensors can be coupledwith readable outputs, linked to an output providing a fitnessadvantage, or used directly in a metabolic pathway throughfeedback control.9,10 When biosensors are coupled with reporters,such as fluorescence, they provide a semi-quantitative way torapidly screen many genetic variants (for recent reviews seeref. 9–11). Biosensors can also be used to control expression ofgenes that provide a fitness advantage.9–11 This growth-coupled
School of Engineering, University of Vermont, Burlington, VT, 05405, USA.
E-mail: [email protected]
Received 10th November 2015,Accepted 27th December 2015
DOI: 10.1039/c5ib00286a
www.rsc.org/ibiology
Integrative Biology
PAPER
Publ
ishe
d on
13
Janu
ary
2016
. Dow
nloa
ded
by U
nive
rsity
of
Ver
mon
t on
13/0
1/20
16 1
3:38
:26.
View Article OnlineView Journal

Integr. Biol. This journal is©The Royal Society of Chemistry 2016
assay approach has been used to select for improved L-lysine12
and butanol13 production strains. In a recent study that hasbroad potential, a biosensor was used to control expression ofTolC, where increased expression leads to higher levels ofantibiotic resistance, providing a straightforward selectionmethod.14 Critically, the authors made use of negative selectionto eliminate false positives from their libraries. An alternativestrategy uses a phage-assisted approach, where the target ofinterest is coupled with expression of a phage infection protein,allowing rapid evolution of novel synthetic systems for theproduction of biomolecules.15 Coupling a biosensor to a selectableoutput, especially when there is a way of performing negativeselection, can be applicable for improving production of a broadvariety of compounds. Here, we take this approach and assumethat the phenotype of interest can be directly coupled to growthrate. This can be achieved by using a biosensor to control a genethat provides a growth advantage, or if the system of interestalready provides a selective advantage it can be used directly.
Synthetic biology applications often have multi-factorialobjectives where designs need to perform well under multipleconditions or conditions that change with time. For example,when designing a biofuel production strain, cells should producefuel at high levels, but should not be burdened by the additionalmetabolic infrastructure to the point that they are under dramaticselective pressure to eliminate the engineered components.Another example comes from the design of biological sensors.Sensors need to respond to the presence a signal, but not theabsence. This is especially critical if the sensor is driving anactuator as part of a feedback loop, where it might be costly tohave the actuator on at all times. In addition, it might be desirableto select for a sensor that responds in a graded or linear fashion,while other applications may require a digital response. Further-more, the desired phenotype may be one that needs to performwell under changing environments. For example, in metabolicengineering applications a toxic byproduct may build up overtime. Therefore, strains need to be tolerant to ramping increasesin the byproduct, but do not need to exhibit complete resistancein early stages of growth.
Synthetic systems can be designed to respond to dynamicconditions and efficient dynamic selection methods can aid insynthetic circuit optimization. Here, we explore a specific exampleusing a biosensor to drive expression of a biofuel tolerancemechanism in a synthetic feedback loop. We compare the systemwithout feedback (static control) to that with feedback (dynamiccontrol).16 There have been several examples of circuit designs thatuse synthetic feedback loops to achieve optimized outcomes,including production of lycopene,17 farnesyl pyrophosphate,18
and fatty acid based products.19–21 Importantly, all of theseprocesses impose a burden on the cell if pathways are imbalanceddue to accumulation of toxic intermediates or byproducts.Therefore, it is critical that the response not be static, butrather commensurate with the level of burden. These sensor–actuator designs typically require some tuning to achieveoptimal performance, as it may not be clear what combinationof parts will give the best performance. This can be achieved byconstructing several variants and comparing them; for example,
Zhang et al. built 30 combinations of their synthetic circuitdesign and measured fatty acid ethyl ester production directlyin each individual.21 An alternative to testing individualdesigns is to pool the different variants, expose cultures totime-varying inputs that mimic the real system, and select forthose that perform well. The ability to screen library variants forbeneficial properties in an efficient fashion can dramaticallyimprove throughput.
In evolution-guided design there may be features inherent toa synthetic circuit that impose constraints on the range ofvariability or shape of distribution that can be achieved by alibrary. For example, efflux pumps can provide biofuel tolerance,but their overexpression imposes a burden on cell growth.22,23
This tradeoff will become apparent in any design that introducesdiversity via static pump expression: there will be a strongcorrelation between library members that provide tolerance tobiofuel and those that do not grow as well in the absence of fuel.Introducing library diversity in a way that works around theseconstraints can make selection more straightforward. In theefflux pump example, introducing different constitutive promotersto control pumps will not get around the trade off between biofueland pump toxicity, while designs that include feedback control canbe used to circumvent this constraint.
Here, we show that dynamic selection protocols can identifylibrary members that have complex phenotypes. For example,applying a time-varying input can select for library members thathave beneficial properties under multiple different environmentalconditions or that respond in a specific way to conditions thatchange with time. Given the prevalence of tools from syntheticbiology that enable large-scale library construction, the ability toefficiently screen for complex traits represents an important areafor optimization in synthetic biology. We envision that syntheticcircuit design should include rational components, coupled withdiversity generation, and dynamic screening or selection.
ExperimentalCompetitive growth model
We used the Lotka–Volterra competitive growth equation24 tomodel the biomass of each of strain (Ni) over time during eachselection cycle:
dNi
dt¼ giNi 1�
XCj¼1
AijNj
!
The growth rate of strain i is gi, C is the total number ofstrains, and Aij is the strain interaction matrix, which we define
as Aij ¼gj
giso that the competitive advantage that that strain j
has over strain i is proportional to the ratio of the growth rates.We note that other interaction matrix models could be used toincorporate more complex community dynamics.
The following conditions are identical across all simulations:Initial conditions were set to 0.01/C for all strains. Thus, the totalinitial biomass is 0.01 and all strains start with identical initialconditions. Simulated cultures were grown for 12 hours, then the
Paper Integrative Biology
Publ
ishe
d on
13
Janu
ary
2016
. Dow
nloa
ded
by U
nive
rsity
of
Ver
mon
t on
13/0
1/20
16 1
3:38
:26.
View Article Online
This journal is©The Royal Society of Chemistry 2016 Integr. Biol.
biomass at 12 hours of all strains was divided by 100(a 1:100 dilution) and these values were used as the initialconditions for the next selection cycle. Note that the carryingcapacity of the total culture is normalized to one such that thefinal total biomass, which is the sum of the biomass of all Cstrains, at steady state is equal to one.
Growth rate distributions, number of strains, and numberof selection cycles vary and are listed in the figure captions.Here we give a brief overview: for Fig. 1, 2D and E, the growthrate (gi) values were sampled from normal distributions. Fig. 2Fis similar, where gi values were sampled from two normaldistributions with switching between them as a function ofthe input. For Fig. 3, gi values depend on the input and are afunction of two normally distributed parameters, ai and Ki,
described below. In Fig. 4, the gi values are calculated from thepump model and depend on the pump expression value, ap, asdescribed below.
All simulations were performed in Matlab (Mathworks, Inc.)using the ode45 differential equation solver.
Input-dependent growth rate model
In Fig. 3 we modeled the growth rate as a function of the inputusing the function
gi ¼ ai
I
Ki
� �2
1þ I
Ki
� �2
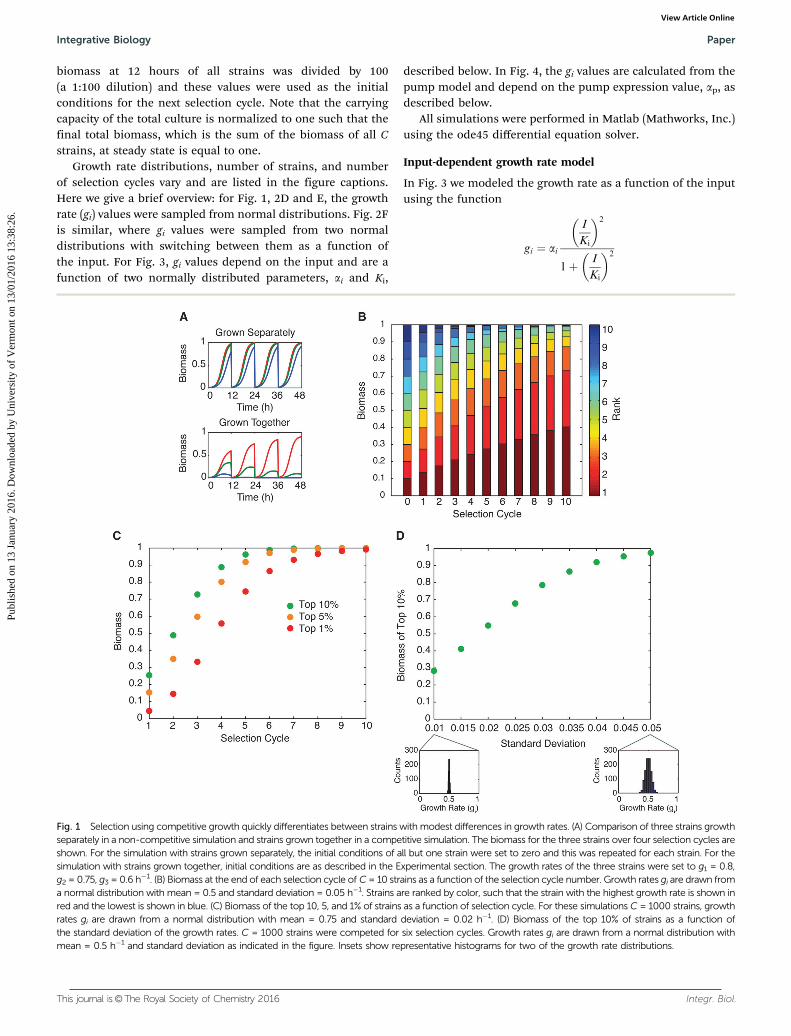
Fig. 1 Selection using competitive growth quickly differentiates between strains with modest differences in growth rates. (A) Comparison of three strains growthseparately in a non-competitive simulation and strains grown together in a competitive simulation. The biomass for the three strains over four selection cycles areshown. For the simulation with strains grown separately, the initial conditions of all but one strain were set to zero and this was repeated for each strain. For thesimulation with strains grown together, initial conditions are as described in the Experimental section. The growth rates of the three strains were set to g1 = 0.8,g2 = 0.75, g3 = 0.6 h�1. (B) Biomass at the end of each selection cycle of C = 10 strains as a function of the selection cycle number. Growth rates gi are drawn froma normal distribution with mean = 0.5 and standard deviation = 0.05 h�1. Strains are ranked by color, such that the strain with the highest growth rate is shown inred and the lowest is shown in blue. (C) Biomass of the top 10, 5, and 1% of strains as a function of selection cycle. For these simulations C = 1000 strains, growthrates gi are drawn from a normal distribution with mean = 0.75 and standard deviation = 0.02 h�1. (D) Biomass of the top 10% of strains as a function ofthe standard deviation of the growth rates. C = 1000 strains were competed for six selection cycles. Growth rates gi are drawn from a normal distribution withmean = 0.5 h�1 and standard deviation as indicated in the figure. Insets show representative histograms for two of the growth rate distributions.
Integrative Biology Paper
Publ
ishe
d on
13
Janu
ary
2016
. Dow
nloa
ded
by U
nive
rsity
of
Ver
mon
t on
13/0
1/20
16 1
3:38
:26.
View Article Online
Integr. Biol. This journal is©The Royal Society of Chemistry 2016
where I is the input, ai is the maximal growth rate, and Ki is theinput concentration at which growth is half-maximal. Although theexact choice of this function is arbitrary, it represents situationswhere the input is required for growth, but where the growth rateeventually saturates, such as in a growth-coupled assay.14
Biofuel toxicity and efflux pump model
In Fig. 4A–C, we used a biofuel toxicity model we developedpreviously, which is based on fits to experimental data.22 Here,we briefly state the mathematical model; further details on itsderivation and parameter values are available in ref. 22 andfigures and additional background are available in ref. 25–27.
dN
dt¼ mmaxN
S
S þ KS
1
1þ cint
Kc
� �hc
1
1þ p
Kp
� �hp
dS
dt¼ �1
gmmaxN
S
S þ KS
dp
dt¼ ap0 þ ap � bp
dcint
dt¼ ac0
Vext
Vintcext � cintð Þ � accintp
N is the biomass of the strain, S is the substrate level, p is theefflux pump level, and cint is the intracellular biofuel concen-tration. The parameters and additional equations required forthe simulations are: mmax = 3.0 h�1, KS = 3.0, Kc = 0.25% v/v, hc = 2,Kp = 0.8, hp = 4.0, g = 1.05, ap0 = 0.092 proteins per h, b = 1 h�1,ac0 = 0.001 h�1, and ac = 30 h�1. Vcell = 1 � 10�15 L, mcell =9.5 � 10�13 g, Vr = 0.5 � 10�3 L, Vint = N � (Vr/mcell) � Vcell, Vext =Vr� Vint, and cext = (bext� Vr� cint� Vint)/Vext, where bext is the levelof biofuel input.
We varied the pump expression rate ap. For each pumpexpression rate, we simulated the effect of biofuel toxicity ongrowth using the four equations above. We then used the rateof biomass change over time, dN/dt, to calculate the meangrowth rate in mid-log phase, which we define as between 2 and4 hours. These growth rates, gi, were then used for all subsequentsimulations using the Lotka–Volterra equation described above.
Biofuel efflux pump model with feedback
The model in Fig. 4D and E is identical to the biofuel exportmodel above with the exception that the pump expressiondepends on the level of intracellular biofuel. Thus, the dp/dtequation is replaced, as described in ref. 27, with:
dp
dt¼ ap0 þ ap
cint
Kc
1þ cint
Kc
� bp
Growth rates were calculated and used in the Lotka–Volterracompetitive growth model in the same way as described in theprevious section.
Results and discussion
For our library, we consider a set of strains, all of which arevariants on each other, such as multiple instances of a syntheticcircuit design where mutations have been introduced. Whengrown separately, the strains have different growth rates, butshow similar growth curves (Fig. 1A). When pooled in equalproportion and grown together, the differences in growth rateare amplified, with strains that grow well eventually dominatingthe culture. As our model of selection, we assume that the strainsare grown in liquid media with 1:100 serial dilution every12 hours. As an illustrative example, we simulated selection
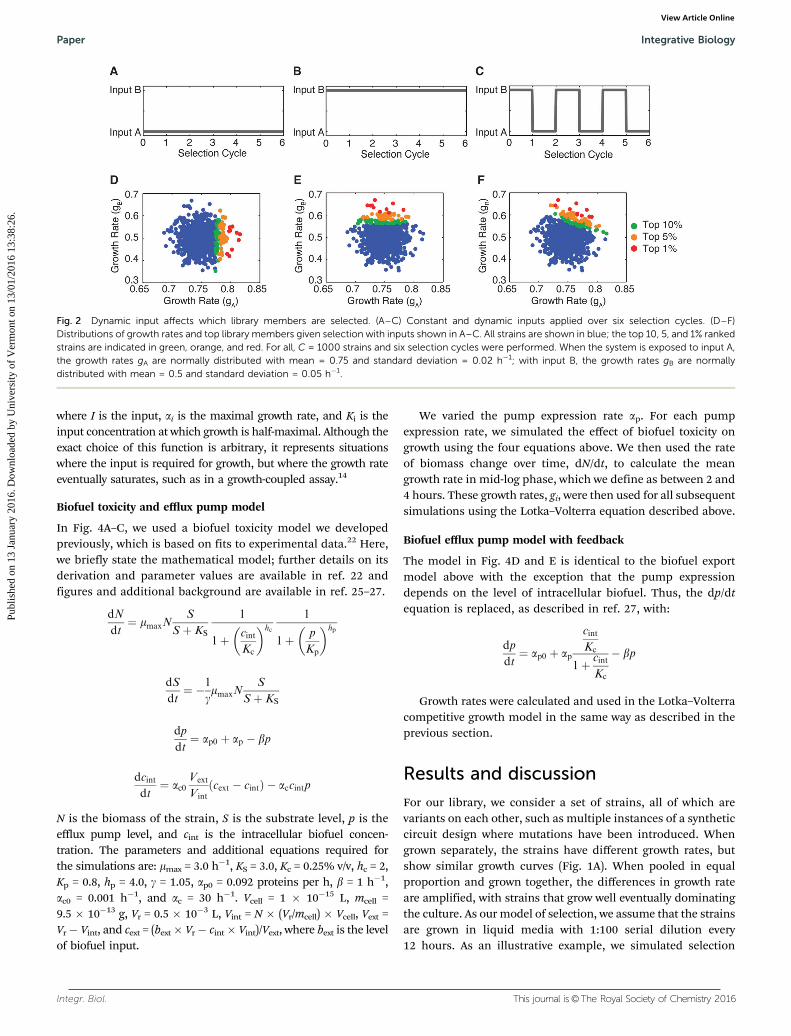
Fig. 2 Dynamic input affects which library members are selected. (A–C) Constant and dynamic inputs applied over six selection cycles. (D–F)Distributions of growth rates and top library members given selection with inputs shown in A–C. All strains are shown in blue; the top 10, 5, and 1% rankedstrains are indicated in green, orange, and red. For all, C = 1000 strains and six selection cycles were performed. When the system is exposed to input A,the growth rates gA are normally distributed with mean = 0.75 and standard deviation = 0.02 h�1; with input B, the growth rates gB are normallydistributed with mean = 0.5 and standard deviation = 0.05 h�1.
Paper Integrative Biology
Publ
ishe
d on
13
Janu
ary
2016
. Dow
nloa
ded
by U
nive
rsity
of
Ver
mon
t on
13/0
1/20
16 1
3:38
:26.
View Article Online

This journal is©The Royal Society of Chemistry 2016 Integr. Biol.
due to competitive growth of 10 strains with very minor differencesin growth rates (mean = 0.5, standard deviation = 0.05 h�1).Although the 10 strains start out with equal representation, withsubsequent selection cycles the top ranked strains make up largerproportions of the biomass, rapidly eliminating the lower rankedstrains (Fig. 1B).
We next considered a library with 1000 members and askedhow long it would take to converge to the top ranked members.Because competitive growth amplifies differences in growthrate, our model suggests that any library member that has anappreciable biomass at the end of the selection should be verysimilar in its performance to the top ranked library member. Inpractical terms, this means that it may be possible to run theselection for a much shorter amount of time. To quantify thisidea, we recorded the amount of biomass in the culture thatwas made up by the top 10%, 5%, and 1% of strains in thelibrary (Fig. 1C). In all cases, as the number of selection cyclesincreases the top performers make up an increasing fraction ofthe biomass. As expected, the 10% case converges more quickly
than the 5% case, which is faster than 1%. Importantly, theseresults indicate that within a small number of selection cycles,the top performers make up a large percentage of the biomass.For example, after six selection cycles, 99.8% of the biomass ismade up of strains from the top 10% of the library. Theseresults are in line with findings from a study targetingimproved production of naringenin and glucaric acid, wherefour rounds of selection were sufficient to dramatically improvetiters of these chemical compounds.14 Our findings suggestthat convergence to near-optimal solutions is rapid and canoccur within a small number of selection cycles, reducing effortand the potential for mutation.
The time to convergence depends upon library diversity. Werecorded the fraction of the total biomass that is made up bythe top 10% of the library after six dilution cycles as a functionof the standard deviation of the library members’ growth rates(Fig. 1D). We use standard deviation as a measure of diversitywithin the population. As expected, libraries that containvery similar members have low diversity and take longer toconverge. As diversity increases, convergence is faster. Eventhough convergence to the top 10% is slow when librarydiversity is low, because the library members are very similarit is still reasonable to run the selection for a small number ofcycles, as the solutions will all be similar and additionalselection cycles will yield little improvement.
We next asked how the selection would be influenced by thetype of selective pressure placed upon the library. We firstconsidered a case where we were interested in optimizinggrowth rate in the presence of two inputs. This could representa situation where there are two distinct inputs, for exampleselecting for a biosensor that responds to two different smallmolecules. Alternatively, the two inputs could be the samesignal present at two different levels, such as selecting forstrains that perform well in both low and high stress. Weinitially considered library members that had growth rates thatwere normally distributed about a mean value that depends onwhether input A and B is present (growth rates are gA and gB).We then subjected the libraries to conditions with only input A,only input B, and with switching between inputs A and B(Fig. 2A–C). The selection correctly sorts the library membersgiven the selective pressure. With only input A, the librarymembers that have the highest growth rate values (gA) areselected preferentially; these results are agnostic to the growthrate in the presence of input B (gB) (Fig. 2D). Equivalently, whengrowth is conducted with only input B, the selection optimizesfor high gB values (Fig. 2E). However, when there are multipleobjectives, constant selective pressure can be insufficient toselect for library members that function well under a variety ofconditions. As an illustration of this point, we applied an inputthat varied between A and B. In this case, the selection returnslibrary members that fall along a diagonal line, having goodgrowth rates in the presence of both inputs A and B (Fig. 2F).The slope of this line is determined by the ratio of time strainsare exposed to input A versus input B.
Dynamic selection methods can be used to identify librarymembers that perform well under changing conditions. As an
Fig. 3 Selections under dynamic inputs in a growth coupled assay.(A) Growth rate as a function of the input level. These curves are generatedusing normally distributed values for the maximal growth rate ai (mean = 1,standard deviation = 0.25 h�1) and half-maximal input levels Ki (mean = 0.5,standard deviation = 0.25). For all simulations C = 1000 strains; this figureshows 20 representative curves. (B, D, and F) Inputs applied over sixselection cycles. (C, E, and G) Distributions of growth rates at the minimaland maximal input levels, where Imin = 0.1 and Imax = 1. All strains are shownin blue; the top 10, 5, and 1% ranked strains are indicated in green, orange,and red.
Integrative Biology Paper
Publ
ishe
d on
13
Janu
ary
2016
. Dow
nloa
ded
by U
nive
rsity
of
Ver
mon
t on
13/0
1/20
16 1
3:38
:26.
View Article Online
Integr. Biol. This journal is©The Royal Society of Chemistry 2016
example, we considered a model where growth rate is a continuousfunction of input concentration. Our inspiration for this modelcomes from several recent examples of growth-coupled assays,12–15
where a sensor for a compound of interest is coupled with aselective marker. For our library, we used a sigmoidal function todescribe growth as a function of the input. We allowed both themaximum growth rate and the input concentration where half-maximal growth is achieved to vary, such that each library memberhas a unique growth function associated with it (Fig. 3A). Tosummarize the results, we plot the maximum growth rate, gmax,against growth with a constant low level of input, gmin. The shape ofthe distribution is dependent upon how variation in the twoparameters affects growth. As before, given a constant level ofinput, library members with high growth rates in the presenceof that input will be selected (Fig. 3B and C). However, we alsoconsidered conditions where inputs changed with time. Forexample, such an approach might be useful if a sensed com-pound is likely to change with growth phase. In contrast to theconstant input case, the selected library members now fallalong a curved line that balances growth in the presence ofchanging levels of the input (Fig. 3D–G).
Tradeoffs can also impact the underlying distribution of alibrary, and synthetic circuit design choices can dramaticallyalter the distribution shape. As a representative example, we
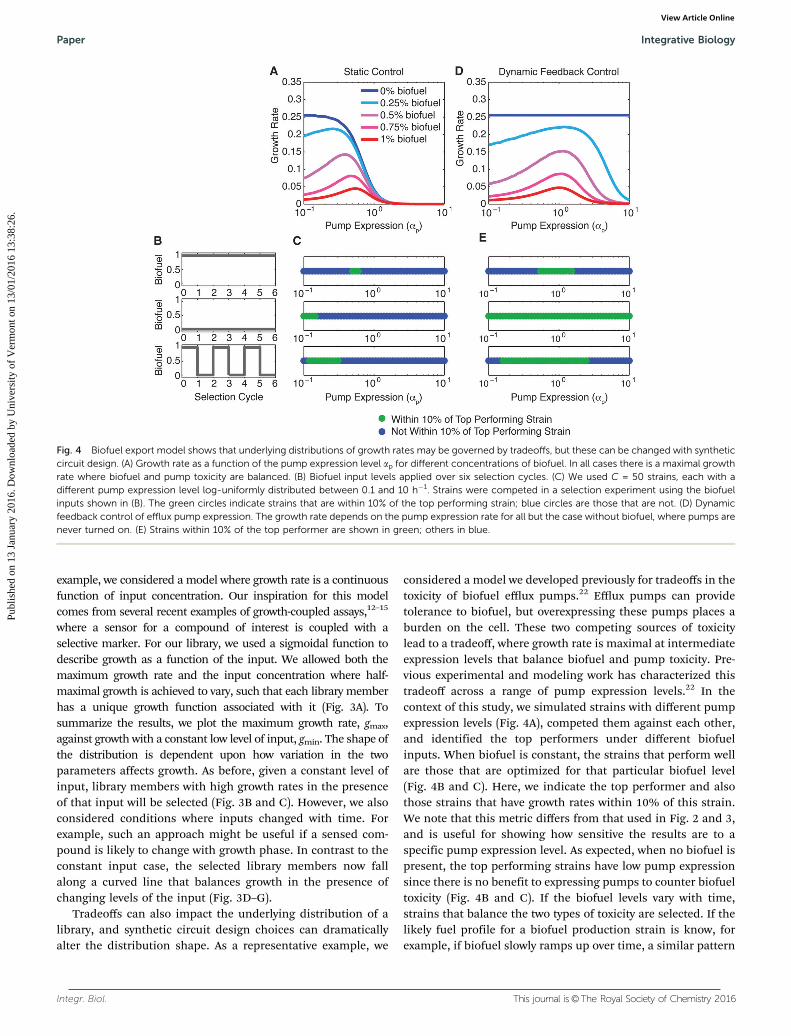
considered a model we developed previously for tradeoffs in thetoxicity of biofuel efflux pumps.22 Efflux pumps can providetolerance to biofuel, but overexpressing these pumps places aburden on the cell. These two competing sources of toxicitylead to a tradeoff, where growth rate is maximal at intermediateexpression levels that balance biofuel and pump toxicity. Pre-vious experimental and modeling work has characterized thistradeoff across a range of pump expression levels.22 In thecontext of this study, we simulated strains with different pumpexpression levels (Fig. 4A), competed them against each other,and identified the top performers under different biofuelinputs. When biofuel is constant, the strains that perform wellare those that are optimized for that particular biofuel level(Fig. 4B and C). Here, we indicate the top performer and alsothose strains that have growth rates within 10% of this strain.We note that this metric differs from that used in Fig. 2 and 3,and is useful for showing how sensitive the results are to aspecific pump expression level. As expected, when no biofuel ispresent, the top performing strains have low pump expressionsince there is no benefit to expressing pumps to counter biofueltoxicity (Fig. 4B and C). If the biofuel levels vary with time,strains that balance the two types of toxicity are selected. If thelikely fuel profile for a biofuel production strain is know, forexample, if biofuel slowly ramps up over time, a similar pattern
Fig. 4 Biofuel export model shows that underlying distributions of growth rates may be governed by tradeoffs, but these can be changed with syntheticcircuit design. (A) Growth rate as a function of the pump expression level ap for different concentrations of biofuel. In all cases there is a maximal growthrate where biofuel and pump toxicity are balanced. (B) Biofuel input levels applied over six selection cycles. (C) We used C = 50 strains, each with adifferent pump expression level log-uniformly distributed between 0.1 and 10 h�1. Strains were competed in a selection experiment using the biofuelinputs shown in (B). The green circles indicate strains that are within 10% of the top performing strain; blue circles are those that are not. (D) Dynamicfeedback control of efflux pump expression. The growth rate depends on the pump expression rate for all but the case without biofuel, where pumps arenever turned on. (E) Strains within 10% of the top performer are shown in green; others in blue.
Paper Integrative Biology
Publ
ishe
d on
13
Janu
ary
2016
. Dow
nloa
ded
by U
nive
rsity
of
Ver
mon
t on
13/0
1/20
16 1
3:38
:26.
View Article Online
This journal is©The Royal Society of Chemistry 2016 Integr. Biol.
for exogenous addition of fuel can be tested to select for a strainwith an optimized pump expression level.
The choice of synthetic circuit design can have a dramaticimpact on the underlying distribution of library members, makingit easier or more challenging to select for library variants that haveideal properties. To highlight this, we extended the biofuel tradeoffmodel to include feedback. We modeled this by allowing effluxpump expression to be controlled by intracellular biofuel concen-trations.26,27 This design mirrors that of several recent studies thathave used biosensors to control expression of toxic genes or theproduction of toxic pathway intermediates.17–21 As before, weintroduced variability in the pump expression level. With theaddition of feedback, the tradeoff between biofuel and pumptoxicity changes, and broader pump expression ranges allow forgood performance while mitigating biofuel toxicity (Fig. 4D). Usingthe same selection strategy as before, we identified those libraryvariants within 10% of the optimal strain, testing different biofuelinputs (Fig. 4B and E). In all cases, the number of library membersthat met the 10% criterion was increased relative to the systemwithout feedback (Fig. 4C and E). This finding highlights theimportance of coupling random approaches to library generationwith well-designed synthetic circuits. In the case of biofuel toxicity,there are feedback circuit designs that will dramatically outper-form static control. Selection can be used to distinguish betweenmany different options, but good synthetic circuit design will biaslibrary members towards optimal solutions. These libraries canthen be subjected to selection using dynamic inputs that mimicconditions of interest.
Conclusions
As designs of synthetic circuits and metabolic networks becomemore complex, it is often difficult to tell in advance which exactparameters will lead to desired phenotypes. The ability to couplerational design with diversity introduced through mutagenesis ormultiplexed genome engineering strategies offers researchers thepotential to screen many library variants for a desired phenotype.Recent studies have shown the great potential of coupling phenotypeto growth-based assays, allowing for efficient selection of desiredtraits.12–14
Here, we use a competitive growth simulation to show that itis possible to rapidly differentiate library variants based on subtledifferences in growth rate. Only a small number of selection cyclesare necessary to converge to near-optimal solutions. This offersgreat potential for engineering applications, where near-optimalsolutions are often acceptable. In this work, we used a competitiveLotka–Volterra model, however other models, such as those thatexplicitly model competition for nutrients28 or relative fitnessbenefits,29,30 could allow other effects to be incorporated.
The main contribution of this study is that we consideredthe possibility that the desired phenotype is a combination ofdifferent factors and may change over time. These are importantconsideration, as designs for biosensors and metabolic engineeringapplications often involve tradeoffs and the ability to select basedon more than one trait has the potential to dramatically improve
how selections are performed. We considered differences ingrowth rate under two different inputs and showed that distinctlibrary members are selected based on which inputs areapplied. The shape of the underlying distribution is alsoimportant for determining what will result from a selection.We considered two examples: input-dependent growth and abiofuel export system. In each case, it is possible to usedynamic inputs to bias selections towards library memberswith traits that match changing inputs. In the biofuel modelwe showed that the underlying distribution of library memberscould be altered to bias the library towards ideal phenotypes.The ability to generate many variants and select is not asubstitute for well-designed synthetic circuits; good circuitdesign can dramatically improve the changes of finding avariant that has a desired phenotype. This work highlightsthe potential of evolution-guided design for synthetic biologywhere desired phenotypes have multiple, dynamic objectives.
Acknowledgements
We thank Mads Almassalkhi for helpful discussions. This work wassupported by the Office of Science (BER) at the U.S. Department ofEnergy.
References
1 J. A. Dietrich, A. E. McKee and J. D. Keasling, Annu. Rev.Biochem., 2010, 79, 563–590.
2 C. Engler, R. Kandzia and S. Marillonnet, PLoS One, 2008,3, e3647.
3 D. G. Gibson, L. Young, R. Y. Chuang, J. C. Venter,C. A. Hutchison and H. O. Smith, Nat. Methods, 2009, 6,343–345.
4 J. Quan and J. Tian, Nat. Protoc., 2011, 6, 242–251.5 H. H. Wang, F. J. Isaacs, P. A. Carr, Z. Z. Sun, G. Xu,
C. R. Forest and G. M. Church, Nature, 2009, 460, 894–898.6 T. Jakociunas, I. Bonde, M. Herrgård, S. J. Harrison,
M. Kristensen, L. E. Pedersen, M. K. Jensen and J. D. Keasling,Metab. Eng., 2015, 28, 213–222.
7 J. E. DiCarlo, A. J. Conley, M. Penttila, J. Jantti, H. H. Wangand G. M. Church, ACS Synth. Biol., 2013, 2, 741–749.
8 O. W. Ryan, J. M. Skerker, M. J. Maurer, X. Li, J. C. Tsai,S. Poddar, M. E. Lee, W. DeLoache, J. E. Dueber, A. P. Arkin,J. H. Cate and E. Izaurralde, eLife, 2014, 3, e03703.
9 T. J. Ford and P. A. Silver, Curr. Opin. Chem. Biol., 2015, 28,20–28.
10 D. Liu, T. Evans and F. Zhang, Metab. Eng., 2015, 35–43.11 J. Zhang, M. K. Jensen and J. D. Keasling, Curr. Opin. Chem.
Biol., 2015, 28, 1–8.12 J. Yang, S. W. Seo, S. Jang, S.-I. Shin, C. H. Lim, T.-Y. Roh
and G. Y. Jung, Nat. Commun., 2013, 4, 1413.13 J. A. Dietrich, D. L. Shis, A. Alikhani and J. D. Keasling, ACS
Synth. Biol., 2012, 47–58.14 S. Raman, J. K. Rogers, N. D. Taylor and G. M. Church, Proc.
Natl. Acad. Sci. U. S. A., 2014, 111, 17803–17808.
Integrative Biology Paper
Publ
ishe
d on
13
Janu
ary
2016
. Dow
nloa
ded
by U
nive
rsity
of
Ver
mon
t on
13/0
1/20
16 1
3:38
:26.
View Article Online
Integr. Biol. This journal is©The Royal Society of Chemistry 2016
15 K. M. Esvelt, J. C. Carlson and D. R. Liu, Nature, 2011, 472,499–503.
16 W. J. Holtz and J. D. Keasling, Cell, 2010, 140, 19–23.17 W. R. Farmer and J. C. Liao, Nat. Biotechnol., 2000, 18,
533–537.18 R. H. Dahl, F. Zhang, J. Alonso-Gutierrez, E. Baidoo, T. S. Batth,
A. M. Redding-Johanson, C. J. Petzold, A. Mukhopadhyay, T. S.Lee, P. D. Adams and J. D. Keasling, Nat. Biotechnol., 2013,1039–1046.
19 D. Liu, Y. Xiao, B. S. Evans and F. Zhang, ACS Synth. Biol.,2015, 4, 132–140.
20 P. Xu, L. Li, F. Zhang, G. Stephanopoulos and M. Koffas,Proc. Natl. Acad. Sci. U. S. A., 2014, 111, 11299–11304.
21 F. Zhang, J. M. Carothers and J. D. Keasling, Nat. Biotechnol.,2012, 30, 354–359.
22 W. J. Turner and M. J. Dunlop, ACS Synth. Biol., 2015, 4,1056–1063.
23 M. J. Dunlop, Z. Y. Dossani, H. L. Szmidt, H. C. Chu,T. S. Lee, J. D. Keasling, M. Hadi and A. Mukhopadhyay,Mol. Syst. Biol., 2011, 7, 487.
24 S. H. Strogatz, Nonlinear Dynamics and Chaos, 1994.25 M. Frederix, K. Hutter, J. Leu, T. S. Batth, W. J. Turner,
T. L. Ruegg, H. W. Blanch, B. A. Simmons, P. D. Adams,J. D. Keasling, M. P. Thelen, M. J. Dunlop, C. J. Petzold andA. Mukhopadhyay, PLoS One, 2014, 9, e101115.
26 M. E. Harrison and M. J. Dunlop, Front. Microbiol., 2012, 3, 360.27 M. J. Dunlop, J. D. Keasling and A. Mukhopadhyay, Syst.
Synth. Biol., 2010, 4, 95–104.28 A. Y. Weiße, D. A. Oyarzun, V. Danos and P. S. Swain, Proc.
Natl. Acad. Sci. U. S. A., 2015, 112, E1038–1047.29 M. Acar, J. T. Mettetal and A. van Oudenaarden, Nat. Genet.,
2008, 40, 471–475.30 J. Garcia-Bernardo and M. J. Dunlop, PLoS Comput. Biol.,
2013, 9, e1003229.
Paper Integrative Biology
Publ
ishe
d on
13
Janu
ary
2016
. Dow
nloa
ded
by U
nive
rsity
of
Ver
mon
t on
13/0
1/20
16 1
3:38
:26.
View Article Online