Embed Size (px)
Citation preview

..362 PHILIPS TECHNICAL REVIEW VOLUME 21
PERFORMANCE TESTS ON LOUDSPEAKERS
by M. T. HAITJEMA, W; KOPINGA and S. J. PORTE.
The article below describes a number of established methods of loudspeaker testing used overthe years at Philips. These methods have proved particularly valuable in the design of loud-speakers and loudspeaker cabi,,;ets. Some are also well adapted for sampli~g inspection duringmanufacture.
The loudspeaker tests discussed in this article areconcerned with:a) the variation of sound pressure as a function of. frequency,
b) the variation of loudspeaker impedance as afunction of frequency,
c) the resonance frequency,d) transients, such as occur when the signal applied
to the loudspeaker suddenly drops to zero,e) directivity patterns, giving the sound pressure
in different directions at constant frequency inpolar coordinates, and .
f) the variation of loudspeaker efficiency as afunction of frequency.Sound pressure, impedance and efficiency are
recorded as a function of frequency on a strip-chartrecorder; the transients and the directivity patternsare displayed on a cathode-ray oscilloscope 1).
Sound pressure as a function of frequency
The procedure for recording the variation of thesound pressure of a loudspeaker as a function offrequency (frequency response) is as follows. Thesignal from a signal generator is applied to the loud-speaker under test via an amplifier. Mounted in linewith the axis of the loudspeaker 2) is a condensermicrophone, the signal from which is amplified andrecorded. Loudspeaker and microphone are situatedin an acoustically dead (non-reverberant) room at adistance of 50 cm apart (fig. 1). This distance provedto he the best compromise in connection with theimperfections of the dead room and the dimensionsof the loudspeaker (provided that the diameter ofthe cone is not larger than about 30 cm).
Asmall motor drives a rotary capacitor in the signalgenerator such that the frequency is swept from 0 to
1) The methodsofrecording directivitypatterns and efficiencycurves were describedbriefly in T. Ned. Radiogenootschap23, 303-309, 1958(No. 6). .
2) All the tests described here were made on loudspeakerswithout baffles. Thus, the properties of the loudspeakeritself were measured, and not the additional properties ofa baffle.
53.08:621.395.623.7
20000 cis, the range from 0 to 100 cis linearly withtime and the range from 100 to 20000 els logarith-mically (equal times for each swept octave). Thesame motor drives the strip-chart recorder. To allowfor possible small discrepancies between the fr~-quency scale printed on the paper strip and the truefrequency variation, the generator signal is auto-matically interrupted for a moment as its frequencypasses 1000 els.
i 'M07' I~.L_._._.~._._._. ._.J ~
Fig. L Block diagram of apparatus for recording the soundpressure of a loudspeaker L as a function of the frequency ofa signal generator G. A1 amplifier with 50 Woutput stage inpush-pull. M condenser microphone. A2 microphone amplifier.Ree recorder. MOl motor, which causes the frequency to sweepfrom 0 to 20000 cis and also drives the strip-chart recorder.K dead room.
The amplifier Al between the signal generator andthe loudspeaker has a 50 Woutput stage in push.pull fitted with four EL 34 pentodes in class AB.The output transformer is provided with taps formatching to loudspeaker coils of different impe-dance. Depending on whether the output current oroutput voltage is to be kept constant with varyingfrequency, 20·fold negative current or voltage feed-back can be switched in. The frequency response is'~ecorded at a constant current, viz. -v50 X 10-31Ramp, where R is the DC'resistance ofthe loudspeakercoil in ohms. This means a power consumption of50 mW at low frequencies.
The microphone amplifier A2 is corrected so as togive the condenser microphone' plus amplifier a flatfrequency response from 20 to 20000 els.
The recorder is fitted in the usual way with aninput potentiometer whose sliding contact is coupledwith the stylus. The arrangement IS such that thestylus is at rest only when the sliding contact is at
'1
I
II

1959/60, No. 12 PERFORMANCE TESTS ON LOUDSPEAKERS 363
a point having a potentialof 10 mV with respect toearth (the deflection is thus zero for input signalssmaller than 10 mV). The relation between thedeflection of the stylus and the input voltagedepends on the resistance law of the potentiometer.In the present case a decibel scale is required for theordinate of the response curve, whereas a linear scaleis needed for the impedance characteristic, discussedbelow. Two interchangeable input potentiometersare therefore used, one of which gives a logarithmicand the other a linear scale, both for input voltagesfrom 10 mV upwards.
Fig. 2 shows a loudspeaker frequency responsecurve recorded by the method described.
Electrical impedance as a fnnction of frequency
The electrical impedance of a loudspeaker is theratio of the voltage across the loudspeaker coil tothe current through it. When the current is keptconstant, the voltage is thus proportional to theimpedance. For recording the impedance/frequencycurves the loudspeaker is again fed via the above-mentioned push-pull amplifier (with negative cur-rent feedback) with an audio signal from the signalgenerator, and the voltage across the loudspeakercoil is recorded. In this case the recorder uses thepotentiometer giving a linear scale.
Fig. 3 shows two examples of impedance curves.Unlike curve 1, curve 2 was recorded on a loud-speaker fitted with a short-circuiting ring 3). Thiscauses the impedance to rise much less sharply withfrequency, thereby improving the reproduetion ofhigh notes.
Determination of the resonance frequency
The resonance frequency of a loudspeaker IS thp-frequency at which the electrical impedance showsa maximum, by analogy with an inductance andcapacitance in parallel which, in the region of theresonance frequency, form the electrical equivalentof the loudspeaker. The resonance frequencydepends on the construction of the loudspeaker andalso, where present, on the cabinet. The import.anccvof the resonance frequency lies in the fact that itconstitutes roughly the lower limit of the spectrumwhich the loudspeaker is capable of reproducing.(Below the resonance frequency the sound pressuredrops with decreasing frequency by 18 dB peroctave in the case of a loudspeaker withoutbaffle, and by 12 dB per octave in the case of aloudspeaker in an infinitely large baffle.)
3) See Philips tech. Rev. 18, 313, 1956/57.
I II It I
p I)1t IOdB
I
I
I , 1/J3, ,""
Fig. 2. Recording of sound pressure P as a function of frequen-cy f (frequency response), obtained bv the method illustratedin fig. 1. Sound-pressure scale logarithmic; frequency scalelinear from 0 to 100 cis, logarithmic from 100 to 20000 cis.At 1000 cis there is a marker dip, obtained by momentarilyinterrupting the signal at this frequency.
The resonance frequency is determined by keepingthe voltage across the loudspeaker constant (nega-tive voltage feedback) and by adjusting the fre-quency of the signal generator until the current isminimum; this frequency is the resonance frequency.The constant voltage is chosen such that the mini-mum current is 50 mA for loudspeakers of lowresistance (of the order of 10 ohms), and 5 mA forloudspeakers of high resistance (400 or 800 ohms) 4).At these currents the amplitude of the cone is so smallthat non-linearity in the deformation of the center-ing ring or of the rim of the cone can be neglected.
Fig. 3. Recordings of the impedance Z of a loudspeaker (linearscale) as a function of frequency f (in cis). Curve 2 refers toa loudspeaker fitted with a short-circuiting ring 3), curve 1 toa loudspeaker wi thout such a ring. The flatter shape ofcurve 2 implies better reproduetion of the high notes.
For determining the resonance frequency of loud-speakers in manufacture, an instrument giving adirect reading is preferred. An instrument of thiskind has been devised, in which the loudspeakerunder test functions as the Le circuit of an oscil-lator. The latter is provided with both positive andnegative feedback. Both feedback circuits contain
4) For high-resistance loudspeakers, see Philips tech. Rev. 19,42, 1957/58.

364 PHILlPS TECHNICAL REVIEW VOLUME 21
non-linear elements which are dependent on thecurrent. This makes the current through the loud-speaker virtually independent of the damping atresonance, the value of which may differ consider-ably for loudspeakers of different types. The fre-quency at which the system oscillates is the reso-nance frequency of the loudspeaker and can be readfrom a direct-reading frequency meter.
Oscilloscopic display of transients
Of great importance to the good reproduction ofspeech and music is the way in which the loud-speaker responds to plosives and the sudden entryof musical instruments, that is its response to abruptinitiation or removal of the electrical signal. Theresultant transients, and in particular the subsidencetransient following the interruption of the signal,can be studied by the following method.
The loudspeaker is supplied with a periodicallyinterrupted sinusoidal signal (sine wave trains). Theacoustic signal delivered by thc loudspeaker, andpicked up by a neighbouring microphone, is dis-played on a cathode-ray oscilloscopc. The oscillo-gram shows the initiation transient as well as thesubsidence transient. The display ofthe latter can beimproved by inserting a device between microphoneand oscilloscope which suppresses the microphonesignal for thc duration of each applied wave train,so that only the transient prop cr remains visible.Loudspeaker and microphone must be set up in anacoustically dead room, as otherwise reverberationwould appear as spurious deflections in the oscillo-gram.
Fig. 4 shows the block diagram ofthe circuit. Anelectronic switch El between the signal generator Gand the push-pull amplifier Al produces the sinus-oidal signals by intermittently passing the voltagefrom the signal generator for a certain number ofcycles n and blocking it for the same length of time;the signal is switched on and off at the moment thesine wave passes through zero. The electronic switchis controlled by a square-wave voltage supplied bythe frequency-divider stages C (bistable multivibra-tors), one or more of which can be switched in toset n at 4, 8, 16 or 32 cycles. The first divider stagereceives its input signal from the signal generatorvia the circuit E, which converts the sinusoidalsignal into a square-wave voltage. Fig. Sa shows anoscillogram of the microphone signal for f = 2500 cis,n = 16.
To suppress the microphone signal during eachapplied wave train, an electronic switch E2 is placedbetween the microphone amplifier A2 and the
99905
Fig. 4. Block diagram of the equipment for displaying tran-sients. G signal generator. El electronic switch producing wavetrains from the sinusoidal voltage. Al push-pull amplifier.L loudspeaker under test and M microphone in dead room K.A2 microphone amplifier. E2 electronic switch for suppressingthe microphone signal during the presence of the wave train.o cathode-ray oscilloscope. B circuit for converting the sinus-oidal waveform into a square-wave form. C frequency dividerscontrolling electronic switches El and E2; they deliver square-wave forms of fundamental frequencies 1/4, lis, 1/16 and 1/32times the frequency f of the signal generator. D device whichdelays the control signal for E2 by an amount equal to the timetaken by the sound to travel from L to M.
oscilloscope. This switch is controlled by the samesquare-wave voltage as El' but roughly in anti-phaseand moreover with a fixed time-delay equal to thetime which the sound from the loudspeaker takes toreach the microphone. The way in which the controlsignal is delayed is explained in fig. 6. The suppres-sion is effective when the oscilloscope in fig. 4 is
a
b
Fig. 5. a) Oscillogram of the microphone voltage in fig. 4(oscilloscope connected to point x).b) Oscilloscope connected to point y in fig. 4: the microphonesignal is suppressed for the duration of the wave train itself,leaving only the transient visible.

1959/60, No. 12 PERFORMANCE TESTS ON LOUDSPEAKERS
_b{ : V : r :I I I----r---t-r--r-, ,I 1
: l~ ~~~ __I 1, I
II
I j---t J1 1 ~,----~,
, 1
1---'-
_g { ,1,
1,
I 1 1
I' + I' I' 4C "" " î ", i •, 1
f
'( .ir iT 99971
connected to point y. The resultant oscillogram ofthe transient alone is shown in fig. Sb.
As regards the transients at lower frequencies itmakes a great difference whether the push-pullamplifier Al operates with negative current orvoltage feedback. In the first case the amplifier
a
Fig. 6. Illustrating the way in which network D (fig. 4) delaysthe control signal for the electronic switch E2 by a variabletime T, independent of the frequency fa) Square-wave voltages in anti-phase, derived from the fre-quency dividers C (fig. 4), A half period iT comprises n cyclesof the signal-generator voltage (n = 4, 8, 16 or 32),b) Negative pulses obtained by differentiating the square-wavesignals (a) and blocking the positive pulses.c) Positive pulses obtained by amplifying the pulses in (b).The pulses (c) control a monostabie flip-flop which, after eachtriggering pulse, returns to the quiescent state with an adjust-able delay (by means of RC network with variable resistance).d) Output of monostabie flip-flop, The reset time of the flip-flopcan be varied between the limits Tl and T2.
e) Pulses produced by differentiating, clipping and amplifyingthe signal in (d). These pulses can be varied in time betweenthe limits Tl and T2, and are used to trigger a second multi-vibrator.f) Square-wave voltage delivered by the second multivibrator.The signals in (d) are so adjusted that the square-wave volt-age (f) has the same half period tT as the signals in (a), butare displaced relative thereto by a variable interval T. Thesignal (f) controls the electronic switch E2 (fig, 4).
behaves like a current source. Its internal resistance-- in parallel with the loudspeaker -- is then about100 X higher than the loudspeaker resistance: theloudspeaker is thus only feebly damped and thetransient takes a relatively long time to subside.With negative voltage feedback the amplifier be-haves like a voltage source, the internal resistanceis low (about 0.1 ohm): the loudspeaker is thenstrongly damped and therefore the transient isshort-lived. The difference can be seen in the oscillo-grams in fig. 7a and b.
Some particulars of the oscilloscope are discussedat the end of the following section.
Display of directivity patterns
The directivity pattern of a loudspeaker presentsthe variation of the sound pressure -- at a givendistance and at constant frequency -- in differentdirections. The form of the pattern depends on thefrequency and on the dimensions and constructionof the loudspeaker and of the cabinet or baffle, ifpresent.
Fig. 7. Oscillograms of the microphone voltage (oscilloscope in fig. 4 connected to point x)at f = 180 cis, n = 8, In (a) tbe amplifier Al operated with negative current feedbackso that tbe loudspeaker was only weakly damped; in (b), the amplifier operated withnegative voltage feedback so that the loudspeaker was heavily damped.
365
b
366 PHILIPS TECHNICAL REVIEW VOLUME 21
In our test set-up the loudspeaker is rotated infront of a fixed microphone in an acoustically deadroom (fig. 8). By a method presently to be discussed,the logarithmically-amplified microphone signal isdisplayed on an oscilloscope in polar coordinates asa function of direction and at constant frequency.
Fig. 8. Set-up for obtaining directivity patterns. G signalgenerator. Al push-pull amplifier. L loudspeaker under testin dead room K and, together with the liquid potentiometer Pl,rotated about a vertical axis by motor Mo2• M microphone.A2 microphone amplifier. A3 logarithmic amplifier. Det detec-tor. 0 oscilloscope.
We shall first explain how a polar diagram can bepresented on an ordinary oscilloscope with two pairsof deflection plates. When a voltage E sin wt isapplied to one pair of plates and a voltage E cos wtto the other pair, a circle is traced on the screen 5).If these voltages are modulated in amplitude by aperiodic time-function of fundamental frequencyk. wj2n (k an integer), a "modulated circle"is produced, that is to say one in which the radius isvaried. The angle wt is kept constantly equal to theangle a through which the loudspeaker is rotatedduring the time interval from 0 to t, and the ampli-tudes E are modulated in accordance with thelogarithmically amplified microphone signal.
5) It is assumed for the sake of simplicity that the two pairsof plates are equally sensitive. The difference in sensitivitythat actually exists must be corrected by adjusting theamplitudes of the two voltages to the correct ratio.
The voltages E sin wt and E cos wt are taken froma liquid potentiometer, the principle of which isillustrated in fig. 9. An insulating container 1 isfilled with a conductive liquid (ethylene glycol). Onopposite sides of the container carbon plates (2, 3)are mounted, and between them a disc 4 of insulat-ing material is rotated at a constant angularvelocity w. Fitted to the periphery of the disc,90° apart, are two contacts of graphite (5, 6) whichare led out via slip rings. Connected between plates 2and 3 is a centre-tapped battery of voltage 2E, thecentre-tap being earthed. The liquid in the plane ofsymmetry between the plates is therefore at earthpotential, and the voltages on 5 and 6 vary, withrespect to earth, asE sin wt and E coswt, respectively(disregarding a constant factor equal to the ratio ofthe diameter of the disc to the distance between thecarbon plates).
t
+ .,.---T: E
~}hI E
L...... ...L...JI __ J99973
Fig. 9. Liquid potentiometer (Pl in fig. 8) seen from above.1 insulating container filled with a conducting fluid. 2, 3 carbonplates. 4 disc of insulating material, rotating with angularvelocity w. 5, 6 graphite contacts 90° apart on the periphery ofthe disc 4. When voltages +E and -E with respect to earthare applied to plates 2 and 3, the potentials of contacts 5 and 6vary according to E sin wt and E cos wt, respectively.
When these two voltages are applied to thedeflection plates of the oscilloscope, a circle is tracedon the screen which, when the applied voltage 2Eis varied, becomes a "modulated circle". Thisvarying DC voltage is obtained by rectifying the
1000 cis 2000 cis 3000 cis

1959/60, No. 12
a
PERFORMANCE TESTS ON LOUDSPEAKERS
99970'__.. _ ..J
b
Fig. 10. a) Mechanism for rotating the loudspeaker L about a vertical axis (1/3 rev per secfor recording directivity patterns). P2 potentiometer required for recording efficiencycurves. b) Mechanism seen from the other side, revealing the liquid potentiometer P1(cf. figs. 8 and 9) and the driving motor Mo2•
output voltage of the logarithmic amplifier Aa(fig. 8) by the detector Det.The rotary mechanism, with a loudspeaker
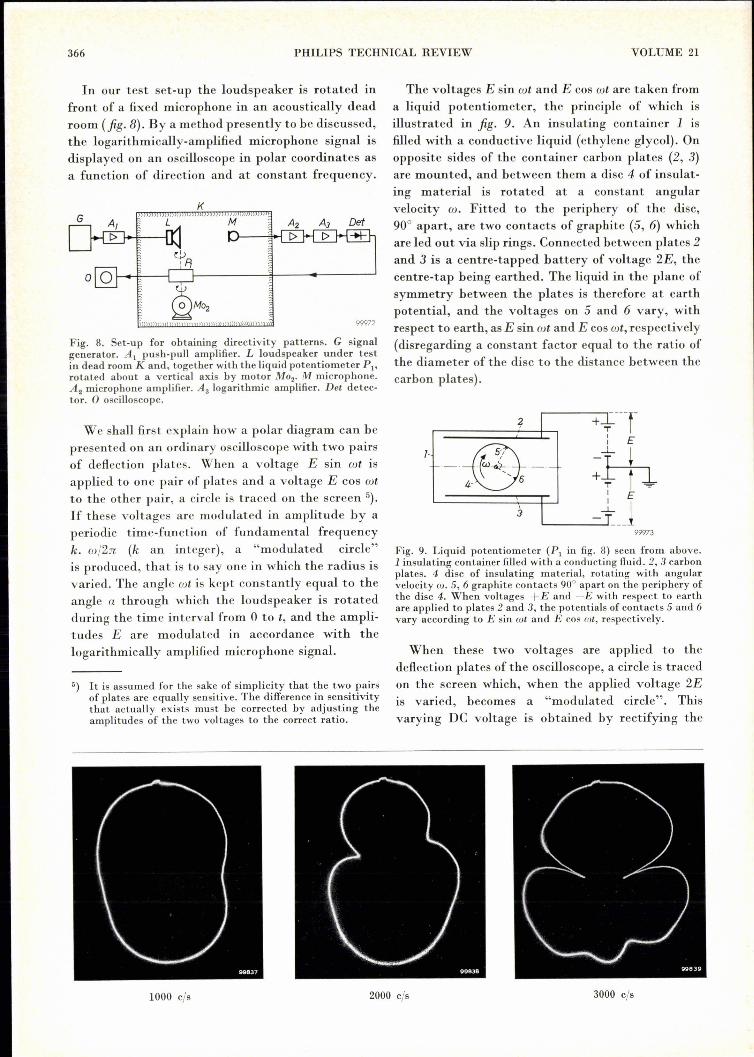
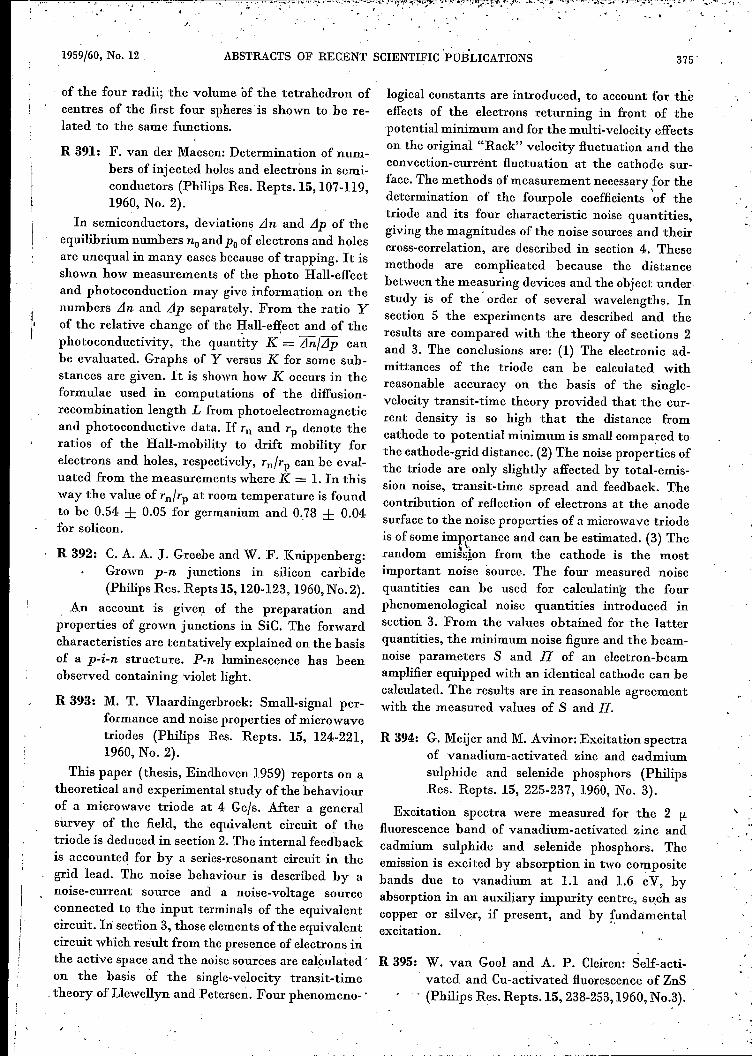
mounted on it, is shown in fig. lOa. The liquidpotentiometer (PI) can be seen in fig. lOb. Fig. 11reproduces some examples of directivity patternsrecorded with the set-up described.
8000 cis
The logarithmic gain is obtained by using type EBF 80pentodes in the first two stages of A3. A feature of this valve isthat the logarithm of the transconductance S at constantscreen-grid voltage is approximately a linear function of thecontrol-grid voltage (fig. 12). The rectified output signal is usedfor negatively biasing both EBF 80 pentodes. As a result, thelogarithm of the gain is virtually proportional to the amplitudeof the input signal, so that the microphone signal is recorded on
Fig. ll. Directivity patterns recorded atdifferent frequencies on a double-coneloudspeaker, type 9710 M (outer diameter216 mm), without cabinet or baffle.
16000 cis
367

368 PHILIPS TECHNICAL REVIEW VOLUME 21
1/EBF80
/Vg2=65V~J =OV '.;
, .
Va =250V
I:'
1//
V/
\::
s
i
10
To-T5V -TO -5-~, 99906
Fig. 12. Transconductance S (on 10g:1rithmic scale) of a pentodetype EBF 80 as a function of control-grid voltage Vg]' at ascreen-grid voltage of 65 V, a suppressor-grid potentialof zerovolts and an anode potentialof 250 V. The characteristic isapproximately straight, so that S is virtually a logarithmicfunction of Vgl'
a logarithmic scale.The detector DeL consists of two full-wave rectifiers, the
output from one being positive and from the other negativewith respect to earth. Full-wave rectifiers are used to reduceripple and to provide effective smoothing. The ripple voltagemust be kept small because it is superimposed as a spuriouseffect on the modulation of the circle. On the other hand, thereis a limit imposed on the time constant for the smoothing:ifit is too long, the direct voltages cannot vary rapidly enoughand the pattern loses detail. The maximum permissible timeconstant is determined by the speed at which the loudspeakeris rotated (here '/3 revolution per second) and by the smallestangle of rotation wi thin which the maximum pressure differencein the pattern must still be reasonably perceptible. This anglewas taken as 5°, and the maximum permissible time constantis therefore: (5/360) X 3 = '/24 sec. With full-wave rectificationadequate smoothing is obtained with this fairly short timeconstant.
The oscilloscope
The transients and the directivity patterns aredisplayed on two oscilloscope tubes connected inparallel. One of these serves as the oscilloscopeproper and must have a very long persistence screen,the time taken to trace a directivity pattern being3 sec. The other tube is used for photographingoscillograms and is accordingly provided with ablue-luminescent phosphor of short persistence.Focusing and brilliance for the two tubes are
controlled separately. A photograph of the oscillo-scope rack appears in fig. 13.For the recording of directivity patterns, both
components of the signal voltage are modulatedwith the loudspeaker rotational frequency of t el».AC amplifiers would have to be given impracticallylarge RC values in order to reproduce such low-frequency signals without distortion. DC amplifiersare therefore used, the principal data for which areas follows:
Gain 2000 x,± 1 dB from 0 to 20 kc/s,± 3 dB to 50 kc/so60 V.< 2%.approx. 0.5 MO.
Max. output voltage.Distortion .Input impedance . .
Fig. 13. Rack with two oscilloscope tubes and associatedequipment. The left tube serves for observation of the direc-tivity patterns and has a greenish-yellow luminescent phosphorof long persistence. The right tube is used when oscillogramsare to be photographed, and has a blue-luminescent screen ofshort persistence.

.~..
1959/60, No. 12 PERFORMANCE TESTS ON LOUDSPEAKERS 369
The study of transients calls for a sawtooth sweep voltageof very low frequency, in order to be able to display at leastone complete wave train plus the interval between two trains.The time involved may be up to 64 cycles of the audio fre-quency used. At the lowest audio frequency (20 els) the lowestsweep frequency must therefore be 2°/64 F:::I 0.3 els. The time-base generator uses a Miller integrator based on a transitroncircuit 6). This produces a closely linear sawtooth voltage ofvery low frequency without the need for a high supply voltageor high capacitances. The sawtooth voltage is amplified by oneof the DC amplifiers mentioned above.
Loudspeaker efficiency as a function of frequency
The efficiency 'YJ of a loudspeaker is the ratio ofthe radiated acoustic power Wo to the electricalinput power Wi' The latter is the sum of Wo and thelosses, such as the electricalloss PR in the coil andthe mechanicallosses in the centering ring and in therim of the cone. In the region of 500 els the efficiencyof most loudspeakers is only a few per cent 7); thelosses there are thus much greater than Wo, and byfar the largest part of these losses is due to l2R. It istherefore the usual practice to measure efficiency atconstant current l, and to regard Wi to the firstapproximation as identical with l2R, although thisis not correct in three respects:1) it neglects the other losses with respect to l2R,2) it neglects Wo with respect to l2R,3) it takes no account of the fact that R is frequen-
cy-dependent.These errors only become significant, however, at
frequencies higher than about 1000 cis, mainly be-cause the iron losses (or the copper losses if the loud-speaker is fitted with a short-circuiting ring) are thenno longer negligible in relation to l2R. At thesefrequencies, then, it is necessary to apply to therecorded curve a correction as a function of fre-quency. This correction takes account of the extralosses and also, in the region of several kcls, of theradiated power. We shall not discuss here thedetermination of the correction curve, which can bedone by the so-called three-voltmeter method.Let us now turn to the method of determining the
radiated acoustical power Wo. We assume that theloudspeaker possesses rotational symmetry about itsaxis. The sound intensity at a distance r from theloudspeaker, a~d in a direction a with respect to theaxis, will be denoted by lea). The power dWoradiated between the directions a and a + da (seefig. 14) is then:
dWo = l(a) X 2nr sin a X T da.
6) See e.g. F. Kerkhof and W. Werner, Television, PhilipsTechnical Library, 1952, page 138 et seq.
7) J. de Boer, The efficiency of loudspeakers, Philips tech.Rev. 4, 301-307, 1939.
For lea) we can write p2(a)/(!c, where pea) is ther.m.s, sound pressure at a distance T in a directiona, (! is the density of the air and c is the velocityof sound in air. This gives us:
27tr2dWo = -- p2(a) sin a da.
(!C .
The :total radiated power Wo is therefore:
"2nr2 fWo = -- p2(a) sin a da.(!C
o(1)
If we have the directivity pattern of the loud-speaker at various frequencies, we could derive Woat these frequencies from the bounded area of thecurve obtained by multiplying the radius vectors in
,. ~
Fig. 14.When the loudspeaker L possesses rotational symmetryabout the axis a = 0, a sound intensity I(a) prevails at everypoint of the hatched segment. The surface area of the segmentis (2:n:r sin a) X r da. The acoustic power incident on thesegment is [(a) X 2:n:r2sin a da. By integrating this expressionover a (see eq.1), we find the total radiated acoustic power Wo'
the directivity pattern by ilsin al. This area can befound by planimetry, but this is a cumbersomemethod, particularly if it is required to find theefficiency for a whole series of frequencies.
In principal it would be possible to measure Woby disposing a very large number of microphones ina circle around the loudspeaker; by squaring themicrophone voltages, multiplying them by thecorresponding value of [sin al and adding the results .together, we should find the approximate value ofthe integral in'{L), However, this method is ruled outtoo by the high costs of the numerous condensermicrophones that would be needed.
Fig. 15 illustrates a method bywhich, with onlyone microphone, the loudspeaker efficiency can berecorded directly as a function of frequency. Themicrophone is set up in a dead room, and in front
..

370 PHILlPS TECHNICAL REVIEW VOLUME 21
Fig. IS. Set-up for recording the efficiency of a loudspeakeras a function of frequency. L loudspeaker under test, fed fromsignal generator G via push-pull amplifier Al' K dead room.M microphone. A2 microphone amplifier. P2 rotary potenti-ometer whose arm, like the loudspeaker, is rotated by themotor M02 at about 3 revs/sec; the potentiometer has aVlsin allaw. A4 amplifier. Th thermocouple. A5 DC amplifier.Ree recorder. The motor MOl causes the frequency f of thesignal generator to traverse the whole audio range in about5 minutes, and at the same time drives the strip recorder ata corresponding rate.
of it the loudspeaker is rotated uniformly about avertical axis. The angle a between the geometricalaxis of the loudspeaker and the fixed connecting linebetween loudspeaker and microphone thus passesperiodically through all values from 0 to 2n. To theoutput of the microphone amplifier a potentiometerP2 is connected, whose arm rotates together with theloudspeaker. The potentiometer is so wound as togive a -Vlsinallaw. The design ofthis potentiometer,which must be entirely free from crackle, is illus-trated in fig. 16; see also fig. lOa and b. The outputvoltage of the potentiometer is applied to anamplifier which feeds the heater of a vacuumthermocouple. The direct voltage delivered by thethermocouple is amplified and recorded on a strip-chart recorder. The movement of the paper iscoupled with the rotation of the capacitor in thesignal generator which feeds the loudspeaker (just asin the case of the frequency response, see above).The amplifier between the signal generator and theloudspeaker operates in this case with negativecurrent feedback, so that the current through theloudspeaker remains just about constant throughoutthe frequency range swept.The fact that the deflection of the recording stylus
is proportional to the radiated power, so that theefficiency is directly recorded as a function offrequency, can be explairied roughly as follows. Theproportionalities involved are:Microphone voltageInput voltage, potentiometerOutput voltage, potentiometer.Alternating current, thermocoupleDirect voltage, thermocouple
cx.P(a),cx.P( a),cx.P(a) -Vlsinal,cx.P(a) -Vlsinal,cx.P2(a)lsinal.
p2(a) sm a appears in (1) under the integral sign.The integration over a from 0 to n is effected by therotation of the loudspeaker. The thermal inertia ofthe thermocouple ensures that the direct voltageobtained is proportional to the mean square value
3 99908
Fig. 16. Construction of the rotary potentiometer P2 (fig. IS).RI' R2' ... fixed resistors with values giving the potentiometera Ylsin allaw. The taps are formed by 72 strip contacts 1 whichare secured in the insulating plate 3 along the annulargroove 2. The groove is filled with a conducting liquid (ethyleneglycol). The rotary arm 4 is clear of the strips but makes elec-trical contact with them via the conducting liquid. Thisconstruction guarantees complete freedom from crackle. Theresistance values R are chosen low enough to make the con-duction between the successive strips via the liquid negligiblylow compared with the conduction through R. The fairly highcontact resistance between the arm and the strips is of noconsequence in that no current is drawn.
of the alternating current, which vanes with a.A further condition is that the frequency should notchange much during a single revolution of the loud-speaker. Fig. 17 gives an example of an efficiencycurve, which took about 5 minutes to record.
Fig. 17. Efficiency TI (on logarithmic scale) recorded with theset-up in fig. IS; dashed curve: after correction for other lossesthan PR and for the radiated power. The recording was madein 5 minutes. For comparison, the frequency response (P) ofthe same loudspeaker is also shown.

1959/60, No. 12 PERFORMANCE TESTS ON LOUDSPEAKERS 371
When the loudspeaker is rotated through an angle a withrespect to the position of the microphone, the instantaneousvalue p(a) of the sound pressure near the microphone is
p(a) = P(a)]12 sin (2nft + rp),
where f is the sound frequency and rp is a phase angle.Let the sensitivity of the microphone, including the micro-
phone amplifier A2' be s. The output voltage V2 of A2 is then:
V2 = s P(a) ]/2 sin (2nft + rp).
The rotating potentiometer introduces a factor Vlsinal. Itsoutput voltage, vp, is therefore:
vp = s P(a) V2 Isin al sin (2nft + rp).
The thermocouple produces a direct voltage Eth which isproportional to the mean square value of vp over half arevolution. Let the proportionality factor he {}, then:
Eth = ~ 7 Vp2 da = 2~ S27 p2(a) sin a sin2 (2nft+rp) da. (2)o 0
Now we have. 2 (2 :fi +) 1 - cos 2 (2nft + rp)sm ntt rp = 2 .
Hence (2) becomes:
Eth=" "{}S2 f {}S2 f--;:& P2(a)sinada---;:t p2(a) sin a cos 2(2nft + rp) da.o 0'
It is easy to see that the second integral will he approximatelyzero, for even the lowest audio frequency f (20 c/s) is still highcompared with the number of revolutions made by the loud-speaker per second, viz. 3. This means that during half arevolution (a = 0 ......,..n) the factor cos 2(2nft + rp) swings toand fro many times between +1 and -1, thereby making thisintegral virtually zero. This also applies iffis gradually raisedduring half a revolution. To a good approximation, then, onlythe first integral r~mains:
{} 2 nEth RS _s_ f p2(a) sin a da.
n 0
In conjunction with (1) this gives:
2nr2 n 2n2r2Wo RS -- -{} 2 Eth = -{} 2 Eth,
QC s QC s
which demonstrates the approximate proportionality betweenWo and Eth.We have tacitly assumed above that the wave front is
spherical. If it is not spherical, the contribution of the secondintegral in (2) will, in general, not be so small. It can be cal-culated, however, for a dipole - and as such we can regard aloudspeaker at low frequencies - which turns at two revolu-tions pers econd, that at f = BO c/s the contribution of thesecond integral is smaller than 1%.
Other methods of measuring Wo
Two other methods of measuring Wo 'may be briefly men-:ioned. One resembles the measurement of .the luminous fluxof a light source in anintegrating photometer: l~udspeaker andmicrophone are placed in an acoustically "hard" room (withreflecting walls) in such a way that the direct radiatión fromthe loudspeaker to the microphone, is negligible. Since the
wavelengths of the sound are relatively long, fairly complicatedmeasures are necessary to prevent the formation of standingwaves ,and to bring about a sufficiently diffuse distribution ofthe sound. This subject has already been dealt with in thisreview B).The other method of measuring Wo was devised by the
British Broadcasting Corporation D).As in our case, a potentic-meter is made to rotate together withthe loudspeaker, but thepotentiometer law here is [sin al. Use is further made of asomewhat modified kilowatt-hour meter. To the current coilof this meter a current is applied which is proportional to themicrophone voltage, hence to P(a); to the voltage coil a voltageis applied which is taken from the potentiometer and isproportional to P(a) [sin al. In accordance with the principleof the kilowatt-hour meter the number of revs per se.cof thedisc in this meter is thus proportional to p2(a) [sin al. Theintegration over a from 0 to n is again effected by rotating theloudspeaker. Since the kilowatt-hour meter only worksreliably at frequencies of about 50 c/s, the microphone voltagemust first be detected and the resultant direct voltage con-verted into an alternating voltage of 50 ej«: The method isnot suitable for recording.
CalibrationI
It only remains to describe how the scale of therecorder is calibrated in milliwatts. '
The microphone is disconnected from the amplifierA2 (fig. 15) and the input of A2 is connected to asignal generator with an output miIlivoltmeter.With the potentiometer P2 rotating we can nowdetermine the proport.ionality factor fJ between thesquare of the input voltage Vi of A2 and the de-flection x of the recorder:
(3)
The sensrtrvrty Sm of the microphone is known,i.e. the proportionality factor between the soundpressure P and the voltage Vi:
(4)
All that we need now is the relation between thesound pressure P and the power Wo radiated by theloudspeaker. This relation can be calculated for apoint sound source. Let the radiated power fromthis point source be Wo (uniformly distributed in alldirections), then at a distance r from the so~rce thesound intensity is 1= Wo/4nr2, and the relationbetween sound pressure P and I at that distance isgiven by I = P2/ec. Hence: '
(5)
B) R. Vermeulen, The testing of loudspeakers, Philips tech.Rev. 4; 354-363, 1939, in particular page 361. " '
D) A. Gee and D. E. L. Shorter, An automatic integrator fordetermining the mean spherical response of loudspeakersand microphones, B.B.C. Engng. Div. Monogr. No. B,Aug. 1956. '

372 PHILIPS TECHNICAL REVIEW . VOLUME 21
From (3), (4) and (5) we find:
r, '
4n r2 'Wo= x.', (Jesm2f3
In (6) th~ following are known:r distance from loudspeaker to microphone,(J . - densit; 'of the air (1.2 kg/m3 at 1 atm pres- .
sure and 22°C),e velocity of sound (345 mis at 22°C),Sm = sensitivity of the microphone, andf3 measured ratio between x and Vi2•With these known quantities we can therefore cal-culate the proportionality factor between Wo and x.'
In conclusion it may be noted that the equipmentdescribed can also be used mutatis mutandis for
(6)
similar measurements on objects other than loud-speakers. Without any fundamental modifications itcan serve, for example, for recording the frequencyresponse and ' transients of amplifiers, and thedirectivity patterns of microphones, light sourcesand short-wave aerials.
Summary. Methods of testing loudspeakers are described, in,which the sound pressure, the electrical impedance and theefficiency are recorded as.a function of frequency (20-20000cIs)on a strip-chart recorder, whilst the directivity patterns atdifferent frequencies and the transients produced by the suddeninterruption of the electrical signal are displayed on a cathode-ray oscilloscope.The resonance frequency of the loudspeakercan also be determined. For most of the tests the loudspeaker,and microphone (condenser type) are set up in an acousticallydead room. For recording the directivity patterns and theefficiency curve the loudspeaker is rotated about a vertical axis.About 5 minutes are required to record the efficiency curve.
ABSTRACTS OF RECENT SCIENTIFIC PUBLICATIONS BY THE STAFF OFN.V. PHILIPS' GLOEILAMPENFABRIEKEN
Reprints of these papers not marked with an asterisk * can be obtained free of chargeupon application to the Philips Research Laboratories, Eindhoven, Netherlands.
2723: K. van Duuren and G. J. Sizoo: The gas-discharge mechanism for the argon-alcoholproportional counter (Appl. sci. Res. B 7,379-399, 1959, No. 5).
Accurate measurements of the gas multiplicationfactor were done for a number of proportionalcounters with various wire diameters ranging from0.003 to 0.1 cm and for various gas pressures rang-ing from 67 to 220 mm Hg. From these resultsthe ionization coefficient for the argon-alcohol gasmixture 9 : 1 was deduced. It appeared that in afew cases the equilibrium between the mean electronenergy and the electrical field was slightly disturbedand the conditions for the non-equilibrium situa-tion could be established from the experiments.Rose's and Korff's calculations of the gas multipli-cation factor in proportional counters were com-pared with the authors' experimental results,whereby rather large discrepancies were found.Comparison of the authors' experimental valuesof the ionization coefficient for argon-alcohol withthe earlier published values for pure argon andalcohol gives and insight in the mechanism of theelectron multiplication process in the argon-alcoholgas mixture 9 : 1.
2724: J. M. Stevels and A. Kats: Défauts de réscaudans' le quartz cristallin et la silice fondue
(Compte-rendu XXXIe Congrès int. Chim.industr., Liège, Sept. 1958, Vol. n, pp. 125-128, Mercurius, Antwerp). (Lattice defectsin quartz and fused silica; in French.)
In the Si-O lattice of quartz and of fused silica,defects - either foreign atoms or vacancies -are almost always present. The former are often notdetectable by classical chemical methods owingto their low concentration. By study of dielec-tric losses, absorption spectra and paramagneticresonance it is possible to gain information on thechemical nature of these imperfections.
2725: K. van Duuren and J. Hermsen: Improveddesign for halogen-quenched end-windowGeiger counters (Rev. sci. Instr. 30, 367-368,1959, No. 5).
Note reporting certain improvements in thedesign of end-window Geiger-Muller tubes. Theimprovements' are concerned with modifying theelectric field especially near the window, and con-sist of the use of a conducting window and of aspherical or hemispherical anode.
2726: N. W. H. Addink and L. J. P. Frank: Re-marks apropos of analysis of trace elementsin human tissues (Cancer 12, 544-551, 1959,No. 3).

1959/60, No. 12 '
r ,
ABSTRACTS OF RECENT SCIENTIFIC PUBLICATIONS . 373-
It is shown that unless neoplasms develop intissues relatively rich in zinc, the zinc level of bothserum and whole blood in carcinoma cases is sub-normal. There is no connection between the zinclevel of whole blood on the one hand and the iron(in hemoglobin) or water level on the other. Controlof 3 groups of carcinoma patients by measuring thezinc content of their whole blood during the years1955 to 1957 resulted in agreement between thephysician's view and that of the Iahoratory studyingzinc level alterations, in 80 to 90% of the cases.The authors' conclusions are: (1) Blood from can-cerous patients generally shows a subnormal zinclevel (with a mean value of 4.5 parts per millionas compared to a value of 6.5 parts per million forblood from healthy subjects). Favourable progressagainst the disease is accompanied by an increasetowards normal values. In the case of unfavourableprogress, the low zinc level is persistent or it de-creases still further. (2) In cases of tumor develop-ment in tissues relatively rich in zinc (the aberranttumor groups), the zinc level has been found to besupernormal. A fall to the normal zinc level indi-cates favourable progress, whereas a permanentsupernormal level indicates unfavourable develop-ment in the illness. Shortly before death, super-normal as well as subnormal values can be found.
2727: J. Hornstra: Models of grain boundaries inthe diamond lattice, I. Tilt about <UO'>(Physica 25, 4.09-422, 1959, No. 6).
Small-angle grain boundaries are known to con-sist of arrays of dislocations. In this paper it isshown that in the diamond lattice not only forsmall, but for all angles of tilt about [IÏO] a dis-location model can be constructed. There are noabrupt changes of model for small variations of theangle of tilt and the {UI} twin boundary comes outautomatically. This twin boundary can equally wellbe described as a twist boundary with a networkof screw dislocations, but both models are identicalwith the generally accepted structure of the {UI}twin boundary.
2728: M. J. Sparnaay: Van der Waals forces andfluctuation phenomena (Physica 25, 444-4.54, 1959, No. 6).
An expression is given for the attraction betweentwo electrically neutral systems' each consistingof electric point charges which move at' randominside spherical volumes. The calculation is basedon the use of mean square values of density flue-tuations in each system. The result and the method
, used are compared with Keesom's expression for the
interaction hetween two dipoles and with the expres-sion which is obtained for the interaction of twoclassical harmonic oscillators a large distance apart.
2729: P. H. J. A. Kleijnen: Travelling-wave-buizen(T. Ned. Radiogenootschap 24, 71-88, 1959,No. 2/3). (Travelling-wave tubes; in Dutch.)
Fundamentals of the theory of the various formsof travelling-wave tube. The article substantiallyreproduces an introductory lecture given at thesymposium on travelling-wave tubes organized bythe Netherlands Radio Society in 1958.
2730: C. T. de Wit: Een IO-watt-Iopendegolfbuisvoor de 7,5-cm-band (T. Ned. Radiogenoot-schap 24, 89-100, 1959, No. 2/3). (A IO-watttravelling-wave tube for the 7.5 cm wave-band; in Dutch.)
Discussion of the main factors involved in thedesign and construction of a travelling-wave tubeof high beam efficiency. An outline is given of thedesign of some of the components of the tube andof the circuit.
2731: A. Versnel: Lopendegolfbuizen met een laagruisgetal (T. Ned. Radiogenootschap 24,IOI-U2, 1959, No. 2/3). (Travelling-wavetubes with a low noise factor; in Dutch.)
The behaviour of current and velocity fluctuationsin a travelling-wave tube are discussed. The cal-culations are ·done in 3 stages: first fluctuationsbetween cathode and anode are considered, thenthe behaviour of these fluctuations in the drift spacebetween anode and helical electrode and finallytheir behaviour when they interact with the signalinjected on the helix. If the beam diameter, beamvelocity in the drift space and beam current are keptconstant, it i~ found that the noise factor dependsonly on the cathode-anode potential and on thelength of the drift space. By a suitable choice ofthese parameters the minimum noise figure can beachieved. With certain assumptions, the calculatedvalues agree with those measured on speciallabora-tory tubes. It is shown that if certain conditionscould he fulfilled it should be possible to achieveeven lower noise factors.
_ 2732: J. Ubbink: Masers, I (T. Ned. Radiogenoot-schap 24, 129-136, 1959, No. ~/3; in.Dutch),
Introduetory article on the operation ofthemaser.Processes such as absorption and stimulated andspontaneous emission are dis'cussed in connectionwith the inversion of energy-level population den-sities. This inversion (higher population in the higher

I,PHILIPS TECHNICAL REVIEW VOLUME 21374
levels], often characterized by the term "negativetemperature", is essential to, maser operation. The:reason why magnetic dipole systems. are more,favourable than electric dipole systems is outlined.It is also explained why low temperatures are favour-able to maser operation. The product of ampli-ficatión and bandwidth and the noise of a maserare discussed with the aid of an equivalent circuit.. "
2733: T. KraIt, H. D. Moed, E. J. Ariëns and Th.W. J. Hendriksen:' Synthesis and pharma-cological properties of O-aèetylsalicylamides(Rec.· Trav. chim. Pays-Bas 78, 199-206,1959, No. 3).
The synthesis of a series of N-substituted 0-acetylsalicylamides is described. Most compoundspossess weak antipyretic activity and strong spas-molytic activity.
2734: T. KraIt, H. D. Moed, E. J. Ariëns and Th.W. J. Hendriksen: Synthesis and pharma-cological properties of salicylamides (Rec.Trav. chim. Pays-Bas 78, 207-214, 1959,No.3).
The synthesis of a series of N-substituted sali-cylamides is described. Most compounds possessweak antipyretic activity and strong spasmolyticactivity.
2735: A. Venema: The production of ultra-highvacua by means of a diffusion pump (Vacuum9, 54-57, 1959, No. I).
The result of a measurement of the so-calledultimate pressure of a diffusion pump is often notonly determined by the pump itself, but also by theadditional apparatus necessary for making thismeasurement. An analysis is given of the gaseswhich may be present at the pump mouth and thefactors determining the pressure of those gases aretreated. A discussion of the methods which can beused for making these pressures as small as possibleresults in a design of a pump apparatus. A descrip-tion of this apparatus, which includes a mercurydiffusion pump with cooling traps, is given. Withthe apparatus a pump speed at the recipient of5-10 lis for-the common gases is obtained and anultimate pressure lower than 10-12 mm Hg is reached.(See also Philips tech. Rev. 20, 145-157, 1958/59.)
R 387: J. van Laar.and J. J. Scheer: Photoelectric _.)etermination of the électron work functionof.indium (Philips Res. Repts. 15,1-6,1960,. No. 1)'0
The photoelectric work function of evaporatedindium films prepared in ultra-high vacuum is foundtobe 4.08 ± 0.01 eV.
R 388: C. Kooy a~d U. Enz: Experimental andtheoretical study of the domain configura-tion in thin layers of BaFe12019 (Philips Res.Repts. 15, 7-29, 1960, N!>.1).
With the aid of the optical Faraday effect thedomain configuration and the màgnetization process'in thin transparent single-crystal plates of BaFe12019are studied. The plates have surfaces parallel to thebasal plane of the hexagonal structure. The domainpattern consists ofline-shaped domains. The domainwidth is measured as dependent on the, appliedmagnetic field parallel to the c-axis. The width of areversed domain decreases slowly with the' appliedfield reaching a finite thickness near saturation,whereas the width of a domain magnetized in thedirection of the applied field increases rapidly nearsaturation. In this stage the remaining reversedline-shaped domains contract towards cylindricaldomains which collapse at slightly higher fields.Saturation is reached in a field well below 411:15• Thedemagnetizing energy of a partly magnetized thinuniaxial crystal having the easy axis normal to thesurface is calculated for a domain pattern consistingof straight parallel domains. The stable domain con-figuration for a given value of the magnetic field isobtained by minimizing the total energy. The solu-tion is obtained in the form of two simultaneousequations containing the two different domainwidths, which are evaluated by an electronic com-puter. Theoretical magnetization curves are de-duced. The general accordance between experimentand theory is good.
R 389: K. Teer: Investigations into redundancyand possible bandwidth compression in tele-vision transmission (Philips Res. Repts. 15,30-96, 1960, No. I).
Continuation of R 385.
R 390: M. E. Wise: On the radii of five packedspheres in mutual contact (Philips Res.Repts. 15, 101-106, 1960, No. 2).
These results form part of a study of close packingin spheres. Each of four given spheres touchés theother three. The fifth ("interstitial") sphere touchesall four .externally and is usually surrounded bythem. The other sphere touching all four either liesoutside them or encloses them. These properties areshown by geometrical inversion. In this way a gen-eral equation relating to 'the radii of five spheres inmutual contact is derived. Some general conclusionsabout different configurations of the five spheres arediscussed on the basis of this relation. The formulaeare also expressed in terms of statistical functions
1959/60, No. 12 . ABSTRACTS OF RECENT SCIENTIFIC PUBLICATIONS 375'
of the four radii; the volume of the tetrahedron ofcentres of the first four spheres is shown to be re-lated to the same functions.
R 391: F. van der Maesen: Determination of num-bers of injected holes and electrons in semi-conductors (Philips Res. Repts.I5, 107-119,1960, No. 2).
In semiconductors, deviations Lln and LIp of theequilibrium numbers no and Po of electrons and holesare unequal in many cases because of trapping. It isshown how measurements of the photo Hall-effectand photoconduction may give information on thenumbers Lln and LIp separately. From the ratio Yof the relative change of the Hall-effect and of thephotoconductivity, the quantity K = Lln/Llp canbe evaluated. Graphs of Y versus K for some sub-stances are given. It is shown how K occurs in theformulae used in computations of the diffusion-recombination length L from photoelectromagneticand photoconductive data. If ru and r p denote theratios of the Hall-mobility to drift mobility forelectrons and holes, respectively, rn/rp can be eval-uated from the measurements where K = 1. In thisway the value of rn/rp at room temperature is foundto be 0.54 ± 0.05 for germanium and 0.}8 ± 0.04.for solicon.
1,I
R 392: C. A. A. J. Greebe and W. F. Knippenberg:Grown pon junctions in silicon carbide(Philips Res. Repts 15,120-123,1960, No.2).
An account is given of the preparation andproperties of grown junctions in SiC. The forwardcharacteristics are tentatively explained on the basisof a p-i-n structure. Pon luminescence has beenobserved containing violet light.
R 393: M. T. Vlaardingerbroek: Small-signal per-formance and noise properties of microwavetrio des (Philips Res. Repts. 15, 124-221,1960, No. 2).
This paper (thesis, Eindhoven 1959) reports on atheoretical and experimental study of the behaviourof a microwave triode at 4. Gc/s. After a generalsurvey of the field, the equivalent circuit of thetriode is deduced in section 2. The internal feedbackis accounted for by a series-resonant circuit in thegrid lead. The noise behaviour is described by anoise-current source and a noise-voltage sourceconnected to the input terminals of the equivalentcircuit. In section 3, those elements ofthe equivalentcircuit which result from the presence of electrons inthe active space and the noise sources are calculated .on the basis óf the single-velocity transit-timetheory of Llewellyn and Petersen. Four phenomeno- .
logical constants are introduced, to account for theeffects of the electrons returning in front of thepotential minimum and for the multi-velocity effectson the original "Rack" velocity fluctuation and theconvection-current fluctuation at the cathode sur-face. The methods of measurement necessary for the,determination of the fourpole coefficients of thetriode and its four characteristic noise quantities,giving the magnitudes of the noise sources and theircross-correlation, are described in section 4. Thesemethods are complicated because the distancebetween the measuring devices and the object understudy is of the' order of several wavelengths. Insection 5 the experiments are described and theresults are compared with the theory of sections 2and 3. The conclusions are: (1) The electronic ad-mittances of the triode can be calculated withreasonable accuracy on the basis of the single-velocity transit-time theory provided that the cur-rent density is so high that the distance fromcathode to potential minimum is small compared tothe cathode-grid distance. (2) The noise properties ofthe triode are only slightly affected by total-emis-sion noise, transit-time spread and feedback. Thecontribution of reflection of electrons at the anodesurface to the noise properties of a microwave triodeis of some importance and can be estimated. (3) Therandom emi~~!on from the cathode is the mostimportant noise source. The four measured noisequantities can be used for calculating the fourphenomenological noise quantities introduced insection 3. From the values obtained for the latterquantities, the minimum noise figure and the beam-noise parameters S and IJ of an electron-beamamplifier equipped with an identical cathode can becalculated. The results are in reasonable agreementwith the measured values of Sand Il.
R 394: G. Meijer and M. Avinor: Excitation spectraof vanadium-activated zinc and cadmiumsulphide and selenide phosphors (PhilipsRes. Repts. 15, 225-237, 1960, No. 3).
Excitation spectra were measured for the 2 fLfluoresoence band of vanadium-activated zinc andcadmium sulphide and selenide phosphors. Theemission is excited by absorption in two compositebands due to vanadium at 1.1 and 1.6 eV, byabsorption in an auxiliary impurity centre, such ascopper or silver, if present, and by fundamentalexcitation.
,
R 395: W. van GooI and A. P. Cleiren: Self-acti-vated and Cu-activated fluorescence of ZnS(Philips Res. Repts.I5, 238-253,1960, No.~).

, '
376 PHILIPS TECHNICAL REVIEW VOLUME 21
.' Two series of experiments on the fluorescence of, ZnS are described. The first one, of which only areview of the, experimental results is givén, presentssome additional data on the theory of ZnS activatedwith Cu, made some years ago by Kröger and co-workers. In the second series a limited number ofphosphors have been studied in order to settle a fewquestions. In particular, the difference b~tween theblue Cu emission and the blue self-activated emissionof ZnS has been studied. Furthermore, the temper-ature dependence of the fluorescence bands and theinfluence of the coactivator on both mentionedfluorescences and the green copper fluorescence weredetermined. The results can be interpreted by as-suming that the low-temperature fluorescence isdependent on, the coactivator. The room-tempera-ture emission -bands can have a composite character,in such a way that in addition to the low-tempera-ture emission band another band may be important. 'The results are to some extent uncertain, due toexperimental difficulties. These have been discussedand it is stressed that further careful experimentalwork may be more important for our knowledge ofthe ZnS fluorescence than detailed calculationsabout some special model.
R '396: W. van GooI, A. P. Cleiren and H.J.M. Heij-ligers: Fluorescence of some activated ZnSphosphors (Philips Res. Repts.15, 254-274,1960, No. 3).
Several series of ZnS phosphors were prepared inH2S atmosphere at 1150-1200 °C. Activators usedwere Ag, Cu, Au and coactivators were Al, Sc, Ga,In. Phosphors were made with all combinations ofactivators and coactivators with one concentra-tion. In other phosphors equal concentrations of.selected pairs of activators and coactivators werestudied at different levels. Some special series ofphosphors were made in addition, and spectraldistributions of all phosphors at room temperatureand at -196°C are reported. The spectral distri-butions can be separated into parts of low and highphoton energy. The high-energy parts can beattributed to the presence of the activators. Thelow-energy parts are of a composite structure. Partof these bands is due to an associate centre of acti-vator and coactivator. Other parts of the low-energybands may be due to other centres, which could notbe identified unambiguously.
R 397: J. A. W. van der Does de Bye: Measurementof decay times of excess carriers in semi-
conductors, excited by X-ray pulses (PhilipsRes. Repts. 15, 275-289, 1960, No. 3).
A method for the measurement of transient decaytimes of excess carrier concentrations in homogene-ous semiconductors is described. The exciting agentis X-rays, which are delivered· in short pulsesof 0.1..0.3 flsec. A reasonable excitation (about1012 cm-3 per pulse in Ge) requires peak currents of'several tens of amperes through the X7ray tube,which is fitted with a large dispenser cathode. Twopulse generators, which can deliver short, high-tension pulses of 80 kV and of 150 kV, are used.These two voltages imply two different effectivelinear X-ray attenuation coefficients for every sub-stance. For germanium they are about 20 cm-1 and8 cm-I. This affords a reasonable possibility ofexciting the bulk without much disturbance by sur-face recombination. Excitation, .dissipation, samplegeometry and noise set a minimum to the resistivityof the sample for the production of a clearly visibledecay curve on the oscilloscope. For Ge this isbetween 0.1 and 1 ohm cm. The measuring appara-tus comprises an exponential time base and a decay-curve simulator for the measurements of decay timeconstants, down to 0.1 flsec. Measurements per-formed on copper-doped germanium yield decaytimes which are also found with chopped light. Somemeasurements on CdTe are also described.
R 398: H. G. Grimmeiss and H. Koelmans: P-nluminescence and photovoltaic effects inGaP (Philips Res. Repts.15, 290-304., 1960,No.3).
GaP crystals were prepared from the elements.'Crystals made at low phosphorus pressure mainlyshowed n-conductivity with an activation energy of0.07 eV. Crystals with p-conductivity were obtainedby heating at high phosphorus pressure (activationenergy 0.19 eV) or by doping with Zn. The non-doped crystals showed electroluminescence in bandsat 6250 Á and 5650 Á. The electroluminescence isshown to be due to the recombination of chargecarriers, within p-n junctions via levels within theforbidden gap. A level scheme for undoped GaP isproposed. The crystals showed point-contact recti-fication and photovoltaic effects. On measuring thephotovoltage as a function of wavelength, excitationbands were found at 4200 Á and 5600 Á in non-doped crystals and at' 4200 Á and 6000 Á in Zn-doped crystals. The long-wave excitation peaks ofthe photovoltage are explained with a two-stepmechanism, one optical and one thermal.