Embed Size (px)
Citation preview

EN
2020Performance report in brief
Introducing the report of the European Court of Auditors on the performance of the EU budget – Status at the end of 2020
EN
EUROPEAN COURT OF AUDITORS 12, rue Alcide De Gasperi 1615 Luxembourg LUXEMBOURG
Tel. +352 4398-1Enquiries: eca.europa.eu/en/Pages/ContactForm.aspWebsite: eca.europa.euTwitter: @EUAuditors
More information on the European Union is available on the internet (http://europa.eu).
Luxembourg: Publications Office of the European Union, 2021
PDF ISBN 978-92-847-7226-1 ISSN 2600-1314 doi:10.2865/12342 QJ-AK-21-002-EN-NHTML ISBN 978-92-847-7263-6 ISSN 2600-1314 doi:10.2865/45080 QJ-AK-21-002-EN-Q
EN
2020Performance report in brief
Introducing the report of the ECA on the performance of the EU budget – Status at the end of 2020
2
Contents What we audited and analysed 3
Purpose 3
Scope 3
Chapter 1 – Performance framework 6
What we analysed 6
What we found 7
What we recommend 8
Chapter 2 – Competitiveness for growth and jobs 10
What we analysed 10
What we found 11
Chapter 3 – Economic, social and territorial cohesion 13
What we analysed 13
What we found 14
Chapter 4 – Natural resources 16
What we analysed 16
What we found 16
Chapter 5 – Security and citizenship 19
What we analysed 19
What we found 20
Chapter 6 – Global Europe 22
What we analysed 22
What we found 23
Chapter 7 – Follow-up of recommendations 25
What we analysed 25
What we found 25
3
What we audited and analysed
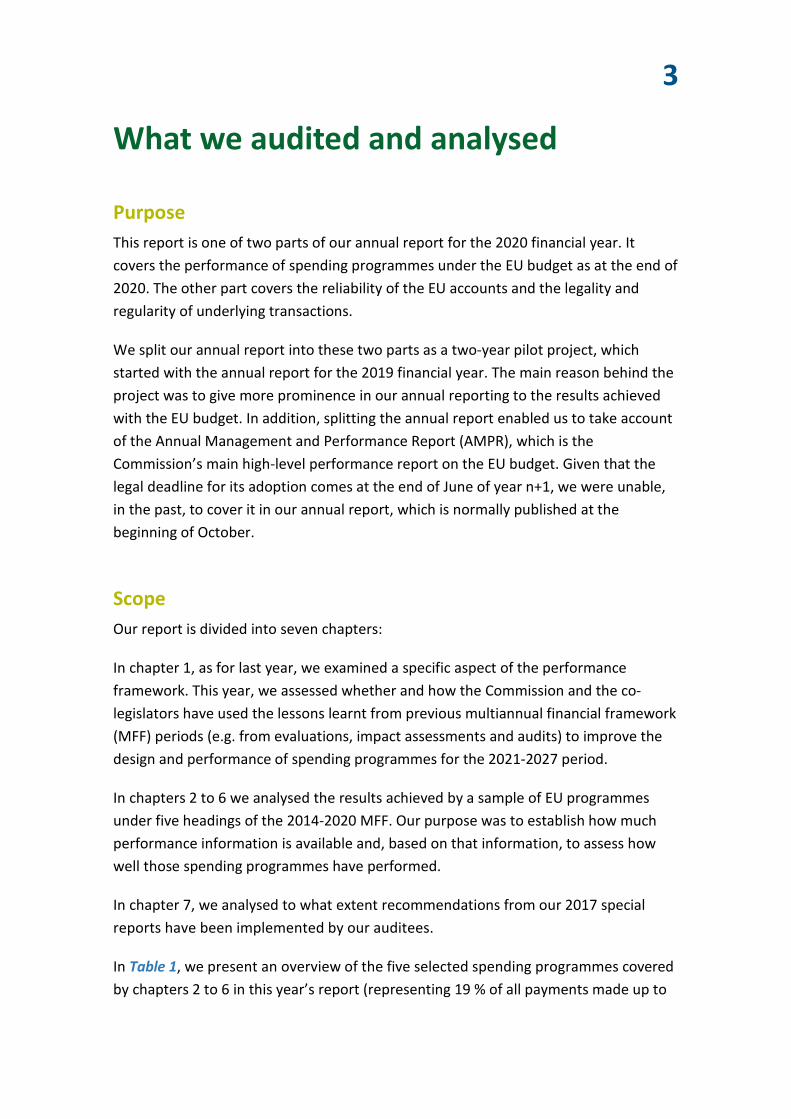
Purpose This report is one of two parts of our annual report for the 2020 financial year. It covers the performance of spending programmes under the EU budget as at the end of 2020. The other part covers the reliability of the EU accounts and the legality and regularity of underlying transactions.
We split our annual report into these two parts as a two-year pilot project, which started with the annual report for the 2019 financial year. The main reason behind the project was to give more prominence in our annual reporting to the results achieved with the EU budget. In addition, splitting the annual report enabled us to take account of the Annual Management and Performance Report (AMPR), which is the Commission’s main high-level performance report on the EU budget. Given that the legal deadline for its adoption comes at the end of June of year n+1, we were unable, in the past, to cover it in our annual report, which is normally published at the beginning of October.
Scope Our report is divided into seven chapters:
In chapter 1, as for last year, we examined a specific aspect of the performance framework. This year, we assessed whether and how the Commission and the co-legislators have used the lessons learnt from previous multiannual financial framework (MFF) periods (e.g. from evaluations, impact assessments and audits) to improve the design and performance of spending programmes for the 2021-2027 period.
In chapters 2 to 6 we analysed the results achieved by a sample of EU programmes under five headings of the 2014-2020 MFF. Our purpose was to establish how much performance information is available and, based on that information, to assess how well those spending programmes have performed.
In chapter 7, we analysed to what extent recommendations from our 2017 special reports have been implemented by our auditees.
In Table 1, we present an overview of the five selected spending programmes covered by chapters 2 to 6 in this year’s report (representing 19 % of all payments made up to

4the end of 2020), as well as the eight programmes covered in last year’s report (which represented 74 % of total payments up to the end of 2019).
Table 1 – Spending programmes selected for the 2019 and 2020 reports
Chapter MFF heading Number of programmes
Spending programmes
selected
2019 report
Spending programmes
selected
2020 report
2
1a: Competitiveness for growth and jobs
23
Horizon 2020
European Fund for Strategic Investments (EFSI)
Erasmus+
3
1b: Economic, social and territorial cohesion
4
European Regional Development Fund (ERDF)
Cohesion Fund (CF)
European Social Fund (ESF)
4 2: Sustainable growth/ natural resources
5
European Agricultural Guarantee Fund (EAGF)
European Agricultural Fund for Rural Development (EAFRD)
European Maritime and Fisheries Fund (EMFF)
5 3: Security and citizenship 11
Asylum, Migration and Integration Fund (AMIF)
Internal Security Fund – Borders and Visa (ISF-BV)
6 4: Global Europe 15
Development Cooperation Instrument (DCI)
European Neighbourhood Instrument (ENI)
Instrument for Pre-Accession Assistance (IPA II)
Percentage of all payments made 74 % by the end of 2019
19 % by the end of 2020
Source: ECA, based on Commission data.
5
We based our assessment on the performance information issued by the Commission (e.g. the 2020 AMPR, the relevant programme statements for the 2022 draft budget, the 2020 annual activity reports, evaluations, etc.). We checked this information for plausibility and consistency with our own findings, but we did not audit its reliability. We supplemented the Commission’s information with recent findings from our audit and review work.
Each EU spending programme contains a number of objectives, which are classified as either general (usually broader and more strategic) or specific (usually narrower and more operational). We examined the performance of spending programmes against a selection of those objectives. We covered all general objectives, if available, and a selection of specific objectives chosen for their materiality and links to a general objective and higher-level EU objectives.
As part of our performance assessment, we analysed the information from performance indicators presented by the Commission. In particular, our assessment of whether a given indicator is ‘on track’ relates to our analysis of the likelihood that a given indicator will meet its target on schedule. Our assessment does not take into account the relevance of the indicator to the programme’s objectives and actions, or whether the target set for the indicator is sufficiently ambitious. These indicators by themselves do not necessarily reflect the attainment of programme objectives.

6
Chapter 1 – Performance framework
What we analysed The EU implements its spending programmes in seven-year cycles, or MFF periods. The last few years have seen intensive preparations for the current MFF, which began in 2021 and will run until 2027.
The EU has developed principles to help ensure its laws (including the MFF) are of high quality. These principles are set out in particular, in the interinstitutional agreement on better law-making concluded between the Parliament, the Council and the Commission, and in the Commission’s better regulation guidelines and toolbox (a set of guidance, tips and best practices). Both documents recognise that the quality of legislation, which, in the case of the MFF affects the design and future performance of spending programmes, depends on a few key elements, such as the use of evaluations and impact assessments.
For this chapter, we examined whether and how the Commission, as well as the Parliament and the Council have used the lessons learnt from previous MFF periods (for example from evaluations and impact assessments) to improve the design and performance of spending programmes for the 2021-2027 period.
We did so on the basis of six legislative proposals relating to five spending programmes established for the 2021-2027 period, representing 60 % of the period’s total budget. We also covered the MFF regulation itself.
The main criteria for our selection were financial materiality and the fact that we have issued opinions on the Commission’s legislative proposals for these programmes.
7
What we found The better regulation approach helps the Commission to identify lessons learnt from the past implementation of policies and programmes and use them to improve future performance
We found that:
o The Commission had mostly complied with the ‘evaluate first’ principle in the legislative procedures we examined, meaning that the lessons learnt from evaluations of past EU actions were mostly available and fed into impact assessment work from the outset, and that relevant evidence was available to support the preparation of new initiatives. However, the Commission had not carried out an impact assessment for the common provisions regulation, which contains important performance-related provisions for the ERDF, the CF and six other programmes. In addition, regarding the package of legislative proposals for the common agricultural policy (CAP), a comprehensive set of recent evaluations covering all important aspects of the CAP was not available at the time the impact assessment was prepared;
o Publishing evaluations and impact assessments provides a key opportunity to engage with stakeholders and the general public, and disseminating evaluation findings is a prerequisite for active discussion. Impact assessments and evaluations, and their supporting studies, are published, but there is no single point of access to them all;
o The lessons learnt were generally clearly identified in the evaluations we examined. However, the Commission did not clearly identify the related relevant follow-up actions in the management plans it published;
o Impact assessments should compare policy options based on their economic, social and environmental impacts, and all relevant impacts must be assessed qualitatively and quantitatively wherever possible. The impact assessments we examined put forward a range of options for the design of the corresponding spending programmes, but they offered little quantified information to make it easier to compare the options presented;
o The Regulatory Scrutiny Board, which the Commission had set up in 2016 to assess the quality of all impact assessments and major evaluations before it issues legislative proposals, carries out significant work. It reviews all impact assessments and a selection of evaluations and contributes tangibly to improving their quality.

8
The Commission prepared its legislative proposals with lessons learnt in mind
We found that in the seven legislative proposals we examined, the Commission had generally taken into account the lessons learnt from the relevant evaluations and audits, although not always fully, and in some cases only to a limited extent. One example where the Commission’s legislative proposal reflected the lessons learnt to a limited extent only was the matter of measuring the CAP’s contribution to climate action. We found that a more realistic way of estimating the contribution to climate action of direct payments made to farmers would be to take into account only support paid for areas where farmers actually apply practices to mitigate climate change.
Amendments to draft MFF legislation were partly supported by the Commission’s impact assessments, but no additional ones were prepared by the Parliament or the Council
We found that:
o A major factor affecting the performance of MFF spending programmes is their timely rollout. Adoption of the legislation for the 2021-2027 MFF took longer than for the preceding period (over three years compared with 2.5 years – and the procedure is still ongoing for the CAP), delaying the launch of the new spending programmes. This was partly due to the COVID-19 pandemic.
o The Parliament and the Council had introduced numerous amendments to the Commission’s legislative proposals that we examined, some of which we considered significant in terms of programme performance. Most of their amendments could be linked to lessons learnt through evaluations or impact assessments. Both the Parliament and the Council decided not to use the option provided for in the interinstitutional agreement on better law-making to carry out their own impact assessments.
What we recommend We recommend that the Commission should:
o Ensure, when preparing the next MFF, that impact assessments examine the key substantive aspects of legislation covering several programmes (such as the common provisions regulation) and plan its evaluations for all spending programmes, including evaluations covering specific thematic aspects of such programmes, so that their results are available for use in the relevant impact assessments;

9
o Pursue and implement its plans to establish a user friendly point of access for all impact assessments, evaluations and underlying studies;
o Clearly identify relevant follow-up actions arising from evaluations, by presenting them in its annual management plans or in any other publicly available documents of equivalent status;
o Include more quantitative information, especially cost-benefit and cost-effectiveness analyses, when presenting options in impact assessments.
10
Chapter 2 – Competitiveness for growth and jobs
What we analysed The MFF heading ‘Competitiveness for growth and jobs’ finances 23 programmes which aim to foster an inclusive society, stimulate growth, boost research, development and innovation, and create employment in the EU. The planned expenditure under this heading of the 2014-2020 MFF is €142 billion, of which €104.6 billion had been paid out by the end of 2020.
For this year’s report, we selected Erasmus+, which is the EU’s programme in the fields of education and training, youth and sport. Together with the programmes selected last year (Horizon 2020 and EFSI) this represents more than 70 % of all payments made under this MFF heading by the end of 2020.
Erasmus+ has:
One general objective, which we covered. This objective contributes to a series of high-level objectives, including the Europe 2020 strategy and the strategic framework for European cooperation in education and training;
Thirteen specific objectives, of which we covered the four largest in terms of funding: o education and training mobility, o education and training cooperation, o education and training external action, o youth mobility.
We analysed the information given by performance indicators, which measure the achievement and progress towards the above-mentioned objectives, and which the Commission reports on in the Erasmus + programme statement1. Based on the relevant performance information available, we assessed how well Erasmus+ had
1 Programme statements for the 2022 draft budget.

11
performed and checked this information for plausibility against our own findings from recent audits2 and a review3.
What we found Overall, Erasmus+ is a popular programme, that especially benefits individual participants. Our assessment of progress for the indicators under the programme’s general objective roughly corresponds to that of the Commission and shows that they are on track to meet their targets. The efficiency of the programme has been improved by its simplification compared to predecessor programmes. In particular, it brings its predecessor programmes under one umbrella, thereby making the programme’s set-up simpler and ensuring greater coherence. However, there is room for improvement, for example by reducing the number of IT tools, making the programme guide easier to understand, simplifying the application procedure and addressing gender equality in both programming and reporting phases.
Erasmus+ is valued by both the public and stakeholders. Whilst the fact that it is over-subscribed attests to its popularity, the downside is that not all proposals can be funded.
The first specific objective we analysed concerns the promotion of education and training mobility by funding the mobility of students, trainees and staff. This specific objective received the largest funding allocation (€1 630.7 million for 2020, or 54.1 % of the programmes total). Interest in this type of mobility has increased by 10 % annually since Erasmus+ was launched in 2014. However, the restrictions on travel and in-person education that were imposed in response to the COVID-19 pandemic resulted in a marked decrease in mobility activities in 2020 (a reduction of around 60 %, or 500 000 fewer individual mobility activities). This also explains why the indicator for higher education students and trainees is missing its participation target by a small margin. The mobility supported by the programme provides many types of added value beyond those intended by the Erasmus+ regulation (e.g. boosting multilingualism, or a system of charters that boosts the reputation of institutions).
The second specific objective, on cooperation in the field of education and training between beneficiary organisations, is intended to result in innovative practices at local, regional, national or European level. This specific objective is significant in budgetary terms with €782.4 million allocated for 2020. Beneficiary organisations
2 Special reports 22/2018 and 10/2021.
3 Review 3/2021.
12
consider it highly important, so competition for funding is strong, but countries and institutions with greater experience and means are at an advantage and have more chance of attracting funding. The level of innovation obtained by the partnerships is relatively low compared with predecessor actions, and often insufficient to have any impact beyond the beneficiary organisations. This specific objective has two indicators. Owing to lack of data since 2016, it is not possible to establish whether they are on track.
External action in the field of education and training includes projects aiming at, for example, capacity building in higher education and focusing in particular on partner countries neighbouring the EU. Student and staff mobility from and to partner countries is also supported. This specific objective facilitates the recognition of qualifications by EU partner countries, and by promoting learning mobility between countries; it contributes to soft diplomacy. The indicators we reviewed show that this specific objective is on track in terms of numbers of students and staff coming from and going to partner countries.
Projects financed under the youth mobility specific objective seek to enable organisations to set up exchanges of youth and youth workers whereby groups of young people go abroad to interact with other young people from other countries. It has largely positive effects on participants such as on foreign language skills and positive enhancements of key competences. Competition for projects is relatively high, and the programme is perceived as more suitable for larger organisations active in youth work because they tend to have the knowledge and resources for successful applications. We consider that the two indicators we reviewed, on the increase in key competences and on the number of young people engaged in supported mobility actions, are on track.

13
Chapter 3 – Economic, social and territorial cohesion
What we analysed Spending under this MFF heading focuses on reducing disparities in the level of development of EU Member States’ regions. The four main programmes financed under this heading have total planned expenditure of €371 billion for the 2014-2020 period, of which €194.8 billion had been paid out by the end of 2020.
This year, we analysed the European Social Fund (ESF), a programme that aims to promote employment and social inclusion, integrate disadvantaged people into society and ensure fairer life opportunities. Together with the programmes selected last year (ERDF and CF) it represented more than three quarters of all payments made under this MFF heading by the end of 2020.
The ESF has five specific objectives. We analysed the four relating to:
o sustainable and quality employment and labour mobility, o social inclusion, combating poverty and discrimination, o education, training and vocational training for skills and life-long learning.
Concerning sustainable and quality employment and labour mobility, we covered the performance of operations addressing the needs of young people aged 15-24 not in employment, education or training (NEETs). These operations are supported by the ESF (which supports structural measures, such as institutional capacity and system support) and by the Youth Employment Initiative (YEI), which was launched in 2013 and which targets individuals.
We analysed the information given by the performance indicators, which measure the achievement and progress towards the above-mentioned objectives, and which the Commission reports on in the ESF programme statement4. Based on the relevant performance information available, we assessed how well the spending programmes had performed and checked this information for plausibility against our own findings
4 Programme statements for the 2022 draft budget.
14
from recent audits5 (including one we carried out in parallel with the supreme audit institutions of the Member States of the European Union6), reviews7 and opinions8.
What we found We found that the performance framework is well developed: it comprises milestones and targets for each priority axis of ESF and YEI operational programmes.
The framework has considerably increased the availability of performance information, but it still focuses on financial inputs and outputs rather than on the delivery of results.
We reviewed 13 ESF common indicators and consider that 12 are on track to achieve their targets. However, five of them are only on track because the Commission had reduced their target values in the 2021 programme statement, and one is still not on track despite the reduction.
The specific objective on sustainable and quality employment and labour mobility has contributed to the target of increasing the employment rate of the population aged 20-64 to at least 75 % by 2020. We found that implementation is slower than planned, with significant differences between Member States: for the 2014-2020 period, €39.8 billion was allocated to this objective and as of June 2021, Member States had spent an average of 54 % of available funding, ranging from 24 % in Malta to 90 % in Cyprus. During the 2014-2020 period, employment rates in the 20-64 age group increased (up to 73.1 % in 2019), but are falling short of the EU’s target, mainly due to the COVID-19 pandemic. The share of ESF funding allocated to measures addressing other structural issues (such as gender equality, active ageing and the modernisation of labour market institutions) was relatively low, and implementation was slower than expected. Finally, whereas the proportion of unemployed and inactive young people in the EU declined, the proportion of inactive NEETs remained constant at 6 %. This highlights the difficulty of reaching and mobilising them.
The second specific objective we analysed concerns social inclusion, combating poverty and discrimination and focuses on a range of groups, such as low-skilled
5 Special reports 14/2016, 16/2016, 2/2017, 5/2017, 15/2017, 6/2018, 16/2018, 21/2018,
5/2019, 20/2020 and 24/2021.
6 Report from 2017 on the parallel audit on Contribution of the Structural Funds to the Europe 2020 Strategy in the areas of Employment and/or Education.
7 Reviews 4/2018, 5/2018, 8/2019 and 2/2021.
8 Opinions 1/2017 and 6/2018.

15
adults, the long-term unemployed and people with a migrant or foreign background. Around €33.3 billion (27 % of the total ESF budget) was allocated to this objective. We found that, by the end of 2019, although the number of people at risk of poverty or social exclusion in the EU had decreased overall, only around half of the Member States had met their 2020 targets. Since then, the economic effects of the COVID-19 crisis are likely to have added to the population at risk of poverty. It is thus unlikely that the Europe 2020 target for the reduction of poverty and greater social inclusion will be achieved. Furthermore, it is difficult to assess the effectiveness of the 2014-2020 ESF funding for specific target groups due to the lack of monitoring data (for example it was impossible to measure the contribution of EU funding to the social inclusion of the most deprived because of lack of quantitative data).
Finally, €37.8 billion was allocated to education, training and vocational training for skills and life-long learning. The target under this specific objective was to reduce the share of those not completing education or training to under 10 % and to increase the share of the population aged 30-34 who have completed tertiary or equivalent education to at least 40 %. Progress towards these targets is on track overall, but there is a significant gender disparity for both targets, with men performing less well than women. Finally, it is difficult to identify how much the ESF has contributed to the targets because it makes up only about 1 % on average of Member States’ education budgets, and because the links between actions and results could be further clarified.
Overall, the ESF is in line with and contributing to the Europe 2020 strategy for generating smart, sustainable and inclusive growth in the EU. The performance information reported by Member States and the Commission shows that a considerable number of EU citizens have benefited from ESF funding to improve their skills, employability and career prospects. However, due to data limitations and the fact that many operations were still ongoing at the time of our audit, we are not yet in a position to draw an overall conclusion on the actual performance of ESF spending during the 2014-2020 period.

16
Chapter 4 – Natural resources
What we analysed This MFF heading comprises five programmes, covering expenditure linked to policies on the sustainable use of natural resources, financing the common agricultural policy, the common fisheries policy (CFP), and environmental and climate action. The total planned expenditure in the 2014-2020 period was €420 billion, of which €367 billion had been paid out by the end of 2020.
For this years’ report, we selected the European Maritime and Fisheries Fund (EMFF). Together with the two programmes covered last year (EAGF and EAFRD) it represented almost 85 % of all payments made under this heading of the MFF by the end of 2020.
The primary objective of the EMFF is to ensure that the fishing and aquaculture sectors are environmentally sustainable in the long term and managed in a way that is consistent with achieving economic, social and employment benefits, and to contribute to the availability of food supplies. The EMFF has four specific objectives, of which we analysed two, corresponding to 84 % of the EMFF budget:
o Promoting competitive, environmentally sustainable, economically viable and socially responsible fisheries and aquaculture,
o Fostering the implementation of CFP.
We analysed the information given by performance indicators, which measure the achievement and progress towards the above-mentioned objectives, and which the Commission reports on in the EMFF programme statement9. Based on the relevant performance information available, we assessed how well the EMFF has performed and checked this information for plausibility against our own findings from two recent audits reports10.
What we found Overall, we found that the Commission’s performance information, as presented in the programme statements and the AMPR, concentrates mainly on the financial contribution of the EMFF to the CFP objectives, rather than on its results. Since there is 9 Programme statements for the 2022 draft budget.
10 Special reports 26/2020 and 08/2017.

17
no clear link between the EMFF contribution and the stated achievements, it is difficult to identify a causal relationship between the two, and thus to assess the programme’s impact on the overall policy performance.
The Commission has designed a complementary set of EMFF-specific indicators and collects relevant data. Information for these indicators is based on Member States reporting via their Annual Implementation reports and allow for a more complete overview of the EMFF’s implementation. However, they too concentrate on spending rather than results.
The first specific objective we analysed was to ‘promote competitive, environmentally sustainable, economically viable and socially responsible fisheries and aquaculture’. Spending under this objective may cover, for example, costs of fishing gear with improved fish size selectivity to reduce unwanted catches, or in aquaculture it can be used to strengthen companies’ competitiveness. The available information indicates that the EU fishing fleet is profitable overall, and that fleets targeting stocks that are exploited sustainably are beneficial for fishers. Progress in boosting EU aquaculture production is less advanced, as it has stagnated recently. The EMFF should also promote environmentally sustainable fisheries. While a framework to protect the marine environment was in place, EU actions, including actions by Member States, had not restored seas to good environmental status. Problems such as by-catch of protected species persist. Even though discards of unwanted catches are banned (subject to certain derogations), this practice continues but the relevant indicator in the programme statement does not provide data and the data in the EMFF Annual Implementation Report is considered unreliable. Overall, we found that the Commission provides little performance information on the EMFF results in terms of supporting the CFP environmental objectives in the EMFF programme statement and the AMPR.
The second specific objective we looked at (‘fostering the implementation of the CFP’), focuses on managing fisheries conservation through the improvement of scientific knowledge and of fisheries control. One of the management tools available to the EU under the CFP to achieve sustainable fishing levels is setting total allowances catch limits for commercial fish stocks. Yet, the CFP target of reaching the desired conservation status for all fish stocks by 2020 is unlikely to have been met, and the key indicator designed to monitor progress in this area does not contain sufficient information to indicate the level of progress towards reaching it. The proportion of overexploited stocks in the North East Atlantic is close to 40 %, and it is 83 % in the Mediterranean and Black Seas. Overcapacity of the fishing fleet is the key driver of overfishing. While the capacity of the EU fleet is slowly declining, too many fleet segments in most Member States are still out of balance with their fishing

18
opportunities. The EMFF supports scientific data collection, which is essential as it should be taken into account in major decisions concerning quota for catches. We found that, due to data limitations, scientific advice was not available for many fish stocks, particularly in the Mediterranean and the Black Sea. Lastly, the success of the CFP is strongly linked to the effectiveness of the fisheries control system. The EMFF provides funding to improve the effectiveness of the national control systems, which are necessary for enforcing the rules. However, there are no indicators on the EMFF contribution towards achieving the objective of an effective control system.

19
Chapter 5 – Security and citizenship
What we analysed Spending under the MFF heading ‘Security and citizenship’ is linked to policies with the aim of strengthening the concept of European citizenship by creating an area of freedom, justice and security without internal borders. It includes funding for, among other areas, for harmonised border management, visa policy, asylum and migration. The total planned expenditure under this heading in the 2014-2020 MFF was €22.4 billion, of which €17.5 billion had been paid out by the end of 2020.
For this year’s report, out of the 11 programmes under this heading, we selected Borders and Visa strand of the Internal Security Fund (ISF-BV). Together with the programme selected last year (the AMIF) it represented more than a quarter of all payments made under this MFF heading by the end of 2020.
ISF-BV has:
One general objective which is to ensure a high level of security in the EU. For this objective, there is one indicator defined in the programme statement;
Two specific objectives: o Support a common visa policy, o Support integrated border management.
We covered all these objectives. We analysed the information given by performance indicators, which measure the achievement and progress towards the above-mentioned objectives, and which the Commission reports on in the ISF programme statement11. Based on the relevant performance information available, we assessed how well ISF-BV has actually performed and checked this information for plausibility against our own findings in two recent audit reports12.
11 Programme statements for the 2022 draft budget.
12 Special reports 20/2019 and 8/2021.
20
What we found ISF-BV has provided substantial support (€1.4 billion so far for the 2014-2020 period) for the general objective of ensuring a high level of security in the EU through a uniform and high level of control at the borders and the effective processing of Schengen visas. The general impact indicator defined for assessing this objective is “Irregular migrants apprehended at the EU external borders”. While ISF-BV spending and activities may contribute to apprehending irregular migrants at the EU’s external borders, the number of migrants depends on highly volatile external factors beyond the EU’s control. Therefore, even if this indicator is on track, it is unclear as to what extent the programme has achieved its general objective of contributing to a high level of security in the EU.
Up to the end of 2020, only 55 % of national programme allocations had been paid out. There were marked differences in Member States’ absorption rates of ISF-BV funding, which varied from 18 % to 79 %. Delays in the uptake of funds were caused by, for example, procurement delays due to limited number of applicants or complex tender specifications, or the effect of the COVID-19 pandemic. Thus, many results are likely to materialise after 2020 and cannot be assessed yet. In addition, there are some gaps in the programme’s performance information owing to the fact that two actions funded by the programme (action at EU level and emergency assistance – together worth €553 million) are not covered by the performance monitoring framework.
The performance information published in the AMPR gives an optimistic picture of ISF-BV. The Commission presents the indicators that show a high degree of progress towards the ISF-BV targets, but not the less encouraging indicators on training and capacity-building for consulates and border guards. Furthermore, as the published performance indicators aggregate the results reported by Member States, the exceptional results achieved by a limited number of countries give a positive overall picture and an optimistic view of progress made so far. An example is the number of specialised posts for consular staff in third countries which had a target of 395. Out of the 759 reported, 679 were reported by four countries alone (Germany, Greece, the Netherlands and Austria). Without these four, the figure for progress to date drops from 192 % to 28 %.
The specific objective of supporting a common visa policy aims to facilitate legitimate travel, provide a high quality of service to applicants and tackle illegal immigration. It encourages the development of a common policy to allow control-free travel within the Schengen area for both EU and third-country nationals’ in possession of a visa. This common policy deals only with short-term visas, whereas longer-term visas and residence permits are still a Member State competence, which means that ISF-BV can only contribute to the consistent and efficient processing of some of the permits used

21
to enter the EU. The programme has funded the upgrading of more than 2 600 consulates (290 % of the 2020 target), and the development of 430 common consular activities and common visa policy’s IT systems, thereby fostering consular cooperation activities between Member States and creating more secure and efficient visa processing centres. However, so far the average number of hours of staff training in the common visa policy reported has been low (three hours compared to a target of 16 hours per individual). This means that the programme has insufficiently contributed to the consistent application of the acquis (i.e. the body of common rights and obligations that is binding on all the EU Member States) through training.
The second specific objective of the programme supports integrated border management to ensure a uniform and high level of control and protection of the external borders as well as the smooth border crossings. The support provided by ISF-BV for the development and upgrading of IT systems, equipment and infrastructure for visa and border checks has real EU added value. These systems are crucial to allow border check to identify people who pose a security threat while allowing legitimate travellers to cross smoothly. By the end of 2020, 33 516 items of border control infrastructure and equipment had been developed or upgraded with ISF-BV support (well above the 2020 target of 19 902). The benefits they bring also depend on staff training, which is likewise supported by the programme. As some Member States reported hours of training, training days and the number of training courses under the same indicator, the aggregated values for this indicator are not comparable. The databases supported are consulted increasingly frequently. Data shows that the number of third country nationals refused entry at external border crossings has increased steadily, from 297 860 in 2015 to 689 065 in 2019, which indicates that border management systems are helping border controls to be carried out effectively. The system has however an inherent limitation: the VIS system, which connects consulates in non-EU countries with all external border checkpoints in Schengen countries, only allows countries to exchange data for short-term Schengen visas. Therefore, there is no consolidated record of all visas issued and checked.
22
Chapter 6 – Global Europe
What we analysed ‘Global Europe’ finances 15 programmes and covers expenditure on all external action funded by the EU general budget, such as activities linked to development and cooperation, humanitarian aid, neighbourhood countries and pre-accession assistance. The total planned expenditure under this heading for the 2014-2020 MFF is €66.3 billion, of which €44.2 billion had been paid out by the end of 2020.
For this year’s report, we selected the Instrument for Pre-accession Assistance (IPA II). Together with the programmes selected last year (the DCI and the ENI) it represented nearly half of all payments made under this MFF heading by the end of 2020.
IPA II has:
one general objective which is to support candidate countries and potential candidates in their reforms to align with EU rules and values with a view to EU membership; and
four specific objectives, of which we covered three, relating to:
o political reforms, o economic, social and territorial development, o strengthening the ability of beneficiaries to fulfil the obligations stemming from
Union membership.
We analysed information given by performance indicators, which measure the achievement and progress towards the above-mentioned objectives, and which the Commission reports on in the IPA II programme statement13. Based on the relevant performance information available, we assessed how well IPA II has actually performed and checked this information for plausibility against our own findings in two recent audit reports14.
13 Programme statements for the 2022 draft budget.
14 Special reports 7/2018 and 27/2018.

23
What we found Overall, the indicators reported by the Commission in the programme statement show a modest performance for IPA II. We consider that of a total of 19 indicators, only five are on track to meet their targets while around half (9) are not on target, and for the remaining five, there is not enough information to assess their progress clearly.
In the AMPR, the Commission presents six of these indicators as key performance indicators, all showing progress. However, we do not consider this selection representative of IPA II’s performance: four of the six are impact indicators and give an indication of the programme’s context rather than its performance, while the other two are output indicators that relate to cross-border cooperation programmes not representative of IPA II expenditure. Lastly none of the six indicators selected by the Commission measure progress towards the specific objective relating to political reforms, despite this being a central element for enlargement.
IPA II’s budget is managed either under direct management by the Commission or under indirect management by IPA II beneficiaries’ relevant authorities accredited to do so. Indirect management is primarily used to prepare these authorities to manage structural/cohesion funds in the future. However, although it improved beneficiaries’ ownership of the programme, the use of indirect management has caused serious efficiency problems related to system weaknesses and low administrative capacity. In Turkey, for example, chronic delays have led to a spending backlog of €600 million in IPA I and II funding under this management mode. IPA II beneficiaries are not always interested in indirect management. Serbia, for example, preferred direct management by the Commission in the ‘rule of law’ sector, mainly due to the low administrative capacity and high staff turnover in the responsible agencies.
We noted some gaps in IPA II’s performance information. Firstly, DG NEAR publishes detailed annual reports on each candidate country and potential candidate’s state of play and progress in the different negotiations chapters and in meeting the political and economic criteria. Although these reports, mandated by the Council of the European Union, fulfil their purpose of providing information on the enlargement process, they do not specify the extent to which progress (or lack of) is due to IPA II and how much relates to other factors. Similarly, there were weaknesses in the monitoring of individual projects. In some instances, for example, monitoring focused on inputs, activities and processes rather than on results and impacts. Some of the indicators analysed in our reports also lacked baselines or were poorly defined.
Secondly, the IPA II programme statement presents impact and output indicators, with no result indicators to link the two. Result indicators are key to understand how the programme has contributed to progress towards its objectives.
24
One of the specific objective of IPA II is to ‘support political reforms’. Although some IPA II beneficiaries have made progress, all indicators from the programme statement relating to political reforms have regressed in relation to their baselines, and none of them are on track to reach their targets. For example, indicators measuring the perception of corruption, press freedom, government effectiveness, rule of law, regulatory quality and voice and accountability show a general backslide and remain below baseline levels. One useful indicator that monitors civil society involvement in reform processes has been discontinued. The main reason for the slow progress is insufficient political will in certain cases, but there is also evidence that EU support has been more effective in promoting these reforms than in securing their implementation.
Another IPA II specific objective is to support ‘economic, social and territorial development’. The indicators used for this specific objective mainly provide information on the economic context in which IPA II operates or how it contributes to the agri-food and rural development sectors. However, there are no indicators measuring IPA II’s contribution to social and territorial development. The programme has contributed to modernisation in the agri-food and rural development sectors. Seven of the 11 indicators measuring progress in this area are either not on track to meet their targets or it is unclear whether they will meet them.
The third specific objective we analysed is to help IPA II beneficiaries align with the EU acquis. Overall, they have increased their alignment with the EU. However, since the latest programme statement does not include a target for the indicator measuring progress in this area, it is difficult to assess whether the pace of alignment is sufficient. This specific objective also concerns preparing beneficiaries for managing EU funds. However, there are no corresponding indicators on beneficiaries’ readiness in this regard.
25
Chapter 7 – Follow-up of recommendations
What we analysed Every year, we review the extent to which our auditees have taken action in response to our recommendations. To do so, we follow up the recommendations made in the special reports we published three years earlier.
This year’s analysis of follow-up covered 161 recommendations from 20 of the 23 special reports published in 2017. The recommendations made in the three remaining special reports have been or will be followed up under separate audits. As in the past, the recommendations addressed to Member States fell outside the scope of this exercise.
For the last few years, we have given a timeframe for implementation of recommendations made in our special reports. This year, for the first time, we have analysed the timeliness of the corrective actions taken by our auditees.
What we found Overall, we found that our auditees had implemented most of our special report recommendations on time (68 % of them).
Of the 161 recommendations we followed-up, 149 were addressed to the Commission and the remaining 12 to the European External Action Service. 77 % were fully accepted by our auditees, 16 % were partially accepted and 7 % were not.
Of the 149 recommendations addressed to the Commission, 100 have been fully implemented (67 %), 17 in most respects (12 %), 14 in some respects (9 %) and 16 (11 %) were not implemented. In two cases (1 %), we considered the recommendations to be no longer relevant.
All 12 recommendations addressed to the EEAS have been fully implemented.
We noticed that the level of implementation of our recommendations is correlated to their acceptance by our auditees. Compared with the previous year, the proportion of recommendations implemented fully or in most respects has remained relatively stable (80 %). There is scope for further progress with regard to the recommendations

26
that have not been implemented and those which have been implemented in some or most respects. Our analysis shows that the auditees’ acceptance of audit recommendations is helpful to ensure that adequate follow-up measures are taken to remedy the reported deficiencies.
COPYRIGHT
© European Union, 2021.
The reuse policy of the European Court of Auditors (ECA) is implemented by Decision of the European Court of Auditors No 6-2019 on the open data policy and the reuse of documents.
Unless otherwise indicated (e.g. in individual copyright notices), the ECA’s content owned by the EU is licensed under the Creative Commons Attribution 4.0 International (CC BY 4.0) licence. This means that reuse is allowed, provided appropriate credit is given and changes are indicated. The reuser must not distort the original meaning or message of the documents. The ECA shall not be liable for any consequences of reuse.
You are required to clear additional rights if a specific content depicts identifiable private individuals, e.g. in pictures of the ECA’s staff or includes third-party works. Where permission is obtained, such permission shall cancel and replace the above-mentioned general permission and shall clearly indicate any restrictions on use.
To use or reproduce content that is not owned by the EU, you may need to seek permission directly from the copyright holders.
Software or documents covered by industrial property rights, such as patents, trade marks, registered designs, logos and names, are excluded from the ECA’s reuse policy and are not licensed to you.
The European Union’s family of institutional Web Sites, within the europa.eu domain, provides links to third-party sites. Since the ECA has no control over them, you are encouraged to review their privacy and copyright policies.
Use of European Court of Auditors’ logo
The European Court of Auditors logo must not be used without the European Court of Auditors’ prior consent.

ISBN 978-92-847-7226-1
QJ-A
K-21-002-EN-N
A word on the ‘2020 performance report in brief’The ‘2020 performance report in brief’ provides an overview of our ‘report on the performance of the EU budget – Status at the end of 2020’, in which we examined a specific aspect of the EU performance framework, analysed the results achieved by a sample of EU spending programmes and reviewed to what extent recommendations from our 2017 special reports have been implemented by our auditees.The full texts of the reports may be found at eca.europa.eu.The European Court of Auditors (ECA) is the independent external auditor of the EU. We warn of risks, provide assurance, highlight shortcomings and good practice, and offer guidance to EU policymakers and legislators on improving the management of EU policies and programmes. Through our work we ensure that EU citizens know how their money is being spent.