Embed Size (px)
Citation preview
Performance ProfilesPotentially avoidable admissions for
COPD and CHF, July 2009 to June 2010Illawarra Shoalhaven Local Health Network
The Insights SeriesVolume 2, PART 1
PERFORMANCE PROFILES: Chronic disease care, admissions for COPD and CHF July 2009 to June 2010 www.bhi.nsw.gov.au
Bul
li D
istr
ict
Hos
pita
l D
istr
ict g
roup
2 h
ospi
tals
(C2)
Ill
awar
ra S
hoal
have
n Lo
cal H
ealth
Net
wor
k
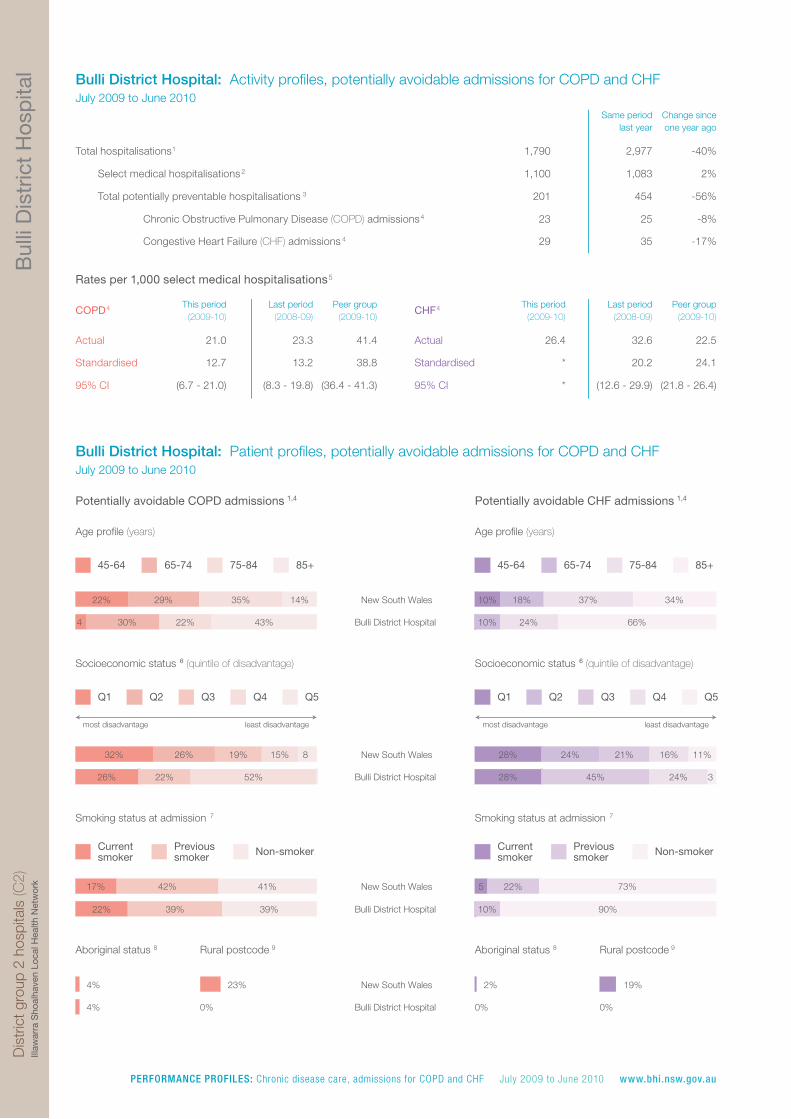
Bulli District Hospital: Activity profiles, potentially avoidable admissions for COPD and CHFJuly 2009 to June 2010
Same periodlast year
Change sinceone year ago
This period(2009-10)
Last period(2008-09)
Peer group(2009-10)
CHF 4 This period(2009-10)
Last period(2008-09)
Peer group(2009-10)
Bulli District Hospital: Patient profiles, potentially avoidable admissions for COPD and CHFJuly 2009 to June 2010
Potentially avoidable COPD admissions 1,4 Potentially avoidable CHF admissions 1,4
Age profile (years) Age profile (years)
Socioeconomic status (quintile of disadvantage)6 Socioeconomic status (quintile of disadvantage)6
most disadvantage least disadvantage most disadvantage least disadvantage
Smoking status at admission 7 Smoking status at admission 7
Aboriginal status 8 Rural postcode 9 Aboriginal status 8 Rural postcode 9
1,790
1,100
201
23
29
2,977
1,083
454
25
35
-40%
2%
-56%
-8%
-17%
21.0
12.7
(6.7 - 21.0)
23.3
13.2
(8.3 - 19.8)
41.4
38.8
(36.4 - 41.3)
Actual 26.4
Standardised *
95% CI *
32.6
20.2
(12.6 - 29.9)
22.5
24.1
(21.8 - 26.4)
45-64 65-74 75-84 85+ 45-64 65-74 75-84 85+
New South Wales
Bulli District Hospital
22% 29% 35% 14%
30% 22% 43%
10% 18% 37% 34%
10% 24% 66%
Q1 Q2 Q3 Q4 Q5 Q1 Q2 Q3 Q4 Q5
New South Wales
Bulli District Hospital
32% 26% 19% 15%
26% 22% 52%
28% 24% 21% 16% 11%
28% 45% 24%
Currentsmoker
Previous smoker Non-smoker Current
smokerPrevious smoker Non-smoker
New South Wales
Bulli District Hospital
17% 42% 41%
22% 39% 39%
5 22% 73%
10% 90%
New South Wales
Bulli District Hospital
4%
4%
23%
0%
2%
0%
19%
0%
Actual
Standardised
95% CI
COPD 4
Total hospitalisations 1
Select medical hospitalisations 2
Total potentially preventable hospitalisations 3
Chronic Obstructive Pulmonary Disease (COPD) admissions4
Congestive Heart Failure (CHF) admissions 4
Rates per 1,000 select medical hospitalisations 5
4
3
8
PERFORMANCE PROFILES: Chronic disease care, admissions for COPD and CHF July 2009 to June 2010 www.bhi.nsw.gov.au
Bul
li D
istr
ict
Hos
pita
l D
istr
ict g
roup
2 h
ospi
tals
(C2)
Ill
awar
ra S
hoal
have
n Lo
cal H
ealth
Net
wor
k
Bulli District Hospital: Activity profiles, potentially avoidable admissions for COPD and CHFJuly 2009 to June 2010
Same periodlast year
Change sinceone year ago
This period(2009-10)
Last period(2008-09)
Peer group(2009-10)
CHF 4 This period(2009-10)
Last period(2008-09)
Peer group(2009-10)
Bulli District Hospital: Patient profiles, potentially avoidable admissions for COPD and CHFJuly 2009 to June 2010
Potentially avoidable COPD admissions 1,4 Potentially avoidable CHF admissions 1,4
Age profile (years) Age profile (years)
Socioeconomic status (quintile of disadvantage)6 Socioeconomic status (quintile of disadvantage)6
most disadvantage least disadvantage most disadvantage least disadvantage
Smoking status at admission 7 Smoking status at admission 7
Aboriginal status 8 Rural postcode 9 Aboriginal status 8 Rural postcode 9
1,790
1,100
201
23
29
2,977
1,083
454
25
35
-40%
2%
-56%
-8%
-17%
21.0
12.7
(6.7 - 21.0)
23.3
13.2
(8.3 - 19.8)
41.4
38.8
(36.4 - 41.3)
Actual 26.4
Standardised *
95% CI *
32.6
20.2
(12.6 - 29.9)
22.5
24.1
(21.8 - 26.4)
45-64 65-74 75-84 85+ 45-64 65-74 75-84 85+
New South Wales
Bulli District Hospital
22% 29% 35% 14%
30% 22% 43%
10% 18% 37% 34%
10% 24% 66%
Q1 Q2 Q3 Q4 Q5 Q1 Q2 Q3 Q4 Q5
New South Wales
Bulli District Hospital
32% 26% 19% 15%
26% 22% 52%
28% 24% 21% 16% 11%
28% 45% 24%
Currentsmoker
Previous smoker Non-smoker Current
smokerPrevious smoker Non-smoker
New South Wales
Bulli District Hospital
17% 42% 41%
22% 39% 39%
5 22% 73%
10% 90%
New South Wales
Bulli District Hospital
4%
4%
23%
0%
2%
0%
19%
0%
Actual
Standardised
95% CI
COPD 4
Total hospitalisations 1
Select medical hospitalisations 2
Total potentially preventable hospitalisations 3
Chronic Obstructive Pulmonary Disease (COPD) admissions4
Congestive Heart Failure (CHF) admissions 4
Rates per 1,000 select medical hospitalisations 5
4
3
8
COPD admissions 4 This period(2009-10)
Last period(2008-09)
Peer group(2009-10)
COPD average length of stay in days 4
CHF admissions 4 This period(2009-10)
Last period(2008-09)
Peer group(2009-10)
CHF average length of stay in days 4
July 2005 to June 2010 (monthly)
Bul
li D
istr
ict
Hos
pita
l D
istr
ict g
roup
2 h
ospi
tals
(C2)
Illaw
arra
Sho
alha
ven
Loca
l Hea
lth N
etw
ork
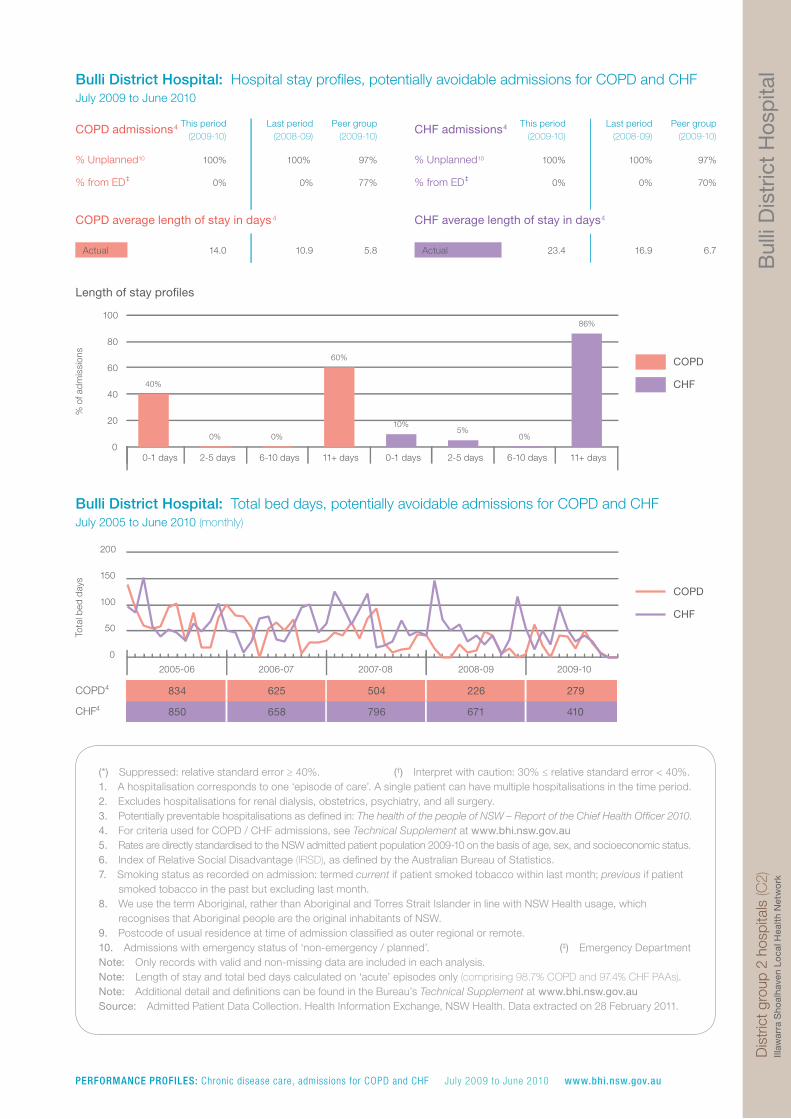
Bulli District Hospital: Hospital stay profiles, potentially avoidable admissions for COPD and CHFJuly 2009 to June 2010
% Unplanned 10
% from ED
% Unplanned 10
% from ED
Length of stay pro�les
% o
f ad
mis
sion
s
COPD
CHF
Bulli District Hospital: Total bed days, potentially avoidable admissions for COPD and CHF
Tota
l bed
day
s
COPD
CHF
COPD 4
CHF 4
100% 100% 97%
0% 0% 77%
Actual 14.0 10.9 5.8
100% 100% 97%
0% 0% 70%
Actual 23.4 16.9 6.7
0
20
40
60
80
100
40%
0-1 days
0%
2-5 days
0%
6-10 days
60%
11+ days
10%
0-1 days
5%
2-5 days
0%
6-10 days
86%
11+ days
0
50
100
150
200
2005-06 2006-07 2007-08 2008-09 2009-10
834
850
625
658
504
796
226
671
279
410
(*) Suppressed: relative standard error ≥ 40%. (†) Interpret with caution: 30% ≤ relative standard error < 40%. 1. A hospitalisation corresponds to one ‘episode of care’. A single patient can have multiple hospitalisations in the time period.2. Excludes hospitalisations for renal dialysis, obstetrics, psychiatry, and all surgery.3. Potentially preventable hospitalisations as defined in: The health of the people of NSW – Report of the Chief Health Officer 2010.4. For criteria used for COPD / CHF admissions, see Technical Supplement at www.bhi.nsw.gov.au5. Rates are directly standardised to the NSW admitted patient population 2009-10 on the basis of age, sex, and socioeconomic status.6. Index of Relative Social Disadvantage (IRSD), as defined by the Australian Bureau of Statistics.7. Smoking status as recorded on admission: termed current if patient smoked tobacco within last month; previous if patient
smoked tobacco in the past but excluding last month.8. We use the term Aboriginal, rather than Aboriginal and Torres Strait Islander in line with NSW Health usage, which
recognises that Aboriginal people are the original inhabitants of NSW. 9. Postcode of usual residence at time of admission classified as outer regional or remote.10. Admissions with emergency status of ‘non-emergency / planned’. (‡) Emergency DepartmentNote: Only records with valid and non-missing data are included in each analysis.Note: Length of stay and total bed days calculated on ‘acute’ episodes only (comprising 98.7% COPD and 97.4% CHF PAAs).Note: Additional detail and definitions can be found in the Bureau’s Technical Supplement at www.bhi.nsw.gov.auSource: Admitted Patient Data Collection. Health Information Exchange, NSW Health. Data extracted on 28 February 2011.
‡ ‡
PERFORMANCE PROFILES: Chronic disease care, admissions for COPD and CHF July 2009 to June 2010 www.bhi.nsw.gov.au
Milt
on a
nd U
llad
ulla
Hos
pita
l D
istr
ict g
roup
2 h
ospi
tals
(C2)
Illaw
arra
Sho
alha
ven
Loca
l Hea
lth N
etw
ork
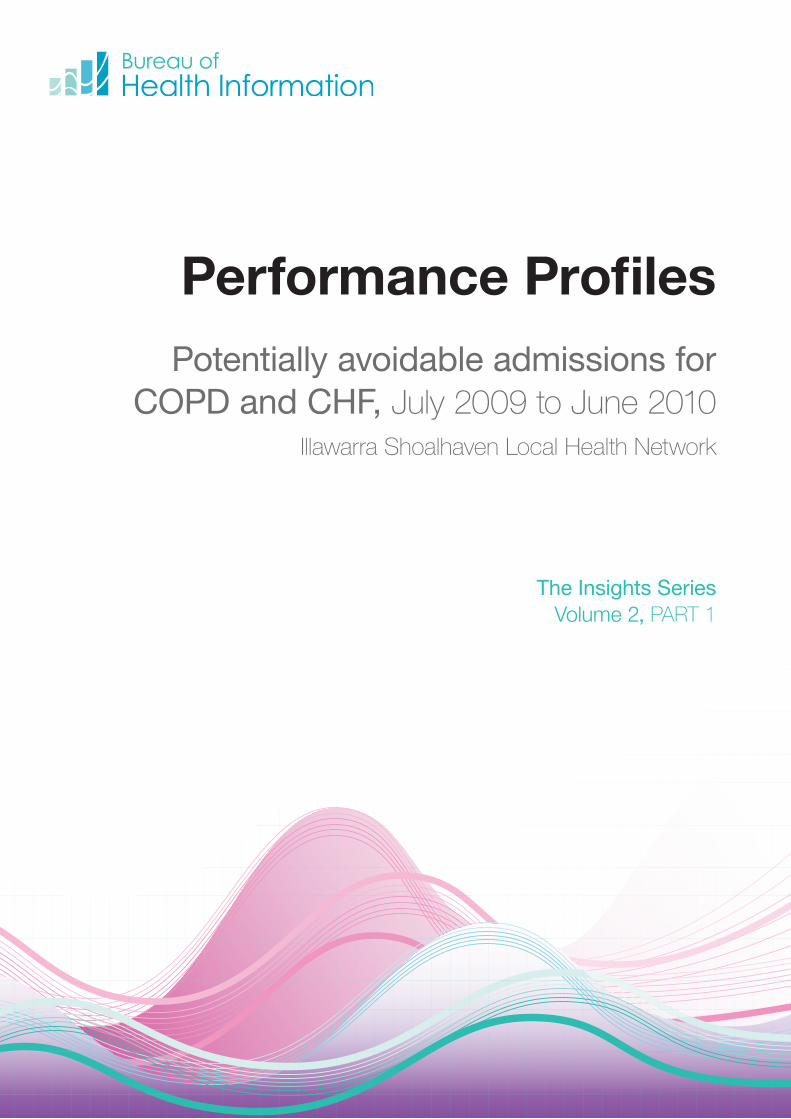
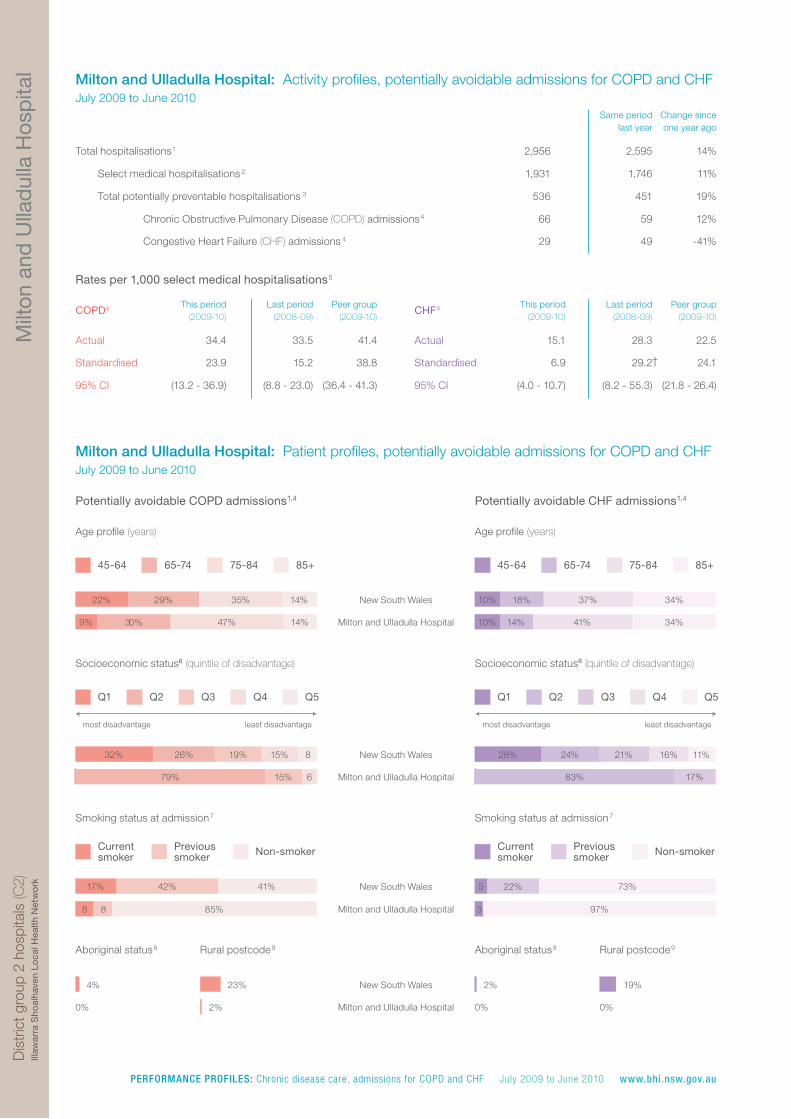
Milton and Ulladulla Hospital: Activity profiles, potentially avoidable admissions for COPD and CHFJuly 2009 to June 2010
Same periodlast year
Change sinceone year ago
This period(2009-10)
Last period(2008-09)
Peer group(2009-10)
CHF 4 This period(2009-10)
Last period(2008-09)
Peer group(2009-10)
Milton and Ulladulla Hospital: Patient profiles, potentially avoidable admissions for COPD and CHFJuly 2009 to June 2010
Potentially avoidable COPD admissions 1,4 Potentially avoidable CHF admissions 1,4
most disadvantage least disadvantage most disadvantage least disadvantage
Smoking status at admission 7 Smoking status at admission 7
Aboriginal status 8 Rural postcode 9 Aboriginal status 8 Rural postcode 9
2,956
1,931
536
66
29
2,595
1,746
451
59
49
14%
11%
19%
12%
-41%
34.4
23.9
(13.2 - 36.9)
33.5
15.2
(8.8 - 23.0)
41.4
38.8
(36.4 - 41.3)
Actual 15.1
Standardised 6.9
95% CI (4.0 - 10.7)
28.3
29.2
(8.2 - 55.3)
22.5
24.1
(21.8 - 26.4)
45-64 65-74 75-84 85+ 45-64 65-74 75-84 85+
New South Wales
Milton and Ulladulla Hospital
22% 29% 35% 14%
9% 30% 47% 14%
10% 18% 37% 34%
10% 14% 41% 34%
Q1 Q2 Q3 Q4 Q5 Q1 Q2 Q3 Q4 Q5
New South Wales
Milton and Ulladulla Hospital
32% 26% 19% 15%
79% 15%
28% 24% 21% 16% 11%
83% 17%
Currentsmoker
Previous smoker Non-smoker Current
smokerPrevious smoker Non-smoker
New South Wales
Milton and Ulladulla Hospital
17% 42% 41%
8 8 85%
5 22% 73%
3 97%
New South Wales
Milton and Ulladulla Hospital
4%
0%
23%
2%
2%
0%
19%
0%
Total hospitalisations 1
Select medical hospitalisations 2
Total potentially preventable hospitalisations 3
Chronic Obstructive Pulmonary Disease (COPD) admissions4
Congestive Heart Failure (CHF) admissions 4
Rates per 1,000 select medical hospitalisations 5
COPD 4
Age profile (years) Age profile (years)
Socioeconomic status (quintile of disadvantage) 6 Socioeconomic status (quintile of disadvantage) 6
Actual
Standardised
95% CI
8
†
6
PERFORMANCE PROFILES: Chronic disease care, admissions for COPD and CHF July 2009 to June 2010 www.bhi.nsw.gov.au
Milt
on a
nd U
llad
ulla
Hos
pita
l D
istr
ict g
roup
2 h
ospi
tals
(C2)
Illaw
arra
Sho
alha
ven
Loca
l Hea
lth N
etw
ork
Milton and Ulladulla Hospital: Activity profiles, potentially avoidable admissions for COPD and CHFJuly 2009 to June 2010
Same periodlast year
Change sinceone year ago
This period(2009-10)
Last period(2008-09)
Peer group(2009-10)
CHF 4 This period(2009-10)
Last period(2008-09)
Peer group(2009-10)
Milton and Ulladulla Hospital: Patient profiles, potentially avoidable admissions for COPD and CHFJuly 2009 to June 2010
Potentially avoidable COPD admissions 1,4 Potentially avoidable CHF admissions 1,4
most disadvantage least disadvantage most disadvantage least disadvantage
Smoking status at admission 7 Smoking status at admission 7
Aboriginal status 8 Rural postcode 9 Aboriginal status 8 Rural postcode 9
2,956
1,931
536
66
29
2,595
1,746
451
59
49
14%
11%
19%
12%
-41%
34.4
23.9
(13.2 - 36.9)
33.5
15.2
(8.8 - 23.0)
41.4
38.8
(36.4 - 41.3)
Actual 15.1
Standardised 6.9
95% CI (4.0 - 10.7)
28.3
29.2
(8.2 - 55.3)
22.5
24.1
(21.8 - 26.4)
45-64 65-74 75-84 85+ 45-64 65-74 75-84 85+
New South Wales
Milton and Ulladulla Hospital
22% 29% 35% 14%
9% 30% 47% 14%
10% 18% 37% 34%
10% 14% 41% 34%
Q1 Q2 Q3 Q4 Q5 Q1 Q2 Q3 Q4 Q5
New South Wales
Milton and Ulladulla Hospital
32% 26% 19% 15%
79% 15%
28% 24% 21% 16% 11%
83% 17%
Currentsmoker
Previous smoker Non-smoker Current
smokerPrevious smoker Non-smoker
New South Wales
Milton and Ulladulla Hospital
17% 42% 41%
8 8 85%
5 22% 73%
3 97%
New South Wales
Milton and Ulladulla Hospital
4%
0%
23%
2%
2%
0%
19%
0%
Total hospitalisations 1
Select medical hospitalisations 2
Total potentially preventable hospitalisations 3
Chronic Obstructive Pulmonary Disease (COPD) admissions4
Congestive Heart Failure (CHF) admissions 4
Rates per 1,000 select medical hospitalisations 5
COPD 4
Age profile (years) Age profile (years)
Socioeconomic status (quintile of disadvantage) 6 Socioeconomic status (quintile of disadvantage) 6
Actual
Standardised
95% CI
8
†
6
COPD admissions 4 This period(2009-10)
Last period(2008-09)
Peer group(2009-10)
COPD average length of stay in days 4
CHF admissions 4 This period(2009-10)
Last period(2008-09)
Peer group(2009-10)
CHF average length of stay in days 4
July 2005 to June 2010 (monthly)
Milt
on a
nd U
llad
ulla
Hos
pita
l D
istr
ict g
roup
2 h
ospi
tals
(C2)
Illaw
arra
Sho
alha
ven
Loca
l Hea
lth N
etw
ork
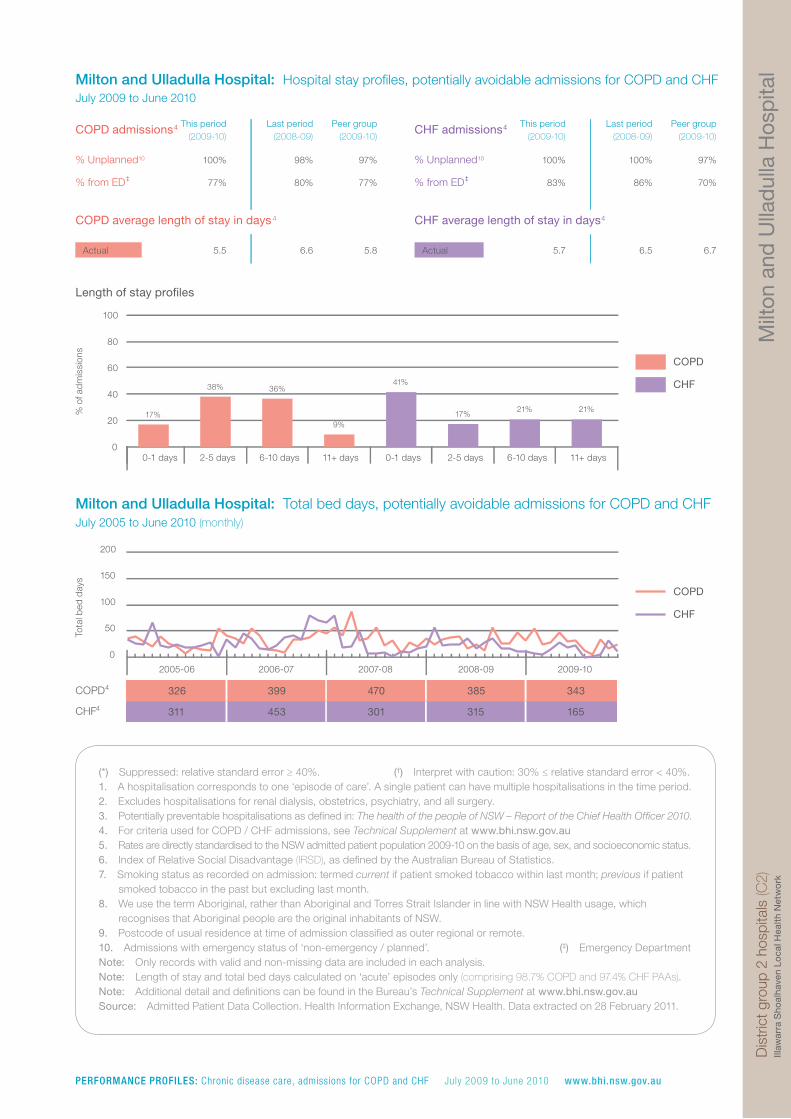
Milton and Ulladulla Hospital: Hospital stay profiles, potentially avoidable admissions for COPD and CHFJuly 2009 to June 2010
% Unplanned 10
% from ED
% Unplanned 10
% from ED
Length of stay pro�les
% o
f ad
mis
sion
s
COPD
CHF
Milton and Ulladulla Hospital: Total bed days, potentially avoidable admissions for COPD and CHF
Tota
l bed
day
s
COPD
CHF
COPD 4
CHF 4
100% 98% 97%
77% 80% 77%
Actual 5.5 6.6 5.8
100% 100% 97%
83% 86% 70%
Actual 5.7 6.5 6.7
0
20
40
60
80
100
17%
0-1 days
38%
2-5 days
36%
6-10 days
9%
11+ days
41%
0-1 days
17%
2-5 days
21%
6-10 days
21%
11+ days
0
50
100
150
200
2005-06 2006-07 2007-08 2008-09 2009-10
326
311
399
453
470
301
385
315
343
165
(*) Suppressed: relative standard error ≥ 40%. (†) Interpret with caution: 30% ≤ relative standard error < 40%. 1. A hospitalisation corresponds to one ‘episode of care’. A single patient can have multiple hospitalisations in the time period.2. Excludes hospitalisations for renal dialysis, obstetrics, psychiatry, and all surgery.3. Potentially preventable hospitalisations as defined in: The health of the people of NSW – Report of the Chief Health Officer 2010.4. For criteria used for COPD / CHF admissions, see Technical Supplement at www.bhi.nsw.gov.au5. Rates are directly standardised to the NSW admitted patient population 2009-10 on the basis of age, sex, and socioeconomic status.6. Index of Relative Social Disadvantage (IRSD), as defined by the Australian Bureau of Statistics.7. Smoking status as recorded on admission: termed current if patient smoked tobacco within last month; previous if patient
smoked tobacco in the past but excluding last month.8. We use the term Aboriginal, rather than Aboriginal and Torres Strait Islander in line with NSW Health usage, which
recognises that Aboriginal people are the original inhabitants of NSW. 9. Postcode of usual residence at time of admission classified as outer regional or remote.10. Admissions with emergency status of ‘non-emergency / planned’. (‡) Emergency DepartmentNote: Only records with valid and non-missing data are included in each analysis.Note: Length of stay and total bed days calculated on ‘acute’ episodes only (comprising 98.7% COPD and 97.4% CHF PAAs).Note: Additional detail and definitions can be found in the Bureau’s Technical Supplement at www.bhi.nsw.gov.auSource: Admitted Patient Data Collection. Health Information Exchange, NSW Health. Data extracted on 28 February 2011.
‡ ‡
PERFORMANCE PROFILES: Chronic disease care, admissions for COPD and CHF July 2009 to June 2010 www.bhi.nsw.gov.au
She
llhar
bou
r H
osp
ital
Dis
tric
t gro
up 1
hos
pita
ls (C
1)Ill
awar
ra S
hoal
have
n Lo
cal H
ealth
Net
wo
rk
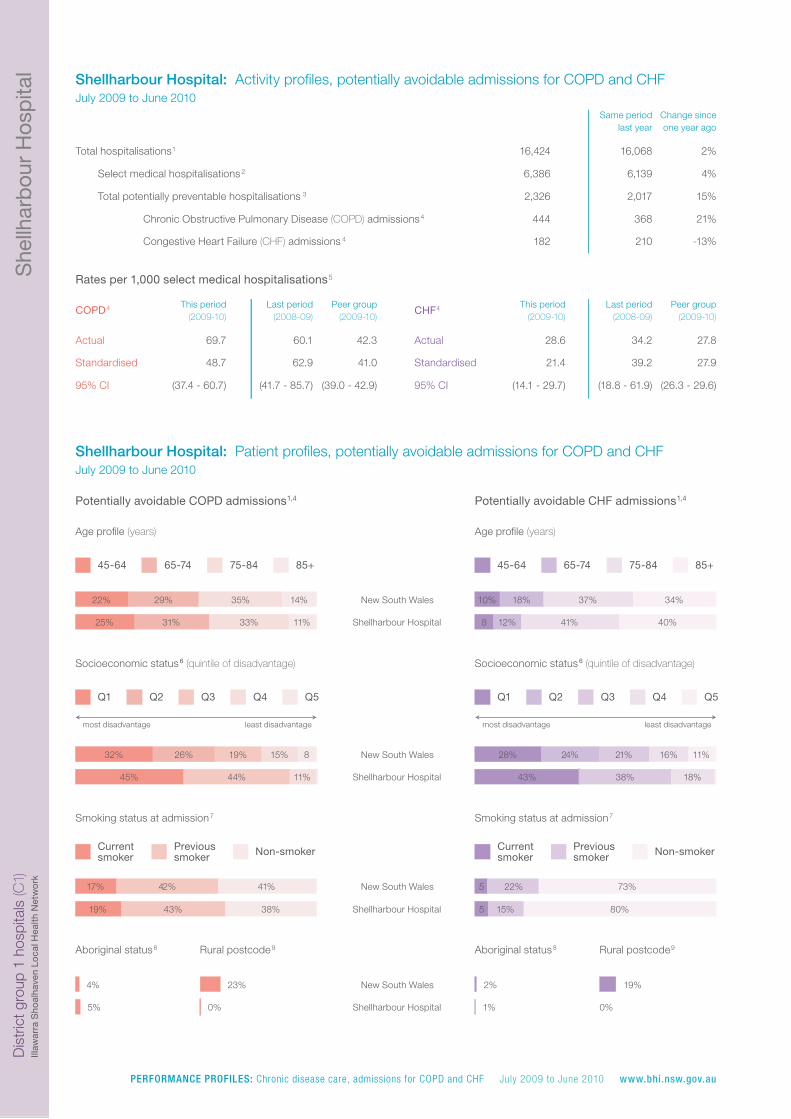
Shellharbour Hospital: Activity profiles, potentially avoidable admissions for COPD and CHFJuly 2009 to June 2010
Same periodlast year
Change sinceone year ago
This period(2009-10)
Last period(2008-09)
Peer group(2009-10)
CHF 4 This period(2009-10)
Last period(2008-09)
Peer group(2009-10)
Shellharbour Hospital: Patient profiles, potentially avoidable admissions for COPD and CHFJuly 2009 to June 2010
Potentially avoidable COPD admissions 1,4 Potentially avoidable CHF admissions 1,4
Socioeconomic status (quintile of disadvantage)6 Socioeconomic status (quintile of disadvantage)6
most disadvantage least disadvantage most disadvantage least disadvantage
Smoking status at admission 7 Smoking status at admission 7
Aboriginal status 8 Rural postcode 9 Aboriginal status 8 Rural postcode 9
16,424
6,386
2,326
444
182
16,068
6,139
2,017
368
210
2%
4%
15%
21%
-13%
69.7
48.7
(37.4 - 60.7)
60.1
62.9
(41.7 - 85.7)
42.3
41.0
(39.0 - 42.9)
Actual 28.6
Standardised 21.4
95% CI (14.1 - 29.7)
34.2
39.2
(18.8 - 61.9)
27.8
27.9
(26.3 - 29.6)
45-64 65-74 75-84 85+ 45-64 65-74 75-84 85+
New South Wales
Shellharbour Hospital
22% 29% 35% 14%
25% 31% 33% 11%
10% 18% 37% 34%
8 12% 41% 40%
Q1 Q2 Q3 Q4 Q5 Q1 Q2 Q3 Q4 Q5
New South Wales
Shellharbour Hospital
32% 26% 19% 15%
45% 44% 11%
28% 24% 21% 16% 11%
43% 38% 18%
Current smoker
Previous smoker Non-smoker Current
smoker Previous smoker Non-smoker
New South Wales
Shellharbour Hospital
17% 42% 41%
19% 43% 38%
22% 73%
5 15% 80%
New South Wales
Shellharbour Hospital
4%
5%
23%
0%
2%
1%
19%
0%
Age profile (years) Age profile (years)
8
Actual
Standardised
95% CI
COPD 4
Total hospitalisations 1
Select medical hospitalisations 2
Total potentially preventable hospitalisations 3
Chronic Obstructive Pulmonary Disease (COPD) admissions4
Congestive Heart Failure (CHF) admissions 4
Rates per 1,000 select medical hospitalisations 5
5
PERFORMANCE PROFILES: Chronic disease care, admissions for COPD and CHF July 2009 to June 2010 www.bhi.nsw.gov.au
She
llhar
bou
r H
osp
ital
Dis
tric
t gro
up 1
hos
pita
ls (C
1)Ill
awar
ra S
hoal
have
n Lo
cal H
ealth
Net
wo
rk
Shellharbour Hospital: Activity profiles, potentially avoidable admissions for COPD and CHFJuly 2009 to June 2010
Same periodlast year
Change sinceone year ago
This period(2009-10)
Last period(2008-09)
Peer group(2009-10)
CHF 4 This period(2009-10)
Last period(2008-09)
Peer group(2009-10)
Shellharbour Hospital: Patient profiles, potentially avoidable admissions for COPD and CHFJuly 2009 to June 2010
Potentially avoidable COPD admissions 1,4 Potentially avoidable CHF admissions 1,4
Socioeconomic status (quintile of disadvantage)6 Socioeconomic status (quintile of disadvantage)6
most disadvantage least disadvantage most disadvantage least disadvantage
Smoking status at admission 7 Smoking status at admission 7
Aboriginal status 8 Rural postcode 9 Aboriginal status 8 Rural postcode 9
16,424
6,386
2,326
444
182
16,068
6,139
2,017
368
210
2%
4%
15%
21%
-13%
69.7
48.7
(37.4 - 60.7)
60.1
62.9
(41.7 - 85.7)
42.3
41.0
(39.0 - 42.9)
Actual 28.6
Standardised 21.4
95% CI (14.1 - 29.7)
34.2
39.2
(18.8 - 61.9)
27.8
27.9
(26.3 - 29.6)
45-64 65-74 75-84 85+ 45-64 65-74 75-84 85+
New South Wales
Shellharbour Hospital
22% 29% 35% 14%
25% 31% 33% 11%
10% 18% 37% 34%
8 12% 41% 40%
Q1 Q2 Q3 Q4 Q5 Q1 Q2 Q3 Q4 Q5
New South Wales
Shellharbour Hospital
32% 26% 19% 15%
45% 44% 11%
28% 24% 21% 16% 11%
43% 38% 18%
Current smoker
Previous smoker Non-smoker Current
smoker Previous smoker Non-smoker
New South Wales
Shellharbour Hospital
17% 42% 41%
19% 43% 38%
22% 73%
5 15% 80%
New South Wales
Shellharbour Hospital
4%
5%
23%
0%
2%
1%
19%
0%
Age profile (years) Age profile (years)
8
Actual
Standardised
95% CI
COPD 4
Total hospitalisations 1
Select medical hospitalisations 2
Total potentially preventable hospitalisations 3
Chronic Obstructive Pulmonary Disease (COPD) admissions4
Congestive Heart Failure (CHF) admissions 4
Rates per 1,000 select medical hospitalisations 5
5
COPD admissions 4 This period(2009-10)
Last period(2008-09)
Peer group(2009-10)
COPD average length of stay in days 4
CHF admissions 4 This period(2009-10)
Last period(2008-09)
Peer group(2009-10)
CHF average length of stay in days 4
July 2005 to June 2010 (monthly)
She
llhar
bou
r H
osp
ital
Dis
tric
t gro
up 1
hos
pita
ls (C
1)
Illaw
arra
Sho
alha
ven
Loca
l Hea
lth N
etw
ork
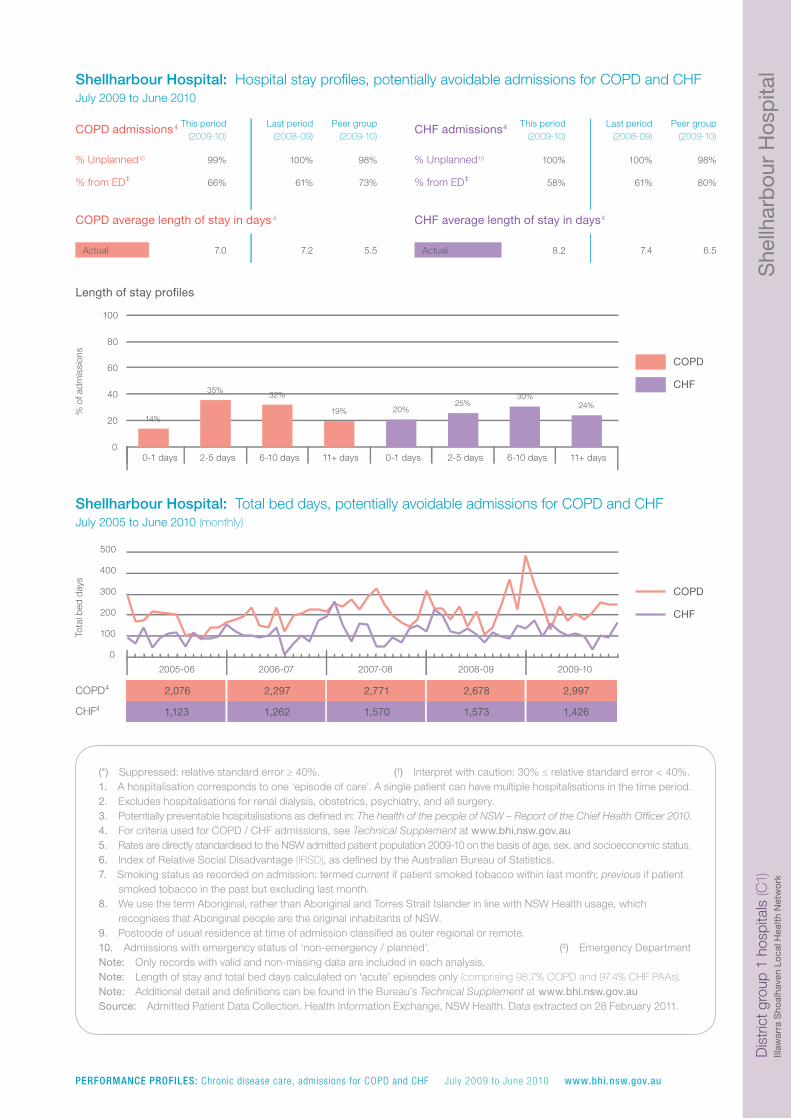
Shellharbour Hospital: Hospital stay profiles, potentially avoidable admissions for COPD and CHFJuly 2009 to June 2010
% Unplanned 10
% from ED
% Unplanned 10
% from ED
Length of stay pro�les
% o
f ad
mis
sion
s
COPD
CHF
Shellharbour Hospital: Total bed days, potentially avoidable admissions for COPD and CHF
Tota
l bed
day
s
COPD
CHF
COPD 4
CHF 4
99% 100% 98%
66% 61% 73%
Actual 7.0 7.2 5.5
100% 100% 98%
58% 61% 80%
Actual 8.2 7.4 6.5
0
20
40
60
80
100
14%
0-1 days
35%
2-5 days
32%
6-10 days
19%
11+ days
20%
0-1 days
25%
2-5 days
30%
6-10 days
24%
11+ days
0
100
200
300
400
500
2005-06 2006-07 2007-08 2008-09 2009-10
2,076
1,123
2,297
1,262
2,771
1,570
2,678
1,573
2,997
1,426
(*) Suppressed: relative standard error ≥ 40%. (†) Interpret with caution: 30% ≤ relative standard error < 40%. 1. A hospitalisation corresponds to one ‘episode of care’. A single patient can have multiple hospitalisations in the time period.2. Excludes hospitalisations for renal dialysis, obstetrics, psychiatry, and all surgery.3. Potentially preventable hospitalisations as defined in: The health of the people of NSW – Report of the Chief Health Officer 2010.4. For criteria used for COPD / CHF admissions, see Technical Supplement at www.bhi.nsw.gov.au5. Rates are directly standardised to the NSW admitted patient population 2009-10 on the basis of age, sex, and socioeconomic status.6. Index of Relative Social Disadvantage (IRSD), as defined by the Australian Bureau of Statistics.7. Smoking status as recorded on admission: termed current if patient smoked tobacco within last month; previous if patient
smoked tobacco in the past but excluding last month.8. We use the term Aboriginal, rather than Aboriginal and Torres Strait Islander in line with NSW Health usage, which
recognises that Aboriginal people are the original inhabitants of NSW. 9. Postcode of usual residence at time of admission classified as outer regional or remote.10. Admissions with emergency status of ‘non-emergency / planned’. (‡) Emergency DepartmentNote: Only records with valid and non-missing data are included in each analysis.Note: Length of stay and total bed days calculated on ‘acute’ episodes only (comprising 98.7% COPD and 97.4% CHF PAAs).Note: Additional detail and definitions can be found in the Bureau’s Technical Supplement at www.bhi.nsw.gov.auSource: Admitted Patient Data Collection. Health Information Exchange, NSW Health. Data extracted on 28 February 2011.
‡ ‡
PERFORMANCE PROFILES: Chronic disease care, admissions for COPD and CHF July 2009 to June 2010 www.bhi.nsw.gov.au
Sho
alha
ven
and
Dis
tric
t M
emor
ial H
osp
ital
Maj
or n
on-m
etro
polit
an h
ospi
tals
(BN
M)
Illaw
arra
Sho
alha
ven
Loca
l Hea
lth N
etw
ork
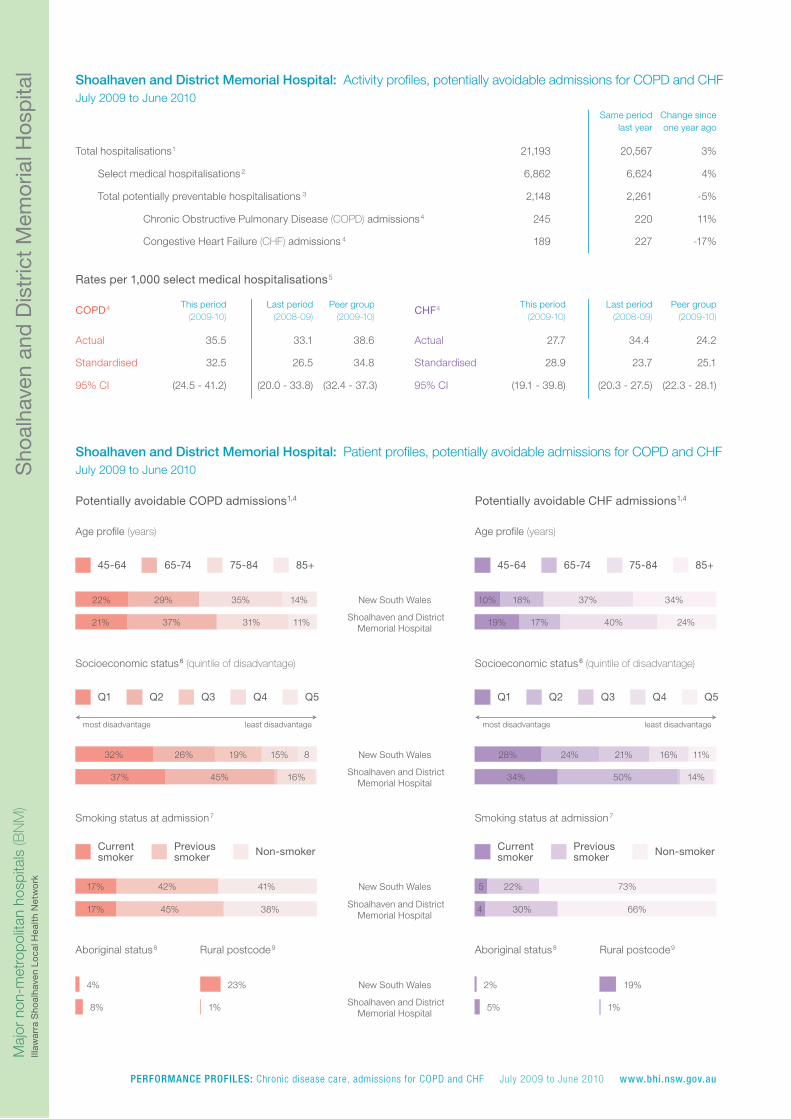
Shoalhaven and District Memorial Hospital: Activity profiles, potentially avoidable admissions for COPD and CHFJuly 2009 to June 2010
Same periodlast year
Change sinceone year ago
This period(2009-10)
Last period(2008-09)
Peer group (2009-10)
CHF 4 This period(2009-10)
Last period(2008-09)
Peer group(2009-10)
Shoalhaven and District Memorial Hospital: Patient profiles, potentially avoidable admissions for COPD and CHFJuly 2009 to June 2010
Potentially avoidable COPD admissions 1,4 Potentially avoidable CHF admissions 1,4
Socioeconomic status (quintile of disadvantage)6 Socioeconomic status (quintile of disadvantage)6
most disadvantage least disadvantage most disadvantage least disadvantage
Smoking status at admission 7 Smoking status at admission 7
Aboriginal status 8 Rural postcode 9 Aboriginal status 8 Rural postcode 9
21,193
6,862
2,148
245
189
20,567
6,624
2,261
220
227
3%
4%
-5%
11%
-17%
35.5
32.5
(24.5 - 41.2)
33.1
26.5
(20.0 - 33.8)
38.6
34.8
(32.4 - 37.3)
Actual 27.7
Standardised 28.9
95% CI (19.1 - 39.8)
34.4
23.7
(20.3 - 27.5)
24.2
25.1
(22.3 - 28.1)
45-64 65-74 75-84 85+ 45-64 65-74 75-84 85+
New South Wales
Shoalhaven and DistrictMemorial Hospital
22% 29% 35% 14%
21% 37% 31% 11%
10% 18% 37% 34%
19% 17% 40% 24%
Q1 Q2 Q3 Q4 Q5 Q1 Q2 Q3 Q4 Q5
New South Wales
Shoalhaven and DistrictMemorial Hospital
32% 26% 19% 15%
37% 45% 16%
28% 24% 21% 16% 11%
34% 50% 14%
Current smoker
Previous smoker Non-smoker Current
smoker Previous smoker Non-smoker
New South Wales
Shoalhaven and DistrictMemorial Hospital
17% 42% 41%
17% 45% 38%
5 22% 73%
30% 66%
New South Wales
Shoalhaven and DistrictMemorial Hospital
4%
8%
23%
1%
2%
5%
19%
1%
Age profile (years) Age profile (years)
8
Actual
Standardised
95% CI
COPD 4
Total hospitalisations 1
Select medical hospitalisations 2
Total potentially preventable hospitalisations 3
Chronic Obstructive Pulmonary Disease (COPD) admissions4
Congestive Heart Failure (CHF) admissions 4
Rates per 1,000 select medical hospitalisations 5
4
PERFORMANCE PROFILES: Chronic disease care, admissions for COPD and CHF July 2009 to June 2010 www.bhi.nsw.gov.au
Sho
alha
ven
and
Dis
tric
t M
emor
ial H
osp
ital
Maj
or n
on-m
etro
polit
an h
ospi
tals
(BN
M)
Illaw
arra
Sho
alha
ven
Loca
l Hea
lth N
etw
ork
Shoalhaven and District Memorial Hospital: Activity profiles, potentially avoidable admissions for COPD and CHFJuly 2009 to June 2010
Same periodlast year
Change sinceone year ago
This period(2009-10)
Last period(2008-09)
Peer group (2009-10)
CHF 4 This period(2009-10)
Last period(2008-09)
Peer group(2009-10)
Shoalhaven and District Memorial Hospital: Patient profiles, potentially avoidable admissions for COPD and CHFJuly 2009 to June 2010
Potentially avoidable COPD admissions 1,4 Potentially avoidable CHF admissions 1,4
Socioeconomic status (quintile of disadvantage)6 Socioeconomic status (quintile of disadvantage)6
most disadvantage least disadvantage most disadvantage least disadvantage
Smoking status at admission 7 Smoking status at admission 7
Aboriginal status 8 Rural postcode 9 Aboriginal status 8 Rural postcode 9
21,193
6,862
2,148
245
189
20,567
6,624
2,261
220
227
3%
4%
-5%
11%
-17%
35.5
32.5
(24.5 - 41.2)
33.1
26.5
(20.0 - 33.8)
38.6
34.8
(32.4 - 37.3)
Actual 27.7
Standardised 28.9
95% CI (19.1 - 39.8)
34.4
23.7
(20.3 - 27.5)
24.2
25.1
(22.3 - 28.1)
45-64 65-74 75-84 85+ 45-64 65-74 75-84 85+
New South Wales
Shoalhaven and DistrictMemorial Hospital
22% 29% 35% 14%
21% 37% 31% 11%
10% 18% 37% 34%
19% 17% 40% 24%
Q1 Q2 Q3 Q4 Q5 Q1 Q2 Q3 Q4 Q5
New South Wales
Shoalhaven and DistrictMemorial Hospital
32% 26% 19% 15%
37% 45% 16%
28% 24% 21% 16% 11%
34% 50% 14%
Current smoker
Previous smoker Non-smoker Current
smoker Previous smoker Non-smoker
New South Wales
Shoalhaven and DistrictMemorial Hospital
17% 42% 41%
17% 45% 38%
5 22% 73%
30% 66%
New South Wales
Shoalhaven and DistrictMemorial Hospital
4%
8%
23%
1%
2%
5%
19%
1%
Age profile (years) Age profile (years)
8
Actual
Standardised
95% CI
COPD 4
Total hospitalisations 1
Select medical hospitalisations 2
Total potentially preventable hospitalisations 3
Chronic Obstructive Pulmonary Disease (COPD) admissions4
Congestive Heart Failure (CHF) admissions 4
Rates per 1,000 select medical hospitalisations 5
4
COPD admissions 4 This period(2009-10)
Last period(2008-09)
Peer group(2009-10)
COPD average length of stay in days 4
CHF admissions 4 This period(2009-10)
Last period(2008-09)
Peer group(2009-10)
CHF average length of stay in days 4
July 2005 to June 2010 (monthly)
Sho
alha
ven
and
Dis
tric
t M
emor
ial H
osp
ital
Maj
or n
on-m
etro
polit
an h
ospi
tals
(BN
M)
Illaw
arra
Sho
alha
ven
Loca
l Hea
lth N
etw
ork
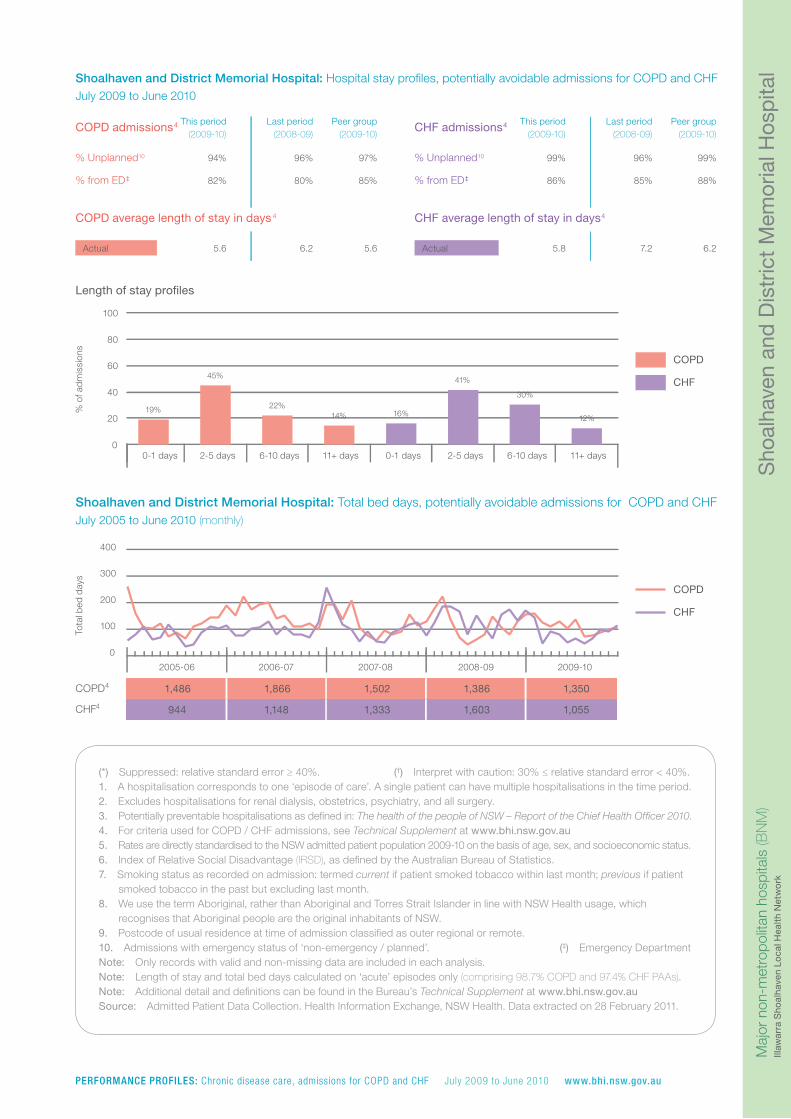
Shoalhaven and District Memorial Hospital: Hospital stay profiles, potentially avoidable admissions for COPD and CHF July 2009 to June 2010
% Unplanned 10
% from ED
% Unplanned 10
% from ED
Length of stay pro�les
% o
f ad
mis
sion
s
COPD
CHF
Shoalhaven and District Memorial Hospital: Total bed days, potentially avoidable admissions for COPD and CHF
Tota
l bed
day
s
COPD
CHF
COPD 4
CHF 4
94% 96% 97%
82% 80% 85%
Actual 5.6 6.2 5.6
99% 96% 99%
86% 85% 88%
Actual 5.8 7.2 6.2
0
20
40
60
80
100
19%
0-1 days
45%
2-5 days
22%
6-10 days
14%
11+ days
16%
0-1 days
41%
2-5 days
30%
6-10 days
12%
11+ days
0
100
200
300
400
2005-06 2006-07 2007-08 2008-09 2009-10
1,486
944
1,866
1,148
1,502
1,333
1,386
1,603
1,350
1,055
(*) Suppressed: relative standard error ≥ 40%. (†) Interpret with caution: 30% ≤ relative standard error < 40%. 1. A hospitalisation corresponds to one ‘episode of care’. A single patient can have multiple hospitalisations in the time period.2. Excludes hospitalisations for renal dialysis, obstetrics, psychiatry, and all surgery.3. Potentially preventable hospitalisations as defined in: The health of the people of NSW – Report of the Chief Health Officer 2010.4. For criteria used for COPD / CHF admissions, see Technical Supplement at www.bhi.nsw.gov.au5. Rates are directly standardised to the NSW admitted patient population 2009-10 on the basis of age, sex, and socioeconomic status.6. Index of Relative Social Disadvantage (IRSD), as defined by the Australian Bureau of Statistics.7. Smoking status as recorded on admission: termed current if patient smoked tobacco within last month; previous if patient
smoked tobacco in the past but excluding last month.8. We use the term Aboriginal, rather than Aboriginal and Torres Strait Islander in line with NSW Health usage, which
recognises that Aboriginal people are the original inhabitants of NSW. 9. Postcode of usual residence at time of admission classified as outer regional or remote.10. Admissions with emergency status of ‘non-emergency / planned’. (‡) Emergency DepartmentNote: Only records with valid and non-missing data are included in each analysis.Note: Length of stay and total bed days calculated on ‘acute’ episodes only (comprising 98.7% COPD and 97.4% CHF PAAs).Note: Additional detail and definitions can be found in the Bureau’s Technical Supplement at www.bhi.nsw.gov.auSource: Admitted Patient Data Collection. Health Information Exchange, NSW Health. Data extracted on 28 February 2011.
‡ ‡
PERFORMANCE PROFILES: Chronic disease care, admissions for COPD and CHF July 2009 to June 2010 www.bhi.nsw.gov.au
Wol
long
ong
Hos
pita
l P
rinci
pal r
efer
ral h
ospi
tals
(A1)
Illaw
arra
Sho
alha
ven
Loca
l Hea
lth N
etw
ork
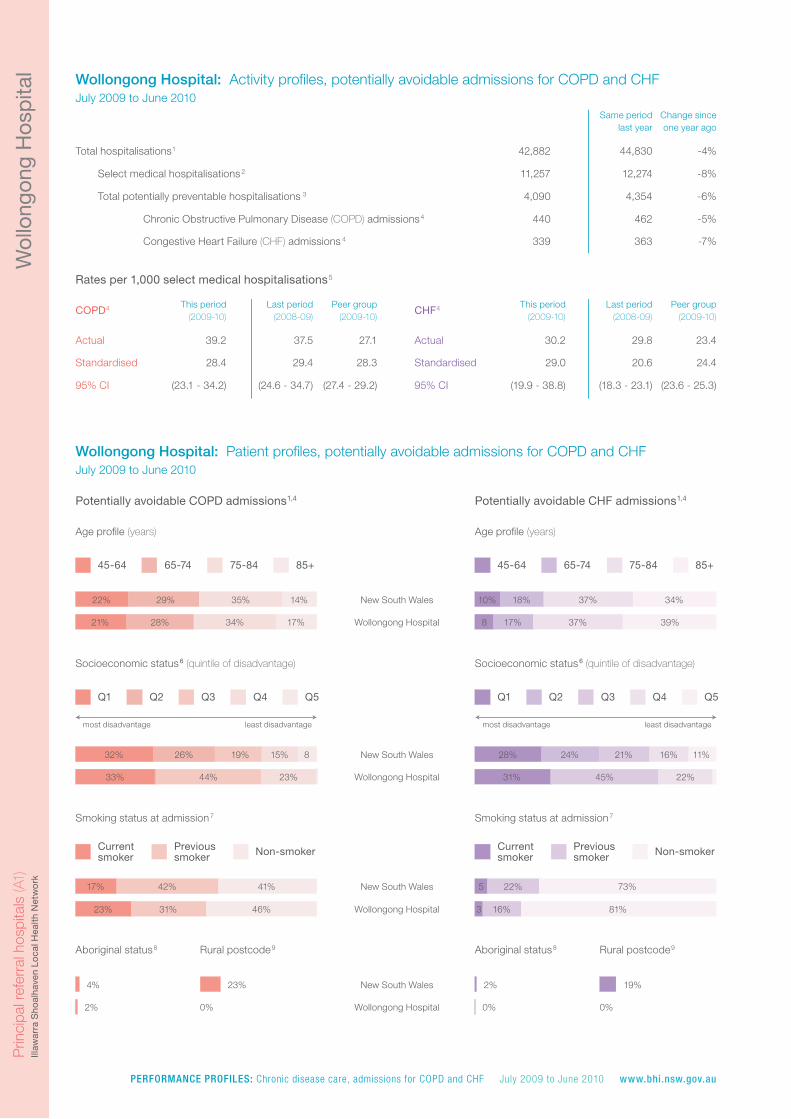
Wollongong Hospital: Activity profiles, potentially avoidable admissions for COPD and CHFJuly 2009 to June 2010
Same periodlast year
Change sinceone year ago
COPD 4 This period(2009-10)
Last period(2008-09)
Peer group(2009-10)
CHF 4 This period(2009-10)
Last period(2008-09)
Peer group(2009-10)
Wollongong Hospital: Patient profiles, potentially avoidable admissions for COPD and CHFJuly 2009 to June 2010
Potentially avoidable COPD admissions 1,4 Potentially avoidable CHF admissions 1,4
Socioeconomic status (quintile of disadvantage)6 Socioeconomic status (quintile of disadvantage)6
most disadvantage least disadvantage most disadvantage least disadvantage
Smoking status at admission 7 Smoking status at admission 7
Aboriginal status 8 Rural postcode 9 Aboriginal status 8 Rural postcode 9
42,882
11,257
4,090
440
339
44,830
12,274
4,354
462
363
-4%
-8%
-6%
-5%
-7%
Actual 39.2
Standardised 28.4
95% CI (23.1 - 34.2)
37.5
29.4
(24.6 - 34.7)
27.1
28.3
(27.4 - 29.2)
Actual 30.2
Standardised 29.0
95% CI (19.9 - 38.8)
29.8
20.6
(18.3 - 23.1)
23.4
24.4
(23.6 - 25.3)
45-64 65-74 75-84 85+ 45-64 65-74 75-84 85+
New South Wales
Wollongong Hospital
22% 29% 35% 14%
21% 28% 34% 17%
10% 18% 37% 34%
8 17% 37% 39%
Q1 Q2 Q3 Q4 Q5 Q1 Q2 Q3 Q4 Q5
New South Wales
Wollongong Hospital
32% 26% 19% 15%
33% 44% 23%
28% 24% 21% 16% 11%
31% 45% 22%
Currentsmoker
Previous smoker Non-smoker Current
smokerPrevious smoker Non-smoker
New South Wales
Wollongong Hospital
17% 42% 41%
23% 31% 46%
5 22% 73%
3 16% 81%
New South Wales
Wollongong Hospital
4%
2%
23%
0%
2%
0%
19%
0%
Age profile (years) Age profile (years)
8
Total hospitalisations 1
Select medical hospitalisations 2
Total potentially preventable hospitalisations 3
Chronic Obstructive Pulmonary Disease (COPD) admissions4
Congestive Heart Failure (CHF) admissions 4
Rates per 1,000 select medical hospitalisations 5
PERFORMANCE PROFILES: Chronic disease care, admissions for COPD and CHF July 2009 to June 2010 www.bhi.nsw.gov.au
COPD admissions 4 This period(2009-10)
Last period(2008-09)
Peer group(2009-10)
COPD average length of stay in days 4
CHF admissions 4 This period(2009-10)
Last period(2008-09)
Peer group(2009-10)
CHF average length of stay in days 4
July 2005 to June 2010 (monthly)
Wol
long
ong
Hos
pita
l P
rinci
pal r
efer
ral h
ospi
tals
(A1
)Ill
awar
ra S
hoal
have
n Lo
cal H
ealth
Net
wo
rk
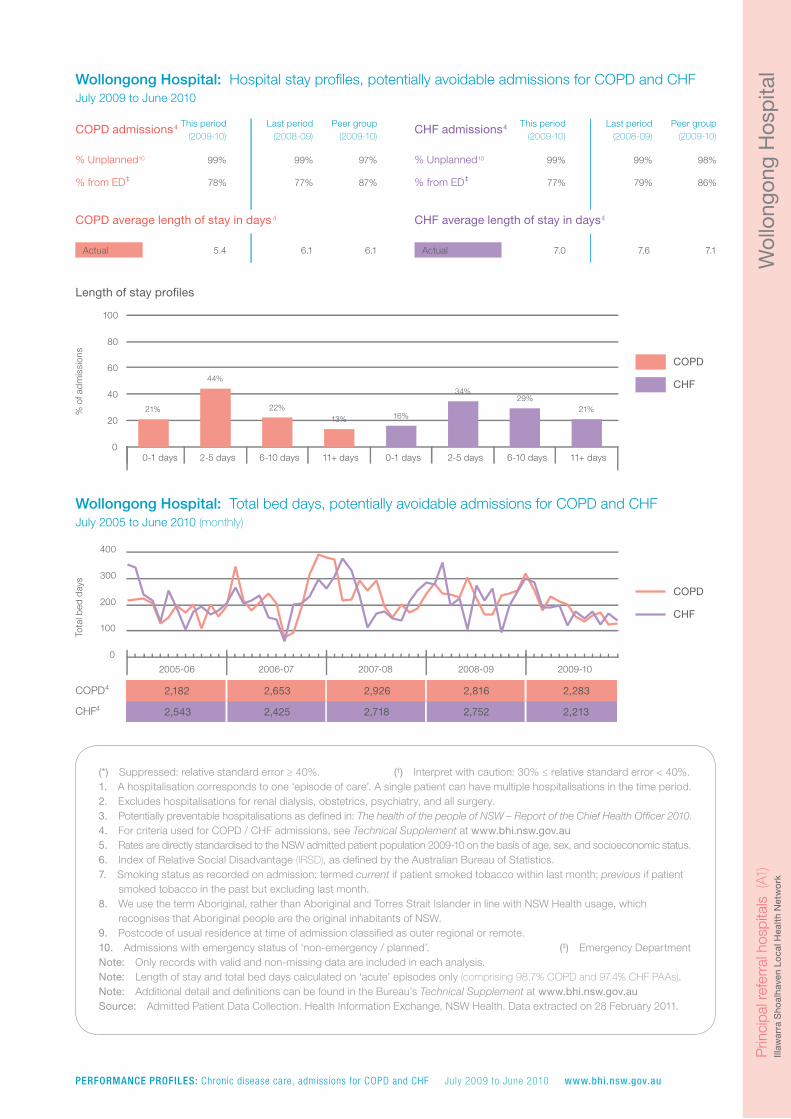
Wollongong Hospital: Hospital stay profiles, potentially avoidable admissions for COPD and CHFJuly 2009 to June 2010
% Unplanned 10
% from ED
% Unplanned 10
% from ED
Length of stay pro�les
% o
f ad
mis
sion
s
COPD
CHF
Wollongong Hospital: Total bed days, potentially avoidable admissions for COPD and CHF
Tota
l bed
day
s
COPD
CHF
COPD 4
CHF 4
99% 99% 97%
78% 77% 87%
Actual 5.4 6.1 6.1
99% 99% 98%
77% 79% 86%
Actual 7.0 7.6 7.1
0
20
40
60
80
100
21%
0-1 days
44%
2-5 days
22%
6-10 days
13%
11+ days
16%
0-1 days
34%
2-5 days
29%
6-10 days
21%
11+ days
0
100
200
300
400
2005-06 2006-07 2007-08 2008-09 2009-10
2,182
2,543
2,653
2,425
2,926
2,718
2,816
2,752
2,283
2,213
Wol
long
ong
Hos
pita
l P
rinci
pal r
efer
ral h
ospi
tals
(A1)
Illaw
arra
Sho
alha
ven
Loca
l Hea
lth N
etw
ork
Wollongong Hospital: Activity profiles, potentially avoidable admissions for COPD and CHFJuly 2009 to June 2010
Same periodlast year
Change sinceone year ago
COPD 4 This period(2009-10)
Last period(2008-09)
Peer group(2009-10)
CHF 4 This period(2009-10)
Last period(2008-09)
Peer group(2009-10)
Wollongong Hospital: Patient profiles, potentially avoidable admissions for COPD and CHFJuly 2009 to June 2010
Potentially avoidable COPD admissions 1,4 Potentially avoidable CHF admissions 1,4
Socioeconomic status (quintile of disadvantage)6 Socioeconomic status (quintile of disadvantage)6
most disadvantage least disadvantage most disadvantage least disadvantage
Smoking status at admission 7 Smoking status at admission 7
Aboriginal status 8 Rural postcode 9 Aboriginal status 8 Rural postcode 9
42,882
11,257
4,090
440
339
44,830
12,274
4,354
462
363
-4%
-8%
-6%
-5%
-7%
Actual 39.2
Standardised 28.4
95% CI (23.1 - 34.2)
37.5
29.4
(24.6 - 34.7)
27.1
28.3
(27.4 - 29.2)
Actual 30.2
Standardised 29.0
95% CI (19.9 - 38.8)
29.8
20.6
(18.3 - 23.1)
23.4
24.4
(23.6 - 25.3)
45-64 65-74 75-84 85+ 45-64 65-74 75-84 85+
New South Wales
Wollongong Hospital
22% 29% 35% 14%
21% 28% 34% 17%
10% 18% 37% 34%
8 17% 37% 39%
Q1 Q2 Q3 Q4 Q5 Q1 Q2 Q3 Q4 Q5
New South Wales
Wollongong Hospital
32% 26% 19% 15%
33% 44% 23%
28% 24% 21% 16% 11%
31% 45% 22%
Currentsmoker
Previous smoker Non-smoker Current
smokerPrevious smoker Non-smoker
New South Wales
Wollongong Hospital
17% 42% 41%
23% 31% 46%
5 22% 73%
3 16% 81%
New South Wales
Wollongong Hospital
4%
2%
23%
0%
2%
0%
19%
0%
Age profile (years) Age profile (years)
8
Total hospitalisations 1
Select medical hospitalisations 2
Total potentially preventable hospitalisations 3
Chronic Obstructive Pulmonary Disease (COPD) admissions4
Congestive Heart Failure (CHF) admissions 4
Rates per 1,000 select medical hospitalisations 5
(*) Suppressed: relative standard error ≥ 40%. (†) Interpret with caution: 30% ≤ relative standard error < 40%. 1. A hospitalisation corresponds to one ‘episode of care’. A single patient can have multiple hospitalisations in the time period.2. Excludes hospitalisations for renal dialysis, obstetrics, psychiatry, and all surgery.3. Potentially preventable hospitalisations as defined in: The health of the people of NSW – Report of the Chief Health Officer 2010.4. For criteria used for COPD / CHF admissions, see Technical Supplement at www.bhi.nsw.gov.au5. Rates are directly standardised to the NSW admitted patient population 2009-10 on the basis of age, sex, and socioeconomic status.6. Index of Relative Social Disadvantage (IRSD), as defined by the Australian Bureau of Statistics.7. Smoking status as recorded on admission: termed current if patient smoked tobacco within last month; previous if patient
smoked tobacco in the past but excluding last month.8. We use the term Aboriginal, rather than Aboriginal and Torres Strait Islander in line with NSW Health usage, which
recognises that Aboriginal people are the original inhabitants of NSW. 9. Postcode of usual residence at time of admission classified as outer regional or remote.10. Admissions with emergency status of ‘non-emergency / planned’. (‡) Emergency DepartmentNote: Only records with valid and non-missing data are included in each analysis.Note: Length of stay and total bed days calculated on ‘acute’ episodes only (comprising 98.7% COPD and 97.4% CHF PAAs).Note: Additional detail and definitions can be found in the Bureau’s Technical Supplement at www.bhi.nsw.gov.auSource: Admitted Patient Data Collection. Health Information Exchange, NSW Health. Data extracted on 28 February 2011.
‡ ‡
The Bureau of Health Information provides
the community, healthcare professionals and
the NSW Parliament with timely, accurate and
comparable information on the performance
of the NSW public health system in ways that
enhance the system’s accountability and inform
efforts to increase its beneficial impact on the
health and wellbeing of the people of NSW.
The Bureau is an independent, board-governed
statutory health corporation. The conclusions in
this report are those of the Bureau and no official
endorsement by the NSW Minister for Health,
the NSW Department of Health or any other
NSW statutory health corporation is intended
or should be inferred.
About the Bureau
Copyright Bureau of Health Information 2011
State Health Publication Number: (BHI) 110135ISSN 1839-1680 ISBN 978-1-74187-604-8
Suggested citation: Bureau of Health Information. Chronic Disease Care Performance Profiles:
A piece of the picture, July 2009 to June 2010. Sydney (NSW); 2011.
Published June 2011
Please note that there is the potential for minor revisions of data in this report. Please check the online version
at www.bhi.nsw.gov.au for any amendments.
To contact the Bureau
Telephone: +61 2 8644 2100
Fax: +61 2 8644 2119
Email: [email protected]
Postal address:
PO Box 1770
Chatswood
New South Wales 2057
Australia
Web: www.bhi.nsw.gov.au
Download our reports
The report, Chronic Disease Care: A piece of
the picture - admissions for chronic obstructive
pulmonary disease (COPD) and congestive heart
failure (CHF), July 2009 to June 2010 and related
reports are available at www.bhi.nsw.gov.au
The suite of products includes:
• Main report
• Performance Profiles (reports for
79 hospitals and NSW as a whole)
• Technical Supplement